CERNE 439 Historic: Received 06/07/2018 Accepted 21/09/2018 Keywords: Machine learning Network architecture Stem profile Transfer function 1 Kastamonu University, Faculty of Forestry, Turkey - ORCID: 0000-0003-4961-2991 a , 0000-0003-2765-084X b + Correspondence: [email protected]ISSN 0104-7760 DOI: 10.1590/01047760201824042572 Oytun Emre Sakici 1a+ , Gulay Ozdemir 1b STEM TAPER ESTIMATIONS WITH ARTIFICIAL NEURAL NETWORKS FOR MIXED ORIENTAL BEECH AND KAZDAĞI FIR STANDS IN KARABÜK REGION, TURKEY SAKICI, O. E.; OZDEMIR, G. Stem taper estimations with artificial neural networks for mixed Oriental beech and Kazdaği fir stands in Karabük region, Turkey. CERNE, v. 24, n. 4, p. 439-451, 2018. HIGHLIGHTS The volume of a stem or any part of a tree can be accurately estimated depends on the stem taper estimations. The ANN models and taper equations were compared for estimating stem diameters for a mixed stand in Turkey. The ANN models were superior to taper equations for stem diameter predictions. ANN models offer some advantages to overcome the problems such as multicollinearity and autocorrelation. ABSTRACT Development of artificial neural network (ANN) models to estimate stem tapers of indi- vidual trees in mixed Fagus orientalis and Abies nordmanniana subsp. equi-trojani stands dis- tributed in Karabük region of Turkey, and comparison of the ANN models with stem taper equations were aimed in this study. The measurements were obtained from 516 sample trees (238 for Oriental beech and 278 for Kazdağı fir) in mixed stands of Karabük region. The measurements included diameter at breast height, tree height, diameter at stump height, and diameters at intervals of 1 m along the stem. In total, 45 ANN models and four stem taper equations were developed. Estimation performances of ANN models and stem taper equations were compared using relative rankings according to seven goodness-of-fit criteria. As a result, the ANN models were more successful in estimation of stem taper for both tree species. The most successful ANN model structures were (i) the model us- ing logistic function in hidden layer with 10 nodes and hyperbolic tangent function in out- put layer for Fagus orientalis, and (ii) the model using logistic function in hidden layer with 10 nodes and linear function in output layer for Abies nordmanniana subsp. equi-trojani. v.24 n.4 2018
Transcript
CERNE
439
Historic:Received 06/07/2018 Accepted 21/09/2018
Keywords:Machine learning
Network architectureStem profile
Transfer function
1 Kastamonu University, Faculty of Forestry, Turkey - ORCID: 0000-0003-4961-2991a, 0000-0003-2765-084Xb
STEM TAPER ESTIMATIONS WITH ARTIFICIAL NEURAL NETWORKS FOR MIXED ORIENTAL BEECH AND KAZDAĞI FIR STANDS IN KARABÜK REGION, TURKEY
SAKICI, O. E.; OZDEMIR, G. Stem taper estimations with artificial neural networks for mixed Oriental beech and Kazdaği fir stands in Karabük region, Turkey. CERNE, v. 24, n. 4, p. 439-451, 2018.
HIGHLIGHTS
The volume of a stem or any part of a tree can be accurately estimated depends on the stem taper estimations.
The ANN models and taper equations were compared for estimating stem diameters for a mixed stand in Turkey.
The ANN models were superior to taper equations for stem diameter predictions.
ANN models offer some advantages to overcome the problems such as multicollinearity and autocorrelation.
ABSTRACT
Development of artificial neural network (ANN) models to estimate stem tapers of indi-vidual trees in mixed Fagus orientalis and Abies nordmanniana subsp. equi-trojani stands dis-tributed in Karabük region of Turkey, and comparison of the ANN models with stem taper equations were aimed in this study. The measurements were obtained from 516 sample trees (238 for Oriental beech and 278 for Kazdağı fir) in mixed stands of Karabük region. The measurements included diameter at breast height, tree height, diameter at stump height, and diameters at intervals of 1 m along the stem. In total, 45 ANN models and four stem taper equations were developed. Estimation performances of ANN models and stem taper equations were compared using relative rankings according to seven goodness-of-fit criteria. As a result, the ANN models were more successful in estimation of stem taper for both tree species. The most successful ANN model structures were (i) the model us-ing logistic function in hidden layer with 10 nodes and hyperbolic tangent function in out-put layer for Fagus orientalis, and (ii) the model using logistic function in hidden layer with 10 nodes and linear function in output layer for Abies nordmanniana subsp. equi-trojani.
v.24 n.4 2018
STEM TAPER ESTIMATIONS WITH ARTIFICIAL NEURAL NETWORKS FOR MIXED ORIENTAL BEECH AND KAZDAĞI FIR STANDS IN KARABÜK REGION, TURKEY
440
CERNE
SAKICI AND OZDEMIR
INTRODUCTION
In order to know merchantable stand volume, which is one of the main components of forest dynamics, type and amount of the wood-based products obtained from the stands are important components of forest inventory which forms the basis of forest management (Barrio-Anta et al., 2007). In addition, depending on the commercial standards changing in the direction of forest products industry’s demands, the quantities of wood-based products must be estimated successfully as well as stem volumes before harvesting activities. The success of accurate and reliable estimation of the stem volume of a tree and the volumes of the wood products obtained from trees coincides with the success in estimation of the stem diameters. Thus, volume of a stem or any part of a standing tree can be accurately estimated depending on the stem taper estimation success for the subject tree.
The most common approach to estimate stem diameters, which is the main variable to predict the volume of wood products more accurately, is to use stem taper equations (Fang et al., 2000; Diéguez-Aranda et al., 2006; Li and Weiskittel, 2010; Özçelik and Crecente-Campo, 2016). Researches on modeling of stem taper estimates have still been in progress for over a century (Fang and Bailey, 1999). It has been stated that there are two main reasons for these studies; (i) the absence of a basic theory that would explain the change in stem forms of trees, and (ii) the need for a method that considers various wood products standards depending on the changing market conditions (Nevnham, 1988).
In general, regression models are used to develop stem taper equations, and successful equations are determined by making evaluations according to various statistical criteria. However, some statistical assumptions have to be provided in order to develop regression models. These assumptions are; (i) independent, normally distributed and homoscedastic data, (ii) exact relationships between dependent and independent variables, and (iii) no measurement errors in variables (Ashraf et al., 2013). Moreover, multicollinearity and autocorrelation among variables also influence estimation success of regression models (Legendre, 1993; Sakici et al., 2008). The multicollinearity measures the correlations between the independent variables, and autocorrelation affects the independence of errors (Kozak, 1997). These problems may seriously affect the standard errors of the coefficient, invalidating statistical tests using t or F distributions and confidence intervals (Diéguez-Aranda et al., 2006; Özçelik and Crecente-Campo, 2016), even if it may not be
important for practical use of regression models such as stem taper equations (Özçelik et al., 2016).
Artificial neural networks (ANN) is a modelling and estimating method based on the architecture of human brain, and it has been an essential tool in estimation studies since 1980’s (Elmas, 2007). It is known that regression models developed on the basis of various biological data (i.e., forestry researches) cannot fulfill some of the aforementioned assumptions, and may contain multicollinearity and autocorrelation problems. Since ANN techniques have considerable flexibility in achieving these assumptions and they can provide successful estimation results for modeling complex relationships, its use is an innovative trend in forestry researches as well as other biological based studies.
Since the initial studies on stem taper estimations, the regression analysis approach has been commonly utilized (e.g., Kozak et al., 1969; Max and Burkhart, 1976; Clark et al., 1991; Kozak, 2004; Özçelik and Brooks, 2012; Corral Rivas et al., 2017). However, the knowledge on the use of ANN techniques for stem taper estimation is quite limited (e.g., Diamantopoulou, 2010; Özçelik et al., 2010; Leite et al., 2011; Özçelik et al., 2014; Nunes and Görgens, 2016), although this approach has been widely used in some other research areas of forestry (e.g., Diamantopoulou et al., 2009; Diamantopoulou and Millios, 2010; Cai et al., 2012; Diamantopoulou and Özçelik, 2012; Ashraf et al., 2013; Castro et al., 2013; Özçelik et al., 2013; Yurtseven et al., 2013; Ashraf et al., 2015; Diamantopoulou et al., 2015; Vahedi, 2016; Nazerian et al., 2018).
In this study, the ANN models for stem taper estimations were developed for both Oriental beech (Fagus orientalis Lipsky.) - Kazdağı fir (Abies nordmanniana subsp. equi-trojani (Asc. & Sint. ex Boiss.) Coode & Cullen) species in mixed stands located in Karabük region, Turkey. The estimation successes of these models were compared with some regression based stem taper equations (i.e., Max and Burkhart, 1976; Fang et al., 2000; Bi, 2000; Kozak, 2004). It was hypothesized that ANN models would give a better estimation of stem taper than regression based equations.
MATERIAL AND METHODS
Study area
The total forested area of Turkey is 22.3 million hectares, and it comprises 28.6% of the total area of the country. Among the numerous tree species spread throughout the forest ecosystems in Turkey, beech
441
CERNE
SAKICI AND OZDEMIR.
STEM TAPER ESTIMATIONS WITH ARTIFICIAL NEURAL NETWORKS FOR MIXED ORIENTAL BEECH AND KAZDAĞI FIR STANDS IN KARABÜK REGION, TURKEY
(Fagus L.) has the largest distribution area (1.96 million hectares) within deciduous tree species, while fir (Abies Mill.) has the second widest distribution area (0.67 million hectares) following pine (Pinus L.) species within coniferous (General Directorate of Forestry, 2015).
The data used in this study were obtained from beech and fir sample trees located in mixed Oriental beech (Fagus orientalis) and Kazdağı fir (Abies nordmanniana subsp. equi-trojani) forests of Büyükdüz Planning Unit, which is one of the nine planning units of Karabük Forest Enterprise (Figure I). The total forested area of the planning unit is 5,341 ha (99% of the total acreage), and 51% of these forests are covered by mixed stands of beech and fir. Seventy-eight percent of these mixed stands are managed using even-aged techniques, while uneven-aged methods are used within the remaining 22%.
The elevation of the study area ranges from 800 to 1,736 m above sea level, with an average of 1,270 m, while the average slope is 45%. Mean annual temperature is 12 °C, and mean annual precipitation is 650 mm. The soils are loam or sandy-loam, and soil depth is medium or deep.
Data
In total, 516 sample trees (238 for Oriental beech and 278 for Kazdağı fir) were sampled in the study area. During the selection of the sample trees, healthy trees with unbroken tops were chosen from both even-aged and uneven-aged stands covering the existing range of sites. All sample trees were felled from stump height (i.e., 0.30 m above ground). For each sample tree, stump diameter (cm, at 0.30 m above ground), diameter at breast height (cm, at 1.30 m above ground), and diameters over-bark (cm) at 1 m height interval above breast height along to the stem were measured to the nearest 0.1 cm. Total tree heights (m) were also recorded to the nearest 0.01 m.
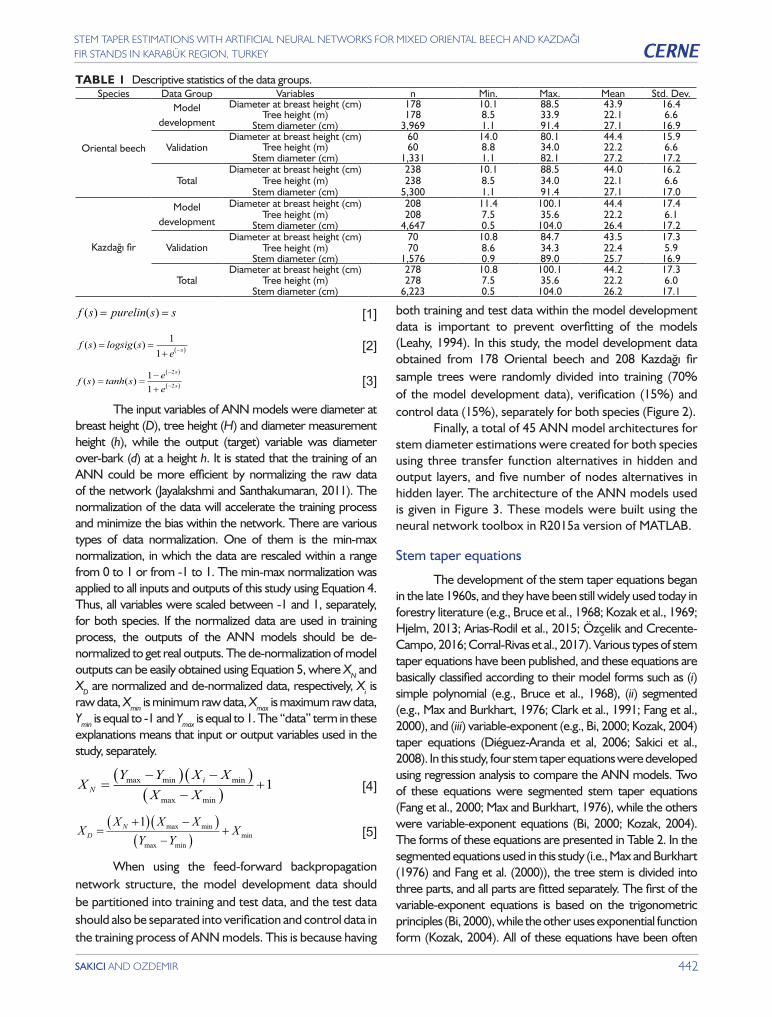
The sample trees were randomly divided into two groups as model development and validation data, considering diameter at breast height and tree height ranges. The first group included 75% of the sample trees of both species (i.e., 178 for Oriental beech and 208 for Kazdağı fir), while the second included the remaining 25% (i.e., 60 for Oriental beech and 70 for Kazdağı fir). The data within the first group were used to develop ANN models and stem taper equations, while the data within second group were used to test the validity of the developed models. Descriptive statistics of the data groups are given in Table I.
Artificial neural networks
Artificial intelligence techniques were used to estimate stem diameters, and ANN models were developed for this aim in this study. There are several criteria such as number of layers, learning algorithms, form of transfer functions, node numbers in hidden layer, and determination of data sizes for training, verification and test processes for defining the neural network architectures. The ANN models developed in this study included three layers: input, hidden and output layers. The feed-forward backpropagation network structure was chosen, since this structure has been very popular in forestry literature due to its estimation success (e.g., Özçelik et al., 2014; Diamantopoulou et al., 2015). The Levenberg-Marquardt algorithm was used as learning algorithm in ANN models because of the same reason with selecting network structure. In hidden and output layers separately, the transfer function forms were linear, logistic and hyperbolic tangent functions (Equations 1-3). To determine the successful alternatives, the node numbers in hidden layers tested were 2, 4, 6, 8 and 10 in training process of ANN models, where s=∑wixi, wi are weights and xi are the input variables.
FIGURE 1 Study area.
STEM TAPER ESTIMATIONS WITH ARTIFICIAL NEURAL NETWORKS FOR MIXED ORIENTAL BEECH AND KAZDAĞI FIR STANDS IN KARABÜK REGION, TURKEY
442
CERNE
SAKICI AND OZDEMIR
The input variables of ANN models were diameter at breast height (D), tree height (H) and diameter measurement height (h), while the output (target) variable was diameter over-bark (d) at a height h. It is stated that the training of an ANN could be more efficient by normalizing the raw data of the network (Jayalakshmi and Santhakumaran, 2011). The normalization of the data will accelerate the training process and minimize the bias within the network. There are various types of data normalization. One of them is the min-max normalization, in which the data are rescaled within a range from 0 to 1 or from -1 to 1. The min-max normalization was applied to all inputs and outputs of this study using Equation 4. Thus, all variables were scaled between -1 and 1, separately, for both species. If the normalized data are used in training process, the outputs of the ANN models should be de-normalized to get real outputs. The de-normalization of model outputs can be easily obtained using Equation 5, where XN and XD are normalized and de-normalized data, respectively, Xi is raw data, Xmin is minimum raw data, Xmax is maximum raw data, Ymin is equal to -1 and Ymax is equal to 1. The “data” term in these explanations means that input or output variables used in the study, separately.
TABLE 1 Descriptive statistics of the data groups.Species Data Group Variables n Min. Max. Mean Std. Dev.
Oriental beech
Model development
Diameter at breast height (cm) 178 10.1 88.5 43.9 16.4Tree height (m) 178 8.5 33.9 22.1 6.6
Stem diameter (cm) 3,969 1.1 91.4 27.1 16.9
ValidationDiameter at breast height (cm) 60 14.0 80.1 44.4 15.9
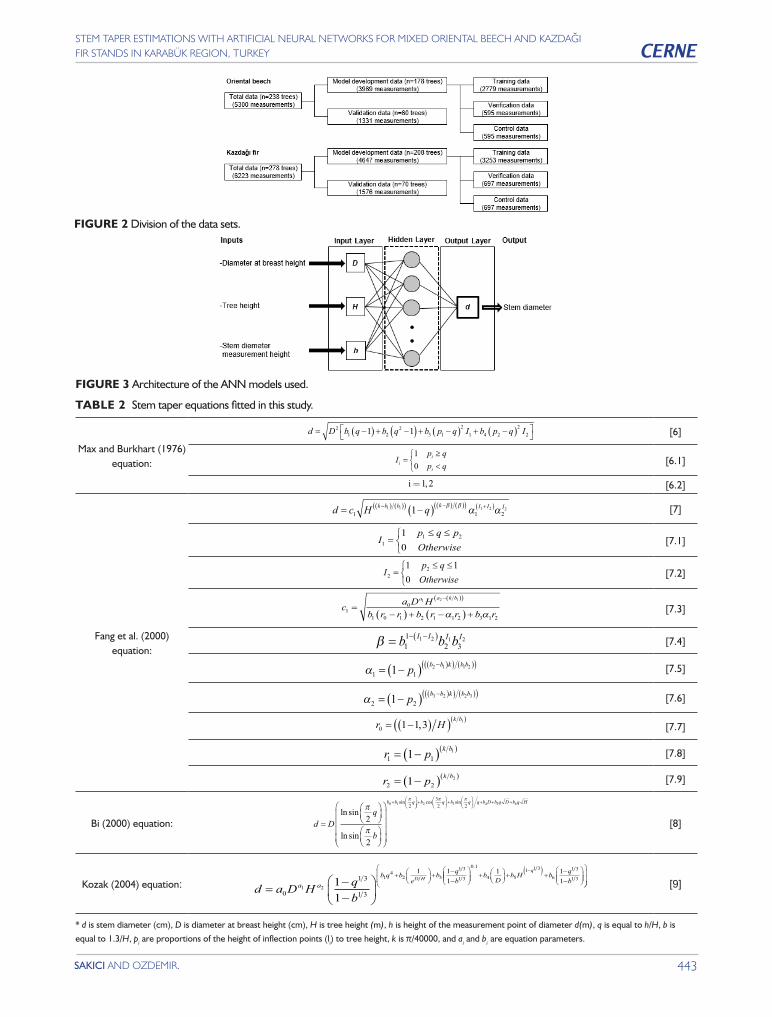
both training and test data within the model development data is important to prevent overfitting of the models (Leahy, 1994). In this study, the model development data obtained from 178 Oriental beech and 208 Kazdağı fir sample trees were randomly divided into training (70% of the model development data), verification (15%) and control data (15%), separately for both species (Figure 2).
Finally, a total of 45 ANN model architectures for stem diameter estimations were created for both species using three transfer function alternatives in hidden and output layers, and five number of nodes alternatives in hidden layer. The architecture of the ANN models used is given in Figure 3. These models were built using the neural network toolbox in R2015a version of MATLAB.
Stem taper equations
The development of the stem taper equations began in the late 1960s, and they have been still widely used today in forestry literature (e.g., Bruce et al., 1968; Kozak et al., 1969; Hjelm, 2013; Arias-Rodil et al., 2015; Özçelik and Crecente-Campo, 2016; Corral-Rivas et al., 2017). Various types of stem taper equations have been published, and these equations are basically classified according to their model forms such as (i) simple polynomial (e.g., Bruce et al., 1968), (ii) segmented (e.g., Max and Burkhart, 1976; Clark et al., 1991; Fang et al., 2000), and (iii) variable-exponent (e.g., Bi, 2000; Kozak, 2004) taper equations (Diéguez-Aranda et al, 2006; Sakici et al., 2008). In this study, four stem taper equations were developed using regression analysis to compare the ANN models. Two of these equations were segmented stem taper equations (Fang et al., 2000; Max and Burkhart, 1976), while the others were variable-exponent equations (Bi, 2000; Kozak, 2004). The forms of these equations are presented in Table 2. In the segmented equations used in this study (i.e., Max and Burkhart (1976) and Fang et al. (2000)), the tree stem is divided into three parts, and all parts are fitted separately. The first of the variable-exponent equations is based on the trigonometric principles (Bi, 2000), while the other uses exponential function form (Kozak, 2004). All of these equations have been often
When using the feed-forward backpropagation network structure, the model development data should be partitioned into training and test data, and the test data should also be separated into verification and control data in the training process of ANN models. This is because having
443
CERNE
SAKICI AND OZDEMIR.
STEM TAPER ESTIMATIONS WITH ARTIFICIAL NEURAL NETWORKS FOR MIXED ORIENTAL BEECH AND KAZDAĞI FIR STANDS IN KARABÜK REGION, TURKEY
FIGURE 2 Division of the data sets.
FIGURE 3 Architecture of the ANN models used.
TABLE 2 Stem taper equations fitted in this study.
Max and Burkhart (1976) equation:
d D b q b q b p q I b p q I= −( ) + −( ) + −( ) + −( )
21 2
23 1
21 4 2
221 1 [6]
Ip qp qii
i
=≥<
10 [6.1]
i=1 2, [6.2]
Fang et al. (2000) equation:
d c H qk b b k I I I= −( )−( ) ( )( ) −( ) ( )( ) +( )1 1 2
1 1 1 2 21 β β α α [7]
Ip q pOtherwise11 21
0=
≤ ≤
[7.1]
Ip qOtherwise221 1
0=
≤ ≤
[7.2]
c a D Hb r r b r r b r
a a k b
10
1 0 1 2 1 1 2 3 1 2
1 2 1
=−( ) + −( ) +
−( )( )
α α [7.3]
β = − −( )b b bI I I I11
2 31 2 1 2 [7.4]
α1 11 2 1 1 2= −( ) −( )( ) ( )( )p b b k b b [7.5]
α2 21 3 2 2 3= −( ) −( )( ) ( )( )p b b k b b [7.6]
r Hk b
0 1 1 3 1= −( )( )( ), [7.7]
r p k b1 11 1= −( )( ) [7.8]
r p k b2 21 2= −( )( ) [7.9]
Bi (2000) equation: d Dq
b
b b q
=
+
ln sin
ln sin
sinπ
π
π
2
2
0 1 2 +
+
+ + +b q b q q b D b q D b q H2 3 4 5 6
32 2
cos sinπ π
[8]
Kozak (2004) equation: d a D H qb
a ab q b
eb q
bD H
=−−
+
+
−−
0
1 3
1 3
1 11
1 2
14
2 3
1 3
1 311
+
+ +
−−
−( )0 1
4 51 1 3
6
1 3
1 31 1
1
.
bD
b H b qb
q
[9]
* d is stem diameter (cm), D is diameter at breast height (cm), H is tree height (m), h is height of the measurement point of diameter d(m), q is equal to h/H, b is
equal to 1.3/H, pi are proportions of the height of inflection points (li) to tree height, k is π/40000, and ai and bi are equation parameters.
STEM TAPER ESTIMATIONS WITH ARTIFICIAL NEURAL NETWORKS FOR MIXED ORIENTAL BEECH AND KAZDAĞI FIR STANDS IN KARABÜK REGION, TURKEY
444
CERNE
SAKICI AND OZDEMIR
preferred, and provide better statistical results in the literature (e.g., Brooks et al. (2008) for Max and Burkhart (1976) equation, Diéguez-Aranda et al. (2006), Özçelik and Crecente-Campo (2016), Özçelik et al. (2016) and Corral-Rivas et al. (2017) for Fang et al. (2000) equation, Li and Weiskittel (2010) and de-Miguel et al. (2012) for Bi (2000) equation, and Fonweban et al. (2011) and Menéndez-Miguélez et al. (2014) for Kozak (2004) equation). The stem taper equations were fitted using model development data by MODEL procedure of SAS software for both species.
Model comparisons and validation
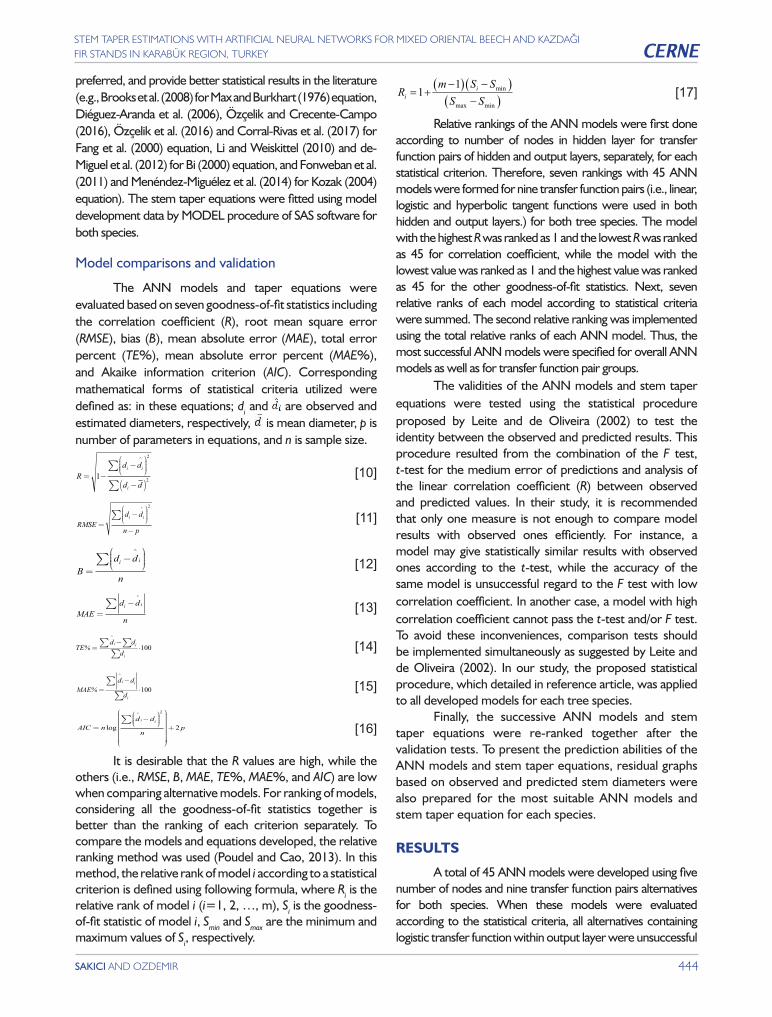
The ANN models and taper equations were evaluated based on seven goodness-of-fit statistics including the correlation coefficient (R), root mean square error (RMSE), bias (B), mean absolute error (MAE), total error percent (TE%), mean absolute error percent (MAE%), and Akaike information criterion (AIC). Corresponding mathematical forms of statistical criteria utilized were defined as: in these equations; di and are observed and estimated diameters, respectively, is mean diameter, p is number of parameters in equations, and n is sample size.
[10]
[11]
[12]
[13]
[14]
[15]
[16]
Rm S SS Si
i= +−( ) −( )
−( )1
1 min
max min
[17]
Relative rankings of the ANN models were first done according to number of nodes in hidden layer for transfer function pairs of hidden and output layers, separately, for each statistical criterion. Therefore, seven rankings with 45 ANN models were formed for nine transfer function pairs (i.e., linear, logistic and hyperbolic tangent functions were used in both hidden and output layers.) for both tree species. The model with the highest R was ranked as 1 and the lowest R was ranked as 45 for correlation coefficient, while the model with the lowest value was ranked as 1 and the highest value was ranked as 45 for the other goodness-of-fit statistics. Next, seven relative ranks of each model according to statistical criteria were summed. The second relative ranking was implemented using the total relative ranks of each ANN model. Thus, the most successful ANN models were specified for overall ANN models as well as for transfer function pair groups.
The validities of the ANN models and stem taper equations were tested using the statistical procedure proposed by Leite and de Oliveira (2002) to test the identity between the observed and predicted results. This procedure resulted from the combination of the F test, t-test for the medium error of predictions and analysis of the linear correlation coefficient (R) between observed and predicted values. In their study, it is recommended that only one measure is not enough to compare model results with observed ones efficiently. For instance, a model may give statistically similar results with observed ones according to the t-test, while the accuracy of the same model is unsuccessful regard to the F test with low correlation coefficient. In another case, a model with high correlation coefficient cannot pass the t-test and/or F test. To avoid these inconveniences, comparison tests should be implemented simultaneously as suggested by Leite and de Oliveira (2002). In our study, the proposed statistical procedure, which detailed in reference article, was applied to all developed models for each tree species.
Finally, the successive ANN models and stem taper equations were re-ranked together after the validation tests. To present the prediction abilities of the ANN models and stem taper equations, residual graphs based on observed and predicted stem diameters were also prepared for the most suitable ANN models and stem taper equation for each species.
RESULTS
A total of 45 ANN models were developed using five number of nodes and nine transfer function pairs alternatives for both species. When these models were evaluated according to the statistical criteria, all alternatives containing logistic transfer function within output layer were unsuccessful
It is desirable that the R values are high, while the others (i.e., RMSE, B, MAE, TE%, MAE%, and AIC) are low when comparing alternative models. For ranking of models, considering all the goodness-of-fit statistics together is better than the ranking of each criterion separately. To compare the models and equations developed, the relative ranking method was used (Poudel and Cao, 2013). In this method, the relative rank of model i according to a statistical criterion is defined using following formula, where Ri is the relative rank of model i (i=1, 2, …, m), Si is the goodness-of-fit statistic of model i, Smin and Smax are the minimum and maximum values of Si, respectively.
Rd d
d d
i i
i
= −−
−( )
∑
∑1
2
2
^
RMSEd d
n p
i i
=−
−
∑^ 2
Bd d
n
i i
=−
∑
^
MAEd d
n
i i
=−∑
^
TE%d dd
i i
i
=−
⋅∑ ∑∑
^
100
MAE%d d
d
i i
i
=−
⋅∑∑
^
100
AIC nd d
np
i i
=−
+∑
log
^ 2
2
445
CERNE
SAKICI AND OZDEMIR.
STEM TAPER ESTIMATIONS WITH ARTIFICIAL NEURAL NETWORKS FOR MIXED ORIENTAL BEECH AND KAZDAĞI FIR STANDS IN KARABÜK REGION, TURKEY
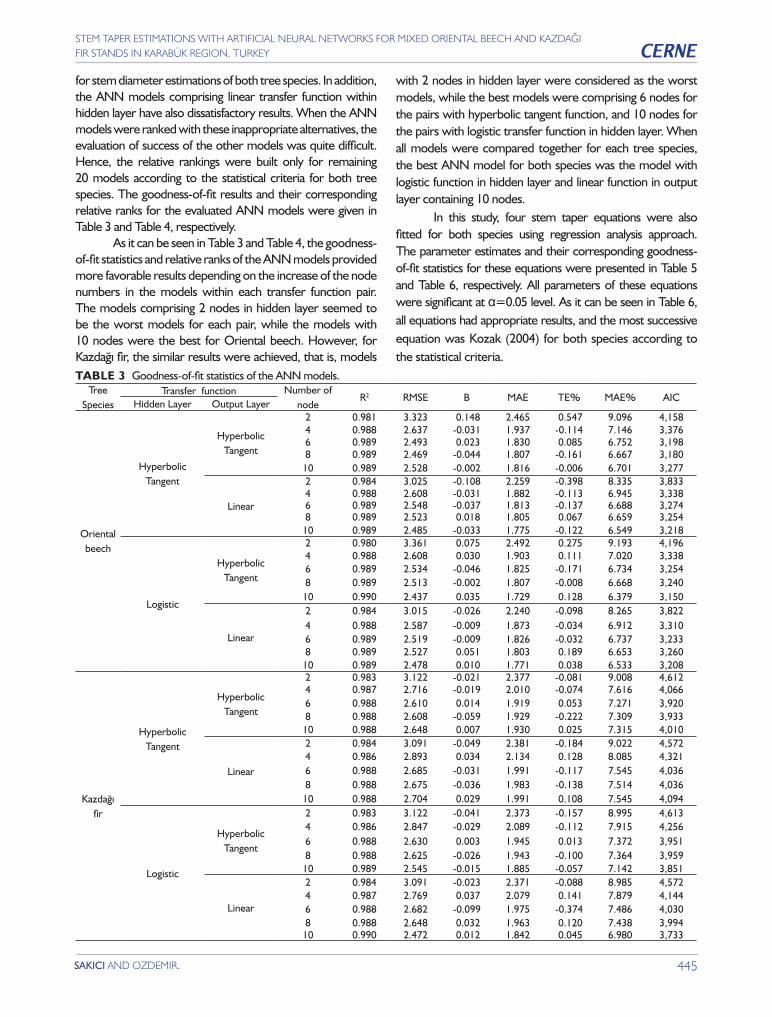
for stem diameter estimations of both tree species. In addition, the ANN models comprising linear transfer function within hidden layer have also dissatisfactory results. When the ANN models were ranked with these inappropriate alternatives, the evaluation of success of the other models was quite difficult. Hence, the relative rankings were built only for remaining 20 models according to the statistical criteria for both tree species. The goodness-of-fit results and their corresponding relative ranks for the evaluated ANN models were given in Table 3 and Table 4, respectively.
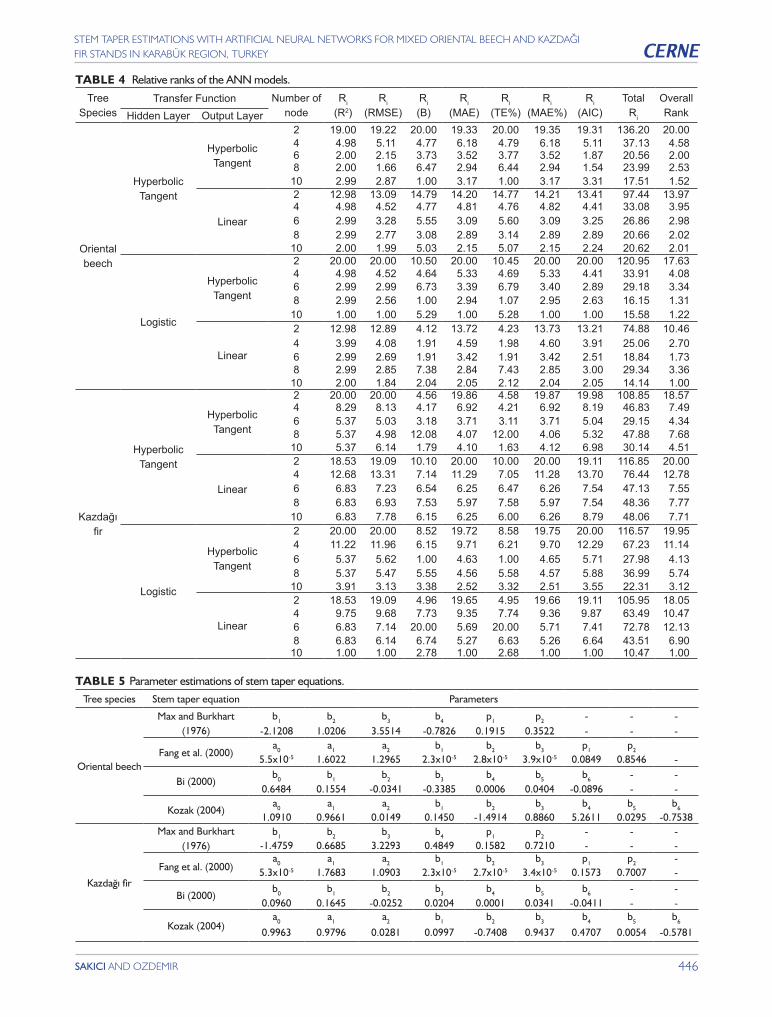
As it can be seen in Table 3 and Table 4, the goodness-of-fit statistics and relative ranks of the ANN models provided more favorable results depending on the increase of the node numbers in the models within each transfer function pair. The models comprising 2 nodes in hidden layer seemed to be the worst models for each pair, while the models with 10 nodes were the best for Oriental beech. However, for Kazdağı fir, the similar results were achieved, that is, models
with 2 nodes in hidden layer were considered as the worst models, while the best models were comprising 6 nodes for the pairs with hyperbolic tangent function, and 10 nodes for the pairs with logistic transfer function in hidden layer. When all models were compared together for each tree species, the best ANN model for both species was the model with logistic function in hidden layer and linear function in output layer containing 10 nodes.
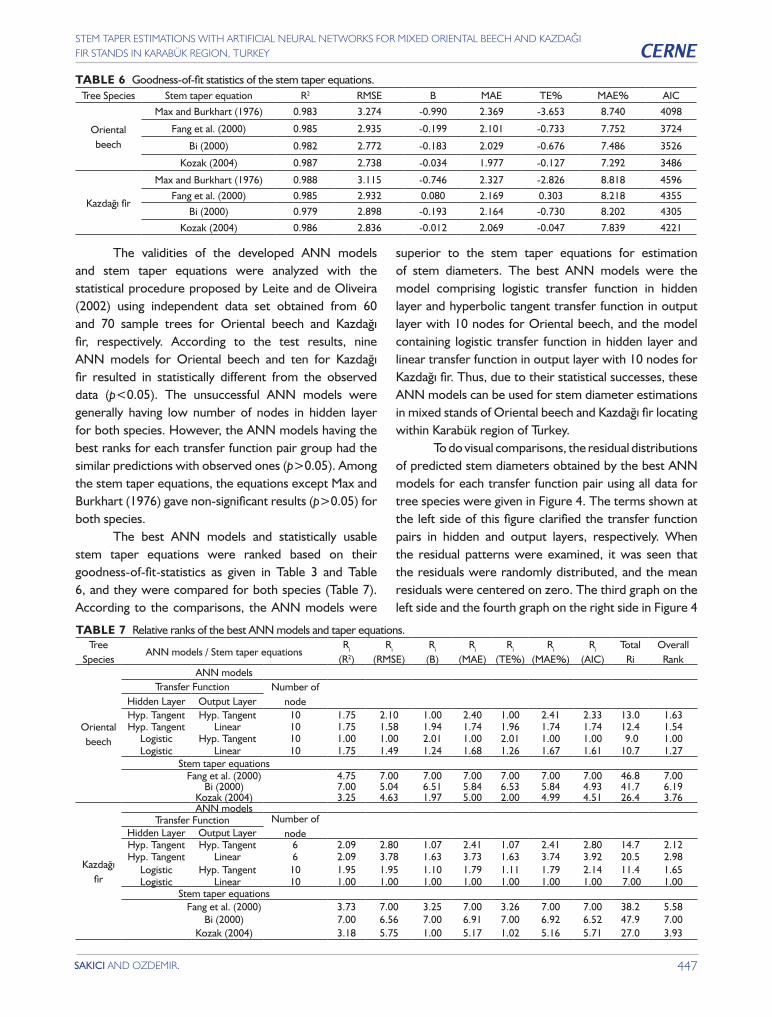
In this study, four stem taper equations were also fitted for both species using regression analysis approach. The parameter estimates and their corresponding goodness-of-fit statistics for these equations were presented in Table 5 and Table 6, respectively. All parameters of these equations were significant at α=0.05 level. As it can be seen in Table 6, all equations had appropriate results, and the most successive equation was Kozak (2004) for both species according to the statistical criteria.
TABLE 3 Goodness-of-fit statistics of the ANN models.Tree
STEM TAPER ESTIMATIONS WITH ARTIFICIAL NEURAL NETWORKS FOR MIXED ORIENTAL BEECH AND KAZDAĞI FIR STANDS IN KARABÜK REGION, TURKEY
The validities of the developed ANN models and stem taper equations were analyzed with the statistical procedure proposed by Leite and de Oliveira (2002) using independent data set obtained from 60 and 70 sample trees for Oriental beech and Kazdağı fir, respectively. According to the test results, nine ANN models for Oriental beech and ten for Kazdağı fir resulted in statistically different from the observed data (p<0.05). The unsuccessful ANN models were generally having low number of nodes in hidden layer for both species. However, the ANN models having the best ranks for each transfer function pair group had the similar predictions with observed ones (p>0.05). Among the stem taper equations, the equations except Max and Burkhart (1976) gave non-significant results (p>0.05) for both species.
The best ANN models and statistically usable stem taper equations were ranked based on their goodness-of-fit-statistics as given in Table 3 and Table 6, and they were compared for both species (Table 7). According to the comparisons, the ANN models were
superior to the stem taper equations for estimation of stem diameters. The best ANN models were the model comprising logistic transfer function in hidden layer and hyperbolic tangent transfer function in output layer with 10 nodes for Oriental beech, and the model containing logistic transfer function in hidden layer and linear transfer function in output layer with 10 nodes for Kazdağı fir. Thus, due to their statistical successes, these ANN models can be used for stem diameter estimations in mixed stands of Oriental beech and Kazdağı fir locating within Karabük region of Turkey.
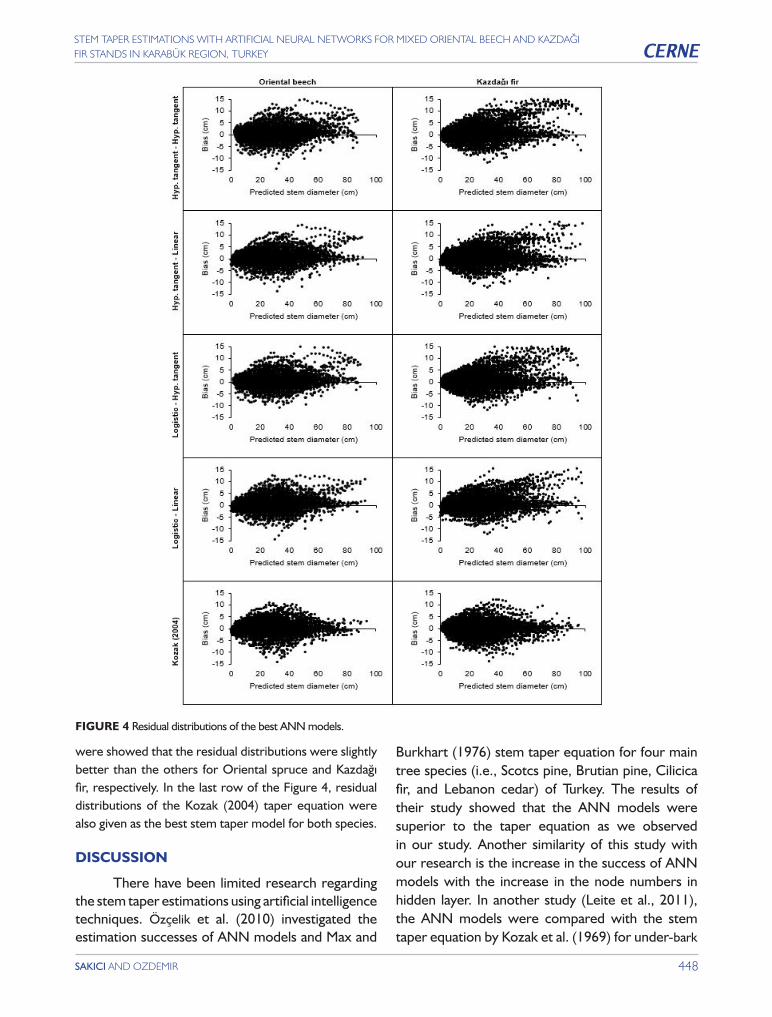
To do visual comparisons, the residual distributions of predicted stem diameters obtained by the best ANN models for each transfer function pair using all data for tree species were given in Figure 4. The terms shown at the left side of this figure clarified the transfer function pairs in hidden and output layers, respectively. When the residual patterns were examined, it was seen that the residuals were randomly distributed, and the mean residuals were centered on zero. The third graph on the left side and the fourth graph on the right side in Figure 4
TABLE 6 Goodness-of-fit statistics of the stem taper equations.Tree Species Stem taper equation R2 RMSE B MAE TE% MAE% AIC
Oriental beech
Max and Burkhart (1976) 0.983 3.274 -0.990 2.369 -3.653 8.740 4098
STEM TAPER ESTIMATIONS WITH ARTIFICIAL NEURAL NETWORKS FOR MIXED ORIENTAL BEECH AND KAZDAĞI FIR STANDS IN KARABÜK REGION, TURKEY
448
CERNE
SAKICI AND OZDEMIR
were showed that the residual distributions were slightly better than the others for Oriental spruce and Kazdağı fir, respectively. In the last row of the Figure 4, residual distributions of the Kozak (2004) taper equation were also given as the best stem taper model for both species.
DISCUSSION
There have been limited research regarding the stem taper estimations using artificial intelligence techniques. Özçelik et al. (2010) investigated the estimation successes of ANN models and Max and
Burkhart (1976) stem taper equation for four main tree species (i.e., Scotcs pine, Brutian pine, Cilicica fir, and Lebanon cedar) of Turkey. The results of their study showed that the ANN models were superior to the taper equation as we observed in our study. Another similarity of this study with our research is the increase in the success of ANN models with the increase in the node numbers in hidden layer. In another study (Leite et al., 2011), the ANN models were compared with the stem taper equation by Kozak et al. (1969) for under-bark
FIGURE 4 Residual distributions of the best ANN models.
449
CERNE
SAKICI AND OZDEMIR.
STEM TAPER ESTIMATIONS WITH ARTIFICIAL NEURAL NETWORKS FOR MIXED ORIENTAL BEECH AND KAZDAĞI FIR STANDS IN KARABÜK REGION, TURKEY
stem diameter estimations of Tectona grandis located in the Brazil. The similar results were also obtained with their study, and the ANN models had better estimations than taper equation. The number of nodes considered to be sufficient in this study were also similar to our findings. Özçelik et al. (2014) compared the ANN models with the taper equation of Clark et al. (1991), and the ANN models were found to be better for stem diameter estimations of Pinus brutia in southern Turkey.
Nunes and Görgens (2016) investigated and compared the stem taper estimating performances of some ANN models and six stem taper equations including Bi (2000) and Kozak (2004) functions for three forest types including a tropical savanna, a rainforest and a semi-deciduous forest in southeastern Brazil. According the results of their study, the ANN approach were recommended for stem diameter estimations due to some advantages of this approach, although the Kozak (2004) were also gave better results. We have also nearly the same results with Nunes and Görgens (2016) for both estimation approach (i.e., the ANN models and the stem taper equations) despite the different forest structures. The results of the limited number of studies described above on stem taper estimation with artificial intelligence techniques were quite similar to of our study.
Contrary to our work and the studies described above, da Silva et al. (2018) stated that the neural networks (i.e., some kinds of Radial basis function and Multilayer perceptron) and classical equations (i.e., Schumacher-Hall and Spurr volume models) are equivalent to each other when there is a lot of data for training, while the classical models performed better when there are few training data for the volume estimation. However, they suggested the Radial basis function neural networks because of their adaptation capabilities for different data sets and advantage of having architecture defined automatically by clustering algorithms.
CONCLUSION
Although regression based functions such as stem taper equations have still favorable usage for stem taper predictions, artificial intelligence applications can be another flexible tool. According to the results of the study, the ANN models have better stem diameter predictions than stem taper equations for the mixed Oriental beech and Kazdağı fir stands, which have large distribution area within the study region. The stem diameter estimations obtained from developed models can be used to determine the volume of wood-based products of standing trees.
It is important to define the successive ANN model structures for various individual tree or stand parameters in forestry researches. In this study, it was aimed to make this definition for stem diameter estimations. Within the ANN models, using the linear transfer function in hidden layer causes the unsuccessful results. Moreover, utilization of the logistic transfer function in output layer negatively influences the estimation power of the ANN models for stem diameter estimation. The models containing a large number of nodes (i.e., six to ten) within hidden layer were better than the ones with smaller node numbers (i.e., two or four). Based on these initial results, it can be stated that the transfer functions, which should not be used in hidden and output layers, are linear and logistic functions, respectively. The number of nodes in hidden layer should be more than five in stem diameter estimation models.
The ANN models offer some advantages to overcome the problems such as multicollinearity and autocorrelation in forestry data. These advantages are also important for researches on stem taper. In this respect, the ANN models should be considered as an alternative approach for this aim. If stem taper equations are used for the stem taper estimations of the studied tree species, the equation proposed by Kozak (2004) can be used with the parameters acquired in this study. However, when choosing a stem taper estimating model, both practical and acceptable statistical considerations should be taken into account.
We preferred the feed-forward backpropagation network structure and achieved the satisfactory results in our study. The other network structures such as cascade correlation or resilient backpropagation can also be investigated in further studies for stem diameter or any other individual tree or forest parameters estimations.
ACKNOWLEDGMENTS
This study was produced from a master’s thesis prepared by Gulay Ozdemir and supervised by Dr. Oytun Emre Sakici for the Institute of Science, Kastamonu University, Turkey. We would like to thank Cemal Bozkurt for his support in the field work.
REFERENCESARIAS-RODIL, M.; DIÉGUEZ-ARANDA, U.; PUERTA, F. R.;
LÓPEZ-SÁNCHEZ, C. A.; LIBANO, E. C.; OBREGÓN, A. C.; CASTEDO-DORADO, F. Modeling and localizing a stem taper function for Pinus radiata in Spain. Canadian Journal of Forest Research, v. 45, n. 6, p. 647-658, 2015.
ASHRAF, M. I.; ZHAO, Z.; BOURQUE, C. P. A.; MACLEAN, D. A.; MENG, F. Integrating biophysical controls in forest growth and yield predictions generated with artificial intelligence technology. Canadian Journal of Forest Research, v. 43, n. 12, p. 1162–1171, 2013.
STEM TAPER ESTIMATIONS WITH ARTIFICIAL NEURAL NETWORKS FOR MIXED ORIENTAL BEECH AND KAZDAĞI FIR STANDS IN KARABÜK REGION, TURKEY
450
CERNE
SAKICI AND OZDEMIR
ASHRAF, M. I.; MENG, F. R.; BOURQUE, C. P. A.; MACLEAN, D. A. A novel modelling approach for predicting forest growth and yield under climate change. PLoS ONE, v. 10, n. 7, e0132066, 2015.
BARRIO-ANTA, M.; DIÉGUEZ-ARANDA, U.; CASTEDO-DORADO, F.; ÁLVAREZ-GONZÁLEZ, J. G.; GADOW, K. Merchantable volume system for pedunculate oak in northwestern Spain. Annals of Forest Science, v. 64, n. 5, p. 511-520, 2007.
BI, H. Trigonometric variable-form taper equations for Australian eucalypts. Forest Science, v. 46, n. 3, p. 397-407, 2000.
BROOKS, J. R.; JIANG, L.; ÖZÇELIK, R. Compatible stem volume and taper equations for Brutian pine, Cedar of Lebanon, and Cilicica fir in Turkey. Forest Ecology and Management, v. 256, n. 1-2, p. 147-151, 2008.
BRUCE, D.; CURTIS, R. O.; VANCOEVERING, C. Development of a system of taper and volume tables for red alder. Forest Science, v. 14, n. 3, p. 339-350, 1968.
CAI, S.; KANG, X.; ZHANG, L. Simulation of trunk diameter distribution for three broadleaved trees based on artificial neural networks. International Journal of Advancements in Computing Technology, v. 4, p. 520-527, 2012.
CASTRO, R. V. O.; SOARES, C. P. B.; LEITE, H. G.; LOPES DE SOUZA, A.; NOGUEIRA, G. S.; MARTINS, F. B. Individual growth model for Eucalyptus stands in Brazil using artificial neural network. ISRN Forestry, 196832, 2013.
CLARK, A.; SOUTER, R. A.; SCHLAEGEL, B. E. Stem profile equations for southern tree species. USDA Forest Service, Research Paper SE-282, 1991.
CORRAL-RIVAS, J. J.; VEGA-NIEVA, D. J.; RODRÍGUEZ-SOALLERIO, R.; LÓPEZ-SÁNCHEZ, C. A.; WEHENKEL, C.; VARGAS-LARRETA, B.; ÁLVAREZ-GONZÁLEZ, J. G.; RUIZ-GONZÁLEZ, A. D. Compatible system for predicting total and merchantable stem volume over and under bark, branch volume and whole-tree volume of pine species. Forests, v. 8, n. 11, 417, 2017.
DA SILVA, E. M.; MAIA, R. D.; CABACINHA, C. D. Bee-inspired RBF network for volume estimation of individual trees. Computers and Electronics in Agriculture, v. 152, p. 401-408, 2018.
DE-MIGUEL, S.; MEHTÄTALO, L.; SHATER, Z.; KRAID, B.; PUKKALA, T. Evaluating marginal and conditional predictions of taper models in the absence of calibration data. Canadian Journal of Forest Research, v. 42, n. 7, p. 1383-1394, 2012.
DIAMANTOPOULOU, M. J.; MILIOS, E.; DOGANOS, D.; BISTINAS, I. Artificial neural network modeling for reforestation design through the dominant trees bole-volume estimation. Natural Resource Modeling, v. 22, n. 4, p. 511-543, 2009.
DIAMANTOPOULOU, M. J. Filling gaps in diameter measurements on standing tree boles in the urban forest of Thessaloniki, Greece. Environmental Modelling & Software, v. 25, n. 12, p. 1857-1865, 2010.
DIAMANTOPOULOU, M. J.; MILIOS, E. Modelling total volume of dominant pine trees in reforestations via multivariate analysis and artificial neural network models. Biosystems Engineering, v. 105, n. 3, p. 306–315, 2010.
DIAMANTOPOULOU, M. J.; ÖZÇELIK, R. Evaluation of different modeling approaches for total tree-height estimation in Mediterranean Region of Turkey. Forest Systems, v. 21, n. 3, p. 383-397, 2012.
DIAMANTOPOULOU, M. J.; ÖZÇELIK, R.; CRECENTE-CAMPO, F.; ELER, Ü. Estimation of Weibull function parameters for modelling tree diameter distribution using least squares and artificial neural networks methods. Biosystems Engineering, v. 133, p. 33-45, 2015.
DIÉGUEZ-ARANDA, U.; CASTEDO-DORADO, F.; ÁLVAREZ-GONZÁLEZ, J. G.; ROJO, A. Compatible taper function for Scots pine Plantations in nortwestern Spain. Canadian Journal of Forest Research, v. 36, n. 5, p. 1190–1205, 2006.
ELMAS, Ç. Yapay Zeka Uygulamaları. Seçkin Yayıncılık, 2007. 425 p.
FANG, Z.; BAILEY, R. L. Compatible volume and taper models with coefficients for tropical species on Hainan Island in Southern China. Forest Science, v. 45, n. 1, p. 85-100, 1999.
FANG, Z.; BORDERS, B. E.; BAILEY, R. L. Compatible volume taper models for loblolly and slash pine based on system with segmented-stem form factors. Forest Science, v. 46, n. 1, p. 1-12, 2000.
GENERAL DIRECTORATE OF FORESTRY. Türkiye Orman Varlığı 2015. General Directorate of Forestry Publications, 2015. 32 p.
HJELM, B. Stem taper equations for poplars growing on farmland in Sweden. Journal of Forestry Research, v. 24, n. 1, p. 15-22, 2013.
JAYALAKSHMI, T.; SANTHAKUMARAN, A. Statistical normalization and back propagation for classification. International Journal of Computer Theory and Engineering, v. 3, n. 1, p. 89-93, 2011.
KOZAK, A.; MUNRO, D. D.; SMITH, J. H. G. Taper functions and their applications in forest inventory. The Forestry Chronicle, v. 45, n. 4, p. 278-283, 1969.
KOZAK, A. My last words on taper equations. The Forestry Chronicle, v. 80, n. 4, p. 507-515, 2004.
LEAHY, K. The overfitting problem in perspective. AI Expert, v. 9, n. 10, p. 35–36, 1994.
LEGENDRE, P. Spatial autocorrelation: trouble or new paradigm?. Ecology, v. 74, n. 6, p. 1659-1673, 1993.
451
CERNE
SAKICI AND OZDEMIR.
STEM TAPER ESTIMATIONS WITH ARTIFICIAL NEURAL NETWORKS FOR MIXED ORIENTAL BEECH AND KAZDAĞI FIR STANDS IN KARABÜK REGION, TURKEY
LEITE, H. G.; DA SILVA, M. L. M.; BINOTI, D. H. B.; FARDIN, L.; TAKIZAWA, F. H. Estimation of inside-bark diameter and heartwood diameter for Tectona grandis Linn. trees using artificial neural networks. European Journal of Forest and Research, v. 130, n. 2, p. 263–269, 2011.
LEITE, H. G.; DE OLIVEIRA, F. H. T. Statistical procedure to test identity between analytical methods. Communications in Soil Science and Plant Analysis, v. 33, n. 7-8, p. 1105-1118, 2002.
LI, R.; WEISKITTEL, A. R. Comparison of model forms for estimating stem taper and volume in the primary conifer species of the North American Acadian Region. Annals of Forest Science, v. 67, n. 3, 302, 2010.
MAX, T. A.; BURKHART, H. E. Segmented polynomial regression applied to taper equations. Forest Science, v. 22, n. 3, p. 283-289, 1976.
MENÉNDEZ-MIGUÉLEZ, M.; CANGA, E.; ÁLVAREZ-ÁLVAREZ, P.; MAJADA, J. Stem taper function for sweet chestnut (Castanea sativa Mill.) coppice stands in northwest Spain. Annals of Forest Science, v. 71, n. 7, p. 761-770, 2014.
NAZERIAN, M.; KAMYABB, M.; SHAMSIANB, M.; DAHMARDEHB, M.; KOOSHAA, M. Comparison of response surface methodology (RSM) and artificial neural networks (ANN) towards efficient optimization of flexural properties of gypsum-bonded fiberboards. Cerne, v. 24, n. 1, p. 35-47, 2018.
NEWNHAM, R. M. A variable-form taper function. Forestry Canada Petawawa National Forestry Institute, Information Report, PI-X-83, 1988.
NUNES, M. H.; GÖRGENS, E. B. Artificial intelligence procedures for tree taper estimation with in a complex vegetation mosaic in Brazil. PLoS ONE, v. 11, n. 5, e0154738, 2016.
ÖZÇELIK, R.; DIAMANTOPOULOU, M. J.; BROOKS, J. R.; WIANT, H. V. Estimating tree bole volume using artificial neural network models for four species in Turkey. Journal of Environmental Management, v. 91, n. 3, p. 742–753, 2010.
ÖZÇELIK, R.; BROOKS, J. R. Compatible volume and taper models for economically important tree species of Turkey. Annals of Forest Science, v. 69, n. 1, p. 105-118, 2012.
ÖZÇELIK, R.; DIAMANTOPOULOU, M. J.; CRECENTE-CAMPO, F.; ELER, Ü. Estimating Crimean juniper tree height using nonlinear regression and artificial neural network models. Forest Ecology and Management, v. 306, p. 52-60, 2013.
ÖZÇELIK, R.; DIAMANTOPOULOU, M. J.; BROOKS, J. R. The use of tree crown variables in over-bark diameter and volume prediction models. iForest, v. 7, p. 132-139, 2014.
ÖZÇELIK, R.; CRECENTE-CAMPO, F. Stem taper equations for estimating merchantable volume of Lebanon cedar trees in the Taurus Mountains, Southern Turkey. Forest Science, v. 62, n. 1, p. 78-91, 2016.
ÖZÇELIK, R.; KARATEPE, Y.; GÜRLEVIK, N.; CAÑELLAS, I.; CRECENTE-CAMPO F. Development of ecoregion-based merchantable volume systems for Pinus brutia Ten. and Pinus nigra Arnold. in southern Turkey. Journal of Forestry Research, v. 27, n. 1, p. 101–117, 2016.
POUDEL, K. P.; CAO, Q. V. Evaluation of methods to predict Weibull parameters for characterizing diameter distributions. Forest Science, v. 59, n. 2, p. 243-252, 2013.
SAKICI, O. E.; MISIR N.; YAVUZ H.; MISIR M. Stem taper functions for Abies nordmanniana subsp. bornmulleriana in Turkey. Scandinavian Journal of Forest Research, v. 23, n. 6, p. 522-533, 2008.
VAHEDI, A. A. Artificial neural networks application in comparison with modeling allometric equations for predicting above-ground biomass in the Hyrcanian mixed-beech forests of Iran. Biomass and Bioenergy, v. 88, p. 66-76, 2016.
YURTSEVEN, İ.; SERENGIL, Y.; ÖZHAN, S. Estimation of interception with artificial neural networks in oak-beech mixed stand. Journal of the Faculty of Forestry, Istanbul University, v. 63, n. 1, p. 19-25, 2013.