18
Step 3: Critically Appraising the Evidence: Statistics for Harm and Etiology
| Date post: | 17-Dec-2015 |
| Category: |
Documents |
| Upload: | kathleen-waters |
| View: | 216 times |
| Download: | 0 times |

Table of Contents• Clinical Statistics Calculator (Excel
)• Statistics for:
– Harm/Etiology & Prognosis• Control Event Rate (CER) & Experimental E
vent Rate (EER)• Number Needed to Harm (NNH)
– Absolute Risk Increase (ARI)
• Relative Risk (RR)• Odds• Odds Ratio (OR)
• Practice Exercises

Making It Easier• If available, find the best
evidence in secondary sources where analysis has already occurred.
• If not pre-assessed, use critical appraisal worksheets to help you through the process.
Importance of Critically Appraising the Evidence
• Understanding the Limitations of the Author’s Analyses and Interpretations of the Data
• Assessing Internal Validity• Assessing External Validity• Identifying Potential
Confounding Variables– Simpson’s Paradox

Critical Appraisal Basics
• View movie as:– QuickTime
(.mov)– Flash (.swf)
• Double-click on video for full-screen mode.

Generalized 2x2 Clinical Table
Target Outcome
+ -
Intervention/
Comparison
+ a (True Positiv
es)
b (False Positiv
es)
- c (False Negativ
es)
d (True Negatives)

Control Event Rate (CER) and
Experimental Event Rate (EER)• Experimental Event Rate (EER)
– The proportion of patients (in the intervention) who experienced the target outcome
• Control Event Rate (CER)– The proportion of patients (in
the comparison group) who experienced the target outcome

Calculating CER and EER
• Experimental Event Rate (EER)– a/(a+b)
• Control Event Rate (CER)– c/(c+d)

Number Needed to Harm (NNH)
• The estimated number of people treated for each patient the treatment harms beyond baseline/control risk.
• So smaller numbers indicate greater probability of harm as a result of the treatment
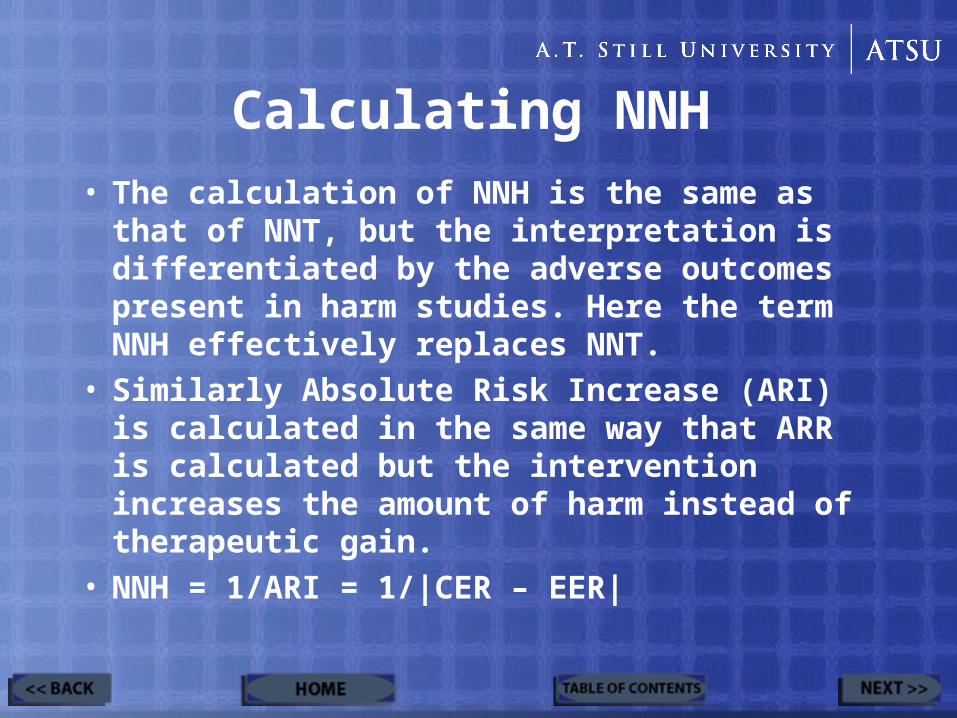
Calculating NNH• The calculation of NNH is the same as
that of NNT, but the interpretation is differentiated by the adverse outcomes present in harm studies. Here the term NNH effectively replaces NNT.
• Similarly Absolute Risk Increase (ARI) is calculated in the same way that ARR is calculated but the intervention increases the amount of harm instead of therapeutic gain.
• NNH = 1/ARI = 1/|CER – EER|

NNH Video
• View movie as:– QuickTime
(.mov)– Flash (.swf)
• Double-click on video for full-screen mode.

Relative Risk (RR)• The number of treated/exposed
patients with the target outcome for every patients in the control with the target outcome– (Also used in therapy articles)
• RR = EER / CER = (a/(a+b)) / (c/(c+d))

Relative Risk Video
• View movie as:– QuickTime
(.mov)– Flash (.swf)
• Double-click on video for full-screen mode.

Odds• The number of times the
target outcome occurred in patients exposed to the risk for each time the target outcome occurred in patients not exposed to the risk.

Odds Ratio (OR)• OR = (a/b) / (c/d)• = a*d / b*c
• A measure of association• When large, there is greater
association

Links to Other Websitesand Hands-On Activities
• EBM Glossary– From CEBM
• Critical Appraisal Practice Exercises– From CEBM