Stock Pointer - 1 - Tuesday, June’ 19, 2007 Jindal Saw Ltd. CMP: Rs.606.0 P/E 10.4x FY 08 BUY PRICE TARGET Rs. 850/- (18 Months) Index Details Sensex 14,080 Nifty 4,147 BSE MID CAP 6,172 Industry PIPE INDUSTRY Scrip Details Mkt Cap (Rs in crores) 2933.0 Book Value (Rs) 245.5 Eq Shares O/s (Cr) 48.4 Avg Vol 40,238 52 Week H/L 615 / 235 Dividend Yield (%) 1.0 Face Value (Rs) 10.0 BSE Code 500378 NSE Code JINDALSAW Shareholding Pattern (31 st March 07) Shareholders % holding Promoters 42.6 Indian Institutions 17.8 FII’s 17.1 Non Promoter Corporate 15.7 Public 6.8 Total 100.0 Jindal Saw Vs Sensex Jindal Saw Ltd (JSL), a part of $6 billion O.P. Jindal group is one of the largest pipe manufacturing company in India with strong global presence, offering total pipe solutions including high grade Submerged Arc Welded (SAW) pipes, steel plates, Ductile Iron (DI) pipes and seamless pipes. Key Investment Highlights Strong Demand Scenario Economic growth in emerging markets is driving oil and gas demand thereby creating readymade markets for its products. The period between 2005 – 2010 (E) is expected to exhibit a CAGR of 1.9% and 3.1% for oil and gas respectively. The natural fallout would be demand for pipelines which is estimated to be at US$ 56 bn over the next five years. Diversified business model: Balanced approach JSL has a diversified product range having presence in value as well as volume driven product lines. While SAW pipe is more of a volume driven product having good margins, DI pipes & Seamless pipes are segments with higher realizations & better margins. Increasing focus on Seamless & DI pipes: Margin accretive JSL is ramping up its Seamless pipes capacity from 100,000 MTPA to 250,000 MTPA which is expected to be completed by July’08. Further it is also adding two additional lines in the DI pipes segment which would increase the production of DI pipes from 120,000 MTPA to 180,000 MTPA. These additions would in turn add to the margins & profitability. Strong Order Book provides earnings visibility JSL’s Order Book provides earnings visibility. Currently the company has an order book worth Rs 56 billion, which is executable over a period of 12 months. The overseas orders contribute around 85% to the order book. Valuation & Recommendation At CMP, JSL is trading at 10.4x its FY08e earnings of Rs 58 and 8.0x its FY09e earnings of Rs 75.5. With JSL expected to increase its margins in the coming years coupled with its strong order book & the robust demand likely to prevail over the next five years, we recommend the investors to BUY the stock at the CMP with a price target of Rs 850, an upside of 40% from the current levels for 15 to 18 months. Key Financials: Y/E September Rs. in Cr. FY06 FY07E FY08E FY09E Net Revenues 3855.7 5028.4 5802.0 6624.0 EBIDTA 409.9 583.9 708.5 889.0 PAT 176.2 266.9 334.0 432.0 EPS (Rs.) 34.6 53.4 *58.0 75.5 EPS Growth (%) 75.3 54.1 8.6 30.1 ROCE (%) 16.1 18.8 20.4 23.6 ROE (%) 18.8 24.8 24.1 24.4 P/E (x) 18.7 11.3 10.4 8.0 EV/EBIDTA (x) 10.3 7.5 6.8 5.3 Note: * on diluted equity post conversion of warrants & FCCBs This document is for private circulation, and must be read in conjunction with the disclaimer on the last page.
Transcript
Stock Pointer
- 1 - Tuesday, June’ 19, 2007
Jindal Saw Ltd. CMP: Rs.606.0 P/E 10.4x FY 08 BUY
PRICE TARGET Rs. 850/- (18 Months)
Index Details Sensex 14,080 Nifty 4,147 BSE MID CAP 6,172
Industry PIPE INDUSTRY
Scrip Details
Mkt Cap (Rs in crores) 2933.0 Book Value (Rs) 245.5 Eq Shares O/s (Cr) 48.4 Avg Vol 40,238 52 Week H/L 615 / 235 Dividend Yield (%) 1.0 Face Value (Rs) 10.0 BSE Code 500378 NSE Code JINDALSAW
Shareholding Pattern (31st March 07) Shareholders % holding Promoters 42.6 Indian Institutions 17.8 FII’s 17.1 Non Promoter Corporate 15.7 Public 6.8 Total 100.0
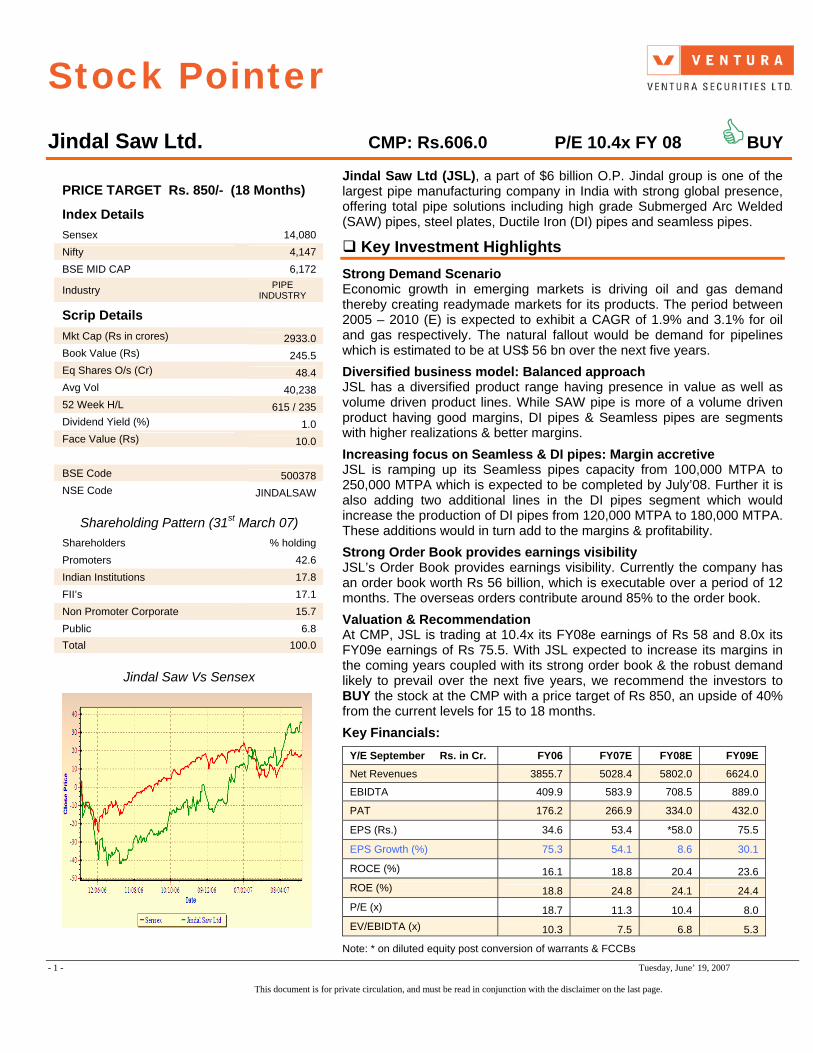
Jindal Saw Vs Sensex
Jindal Saw Ltd (JSL), a part of $6 billion O.P. Jindal group is one of the largest pipe manufacturing company in India with strong global presence, offering total pipe solutions including high grade Submerged Arc Welded (SAW) pipes, steel plates, Ductile Iron (DI) pipes and seamless pipes.
Key Investment Highlights
Strong Demand Scenario Economic growth in emerging markets is driving oil and gas demand thereby creating readymade markets for its products. The period between 2005 – 2010 (E) is expected to exhibit a CAGR of 1.9% and 3.1% for oil and gas respectively. The natural fallout would be demand for pipelines which is estimated to be at US$ 56 bn over the next five years.
Diversified business model: Balanced approach JSL has a diversified product range having presence in value as well as volume driven product lines. While SAW pipe is more of a volume driven product having good margins, DI pipes & Seamless pipes are segments with higher realizations & better margins.
Increasing focus on Seamless & DI pipes: Margin accretive JSL is ramping up its Seamless pipes capacity from 100,000 MTPA to 250,000 MTPA which is expected to be completed by July’08. Further it is also adding two additional lines in the DI pipes segment which would increase the production of DI pipes from 120,000 MTPA to 180,000 MTPA. These additions would in turn add to the margins & profitability.
Strong Order Book provides earnings visibility JSL’s Order Book provides earnings visibility. Currently the company has an order book worth Rs 56 billion, which is executable over a period of 12 months. The overseas orders contribute around 85% to the order book.
Valuation & Recommendation At CMP, JSL is trading at 10.4x its FY08e earnings of Rs 58 and 8.0x its FY09e earnings of Rs 75.5. With JSL expected to increase its margins in the coming years coupled with its strong order book & the robust demand likely to prevail over the next five years, we recommend the investors to BUY the stock at the CMP with a price target of Rs 850, an upside of 40% from the current levels for 15 to 18 months.
Key Financials:
Y/E September Rs. in Cr. FY06 FY07E FY08E FY09E Net Revenues 3855.7 5028.4 5802.0 6624.0
Note: * on diluted equity post conversion of warrants & FCCBs
This document is for private circulation, and must be read in conjunction with the disclaimer on the last page.
- 2 - Tuesday, June’ 19, 2007
This document is for private circulation, and must be read in conjunction with the disclaimer on the last page.
JSL is the largest manufacturer of pipes in the country both in terms of revenues & capacity.
JSL has a balanced approach with presence in value as well as volume driven product lines JSL’s greater emphasis on Seamless & DI pipes would enable the company to improve their margins going forward
Company Background
Jindal Saw Ltd (JSL), formerly known as Saw Pipes Ltd & a part of the $6 billion Jindal Group, is one of the largest pipe manufacturing company in India, offering ‘Total Pipes Solutions’ including Submerged Arc Welded (SAW) pipes both spiral as well as longitudinal pipes widely used in the energy sector for transportation of oil & gas, Ductile Iron Pipes (DI) for water & sewage transportation and Seamless tubes & pipes for Exploration & Production (E&P) activities and industrial applications. JSL has effectively established itself as a market leader and a global major in providing ‘Total Pipe Solutions’ to the industry.
The company has its production facilities at Kosi Kalan in UP catering to Saw pipes, two units at Mundra for Saw & DI pipes, seamless pipe unit at Nashik and two units in USA for steel plates & Saw pipes.
Business Model
The business operations of JSL are structured into four Strategic Business Units (SBUs) which include Saw pipes, Seamless Tubes & Pipes, DI Pipes & the US operations. While the first three SBUs manufacture & market LSAW, HSAW, Seamless & DI pipes respectively, the last SBU acts as a dedicated marketing arm catering to the US market.
Thus the company has a diversified product range which mitigates the business risks in the form of being diversified across various user segments (energy transportation sector, E&P activities & industrial applications and water & sewage transportation).
JSL has presence in value as well as volume driven product lines. While SAW pipe is more of a volume driven product having decent margins, DI pipes & Seamless pipes are high profitable segments having better realization & margins.
LSAW 16” to 48” up to 38 mm High Pressure as compared to HSAW – Critical Oil & Gas
HSAW 20” to 84” up to 18 mm Low & Medium Pressure – Oil & Gas / Water
Seamless 6 mm to 177.7 mm 1 mm to 25 mm E&P activities & industrial applications
DI 0.5” to 16” up to 13 mm Water projects & sewage Transportation
Product Mix: To focus more on higher margin products
Although majority of the revenues would continue to generate from the SAW pipe segment in the coming years, JSL’s focus on higher margin products viz. DI pipes & Seamless pipes would result in expansion of margins & de-risking its business. JSL is planning to ramp up the production in DI pipes by adding additional two lines which will enhance the production from current 120,000 tons to 180,000 tons.
Further the seamless pipe capacity which is around 100,000 tons will be increased to 250,000 tons. The incremental capacity is likely to be completed by July’08.
Though we expect majority of the revenues to be contributed by SAW pipe segment & US operations in the near future, we expect the revenues from Seamless & DI pipes to increase gradually in the coming years.
- 3 - Tuesday, June’ 19, 2007
This document is for private circulation, and must be read in conjunction with the disclaimer on the last page.
JSL is currently implementing a capex program which will not only add capacities but will also improve operational efficiency
The following chart depicts the likely product mix in terms of revenues from the period FY06 to FY09.
12%
14%16%
42%38%
20%20%
22%
34%
8%
11%13%
15%
7%
15%
9%
5%
15%
35%
32%
6%4%
4%3%
0% 20% 40% 60% 80% 100%
FY06
FY07
FY08
FY09
LSAW HSAW Seamless DI US Others
We expect the revenue share from seamless pipe segment to improve from 5% in FY06 to 15% in FY09. Similarly DI pipes contribution to revenues would increase from 12% in FY06 to 15% in FY09.
Capital Expenditure to add capacity & improve operational efficiency
For productivity & operating efficiency enhancement, JSL is implementing is implementing following schemes/projects at its various locations. Some of the major schemes/projects include:
Capex Programme Rs in cr.
Waste heat recovery based captive Power plant of 15MW 70.00
Slag granulation plant for DI pipes operations 10.00
Sinter Plant at Mundra for DI pipes operations 35.00
De-bottlenecking of the DI pipe facility 80.00
Installation of PQF mill in Seamless plant 300.00
De-bottlenecking of the SAW pipes facility 75.00
Enhancing capacity of HSAW pipes 75.00
Housing colony for staff at Mundra 40.00
Total Capex…… 685.00 Benefits of Capital outlay:
• With the setting up of a sinter plant and a captive power plant, margins from DI pipes are expected to improve by lower power cost coupled with the iron ore fine that will be sinterized & utilized as usable iron ore along with scrap to form hot iron which in turn would be used in DI pipe operations. This would result in savings to the tune of Rs 40 crore annually.
- 4 - Tuesday, June’ 19, 2007
This document is for private circulation, and must be read in conjunction with the disclaimer on the last page.
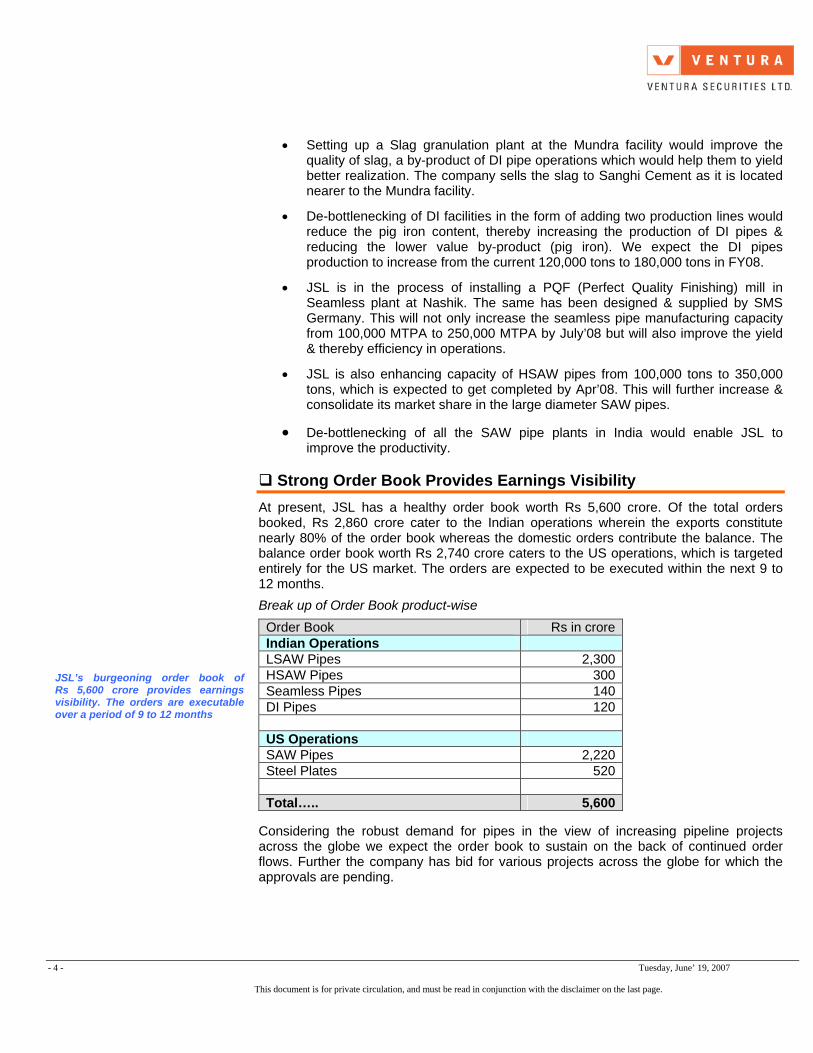
JSL’s burgeoning order book of Rs 5,600 crore provides earnings visibility. The orders are executable over a period of 9 to 12 months
• Setting up a Slag granulation plant at the Mundra facility would improve the
quality of slag, a by-product of DI pipe operations which would help them to yield better realization. The company sells the slag to Sanghi Cement as it is located nearer to the Mundra facility.
• De-bottlenecking of DI facilities in the form of adding two production lines would reduce the pig iron content, thereby increasing the production of DI pipes & reducing the lower value by-product (pig iron). We expect the DI pipes production to increase from the current 120,000 tons to 180,000 tons in FY08.
• JSL is in the process of installing a PQF (Perfect Quality Finishing) mill in Seamless plant at Nashik. The same has been designed & supplied by SMS Germany. This will not only increase the seamless pipe manufacturing capacity from 100,000 MTPA to 250,000 MTPA by July’08 but will also improve the yield & thereby efficiency in operations.
• JSL is also enhancing capacity of HSAW pipes from 100,000 tons to 350,000 tons, which is expected to get completed by Apr’08. This will further increase & consolidate its market share in the large diameter SAW pipes.
• De-bottlenecking of all the SAW pipe plants in India would enable JSL to improve the productivity.
Strong Order Book Provides Earnings Visibility
At present, JSL has a healthy order book worth Rs 5,600 crore. Of the total orders booked, Rs 2,860 crore cater to the Indian operations wherein the exports constitute nearly 80% of the order book whereas the domestic orders contribute the balance. The balance order book worth Rs 2,740 crore caters to the US operations, which is targeted entirely for the US market. The orders are expected to be executed within the next 9 to 12 months.
Break up of Order Book product-wise
Order Book Rs in crore Indian Operations LSAW Pipes 2,300 HSAW Pipes 300 Seamless Pipes 140 DI Pipes 120 US Operations SAW Pipes 2,220 Steel Plates 520 Total….. 5,600
Considering the robust demand for pipes in the view of increasing pipeline projects across the globe we expect the order book to sustain on the back of continued order flows. Further the company has bid for various projects across the globe for which the approvals are pending.
- 5 - Tuesday, June’ 19, 2007
This document is for private circulation, and must be read in conjunction with the disclaimer on the last page.
JSL with accreditations from the global oil majors is likely to emerge as a successful bidder for a number of global projects.
Accreditations: One of the Key Entry Barriers in the Industry
The approval from Oil & Gas global majors is a key entry barrier in the industry in which JSL operates. This prequalification process could take nearly 2 to 4 years to establish itself as one of the approved vendors of pipelines.
JSL has an edge over its competitors as the company already has been approved by many Oil & Gas majors across the globe including Shell Global Solutions, Saudi Aramco, AGIP, Pemex & Bechtel to name a few. With the company being bestowed with various accreditations & certifications (including American Petroleum Institute certifications), it is technically qualified to handle majority of the projects which would come on stream over the next five years.
Subsidiaries & Affiliates
Jindal Saw has two wholly owned subsidiaries – HexaSecurities & Finance Company being a NBFC and has investments in various entities including within the Jindal Group and Jindal Enterprises, LLC, USA, a company engaged in the business of stainless steel processing which also holds a 49% stake in US Denro Steels, Inc (doing business as Jindal United Steel Corporation, or JUSCO) manufacturing steel plates in Baytown, Texas having a total capacity of 1.2m tpa. The remaining equity interest in JUSCO is held by various entities within the Jindal group. IUP Jindal Metals and Alloys is a joint venture between Jindal Saw and ImphyUginePrecision (IUP), a division of Arcelor, France with 73% and 27% shareholding respectively. The company manufactures stainless steel and nickel alloy precision foils. JSL also has a 19.47% stake in SAW Pipes, USA (SPU). SPU owns and operates SAW pipe facilities in Baytown, Texas. Toll Conversion Agreements with JUSCO & SPU The Company has entered into toll conversion agreements with JUSCO and SPU pursuant to which it provides all necessary raw materials and JUSCO and SPU manufacture finished goods and charge a manufacturing, or tolling fee. The Company sells these products through its U.S. branch office to its customers in the U.S. and neighbouring markets. It also uses a small part of the steel plates produced through its U.S. affiliates in its SAW pipes manufacturing facilities in India to cater to specialized high grade SAW pipes orders.
- 6 - Tuesday, June’ 19, 2007
This document is for private circulation, and must be read in conjunction with the disclaimer on the last page.
Strong demand for oil & gas continue to remain strong especially in the emerging markets Strong demand for oil & gas to generate demand for pipelines Major domestic players like GAIL, RELIANCE & ONGC have proposed to invest in additional 20,300 km pipeline projects to be carried out over the next five years
Industry Outlook
Fossil fuels (Oil, natural gas & coal) continue to dominate the global energy mix, accounting for more than 85% of the world energy demand. Of this, oil & gas accounted for 60% of the energy used globally in 2005. During 1998-2005, the global demand for oil & gas grew at a CAGR of 1.6% and 2.7% respectively.
The OECD countries which accounted for 63% and 56% of the total global demand for oil & gas respectively in 1998 has witnessed a decline in the share to 60% & 53% respectively by 2005. The reason being the developing Asian markets, whose economies are witnessing strong growth were the main driving force for the incremental increase in demand for oil & gas. This is substantiated from the fact that their share have increased from 16.8% & 7.3% to 20.3% & 11% respectively.
During 2005-10E, the global demand for oil & gas is expected to grow at a CAGR of 1.9% & 3.1% while the incremental demand would continue to emerge from the developing markets.
Globally, the transportation of petroleum products & natural gas is usually preferred by pipeline to other modes of transportation due to operational economies, coupled with benefits of a cleaner distribution chain. Pipelines are generally the most cost-effective way of transporting petroleum products and natural gas. It costs approximately Rs 1.30/Km as compared to rail Rs 2.20/Km & road Rs 3.02/Km.
The Ministry of Petroleum & Natural Gas (MOP&NG), India estimates that in developed countries around 60% of the total petroleum products is transported through pipelines while in India, it is around 32%. The Ministry estimates that the share of pipelines might touch around 45% over the next 2-3 years. Addressable Market for Indian Pipe Manufactures in the Domestic as well as global Market: A US$ 56 bn Opportunity
Middle East & Asia and North America are the biggest importers while India is one of the major exporting nations along with China, Indonesia, Malaysia and Thailand. Thus Indian pipe manufacturers are expected to benefit from the pipeline projects which are to be carried out over the next five years. Besides, Indian companies are also expected to cover a large pie of Indian pipeline projects to cater to the rising domestic demand. We expect the global demand (including India) for pipes over the next five years across at US$ 56 bn.
Domestic Market
India currently has about 15,000 Km of pipelines transporting crude oil, refined products and gas. Domestic investment in pipeline infrastructure is quite low, particularly in gas pipelines due to lack of gas supply. However, due to recent gas finds in the Krishna Godavari Basin by Reliance & GSPC Ltd, there will be increased investments in pipelines. With the increased availability of natural gas in northern & western India, domestic players such as Reliance, GAIL, GSPC, ONGC & Cairn energy have proposed investing in an additional 20,300 Km in pipeline infrastructure over the next five years of which Reliance is expected to account for 4,100 Km (20%). This will entail an investment to the tune of US$ 5 bn (Rs 20,000 crore). Indian players clearly have a cost advantage as compared to imports on account of lower labour costs. Further, the landed cost of imports is significantly higher than the domestic prices due to additional freight costs & import duties.
- 7 - Tuesday, June’ 19, 2007
This document is for private circulation, and must be read in conjunction with the disclaimer on the last page.
Middle East & USA are amongst the key export destinations as far as the Indian pipe manufacturers are concerned Demand for Seamless pipes likely to rise on the back of increased E&P activities across the globe
Overseas Market
The global market for steel pipes is expected to grow at a rapid pace with a number of global projects announced over the period of next 5 years. The share of demand from Middle East and Asia from the total length of pipeline projects envisaged globally is at 35% followed by North America at 30%, which is a major demand driver for the Indian pipe manufacturers. The global market (excluding India) for steel pipes over the next five years is estimated at US$ 51 bn (Rs 204,000 crore). Thus the addressable market for the Indian pipe manufacturers stands at US$ 56 bn. (US$ 5 bn + US$ 51 bn) as provided in Exhibit 1.
Exhibit 1: Global Demand Projects over the next five years
Geographical Zone No. of Projects
Total Length
(km) Equivalent Mn Tons
Equivalent US$ Mn
Global Share (%)
*Middle East & Asia 119 79,074 19.8 19,769 35 India 15 20,300 5.1 5,075 9 North America 210 65,988 16.5 16,497 30 Latin America 41 31,654 7.9 7,914 14 Europe 55 22,565 5.6 5,641 10 Australasia 18 13,673 3.4 3,418 6 Africa 21 12,036 3.0 3,009 5 Total 464 221,990 56.2 56,248 100 Source: Simdex (September 2006 Update), Assumption 1 Km = 250 tons. * Including India
As shown above Middle East market is amongst the key export destination where the robust demand is likely to sustain over the next 5 years on account of very few pipe manufacturers within the region. India is always likely to have cost competitiveness advantage as compared to foreign manufacturers while exporting pipes to Middle east on account of India’s geographical proximity to the region (close proximity to Mundra & Kandla ports) and due to lower cost of conversion from plates/coils to pipes on account of lower labour costs.
Product wise demand scenario: Seamless & DI Pipes
Seamless Pipes & Tubes Seamless pipes & tubes are used both in oil & non-oil sector. Nearly 65% of the demand for these pipes comes from the oil & gas sector (E&P activities in particular) alone while the balance comes from the chemical, general engineering & automobile industries. Seamless pipe market is far more consolidated than welded pipe market (top 5 catering to almost 60% of the demand world-wide). This has led to greater pricing power for the seamless pipe manufacturers. USA is by far the largest consumer of the Seamless pipes.
During 2005-10E, the global demand for oil & gas is expected to grow at a CAGR of 1.9% & 3.1%. Following the rising crude prices & the increasing demand for oil & gas, the drilling activity is likely to grow at a much faster pace. The demand for seamless pipes & tubes is expected to grow at a CAGR of 20%+ over the next couple of years due to increased E&P activities across the globe. With the company expanding its seamless pipe capacity over the next twelve months to 250,000 tons, JSL is well positioned to meet the growing requirement of the market.
- 8 - Tuesday, June’ 19, 2007
This document is for private circulation, and must be read in conjunction with the disclaimer on the last page.
Higher budgetary allocation towards water & sewage
Development projects by World
Bank and ADB
Demand Drivers
Proposal to increase water
tariff and funding through SPVs
Demand for DI pipes is expected to grow at a CAGR of 15% for the next couple of years
Ductile Iron (DI) Pipes
DI Pipes are used for transportation of water & sewage. Fast growing population & rising population in country has resulted an increase in demand for safe water. This in turn has increased the demand for transporting good quality water from potential sources to distant cities without contaminating it.
Demand drivers for DI pipes
Given the increasing demand & low penetration of water distribution and sewage infrastructure in the country, the growth prospect for this segment is favorable. India has 16% of the world’s population but is estimated to have just 4-5% of the world’s water resources. This is because slow implementation of water supply projects in India due to issues on funding of such projects. However with the multilateral finance institutions like ADB and World Bank, recognizing the need for pipeline network transmission of water in recent times, coupled with increasing focus of the Central Government, State Government & local bodies the path has been cleared for the development of the infrastructure. The demand for DI Pipes is expected to grow at a CAGR of 15% for next couple of years. With only few players present in this segment, the company is all set to reap these benefits in the coming years.
- 9 -
This document is for private circulation
The company’s key products namely LSAW & HSAW to witness robust demand globally over the next three years.
Global Demand and Supply Position: LSAW and HSAW Pipes
LSAW HSAW
For FY07, the total production of LSAW & HSAW pipes is estimated to the tune of 11 million & 5 million respectively while the demand for both the pipes together is estimated at around 19.3 million tons which results in a shortfall of 3.3 million tons. With the incremental capacities building up across the globe not likely to keep in pace with the anticipated higher demand for FY08 & FY09, we expect the demand – supply mismatch to continue at least for the next three years. JSL, being one of the leading manufacturers of SAW pipes in India & also having its manufacturing facilities in USA, is all set to cater to the increasing demand in US & Middle East markets on account of its close proximity to the ports besides the domestic demand.
Porter Analysis
Suppliers
Shortage in supply of high-grade price sensitive steel
plates. To mitigate this, players are now increasingly
going for backward integration
Expected robust demand tocontinue over the next 5 yea
Insistence record of global majors & rigorous quality approvals restricts new entrants
Tuesday, June’ 19, 2007
, and must be read in conjunction with the disclaimer on the last page.
Industry Competitors
Buyers
Substitutes
Entrants (Barrier)
Alternative means (rail, road) are costlier than pipelines by 100% &
130% respectively, hence negligible threat of substitutes
A consolidated Global SAW pipe industry leaves limited bargaining power with the
customers
rs
- 10 - Tuesday, June’ 19, 2007
This document is for private circulation, and must be read in conjunction with the disclaimer on the last page.
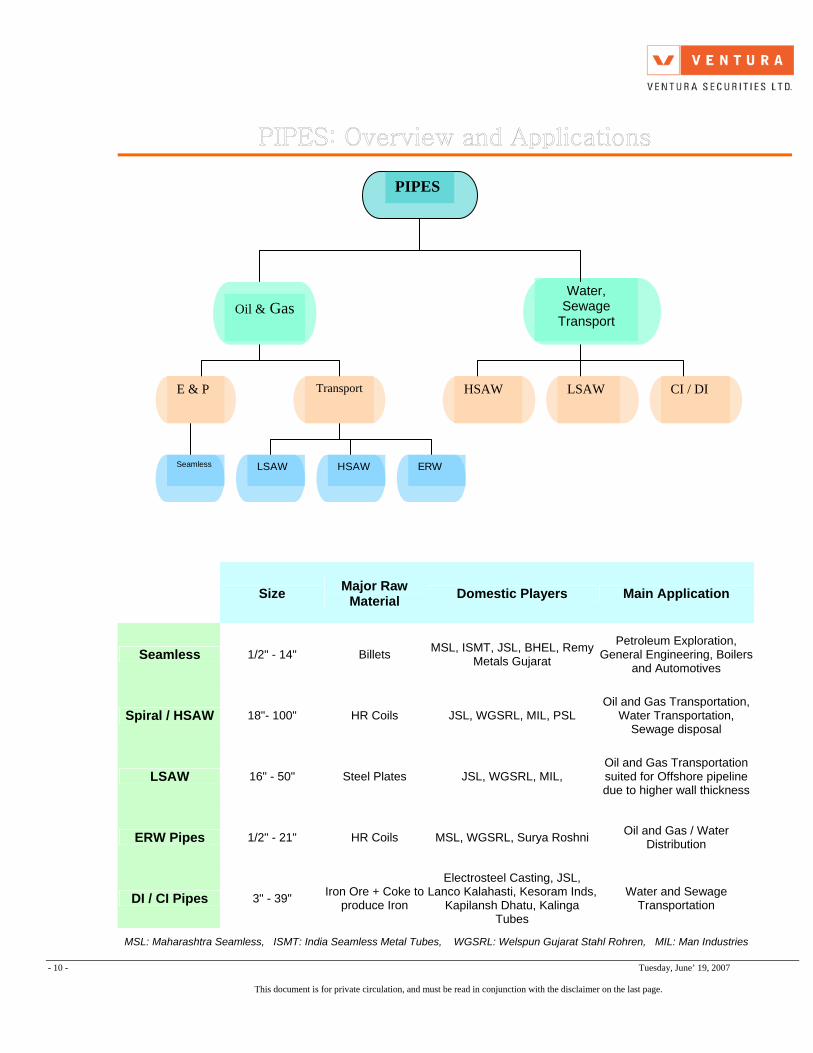
PIPES Water,
Sewage Transport
Oil & Gas
E & P HSAW LSAW CI / DI Transport Seamless LSAW HSAW ERW
Size Major Raw Material Domestic Players Main Application
MSL: Maharashtra Seamless, ISMT: India Seamless Metal Tubes, WGSRL: Welspun Gujarat Stahl Rohren, MIL: Man Industries
- 11 - Tuesday, June’ 19, 2007
Going forward, we expect revenues and profits to grow at a CAGR of 20% and 36%, respectively, from FY06 to FY09.
Impressive Financial Performance
The company’s net sales for Q2FY07 jumped by 33% to Rs 1,269 crore from Rs 953 crore in Q2FY06. Its PAT for the quarter went up by 49% to Rs 70 crore from Rs 47 crore. For H1FY07, net sales grew to Rs 2462 crore, up 39%. The company showed an impressive growth of 50% in PAT, to Rs 130 crore from Rs 50 crore in H1FY06. The EPS jumped significantly, to Rs 27.0 for H1FY07 from Rs 18.1 in H1FY06.
For H1FY07, the company reported an operating profit of Rs 283 crore, up 42%. Margins were up 30 bps from 11.2% in H1FY06 to 11.5% in H1FY07, on the back of volume growth & better realization.
Financial Outlook
We expect the company’s net revenues to touch Rs 6,624 crore in FY09, which represents a CAGR of 20% and the net profit to touch Rs 432 crore at a CAGR of 36%+ through FY06 to FY09.
0.0
1000.0
2000.0
3000.0
4000.0
5000.0
6000.0
7000.0
FY05 FY06 FY07 FY08 FY09
Net R
even
ues
(Rs
in c
r)
0.0
2.0
4.0
6.0
8.0
10.0
12.0
14.0
16.0
OP
M (%
)
We also expect the operating margins to improve by 280 bps from 10.6% in FY06 to 13.4% in FY09 on account of various cost efficiency measures carried out by the company & greater emphasis on higher margin seamless & DI pipes.
Equity Dilution
During FY06, JSL had issued JPY 9,090 million FCCB’s with a conversion price of Rs 675/- convertible into equity shares of Rs 10 each with a tenure of 5 years. Since the conversion price is substantially higher than the CMP, we expect the same to be converted only in FY08. Further the company has also issued 2.41 million warrants each convertible into one equity share of Rs 10 each at a price of Rs 483/- within a period of 18 months from the date of allotment. Post the conversion of warrants & FCCBs, the equity capital would increase from Rs 48.36 crore in FY06 to Rs 56.09 crore in FY08.
The above issuance of equity would dilute the promoter’s stake from the current 42.6% to 41% in FY08.
This document is for private circulation, and must be read in conjunction with the disclaimer on the last page.
- 12 - Tuesday, June’ 19, 2007
This document is for private circulation, and must be read in conjunction with the disclaimer on the last page.
JSL is available at reasonable valuations as compared to its peers. Further with margins & return ratios expected to improve in the coming years, the stock is well placed to outperform its peers in the industry
Key Concerns
• Increases in steel prices, which would increase the Company’s cost of
manufacturing its products, would adversely affect its operating margins and results of operations
• JSL’s return ratios are currently depressed on account of heavy investments made for increasing the capacities of its products & for improving the operational efficiencies. We expect ratios to improve from FY08 once the additional capacities are commissioned & the expected cost reduction comes into effect.
• Since majority of the revenues come from exports, wide fluctuations in foreign exchange will impact the financials of the company. However the company mitigates the risk by conservatively entering into forward contracts in case of its import & export transactions.
In peer comparison, we have ignored Maharashtra Seamless Limited & Electrosteel Casting Limited in the list of peers as majority of their revenues come from the seamless pipe & Ductile Iron Pipes segment respectively while only 20% of the JSL revenues come from these two segments. Though we have included four companies in our review, it would be more appropriate to compare Jindal Saw with Welspun Gujarat Stahl Rohren Ltd (WGSRL) considering their business, the products they manufacture & the size of the companies.
- 13 - Tuesday, June’ 19, 2007
This document is for private circulation, and must be read in conjunction with the disclaimer on the last page.
Though WGSRL has currently an upper edge between the two considering that it enjoys better margins which would further be increased further post the commissioning of its Steel plates plant at Anjar in Dec’07, JSL has a better diversified business model catering to almost all the pipeline products and with its increasing focus on the higher margin seamless & DI pipes, margins also have a sufficient scope for improvement.
Further the return ratios of JSL are far better than WGSRL, which is likely to improve further in the coming years. As per valuations, JSL is the most attractively valued stock amongst the peers trading at a significant discount to WGSRL & almost at par with the comparatively smaller players in the industry.
Valuation & Recommendation The burgeoning oil and gas demand should benefit pipe industry as more and more new pipe lines projects are being announced. JSL today is accredited by almost all oil and gas majors and thus is automatically qualified to bid for most of the projects. These approvals, along with its diversified business model, shall enable the Company to reap the robust demand prevalent over the next 5 years.
At the CMP of Rs 606, the stock is trading at 10.4x the FY08e earnings of Rs 58 & and 8.0x its FY09e its FY09e earnings of Rs 75.5. With the company expected to increase its margins in the coming years coupled with the strong order book & the robust demand likely to prevail over the next five years, we recommend the investors to BUY the stock at the CMP with a price target of Rs 850, an upside of 40% from the current levels for 15 to 18 months horizon.
Y/E September, Fig in Rs. Cr FY2006 FY2007e FY2008e Per Share Data (Rs) EPS 32.4 53.4 58.0 Cash EPS 45.3 66.6 71.1 DPS 5.0 6.0 7.0 Book Value 199.0 245.5 282.2 Capital, Liquidity, Returns Ratio Debt / Equity (x) 1.7 1.5 1.1 Current Ratio (x) 2.3 2.0 1.8 ROE (%) 18.8 24.8 24.1 ROCE (%) 16.1 18.8 20.4 Dividend Yield (%) 0.8 1.0 1.2 Valuation Ratio (x) P/E 18.7 11.3 10.4 P/BV 3.0 2.5 2.1 EV/Sales 1.1 0.9 0.8 EV/EBIDTA 10.3 7.5 6.8 Efficiency Ratio (x) Inventory (days) 131 152 169 Debtors (days) 52 62 69 Creditors (days) 91 128 157
Balance Sheet Cash Flow Statement
Y/E September, Fig in Rs. Cr FY2006 FY2007e FY2008e Share Capital 48.4 48.4 56.1 Share warrants 11.7 11.7 0.0 Reserves & Surplus 803.1 1028.2 1427.1 Total Loans 1736.8 1854.5 1795.0 Deferred Tax Liability 76.3 85.0 90.0 Total Liabilities 2676.3 3027.8 3368.2 Gross Block 1104.9 1400.0 1800.0 Less: Acc. Depreciation 249.9 304.9 369.9 Net Block 855.0 1095.1 1430.1 Capital Work in Progress 154.6 180.0 0.0 Investments 86.8 83.6 83.6 Net Current Assets 1567.3 1656.6 1844.5 Misc. Expd not w/o 15.8 12.5 10.0 Total Assets 2676.3 3027.8 3368.2
Y/E September, Fig in Rs. Cr FY2006 FY2007e FY2008e Profit After Tax 165.2 266.9 334.0 Depreciation & W/o 53.7 55.0 65.0 Working Capital Changes -150.8 -201.7 -197.7 Others 2.0 0.0 0.2 Operating Cash Flow 70.1 120.2 201.5 Capital Expenditure -278.5 -320.5 -220.0 Change in Investment 3.2 0.0 0.0 Cash Flow from Investing -275.3 -320.5 -220.0 Proceeds from equity issue 55.1 0.0 114.1 Inc/(Dec) in Debt 438.9 117.7 -59.5 Dividend Paid -36.7 -41.8 -53.4 Others -12.6 12.0 7.5 Cash Flow from Financing 444.7 87.8 8.7 Net Change in Cash 239.5 -112.5 -9.8 Opening Cash Balance 152.7 392.2 279.7 Closing Cash Balance 392.2 279.7 269.9
Ventura Securities Limited Corporate Office: 11th Floor, Nariman Bhavan, Vinay K. Shah Marg, Nariman Point, Mumbai – 400 021; +91 6754 7000. This report is neither an offer nor a solicitation to purchase or sell securities. The information and views expressed herein are believed to be reliable, but no responsibility (or liability) is accepted for errors of fact or opinion. Writers and contributors may be trading in or have positions in the securities mentioned in their articles. Neither Ventura Securities Limited nor any of the contributors accepts any liability arising out of the above information/articles. Reproduction in whole or in part without written permission is prohibited. This report is for private circulation.
This document is for private circulation, and must be read in conjunction with the disclaimer on the last page.