Marshall & Ilsley Bank STEVENS POINT AREA ECONOMIC INDICATORS 2009: Third Quarter Presented November 13, 2009 College of Professional Studies Presented by: The Central Wisconsin Economic Research Bureau Randy F. Cray, Ph.D. Professor of Economics, CWERB Director Scott Wallace, Ph.D. Associate Professor of Economics, CWERB Research Associate Sarah J. Bauer Research Assistant James P. Draxler Research Assistant Special Report: State Finances: Rewind? Or Recovery Ahead? Todd A. Berry, Ph.D. President, Wisconsin Taxpayers Alliance
Transcript
1
Marshall & Ilsley Bank
STEVENS POINT AREA ECONOMIC INDICATORS 2009: Third Quarter
Presented November 13, 2009
College of Professional Studies
Presented by: The Central Wisconsin Economic Research Bureau
Randy F. Cray, Ph.D. Professor of Economics, CWERB Director
Scott Wallace, Ph.D. Associate Professor of Economics, CWERB Research Associate
Sarah J. Bauer Research Assistant
James P. Draxler Research Assistant
Special Report: State Finances: Rewind? Or Recovery Ahead?
Todd A. Berry, Ph.D. President, Wisconsin Taxpayers Alliance
TABLE OF CONTENTS
National and Regional Outlook .............................................................................................. 1
Table 1: National Economic Statistics .......................................................................... 1 Central Wisconsin................................................................................................................... 3 Table 2: Unemployment Rate in Central Wisconsin .................................................... 3 Table 3: Employment in Central Wisconsin ................................................................. 3 Table 4: Wisconsin Employment Change By Sector .................................................... 4 Table 5: County Sales Tax Distribution ........................................................................ 4 Table 6: Business Confidence in Central Wisconsin .................................................... 5 Figures 1-6 .................................................................................................................... 6 Stevens Point-Plover Area ...................................................................................................... 7 Table 7: Prominent Industries in Portage County – Average Employment ............... 7 Table 8: Retailer Confidence in Stevens Point – Plover Area .................................... 7 Table 9: Help Wanted Advertising in Portage County ............................................... 8 Table 10: Public Assistance Claims in Portage County ................................................ 8 Table 11: Unemployment Claims in Portage County .................................................. 8 Table 12: Residential Construction in Stevens Point – Plover Area ............................ 9 Table 13: Nonresidential Construction in Stevens Point – Plover Area ...................... 9 Figures 7-10 ................................................................................................................ 10
Special Report ...................................................................................................................... 11
State Finances: Rewind? Or Recovery Ahead?
CWERB - Division of Business and Economics
University of Wisconsin-Stevens Point Stevens Point, WI 54481
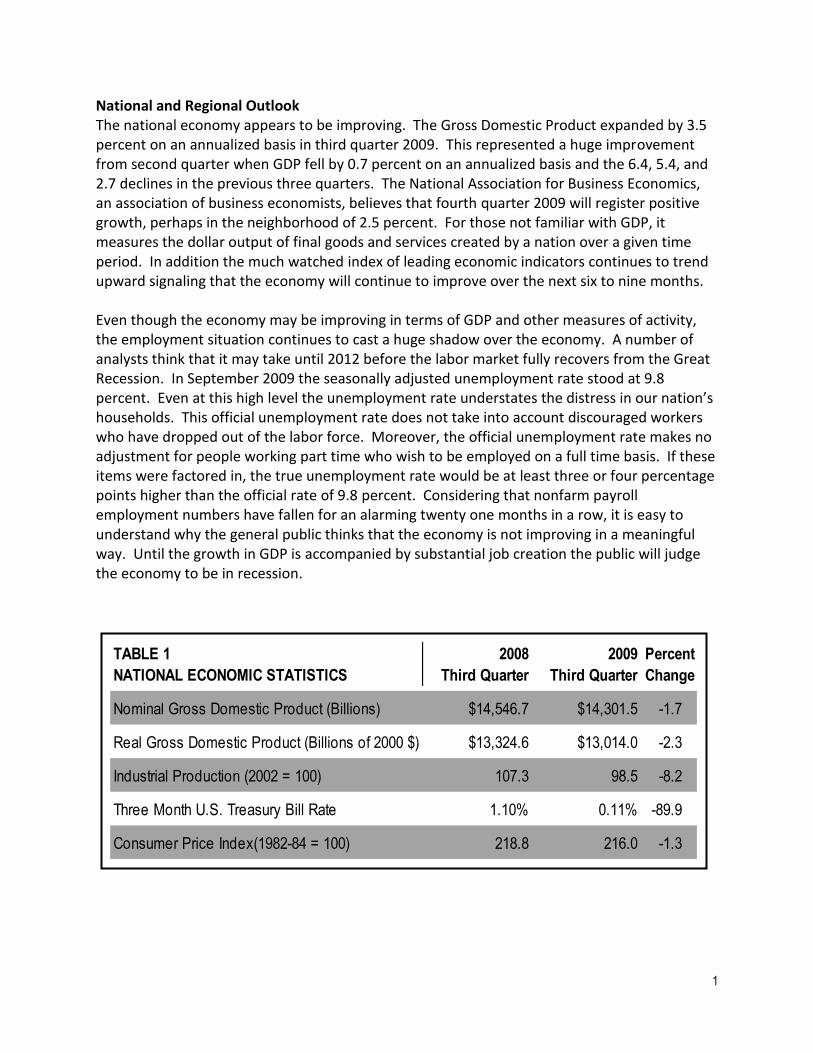
National and Regional Outlook The national economy appears to be improving. The Gross Domestic Product expanded by 3.5 percent on an annualized basis in third quarter 2009. This represented a huge improvement from second quarter when GDP fell by 0.7 percent on an annualized basis and the 6.4, 5.4, and 2.7 declines in the previous three quarters. The National Association for Business Economics, an association of business economists, believes that fourth quarter 2009 will register positive growth, perhaps in the neighborhood of 2.5 percent. For those not familiar with GDP, it measures the dollar output of final goods and services created by a nation over a given time period. In addition the much watched index of leading economic indicators continues to trend upward signaling that the economy will continue to improve over the next six to nine months. Even though the economy may be improving in terms of GDP and other measures of activity, the employment situation continues to cast a huge shadow over the economy. A number of analysts think that it may take until 2012 before the labor market fully recovers from the Great Recession. In September 2009 the seasonally adjusted unemployment rate stood at 9.8 percent. Even at this high level the unemployment rate understates the distress in our nation’s households. This official unemployment rate does not take into account discouraged workers who have dropped out of the labor force. Moreover, the official unemployment rate makes no adjustment for people working part time who wish to be employed on a full time basis. If these items were factored in, the true unemployment rate would be at least three or four percentage points higher than the official rate of 9.8 percent. Considering that nonfarm payroll employment numbers have fallen for an alarming twenty one months in a row, it is easy to understand why the general public thinks that the economy is not improving in a meaningful way. Until the growth in GDP is accompanied by substantial job creation the public will judge the economy to be in recession.
TABLE 1 2008 2009 Percent
NATIONAL ECONOMIC STATISTICS Third Quarter Third Quarter Change
Further, strong employment growth is a necessary condition for strong GDP growth and a rising standard of living. The economy can’t achieve robust growth without job creation. Household consumption accounts for about 70 percent of all expenditures in the economy. It is difficult to understand how GDP can grow at a prolonged and rapid pace without a strong rebound in employment and in household income. Additionally, increases in business investment, government spending, and net export activity can only go so far in making up for the loss in household consumption spending. One needs to understand that the government’s fiscal stimulus package and other temporary programs can only serve as stop gap measures to prop up the economy. At some point, business firms will need to expand their payrolls and hours worked. If this does not happen the recovery will be in a tenuous position. Glimmers of hope come from a variety of data. For example, manufacturing and trade inventories are declining. Inventories levels have been drawn down and at some point in time firms will need to replenish them and in doing so will need to increase the number of hours worked and eventually resort to hiring additional workers. With unemployment levels being so high, real estate prices still well below historic highs, and a stock market that is still a long way from a full recovery, household finances have been battered. This situation has had a substantial impact on state and local finances. Later this morning Todd Berry, president of the Wisconsin Taxpayers Alliance, will discuss the state of Wisconsin’s budgetary outlook and how the state’s finances critically depend on the economic recovery.
3
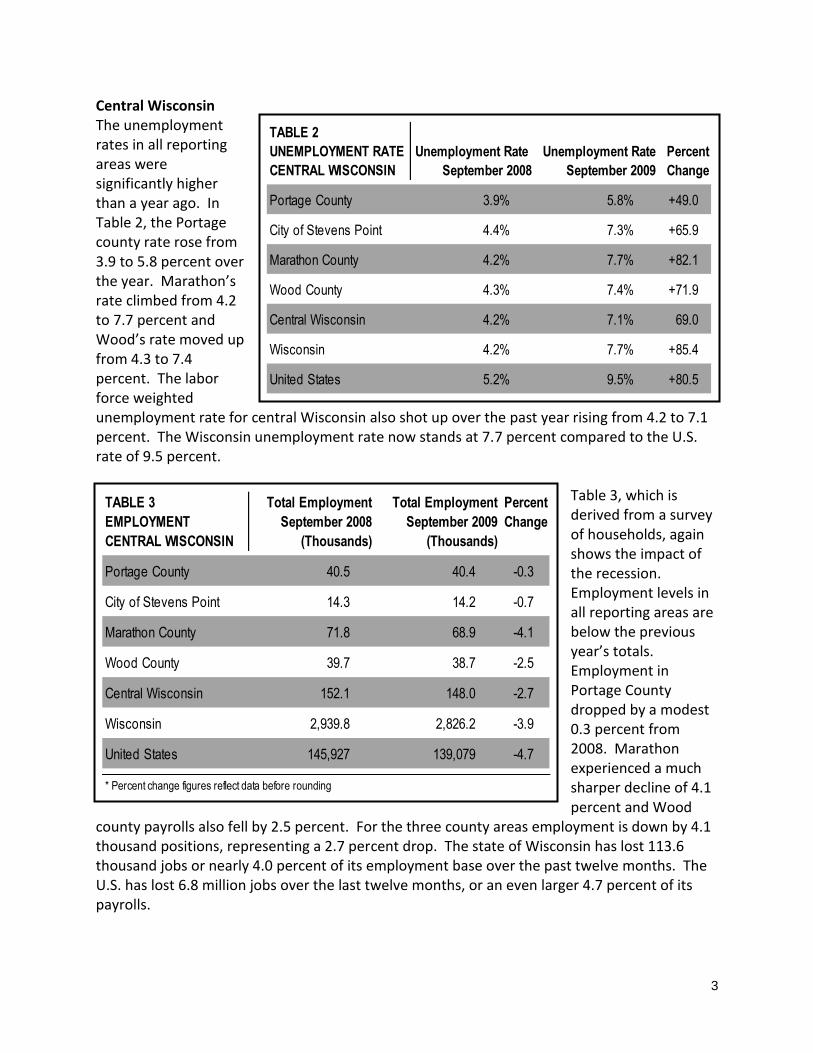
Central Wisconsin The unemployment rates in all reporting areas were significantly higher than a year ago. In Table 2, the Portage county rate rose from 3.9 to 5.8 percent over the year. Marathon’s rate climbed from 4.2 to 7.7 percent and Wood’s rate moved up from 4.3 to 7.4 percent. The labor force weighted unemployment rate for central Wisconsin also shot up over the past year rising from 4.2 to 7.1 percent. The Wisconsin unemployment rate now stands at 7.7 percent compared to the U.S. rate of 9.5 percent.
Table 3, which is derived from a survey of households, again shows the impact of the recession. Employment levels in all reporting areas are below the previous year’s totals. Employment in Portage County dropped by a modest 0.3 percent from 2008. Marathon experienced a much sharper decline of 4.1 percent and Wood
county payrolls also fell by 2.5 percent. For the three county areas employment is down by 4.1 thousand positions, representing a 2.7 percent drop. The state of Wisconsin has lost 113.6 thousand jobs or nearly 4.0 percent of its employment base over the past twelve months. The U.S. has lost 6.8 million jobs over the last twelve months, or an even larger 4.7 percent of its payrolls.
CENTRAL WISCONSIN September 2008 September 2009 Change
Portage County 3.9% 5.8% +49.0
City of Stevens Point 4.4% 7.3% +65.9
Marathon County 4.2% 7.7% +82.1
Wood County 4.3% 7.4% +71.9
Central Wisconsin 4.2% 7.1% 69.0
Wisconsin 4.2% 7.7% +85.4
United States 5.2% 9.5% +80.5
TABLE 3 Total Employment Total Employment Percent
EMPLOYMENT September 2008 September 2009 Change
CENTRAL WISCONSIN (Thousands) (Thousands)
Portage County 40.5 40.4 -0.3
City of Stevens Point 14.3 14.2 -0.7
Marathon County 71.8 68.9 -4.1
Wood County 39.7 38.7 -2.5
Central Wisconsin 152.1 148.0 -2.7
Wisconsin 2,939.8 2,826.2 -3.9
United States 145,927 139,079 -4.7
* Percent change figures reflect data before rounding
4
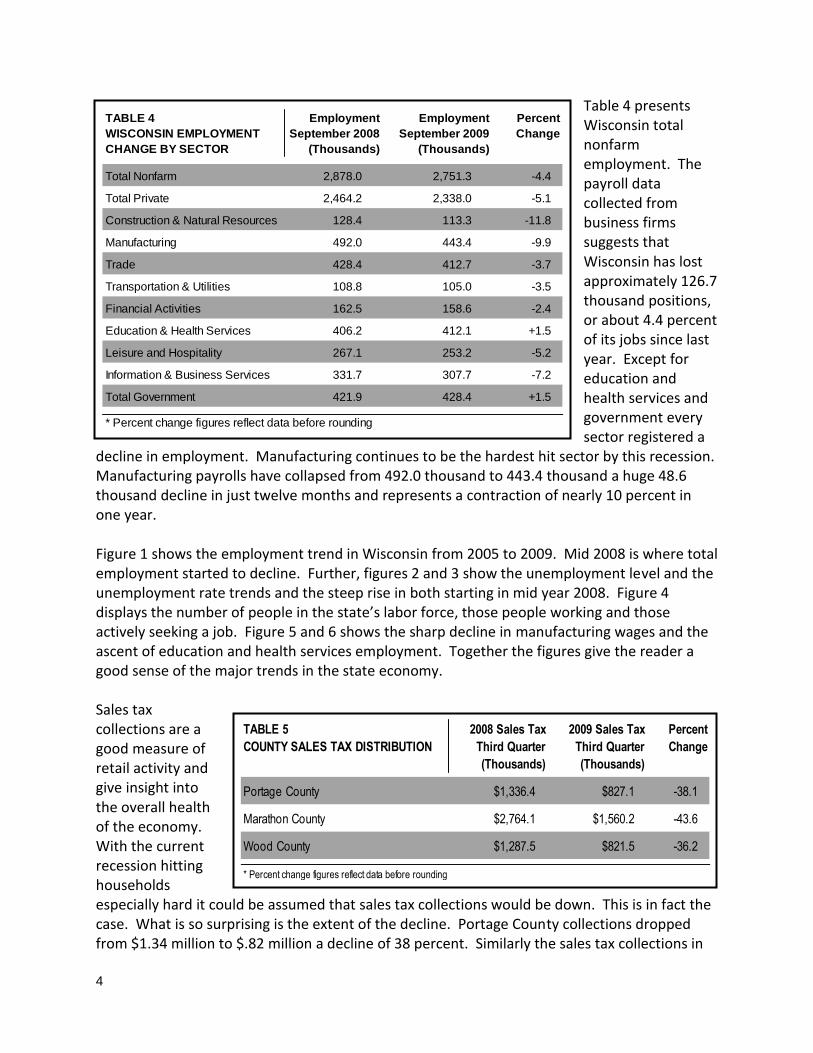
Table 4 presents Wisconsin total nonfarm employment. The payroll data collected from business firms suggests that Wisconsin has lost approximately 126.7 thousand positions, or about 4.4 percent of its jobs since last year. Except for education and health services and government every sector registered a
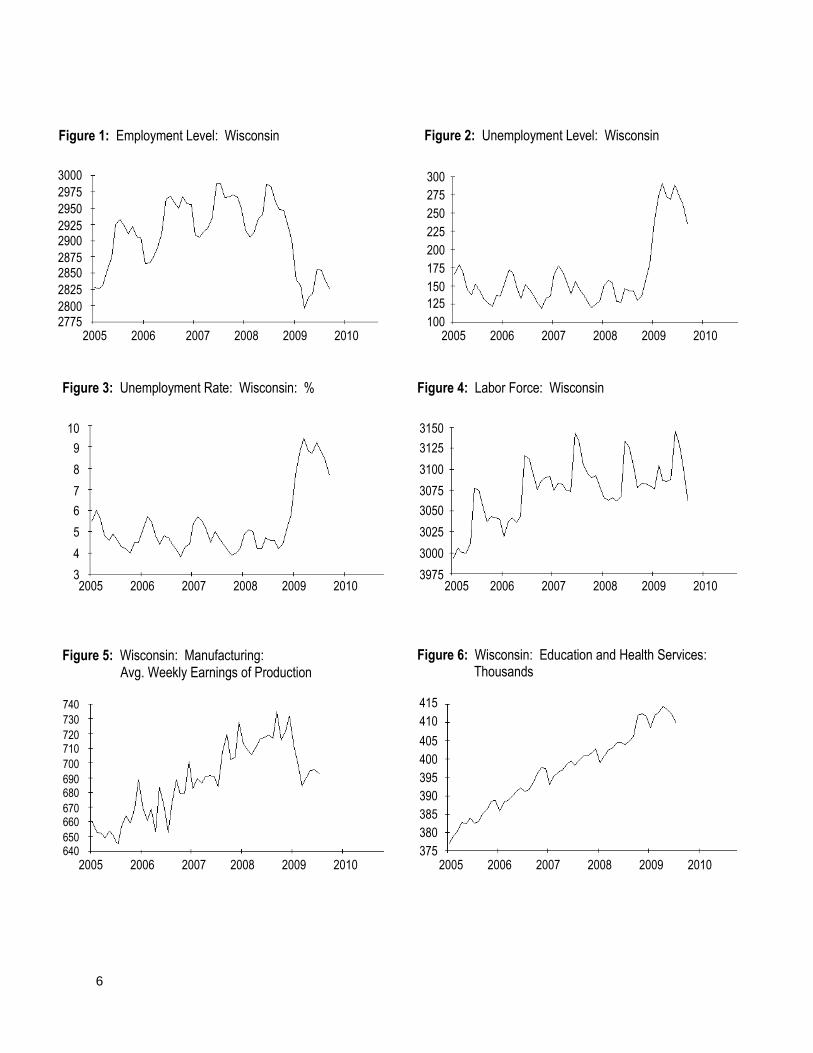
decline in employment. Manufacturing continues to be the hardest hit sector by this recession. Manufacturing payrolls have collapsed from 492.0 thousand to 443.4 thousand a huge 48.6 thousand decline in just twelve months and represents a contraction of nearly 10 percent in one year. Figure 1 shows the employment trend in Wisconsin from 2005 to 2009. Mid 2008 is where total employment started to decline. Further, figures 2 and 3 show the unemployment level and the unemployment rate trends and the steep rise in both starting in mid year 2008. Figure 4 displays the number of people in the state’s labor force, those people working and those actively seeking a job. Figure 5 and 6 shows the sharp decline in manufacturing wages and the ascent of education and health services employment. Together the figures give the reader a good sense of the major trends in the state economy. Sales tax collections are a good measure of retail activity and give insight into the overall health of the economy. With the current recession hitting households especially hard it could be assumed that sales tax collections would be down. This is in fact the case. What is so surprising is the extent of the decline. Portage County collections dropped from $1.34 million to $.82 million a decline of 38 percent. Similarly the sales tax collections in
TABLE 4 Employment Employment Percent
WISCONSIN EMPLOYMENT September 2008 September 2009 Change
CHANGE BY SECTOR (Thousands) (Thousands)
Total Nonfarm 2,878.0 2,751.3 -4.4
Total Private 2,464.2 2,338.0 -5.1
Construction & Natural Resources 128.4 113.3 -11.8
Manufacturing 492.0 443.4 -9.9
Trade 428.4 412.7 -3.7
Transportation & Utilities 108.8 105.0 -3.5
Financial Activities 162.5 158.6 -2.4
Education & Health Services 406.2 412.1 +1.5
Leisure and Hospitality 267.1 253.2 -5.2
Information & Business Services 331.7 307.7 -7.2
Total Government 421.9 428.4 +1.5
* Percent change figures reflect data before rounding
TABLE 5 2008 Sales Tax 2009 Sales Tax Percent
COUNTY SALES TAX DISTRIBUTION Third Quarter Third Quarter Change
(Thousands) (Thousands)
Portage County $1,336.4 $827.1 -38.1
Marathon County $2,764.1 $1,560.2 -43.6
Wood County $1,287.5 $821.5 -36.2
* Percent change figures reflect data before rounding
5
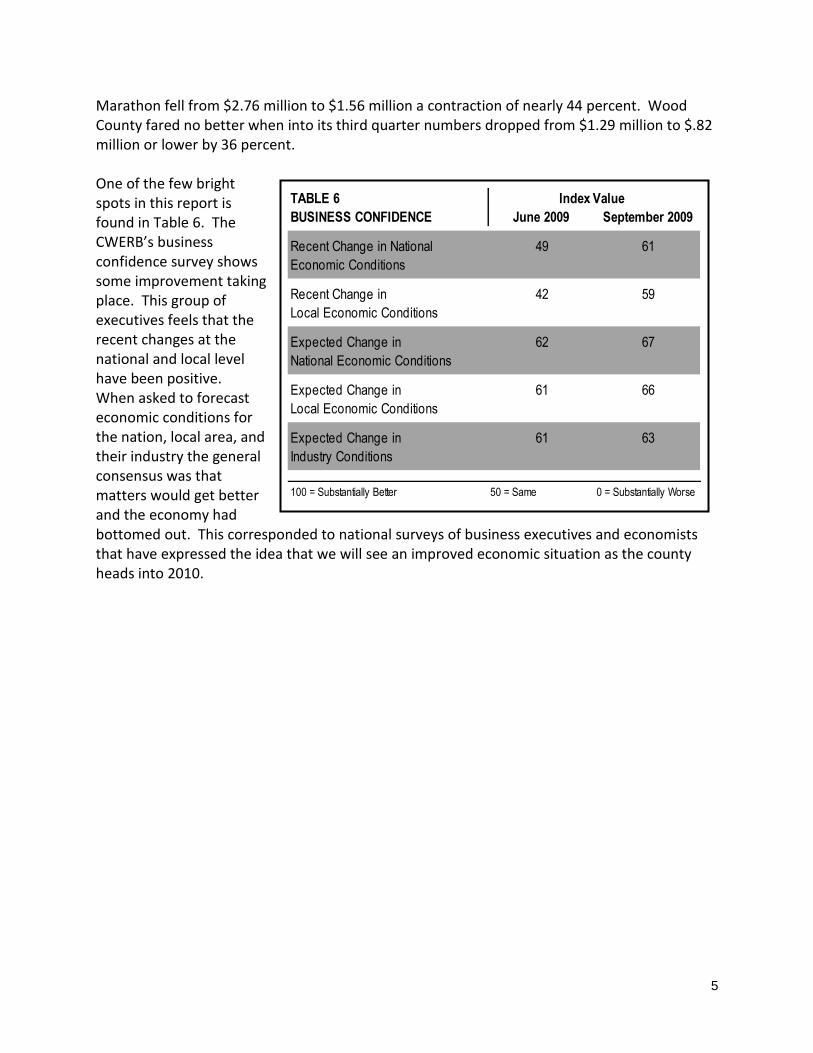
Marathon fell from $2.76 million to $1.56 million a contraction of nearly 44 percent. Wood County fared no better when into its third quarter numbers dropped from $1.29 million to $.82 million or lower by 36 percent. One of the few bright spots in this report is found in Table 6. The CWERB’s business confidence survey shows some improvement taking place. This group of executives feels that the recent changes at the national and local level have been positive. When asked to forecast economic conditions for the nation, local area, and their industry the general consensus was that matters would get better and the economy had bottomed out. This corresponded to national surveys of business executives and economists that have expressed the idea that we will see an improved economic situation as the county heads into 2010.
Figure 5: Wisconsin: Manufacturing: Avg. Weekly Earnings of Production
Figure 6: Wisconsin: Education and Health Services: Thousands
2005 2006 2007 2008 2009 2010
7
Stevens Point-Plover Area Table 7 presents data from the Wisconsin Department of Workforce Development. The employment in Portage County’s prominent industries is given along with the five year percent change. The industry change is also compared to the state of Wisconsin. The largest industry type in Portage County is insurance carriers & related activities with almost 4 thousand workers. Food services and educational services added another 2.6 thousand and 2.6 thousand respectively to the area’s employment.
Local merchants surveyed by the CWERB believe that store traffic and sales are down from the previous year. When they were asked to forecast future retail activity they felt store traffic and sales would not be all that much different three months from now when compared to a year ago. The next three months represents the all important holiday shopping period. Many businesses rely on these sales to stay afloat.
TABLE 7
PROMINENT INDUSTRIES IN PORTAGE COUNTY 2007 Average
AVERAGE EMPLOYMENT Portage County Portage County Wisconsin
Insurance carriers & Related activities 3387 12.9 5.8
Food services & Drinking places 2624 5.5 9.1
Educational services 2621 -3.1 2.0
Executive, Legislative, & General government 1300 4.6 -4.7
Food manufacturing * * -6.7
General merchandise stores 1175 20.3 7.1
Truck transportation 1053 13.3 7.1
Hospitals * * 12.6
Nonstore retailers 1011 -2.3 -12.5
Ambulatory health care services 943 -18.4 8.7
*Data suppressed for confidentiality and not available for calculations
5 - Year Percent Change
TABLE 8
RETAILER CONFIDENCE
STEVENS POINT - PLOVER AREA June 2009 September 2009
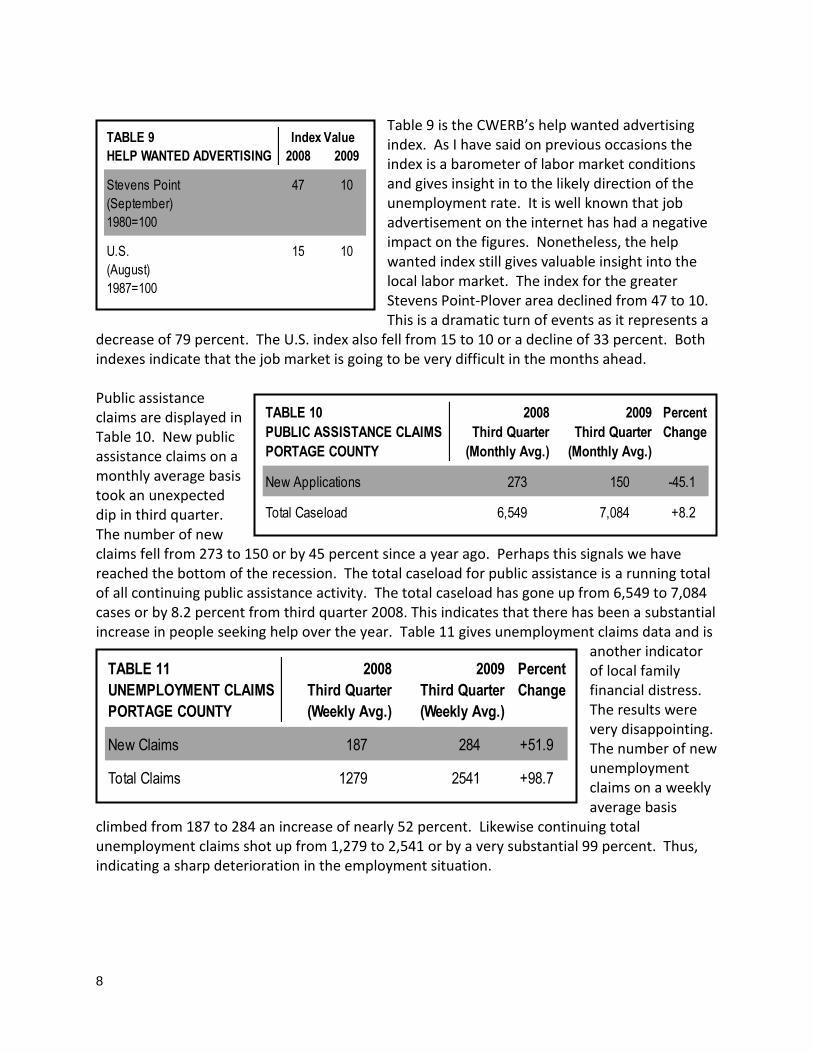
Table 9 is the CWERB’s help wanted advertising index. As I have said on previous occasions the index is a barometer of labor market conditions and gives insight in to the likely direction of the unemployment rate. It is well known that job advertisement on the internet has had a negative impact on the figures. Nonetheless, the help wanted index still gives valuable insight into the local labor market. The index for the greater Stevens Point-Plover area declined from 47 to 10. This is a dramatic turn of events as it represents a
decrease of 79 percent. The U.S. index also fell from 15 to 10 or a decline of 33 percent. Both indexes indicate that the job market is going to be very difficult in the months ahead. Public assistance claims are displayed in Table 10. New public assistance claims on a monthly average basis took an unexpected dip in third quarter. The number of new claims fell from 273 to 150 or by 45 percent since a year ago. Perhaps this signals we have reached the bottom of the recession. The total caseload for public assistance is a running total of all continuing public assistance activity. The total caseload has gone up from 6,549 to 7,084 cases or by 8.2 percent from third quarter 2008. This indicates that there has been a substantial increase in people seeking help over the year. Table 11 gives unemployment claims data and is
another indicator of local family financial distress. The results were very disappointing. The number of new unemployment claims on a weekly average basis
climbed from 187 to 284 an increase of nearly 52 percent. Likewise continuing total unemployment claims shot up from 1,279 to 2,541 or by a very substantial 99 percent. Thus, indicating a sharp deterioration in the employment situation.
TABLE 9
HELP WANTED ADVERTISING 2008 2009
Stevens Point 47 10
(September)
1980=100
U.S. 15 10
(August)
1987=100
Index Value
TABLE 10 2008 2009 Percent
PUBLIC ASSISTANCE CLAIMS Third Quarter Third Quarter Change
PORTAGE COUNTY (Monthly Avg.) (Monthly Avg.)
New Applications 273 150 -45.1
Total Caseload 6,549 7,084 +8.2
TABLE 11 2008 2009 Percent
UNEMPLOYMENT CLAIMS Third Quarter Third Quarter Change
PORTAGE COUNTY (Weekly Avg.) (Weekly Avg.)
New Claims 187 284 +51.9
Total Claims 1279 2541 +98.7
9
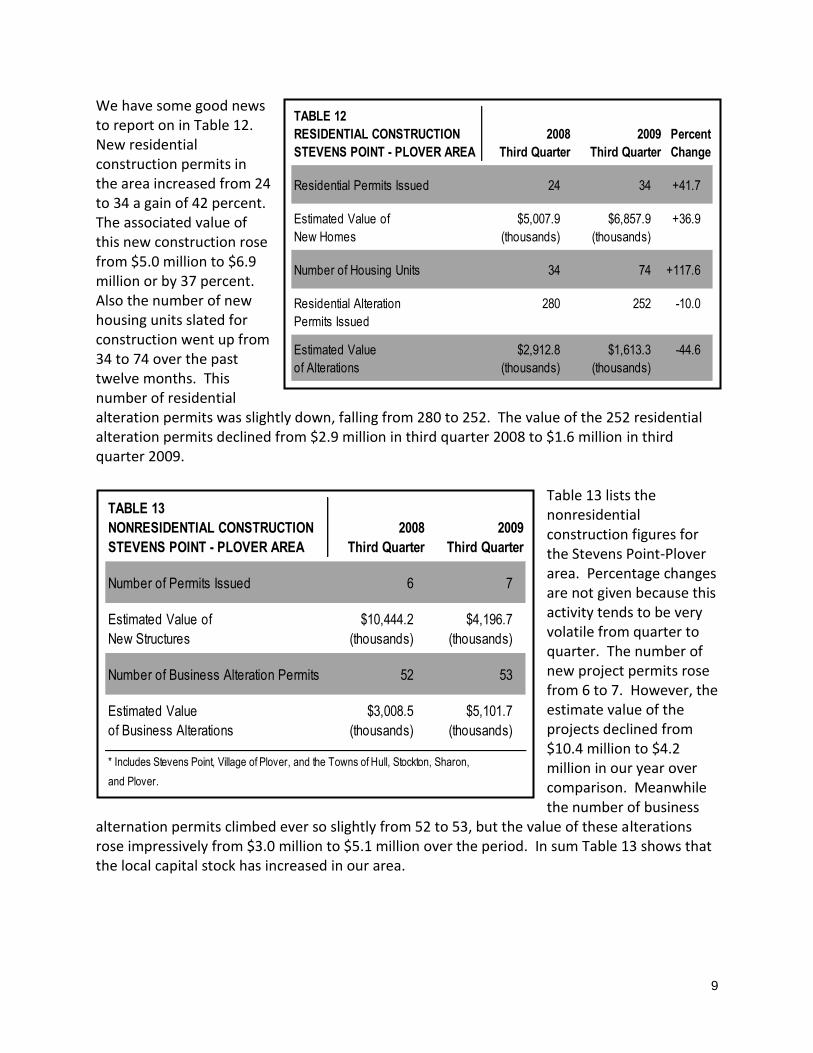
We have some good news to report on in Table 12. New residential construction permits in the area increased from 24 to 34 a gain of 42 percent. The associated value of this new construction rose from $5.0 million to $6.9 million or by 37 percent. Also the number of new housing units slated for construction went up from 34 to 74 over the past twelve months. This number of residential alteration permits was slightly down, falling from 280 to 252. The value of the 252 residential alteration permits declined from $2.9 million in third quarter 2008 to $1.6 million in third quarter 2009.
Table 13 lists the nonresidential construction figures for the Stevens Point-Plover area. Percentage changes are not given because this activity tends to be very volatile from quarter to quarter. The number of new project permits rose from 6 to 7. However, the estimate value of the projects declined from $10.4 million to $4.2 million in our year over comparison. Meanwhile the number of business
alternation permits climbed ever so slightly from 52 to 53, but the value of these alterations rose impressively from $3.0 million to $5.1 million over the period. In sum Table 13 shows that the local capital stock has increased in our area.
TABLE 12
RESIDENTIAL CONSTRUCTION 2008 2009 Percent
STEVENS POINT - PLOVER AREA Third Quarter Third Quarter Change
Residential Permits Issued 24 34 +41.7
Estimated Value of $5,007.9 $6,857.9 +36.9
New Homes (thousands) (thousands)
Number of Housing Units 34 74 +117.6
Residential Alteration 280 252 -10.0
Permits Issued
Estimated Value $2,912.8 $1,613.3 -44.6
of Alterations (thousands) (thousands)
TABLE 13
NONRESIDENTIAL CONSTRUCTION 2008 2009
STEVENS POINT - PLOVER AREA Third Quarter Third Quarter
Number of Permits Issued 6 7
Estimated Value of $10,444.2 $4,196.7
New Structures (thousands) (thousands)
Number of Business Alteration Permits 52 53
Estimated Value $3,008.5 $5,101.7
of Business Alterations (thousands) (thousands)
* Includes Stevens Point, Village of Plover, and the Towns of Hull, Stockton, Sharon,
and Plover.
10
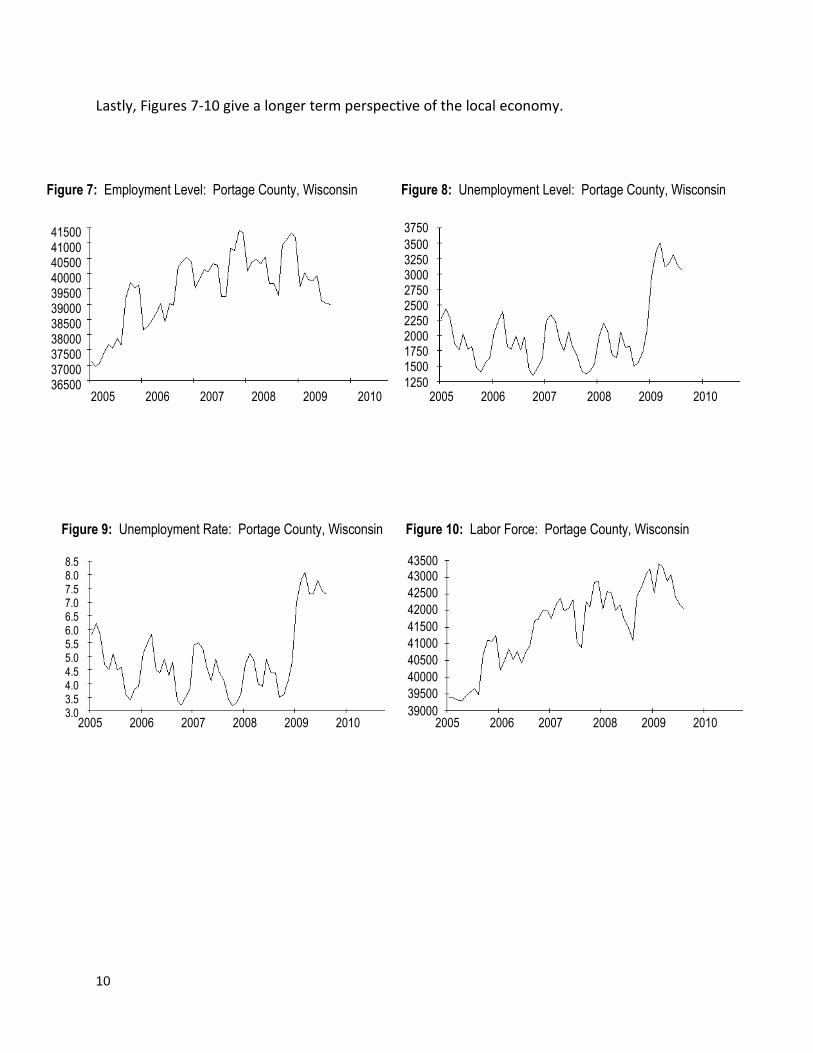
Lastly, Figures 7-10 give a longer term perspective of the local economy.
Figure 7: Employment Level: Portage County, Wisconsin Figure 8: Unemployment Level: Portage County, Wisconsin
Figure 9: Unemployment Rate: Portage County, Wisconsin Figure 10: Labor Force: Portage County, Wisconsin
11
State Finances: Rewind? Or Recovery Ahead? Todd A. Berry, Ph.D. President, Wisconsin Taxpayers Alliance With the U.S. economy showing signs of establishing a base from which to recover, the obvious question for Wisconsin is: What lies ahead for the state economy? Perhaps an even more unsettling question for public officials and taxpayers is: What lies ahead for state finances? Are state deficits behind us?
If recent years have taught us anything, it is the considerable difficulty economists face in forecasting future economic activity. America’s late-2007 move into recession, the severity of that plunge, and the subsequent calamity in the financial markets were all developments not well anticipated.
That uncertainty has brought with it Wisconsin’s share of state and local budget woes. General fund tax collections during 2007-09 were initially anticipated to rise almost 6.0% when the state budget was enacted in October 2007. Hindsight now tells us they dropped by about that amount.
Now that the U.S. economy appears poised for recovery, can Wisconsin economists assume that an equally healthy state rebound is forthcoming? And, more significant, can state and local officials now expect that their budget problems are behind them?
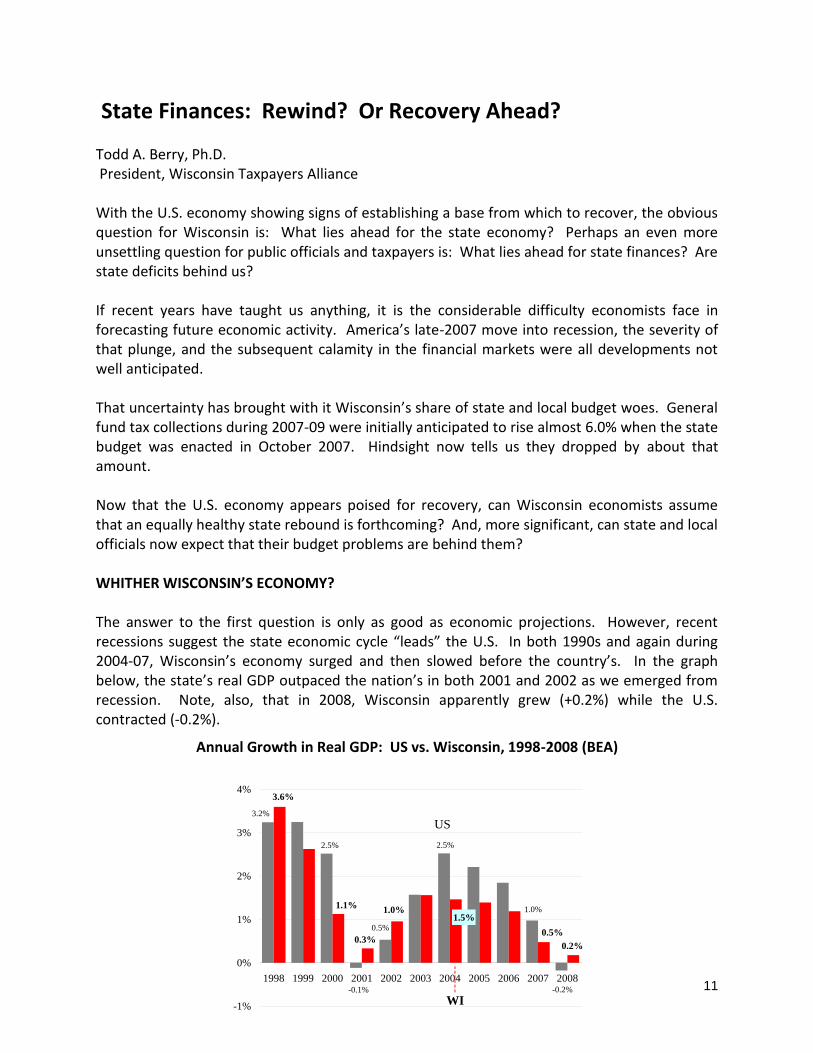
WHITHER WISCONSIN’S ECONOMY? The answer to the first question is only as good as economic projections. However, recent recessions suggest the state economic cycle “leads” the U.S. In both 1990s and again during 2004-07, Wisconsin’s economy surged and then slowed before the country’s. In the graph below, the state’s real GDP outpaced the nation’s in both 2001 and 2002 as we emerged from recession. Note, also, that in 2008, Wisconsin apparently grew (+0.2%) while the U.S. contracted (-0.2%).
Annual Growth in Real GDP: US vs. Wisconsin, 1998-2008 (BEA)
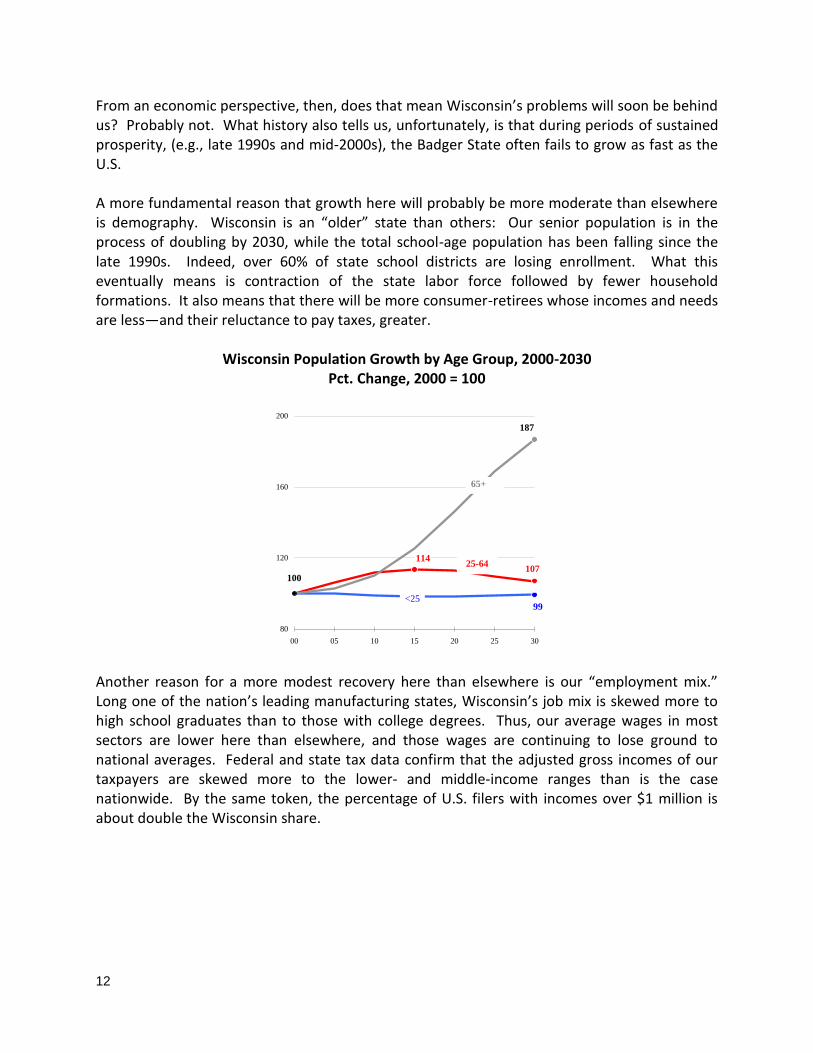
From an economic perspective, then, does that mean Wisconsin’s problems will soon be behind us? Probably not. What history also tells us, unfortunately, is that during periods of sustained prosperity, (e.g., late 1990s and mid-2000s), the Badger State often fails to grow as fast as the U.S. A more fundamental reason that growth here will probably be more moderate than elsewhere is demography. Wisconsin is an “older” state than others: Our senior population is in the process of doubling by 2030, while the total school-age population has been falling since the late 1990s. Indeed, over 60% of state school districts are losing enrollment. What this eventually means is contraction of the state labor force followed by fewer household formations. It also means that there will be more consumer-retirees whose incomes and needs are less—and their reluctance to pay taxes, greater.
Wisconsin Population Growth by Age Group, 2000-2030 Pct. Change, 2000 = 100
99
107114
187
100
80
120
160
200
00 05 10 15 20 25 30
65+
<25
25-64
Another reason for a more modest recovery here than elsewhere is our “employment mix.” Long one of the nation’s leading manufacturing states, Wisconsin’s job mix is skewed more to high school graduates than to those with college degrees. Thus, our average wages in most sectors are lower here than elsewhere, and those wages are continuing to lose ground to national averages. Federal and state tax data confirm that the adjusted gross incomes of our taxpayers are skewed more to the lower- and middle-income ranges than is the case nationwide. By the same token, the percentage of U.S. filers with incomes over $1 million is about double the Wisconsin share.
13
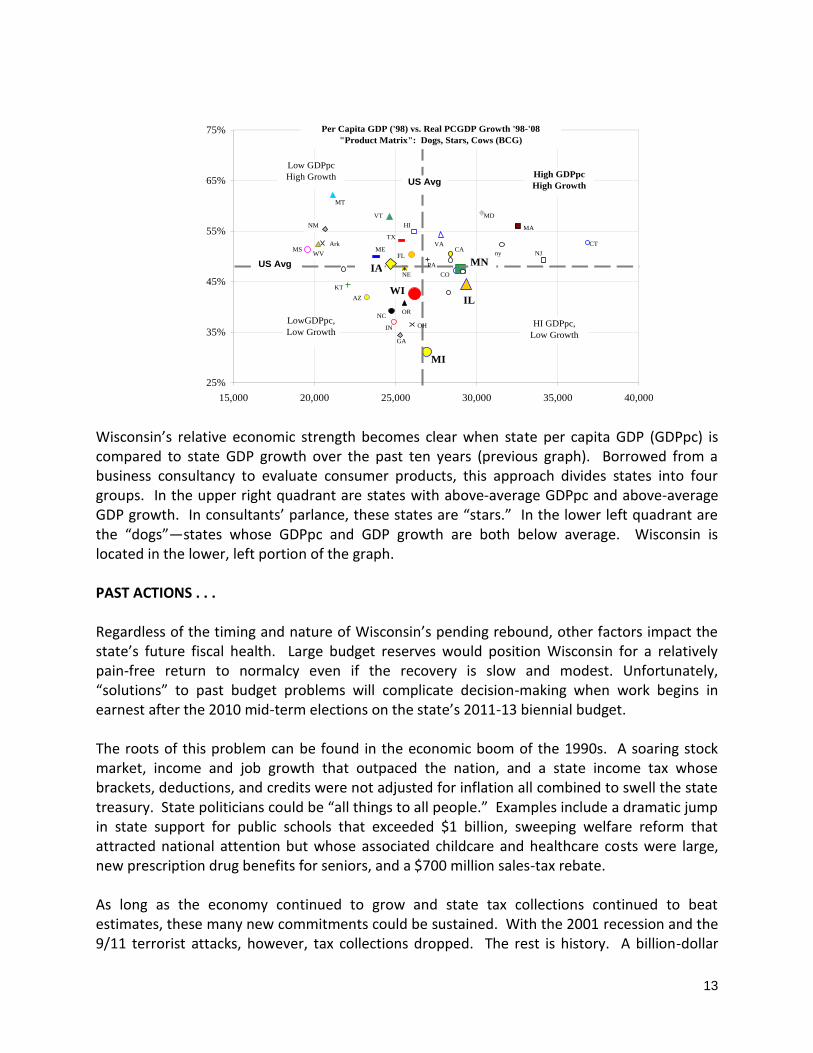
Wisconsin’s relative economic strength becomes clear when state per capita GDP (GDPpc) is compared to state GDP growth over the past ten years (previous graph). Borrowed from a business consultancy to evaluate consumer products, this approach divides states into four groups. In the upper right quadrant are states with above-average GDPpc and above-average GDP growth. In consultants’ parlance, these states are “stars.” In the lower left quadrant are the “dogs”—states whose GDPpc and GDP growth are both below average. Wisconsin is located in the lower, left portion of the graph. PAST ACTIONS . . . Regardless of the timing and nature of Wisconsin’s pending rebound, other factors impact the state’s future fiscal health. Large budget reserves would position Wisconsin for a relatively pain-free return to normalcy even if the recovery is slow and modest. Unfortunately, “solutions” to past budget problems will complicate decision-making when work begins in earnest after the 2010 mid-term elections on the state’s 2011-13 biennial budget.
The roots of this problem can be found in the economic boom of the 1990s. A soaring stock market, income and job growth that outpaced the nation, and a state income tax whose brackets, deductions, and credits were not adjusted for inflation all combined to swell the state treasury. State politicians could be “all things to all people.” Examples include a dramatic jump in state support for public schools that exceeded $1 billion, sweeping welfare reform that attracted national attention but whose associated childcare and healthcare costs were large, new prescription drug benefits for seniors, and a $700 million sales-tax rebate.
As long as the economy continued to grow and state tax collections continued to beat estimates, these many new commitments could be sustained. With the 2001 recession and the 9/11 terrorist attacks, however, tax collections dropped. The rest is history. A billion-dollar
25%
35%
45%
55%
65%
75%
15,000 20,000 25,000 30,000 35,000 40,000
LowGDPpc,
Low Growth
Low GDPpc
High Growth
HI GDPpc,
Low Growth
WI
MN
IL
IA
MA
MT
VT
NC
Ark
KT
MI
CT
MD
NM
TX
MS MEFL
GA
AZ
NJ
VA
ny
HI
CO
CAWV
NE
IN
US Avg
OR
OH
PA
Per Capita GDP ('98) vs. Real PCGDP Growth '98-'08
"Product Matrix": Dogs, Stars, Cows (BCG)
US Avg
High GDPpc
High Growth
14
state deficit emerged; and, although this has not been widely suggested, a convincing argument can be made that Wisconsin has never fully come to grips with the excesses of the 1990s and the subsequent budget imbalance. For the past five biennia, governors and legislators of both parties have lurched from budget crisis to budget crisis.
On paper, state budgets have been balanced using a number of one-time techniques and, what some would label, accounting tricks. In 2001-03, tobacco bonds were sold to generate over $1 billion in one-time money to produce a “balanced” budget. In subsequent biennia, one-time dollars were transferred from other funds to the general fund to keep the latter in the black. More than $1.3 billion was moved from the transportation fund; another $200 million – now disputed in court – was moved from the physician-funded Injured Patients Compensation fund; smaller sums of money were moved from a public utility benefits fund, the recycling fund, and so on. Perhaps the most egregious “budget-balancing” move was repeated use of an accounting trick that allowed the state to pay out property tax-relief credits in one year but not fund them until the following budget year.
To make matters worse, the state has, for more than three decades, almost entirely ignored a 1986 “budget stabilization” law that allowed it to set aside surplus revenues in good times in order to avoid budget cuts and tax hikes during downturns. Entering the current recession, the average state had amassed surpluses equal to almost 7% of annual spending; percentages in Iowa and Minnesota were in the ten-percent range. Wisconsin reserves, by comparison, were less than 1% of expenditures and sometimes approached 0%.
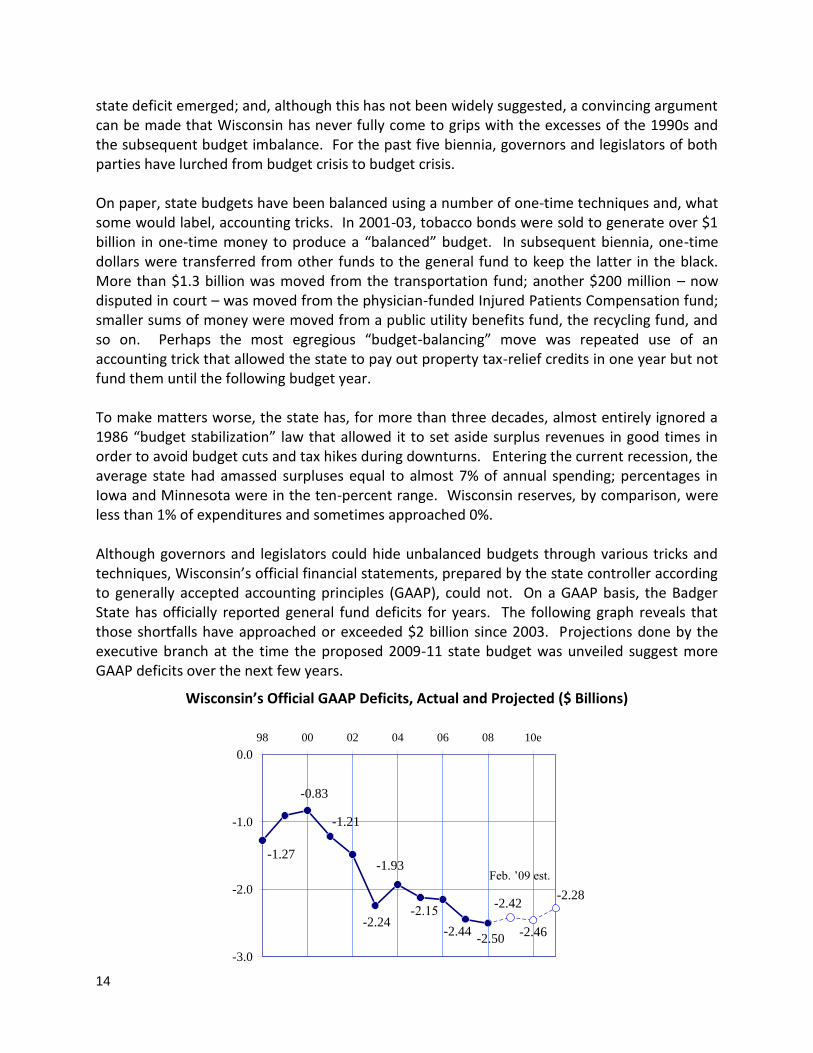
Although governors and legislators could hide unbalanced budgets through various tricks and techniques, Wisconsin’s official financial statements, prepared by the state controller according to generally accepted accounting principles (GAAP), could not. On a GAAP basis, the Badger State has officially reported general fund deficits for years. The following graph reveals that those shortfalls have approached or exceeded $2 billion since 2003. Projections done by the executive branch at the time the proposed 2009-11 state budget was unveiled suggest more GAAP deficits over the next few years.
Wisconsin’s Official GAAP Deficits, Actual and Projected ($ Billions) -2.46
-2.42-2.28
-1.27
-0.83
-1.21
-2.24
-1.93
-2.15
-2.44-2.50
-3.0
-2.0
-1.0
0.0
98 00 02 04 06 08 10e
Feb. ’09 est.
15
RECENT DEVELOPMENTS There is little debate that Wisconsin’s state budget problems deteriorated over the past two years when the economy—and tax collections—slumped. Nevertheless, as the prior discussion shows, state budget problems emerged more than a decade ago and have gone largely unaddressed since. Short-term and quick “fixes” have kept the general fund balanced on paper, but the average CPA or savvy citizen knows better. In 2007, the Badger State’s GAAP deficit (see above) was the second largest in the nation in raw dollar terms, the largest per capita.
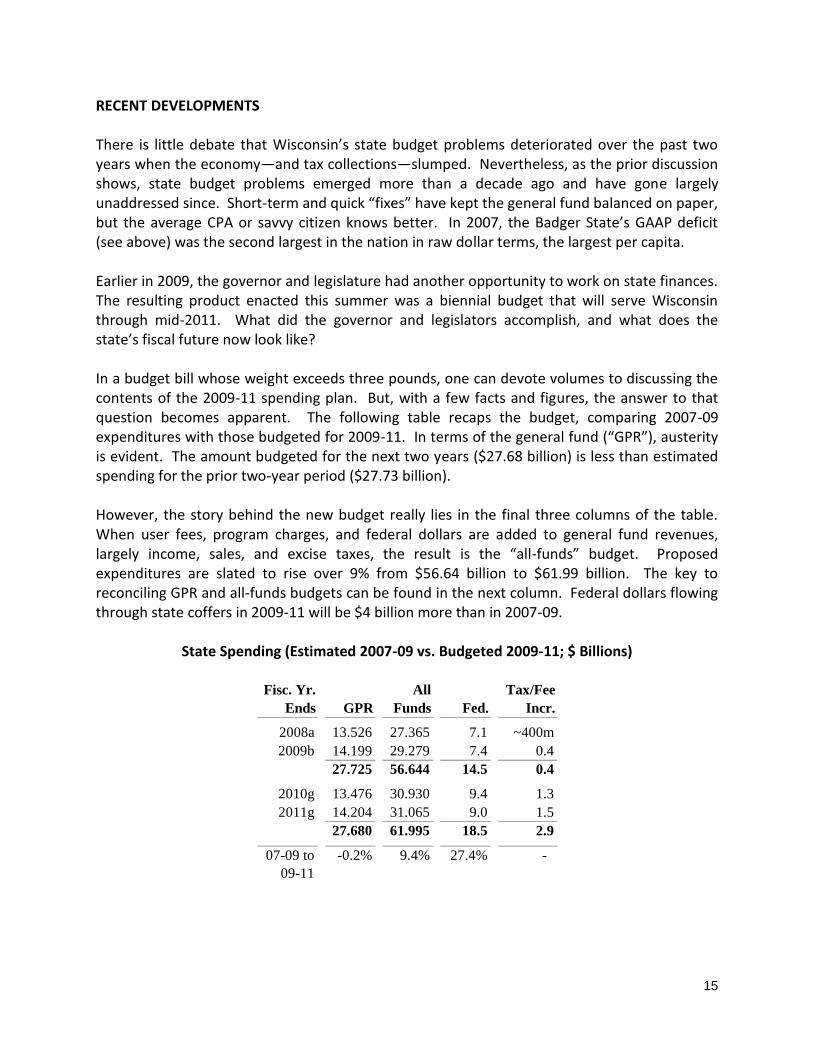
Earlier in 2009, the governor and legislature had another opportunity to work on state finances. The resulting product enacted this summer was a biennial budget that will serve Wisconsin through mid-2011. What did the governor and legislators accomplish, and what does the state’s fiscal future now look like? In a budget bill whose weight exceeds three pounds, one can devote volumes to discussing the contents of the 2009-11 spending plan. But, with a few facts and figures, the answer to that question becomes apparent. The following table recaps the budget, comparing 2007-09 expenditures with those budgeted for 2009-11. In terms of the general fund (“GPR”), austerity is evident. The amount budgeted for the next two years ($27.68 billion) is less than estimated spending for the prior two-year period ($27.73 billion). However, the story behind the new budget really lies in the final three columns of the table. When user fees, program charges, and federal dollars are added to general fund revenues, largely income, sales, and excise taxes, the result is the “all-funds” budget. Proposed expenditures are slated to rise over 9% from $56.64 billion to $61.99 billion. The key to reconciling GPR and all-funds budgets can be found in the next column. Federal dollars flowing through state coffers in 2009-11 will be $4 billion more than in 2007-09.
State Spending (Estimated 2007-09 vs. Budgeted 2009-11; $ Billions)
2008a 13.526 27.365 7.1 ~400m
2009b 14.199 29.279 7.4 0.4
27.725 56.644 14.5 0.4
2010g 13.476 30.930 9.4 1.3
2011g 14.204 31.065 9.0 1.5
27.680 61.995 18.5 2.9
07-09 to -0.2% 9.4% 27.4% -
09-11
Tax/Fee
Incr.
Fisc. Yr.
Ends GPR
All
Funds Fed.
16
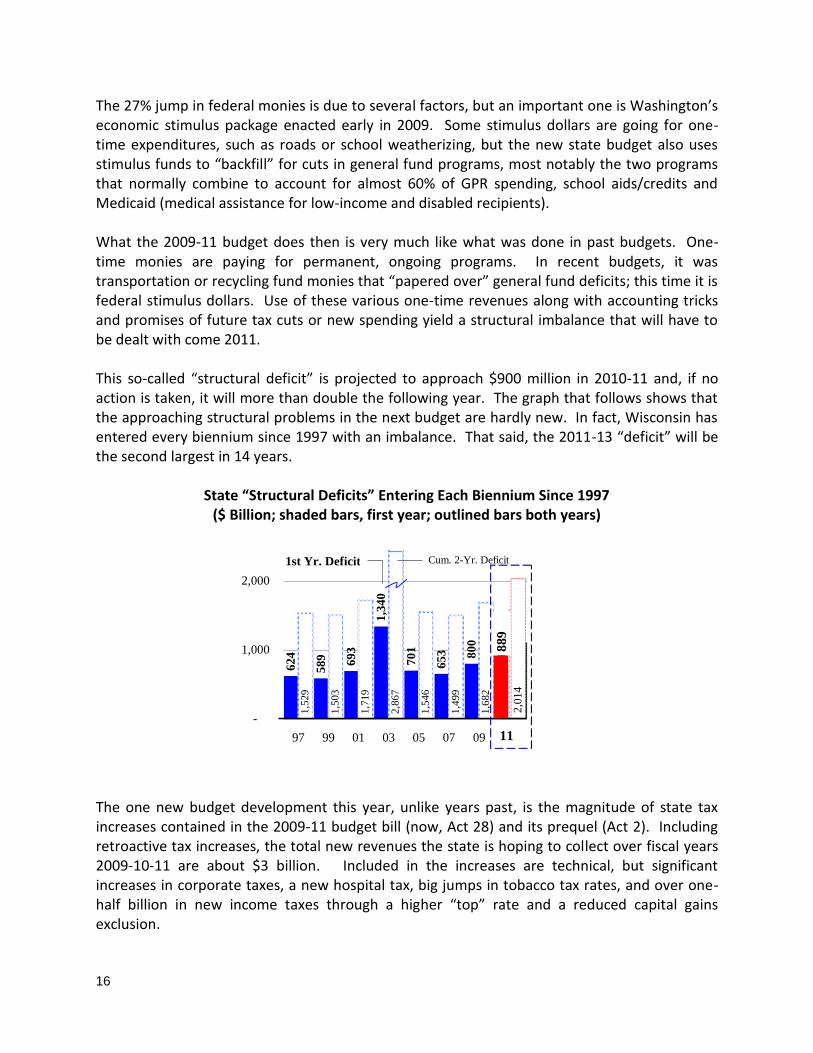
The 27% jump in federal monies is due to several factors, but an important one is Washington’s economic stimulus package enacted early in 2009. Some stimulus dollars are going for one-time expenditures, such as roads or school weatherizing, but the new state budget also uses stimulus funds to “backfill” for cuts in general fund programs, most notably the two programs that normally combine to account for almost 60% of GPR spending, school aids/credits and Medicaid (medical assistance for low-income and disabled recipients). What the 2009-11 budget does then is very much like what was done in past budgets. One-time monies are paying for permanent, ongoing programs. In recent budgets, it was transportation or recycling fund monies that “papered over” general fund deficits; this time it is federal stimulus dollars. Use of these various one-time revenues along with accounting tricks and promises of future tax cuts or new spending yield a structural imbalance that will have to be dealt with come 2011. This so-called “structural deficit” is projected to approach $900 million in 2010-11 and, if no action is taken, it will more than double the following year. The graph that follows shows that the approaching structural problems in the next budget are hardly new. In fact, Wisconsin has entered every biennium since 1997 with an imbalance. That said, the 2011-13 “deficit” will be the second largest in 14 years.
State “Structural Deficits” Entering Each Biennium Since 1997 ($ Billion; shaded bars, first year; outlined bars both years)
The one new budget development this year, unlike years past, is the magnitude of state tax increases contained in the 2009-11 budget bill (now, Act 28) and its prequel (Act 2). Including retroactive tax increases, the total new revenues the state is hoping to collect over fiscal years 2009-10-11 are about $3 billion. Included in the increases are technical, but significant increases in corporate taxes, a new hospital tax, big jumps in tobacco tax rates, and over one-half billion in new income taxes through a higher “top” rate and a reduced capital gains exclusion.
624
589 693
1,3
40
701
653 800
1,5
29
1,5
03
1,7
19
2,8
67
1,5
46
1,4
99
1,6
82
2,2
58
1,1
07
713
1,5
74
-
1,000
2,000
97 99 01 03 05 07 09 11g 11jf
1st Yr. Deficit Cum. 2-Yr. Deficit
GJ
F
11
889
2,0
14
17
The size of such tax hikes might give some state officials hope that expanded tax laws coupled with a strong recovery would combine to erase the approaching structural deficit. The problem with that hope is mathematical. If the state collects $12.9 billion in general fund taxes as it projects for 2010-11, and if those collections grow at 5% in 2011-12—a rate that is historically possible but less likely coming out of a serious recession—the state general fund could expect almost $650 million in new revenues. Even that amount of new money, however, does not begin to erase a carryover structural gap that, in the final analysis, will probably approach $1 billion. And so . . . we end where we began—with a question about the state’s future fiscal health: “Rewind or Recovery Ahead?” Barring an unexpected and almost unprecedented surge in the economy and tax collections, it appears that, regardless of the identity of the individuals occupying the executive and legislative branches come 2011, as they begin work, they will only need to push the “rewind” button. The 2011-13 state budget situation is likely to be quite similar to ones experienced over the past decade.
Santayana comes to mind: “Those who do not learn from history . . . “