Ocean acidification can disrupt the balance and functioning of marine ecosystems (Wannicke et al., 2018). It has been reported that acidifi-cation can decrease calcification rates of marine oysters (Waldbusser et al., 2011), weaken the homing ability of fish (Kroeker et al., 2013),
and increase growth rates of macro- algae (Koch et al., 2013). In estu-arine regions, acidification is becoming even more serious, owing to the weak capacity of buffering acidification and thus raises a global concern in recent decades (Feely et al., 2008; Hurd et al., 2018).
Estuarine ecosystems are experiencing high anthropo-genic loadings of reactive nitrogen (N), resulting in not only
Received: 12 February 2021 | Revised: 4 August 2021 | Accepted: 16 August 2021
DOI: 10.1111/gcb.15863
P R I M A R Y R E S E A R C H A R T I C L E
Stimulation of N2O emission via bacterial denitrification driven by acidification in estuarine sediments
Xiaoxuan Su1 | Teng Wen2 | Yingmu Wang3 | Junshi Xu4 | Li Cui1 | Jinbo Zhang2,5 | Ximei Xue1 | Kai Ding1 | Yijia Tang6,7 | Yong- guan Zhu1,8,9
1Key Laboratory of Urban Environment and Health, Institute of Urban Environment, Chinese Academy of Sciences, Xiamen, China2School of Geography, Nanjing Normal University, Nanjing, China3College of Civil Engineering, Fuzhou University, Fuzhou, China4Civil and Mineral Engineering, University of Toronto, Toronto, Ontario, Canada5Key Laboratory of Virtual Geographic Environment, Ministry of Education, Nanjing Normal University, Nanjing, China6School of Life and Environmental Sciences, The University of Sydney, Sydney, New South Wales, Australia7Sydney Institute of Agriculture, Sydney, New South Wales, Australia8University of the Chinese Academy of Sciences, Beijing, China9State Key Laboratory of Urban and Regional Ecology, Research Center for Eco- Environmental Sciences, Chinese Academy of Sciences, Beijing, China
Funding informationNatural Science Foundation of China, Grant/Award Number: 42021005 and 42003060; Strategic Priority Research Program of Chinese Academy of Sciences, Grant/Award Number: Y9IXD21A10; China Postdoctoral Science Foundation, Grant/Award Number: 2019M662253
AbstractOcean acidification in nitrogen- enriched estuaries has raised global concerns. For decades, biotic and abiotic denitrification in estuarine sediments has been regarded as the major ways to remove reactive nitrogen, but they occur at the expense of re-leasing greenhouse gas nitrous oxide (N2O). However, how these pathways respond to acidification remains poorly understood. Here we performed a N2O isotopocules analysis coupled with respiration inhibition and molecular approaches to investi-gate the impacts of acidification on bacterial, fungal, and chemo- denitrification, as well as N2O emission, in estuarine sediments through a series of anoxic incubations. Results showed that acidification stimulated N2O release from sediments, which was mainly mediated by the activity of bacterial denitrifiers, whereas in neutral environ-ments, N2O production was dominated by fungi. We also found that the contribution of chemo- denitrification to N2O production cannot be ignored, but was not signifi-cantly affected by acidification. The mechanistic investigation further demonstrated that acidification changed the keystone taxa of sedimentary denitrifiers from N2O- reducing to N2O- producing ones and reduced microbial electron- transfer efficiency during denitrification. These findings provide novel insights into how acidification stimulates N2O emission and modulates its pathways in estuarine sediments, and how it may contribute to the acceleration of global climate change in the Anthropocene.
K E Y W O R D Sacidification, bacterial denitrification, fungal denitrification, microbial community, N2O emission, nitrogen isotopes
eutrophication (Pettay et al., 2020) but also profound impacts on N biogeochemical cycles, especially those related to climate change. In anoxic estuarine sediments, denitrification is known as an effec-tive pathway for the removal of reactive N, but is accompanied by emitting a potent greenhouse gas, nitrous oxide (N2O; Jung et al., 2019; Su et al., 2019a; Tan et al., 2020). It has been estimated that global oceans contribute 20%– 30% of N2O emissions (Sun et al., 2020; Tian et al., 2020). As denitrifier activities are sensitive to pH fluctuations (Rittmann & McCarty, 2001), acidification could dis-turb denitrification performance and greatly affect N2O fluxes. For example, Rees et al. (2016) documented that N2O production was closely linked to pH levels in cold seawater, but the potential mech-anism was less explored. Recognizing the roles of acidification in N transformations and their associated N2O emissions in estua-rine sediments is thus important for controlling eutrophication and mitigating greenhouse gas across globally relevant scales. Despite the importance, the impacts of acidification on denitrification and its associated N2O dynamics in estuarine ecosystems have rarely been investigated.
It is traditionally thought that bacterial denitrification is the major pathway for the removal of nitrate and the release of N2O from sediments (Gao et al., 2020; Wang, Pi, Jiang, et al., 2020). However, recent studies have demonstrated that fungal denitrifica-tion may also contribute to N transformation and N2O production (Seo & DeLaune, 2010; Wankel et al., 2017). In fact, unlike terres-trial ecosystems, the diversity and ecological function of fungal denitrifiers in aquatic ecosystems remain largely unexplored, par-ticularly in estuarine ecosystems (Grossart et al., 2019). As fungal denitrifiers lack N2O reductase (Mothapo et al., 2015), fungal de-nitrification may represent a more potent source of N2O emission compared with bacterial denitrification. However, N2O emissions from fungal sources have rarely been investigated in estuarine sed-iments, and fungal denitrification in response to acidification is also unexplored. This, therefore, limits the comprehensive evaluation of N2O emission in estuarine ecosystems under global estuarine acid-ification. In addition, some evidence from laboratory experiments has suggested that abiotic pathways (chemo- denitrification, such as iron coupled with nitrate/nitrite) can also produce N2O as a by-product (Jones et al., 2015; McTigue et al., 2016; Wei et al., 2019). Unfortunately, both fungal denitrification and chemo- denitrification have been frequently overlooked in complex ecosystems when esti-mating N2O fluxes. Whether the chemo- denitrification in estuarine ecosystems could contribute to a greater emission of N2O is largely unknown. We hypothesize that both the activity of fungal denitri-fiers and the cycling of iron would be promoted in organic/N- rich and anoxic estuarine sediments and probably contribute to greater emissions of N2O relative to bacterial sources (Wankel et al., 2017). Moreover, because of the different adaptabilities of bacterial and fungal denitrifiers under acidified and neutral environments (Rousk et al., 2010), the shift away from optimal pH conditions caused by acidification may affect bacterial, fungal, and chemo- denitrification differently and lead to a heterogeneity in N2O emission patterns in estuarine sediments. Therefore, understanding the responses
of biotic and abiotic denitrification to acidification is essential to evaluate N2O emission in estuarine ecosystems under global ocean acidification.
Currently, it remains a challenge to predict N2O production in complex estuarine ecosystems, owing to the difficulty in distinguish-ing various N2O production pathways (Wankel et al., 2017). This study applied a N2O isotopocules analysis together with respiration inhibition approaches to provide a broader perspective on N2O cy-cling during denitrification in anoxic estuarine sediments (Maeda et al., 2017). A N2O isotopocules technique is a promising tool to distinguish various N2O production sources in natural ecosystems (Wankel et al., 2017; Zou et al., 2014). This is because N2O produced from different processes has distinctive preferential cleavages of 14/15N- 16O bond in their symmetric intermediates, which thus gen-erates different intramolecular enrichments of 15Nα (14N- 15N- 16O) or 15Nβ (15N- 14N- 16O) in N2O and leads to the distinct site prefer-ence (SP; Mothapo et al., 2015; Toyoda et al., 2002; Yu et al., 2020). Generally, bacterial denitrification possesses lower SP and δ18O val-ues of N2O, whereas fungal denitrification has higher ones (Sutka et al., 2006, 2008; Toyoda et al., 2017; Zou et al., 2014). The SP value coupled with δ18O of N2O can differentiate N2O sources among di-verse processes (Rohe et al., 2017).
In this study, the isotope ratios of N2O isotopocules (δ15Nα and δ15Nβ) were measured by a gas chromatography– isotope ratio mass spectrometer (GC- IRMS). Additionally, streptomycin (STP) and cy-cloheximide (CYH) were used to inhibit bacterial and fungal respira-tion activities in the estuarine sediments, respectively (Maeda et al., 2017). We first explored the impacts of acidification on N transfor-mations during biotic and abiotic denitrification in anoxic estuarine sediments using a N2O isotopocules analysis combined with differ-ent inhibition strategies of bacteria or fungi. Then the relative con-tributions of denitrification- based N2O production pathways under acidified and neutral conditions were estimated. Furthermore, the molecular mechanisms of acidification affecting bacterial and fungal denitrification were revealed, including the identification of denitri-fiers keystone taxa and the exploration of electron transfer behav-iors during denitrification and N2O emission.
2 | MATERIAL S AND METHODS
2.1 | Sampling and incubation experiments
In total, nine sediment cores were taken from three sampling sites of an estuary in Xiamen, China, in July 2019 (Figure S1), where heavy human activities may have recently released pollutants such as N into the waters. Estuarine sediments (10 kg) were collected with a gravity- corer (at 5.4 m, XDB- 0205, ZX Co.), and the 10– 50 cm over-lying water (30 L) was sampled using a polymethyl– methacrylate sampler (FSS89- 2500, Haifuda). The dissolved oxygen concentration of overlying water was measured in situ (0.05– 0.11 mg/L, anoxic conditions) with a Water Quality Profiler (Hydrolab- DS5, HACH). At each of the three sampling sites, three sediment cores were collected
| 3SU et al.
randomly as subsamples and then mixed to reduce sampling errors. The sediment and water samples were immediately sent back to the laboratory. After homogeneous mixing, the characteristics of sedi-ments and water were analyzed as described by Su et al. (2019a).
pH- based acidification experiments were carried out during a 50- day anaerobic incubation and a subsequent 60- hr denitrification experiment as follows:
a. Experiment 1 (50- day anaerobic incubation). During the incuba-tion, four pH levels were established as pH 5.0 (extreme condi-tions), 5.8 (after 3 centuries; Joint et al., 2011), 6.8 (background level), and 7.5 (common in the literature; Lee et al., 2019). Each pH level contained 200 g of estuarine sediments and 400mL of overlying water in a 1000- ml conical flask. Overlying water was adjusted by HCl or NaOH to reach the corresponding pH levels, and the headspace was purged with helium gas (99.99%) to keep in situ anoxic conditions. Then sediments were incubated in a temperature- controlled chamber (HWS- 250) at 19°C for 50 days. During this period, fresh and pH- adjusted overlying water was supplemented to replace the existing water every 4 days to keep in situ environmental conditions. After each replacement, anoxic conditions also remained by aerating He for 10 min. Except for pH, other incubation conditions were similar to the in situ es-tuarine environments (details shown in Table S1), and microbial communities and activities were stable after 50 days (Su et al., 2021).
b. Experiment 2 (60- h denitrification experiment). To test the im-pacts of acidification on sedimentary denitrification and N2O production, a subsequent 60- h denitrification experiment was conducted (refer Figure S2 for experimental design). We sam-pled sediments from each pH level after 50 days and established four incubation groups: (1) Control group, without any inhibitor; (2) bacterial inhibitor streptomycin (STP, fungal denitrification) group; (3) fungal inhibitor cycloheximide (CYH, bacterial denitri-fication) group; and (4) STP + CYH group (chemo- denitrification). STP can inhibit bacterial protein synthesis by disturbing peptidyl transferase at the 30S ribosomal subunit, and CYH can inhibit fungal protein synthesis by impeding translocation in elongation (Maeda et al., 2017). Concentrations of bacterial (STP, 6 mg g– 1) and fungal (CYH, 10 mg g– 1) inhibitors were determined by mea-suring the respiration inhibition ratio (≈1) (SI 2.1). Each group contained the four pH levels in triplicate. Each treatment con-tained 20 g of estuarine sediments and 40 ml of deionized water. Thereafter, water pH was adjusted by HCl solution to pH 5.0 (150 μl) and 5.8 (90 μl), and by NaOH to pH 7.5 (60 μl). To supply nitrogen and carbon sources, NaNO3 and glucose were added to reach 1 mM nitrogen and 5 mM carbon (simulating urban and agricultural nonpoint pollution (Cheung et al., 2021)). Headspace was purged with helium gas. All treatments were then incubated at 25°C for 60 h. Liquid or gas samples were taken with 1- ml syringes. Concentrations of N and iron species including NO3
−, NO2
−, NH4+, N2O, and N2, as well as Fe2+ and Fe3+ concentra-
tions were measured at 4- or 8- h intervals. After 60hr, N2O and
N2 production rates, N2O isotopocules, bacterial and fungal de-nitrifier communities, electron transfer efficiency, and functional gene abundances were analyzed. Detailed methods are provided in SI (S2.2 and S2.3) and the following sections.
2.2 | Isotope measurements and oxygen exchange
After the 60- h experiment, 12 ml of headspace gas from each treat-ment was collected and stored in pre- evacuated vials (Exetainer, Labco). N2O isotopocules were analyzed using an isotope ratio mass spectrometer (IRMS, Delta V plus, Thermo) coupled to a precon-centrator system (Precon + Gasbench, Thermo; Rohe et al., 2017). Details are listed in SI S2.3. Values of N2O isotopocules were de-termined by measuring the molecular N2O+ (m/z: 44/45/46) and the fragment NO+ (m/z: 30/31). Pure N2O (99.995%) whose isotopocules values have been analyzed in the laboratory of Thünen Institute of Climate- Smart Agriculture was used as internal reference gases. Two standards kindly offered by Dr. Reinhard Well and Anette Giesemann (Thünen Institute of Climate- Smart Agriculture, Germany) were used for performing two- point calibration for site preference (SP) values.
The isotope ratios of 15Nbulk,18O, 15Nα, and 15Nβ of N2O were de-termined using the following relationships:
where 15Ni and 18O, respectively, denote the isotope ratios of 15N/14N and 18O/16O. 15Nα and 15Nβ are the ratios of 15N/14N at the center (14N- 15N- 16O) and the edge (15N- 14N- 16O) sites in the N2O molecule, respec-tively. These ratios were presented as ‰ relative to Vienna Standard Mean Ocean Water (18O) or atmospheric N2 (15N). The SP value of N2O was determined as
The typical measurement precisions are 0.3‰, 0.9‰, 0.9‰, and 0.6‰ for δ15Nbulk, δ15Nα, δ15Nβ, and δ18O, respectively.
δ15N (−1.2 ± 2.3‰) and δ18O (15.6 ± 0.8‰) of initial 15N- NO3–
and δ18O (0.2 ± 0.1‰) of H2O were measured according to Rohe et al. (2017).
During denitrification, the exchange of 18O- N2O with 18O- H2O would affect the actual δ18O value of N2O; thus, the δ18O- N2O analysis could not be directly used to differentiate the N2O sources (Rohe et al., 2017). In this study, we respectively applied two abun-dances of δ18O- H2O (pure water from the lab: 0.2 ± 0.1‰ (natural abundance); from Aladdin: 32.5 ± 2.2‰ (10% 18O atom)) to assess oxygen exchange during denitrification at each pH level. Oxygen ex-change was corrected by the intercept of linear regression of the
(1)δ15Ni(‰) =(
15Nisample
∕15Nstandard − 1)
(i = bulk, �, or�) ,
(2)δ18O(‰) = 18Osample∕18Ostandard − 1,
(3)δ15Nbulk(% ) =(
δ15Nα + δ15Nβ)
∕2,
(4)N2OSP(‰) = δ15Nα − δ15Nβ.
4 | SU et al.
δ18O- N2O/NO3– versus the δ18O- H2O/NO3
– values (Equations 5 and 6; Rohe et al., 2017):
where 18ON2O, 18ONO3−
, and 18OH2O denote the isotope ratios of
18O/16O of N2O, NO3– , and H2O, respectively. The intercepts at each
pH level are shown in Table S2. The δ18O- N2O used in the following estimations is the corrected δ18O of N2O.
2.3 | N2O isotope mass balance and error propagation
N2O isotope mass balance was established to estimate the relative contributions of N2O productions in the estuarine sediments between acidified and neutral conditions (Wankel et al., 2017). As the incuba-tions were simulated under anoxic conditions, we only considered N2O production from denitrification sources, including bacterial, fun-gal, and chemo- denitrification. Fractional contributions of the three processes to the total production of N2O were expressed as
where fB, fF, and fC represent the fractional contributions of bacte-rial denitrification, fungal denitrification, and chemo- denitrification, respectively.
For SP values of N2O production, isotope mass balance contri-butions of the three processes to the SP of N2O production were expressed as
where SPp denotes the SP values of N2O before reduction (not the measured SP values). SPB, SPF, and SPC represent the SP values for bacterial denitrification (−7.5– 3.7‰, 0 ± 2.3‰), fungal denitrifica-tion (30.2·39.3‰, 37 ± 3.2‰), and chemo- denitrification (10– 22‰, 16 ± 4.1‰), respectively (Table S3). The ranges of SP values for the three denitrification processes are summarized according to previous studies (Baggs, 2008; Decock & Six, 2013; Hu et al., 2015; Humbert et al., 2020; Jones et al., 2015; Sutka et al., 2008; Wankel et al., 2017; Yu et al., 2020; Zou et al., 2014). The mean values and standard errors for SP were obtained by estimating error propagation using the Monte Carlo sampling method in MATLAB and then were adjusted based on previous studies (Wankel et al., 2017; Zou et al., 2014).
Similar to SP values, the fractional contributions of the three processes to δ18O of N2O production were expressed as
where δ18Op denotes the δ18O values of N2O before reduction (not the measured δ18O values). δ18OB, δ18OF, and δ18OC represent the δ18O
value for bacterial denitrification (17.4– 26.5‰, 19 ± 3.6‰), fungal denitrification (30.2– 51.9‰, 45 ± 10.8‰), and chemo- denitrification (24.3– 36.5‰, 10 ± 6.3‰), respectively (Baggs, 2008; Frame & Casciotti, 2010; Hu et al., 2015; Humbert et al., 2020; Jones et al., 2015; Maeda et al., 2017; Sutka et al., 2006, 2008; Yu et al., 2020; Table S3). The mean values of SP and δ18O estimated by the Monte Carlo method were the most appropriate for this study and used in the mass balance model (Wankel et al., 2017).
It is known that the SP and δ18O values of residual N2O will in-crease if N2O reduction occurs such as bacterial denitrification. We suggested that N2O reduction would occur before the mixing of N2O produced from bacterial, fungal, and chemo- denitrification in estua-rine sediments (Zou et al., 2014). Thus, the variations in SP and δ18O values during N2O reduction were assessed as
where SP and δ18O represent the measured SP and δ18O values of re-sidual N2O after reduction, respectively. fR is the N2O reduction degree and equals the proportion of the reduced (measured without C2H2) to total N2O (measured with C2H2) concentrations. SP�N2O
and δ18O�N2O
are the kinetic isotope effect on SP (−6‰) and δ18O (−25‰) (Ostrom et al., 2007) during N2O reduction. Considering N2O reduction during the incubation experiment (Equations 10 and 11), Equations (8) and (9) were modified as
Combining Equations (7), (12), and (13), we could estimate the relative contributions (fB, fF, fC) of N2O production from bacterial, fungal, and chemo- denitrification in the core incubations.
2.4 | Kinetics of chemo- denitrification process
Similar to the STP + CYH group (Section 2.1), 20 g of sediments was collected after the 50- day anaerobic incubation. Prior to pH adjustment with HCl or NaOH, 6 mg g– 1 of bacterial inhibitor STP and 10 mg g– 1 of fungal inhibitor CYH were added to the estua-rine sediments. Subsequently, 1 mM NaNO3 and 5 mM glucose were added, and the headspace was purged with helium gas. Each pH level was established in triplicate and then incubated at 25°C for 60 h. Concentrations of Fe species (Fe2+ and Fe3+) and N species (NO3
−, NO2−, N2O, and N2,) were measured at 0,
12, 36, and 60 h.We applied a first- order kinetic model to evaluate the kinetics of
the chemo- denitrification process in the estuarine sediments (Jones et al., 2015). The apparent first- order rates of NO3
– and Fe2+ during chemo- denitrification were expressed as
where [NO3– ] and [Fe2+] were the concentrations of NO3
– and Fe2+ during chemo- denitrification at each pH level, respectively. Kapp1 and Kapp2 denote the apparent rate constants of the variations in Fe2+ and NO3
– concentrations during chemo- denitrification at each pH level, respectively. This apparent rate constant can reflect the level and rate of chemo- denitrification (Jones et al., 2015). Kapp1 and Kapp2 were de-termined by Equations (14) and (15), using the slopes of linear fittings of ln[NO3
– ] or ln[Fe2+] with time at 0, 12, 36, and 60 h at each pH level.
2.5 | Electron transfer efficiency
Behaviors of electron transfer during denitrification process greatly influence bacterial and fungal N2O metabolisms (Su et al., 2019a; Zumft, 1997). Electron transfer efficiency was thus measured in this study through an electron respiration approach by reducing tetra-zolium chloride to formazan (Broberg, 1985; Wan et al., 2016). After incubation, 5 g of estuarine sediments were collected from the STP and CYH groups. Sediments were first washed with 4°C 0.05 M phosphate- buffered saline (PBS) thrice at 4500 rpm for 10 min and then resuspended in PBS. One milliliter 0.5% tetrazolium chloride and 1 mg NADH were added into the resuspended sediment. After incubation in the dark for 30 min (25°C), 1- ml formaldehyde (HCHO) was injected into the sediment to terminate the reaction. The super-natant of the mixture was removed by centrifuging at 4500 rpm for 10 min. Then, 5- ml 96% methanol was added into the sediment to extract formazan at 200 rpm for 30 min. The supernatant was col-lected after being centrifuged at 10,000 rpm for 5 min. Absorbance of the generated orange- like supernatant was quantified at 490 nm. The electron transfer efficiency was estimated as
where ABS490 is the absorbance of the supernatant at 490 nm; 15.9 is the absorptivity of tetrazolium chloride−formazan; V0 and V (ml) are the volumes of initial mixture and methanol, respectively; t (min) is the incubation time; 32/2 is the factor for the transformation of tetra-zolium chloride– formazan to O2; and m (g) is the sediment mass.
2.6 | Bacterial and fungal genetic sequencing
After the 60- h experiment, 3.5 g of estuarine sediments from each pH treatment of Control, STP, and CYH groups were collected. Genomic DNA was extracted using a Power Soil DNA Isolation Kit (MoBio) according to the instructions. 16S rRNA gene (for the
bacterial community), bacterial nirS gene (for the nirS- type bacterial denitrifier), bacterial nirK gene (for the nirK- type bacterial denitri-fier), ITS gene (for the fungal community), and fungal nirK gene (for the nirK- type fungal denitrifier) were amplified with the primer sets 515F/907R, cd3aF/R3cd, F1aCu/R3Cu, ITS1F/ITS2R, and EunirK- F1/EunirK- R2, respectively (Table S4). Identification of fungal deni-trifier communities in the estuarine sediments was based on the EunirK- F1/EunirK- R2 and ITS1F/ITS2R primers according to previ-ous studies (Maeda et al., 2015; Mothapo et al., 2015). PCR products were purified by a DNA purification kit (DP214- 3, Tiangen) and were pooled for library constructions. Pooled samples were sequenced at the Illumina MiSeq platform. Raw sequences were quality fil-tered, chimera checking and grouped at the 97% sequence similarity (Caporaso et al., 2010). Taxonomy was assigned by comparison to Silva (16S rRNA gene), GenBank (functional gene), and UNITE (ITS gene) databases with QIIME. Community phylogenetic investigation by the reconstruction of unobserved- states (PICRUSt)- based pre-dictions was conducted as described by Douglas et al. (2020) and Langille et al. (2013). Accession number is SUB8289327.
The PCR conditions for fungal- denitrifying gene nirK included the initial heating at 94°C for 10 min, followed by 40 cycles at 94°C for 60 s, annealing for 30 s at 53°C, and extension for 60 s at 72°C (Table S4; Maeda et al., 2015). Bacterial- denitrifying genes (i.e., napA, narG, nirS, nirK, and nosZ; Table S5) were quantified by the qPCR- based SmartChip technique according to our previous study (Zheng et al., 2018). Briefly, 3.1 μl of DNA, 24.8 μl of Mix- enzyme, and 3.1 μl of gene primers were added to a SmartChip, which was then detected by a SmartChip PCR system (WaferGen, Biosystems). We used 16S rRNA gene as a reference gene. The qPCR conditions were initial heating at 95°C for 10 min, followed by 40 cycles at 95°C for 30 s, annealing for 30 s at 58°C, and extension for 30 s at 72°C. Samples with the threshold cycle CT less than 31 were selected for downstream analysis (Chen, Ding, et al., 2020; Zheng et al., 2018). These genes were regarded to be detected when they were targeted in all three replicates. Relative copy numbers of 16S rRNA gene and functional gene are as follows (Zheng et al., 2018):
Normalized relative abundance of functional genes is the pro-portion of the relative copy number of the functional gene to that of 16S rRNA gene, which was used as the reference gene (Zheng et al., 2018):
2.7 | Statistical analysis
Prior to the statistical test, the Shapiro– Wilks analysis was applied for the normality test. The data fitted normal distribution. The impacts of acidification on Fe concentrations, N2O/N2 production rates, N2O isotope abundances, electron transfer efficiency, electron transfer
(14)d[NO−
3]
dt= − Kapp1 × [NO−
3],
(15)d[Fe2+]
dt= − Kapp2 × [Fe2+],
(16)
Electron transferefficiency(
μgO2min−1 g−1 sediments)
=ABS49015.9
V
V0t
32
2
1
m, (17)Relativecopynumberofgene = 10(31−CT)∕(3.33).
protein reads, and functional gene abundances were statistically ex-amined using one- way ANOVA followed by a post- hoc Tukey test (p < .05) in IBM SPSS (version 22.0). Alpha- diversity was calculated by R. Permutational multivariate analysis of variance (PERMANOVA) was applied to evaluate the impacts of acidification on denitrifying community dissimilarity (Bray– Curtis distance). Pearson correlation was conducted among nirS- type and nirK- type bacterial denitrifiers and nirK- type fungal denitrifiers, in which nodes (r2 > .9 and p < .05) were selected for network analysis. Co- occurrence network analysis of bacterial and fungal denitrifiers was presented by Gephi software (v0.9.2).
3 | RESULTS
3.1 | N transformation and balance
Transformation and balance of N speciation in each group under dif-ferent pH levels showed a striking heterogeneity (Figure 1; Figure S3). In the Control group and CYH (bacterial denitrification) group,
acidification inhibited reductions of NO3– and NO2
– by 5%– 17% (pH 5.0) and 10%– 59% (pH 5.8), respectively (Tukey, p < .05) and reduced the production rates of N2 in the estuarine sediments com-pared with those at pH 6.8 and 7.5 (p < .05, Figure 1a,b; Figure S4). It is worth mentioning that acidification stimulated N2O emissions significantly (p < .01) in the Control and CYH groups by 223%– 438% upon the termination of incubation (Figure 1; Figure S3). For the STP group (fungal denitrification), NO3
– reduction was also inhib-ited by acidification, but the reduction rate was lower than that in the Control and CYH groups (p < .01, Figure 1a). This is because fungal denitrification commonly starts with NO2
– reduction, owing to the uncommon dissimilatory NO3
– reductase in most fungal deni-trifiers (Kobayashi et al., 1996; Uchimura et al., 2002). Furthermore, as fungal denitrifiers lack N2O reductase (catalyzing N2O to N2; Kobayashi et al., 1996; Shoun & Tanimoto, 1991), the emissions of N2O increased with incubation time and much less N2 production was detected in the STP group (Figure 1c,d). In addition, NH4
+ levels in all groups were enhanced with incubation time although acidifica-tion suppressed its increasing rate (Figure 1e), suggesting that dis-similatory NO3
– reduction to NH4+ may also occur in the estuarine
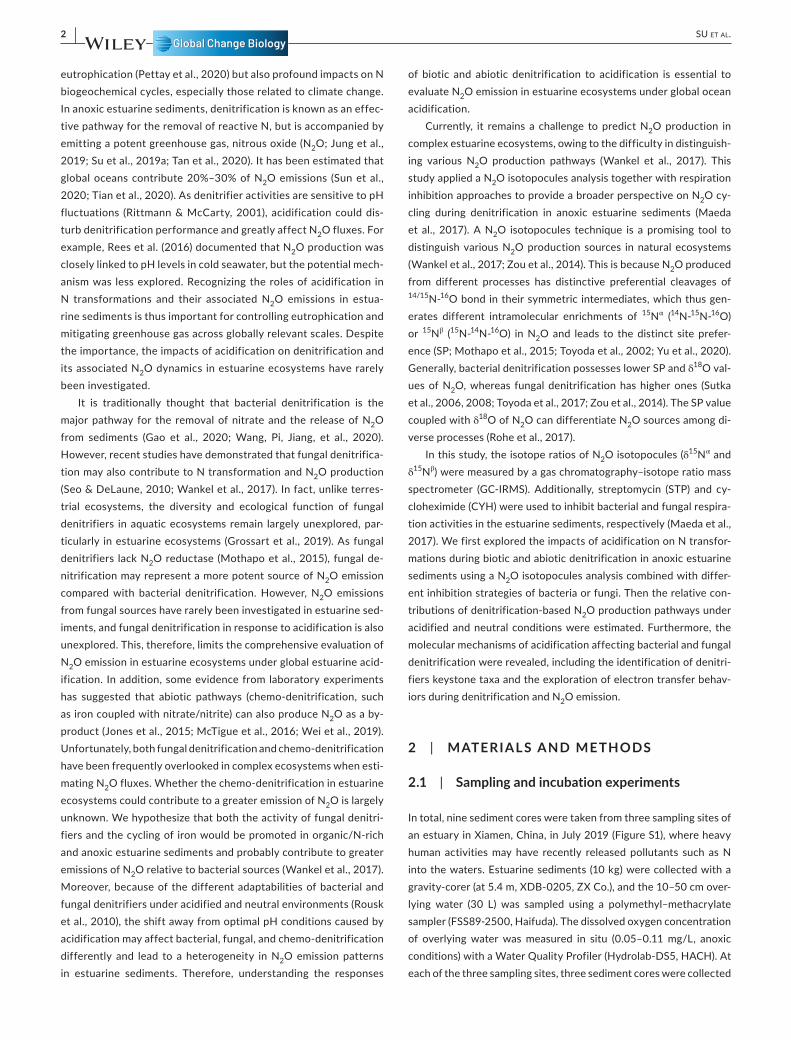
F I G U R E 1 Acidification responses of N speciation in the estuarine sediments along with time. (a) Nitrate. (b) Nitrite. (c) Nitrous oxide. (d) Dinitrogen gas. (e) Ammonium. 1 is the Control group without any inhibitor. 2 is the STP group with bacterial inhibitor streptomycin. 3 is the CYH group with fungal inhibitor cycloheximide. 4 is the STP + CYH group with both bacterial and fungal inhibitors. Error bars mean the standard deviation (n = 3)
| 7SU et al.
sediments (Wang, Pi, Song, et al., 2020), and its rate is likely higher than that of the potential anammox process which consumes NH4
+ in the estuarine sediments.
Bacteria and fungi in the STP + CYH group were expected to be inactivated due to applications of inhibitors; however, we still ob-served a slight NH4
+ increase, NO2– reduction, and N2O yield in all
pH treatments (Figure 1b,c,e). One possible reason was insufficient inhibitions of STP and CYH (Mothapo et al., 2015). For instance, STP has been reported to inactivate only 60%– 70% of total bacterial res-piration in soil environments (Velvis, 1997). The survived denitrifi-ers could be involved in NH4
+ increase, NO2– reduction, and N2O
emission. On the other hand, abiotic pathways in anoxic sediments such as chemo- denitrification (i.e., iron- Fe2+ and NO3
– /NO2– ) can
also contribute to the emission of N2O (Samarkin et al., 2010). For example, sediment surface- bound reduced iron- Fe2+ can act as an available activator for NO3
– or NO2– reduction and subsequent N2O
production (Samarkin et al., 2010; Wankel et al., 2017). Although the traditional respiration inhibition approach can distinguish the dom-inant N2O sources from bacteria and fungi and even from chemical sources (Mothapo et al., 2015), the accuracy of assessments from this approach is still in question. To solve the problem, N2O isotopoc-ules analysis was employed to estimate the relative contributions of N2O emission from the three candidate processes at each pH level.
3.2 | Multi- isotope analysis of N2O emission processes
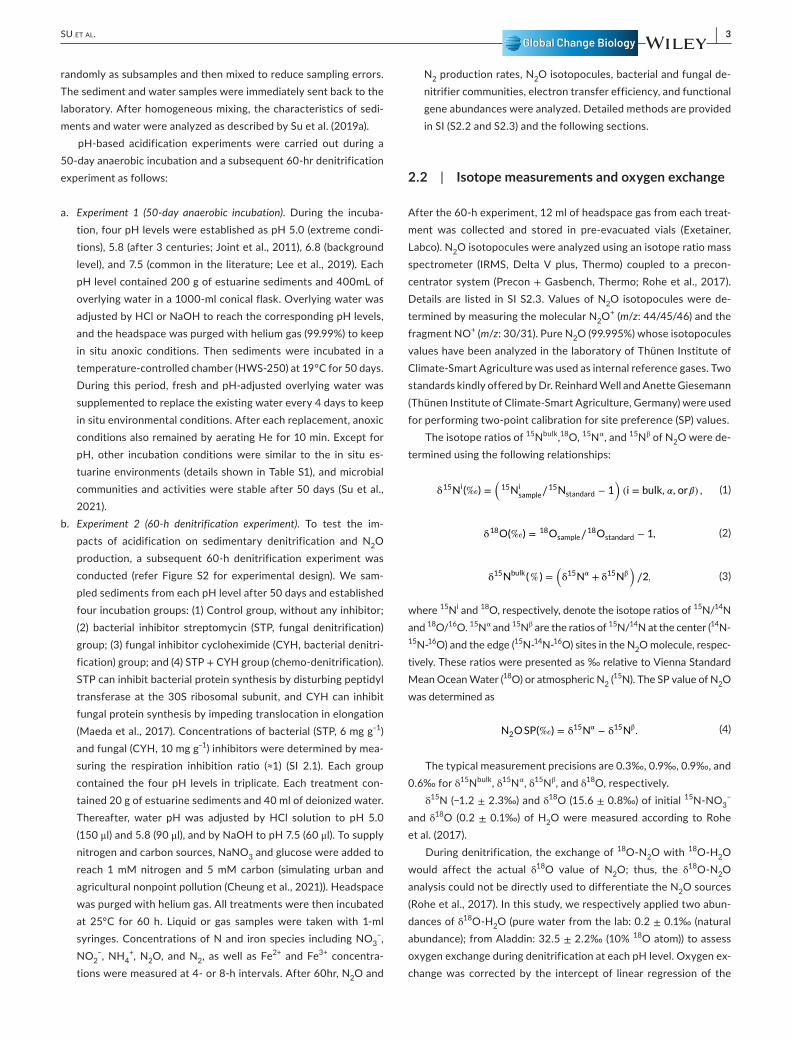
The stable isotopic compositions of N2O, including δ15Nbulk, δ15Nα, δ15Nβ, and δ18O, as well as the intramolecular SP (15Nα- 15Nβ), pro-vided better insights into biogeochemical mechanisms governing sedimentary N2O production and reduction under acidified and neu-tral conditions (Figure 2a; Figure S5). SP analysis of N2O has been widely used to distinguish N2O dynamics from bacterial (lower SP values) and fungal (higher SP values) sources, based on the differ-ent fractionation mechanisms of 15Nα and 15Nβ during nitric oxide (NO) reduction (Figure 2b; Yu et al., 2020). Bacterial NO reductase, holding a binuclear center, simultaneously binds two N atoms of NO molecules to engender an intermediate hyponitrite (ON- NO) prior to forming N2O (Figure 2b; Watmough et al., 2009). The two N atoms in ON- NO have little isotopic preference, thus producing a low SP value. In contrast, fungal NO reductase P450nor has only one cata-lytic center (Figure 2b; Toyoda et al., 2017), and the first and second N atoms sequentially stay at the β and α positions of N2O molecules, respectively (Toyoda et al., 2017). As isotopically lighter 14N reacts faster than the heavier 15N (Fry, 2006), fungal denitrification favors more enrichments of 15Nα than 15Nβ in N2O molecules, therefore generating a higher SP value. In this study, the average SP values in the STP and CYH groups were 25.72– 40.70‰ and 1.73– 17.25‰, respectively (Figure 2a; Figure S5), similar to previously reported fungal denitrification (30.2– 39.3‰; Lewicka- Szczebak et al., 2017; Sutka et al., 2008; Zou et al., 2014) and bacterial denitrification (−7.5– 3.7‰; Sutka et al., 2006; Toyoda et al., 2017; Yu et al., 2020;
Zou et al., 2014). In the Control group, the average SP of N2O at pH 6.8 and 7.5 was significantly (p < .01) higher than that at pH 5.0 and 5.8 (Figure 2a; Figure S5), suggesting that acidification may change the pathways of N2O production in the estuarine sediments.
The mixing model of N2O isotope using SP analysis alone can-not quantify N2O production when considering three or more end members (Duan et al., 2017; Fry, 2006). The δ18O isotope signature of N2O is another promising tool to identify different sources of N2O (Lewicka- Szczebak et al., 2017; Maeda et al., 2017). Coupling δ18O with the SP of N2O, we established a multi- isotope mass balance to identify the relative contributions of N2O productions from the three end members of bacterial, fungal, and chemo- denitrification. Meanwhile, N2O reduction during bacterial denitrification and ox-ygen exchange with H2O was also considered (Section 2.3). In this study, the semi- quantitative mass balance revealed that acidification altered the relative contributions of sedimentary N2O production from the three sources (Figure 2c). In pH 6.8 and 7.5 of the Control group, fungal denitrification was dominant in N2O production, con-tributing 41%– 69% of total N2O production (p < .001, Figure 2c). In contrast, bacterial denitrification became dominant at pH 5.0 and 5.8 levels and released 37%– 56% of total N2O (p < .01, Figure 2c).
Under natural conditions, it was previously thought that N2O emission from sediments could mainly be derived from bacterial de-nitrification (Gao et al., 2020; Wang, Pi, Jiang, et al., 2020). However, our study indicated that the fungal source was dominant under background conditions (pH 6.8 and 7.5), which is also similar to the observation that fungal N2O production might not be overlooked in coastal environments (Wankel et al., 2017). This is likely because ac-tivities of bacterial denitrifiers were unaffected under neutral con-ditions (pH 6.8 and 7.5) and thus could effectively reduce N2O to N2 (Figure 1d). By contrast, fungal denitrifiers could not perform N2O reduction due to lack of N2O reductase, thereby resulting in fungal N2O emission and its preponderance. In soil ecosystems, N2O pro-duction from fungi was also nearly one order of magnitude higher than that from bacterial denitrifiers, even though the abundance of fungal denitrifiers was lower than that of bacterial denitrifiers (Laughlin & Stevens, 2002). Our findings may indicate that fungal denitrification could have great influences on N2O emission in estu-arine ecosystems, acting as an important but previously underesti-mated source. Therefore, the role of fungi in N2O emissions should not be ignored in future studies. However, under acidified conditions (pH 5.0 and 5.8), N2O production predominantly switched to a bacte-rial source (Figure 2c). Because bacterial N2O emission (CYH group) was significantly increased by acidification and the fungal source (STP group) decreased (p < .01, Figure 1c), bacterial denitrification became the major source. With global ocean acidification increasing rapidly, such an increase in bacterial N2O yield could influence cli-mate change in global estuarine regions. These results also highlight that acidification effects should be considered when estimating N2O fluxes in estuarine ecosystems in the future.
In addition to biotic pathways, the abiotic production of N2O such as chemo- denitrification has also recently attracted some at-tention but its ecological role remains unclear (Jones et al., 2015;
8 | SU et al.
Laughlin & Stevens, 2002; Wei et al., 2019). Therefore, direct measurement of chemo- denitrification and model estimation with N2O isotope mass balance were applied to investigate the chemo- denitrification in the estuarine sediments. Chemo- denitrification is a complex process primarily due to different mechanisms associated with various substrates such as hydroxylamine, NO3
– , and NO2– ,
which can react with Fe2+ to produce N2O (Heil et al., 2014; Toyoda et al., 2005). In this study, the incubations were conducted under an-oxic conditions, and thus, the hydroxylamine from nitrification can be neglected. N2O production from chemo- denitrification may be related to two reactions, which are Fe2+ and NO3
– through 12Fe2+ + 2NO3
– + 11H2O→4Fe3O4 + N2O + 22H+ (ΔG0 = −509.6 kJ mol−1) and Fe2+ and NO2
– through 6Fe2+ + 2NO2– + 5H2O→2Fe3O4 + N2O
+ 10H+ (ΔG0 = −291.7 kJ mol−1; Jones et al., 2015; Samarkin et al., 2010). In the STP + CYH group, we found that concentrations of Fe2+ and NO3
– in the estuarine sediments declined with incubation time,
whereas Fe3+ and N2O increased (Figure S6). This indicates that the chemo- denitrification process did occur in the estuarine sediments.
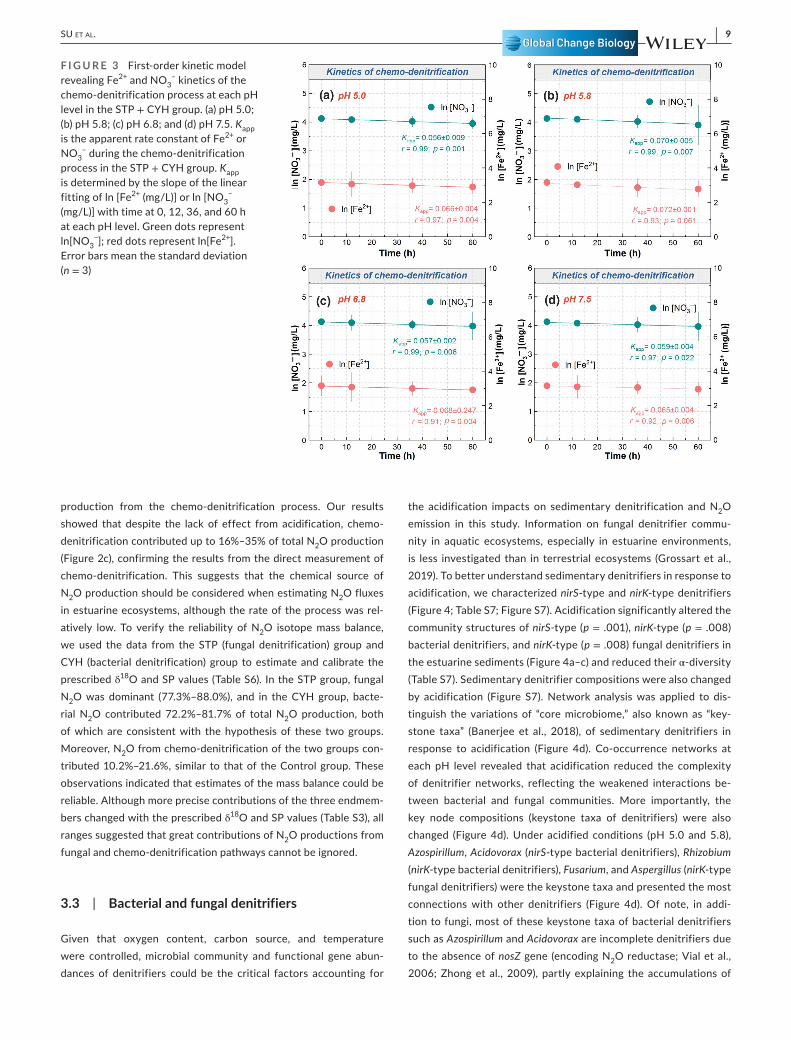
Furthermore, we used the first- order kinetic model and appar-ent rate constant Kapp to examine the chemo- denitrification rate in response to acidification (Figure 3). The apparent rate constants Kapp of NO3
– and Fe2+ were 0.056– 0.070 h– 1 and 0.065– 0.072 h– 1, respectively, lower than those in pure chemical reaction systems (0.11– 0.15 h– 1; Jones et al., 2015). This implies that the chemo- denitrification process was slower in the estuarine sediments. No sig-nificant difference was observed in Kapp among pH levels (Figure 3). Generally, the optimum pH level for the chemo- denitrification pro-cess (Fe2+ and NO3
– ) is ~8 (Chen, Yuan, et al., 2020; Wu et al., 2012) while our sediments were incubated at pH 5.0– 7.5 (acidified and in situ estuarine conditions), which could have led to the reduced chemo- denitrification rate. N2O isotope mass balance (Section 2.3) was further applied to estimate the relative contribution of N2O
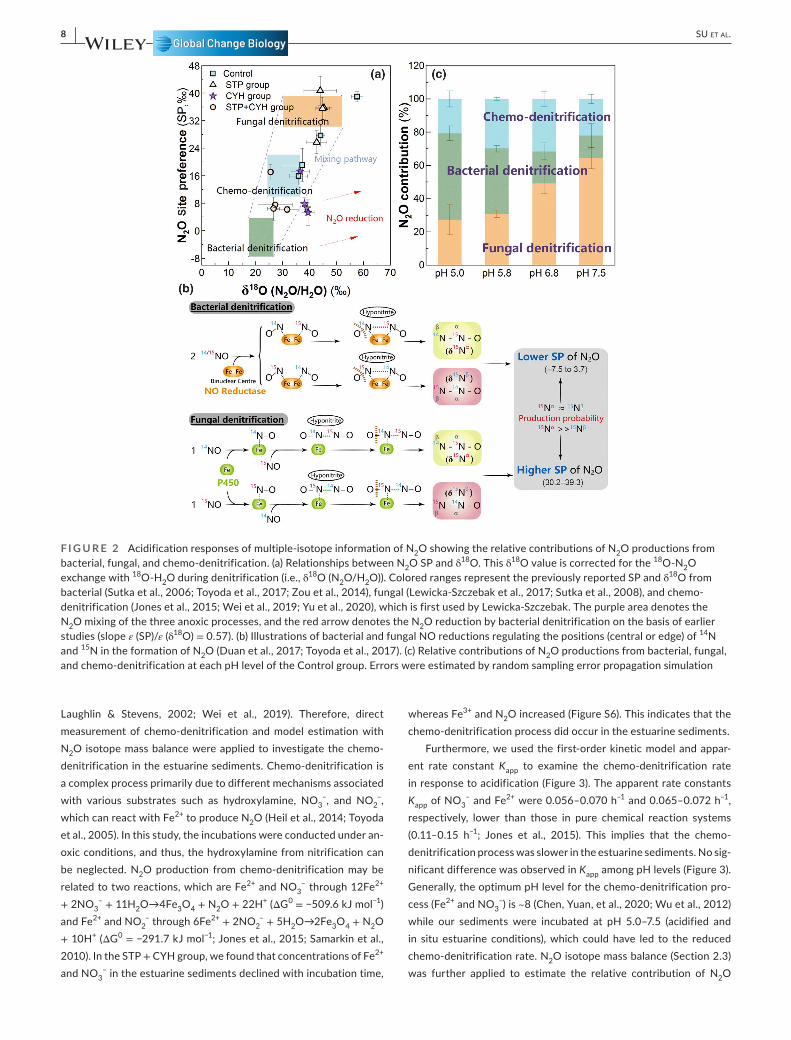
F I G U R E 2 Acidification responses of multiple- isotope information of N2O showing the relative contributions of N2O productions from bacterial, fungal, and chemo- denitrification. (a) Relationships between N2O SP and δ18O. This δ18O value is corrected for the 18O- N2O exchange with 18O- H2O during denitrification (i.e., δ18O (N2O/H2O)). Colored ranges represent the previously reported SP and δ18O from bacterial (Sutka et al., 2006; Toyoda et al., 2017; Zou et al., 2014), fungal (Lewicka- Szczebak et al., 2017; Sutka et al., 2008), and chemo- denitrification (Jones et al., 2015; Wei et al., 2019; Yu et al., 2020), which is first used by Lewicka- Szczebak. The purple area denotes the N2O mixing of the three anoxic processes, and the red arrow denotes the N2O reduction by bacterial denitrification on the basis of earlier studies (slope ε (SP)/ε (δ18O) = 0.57). (b) Illustrations of bacterial and fungal NO reductions regulating the positions (central or edge) of 14N and 15N in the formation of N2O (Duan et al., 2017; Toyoda et al., 2017). (c) Relative contributions of N2O productions from bacterial, fungal, and chemo- denitrification at each pH level of the Control group. Errors were estimated by random sampling error propagation simulation
| 9SU et al.
production from the chemo- denitrification process. Our results showed that despite the lack of effect from acidification, chemo- denitrification contributed up to 16%– 35% of total N2O production (Figure 2c), confirming the results from the direct measurement of chemo- denitrification. This suggests that the chemical source of N2O production should be considered when estimating N2O fluxes in estuarine ecosystems, although the rate of the process was rel-atively low. To verify the reliability of N2O isotope mass balance, we used the data from the STP (fungal denitrification) group and CYH (bacterial denitrification) group to estimate and calibrate the prescribed δ18O and SP values (Table S6). In the STP group, fungal N2O was dominant (77.3%– 88.0%), and in the CYH group, bacte-rial N2O contributed 72.2%– 81.7% of total N2O production, both of which are consistent with the hypothesis of these two groups. Moreover, N2O from chemo- denitrification of the two groups con-tributed 10.2%– 21.6%, similar to that of the Control group. These observations indicated that estimates of the mass balance could be reliable. Although more precise contributions of the three endmem-bers changed with the prescribed δ18O and SP values (Table S3), all ranges suggested that great contributions of N2O productions from fungal and chemo- denitrification pathways cannot be ignored.
3.3 | Bacterial and fungal denitrifiers
Given that oxygen content, carbon source, and temperature were controlled, microbial community and functional gene abun-dances of denitrifiers could be the critical factors accounting for
the acidification impacts on sedimentary denitrification and N2O emission in this study. Information on fungal denitrifier commu-nity in aquatic ecosystems, especially in estuarine environments, is less investigated than in terrestrial ecosystems (Grossart et al., 2019). To better understand sedimentary denitrifiers in response to acidification, we characterized nirS- type and nirK- type denitrifiers (Figure 4; Table S7; Figure S7). Acidification significantly altered the community structures of nirS- type (p = .001), nirK- type (p = .008) bacterial denitrifiers, and nirK- type (p = .008) fungal denitrifiers in the estuarine sediments (Figure 4a– c) and reduced their α- diversity (Table S7). Sedimentary denitrifier compositions were also changed by acidification (Figure S7). Network analysis was applied to dis-tinguish the variations of “core microbiome,” also known as “key-stone taxa” (Banerjee et al., 2018), of sedimentary denitrifiers in response to acidification (Figure 4d). Co- occurrence networks at each pH level revealed that acidification reduced the complexity of denitrifier networks, reflecting the weakened interactions be-tween bacterial and fungal communities. More importantly, the key node compositions (keystone taxa of denitrifiers) were also changed (Figure 4d). Under acidified conditions (pH 5.0 and 5.8), Azospirillum, Acidovorax (nirS- type bacterial denitrifiers), Rhizobium (nirK- type bacterial denitrifiers), Fusarium, and Aspergillus (nirK- type fungal denitrifiers) were the keystone taxa and presented the most connections with other denitrifiers (Figure 4d). Of note, in addi-tion to fungi, most of these keystone taxa of bacterial denitrifiers such as Azospirillum and Acidovorax are incomplete denitrifiers due to the absence of nosZ gene (encoding N2O reductase; Vial et al., 2006; Zhong et al., 2009), partly explaining the accumulations of
F I G U R E 3 First- order kinetic model revealing Fe2+ and NO3
– kinetics of the chemo- denitrification process at each pH level in the STP + CYH group. (a) pH 5.0; (b) pH 5.8; (c) pH 6.8; and (d) pH 7.5. Kapp is the apparent rate constant of Fe2+ or NO3
– during the chemo- denitrification process in the STP + CYH group. Kapp is determined by the slope of the linear fitting of ln [Fe2+ (mg/L)] or ln [NO3
− (mg/L)] with time at 0, 12, 36, and 60 h at each pH level. Green dots represent ln[NO3
−]; red dots represent ln[Fe2+]. Error bars mean the standard deviation (n = 3)
10 | SU et al.
bacterial N2O at pH 5.0 and 5.8 in this study (Figure 1c). Under neu-tral conditions (pH 6.8 and 7.5), however, the keystone taxa shifted to Rubrivivax (nirS- type bacterial denitrifiers), Bradyrhizobium (nirK- type fungal denitrifiers), and Acremonium (nirK- type fungal deni-trifiers) (Figure 4d). These keystone taxa of bacterial denitrifiers (Rubrivivax and Bradyrhizobium) are complete denitrifiers and can re-duce NO3
– or NO2– to N2, leading to less bacterial N2O accumulation
(Bedmar et al., 2005; Nagashima et al., 2012). The aforementioned findings indicated that the keystone taxa of bacterial denitrifiers were shifted from N2O- reducing (complete denitrification) under neutral conditions to N2O- producing (incomplete denitrification) under acidified conditions. This shift may partly explain the in-creased N2O emission under acidified conditions, and the changed N2O production pathways between acidified and neutral conditions in the estuarine sediments. Additionally, the significant correlations between denitrifier abundances and the potential production rates of N2O further supported that the keystone taxa could likely affect N2O emission in the estuarine sediments (Figure 4e).
Acidification also changed the abundances of sedimentary denitrifiers (Figure S7). At the phylum level, the abundance of Proteobacteria in the bacterial community was decreased, but the abundance of Ascomycota in the fungal community was increased. Moreover, the genera abundances of those keystone taxa were also altered by acidification (Figure S7). It is worth mentioning that the relative abundances of these keystone taxa were less than 0.5%, generally defined as “rare microbial taxa” (Lynch & Neufeld, 2015), with the exceptions of Rhizobium (1.9%) and Bradyrhizobium (1.3%). These observations highlighted the importance of rare taxa in me-diating microbial denitrification. The role of rare taxa is increasingly recognized, owing to their capacities in estimating key functions and driving element cycling in aquatic and/or terrestrial ecosystems (Chen, Ding, et al., 2020; Lynch & Neufeld, 2015). They are more sensitive to environmental pressure compared to those abundant representatives and could offer more robust information on micro-bial communities and ecosystems. For example, Lynch and Neufeld (2015) and Chen, Ding, et al. (2020) reviewed that rare microbial
F I G U R E 4 Characteristics of bacterial and fungal denitrifiers in the estuarine sediment in response to acidification. (a– c) Principal coordinates analysis (PCoA)– based Bray– Curtis distance showing the acidification impacts on the community structures of nirS- type and nirK- type bacterial denitrifiers, and nirK- type fungal denitrifiers. Fungal denitrifiers do not possess nirS gene. (d) Co- occurrence network analysis showing the shifts in keystone taxa of denitrifiers by acidification (p < .05 and r2 > .9). (e) Correlations between relative abundances of denitrifiers and N2O production rates at each pH level. (f) Relative abundances of denitrifying functional genes napA, narG, nirS, nirK, and nosZ in bacteria, and nirK in fungi. Different letters (a, b, c) represent the significant differences at each pH level (n = 6, Tukey, p < .05)
| 11SU et al.
taxa could act as an important contributor to evaluate microbial diversity and reflect multifunction of soil ecosystems. Some recent studies also documented that distinctive phylogenetic features of microorganisms were associated with rare taxa members of bacte-rial and fungal communities, despite lacking direct evidence for the relationship between the abundance of rare taxa and phylogenetic novelty (Elshahed et al., 2008; Galand et al., 2009). As part of micro-bial seed banks, nearly 1.5%– 28% of microorganisms are condition-ally rare taxa and can become dominant under several conditions (Chen, Ding, et al., 2020), such as algal blooms or acidification (Lynch & Neufeld, 2015). Our results demonstrated that acidification af-fected rare keystone taxa of denitrifiers and may therefore change N2O production pathways, indicating that rare- biosphere denitrifi-ers could exhibit disproportionately large influences on N cycling in estuarine sediments.
Denitrifying functional gene abundances were quantified at each pH level (Figure 4f). The bacterial gene napA- encoding periplasmic NO3
– reductase was detected only at pH 7.5. The relative abun-dances of narG encoding membrane- bound NO3
– reductase, nirS/nirK encoding NO2
– reductase, and nosZ encoding N2O reductase were all significantly reduced by acidification (p < .05). This prob-ably explains the accumulations of NO2
– and N2O under acidified
conditions at the end of the 60- h experiment. By comparison, the relative abundance of fungal nirK gene- encoding fungal NO2
– reduc-tase was decreased only at pH 5.0 (p < .05, Figure 4f).
3.4 | Electron transfer
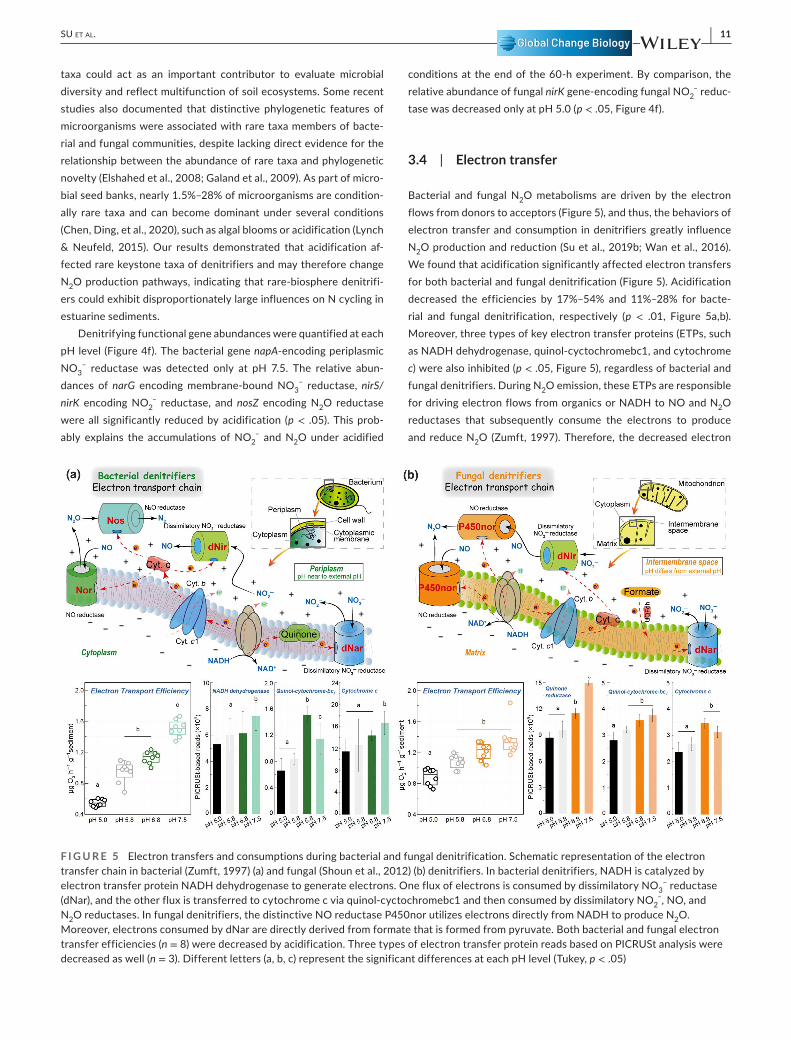
Bacterial and fungal N2O metabolisms are driven by the electron flows from donors to acceptors (Figure 5), and thus, the behaviors of electron transfer and consumption in denitrifiers greatly influence N2O production and reduction (Su et al., 2019b; Wan et al., 2016). We found that acidification significantly affected electron transfers for both bacterial and fungal denitrification (Figure 5). Acidification decreased the efficiencies by 17%– 54% and 11%– 28% for bacte-rial and fungal denitrification, respectively (p < .01, Figure 5a,b). Moreover, three types of key electron transfer proteins (ETPs, such as NADH dehydrogenase, quinol- cyctochromebc1, and cytochrome c) were also inhibited (p < .05, Figure 5), regardless of bacterial and fungal denitrifiers. During N2O emission, these ETPs are responsible for driving electron flows from organics or NADH to NO and N2O reductases that subsequently consume the electrons to produce and reduce N2O (Zumft, 1997). Therefore, the decreased electron
F I G U R E 5 Electron transfers and consumptions during bacterial and fungal denitrification. Schematic representation of the electron transfer chain in bacterial (Zumft, 1997) (a) and fungal (Shoun et al., 2012) (b) denitrifiers. In bacterial denitrifiers, NADH is catalyzed by electron transfer protein NADH dehydrogenase to generate electrons. One flux of electrons is consumed by dissimilatory NO3
– reductase (dNar), and the other flux is transferred to cytochrome c via quinol- cyctochromebc1 and then consumed by dissimilatory NO2
– , NO, and N2O reductases. In fungal denitrifiers, the distinctive NO reductase P450nor utilizes electrons directly from NADH to produce N2O. Moreover, electrons consumed by dNar are directly derived from formate that is formed from pyruvate. Both bacterial and fungal electron transfer efficiencies (n = 8) were decreased by acidification. Three types of electron transfer protein reads based on PICRUSt analysis were decreased as well (n = 3). Different letters (a, b, c) represent the significant differences at each pH level (Tukey, p < .05)
12 | SU et al.
transfer efficiency and the reduced ETPs abundances indicated that acidification directly disturbed bacterial and fungal electron transfer behaviors and then affected their N2O emissions in the estuarine sediments. Some distinctive characteristics existed in denitrify-ing metabolic pathways between bacterial and fungal denitrifiers (Figure 5a,b). In bacterial denitrifiers, the electron transfer chain locates in the cytoplasmic membrane. The produced NADH is cata-lyzed by ETP (NADH dehydrogenase) to generate electrons that are then consumed by NO and N2O reductases (Figure 5a; Li et al., 2016; Zumft, 1997). Importantly, unlike NO reductase (responsible for N2O production), N2O reductase (responsible for N2O reduction) is distributed in the periplasm (Su et al., 2019a; Zumft, 1997), and its activity could be disrupted more easily than NO reductase under acidified conditions (Liu et al., 2010; Pan et al., 2012). This means that the effect of acidification on N2O reduction is stronger than on N2O production, explaining the increased bacterial N2O emis-sion at the end of the experiment under acidified conditions (pH 5.0 and 5.8, Figure 1c) and thus promoting the contribution of bacterial source (Figure 2c). For fungi, however, the electron transfer chain lies in the membrane of the mitochondrion in fungal denitrifiers (Figure 5b), which may be less likely affected by acidification com-pared to bacteria. Nonetheless, fungal electron transfer efficiency and the activity of distinctive NO reductase- P450nor were also re-duced by acidification, leading to a decline in N2O production under acidified conditions (Figure 1c) and thus decreasing the contribution of fungal denitrification to N2O emission. These results explain the changes in the predominant pathways of N2O production between acidified and neutral conditions (Figure 2c).
In addition, we also found that the impacts of acidification on the electron transfers of bacterial denitrifiers were more prominent than those of fungal representatives (Figure 5). Besides different locations of the electron transfer chain, some other alternative ex-planations could also account for this different response to acidifi-cation. It is generally accepted that the bacterial- denitrifying system is only dedicated to energy harvest, whereas the fungal- denitrifying system could be coupled with other metabolic pathways, such as detoxification (Mothapo et al., 2015). Moreover, fungal denitrifiers have strong adaptation and metabolic capacity in a wide range of en-vironments, including acidic and alkaline conditions (Mothapo et al., 2015). These further explain that electron transfers of bacterial
denitrifiers are more burdensome and more easily disrupted than those in fungal denitrifiers. On the other hand, disturbance to proton H+ balance in denitrifiers may also be responsible for the different responses between bacteria and fungi. Acidification increases peri-plasmic H+ contents in bacterial denitrifiers and disrupts H+ balance between cytoplasm and periplasm, known as “proton motivation” that supports their denitrifying metabolism (Madigan & Martinko, 2006). By contrast, proton motivation between inner and outer mitochondrion of fungal denitrifiers is steadily relative to bacteria (Madigan & Martinko, 2006), and thus, fungal electron transfers are less affected by acidification.
4 | DISCUSSION
Ocean acidification in estuarine regions is becoming a global con-cern (Breider et al., 2019; Hurd et al., 2018; Kroeker et al., 2013). As summarized in Figure 6, our study indicates that ocean acidifica-tion disturbs microorganism- mediated N cycling and increases N2O flux from the estuarine region. Furthermore, based on our incuba-tion results, it is suggested that denitrification- derived N2O emis-sions would be stimulated by future ocean acidification. Because N2O can generate a 298- fold effect on global warming compared to CO2 (IPCC, 2013), the increased N2O emissions by acidification could potentially influence global climate change in estuaries. We further assessed N2O emission- based Global Warming Potential (GWPN2O
; Table S8) to evaluate the potential warming effect of N2O emission from the estuarine ecosystem (Chen et al., 2021; Guo et al., 2020). The GWPN2O
at pH 6.8 (in situ estuarine environment) was 0.68 g CO2 eq m– 2 day– 1, similar to those of soil ecosystems (0.05– 0.72 g CO2 eq m– 2 day– 1; Chen et al., 2021) but slightly higher than wetland sediments (0.30– 0.60 g CO2 eq m– 2 day– 1; Du et al., 2018). However, the GWPN2O
greatly increased to 2.15 g CO2 eq m– 2 day– 1 at pH 5.8, implying that acidification increases the estuarine warm-ing potential. Thus, our results indicate that actions to reduce anthropogenic- derived pollutants such as CO2 and N should be taken in the following decades. Otherwise, acidification could nega-tively affect biogeochemical cycling (e.g., C and N cycling), estuarine ecosystems, and human activities (Breider et al., 2019). It should be noted that although the estimation results of our mechanistic study
F I G U R E 6 Conceptual model of acidification impacts on denitrification- based N2O production in the estuarine sediment
| 13SU et al.
indicated an increasing N2O yield by acidification, large- scale field studies are warranted in order to extrapolate N2O fluxes in global estuarine ecosystems.
Based on the SP of N2O, acidification changed the production pathways of N2O (Figures 2 and 6). Our mass balance of N2O isotope highlighted that fungal denitrification was dominant under neutral conditions and the chemo- denitrification contribution cannot be overlooked in estuarine ecosystems. Thus, we suggest that fungal and chemical N2O sources may represent significant components when assessing N2O dynamics in aquatic ecosystems, particularly in regions with N- enriched pollution. Under acidified conditions, however, the major N2O production pathway shifted to a bacterial source. These results provide a better insight into field assessments of N2O flux under ocean acidification in estuarine ecosystems. The commonly observed dynamics of N2O may be comprised of a com-plex network of diverse contributions by biotic and abiotic pathways (Wankel et al., 2017). Our findings reiterate that these previously under- appreciated sources of N2O yields should be highlighted when assessing the impacts of acidification on the biogeochemical cycling of N in the future.
ACKNOWLEDG MENTSWe thank Professor James Prosser for the helpful comments on the manuscript. This project was funded by the Science Fund for Creative Research Groups of the National Natural Science Foundation of China (42021005), Natural Science Foundation of China (42003060), the Strategic Priority Research Program of Chinese Academy of Sciences (Y9IXD21A10), and the China Postdoctoral Science Foundation (2019M662253).
CONFLIC T OF INTERE S TThe authors declare no conflict of interest.
DATA AVAIL ABILIT Y S TATEMENTData are available from the corresponding author upon request.
ORCIDXiaoxuan Su https://orcid.org/0000-0001-6965-7084 Yong- guan Zhu https://orcid.org/0000-0003-3861-8482
R E FE R E N C E SBaggs, E. M. (2008). A review of stable isotope techniques for N2O source
partitioning in soils: Recent progress, remaining challenges and fu-ture considerations. Rapid Communications in Mass Spectrometry, 22, 1664– 1672. https://doi.org/10.1002/rcm.3456
Banerjee, S., Schlaeppi, K., & van der Heijden, M. G. A. (2018). Keystone taxa as drivers of microbiome structure and functioning. Nature Reviews Microbiology, 16, 567– 576. https://doi.org/10.1038/s4157 9- 018- 0024- 1
Bedmar, E. J., Robles, E. F., & Delgado, M. J. (2005). The complete de-nitrification pathway of the symbiotic, nitrogen- fixing bacterium Bradyrhizobium japonicum. Biochemical Society Transactions, 33, 141– 144. https://doi.org/10.1042/bst03 30141
Breider, F., Yoshikawa, C., Makabe, A., Toyoda, S., Wakita, M., Matsui, Y., Kawagucci, S., Fujiki, T., Harada, N., & Yoshida, N. (2019). Response
of N2O production rate to ocean acidification in the western North Pacific. Nature Climate Change, 9, 954– 958. https://doi.org/10.1038/s4155 8- 019- 0605- 7
Broberg, A. (1985). A modified method for studies of electron transport system activity in freshwater sediments. Hydrobiologia, 120, 181– 187. https://doi.org/10.1007/bf000 32140
Caporaso, J. G., Kuczynski, J., Stombaugh, J., Bittinger, K., Bushman, F. D., Costello, E. K., Fierer, N., Pena, A. G., Goodrich, J. K., Gordon, J. I., Huttley, G. A., Kelley, S. T., Knights, D., Koenig, J. E., Ley, R. E., Lozupone, C. A., McDonald, D., Muegge, B. D., Pirrung, M., … Knight, R. (2010). QIIME allows analysis of high- throughput com-munity sequencing data. Nature Methods, 7, 335– 336. https://doi.org/10.1038/nmeth.f.303
Chen, D., Yuan, X., Zhao, W., Luo, X., Li, F., & Liu, T. (2020). Chemodenitrification by Fe (II) and nitrite: pH effect, mineral-ization and kinetic modeling. Chemical Geology, 541. https://doi.org/10.1016/j.chemg eo.2020.119586
Chen, D., Zhou, Y., Xu, C., Lu, X., Liu, Y., Yu, S., & Feng, Y. (2021). Water- washed hydrochar in rice paddy soil reduces N2O and CH4 emis-sions: A whole growth period investigation. Environmental Pollution, 274, 116573. https://doi.org/10.1016/j.envpol.2021.116573
Chen, Q.- L., Ding, J., Zhu, D., Hu, H.- W., Delgado- Baquerizo, M., Ma, Y.- B., He, J.- Z., & Zhu, Y.- G. (2020). Rare microbial taxa as the major drivers of ecosystem multifunctionality in long- term fertilized soils. Soil Biology and Biochemistry, 141. https://doi.org/10.1016/j.soilb io.2019.107686
Cheung, Y. Y., Cheung, S., Mak, J., Liu, K., Xia, X., Zhang, X., Yung, Y., & Liu, H. (2021). Distinct interaction effects of warming and anthro-pogenic input on diatoms and dinoflagellates in an urbanized estua-rine ecosystem. Global Change Biology, 27, 3463– 3473. https://doi.org/10.1111/gcb.15667
Decock, C., & Six, J. (2013). How reliable is the intramolecular distribu-tion of N15 in N2O to source partition N2O emitted from soil? Soil Biology and Biochemistry, 65, 114– 127. https://doi.org/10.1016/j.soilb io.2013.05.012
Douglas, G. M., Maffei, V. J., Zaneveld, J. R., Yurgel, S. N., Brown, J. R., Taylor, C. M., Huttenhower, C., & Langille, M. G. I. (2020). PICRUSt2 for prediction of metagenome functions. Nature Biotechnology, 38, 685– 688. https://doi.org/10.1038/s4158 7- 020- 0548- 6
Du, Y., Pan, K., Yu, C., Luo, B., Gu, W., Sun, H., Min, Y., Liu, D., Geng, Y., Han, W., Chang, S. X., Liu, Y., Li, D., Ge, Y., & Chang, J. (2018). Plant diversity decreases net global warming potential integrating multiple functions in microcosms of constructed wetlands. Journal of Cleaner Production, 184, 718– 726. https://doi.org/10.1016/j.jclep ro.2018.02.273
Duan, H. R., Ye, L., Erler, D., Ni, B. J., & Yuan, Z. G. (2017). Quantifying ni-trous oxide production pathways in wastewater treatment systems using isotope technology— A critical review. Water Research, 122, 96– 113. https://doi.org/10.1016/j.watres.2017.05.054
Elshahed, M. S., Youssef, N. H., Spain, A. M., Sheik, C., Najar, F. Z., Sukharnikov, L. O., Roe, B. A., Davis, J. P., Schloss, P. D., Bailey, V. L., & Krumholz, L. R. (2008). Novelty and uniqueness patterns of rare mem-bers of the soil biosphere. Applied and Environmental Microbiology, 74, 5422– 5428. https://doi.org/10.1128/aem.00410 - 08
Feely, R. A., Sabine, C. L., Hernandez- Ayon, J. M., Ianson, D., & Hales, B. (2008). Evidence for upwelling of corrosive "acidified" water onto the continental shelf. Science, 320, 1490– 1492. https://doi.org/10.1126/scien ce.1155676
Frame, C. H., & Casciotti, K. L. (2010). Biogeochemical controls and iso-topic signatures of nitrous oxide production by a marine ammonia- oxidizing bacterium. Biogeosciences, 7, 2695– 2709. https://doi.org/10.5194/bg- 7- 2695- 2010
Fry, B. (2006). Stable isotope ecology. Springer Science & Business Media.Galand, P. E., Casamayor, E. O., Kirchman, D. L., & Lovejoy, C. (2009).
Ecology of the rare microbial biosphere of the Arctic Ocean.
Proceedings of the National Academy of Sciences of the United States of America, 106, 22427– 22432. https://doi.org/10.1073/pnas.09082 84106
Gao, D. Z., Hou, L. J., Liu, M., Li, X. F., Zheng, Y. L., Yin, G. Y., Wu, D. M., Yang, Y., Han, P., Liang, X., & Dong, H. P. (2020). Mechanisms respon-sible for N2O emissions from intertidal soils of the Yangtze Estuary. Science of the Total Environment, 716. https://doi.org/10.1016/j.scito tenv.2020.137073
Grossart, H. P., Van den Wyngaert, S., Kagami, M., Wurzbacher, C., Cunliffe, M., & Rojas- Jimenz, K. (2019). Fungi in aquatic ecosystems. Nature Reviews Microbiology, 17, 339– 354. https://doi.org/10.1038/s4157 9- 019- 0175- 8
Guo, F., Zhang, J., Yang, X., He, Q., Ao, L., & Chen, Y. (2020). Impact of biochar on greenhouse gas emissions from constructed wetlands under various influent chemical oxygen demand to nitrogen ra-tios. Bioresource Technology, 303. https://doi.org/10.1016/j.biort ech.2020.122908
Heil, J., Wolf, B., Brüggemann, N., Emmenegger, L., Tuzson, B., Vereecken, H., & Mohn, J. (2014). Site- specific 15N isotopic signatures of abiot-ically produced N2O. Geochimica et Cosmochimica Acta, 139, 72– 82. https://doi.org/10.1016/j.gca.2014.04.037
Hu, H. W., Chen, D., & He, J. Z. (2015). Microbial regulation of terrestrial nitrous oxide formation: Understanding the biological pathways for prediction of emission rates. FEMS Microbiology Ecology, 39, 729– 749. https://doi.org/10.1093/femsr e/fuv021
Humbert, G., Sebilo, M., Fiat, J., Lang, L. Q., Filali, A., Vaury, V., Sperandio, M., & Laverman, A. M. (2020). Isotopic evidence for alteration of nitrous oxide emissions and producing pathways’ contribution under nitrifying conditions. Biogeosciences, 17, 979– 993. https://doi.org/10.5194/bg- 17- 979- 2020
Hurd, C. L., Lenton, A., Tilbrook, B., & Boyd, P. W. (2018). Current un-derstanding and challenges for oceans in a higher- CO2 world. Nature Climate Change, 8, 686– 694. https://doi.org/10.1038/s4155 8- 018- 0211- 0
IPCC. (2013). Climate change 2013: The physical science basis (p. 153). Cambridge University Press.
Joint, I., Doney, S. C., & Karl, D. M. (2011). Will ocean acidification affect marine microbes? The ISME Journal, 5, 1– 7. https://doi.org/10.1038/ismej.2010.79
Jones, L. C., Peters, B., Pacheco, J. S. L., Casciotti, K. L., & Fendorf, S. (2015). Stable isotopes and iron oxide mineral products as markers of chemodenitrification. Environmental Science & Technolology, 49, 3444– 3452. https://doi.org/10.1021/es504 862x
Jung, M.- Y., Gwak, J.- H., Rohe, L., Giesemann, A., Kim, J.- G., Well, R., Madsen, E. L., Herbold, C. W., Wagner, M., & Rhee, S.- K. (2019). Indications for enzymatic denitrification to N2O at low pH in an ammonia- oxidizing archaeon. The ISME Journal, 13, 2633– 2638. https://doi.org/10.1038/s4139 6- 019- 0460- 6
Kobayashi, M., Matsuo, Y., Takimoto, A., Suzuki, S., Maruo, F., & Shoun, H. (1996). Denitrification, a novel type of respiratory metabolism in fungal mitochondrion. Journal of Biological Chemistry, 271, 16263– 16267. https://doi.org/10.1074/jbc.271.27.16263
Koch, M., Bowes, G., Ross, C., & Zhang, X. H. (2013). Climate change and ocean acidification effects on seagrasses and marine macroalgae. Global Change Biology, 19, 103– 132. https://doi.org/10.1111/j.1365- 2486.2012.02791.x
Kroeker, K. J., Kordas, R. L., Crim, R., Hendriks, I. E., Ramajo, L., Singh, G. S., Duarte, C. M., & Gattuso, J. P. (2013). Impacts of ocean acidifica-tion on marine organisms: Quantifying sensitivities and interaction with warming. Global Change Biology, 19, 1884– 1896. https://doi.org/10.1111/gcb.12179
Langille, M. G. I., Zaneveld, J., Caporaso, J. G., McDonald, D., Knights, D., Reyes, J. A., Clemente, J. C., Burkepile, D. E., Thurber, R. L. V., Knight, R., Beiko, R. G., & Huttenhower, C. (2013). Predictive func-tional profiling of microbial communities using 16S rRNA marker
Laughlin, R. J., & Stevens, R. J. (2002). Evidence for fungal dominance of denitrification and codenitrification in a grassland soil. Soil Science Society of America Journal, 66, 1540– 1548. https://doi.org/10.2136/sssaj 2002.1540
Lee, Y. H., Kang, H.- M., Kim, M.- S., Wang, M., Kim, J. H., Jeong, C.- B., & Lee, J.- S. (2019). Effects of ocean acidification on life parameters and antioxidant system in the marine copepod Tigriopus japonicus. Aquatic Toxicology, 212, 186– 193. https://doi.org/10.1016/j.aquat ox.2019.05.007
Lewicka- Szczebak, D., Augustin, J., Giesemann, A., & Well, R. (2017). Quantifying N2O reduction to N2 based on N2O isotopocules – Validation with independent methods (helium incubation and 15N gas flux method). Biogeosciences, 14, 711– 732. https://doi.org/10.5194/bg- 14- 711- 2017
Li, M., Su, Y. L., Chen, Y. G., Wan, R., Zheng, X., & Liu, K. (2016). The effects of fulvic acid on microbial denitrification: Promotion of NADH generation, electron transfer, and consumption. Applied Microbiology and Biotechnology, 100, 5607– 5618. https://doi.org/10.1007/s0025 3- 016- 7383- 1
Liu, B., Morkved, P. T., Frostegard, A., & Bakken, L. R. (2010). Denitrification gene pools, transcription and kinetics of NO, N2O and N2 produc-tion as affected by soil pH. FEMS Microbiology Ecology, 72, 407– 417. https://doi.org/10.1111/j.1574- 6941.2010.00856.x
Lynch, M. D. J., & Neufeld, J. D. (2015). Ecology and exploration of the rare biosphere. Nature Reviews Microbiology, 13, 217– 229. https://doi.org/10.1038/nrmic ro3400
Madigan, M. T., & Martinko, J. M. (2006). Brock biology of microorganisms. Pearson Education.
Maeda, K., Spor, A., Edel- Hermann, V., Heraud, C., Breuil, M.- C., Bizouard, F., Toyoda, S., Yoshida, N., Steinberg, C., & Philippot, L. (2015). N2O production, a widespread trait in fungi. Scientific Reports, 5. https://doi.org/10.1038/srep0 9697
Maeda, K., Toyoda, S., Philippot, L., Hattori, S., Nakajima, K., Ito, Y., & Yoshida, N. (2017). Relative contribution of nirK- and nirS- bacterial denitrifiers as well as fungal denitrifiers to nitrous oxide production from dairy manure compost. Environmental Science & Technology, 51, 14083– 14091. https://doi.org/10.1021/acs.est.7b04017
McTigue, N. D., Gardner, W. S., Dunton, K. H., & Hardison, A. K. (2016). Biotic and abiotic controls on co- occurring nitrogen cycling pro-cesses in shallow Arctic shelf sediments. Nature Communications, 7, 1– 11. https://doi.org/10.1038/ncomm s13145
Mothapo, N., Chen, H., Cubeta, M. A., Grossman, J. M., Fuller, F., & Shi, W. (2015). Phylogenetic, taxonomic and functional diversity of fun-gal denitrifiers and associated N2O production efficacy. Soil Biology and Biochemistry, 83, 160– 175. https://doi.org/10.1016/j.soilb io.2015.02.001
Nagashima, S., Kamimura, A., Shimizu, T., Nakamura- Isaki, S., Aono, E., Sakamoto, K., Ichikawa, N., Nakazawa, H., Sekine, M., Yamazaki, S., Fujita, N., Shimada, K., Hanada, S., & Nagashima, K. V. P. (2012). Complete genome sequence of phototrophic Betaproteobacterium Rubrivivax gelatinosus IL144. Journal of Bacteriology, 194, 3541– 3542. https://doi.org/10.1128/jb.00511 - 12
Ostrom, N. E., Pitt, A., Sutka, R., Ostrom, P. H., Grandy, A. S., Huizinga, K. M., & Robertson, G. P. (2007). Isotopologue effects during N2O reduction in soils and in pure cultures of denitrifiers. Journal of Geophysical Research- Biogeosciences, 112, 1– 12. https://doi.org/10.1029/2006j g000287
Pan, Y., Ye, L., Ni, B.- J., & Yuan, Z. (2012). Effect of pH on N2O reduc-tion and accumulation during denitrification by methanol uti-lizing denitrifiers. Water Research, 46, 4832– 4840. https://doi.org/10.1016/j.watres.2012.06.003
Pettay, D. T., Gonski, S. F., Cai, W.- J., Sommerfield, C. K., & Ullman, W. J. (2020). The ebb and flow of protons: A novel approach for the
assessment of estuarine and coastal acidification. Estuarine Coastal and Shelf Science, 236. https://doi.org/10.1016/j.ecss.2020.106627
Rees, A. P., Brown, I. J., Jayakumar, A., & Ward, B. B. (2016). The inhibition of N2O production by ocean acidification in cold temperate and polar waters. Deep- Sea Research Part II- Topical Studies in Oceanography, 127, 93– 101. https://doi.org/10.1016/j.dsr2.2015.12.006
Rittmann, B. E., & McCarty, P. L. (2001). Environmental biotechnology: Principles and applications. McGraw- Hill.
Rohe, L., Well, R., & Lewicka- Szczebak, D. (2017). Use of oxygen iso-topes to differentiate between nitrous oxide produced by fungi or bacteria during denitrification. Rapid Communications in Mass Spectrometry, 31, 1297– 1312. https://doi.org/10.1002/rcm.7909
Rousk, J., Baath, E., Brookes, P. C., Lauber, C. L., Lozupone, C., Caporaso, J. G., Knight, R., & Fierer, N. (2010). Soil bacterial and fungal com-munities across a pH gradient in an arable soil. The ISME Journal, 4, 1340– 1351. https://doi.org/10.1038/ismej.2010.58
Samarkin, V. A., Madigan, M. T., Bowles, M. W., Casciotti, K. L., Priscu, J. C., McKay, C. P., & Joye, S. B. (2010). Abiotic nitrous oxide emis-sion from the hypersaline Don Juan Pond in Antarctica. Nature Geoscience, 3, 341– 344. https://doi.org/10.1038/ngeo847
Seo, D. C., & DeLaune, R. D. (2010). Fungal and bacterial mediated denitrification in wetlands: Influence of sediment redox condi-tion. Water Research, 44, 2441– 2450. https://doi.org/10.1016/j.watres.2010.01.006
Shoun, H., Fushinobu, S., Jiang, L., Kim, S. W., & Wakagi, T. (2012). Fungal denitrification and nitric oxide reductase cytochrome P450nor. Philosophical Transactions of the Royal Society B- Biological Sciences, 367, 1186– 1194. https://doi.org/10.1098/rstb.2011.0335
Shoun, H., & Tanimoto, T. (1991). Denitrification by the fungus Fusarium Oxysporum and involvement of cytochrome- p450 in the respiratory nitrite reduction. Journal of Biological Chemistry, 266, 11078– 11082. https://doi.org/10.1016/S0021 - 9258(18)99130 - 1
Su, X., Chen, Y., Wang, Y., Yang, X., & He, Q. (2019a). Impacts of chloro-thalonil on denitrification and N2O emission in riparian sediments: Microbial metabolism mechanism. Water Research, 148, 188– 197. https://doi.org/10.1016/j.watres.2018.10.052
Su, X. X., Chen, Y., Wang, Y. Y., Yang, X. Y., & He, Q. (2019b). Disturbances of electron production, transport and utilization caused by chlo-rothalonil are responsible for the deterioration of soil denitrifi-cation. Soil Biology and Biochemistry, 134, 100– 107. https://doi.org/10.1016/j.soilb io.2019.03.024
Su, X., Yang, X., Li, H., Wang, H., Wang, Y., Xu, J., Ding, K., & Zhu, Y.- G. (2021). Bacterial communities are more sensitive to ocean acid-ification than fungal communities in estuarine sediments. FEMS Microbiology Ecology, https://doi.org/10.1093/femse c/fiab058
Sun, X., Jayakumar, A., Tracey, J. C., Wallace, E., Kelly, C. L., Casciotti, K. L., & Ward, B. B. (2020). Microbial N2O consumption in and above marine N2O production hotspots. The ISME Journal, 15, 1434– 1444. https://doi.org/10.1038/s4139 6- 020- 00861 - 2
Sutka, R. L., Adams, G. C., Ostrom, N. E., & Ostrom, P. H. (2008). Isotopologue fractionation during N2O production by fungal de-nitrification. Rapid Communications in Mass Spectrometry, 22, 3989– 3996. https://doi.org/10.1002/rcm.3820
Sutka, R. L., Ostrom, N. E., Ostrom, P. H., Breznak, J. A., Gandhi, H., Pitt, A. J., & Li, F. (2006). Distinguishing nitrous oxide production from nitrification and denitrification on the basis of isotopomer abundances. Applied and Environmental Microbiology, 72, 638– 644. https://doi.org/10.1128/aem.72.1.638- 644.2006
Tan, E. H., Zou, W. B., Zheng, Z. Z., Yan, X. L., Du, M. G., Hsu, T. C., Tian, L., Middelburg, J. J., Trull, T. W., & Kao, S. J. (2020). Warming stim-ulates sediment denitrification at the expense of anaerobic ammo-nium oxidation. Nature Climate Change, 10, 349– 357. https://doi.org/10.1038/s4155 8- 020- 0723- 2
Tian, H., Xu, R., Canadell, J. G., Thompson, R. L., Winiwarter, W., Suntharalingam, P., Davidson, E. A., Ciais, P., Jackson, R. B., Janssens- Maenhout, G., Prather, M. J., Regnier, P., Pan, N., Pan,
S., Peters, G. P., Shi, H., Tubiello, F. N., Zaehle, S., Zhou, F., … Yao, Y. (2020). A comprehensive quantification of global nitrous oxide sources and sinks. Nature, 586, 248. https://doi.org/10.1038/s4158 6- 020- 2780- 0
Toyoda, S., Mutobe, H., Yamagishi, H., Yoshida, N., & Tanji, Y. (2005). Fractionation of N2O isotopomers during production by denitri-fier. Soil Biology and Biochemistry, 37, 1535– 1545. https://doi.org/10.1016/j.soilb io.2005.01.009
Toyoda, S., Yoshida, N., & Koba, K. (2017). Isotopocule analysis of bi-ologically produced nitrous oxide in various environments. Mass Spectrometry Reviews, 36, 135– 160. https://doi.org/10.1002/mas.21459
Toyoda, S., Yoshida, N., Miwa, T., Matsui, Y., Yamagishi, H., Tsunogai, U., Nojiri, Y., & Tsurushima, N. (2002). Production mechanism and global budget of N2O inferred from its isotopomers in the west-ern North Pacific. Geophysical Research Letters, 29. https://doi.org/10.1029/2001g l014311
Uchimura, H., Enjoji, H., Seki, T., Taguchi, A., Takaya, N., & Shoun, H. (2002). Nitrate reductase- formate dehydrogenase couple involved in the fungal denitrification by Fusarium oxysporum. Journal of Biochemistry, 131, 579– 586. https://doi.org/10.1093/oxfor djour nals.jbchem.a003137
Velvis, H. (1997). Evaluation of the selective respiratory inhibition method for measuring the ratio of fungal:bacterial activity in acid agricultural soils. Biology and Fertility of Soils, 25, 354– 360. https://doi.org/10.1007/s0037 40050325
Vial, L., Lavire, C., Mavingui, P., Blaha, D., Haurat, J., Moenne- Loccoz, Y., Bally, R., & Wisniewski- Dye, F. (2006). Phase variation and genomic architecture changes in Azospirillum. Journal of Bacteriology, 188, 5364– 5373. https://doi.org/10.1128/jb.00521 - 06
Waldbusser, G. G., Voigt, E. P., Bergschneider, H., Green, M. A., & Newell, R. I. E. (2011). Biocalcification in the eastern oyster (Crassostrea virginica) in relation to long- term trends in Chesapeake bay pH. Estuaries and Coasts, 34, 221– 231. https://doi.org/10.1007/s1223 7- 010- 9307- 0
Wan, R., Chen, Y. G., Zheng, X., Su, Y. L., & Li, M. (2016). Effect of CO2 on microbial denitrification via inhibiting electron transport and consumption. Environmental Science & Technology, 50, 9915– 9922. https://doi.org/10.1021/acs.est.5b05850
Wang, S. Y., Pi, Y. X., Jiang, Y. Y., Pan, H. W., Wang, X. X., Wang, X. M., Zhou, J. M., & Zhu, G. B. (2020). Nitrate reduction in the reed rhizo-sphere of a riparian zone: From functional genes to activity and con-tribution. Environmental Research, 180. https://doi.org/10.1016/j.envres.2019.108867
Wang, S. Y., Pi, Y. X., Song, Y. P., Jiang, Y. Y., Zhou, L. G., Liu, W. Y., & Zhu, G. B. (2020). Hotspot of dissimilatory nitrate reduction to ammonium (DNRA) process in freshwater sediments of riparian zones. Water Research, 173. https://doi.org/10.1016/j.watres.2020.115539
Wankel, S. D., Ziebis, W., Buchwald, C., Charoenpong, C., de Beer, D., Dentinger, J., Xu, Z., & Zengler, K. (2017). Evidence for fun-gal and chemodenitrification based N2O flux from nitrogen im-pacted coastal sediments. Nature Communications, 8. https://doi.org/10.1038/ncomm s15595
Wannicke, N., Frey, C., Law, C. S., & Voss, M. (2018). The response of the marine nitrogen cycle to ocean acidification. Global Change Biology, 24, 5031– 5043. https://doi.org/10.1111/gcb.14424
Watmough, N. J., Field, S. J., Hughes, R. J. L., & Richardson, D. J. (2009). The bacterial respiratory nitric oxide reductase. Biochemical Society Transactions, 37, 392– 399. https://doi.org/10.1042/bst03 70392
Wei, J., Ibraim, E., Bruggemann, N., Vereecken, H., & Mohn, J. (2019). First real- time isotopic characterisation of N2O from chemodenitri-fication. Geochimica et Cosmochimica Acta, 267, 17– 32. https://doi.org/10.1016/j.gca.2019.09.018
Wu, D., Fu, M., & Ma, L. (2012). Nitrous oxide emission and control in biological and chemical denitrification. Progress in Chemistry (in Chinese), 24, 2054– 2061.
Yu, L., Harris, E., Lewicka- Szczebak, D., Barthel, M., Blomberg, M. R. A., Harris, S. J., Johnson, M. S., Lehmann, M. F., Liisberg, J., Müller, C., Ostrom, N. E., Six, J., Toyoda, S., Yoshida, N., & Mohn, J. (2020). What can we learn from N2O isotope data? – Analytics, processes and modelling. Rapid Communications in Mass Spectrometry, 34, e8858. https://doi.org/10.1002/rcm.8858
Zheng, B., Zhu, Y., Sardans, J., Penuelas, J., & Su, J. (2018). QMEC: A tool for high- throughput quantitative assessment of microbial func-tional potential in C, N, P, and S biogeochemical cycling. Science China- Life Sciences, 61, 1451– 1462. https://doi.org/10.1007/s1142 7- 018- 9364- 7
Zhong, Z., Lemke, R. L., & Nelson, L. M. (2009). Nitrous oxide emissions associated with nitrogen fixation by grain legumes. Soil Biology and Biochemistry, 41, 2283– 2291. https://doi.org/10.1016/j.soilb io.2009.08.009
Zou, Y., Hirono, Y., Yanai, Y., Hattori, S., Toyoda, S., & Yoshida, N. (2014). Isotopomer analysis of nitrous oxide accumulated in soil cultivated with tea (Camellia sinensis) in Shizuoka, central Japan. Soil Biology and Biochemistry, 77, 276– 291. https://doi.org/10.1016/j.soilb io.2014.06.016
Zumft, W. G. (1997). Cell biology and molecular basis of denitrification. Microbiology and Molecular Biology Reviews, 61, 533– 616. https://doi.org/10.1128/.61.4.533- 616.1997
SUPPORTING INFORMATIONAdditional supporting information may be found online in the Supporting Information section.
How to cite this article: Su, X., Wen, T., Wang, Y., Xu, J., Cui, L., Zhang, J., Xue, X., Ding, K., Tang, Y., & Zhu, Y.- G. (2021). Stimulation of N2O emission via bacterial denitrification driven by acidification in estuarine sediments. Global Change Biology, 00, 1– 16. https://doi.org/10.1111/gcb.15863