298
Research Reactor Utilization, Safety, Decommissioning, Fuel and Waste Management Posters of an international conference 10–14 November 2003 Santiago, Chile

Research Reactor Utilization, Safety,Decommissioning, Fuel andWaste ManagementPosters of an international conference10–14 November 2003Santiago, Chile

The photograph, on which the cover is based, was taken by George Munro.

LIST OF POSTERS
RESEARCH REACTOR SAFETY (Poster Session I)
Licensing Progammes for Research Reactors and Critical Assemblies Personnel (IAEA-CN-100/6P) ............................................................................................................. 3
C.D. Perrin, S. Canevese
Electronic Data Acquisition System in RA-0, RA-1, RA-3 and RA-6 Nuclear Research Reactors (IAEA-CN-100/24P) ............................................................................................ 8
C.A. Murúa, P.S. Cantero
Delay Neutron Fraction in Low Enrichment Nuclear Fuel, Calculation for RA-3 Reactor Case (IAEA-CN-100/28P) ................................................. 21
G. Estryk
RA-3 Reactor Power Increase to 10 MW (IAEA-CN-100/29P) ........................................ 25 J.A. Quintana Dominguez, P.A. Cataldi
Application of Cambell’s Method to a Wide Range Neutron Flux Channel Measuring System (IAEA-CN-100/31P) ........................................................................... 30
L.M. Giuliodori, E. Matatagui, M. Milberg, S. Thorp, J. Zalcman
Optimization of Safety System Test Frequencies (IAEA-CN-100/54P) ............................ 39 D.J. Winfield, C.A. Alsop
Improving the Balance between Operator Responsibility and Safety Authority Control for Research Facilities (IAEA-CN-100/71P) ........................................ 48
C. Eybert-Prudhomme, J. Avérous
Investigation on Control Rod Interaction in a Conceptual MTR-Type Reactor (IAEA-CN-100/90P) ........................................................................................................... 55
T. Taryo, Prayoto, Muslim, R. Nabbi
Research Reactors in Kazakhstan: Conditions, Safety and Utilization (IAEA-CN-100/98P) ……………………………………………………………………... 65
S. Talanov
Some Issues on the Licence for the Design and Operation of a Research Reactor (IAEA-CN-100/100P) ........................................................................................................ 66
C. Park, H.T. Chae, B.J. Jun, H. Kim, H.R. Kim
Regulating the Salaspils Research Reactor: Management of Extended Shutdown (IAEA-CN-100/103P) ........................................................................................................ 72
A. Ozols
Training of Operators in the Portuguese Research Reactor (IAEA-CN-100/113P) .......... 77 J.G. Marques, F.M. Cardeira, A.J.G. Ramalho
Development of a Diverse Secondary Shutdown System for a Low Power Research Reactor (IAEA-CN-100/133P) ........................................................................... 81
D.S. Bond, S.J. Franklin, N.J. Chapman, H.J. Phillips, Y. Askan
Simulation of the Syrian Miniature Neutron Source Reactor for Training Operators on the Analysis of its Anticipated Operational Accidents (IAEA-CN-100/139P) ............. 92
I. Khamis
Recent Licensing Activities on the TR-2 Research Reactor (IAEA-CN-100/140P) .......... 98 S. Alten

RESEARCH REACTOR UTILIZATION (Poster Session II)
The Research Reactor as a Tool in the 'Master in Nuclear Reactors' in Argentina (IAEA-CN-100/3P) ............................................................................................................. 101
C. Notari
Monte Carlo with Burn-up Calculation Method for Research Reactors (IAEA-CN-100/4P) ............................................................................................................. 106
F. Leszczynski
A CNS Calculation Line Based on a Monte-Carlo Method (IAEA-CN-100/11P) ............. 117 C. Lecot, D.F. Hergenreder, O.P. Lovotti
MCNP Design of High Performance NTD Facilities (IAEA-CN-100/13P) ....................... 122 D.F. Hergenreder, E.A. Villario
ANSTO RRR Simulator for Operating Personnel Training (IAEA-CN-100/16P) ............. 126 A. Etchepareborda, C.A. Flury, F. Lema, F.Maciel, N. De Lorenzo, R.C. Cervieri, D. Alegrechi, G. Ibarra, M. Muguiro, M. Giménez, M. Schlamp, A. Vertullo
Providing the Infrastructure for a BNCT Hiperthermal Neutron Beam (IAEA-CN-100/19P) ........................................................................................................... 137
N.A.Rico, R. Juracich
The Prompt Gamma Neutron Activation Analysis Facility at the RA-6 Reactor of the Bariloche Atomic Centre, Argentina (IAEA-CN-100/21P) ................................................ 143
F.A. Sanchez, O. Calzetta, H. Blaumann
Using the RA-6 Reactor for Medical Research and Clinical Trials: The BNCT Hiperthermal Neutron Beam (IAEA-CN-100/22P) ......................................... 149
H. Blaumann, O.Calzetta Larrieu, J. Longhino, S. González, G. Santa Cruz, M.A. Dagrosa, M. Pisarev, E. Kreimann, A. Schwint, M. Viaggi
Approach to Development of a High Flux Research Reactor with Pebble-Bed Core (IAEA-CN-100/38P) ........................................................................................................... 156
A.A. Mikhalevich, V.T. Kazazyan, D.I. Zhvirblya
Thermal-Hydraulic Design of a Fuel Mini-Plate Irradiator for the IEA-R1 Research Reactor (IAEA-CN-100/49P) .......................................…………......... 166
W.M. Torres, P.E. Umbehaun, D. A. Andrade, M. Yamaguchi, J. A. B. Souza
Utilization of the IEA-R1 reactor for DNA irradiation (IAEA-CN-100/57P) …………… 171 M.R. Gual, A. Deppman, O.R. Hoyos, P.R.P.Coelho, P.T.D.Siqueira
Experimental research reactor LVR-15: operation and use (IAEA-CN-100/60P) ………. 177 J. Kysela, V. Broz, O. Erben, R. Vsolak, M. Zmitko, P. Novosad
Experiments of CNF and ONB in a Finned Rod Bundle Under Low Flow and Low Pressure Conditions (IAEA-CN-100/101P) ........................................................................ 182
H.T.Chae, H. Kim, C. Park, S.J. Park, G.Y. Han
A Fast Neutron Irradiation Facility at the Portuguese Research Reactor (IAEA-CN-100/112P) ......................................................................................................... 191
J.G. Marques, N.P. Barradas, A.C. Fernandes, I.C. Gonçalves, A.J.G. Ramalho
Optimizing the Neutron Diffractometers Configurations (IAEA-CN-100/115P) .......…... 197 I. Ionita

The Resolution Function for a Pulsed-Source TOF Neutron Spectrometer with Mechanical Monochromator (IAEA-CN-100/116P) ......................................................... 202
I. Ionita
Utilization of Research and Training Reactors in the Study Programme of Students at the Slovak University of Technology (IAEA-CN-100/126P) .................................................. 208
J. Lipka, V. Slugen, J. Hascik, M. Miglierini
RESEARCH REACTOR DECOMMISSIONING, FUEL AND WASTE MANAGEMENT (Poster Session III)
Radiological Characterization of the Triton Facility Prior to Stage-3 Decommissioning (IAEA-CN-100/74P) .......................................................................................................... 215
E. Lopes, J. Gaudiau, D. Dubot, L. Pillette-Cousin
Decommissioning of the Prototype Fast Breeder Reactor KNK in Germany (IAEA-CN-100/77P) .......................................................................................................... 219
K. Brockmann, W. Pfeifer, I. Hillebrand
Corrosion Monitoring of Aluminium Alloys in the TRIGA IPR-R1 Research Reactor (IAEA-CN-100/40P) ........................................................................................................... 229
C.F.C. Neves, M.M.A.M. Schvartzman, W.R.C. Campos, N.N. Atanazio Filho
Shielding and Criticality Safety Analyses of a Latin American Cask for Transportation and Interim Storage of Spent Fuel from Research Reactors (IAEA-CN-100/42P) ............ 239
H.M. Dalle, E.B. Tambourgi
Development of MTR-Type Fuel Using UO2 Microspheres Dispersed in Stainless Steel (IAEA-CN-100/46P) .......................................................................................................... 248
W.B. Ferraz, D.M. Braga, J.B. de Paula, A. Santos
Benchmark Measurements and Calculations of U3Si2-Al MTR Fuel Plates with Burned Fuel (IAEA-CN-100/50P) ............................................................................. 254
H.M. Dalle, G.R. Ruggirello, G. Estryk, A. Stankevicius, D.A. Gil, J.A. Quintana, M. Sanchez, C.A. Devida, E.B. Tambourgi, T. Cuya, R. Jeraj, J. Medel, O. Mutis
Fuel Burn-up Measurements Using Gamma Spectrometry Technique (IAEA-CN-100/56P) .......................................................................................................... 270
C. Pereda, C. Henríquez, J. Medel, J.Klein, G. Navarro
FiR1 Reactor and the Plans for the Spent Fuel Management (IAEA-CN-100/68P) .......... 278 S.E.J. Salmenhaara
Maintenance Programme for a Safe Prolonged Wet Storage of the Nuclear Spent Fuel at IFIN-HH Bucharest-Magurele Site (IAEA-CN-100/114P) ............................................ 282
C.A. Dragolici, A. Zorliu, C. Petran, I. Mincu, G. Neacsu
Control Rod Effect on Correlation of 95Nb/95Cr and Cooling Time (IAEA-CN-100/138P) ......................................................................................................... 290
K. Haddad

POSTER SESSIONS


IAEA-CN-100/6P
Licensing Programmes for Research Reactors and Critical Assemblies Personnel C.D. Perrin, S. Canavese Research Reactor and Critical Assemblies, Nuclear Regulatory Authority, Argentina
Abstract. The Argentinean Nuclear Regulatory Authority (ARN) has established, in its norms of licensing for personnel of facilities Class I, two separate stages: the obtaining of an Individual License and the obtaining of the Specific Authorization. The Individual License requires the approval of an examination on general theoretical knowledge, and the Specific Authorization requires the approval of an examination on the installation and the tasks for witch it is asked for. Because the ARN has among its functions the one to participate in the evaluation of the people and to grant these Licenses and Authorizations, it decided to define, in consultation with the specialists of the facilities, thematic programmes for the obtaining of Licenses and Specific Authorizations in all the specified functions. The formulation of this programme required the definition of technical knowledge and skills necessary to fulfill each one of the specified functions in research reactors and critical assemblies. This programme has, as an added value, the definition of the base for the qualification programmes and training of the personnel. In order to establish a certain logical ordering, four subjects were defined in case of Licenses (Reactor Engineering, Documentation and Standards, Radiological Safety, Nuclear Safety) and three subjects in case of Specific Authorizations (Manuals and Procedures, Plant Knowledge, Normal and Emergencies Tasks). On the other hand, in addition to the listing of the corresponding subjects, it was necessary to define levels of depth for each of the item mentioned. This paper describes the criteria and conclusions of the work developed for the preparation of the thematic programme for the obtaining of Licenses and Specific Authorization of the personnel with specified functions of research reactors and critical assemblies. The paper is completed with the example of a programme for some specified functions of a generic reactor.
1. Introduction The Nuclear Regulatory Authority (ARN) was established as an autonomous body reporting to the President of Argentina by Act 24,804 known as the Nuclear Activity National Act, which came into force on April 25, 1997, and is empowered to regulate and control the nuclear activity with regard to radiation and nuclear safety, physical protection and nuclear non-proliferation issues. It must also advise the Executive on issues under its purview.
The objective of the Nuclear Regulatory Authority is to establish, develop and enforce a regulatory system applicable to all nuclear activities carried out in Argentina. The goals of this regulatory system are:
• To provide an appropriate standard of protection for individuals against the harmful effects of ionizing radiation.
• To maintain a reasonable degree of radiological and nuclear safety in the nuclear activities performed in Argentina.
• To ensure that nuclear activities are not developed with purposes un-authorized by the law and regulations resulting therefrom, as well as by the international agreements and the non-proliferation policies adopted by Argentina.
• To prevent the commission of intentional actions which may either have severe radiological consequences or lead to the un-authorized removal of nuclear materials or other materials or equipment subject to control.
3

IAEA-CN-100/6P
With respect to personnel licencing, the ARN is able to grant, suspend and revoke licenses, permissions or authorizations of the personnel of radioactive and nuclear facilities.
As far as the licensing process is concerned, facilities are divided, according to the associated radiological risk and the technological complexity involved, into Type I, II or III facilities (previously classified as major and minor facilities). For Type I and II facilities, the ARN grants operation licences, while for Type III facilities the ARN has a registration system.
The facilities Class I, also called Relevant Facilities include the following sub-classes:
Nuclear power plants Research reactors Critical assemblies Particle accelerators with E>1 MeV Radioisotope or radioactive source production plants High-dose irradiation plants Facilities pertaining to nuclear fuel cycle Wastes plants.
This group of facilities has the following specific norms referred to personnel licensing:
• AR 0.11.1. Licensing of personnel of Type I installations • AR 0.11.2. Psychophysical aptitude requirements for specific authorizations • AR 0.11.3. Retraining of personnel of Type I installations Personnel of Class I facilities occupying positions with significant influence on safety shall hold both, Individual Licences and Specific Authorizations.
The Individual License is a certificate granted by Regulatory Authority, after a formal evaluation, by which is recognized the scientist-technique qualification of an individual in order to perform an specific position in an Class I installation. This certificate has limitless validity.
The Specific Authorizations is another certificate granted by Regulatory Authority, after a formal evaluation, by which is recognized specific knowledge of the facility in question, suitably training for the particular job and an adequate psychophysical fitness. This certificate has limited validity, usually two years, conditional to the fulfilment of the annual retraining.
Based on the upper regulatory responsibilities, the ARN decides to define, with a certain degree of precision, the programmes on which the evaluations would be based. With this purpose a work group was constituted, co-ordinated by the ARN and with the participation of all those responsible for the reactor.
The project was developed during 2002 (for specific authorizations) and 2003 (for individual licences) and consisted in successive partial meetings between the co-ordinator and the reviewers, and fluid exchange of documents and opinions.
The first part of the project, corresponding to Specific Authorizations, was finalized with a plenary session in March 2003. The second part, focused on individual licences, was finalized with a plenary session in October 2003.
2. Individual licences Criteria: With the purpose of simplifying the programmes, three levels or kind of licenses were defined for research reactors, and two types for critical assemblies. These licences are denominated respectively: Licenses type I, II III for research reactors and Licenses type IV and V for critical assemblies.
4

IAEA-CN-100/6P
Within these types of licenses the positions with similar qualification requirements were grouped as follows:
License Level I: Reactor Head (RR) License Level II: Radiation Protection Head (RR), Operation Head (RR), Shift
Responsible (RR) License Level III: Maintenance Responsible (RR), Operator (RR), Radiation Protection
Officer (RR) License Level IV: Reactor Head (CA) License V: Operator (CA), Radiation Protection Officer (CA).
The content of the programme is organized into four basic modules: Reactor Engineering, Radiological Safety, Nuclear Safety, Documentation and Standards.
On the other hand, although the programme specifies the thematic contents, is was considered necessary to specify levels of depth according to the requirements of the different positions. Three levels have been defined: B (basic), M (medium) and H (High).
Basic: B Corresponds to conceptual knowledge of the subjects. Resolution of equations or numeric calculations is not required, although qualitative interpretation of a graph corresponding to the behaviour of parameters, etc. can be required. In the case of documentation and norms, knowledge is required at the level of title and scope.
Medium: M Corresponds to more deep knowledge of the subjects, handling of formulas that describe a process with a simple model or that allow to solve simple problems with the purpose to make estimates of orders of magnitude. In case of documentation and norms, in addition to the previous one, an interpretation of the concepts included is required.
High: H Corresponds to the requirement of knowledge necessary to solve concrete problems using formulas, tables or programs of calculation (codes), or, in its defect, to have a knowledge sufficient to interact with the specialists. In the case of Documentation and Norms, it means that the person must know in depth the content and the concepts including in the documentation and/or being able to make them.
The required level for each position and for each subject is presented and defined in a matrix. An example is shown below.
Levels versus Licenses Matrix
TYPE OF LICENSES
SUBJECTS I II III IV V
3.1 H M B H B
4.1 H H M H M
4.2 H M B H B
5

IAEA-CN-100/6P
Example: 3. Nuclear reactor theory 3.1. Equation of Balance: solution of the equations of balance for an infinite and
homogenous reactor to two groups of energy. Factor of multiplication. Reactivity, units: PCM, mk, %, $. Simulation of the effect of the escapes on the reactivity through buckling. Normalization of the reactor power calculation. Four and six factors formula.
4. Radiation protection basic criteria 4.1. Justification of the practice: principle of justification of the practice. Application. 4.2. Optimization in radiological safety: considerations about optimization of radiological
safety systems. Calculation.
Summarized licenses programme Nuclear Reactor Engineering:
nuclear rectors theory, reactor kinetics and control, reactor materials and chemistry, heat removal, instrumentation and control.
Radiation Protection: radiation sources, basic principles of radiation protection, dosimetry units, external irradiation, internal contamination, biological effects of radiation, operational aspects of radiation protection.
Nuclear Safety: principle of defence in depth, reactor accidents, accident risk analysis, acceptance criteria, experience in research reactors and critical assemblies accidents.
Documentation and Standards: research reactor standards, critical assemblies standards, regulatory guides, safety report.
3. Specific authorizations In this case it was necessary to define two different programmes, one for research reactors and one for critical assemblies. To establish a certain logical order, three general titles were defined: (i) mandatory documentation, (ii) plant, (iii) tasks in normal situations and emergencies.
These general titles are detailed as specific subject in the programme. On the other hand, in addition to the listing of the subjects mentioned, three levels have been defined: B (basic), M (middle) and H (high). For each title the meaning of the level was defined, for example (plant):
B (basic): knowledge is required of plant distribution, location of equipment and systems, process and safety functions.
M (middle): knowledge is required of plant distribution, location of equipment and systems, process and safety functions. Knowledge of the operative parameters, flow sheets and relations between systems.
H (high): knowledge is required of plant distribution, location of equipment and systems, process and safety functions. Knowledge of the operative parameters, flow sheets and relations between systems. Description of physical principles of operation, dynamics of operation, impact in safety caused by failures.
The required level for each position and for each subject is presented and defined in a matrix.
6

IAEA-CN-100/6P
Example: B.3. Safety systems:
Nuclear Parameters: reactivity associated to the control/safety rods, void and temperature reactivity coefficients, Xe reactivity, available shutdown reactivity, reactivity changes, etc.
Thermal hydraulic parameters: Flow in different operation modes, core pressure drop, shape factor, Temperature of ONB
Protection system: sensors, measurement chains, redundancy and diversity, parameters sensed, set points.
Actuation System: Safety rods, characteristics, insertion time, reactivities associated. Isolation of the containment, normal and emergency mode.
Emergency refrigeration system: natural convection, inertia flywheels, natural convection valves emergency sprayer, etc.
Levels and Specific Authorizations Matrix
POSITIONS
ÍTEM Reactor manager
Operation manager
Shift responsible
Operator Radioprot. manager
Radioprotect. officer
Maintenance manager
B.3 H M M M B B M
Summarized specific authorizations programme Mandatory documentation:
Standards, regulatory guides, operation license, safety report, plant manuals.
Plant: Characteristics of the building and the site, core and tank internals, safety system, refrigeration system, instrumentation, auxiliary systems, power supply, experimental facilities, ventilation system, radiation protection systems, emergency infrastructure.
Tasks in normal and emergency situations: Radiation protection, operation, maintenance, core measurements, emergencies.
6. Conclusions The preparation of thematic programmes for Licenses and Specific Authorizations has demonstrated to be a positive experience of work between the Regulatory Authority and Operators. The institutions responsible for the operation of plants (National Atomic Energy Commission, National Universities of Córdoba and Rosario) have adopted the programmes and apply them for the qualification, retraining and evaluation of personnel. The Regulatory Authority has officially recognized these programmes as reference guides for the definition of the profiles of the licensed personnel, and for the examinations required for the granting of licenses and specific authorizations.
REFERENCE MADARIAGA M, WALDMAN R., LERNER A., CANAVESE S., MICHELIN C., PERRIN C.: IT-425 Temario para exámenes de licencias en reactores de investigación y conjuntos críticos.
7

IAEA-CN-100/24P
Electronic Data Acquisition System in RA-0, RA-1, RA-3 and RA-6 Nuclear Research Reactors C.A. Murúa, P.S. Cantero Córdoba, Argentina
Abstract. An electronic data acquisition system is installed and operating in three research reactors in Argentina for more than one year. The principal tasks to be performed by the system, together with its hardware and software components are described.
1. Introduction The Electronic Data Acquisition System (from Spanish S.E.A.D.) is installed and working since more than one year at the nuclear research reactors RA-0 (Córdoba), RA-1 (Centro Atómico Constituyentes) and RA-3 (Centro Atómico Ezeiza), all of them in Argentina. Soon the system will be installed at the nuclear research reactor RA-6 (Centro Atómico Bariloche). The principal tasks to be performed by the system are:
- to help in the operation, - to register the reactor parameters, - to help in the maintenance of the installation.
The help in the operation is performed by presenting to the operator information about the continuous evolution of acquired and calculated parameters and the logic signals. The same signals are registered in a periodic way for the system for a later reconstruction and analysis of the reactor evolution during the operation. The system also permits the measurement of falling and rising time of the control rods and their mechanisms. Other objectives among those already mentioned are:
- help in failure detection in the control instrumentation, - training.
2. System description
2.1. Hardware and analogue signals The S.E.A.D. Hardware, in a generic way, is composed as follows:
- low pass filters CNEA K340 modified (only analogue signals); - optocoupler modules (only digital signals); - decade selector modules (only for the signals coming from the power calibrated
channel); - data acquisition board Advantech PCL 818H and/or PCL 813B; - data acquisition board GASD 1.0; - industrial PC IPC-610 or IPC 615 (with two monitors).
A low pass filter, with a cut-off frequency of about 2 Hz, filters the analogue signals coming from the instrumentation. Then, those signals are digitalized by the PCL 818H or PCL813B.
The analogue signals acquired in the nuclear reactors RA-0, RA-1, RA-03 and RA-6 are listed in Tables 1, 2, 3 and 4 respectively.
8

IAEA-CN-100/24P Table 1: RA-0 analogue signals acquired
SIGNAL SYMBOL Control Rod 1 BC1 Control Rod 2 BC2 Control Rod 3 BC3 Control Rod 4 BC4 Moderator level MODER Log 2 LOGA2 Linear 2 LINA2 Tasa 2 TA2 Linear 3 LINA3 Tasa 4 TM4 Log 5 LOGM5 Linear 6 LINM6 Area Monitor 1 (Console) MA1 Area Monitor 2 MA2 Area Monitor 3 (Reactor room) MA3 Remeter REM
Table 2: RA-1 analogue signals acquired
SIGNAL SYMBOL Control Rod 1 PosBC1 Control Rod 2 PosBC2 Control Rod 3 PosBC3 Control Rod 4 PosBC4 Fine Control Rod PosBCF Log 1 LA1 Log 2 LA2 Tasa 1 TA1 Linear 1 ΦA1 Log 1 LM1 Tasa 1 TM1 Linear 4 ΦM4 Nucleus Delta Temperature ∆TN Primary flow QP Area Monitor 1 MA1 Linear 5 ΦM5
Table 3: RA-3 analog signals acquired
SIGNAL SYMBOL Log 1 LOGM1 Log 2 LOGM2 Log 3 LOGM3 Tasa 3 TM3 Linear 3 LINM3 CIP CIP Delta Presure ∆P Linear 4 LINM4 Primary flow QP Temp. In Nucleus 1 TEN1 Temp. Out Nucleus 1 TSN1 Temp. In Nucleus 3 TEN3 Temp. Out Nucleus 3 TSN3 Area Mon. Pumping room MASB Area Mon. Cell door MAPC Area Mon. Lab 52 MALAB52
9

IAEA-CN-100/24P Area Mon. 1 MABT1 Area Mon. 2 MABT2 Area Mon. 3 MABT3 Area Mon. Console MACON Ioniz. Cham. N16 1 CIN16-1 Ioniz. Cham. N16 2 CIN16-2 Delta Temperature 1 ∆T1 Delta Temperature 3 ∆T3 Log 1 LOGA1 Log 2 LOGA2 Log 3 LOGA3 Tasa 1 TA1 Tasa 2 TA2 Conductivity COND Position Control Rod 1 BC1 Position Control Rod 4 BC4
Table 4: RA-6 analog signals acquired
SIGNAL SYMBOL Position Control Rod 1 BC1 Position Control Rod 2 BC2 Position Control Rod 3 BC3 Position Control Rod 4 BC4 Position Fine Control Rod BCF Log 1 LOG A1 Log 2 LOG A2 Log 3 LOG A3 Log Pow 1 LOG M1 Log Pow 2 LOG M2 Log Pow 3 LOG M3 Linear Pow 1 LIN M1 Linear Pow 2 LIN M2 Linear Pow 3 LIN M3 Linear Pow 4 LIN M4 Tasa 1 TASA M1 Tasa 2 TASA M2 Tasa 3 TASA M3 Tasa 4 TASA M4 N16 chamber CI N16 Temperature In Nucleus TEN Temperature Out Nucleus 1 TSN 1 Temperature Out Nucleus 2 TSN 2 Temperature Out Nucleus 3 TSN 3 Delta Temperatura Nucleus 1 DTN 1 Delta Temperatura Nucleus 2 DTN 2 Delta Temperatura Nucleus 3 DTN 3 Primary Flow (Mediana) FP M Secondary Flow FS Area Mon. 1 LMA 1-1 Area Mon. 2 LMA 2-1 Area Mon. 3 LMA 3-1 Remeter REM NaI INA
10

IAEA-CN-100/24P
2.2. Digital signals Digital signals CMOS or TTL corresponding to the different logics of each reactor are optocoupled and then acquired by PCL 818H and/or GASD 1.0 boards. Digital signals acquired in nuclear reactor RA-0 correspond to the clamping logic, part of the SCRAM logic and the control rod system. In this installation the S.E.A.D. was used to implement the mimic of the logics, which was not existent until that moment. The signals acquired in nuclear reactor RA-0 are listed in Table 5.
Table 5: RA-0 digital signals acquired
SIGNAL SYMBOL Rod Nº 1 coupled B1AC Rod Nº 2 coupled B2AC Rod Nº 3 coupled B3AC Rod Nº 4 coupled B4AC Rod Mechanism Nº 1 in Lower limit MB1LI Rod Mechanism Nº 2 in Lower limit MB2LI Rod Mechanism Nº 3 in Lower limit MB3LI Rod Mechanism Nº 4 in Lower limit MB4LI Rod Nº 1 in Lower limit B1LI Rod Nº 2 in Lower limit B2LI Rod Nº 3 in Lower limit B3LI Rod Nº 4 in Lower limit B4LI Rod Mechanism Nº 1 in Upper limit B1LS Rod Mechanism Nº 2 in Upper limit B2LS Rod Mechanism Nº 3 in Upper limit B3LS Rod Mechanism Nº 4 in Upper limit B4LS Authorization to extract rods BOATS Water pump working MIBA1 Water clamp closed MVDAC Starting minimal flow NOAM High voltage sources connected SLFA Connected equipments signal SLEC NIM Source connected SLA4 5, 12 and –24 V sources connected SLA123 Key in operation position SLOA Reactor room closed SLRC Key in Maintenance SOMT Energized Electromagnets SOEE Area Monitors connected SPMO Channel 1 Period (Upper limit) N1TX Channel 2 Period (Upper limit) N2TX Upper limit channel N1 flux N1LX Upper limit channel N2 flux N2LX Lower limit channel N4 flux N4LM Lower limit channel N5 flux N5LM Upper limit channel N4 flux N4LX Upper limit channel N5 flux N5LX Area Monitor 1 Upper limit SP1X Area Monitor 2 Upper limit SP2X Period N4 N4TX Period N5 N5TX Lower limit channel N1 flux N1LM Lower limit channel N2 flux N2LM
11

IAEA-CN-100/24P
In the nuclear reactor RA-1 the digital signals correspond to the SCRAM logic and the control rod system. Those signals are listed in Table 6.
Table 6: RA-1 digital signals acquired
SIGNAL SYMBOL March channel 1 logarithmic has not overcome upper limit yet. LM1X3 March channel 2 logarithmic has not overcome upper limit yet. LM2X3 March channel 3 logarithmic has not overcome upper limit yet. LM3X3 Start up channel 1 logarithmic has not overcome upper limit yet. LA1X3 Start up channel 2 logarithmic has not overcome upper limit yet. LA2X3 March upper rate not set, and lower limit reset. TMY3 SCRAM function SCRAM
Maintenance function MN Security function SEG
Area monitor has not overcame upper limit MA1X3 Console area monitor has not overcame it upper limit MA2X3 Temperature difference in the nucleus has not overcame upper limit ∆TX3 Primary temperature has not overcame upper limit TSX3 Authorization to energize electromagnets aeed Start up allowed Ap March allowed Mpd
Control Rod 1 lower limit B1LI Control Rod 2 lower limit B2LI Control Rod 3 lower limit B3LI Control Rod 4 lower limit B4LI Control rod 1 mechanism upper limit MB1LS Control rod 2 mechanism upper limit MB2LS Control rod 3 mechanism upper limit MB3LS Control rod 4 mechanism upper limit MB4LS Energized electromagnets control rod 1 EEB1 Energized electromagnets control rod 2 EEB2 Energized electromagnets control rod 3 EEB3 Energized electromagnets control rod 4 EEB4
In nuclear reactor RA-3, signals corresponding to the control rods system and to the automatic pilot were also taken, and a mimic of this system was implemented via S.E.A.D. Those signals are listed in Table 7, Table 8 and Table 9.
Table 7: RA-3 digital signals acquired (control rod system) SIGNAL SIMBOL
Control Rod 1 lower limit B1LI Control Rod 2 lower limit B2LI Control Rod 3lower limit B3LI Control Rod 4 lower limit B4LI
Cont Rod 1 Mech Upper limit MB1LS Cont Rod 2 Mech Upper limit MB2LS Cont Rod 3 Mech Upper limit MB3LS Cont Rod 4 Mech Upper limit MB4LS
Parc. Scram Control Rod 1 SPBC1
12

IAEA-CN-100/24P Parc. Scram Control Rod 2 SPBC2 Parc. Scram Control Rod 3 SPBC3 Parc. Scram Control Rod 4 SPBC4
Table 8: RA-3: digital signals acquired (decade change)
SIGNAL SYMBOL Decade codification (Bit 0) CDBIT0 Decade codification (Bit 1) CDBIT1 Decade codification (Bit 2) CDBIT2 Decade codification (Bit 4) CDBIT3
Table 9: RA-3 digital signals acquired (aut. pilot)
SIGNAL SYMBOL Error ε Error is within its limits X2>ε March channel 4 is within its limits M4Y2φ Five last ranks 5 Ult. Ran Not automatic introduction AUT. INTR. Not SCRAM SCRAM. Not simultaneous descent BSIM 2 security rods in upper limit 2BPS Automatic pilot connected PAC Fine rod between 40% and 60% BCF 40-60 Connect automatic pilot CPA Disconnect automatic pilot RPA
In the RA-6 nuclear reactor, the signals which will be taken are those corresponding to the control rod system and other that are relevant to the reactor operation. Those signals are listed in Table 10.
Table 10: RA-6 digital signals to acquire
SIGNAL SYMBOLControl Rod 1 lower limit B1LI Control Rod 2 lower limit B2LI Control Rod 3lower limit B3LI Control Rod 4 lower limit B4LI
Cont Rod 1 Mech. Upper limit MB1LS Cont Rod 2 Mech. Upper limit MB2LS Cont Rod 3 Mech. Upper limit MB3LS Cont Rod 4 Mech. Upper limit MB4LS
Cont. Rod 1 electromagnet energized EEB1 Cont. Rod 2 electromagnet energized EEB2 Cont. Rod 3 electromagnet energized EEB3 Cont. Rod 4 electromagnet energized EEB4
Cont Rod 1 Mech. Lower limit MB1LI Cont Rod 2 Mech. Lower limit MB2LI Cont Rod 3 Mech. Lower limit MB3LI Cont Rod 4 Mech. Lower limit MB4LI
13

IAEA-CN-100/24P Decade codification (Bit 0) CD BIT0 Decade codification (Bit 1) CD BIT1 Decade codification (Bit 2) CD BIT2 Decade codification (Bit 4) CD BIT3
Five last ranks 5UR Conductivity COND
Security SEG March after allowed PMD
Seismic 1 SISM1 Seismic 2 SISM2 Seismic 3 SISM3
3. Software
The S.E.A.D. software consist of several programs, each one with a specific function and for a particular installation.
PROGRAM FUNCTION RAXBARRAS Measures the time required for the control rods to act
RAXADQ Acquisition, visualization, computing and registering of the operatives parameters of the reactor
RAXCALIB Computing the calibrating coefficients RAXREPROD Recovery and visualization of the registered data
RAXBARRAS
This program allows us to measure the time elapsed for the control rods to go up and down as well as the free fall time. The result obtained in the process of measuring, can be printed. Figure 1 shows a screenshot of these programs in nuclear reactor 1 (RA1BARRAS).
FIG. 1. RA1BARRAS
14

IAEA-CN-100/24P
The time utilized for the rod to go up and down is measured utilizing digital signals obtained of the control rod system. RA1ADQ
The program RAXADQ acquires the signals, digital ones and analogue ones. Analogue signals are calibrated utilizing the coefficients obtained with RA1CALIB. This program also calculates the following parameters for each of the reactors:
Table 11: RA-0: calculated signals
SIGNAL SIMBOL
Power (Channel N6) POTN6 Reactivity REACT
Table 12: RA-1: calculated signals
SIGNAL SIMBOL
Power (Channel M4) POTM4 Reactivity REACT
Table 13: RA-3: calculated signals
SIGNAL SIMBOL Reactivity REACT Power (Neutronic noise) – Channel N16-1 PotN16-1 Power (Neutronic noise) – Cannel N16-2 PotN16-2 Power (Neutronic noise) – Channel CIP PotCIP Power (Neutronic noise) – Channel M4 PotM4 Thermal Power – Rama 1 PotT1 Thermal Power – Rama 3 PotT3 Potencia Térmica – ∆T1 PotDT1 Potencia Térmica – ∆T3 PotDT3
Table 14: RA-6: calculated signals
SIGNAL SIMBOL Reactivity REACT Thermal power PotT Outgoing Nucleus temp. (Mediana) TSN Delta Temp. Nucleus (Mediana) DTN Power N16 PotN16 Burnt QUEM
A flowchart of this program is shown in Figure 2.
15

IAEA-CN-100/24P
ADQUISICIÓN
AJUSTE
VISUALIZACION
GRABACIÓN
PANTALLA 1
PANTALLA 2
INICIALIZACION
CÁLCULOS
FIG. 2. RAXADQ flowchart
In the case of the analog signals, the system presents the actual value (which is refreshed once a second), a figure with last five minutes of the evolution and a cursor which allows you to visualize time and date of a certain point in the figure. FIG. 3, FIG. 4 and FIG. 5 show some screenshots corresponding to analogue signals.
FIG. 3. RA1ADQ (area monitor 1)
16

IAEA-CN-100/24P
FIG. 4. RA3ADQ (March Linear 4) – Automatic Pilot
FIG. 5. RA0ADQ (LIN N2)
Figure 6 shows how digital signals are presented in different reactors:
17

IAEA-CN-100/24P
FIG. 6. RA1ADQ (SCRAM logic)
FIG. 7. RA0ADQ (Operation Console) Power One of the most important signals in the operation of a reactor in march condition is the power of operation. In all the reactors in which S.E.A.D. was implemented, the power of the reactor was calculated from the signals obtained in the neutron channels and the signals obtained from the conventional parameters.
18

IAEA-CN-100/24P
FIG. 8. RA0ADQ (Power)
FIG.9. RA3ADQ (Power)
19

IAEA-CN-100/24P
Reactivity The S.E.A.D. implements in all reactors a reactivity meter by software, and takes as reference the signal obtained from different march channels.
FIG. 10. RA3ADQ (Digital Reactivity Meter)
RAXCALIB This program calculates the coefficients needed to convert voltage measurements into engineering units. The program acquires data expressed in voltage levels and the operator must introduce the lecture in the instrument that is being calibrated in engineering units. After the third value the program calculates the values of the coefficients using the minimum square method. These coefficients are stored in a file, which is read for the acquisition program (RAXADQ).
RAXREPROD This program reads data from files generated for the acquisition program (RAXADQ) and produces a simulation of the operation of the reactor, allowing the user to show and print all the parameters that are found in the file.
20

IAEA-CN-100/28P
Delayed Neutron Fraction in Low Enrichment Nuclear Fuel. Calculation for RA-3 Reactor Case G. Estryk Comisión Nacional de Energía Atómica, Buenos Aires, Argentina.
Abstract. The delayed neutron fraction (βeff ) is recalculated for the case of RA-3 Reactor core (Ezeiza Atomic Centre) which is composed of LEU fuel. The main target is the re-normalization of reactor power measured with neutron noise. The previous accepted value of βeff was 8.14E-03. Now this parameter is re-evaluated using neutron diffusion code PUMA and transport code WIMS. Considered was a five group neutron spectrum, several percentages of burn-up and νd from various authors. The nuclear fraction of delayed neutron calculation gave 6.84 E-03 and the effective one 7.69 E-03, resulting sensitive mainly to νd and not to fuel burn-up.
1. Introduction Between 2000 and 2002 several experiments were carried out to evaluate the power of the RA-3 Reactor (Ezeiza Atomic Centre) by two independent experimental methods: neutron noise [1] and thermohydraulics [1,2,3]. Because the neutron noise technique needs the delayed neutron fraction value (βeff ) it was recalculated following the lines applied to RA-4 Reactor of CNEA [4]. The scheme of this calculation is addressed in the present work.
2. Description of calculations
The βeff calculation consisted of two steps: nuclear beta (βn) and effective beta (βeff) calculation.
2.1. Nuclear beta 2.1.1 Calculation
Nuclear beta is calculated summing up the contribution of the different g delayed neutron groups, usually 6 [5]:
βn = Σg βn,g (1) The βn,g´s of (1) correspond to βϕ
g,i averaged for the different i fissile isotopes present in the fuel, for group g of delayed neutron under flux ϕ (thermal or fast) weighted with reaction rates of the i fissile isotopes, as follows:
βn,g = Σi,ϕ (βϕg,i*FRϕ i) / Σnuc,ϕ (FRϕ i) (2)
In this work fissile isotopes U235, U238 y Pu239 are considered.
βϕg,i is calculated as
βϕg,i = νϕ
d,i ∗ α ϕg,i / νϕi (3)
where νϕd,i ([5], [6])) is delayed and νϕ
i ([5]) total fission neutrons for fissile isotope i and fast or thermal energies, respectively. α ϕg,i ([6]) is the normalized fraction of delayed neutrons in group g, fissile i, in spectrum ϕ.
21

IAEA-CN-100/28P
The reaction rates FRϕi are the product of thermal or fast neutron flux φϕ times macroscopic
fission cross sections Σϕfis,i for each fissile i and spectrum φϕ.
FRϕi = φϕ * Σϕ
fis,i (4) The fluxes φϕ are calculated using some neutron code. We used the three-dimensional diffusion code PUMA [7] applied to reactor RA-3 (core 94) in two energy option groups.
Finally, Σϕfis,i are obtained as the product of microscopic cross section for isotope i in neutron
spectrum ϕ (σϕfis,i) and the number density for isotope i (Nd,i) that depends on fuel burn-up.
Σϕfis,i = σϕ
fis,i * Nd,i (5) The data source of σϕ
fis,i can be seen in ref. [9]. Nd,i were calculated with WIMS-D4 [10] for several steps of fuel burn-up.
2.1.2. Results
The evaluation of βn for the low enriched uranium fuel of RA-3 Reactor showed weak dependence with burn-up. This was not the case when different νϕ
d,i , from several authors [6], [7] were considered, mainly for U235 in thermal spectrum. Table I shows βn for different fuel burn-up and authors of data sources of νϕ
d,i.
Table 1: Calculated nuclear β dependence with U235 burn-up and data source of νd,i
BURN-UP Keepin (1965)
Tuttle (1975)
Tuttle (1979)
England y Rider (1983)
England (1986)
Brady (1989)
0% 6.52E-3 6.83E-3 6.69E-3 7.28E-3 7.28E-3 7.34E-3 1.3% 6.52E-3 6.83E-3 6.69E-3 7.28E-3 7.28E-3 7.34E-3 1.7% 6.52E-3 6.83E-3 6.69E-3 7.28E-3 7.28E-3 7.34E-3 5.0% 6.52E-3 6.83E-3 6.69E-3 7.28E-3 7.29E-3 7.34E-3
10.0% 6.52E-3 6.83E-3 6.69E-3 7.29E-3 7.29E-3 7.34E-3 14.8% 6.53E-3 6.84E-3 6.70E-3 7.29E-3 7.29E-3 7.34E-3 19.7% 6.53E-3 6.84E-3 6.70E-3 7.29E-3 7.29E-3 7.35E-3 24.5% 6.53E-3 6.84E-3 6.70E-3 7.29E-3 7.29E-3 7.35E-3 51.9% 6.57E-3 6.88E-3 6.74E-3 7.31E-3 7.31E-3 7.38E-3
Following Blachot recommendation [6], νϕ
d,i values from Tuttle (1975) were taken to calculate βn. With this in mind we adopted
βn = 6.84 E-03
Tuttle evaluated 3% of error for νd which will introduce an error of 6% in reactor power evaluated with the neutron noise technique.
2.2. Effective beta 2.2.1. Calculation
The calculation of βeff were carried out using code PUMA in a structure of five energy macrogroups G. The cell constants PUMA required were calculated with code WIMS-D4, that generates the constants in 69 energy groups and then condensates them to the five macrogroups as shown in Table II.
WIMS also provides, (see table 4 of “Fission Spectrum for 69-Group Library” [10]), the prompt neutron spectra condensed to five G macrogroups (χG). For condensed (χG,g) spectra of delayed neutrons we used Tables V to X of Rudstam [11].
22

IAEA-CN-100/28P
PUMA requires the delayed neutron precursors constants λg for U235 and we took them from Brady and England [10].
For the five macrogroup velocities we took the 69 values from WIMS as
vm = ((Em+Em+1) / mn)1/2
and then condensed weighting them with the square of the 69 neutron fluxes from a case running WIMS
vG = Σm vm φm2 / Σm φm
2
MACROGROUP G LOW ENERGY LIMIT (EV)
WIMS-D4 GROUPS
1 8.210E+05 1 A 5
2 5.530E+03 6 A 15
3 1.500E+00 16 A 31
4 0.625E+00 32 A 45
5 0.000E+00 46 A 69
Table II
With all these data we could run PUMA in a five energy groups option for a RA-3 core case to obtain the βeff value we looked for. 2.2.2 Results The value obtained for βeff was
βeff = 7.69 E-05 As was expected it was smaller than previous ones (6 %). This value was used for re-normalized neutron noise evaluation of RA-3 power and compared with the thermohydraulics evaluation.
3. Conclusion
Since 1990, when RA-3 began using LEU fuel, a βeff calculated value of 8.14E-3 for neutron noise calibration and conversion factor between dollar and pcm was accepted. We did not have a calculation memory of that value. The present work gave a value of 7.69 E-05, 6% lesser than the previous one. Therefore the value of power obtained from neutron noise technique results 12 % higher. When compared with the thermohydraulic power of the reactor, this value is within error margins [3]. The dependence of βeff with νd shows the importance to re-evaluate βeff when new values of νd appear. In accordance with bibliography it is considered very important to make an experimental evaluation that is possible.
23

IAEA-CN-100/28P
REFERENCES
[1] GÓMEZ A., ESTRYK G., ROQUETA D. “Mediciones de parámetros neutrónicos del reactor RA-3 durante la puesta en marcha en mayo del año 2000”. CNEA.C.RCN.ITE.136 (2001).
[2] HALPERT S., VÁZQUEZ L. “Determinación de la potencia térmica del reactor RA-3”. CNEA. C .RCN. ITA.140 (2000).
[3] A. GOMEZ, S. HALPERT, L. VAZQUEZ "Determinación de la potencia de operación del Reactor RA-3 por técnica de ruido neutrónico y por balance térmico" CNEA.C.RCN.ITA.203 (2002).
[4] QUINTEIROS G. “Estimación de la fracción efectiva de neutrones retardados y del tiempo entre reproducciones para el reactor RA-4.” (1999).
[5] KEEPIN G.R. “Physics on Nuclear Kinetics”. Addison Wesley Publishing Co. Reading, Mass (1965).
[6] BLACHOT J., BRADY M. C., FILIP A., MILLS R. W., WEAVER D. R. “Status of Delayed Neutron Data – 1990”. OECD - NEA. (1990).
[7] BRADY M.C. and ENGLAND T.R.. LANL. “Delayed Neutron Data and Group Parameters for 43 Fissioning Systems”. Nuc. Sci. and Eng. Vol.103. 129-149. (1989)
[8] GRANT C. “Sistema PUMA. Versión IV”. AATN. (1999).
[9] ZIJP W. L., BAARD J. H. “Nuclear Data Guide for Reactor Neutron Metrology”. ECN-70. Netherlands Energy Research Foundation. (1979).
[10] ROTH M. J., MACDOUGALL J. D., KEMSHELL P. B. “The preparation of input data for WIMS”. AEEW – 538. UKAEA. (1967).
[11] RUDSTAM G. ”Six-Group Representation of the Energy Spectra of Delayed Neutrons from Fission”. Nuc. Sci. and Eng.: 80, 238-255 (1982).
24

IAEA-CN-100/29P
RA-3 Reactor Power Increase to 10 MW J.A. Quintana Domínguez, P.A. Cataldi Comisión Nacional de Energía (CNEA), Buenos Aires, Argentina
Abstract. The RA-3, a multi-purpose research reactor designed by Argentina in the 1960s to operate at a power of 3 MW, had since undergone several changes to fulfil the ever-growing needs of its users (such as in the late 1980s when the core was converted and allowed the power to increase to 5 MW). The growing demand for the production of radioisotopes fostered a project to increase the power of the reactor RA-3 to 10 MW. The paper describes the implementation of this project. Addressed are engineering and licensing aspects, in particular modifications introduced, reactor commissioning, and benefits gained.
1. Introduction The production and research reactor RA-3 had been designed by Argentina in the 1960s (first criticality in 1967) to operate at a power of 3 MW. Then it underwent several upgrading changes that allowed its operation along the time to fulfil the ever-growing needs of its users and to comply with the evolution of safety regulations. It is worthwhile mentioning that during the period 1988-1989 the core was reconverted to low enrichment. At this opportunity some internal structure elements of the tank were replaced, the instrumentation upgraded, the bridge and control mechanism replaced, apart from some other changes to the refrigeration systems that allowed the reactor to increase the power to 5 MW.
The RA-3 is a multi-purpose reactor and different activities are carried out. They include: radiation damage studies, activation analysis, detectors assays, fuel element qualifications, etc. But the main activity has been the radioisotopes production which sustains the extended schedule operation (approximately 120 h/week, 11 month/year).
2. Description The ever growing demand on radioisotopes production and the need to incorporate some other products of highly specific activity, fostered the launching of the project to increase the power of the reactor RA-3 to 10 MW in 1997. The resumed project activities were the re-design and modifications of the cooling circuits, and its auxiliary systems to comply with the new power and licensing requirements. The scope of the project has also included the incorporation of new systems (extras nuclear and conventional chains, irradiation pneumatic system, data register system, etc.).
The project activities were performed within the frame of a "Project Organization" that included the reactor RA-3 staff and also other CNEA groups under the same management. Following the premise that the reactor had to be in operation, the reactor chief, i.e. the “primary responsible” who is legally responsible for all the activities performed in the installation, became the head of the project. A Quality Management Programme included the organization, missions and functions, radiological safety and quality requirements that the CNEA work groups and external suppliers had to fulfil. Due to the fact that the reactor had to be in operational status, all the safety regulations, plant procedures, and special procedures, were imposed to the activities and workers. The modification of relevant systems had to be
25

IAEA-CN-100/29P
done during the normal shutdown period (40 days) in summer. In the special case of the primary cooling system modifications, 120 days of shutdown were programmed.
Consultations with the nuclear regulatory authority were carried out in order to manage the system modifications under “engineering changes”, sending in advance the studies and the engineering proposals, obtaining the agreements, and performing the changes under an authority survey. This kind of scheme allowed the continuity of operation of the reactor under the terms of the reactor license during the project.
In the 10 MW commission step, the "Project Organization" was replaced by a "Start-Up Organization", in order to fulfil regulatory aspects under the terms of a “Start-Up” license. At this stage, the new organization implemented a respective new quality programme “10 MW Commissioning Plan”. The most remarkable difference in the organization from the previous one was the appearance of an ad-hoc committee made up of specialists in different areas. This committee had to authorize or not the continuity of the steps of the commissioning plan at any time, the monitoring of the activities, and the approval of the technical documentation.
2.1. Engineering and licensing: Neutronic and thermo-hydraulics studies were performed in order to re-design the cooling system and the fuel core management.
The fuel design report, was revised to guarantee its adequate performance under the new operation conditions. Behaviour of reflectors, components and irradiation’s devices in core, and other unmodified reactor components were also reviewed in order to establish that they are capable of fulfilling the requirements imposed by the new work regime.
Radiation protection evaluations of: shielding, decay tanks, ventilation system, area monitor surveillance system, involved radiological costs, needs of systems improvements or procedures modifications, due to the power increase were performed.
The adequacy of Nuclear and Conventional Instrumentation was analyzed in the frame of the new operative regime. At this stage the improvement or the replacement of measurement chain or system were planned to be done.
The capacity of “safety systems” to avoid or reduce the postulated design accidents or their consequences were verified for the new conditions. In addition four new postulated accidents were analyzed. The “Risk Analysis Report was entirely renewed.
All the installation changes introduced were tested in operation at 5MW during 3 years, at special authorized operation at 6 MW and 8 MW, which allowed the adequacy of the modifications introduced. The commissioning (“Start-up”) to 10 MW , provided the complete verification of the objectives.
The RA-3 technical documents were updated according to the modifications introduced. Most of the procedures, contained in the Operation Manual, Maintenance Manual, Radiological Practice Code, were reviewed and many of them entirely changed. Many of old the technical documentation (plans), were reviewed and transferred to electronic files.
A new version of a Safety Report was accomplished and is going to be sent to the Nuclear Regulatory Authority (ARN).
2.2. Modifications introduced All the modifications introduced had to be qualified and the accurate function within the design specifications demonstrated to be used in the reactor. In case of a new cooling circuit, cold and power operation were performed, the measurements provided by the fixed instrumentation installed (mass flow and pressures gauges, thermo-resistance ) checked with
26

IAEA-CN-100/29P
portable calibrated gauges (ultrasonic mass flow and pressure gauges and thermometers ). When new systems could be placed in parallel with the old ones (for example the drop of pressure in the core), that was carried out. In this way the accuracy and reliability was compared during the operation as part of the qualification process. The teaching and training of personnel on each change performed was done, and became a regulatory condition to maintain current individual and installation licenses during the project. The adequacy of individual knowledge and skill were tested in annual re-training examinations.
Primary cooling circuit The primary cooling circuit of the pumps room has been replaced from two to three loops of refrigeration (equivalent from the thermo-hydraulics point of view).
Previous Situation: Present Situation:
2 driven pumps 3 driven pumps 2 heat exchangers 3 heat exchangers Maximum total flow: 950 m3/h Maximum total flow: 1350 m3/h Operation power: 5 MW Operation power: 10 MW
Secondary cooling circuit All the circuit were replaced due to the reduction of its sections by incrustations
Previous Situation: Present Situation:
3 driven pumps 3·driven pumps 2 heat exchangers 3 heat exchangers 3 cooling draft-forced towers: 4 cooling draft-forced towers: (capacity 8 MW) (capacity 20 MW)
Continuous water purification system A new system was designed and built because old components showed irreversible corrosion problems, instrumentation was obsolete and an adequate system to remove active resins was lacking. The present system has two physical filters stainless steel columns for mixed bed resins, resins traps, decay columns for spent resins, a and system of transfer of spent resins to waste drums. The replacement of spent resins by new ones can be done in a short time (8 hours of a weekly shut-down is enough). All the active resins handling is performed in a remote way. The system was fully instrumented with conductivity gauges, pressure gauges and drop pressure gauges.
Softening water supply Two new stainless steel water softening vessels replaced the previous ebonited carbon steel vessels that showed a significant degree of damage.
Pneumatic irradiation system Two pneumatic irradiation systems were implemented (they are currently being tested). This system is going to be used by the Activation Analysis Ezeiza Group and a new group is interested in using it for nuclear data measurement.
Improvements in instrumentation and control • Two new measurements chains of power by N–16 (measurement rings, chambers and
amplifiers).
• New measurement system of differential pressure across the core. The system is based on two submerged gauges, the first detects the level of the water in the reactor tank, and the second the level of the water inside a pipe connected to a funnel under the core grid. The
27

IAEA-CN-100/29P
electric currents provided by the detectors are subtracted electronically to obtain a current proportional to the drop of pressure in the core.
• Conventional Instrumentation in the new thermo-hydraulic circuit (flow mass meter per branch and total, inlet and outlet heat exchangers temperatures, inlet collector temperature, pressure at inlet and outlet of pumps and exchangers, conductimeter).
• SEAD system of data acquisition and record based on an industrial PC (32 analogy data are recorded once a second- 3 monitors display the selected data on line).
• An additional neutron linear channel (CIP), which also sends its signal to the reactivity meter programmed at SEAD (the reactor reactivity is shown on-line).
• Amplification of the area monitoring system.
• Replacement of measurement equipment for difference in core temperature.
• The mechanical components (fine rod control mechanism) and instrumentation of an Automatic Pilot has been finished. A third start-up channel was constructed with its respective fission chamber and mechanism. A logic to the fission chambers movements was modified. The commissioning of the automatic pilot system is going to be performed during the next year, but the pilot amplifier has been working for almost two years.
• Construction of modules of instrumentation (spare instrumentation components).
Ventilation system Due to the lack of spare components, the ventilation sensor/controller of the reactor hall and the flow gauge were replaced. Commutation entrance to automatic re-circulation was implemented.
An on-line gas detector in chimney based on I-Na detector has been implemented and tested. Some difficulties arose when there was an attempt to correlate measurements with measurements performed by other reliable methods. A new procedure is based on discrete sampling, collected in a special geometry volume and measured by a detector calibrated previously with a volumetric known source (specially constructed with same geometry). The evaluation of gas discharges obtained were compared with independent discharge evaluations performed by the Nuclear Regulatory Authority during many opportunities at different power and stages (e.g. hours after weekly start-up, third or last day of a one week operation cycle). This discrete sampling method became the authorized method for noble gases discharge evaluation.
Fuel elements surveillance A station for fuel elements inspection has been established at RA-3 reactor pool. This was designed by the Nuclear Fuel Elements Unit which, together with the reactor personnel, carries out the periodic inspection of on-service fuel elements. A second station (removable) was also built to inspect burnt fuel elements at the cooling pond. A device for sip test (removable) was developed under IAEA contract (Regional Project CT RLA/4/018 “Spent Fuel Management of Research Reactors”) and assembled in the reactor’s cooling pond (decay pool).
Re-equipment The project also provided funds for buying radiation monitoring detectors, extensible detectors, personal electronic dosimeters, hands and feet station detector, hyper-pure detector with a complete spectrometric chain (PC multi-channel analyzer), a sample changer, I-Na detectors line, high tension sources, amplifiers etc.
28

IAEA-CN-100/29P
2.3. Commissioning of RA-3 for operation at 10 MW In order to obtain a “Start – Up” licensee (authorization to increase the power of the reactor from 5 MW to 10 MW) from the nuclear regulatory authority, the "Project Organization" was replaced, as mentioned earlier, by the "Start-up Organization".
Some remarkable items established in the “10 MW commission Plan” were: Number of power steps to reach 10 MW and number of operation cycles (5 days each)
required in each step (8MW, 9MW and 10 MW) were performed, the time per stage ranged from 4 to 5 cycles each. Operational limits were fixed. Conditions to be fulfilled to go to the next stage were established. List of applicable procedures during the commissioning. Assays, special monitoring, and additional registers to be done in each stage. Requirements to be fulfilled in case of operational incidents or accidents. Reports to be realized by the responsible of each sector in each step. Operation. Radiation protection. Maintenance. Engineering. Quality assurance. Approval conditions to authorize the continuity by Ad-Hoc Committee.
All the people who belong to the reactor staff had to demonstrate knowledge about the modifications made in the installation and in the new plant documents, in order to validate their own specific authorization for the new reactor power through an examination. The power increase began on 18 October 2002 and finished on 8 June 2003 when RA-3 was licensed for 10 MW.
3. Benefits achieved to date as result of the Project To-date, benefits achieved as a result of the project are: • RA-3 has begun producing Ir-192 (450 Ci/g) for the replacement of industrial gamma
radiography sources. Since its power was increased, Iridium has been delivered for the replacement of sources of over 100Ci of Ir-192 each.
• The burn-up of Uranium silicide fuel element (P-06) was achieved (55% Burn-up) within the deadlines established by CNEA.
• The supply of reactor radioisotopes has become more reliable due to the installation improvements.
• The production has been enhanced. The flux of the reactor allows to cope with other radioisotopes of high specific activity. The conventional irradiation places and their new available neutron flux at 10 MW are: - 4 sample irradiation boxes inside the core (each has 16 cans irradiation places, 4 1013
n./(cm2.s)< Φth < 1.2 1014 n./cm2.s – λepi ≅ 0.04 - Φfast ≅ 0.2*Φth ); - 1 special irradiation box for mini-plates targets, placed in the center of the core (12
mini-plates could be placed inside, Φth = 2.4 1014 n./cm2.s); - Thermal column facility (15 places – 5.1010 n/cm2.s < Φth < 2.1013 n/cm2.s – 3.10-4<
λ epi < 4.10-4); - 1 sample irradiation box outside the core reflector (16 cans irradiation places, 2.1013
n./(cm2.s)< Φth < 4. 1013 n./cm2.s –λepi ≅ 0.04 - Φfast ≅ 0.2*Φth ).
29

IAEA-CN-100/31P
Application of Campbell´s Method to a Wide Range Neutron Flux Channel Measuring System L. Giuliodori, E. Matatagui, M. Milberg, S. Thorp, J. Zalcman Instrumentation and Control Department Division of Nuclear Reactors and Power Plants Activities National Atomic Energy Commission (CNEA), Buenos Aires, Argentina
Abstract. A Campbell chain was developed and tested at the National Atomic Energy Commission of Argentina. A fission detector, a fast and low-noise preamplifier and a mean square value amplifier compose the chain. These three components are described in this work and results are presented from preliminary tests carried out at the RA-3 research nuclear reactor. It is considered that a Campbell system, appropriate to operate in gamma fields up to 0.1 MR/h, delivering a pulse mode signal for neutron fluxes from 102 nv to 106 nv and a fluctuation mode signal in the 105 to 0.7 1011 nv, is available.
1. Introduction Nuclear reactor operation requires monitoring neutron flux in the reactor core in a wide range, usually more than ten decades. Conventional instrumentation is composed of several detectors or movable ones (to avoid saturation). A system using only one detector, at a fixed position and able to cover the whole range would be desirable. Campbell system can be considered a convenient option.
A fission detector (FD) is an adequate device to monitor neutron flux. In this kind of detector a fissionable material acts as converter. Neutrons generate fission fragments when collide with the converter. Each event has a characteristic charge qn and their frequency of occurrence determines a count rate Nn. Alpha activity of the converter, gamma radiation, structural materials activation and electronic noise add non-wanted contributions to the neutron signal. Each interference source, i, generates qi at a rate Ni, where i identifies the source. The main advantage of a FD is the great difference among the qi´s. While qn is about 10-13 C for fission events, is only about 5 10-15 C for alpha events (qα), 10-16 C for gamma events (qγ), and 10-19 C for electric events (qe). Ideally, none of these interferences should mask neutron flux measurement.
Three different modes can be used to follow neutron flux: Pulse (PM), Current (CM) and Fluctuation Mode (FM). PM is suitable for low fluxes. The electronics can count fission events, discriminating unwanted contributions based on a pulse height discrimination criterion. For intermediate and high fluxes, it is no longer possible to count pulses individually. CM could be adopted in this range. In this mode, the signal is the mean direct current, <I>. According to the first theorem of Campbell:
(1)
where: q is the mean charge generated in the detector. <N> is the mean rate of pulse generation in the detector.
According to the different origin of the events, the signal can be written as:
(2)
Equation (2) shows that <I>total is a good indicator of neutron flux only if δ<I> << 1.
><>=< NqI
( )><+><=
><><
+><
><+
><><
+><=
><+><+><+><=><
Innnn
ee
nn
γγ
nn
ααnn
eeγγααnntotal
δ1NqNqNq
NqNq
NqNq
1Nq
NqNqNqNqI
30

IAEA-CN-100/31P
>∆< 2Iδ
FM also provides a signal proportional to the neutron flux. The second theorem of Campbell establishes:
(3)
where:
∆I(t) is the instantaneous value of the fluctuation at time t. S(f) is the power spectral density that characterizes fluctuations. Beq is the noise equivalent bandwidth, inside which S(f) can be assumed as a constant.
In a similar way that was mentioned above for CM, for FM different sources contribute to the total signal as follows:
(4)
<∆I2>total will be a good indication of the neutron flux when << 1. Weight factors for each component are ratios of squared values of the charge generated in the associated event, so a better discrimination can be obtained with FM than with CM.
Consequently, if the signal from a FD is processed first in PM and then, when saturation is produced, in FM, it is possible to measure neutron flux in a wide range with only one detector in a fixed position. This is the base of the Campbell method. [1]
2. Description of the system 2.1. Fission detector CNEA F160
The sensor used was designed and constructed at the CNEA. It is a cylindrical structure where two concentric tubes lined with 1 mg/cm2 U3O8 work as signal electrodes; two polarization electrodes surround each signal electrode. The whole system is guarded and an external container serves both as electrical shield and to allow pressurization. Its main characteristics can be summarized as follows:
Length 300 mm Outer diameter 50.8 mm Filling gas Ar Pressure 3 kg./cm2
Converter material U3O8 (90% U235) Electrodes separation 1.5 mm Sensitive length 182 mm Operation voltage 500 V Current Mode Sensitivity 3.6 10-14 A/n cm-2 s-1 Pulse Mode Sensitivity 0.16 cps/n cm-2 s-1 Pulse Mode Sensitivity plus discrimination 0.11 cps/n cm-2 s-1 Fluctuation Mode Sensitivity 5 10-27 A2/Hz n cm-2 s-1
2.2. Electronics 2.2.1. Pre-amplifier/discriminator: K690 module The final version of the K690 is a current to voltage converter capable of processing current signals generated by fission detectors.
( )
eq2
eq
222
B N q 2
B S(f) II(t) I(t)∆ I∆
><=
=>><−<=><≡><
( )>∆<
+><=
><><
+><
><+
><><
+><=
><+><+><+><=>∆<
2Ieqn2n
n2n
2
n2n
2
n2n
2
eqn2n
eqe2eeq
2eq
2eqn
2n
2
δ1 B N q 2
N qN q
N q
N q
N qN q
1 B N q 2
B N q 2 B N q 2 B N q 2 B N q 2
ee
totalI
γγαα
γγαα
31

IAEA-CN-100/31P The converter generates two output signals:
a) a logical signal composed by voltage rectangular pulses whose width and height are fixed; these pulses are generated in response to input current pulses whenever they are higher than a reference level that can be externally adjusted.
b) an analogue voltage signal proportional to the ac component of the input current; this component of the input is a fluctuation signal with similar characteristics of white noise.
Functional description:
As it can be seen in FIG. 1, the first stages of the module, which are implemented in the SHAPING PREAMPLIFIER block, are common to both outputs, FLUCTUATIONS and PULSES. These stages perform a very-low-noise current to voltage amplifier with a real (non imaginary) input impedance of 93Ω in order to adapt to the impedance of the RG-62 type transmission cable coming from the fission detector. The output of the first block is a voltage signal that drives the following stages:
a) The Pulse Channel, which generates the pulses that establish the PULSE OUT signal.
b) The Fluctuation Channel, which generates the FLUCT. OUT signal.
In the Pulse Channel, the PULSE FILTER has a transference function which allows to generate voltage pulses of similar shape to the fast input current pulses, improving the signal-to-noise relation. The RLB block restores the base line, lost in the capacitive couplings of the preceding stages.
The output voltage pulses of the RLB block, is the input of the DISCRIMINATOR. This stage is implemented by a fast integral discriminator, with an externally adjustable triggering level. The output of the DISCRIMINATOR is the input of the MONOSTABLE block; this stage shapes the incoming pulses producing pulses of fixed height and width.
Finally, these logical pulses are sent to the output BUFFER, directly or through the 16:1 RATE DIVIDER; this last option may be accomplished by means of an internal jumper.
In the Fluctuation Channel, the FLUCTUATION FILTER is basically an active second order and band pass filter, centred at the main part of the fluctuation signal spectrum; its purpose is to suppress low- and high-frequency noise signals.
FIG. 1. Preamplifier-discriminator module Performance:
a) INPUT (capacitive coupling): Input impedance: 93Ω Input equivalent noise: i) With open circuit input: in =2.5 10-12 A/Hz1/2 ii) With the input connected to 15m of RG62 cable and
a 500pF capacitor at the far end (500pF is the capacitance of the fission detector): in = 5 10-12 A/Hz1/2
32

IAEA-CN-100/31P b) OUTPUTS
i) PULSE OUTPUT Level: +5V; Width: 0.2 µs; Rise-time: 0.1µs; Fall-time: 0.1µs Trigger level: Adjustable between 0 and 1.8 x 10⁻⁶A Double-pulse resolution: 0.050µs; Output impedance: 50Ω
ii) FLUCTUATION OUTPUT: Maximum level without clipping: ± 12.7V Transference: VRMS output (V)/Input current (A/Hz 1/2 ) = 256 106 Ω.Hz ½ ± 3% Passband: fo =164KHz ; BW(-3dB) = 164KHz.
2.2.2. Mean squared-voltage amplifier: K750 module
The final version of the K750 module is a mean squared voltage (MSV) amplifier that processes fluctuating signals in a frequency band centred at 150KHz and with levels in the range between 5mV and 5V RMS. The K750 module, together with the Pre-Amplifier/Discriminator (K690 module) conform the Fluctuations Measuring System (or Campbell System). The purpose of this system is to give an indication of the neutron flux level, measured by a fission detector. Given that the MSV of the fluctuation signal is its squared RMS value, this module expands the three-decades of input dynamic range to a six decades output, which correspond to the 6 decades of neutron flux of dynamic range, according to Campbell’s measuring method. The K750 has two outputs:
a) The Linear Output, represents the 6 decades of dynamic neutron flux. These 6 decades are divided into 3 ranges of 2 decades each.
b) The Logarithmic Output compresses the 6 decades of neutron flux mentioned above, into a single 4V to 10V output, featuring a 1V/dec measuring scale.
Functional description: FIG. 2 shows a block diagram of this stage. The input MSV computation is performed by the ANALOG MULTIPLIER block implemented by a four-quadrant multiplier chip and the INTEGRATOR block, implemented by an active RC filter. The AGC block is a three-step controlled gain amplifier; its controlling parameter adjusts the output level of the amplifier (input of the multiplier) to only one decade for the whole input signal range (three decades), with the purpose of minimizing the measuring error. LEVEL COMP is a window comparator with a 2 decades width; its input is the output of the INTEGRATOR; its output drives the LOGIC block. This block generates 2 bits, labelled Q1Q0 , that control the AGC block in order to keep the output of the INTEGRATOR within the window. These two bits also establish the scale factor (ESC output) by which the LIN, an analogical 2-decades range voltage output, must be multiplied to obtain the neutron flux reading. LOG AMP. block is a logarithmic amplifier implemented by a monolithic chip that works with only two decades range of input voltage (the output of the INTEGRATOR) in order to minimize errors and has a gain of 1V/dec. Its output is combined with three fixed dc voltages in the ADDER block, selected by the output of the LOGIC block, to establish the LOG output.
FIG. 2. Mean square voltage amplifier module.
33

IAEA-CN-100/31P
Performance: a) INPUT:
Signal level: 5mVRMS < Vin < 5VRMS; max. crest factor: 3.16; bandwidth (-3dB): 5KHz < BW < 500KHz.; impedance: 6.2KΩ.
b) OUTPUTS: i) Linear Output Transference: VLIN K =Vin
2. , where the values of K are shown in Table I. VLIN Range: 25mVdc ≤ VLIN ≤ 2.5Vdc. Accuracy: ± 5%; Response time: Tr < 10ms.
Table I. Scale values ESC (Q1Q0) K
00 10 V 01 10–1 V 11 10-3 V
ii) Logarithmic Output Transference: VLOG = 8.6021V + 2 log (Vin/1V), (that is: 2V/dec.) VLOG Range: 4Vdc ≤ VLOG ≤ 10V; Accuracy: ± 50mV (that translates to ± 12% in flux error) VLOG Response Time: Tr < 10ms.
3. System characterization
3.1. Electronics To evaluate the performance of the entire electronic system, the laboratory set-up shown in FIG. 3 was implemented.
FIG. 3. Laboratory test set-up.
Pulse mode measurements (switch A in “PULSE MODE”)
The system was driven with a random pulse signal (Ni), generated by a BNC, mod. DB2, pulse generator. The auxiliary circuit PULSE SHAPER was adjusted to obtain current pulses with an approximately Gaussian shape and the following parameters:
Pulse height: 1µA; Full width at half maximum (FWHM): 0.2µs, Rate: variable.
The trigger level of the K690 was set at 0.75µA. With the Canberra double channel PULSE COUNTER, two simultaneous measurements were made: the system input pulse rate and the output pulse rate at the output of the K690 at several pulse rates. Both measurements were compared and the resulting error was computed. Results are shown in Table II, where the Equivalent Neutron Flux was computed according to the pulse mode sensitivity specification of the Fission Detector to be used.
Table II. Pulse mode measurements. Average Input Rate
(Pulse/s) Equivalent Neutron Flux
(nv) Computed Error
(%) Ni < 2 x 10⁵ 1.8 x 10⁶ 2.2 Ni < 5 x 10⁵ 4.5 x 10⁶ 6.8
34

IAEA-CN-100/31P Fluctuation mode measurements (switch a in “fluct. mode”)
The system was driven with a current fluctuation signal generated by the HP mod. 33120A generator. Its controls were set to obtain the noise current densities shown in Table III. Corresponding values of neutron flux were estimated using the FM sensitivity specification of the Fission Detector to be used.
Table III. Fluctuation mode measurements. Fluct. Input Curr. Range
(A/Hz 1/2 ) Equivalent Flux Range
(nv) LIN Error LOG Error
38 x 10-12<IF<17 x 10-9 3 x 10⁵<φ<6 x 10¹⁰ 5% 5% 17 x 10-12<IF<19 x 10-9 6 x 10⁴<φ<0.7 x 10¹¹ 11% 10%
3.2. Entire system Several tests were performed on the system. The most representative consisted in positioning the FD inside the nuclear reactor pool at the RA-3 facility. FIG. 4 shows the experimental set-up.
FIG. 4. Experimental set-up used during the system test. The FD was positioned inside the reactor pool using a watertight container. 15 meters of cable were used to carry polarization to and extract the signal from the FD. To have a second measurement, a compensated ionization chamber (CIC), also developed at CNEA, was used to monitor neutron flux and gamma level.
In the first place, before start up, the container was put as close to the core as possible, to do a first measurement with no neutrons and at high gamma dose. Then, the system was moved to a convenient position where it remained for the rest of the experiment. The power was raised in steps from start-up to full power and measured using a neutron noise technique with independent instrumentation. The signal coming from the FD was driven to the designed preamplifier, where PM and FM processing was carried out simultaneously. The PM output was measured with a commercial counter and the FM output was measured both with a commercial true rms voltmeter as well as with a especially designed amplifier with logarithmic and linear indications. The signal coming from the CIC was measured with an electrometer. For each power level the following signals were recorded:
Rate: Counter lecture coming from the PM preamplifier output. V rms: Commercial voltmeter lecture coming from the FM preamplifier output. V lin: Linear output of the MSV amplifier indicating mean value of the quadratic fluctuation. V log: Logarithmic output of the MSV amplifier indicating mean value of the quadratic
fluctuation. I DC: Direct current coming from the FD.
35

IAEA-CN-100/31P I comp: [compensated current] Direct current coming from the CIC, when compensation was
enabled (gamma effect is lowered). I //: [parallel current] Direct current coming from the CIC when compensation was not
enabled (the chamber becomes sensitive to gamma).
Previous versions of both K690 preamplifier and K750 MSV amplifier were used in this test. According to the results obtained in this experience, both modules were modified to improve their performances.
3.2.1. Effect of the gamma field To evaluate the response of the system to gamma, with the reactor shut down, the container was placed in the most nearer to the core position available. Neutron flux was almost negligible (mainly photoneutrons) and gamma field was high. Results obtained in this part are presented in Table IV.
Table IV. Measured values in gamma field.
Neutron [nv]
Gamma [R/h]
Rate [cps]
V rms [V]
I DC [A]
I comp [A]
I // [A]
3 104 7 105 3500 0.0185 1.05 10-4 -1.95 10-8 1.15 10-5
The negative value of the compensated current from the CIC is an indication of the preponderance of the gamma field over the neutron field. The gamma field was estimated from the known value of the gamma sensitivity of the CIC and neutron field from the PM sensitivity of the FD. The sensitivity used for the FD was the one corrected for the discriminator level that had been previously set in order to avoid gamma counting. FM signal was in this case mainly representative of gamma field.
3.2.2. Response to neutrons
To reproduce a more realistic instrumentation location, the FD was moved to a position not so close to the core. Signals obtained during this part of the experience are presented in Table V and values normalized to the minimum ones plotted in FIG. 5. Neutron noise based calibration provides independent values of power that will be used to evaluate linearity of the system.
Table V. Measured values from the FD and the CIC.
Power [W]
Rate [cps]
V rms [V]
V lin [V]
V log [V]
I DC [A]
I comp [A]
I // [A]
16.8 4860 0.0038 5.0 10-7 2.88 3.4 10-7 3.9 10-10 4.05 10-8 87.3 24280 0.0079 3.7 10-6 3.4 3.5 10-7 1.3 10-9 4.1 10-8
369.6 96140 0.0155 2.48 10-5 4.17 3.75 10-7 4.9 10-9 4.5 10-8 1823 357830 0.034 1.87 10-4 5.03 5.35 10-7 2.4 10-8 6.7 10-8 9069 830550 0.0765 9.8 10-4 5.78 1.35 10-6 1.2 10-7 1.75 10-7 50160 1150230 0.18 5.83 10-3 6.52 5.9 10-6 6.4 10-7 7.9 10-7
100180 1197970 0.255 1.16 10-2 6.81 1.15 10-5 1.3 10-6 1.55 10-6 503010 1.2 106 (sat) 0.55 5.9 10-2 7.51 5.7 10-5 6.4 10-6 7.6 10-6
1006310 1.2 106 (sat) 0.79 0.11 7.84 1.1 10-4 1.3 10-5 1.55 10-5 5038030 1.2 106 (sat) 1.75 0.58 8.51 5.6 10-4 6.4 10-5 7.5 10-5
4. Discussion of the results Considering the results shown in FIG. 5, the following considerations can be stated:
Direct current from the FD (I DC) becomes proportional to neutron flux for levels higher than 107 nv. For lower fluxes, neutron signal is buried in the gamma contribution from the core. This can also be
36

IAEA-CN-100/31P seen from the fact that I DC follows the uncompensated output from the CIC. Then, Current Mode is not adequate to follow neutron flux as was pointed previously.
FIG. 5. Measured values normalized to minimum values. Using FD and CIC (in non-compensated configuration) sensitivities neutron flux and gamma dose rate were obtained. Values are presented in Table VI.
Table VI. Neutron flux and gamma in each power step.
Power [W]
γ Dose rate [R h-1]
Neutron flux [n cm2 s-1]
16.8 2.36 103 3.94 104 87.3 2.34 103 1.95 105
369.6 2.36 103 7.70 105 1823 2.53 103 3.73 106 9069 3.24 103 1.89 107 50160 8.82 103 1.05 108
100180 1.47 104 2.10 108 503010 7.06 104 9.79 108
1006310 1.47 105 2.02 109 5038030 6.47 105 9.91 109
Curves identified as PM and FM in FIG. 6 show the output of the Campbell system (Pulse and Fluctuation Modes respectively) as a function of the neutron flux. Using the FM sensitivity for gamma, the simulated responses of the system in the presence of gamma fields of 0.1 MR/h and 1 MR/h were added to the graph.
From the PM curve, it can be seen that the system remains linear for neutron fluxes around 106 nv, where the count rate is higher than 105 cps, which is not easily found in conventional instrumentation. Losses not greater than 5% were obtained for a 7.7 105 nv flux. Laboratory tests showed that the system was able to count fluxes around 102 nv (10 cps) adequately, so it can be established that PM operates properly for neutron fluxes between 102 and 7.7 105 nv. For the next flux step, 3.73 106 nv, losses were around 20%, mainly due to the lack of restoration of the base line of the pulses. The new preamplifier design incorporated a BLR to solve this problem.
From the FM curve, it can be deduced that, in the chosen position, FM becomes a good parameter of neutron flux since 1.95 105 nv. Higher flux recorded in the experience was ∼1010 nv which made the system deliver a 1.75 Vrms signal. Preamplifier design imposes a maximum Vrms output of 5 V which
37
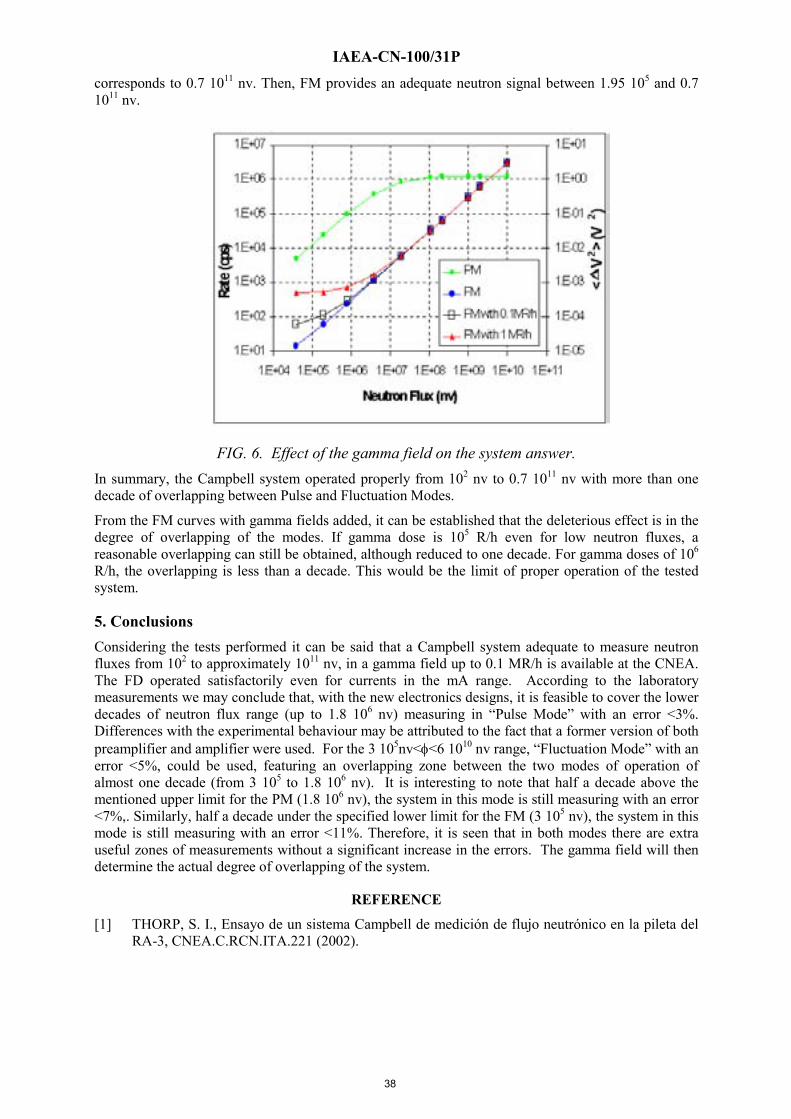
IAEA-CN-100/31P corresponds to 0.7 1011 nv. Then, FM provides an adequate neutron signal between 1.95 105 and 0.7 1011 nv.
FIG. 6. Effect of the gamma field on the system answer. In summary, the Campbell system operated properly from 102 nv to 0.7 1011 nv with more than one decade of overlapping between Pulse and Fluctuation Modes.
From the FM curves with gamma fields added, it can be established that the deleterious effect is in the degree of overlapping of the modes. If gamma dose is 105 R/h even for low neutron fluxes, a reasonable overlapping can still be obtained, although reduced to one decade. For gamma doses of 106 R/h, the overlapping is less than a decade. This would be the limit of proper operation of the tested system.
5. Conclusions Considering the tests performed it can be said that a Campbell system adequate to measure neutron fluxes from 102 to approximately 1011 nv, in a gamma field up to 0.1 MR/h is available at the CNEA. The FD operated satisfactorily even for currents in the mA range. According to the laboratory measurements we may conclude that, with the new electronics designs, it is feasible to cover the lower decades of neutron flux range (up to 1.8 106 nv) measuring in “Pulse Mode” with an error <3%. Differences with the experimental behaviour may be attributed to the fact that a former version of both preamplifier and amplifier were used. For the 3 105nv<φ<6 1010 nv range, “Fluctuation Mode” with an error <5%, could be used, featuring an overlapping zone between the two modes of operation of almost one decade (from 3 105 to 1.8 106 nv). It is interesting to note that half a decade above the mentioned upper limit for the PM (1.8 106 nv), the system in this mode is still measuring with an error <7%,. Similarly, half a decade under the specified lower limit for the FM (3 105 nv), the system in this mode is still measuring with an error <11%. Therefore, it is seen that in both modes there are extra useful zones of measurements without a significant increase in the errors. The gamma field will then determine the actual degree of overlapping of the system.
REFERENCE
[1] THORP, S. I., Ensayo de un sistema Campbell de medición de flujo neutrónico en la pileta del RA-3, CNEA.C.RCN.ITA.221 (2002).
38

IAEA-CN-100/54P
Optimization of Safety System Test Frequencies D.J. Winfielda, C.A. Alsopb
aAECL, Chalk River Laboratories, Chalk River, Ontario, Canada bNNC, Knutsford, Cheshire, United Kingdom
Abstract. Demonstrating that a probabilistic target of 10-3 can be met for the system safety unavailability of redundant channel trip systems of power and thermal power research reactors has been one of the cornerstones of Canadian nuclear safety philosophy for decades. This paper discusses the unavailability analysis from 21 years of experience with safety system testing on the 135 MW(th) NRU research reactor at Chalk River Laboratories.
1. Introduction Particular features of the safety system analysis are: • quantification of common cause failure parameters from failure statistics and their use in
the safety system unavailability models, • demonstration of the dependence of system unavailability upon the test interval, • demonstration of an optimum test interval, and • use of the exponentially weighted moving average technique to identify trends in the trip
channel failure rate data.
2. Trip system unavailability model The reactor trip system, gravity-assisted shutoff rods, has a requirement that each reactor trip parameter can demonstrate a trip system unavailability Q of 10-3, reported on an annual basis. Historically this rigorous quantification requirement can be traced back to the aftermath of the NRX reactor accident at Chalk River in 1952, [1]. Subsequently, this unavailability target for trip systems has been used for Canadian power, as well as research reactors and has also been utilized as a target for other reactor safety systems, [2].
Demonstration of each trip parameter unavailability is achieved through routine testing of the redundant instrument channels of each trip parameter. A large uncertainty in demonstrating the numerical target has however predominated in defining the model used for Q. Originally, trip channel test intervals, upon which Q depends were chosen assuming Q was modelled on independent channel failures. In these early years the concept of Common Cause Failure (CCF), while being recognized qualitatively, could not be incorporated into the model for Q, as CCF quantification models were not available. The late 70s then produced the simple β factor model, so that the non-conservative independent channel model for Q could now incorporate CCF. Triplicated and quadruplicated trip redundancy is not however credited using the simple over-conservative β factor model. In the late 80s, improved, but more complex CCF quantification models such as the Multiple Greek Letter MGL model, [3], became available. An instructive comparison of the relationship of the MGL to other CCF quantification models is provided in [4] which shows generally that the MGL model does not impose any particular limitations. Practical use of a more complex CCF model means however that more parameters have to be used and these can only be reliably predicted when an extensive failure data base is available. The scarcity of CCF failures and the additional practical difficulty of uniquely classifying CCF failures into a CCF model, even with the 21 years of consistently produced NRU test experience, still means there is some uncertainty remaining in a CCF-model for Q. Basically, the use of a more accurate and rigorous model for
39

IAEA-CN-100/54P
Q results in moving some of the uncertainly into the numerical assessment of the CCF parameters needed by the model.
Expressions were derived for Q in terms of the single channel unavailability q and the common cause MGL model parameters, [3] and [5]. The reactor trip system uses both 2-out-of-3 and 2-out-of-4 to trip redundancy for various trip parameters. Table 1 summarizes the expressions for other common redundancy systems for completeness. CCF-related terms are shown bolded; independent coincident failure terms are shown non-bolded. Higher order independent failure terms in q are neglected in column 2. Values for MGL parameters derived from 21 years of accumulated NRU test experience have been incorporated in the column 3 expressions. Failures may be from mechanical, instrumentation or electrical components. The same MGL parameters differ according to the redundancy design, [5], so different numerical values for the same parameters are used in the 2-out-3 and 2-out-of-4 designs. The major practical difficulty with MGL is the sparcity of failure data, but with the accumulated data from 21 years some reasonable confidence was placed on the parameter ranges. The final usable expressions for Q in column 3 are quite simple, in all cases reducing to simple easy-to-use expressions involving only q. Higher order terms of q can be neglected in all cases for Q, except for the 1-out-of-2 system.
MGL β, γ and δ parameter estimation depends upon the level of system redundancy, and also upon the testing schemes, [5]. These factors have therefore to be accounted for when the MGL parameter data was derived from the trip systems with different redundancies. The impact vector method, [5], was used to provide the means of using failure data from systems with different levels of redundancy and applying it to the system for which CCF parameter estimation is required. It was reasonably assumed that the different types of trip parameter channels were sufficiently similar, between the three and four level redundancy systems.
3. Verification of the trip channel unavailability model q A well known derivation for the time-averaged single channel unavailability q, [6], is.
q = qd + λsT/2 + q0TT/T + qdTR/T + qM + qHE (1) where: qd is the probability of failure per demand (demand unavailability),
λsT/2 is the unavailability from the standby failure rate contribution, λs is the standby failure rate and T the time interval between tests,
Table 1: Safety unavailability expressions for redundant channel systems using MGL model: (CCF terms shown italicized; independent coincident failure terms shown non-italicized)
Redundant Channel
System (n out of m)a
System Safety Unavailability Qb
System Safety Unavailability Q
(CCF parameters quantified)c
1 out of 2 q2 + βq 0.06 q + q2 2 out of 3 3q2 + 1.5 βq (1 - γ) + γβq 0.15 q 2 out of 4
4q3 + βγq (4 - δ)
3 0.012 q
3 out of 4
6q2 + βq [2 - γ (2 + δ)] 3
0.22 q
40

IAEA-CN-100/54P a n out of m channels are needed to operate (or fail safely) to trip the system or (m - n + 1) channels out of m need to fail unsafely, in order for the system to be made unavailable. b Higher order independent channel failure terms in q than those noted are neglected. c The non-italicized independent failure unavailability contributions in column 2 are negligible
in all cases except for 1-out-of-2. The numerical MGL values used take into account the testing scheme, as discussed in [5].
q0TT/T is the testing time unavailability, resulting in the event of a true demand during a test, where q0 is the fraction of time during the test duration (TT) that the channel is unavailable for service and subsequent repair.
qdTR/T is the repair time unavailability, resulting from a test failure and subsequent repair time (TR).
qM is the maintenance unavailability. This is the average fraction of time per year that preventive maintenance is performed.
qHE is the human error unavailability during inspection, testing or repair that result in a single channel emerging unavailable from the operation.
While the first two terms of Equation [1] provide a physically reasonable and traditionally accepted model[1] failure rate data is rarely available that separates out demand failures from standby failures. This is because an extensive experience base, with failure data derived from different test intervals, is needed to distinguish between the two contributions.
The third to fifth terms represent unavailability in terms of unavailable time/total time and can be well defined from test and maintenance procedures. The last term is partially subjective, but historical failure data provides a reliable upper limit.
Figure 1 shows the time-averaged failure-to-operate upon demand, (qd), and the standby failure rate unavailability, (λsT/2), contributions, see Equation (1), as a function of test period T. Table 2 summarizes the data for both three and four channel trip systems for 1976-1996 test data. The straight lines represent best linear fits to the data. The three channel data indicates a positive y-axis qd contribution, within statistical accuracy. The four channel data, of lower accuracy because of the smaller number of total demands, indicates qd is close to zero. Combining the two data sets, not shown on Figure 1, provided a composite data set, very similar to that of the three channel data, with about the same prediction for qd as the three channel data. It should be noted that as much as 21 years of data was required to produce the accuracy of Figure 1.
Uncertainty bounds shown on the Figure 1 data points represent a 90% confidence
range. The test and failure data is considered to be very high quality due to the fact that the total number of tests, the test intervals, and failures are accurately documented.
An implicit assumption from the data of Figure 1 is that the values plotted all represent identical channels, from primary sensor to final trip relay. For the two quadruplicated channel data points this assumption is not required as the quarterly and monthly tested trip unit channels are identical. The triplicated channel data however does represent different types of [1] q and λsT are assumed to be < 0.1. The use of T/2 in the second term assumes testing is either random or sequential. In general test schemes are usually a mixture of random, sequential or optimized staggering [5]. When an weighted effective average is made for either the 2-out-of-3 or the 3-out-of-4 the differences between the multiplying factor for λsT is not large. The actual testing which best represents trip system testing in NRU is a mixture of sequential and optimized staggered channel testing.
41

IAEA-CN-100/54P
trip units which are not all identical. Some of these triplicated trips consist of mainly electronic components; others have similar electronics but additionally have some mechanical components. The values of the Figure 1 slopes, of the quadruplicated and triplicated data from which λs is determined are however consistent, within the slope confidence bounds. This suggests that the uncertainty in λs is dominated by low failure statistics, rather than any inherent difference in λs between triplicated and quadruplicated systems. On this basis, the assumption of identical trip channels is taken to be valid.
The Figure 1 results are also similar to those obtained for diesel generator start tests [7], where both types of failure-to-operate on demand unavailability contributions could also be distinguished. The dominant unavailability contribution for the reactor trip systems data is from the time-dependent failure rate λs unavailability contribution. While there are large uncertainty bounds on the data points, both the three and four channel data sets clearly show the time dependent contribution in an upward trend. Physically the positive slopes of the best linear fit lines indicate that, as the time between tests increases, there is an increasing chance of a random dormant failure occurring. This dormant failure demonstrates itself upon the next test. For the combined three and four channel data, Figure 1 gives λs = 3.3 x 10⁻⁶/ hour and qd = 8 x 10⁻⁴ failures per demand.
4. Determination of optimum test interval The analytic expression for the optimum test interval TOPT was first discussed by Jacobs [8] and was based on the assumption of a single channel. In order to find the optimum (smallest) unavailability as a function of test interval T, Equation (1) is differentiated with respect to T and set to zero with the result:
(TOPT) = [2(q0TT + qdTR)/ λs]1/2 (2) Physically Equation (2) means that the optimum test interval, for a single channel, becomes smaller as the standby failure rate λs increases. The unavailability due to failures occurring between tests can thus be minimized. The test interval T cannot be reduced indefinitely to bring the λsT/2 unavailability term to zero, as resulting increased test failures will increase unavailability.
To find the optimum test interval TOPT the following values are used in Equation (2):
qd = 8 x 10⁻⁴
λs = 3.3 x 10⁻⁶ / hour TR = 2 hour TT = 0.1 hour q0 = 1.0
from which TOPT = 10 days. The 90% confidence range on TOPT is from about 5 days to 22 days. Both qd and λs were determined from the historical safety system channel failure data as noted above. Other parameters are a function of the test scheme.
Figure 2 shows the total single channel unavailability q(T) using Equation (1) as a function of test interval. Minimum (optimum) unavailability is about 1.8 x 10⁻³. Unavailability contribution terms (1, 2, 5 and 6) and terms (3 and 4) of Equation (1) are shown separately to illustrate TOPT. The time independent terms of Equation (1) [qd, qM, qHE], estimated to make a total contribution of 10-3 to the unavailability y-axis scale, are included as part of the right hand side dashed curve and also shown as a dotted line. The two time independent terms, [qM, qHE], make a combined contribution of about 2 x 10⁻⁴ to the total.
42

IAEA-CN-100/54P
Table 2: Safety system trip channel test and failure data summary (1976 to 1996)
Test Frequency Failures Number of Channel
Tests 3 Channel Failure on Demand
4 Channel Failure on Demand
Semi-Annually 1(T) 120(T) 0.0083 not available
Quarterly 16(T), 2(Q) 3204(T), 1344(Q) 0.0050 0.0015
Monthly 11(T), 1(Q) 3713(T), 3024(Q) 0.0030 0.00033
Weekly 7(T) 4719(T) 0.0015 not available
(T) = triplicated channel test data (Q) = quadruplicated channel test data
0
0.002
0.004
0.006
0.008
0.01
0 1 2 3 4 5 6 7
Triplicated Channels
Quadruplicated Channels
Una
vaila
bilit
y (d
eman
d an
d st
andb
y fa
ilure
rate
con
tribu
tions
)
Test Interval (months)
95% limit is 0.04
FIG. 1. Trip channel unavailability terms (qd + λsT/2) as a function of test interval derived from triplicated and quadruplicated safety system test data, 1976 to 1996, from Table 1. Straight lines are best linear fits to data points. Data point confidence limits show the 90% confidence range. The value of TOPT in Equation (2) is mainly sensitive to the values of TT and λS. Figure 2 shows that there can be quite a large variation for test intervals about the TOPT value, with very little effect on the single channel and also the system unavailability.
The derivation of TOPT above assumes a single non-redundant channel situation.
If the expressions for system unavailability Q from Table 1 were used assuming complete channel independence then the expression for TOPT would be complex, and different from
43

IAEA-CN-100/54P
Equation (2). The CCF-derived expression for Q in column 3 of Table 1 thus simplifies the analysis for TOPT for redundant systems as Q is now proportional to q. The numerical value derived above for TOPT for a single channel system is thus also valid for the actual multi-channel redundant systems.
0.0001
0.001
0.01
0.1 1 10 100
Tota
l Sin
gle
Cha
nnel
Una
vaila
bilit
y q(
T)
Test Interval T (weeks)
total q
time independent contribution of 0.001 from terms 1, 5 and 6 of Equation 1
demand, standby failure rate,human error and maintenance contributions (from items 1, 2, 5, and 6 from Equation 1)
test and test failure contributions (items 3and 4 from Equation 1)
FIG. 2. Single channel unavailability q as a function of test interval T, from equation (1).
5. Channel failure rate and system unavailability trend monitoring determination by the EWMA method
To determine whether individual trip parameter failure data can comply with the system unavailability target the current trip parameter failure rate is required to be used in the model for Q(q), in column 3 of Table 1.
It is also important to detect any increased trend in failure rates for individual trip channels. An increased trend might indicate the onset of systematic failures, such as wear-out or some external systematic problem. With very low failure statistics, the identification of a failure rate trend is not evident, unless a systematic trend method is used. Older failure data usually becomes less relevant and a failure rate trending method should reflect the decreasing influence of older data.
The Exponentially Weighted Moving Average (EWMA) technique is recommended for determining the historical failure rate as well as predicting any failure rate trend. The technique was first discussed in detail in 1959, [9]. However little use appears to have been made of the technique for engineering applications until 1986. At this time the EWMA method was suggested, [10], to be used for real time dynamic control of industrial processes, because of its predictive capability.
44

IAEA-CN-100/54P
Hunter [10] provided a comparison of four different types of data trending methods available and in particular discussed the advantages of the EWMA technique. The simplest trending method discussed is the classical Shewhart chart, [10], where only the last data point deviation from the average is used to indicate that a deviation exceeds a given confidence level. The second trend method is the cumulative sum (CUSUM) method which determines a deviation based on the total sum of all data point deviations from the average; equal weighting of all data is thus implied. The third trend method is the moving average. This latter method improves upon the two former methods, giving equal importance to the last, say five points, and eliminates weighting of any data prior to these.
The fourth method discussed in [10] is the EWMA method. The method gives less and less weight to data as they get older and older. The EWMA data is calculated as:
yt+1 = λyt + (1 - λ) yt (3)
where:
yt observed number of failures at time t,
yt+1 predicted EWMA number of failures at time t = t + 1,
λ user-specified exponential decay constant, 0 < λ < 1, and
yt predicted EWMA number of failures at time t, (the old EWMA).
The choice of the value for λ is left to the judgement of the analyst. The smaller the value of λ the greater the influence of the historical data. The exponential weighting factor from Equation (3), λ is 0.20 ± 0.10, as recommended in [10].
Only recently [11] has the EWMA technique been discussed in relation to determining failure data trends for nuclear power plant applications. This latter paper also discusses both failure rate data (Poisson data) and failure-on-demand data (Binomial data).
0
1
2
3
0 5 10 15 20 25
annual no of channel failuresEWMA failure dataupper EWMA 95% confidence limit
annu
al n
o of
cha
nnel
failu
res
year
FIG. 3. Annual trip channel failure data as function of time and corresponding EWMA
failure data trend predictions.
45

IAEA-CN-100/54P
The algorithms used in this study for the EWMA data and associated confidence bound calculations, based on [10], are incorporated into an EXCEL spread sheet, allowing easy failure data and trend chart updating. Typical failure data for safety systems is shown in Figure 3, from yearly test data on a single trip channel. The exponential weighting factor from Equation (3), λ is 0.20 ± 0.10, as recommended in [10]. The smaller the value of λ the greater the influence of the historical data.
The EWMA consists of the predicted EWMA plots for smoothed failure data with a 95% confidence limit on the EWMA failure data as a function of time. The EWMA data then provides a graphical indication of any trend in the underlying failure rate over time. A statistical indication of an increasing trend or pattern occurs when the EWMA data falls outside the defined upper confidence limit. The last EWMA data point is a prediction based on the past history. From the 95% upper confidence limit, Figure 3, it can be seen that the last failure brings the EWMA prediction just up to the confidence limit. Prior to this there is no evidence, at the 95% upper confidence limit, of any non-random tend. Therefore, the conclusion is that there is the potential onset of an increased failure trend at the 95% upper confidence limit.
6. Conclusions Analysis of the extensive 21 year historical trip system test records of NRU shows that the test interval can be optimized in terms of the various test and failure data parameters. Channel failure probability as a function of test interval is shown to be dominated by a linear dependence on the standby failure rate component. Adequate test and failure statistics were available to be able to satisfactorily employ an unavailability model, utilizing MGL CCF parameters to demonstrate compliance with the target requirement for system unavailability Q.
Use of the EWMA failure data trending technique is recommended in order to determine the long term trip channel failure rates needed to demonstrate compliance with the system unavailability target. The EWMA trending technique also provides a method, particularly valuable for low statistical accuracy data, to recognize the onset of any trend in the channel failure rate, within a predetermined confidence limit.
REFERENCES [1] LEWIS W.B., The Accident to the NRX Reactor on December 12, 1952,
AECL-232, July 1953, Reprinted, October 1960.
[2] ATCHINSON R.J., BOYD F.C., DOMARATZKI Z , Canadian Approach to Nuclear Power Safety, Nuclear Safety, Vol. 24. No.4, p.439-458, 1983.
[3] FLEMING K.N., KALINOWSKI A.M., An Extension of the Beta Factor Method to Systems with Higher Levels of Redundancy, PLG-0289, 1983 June, Pickard, Lowe and Garrick, Inc.
[4] VAURIO J.K., The Theory and Quantification of Common Cause Shock Events for Redundant Standby Systems, Reliability Engineering and System Safety, Vol. 43, p.289-305, 1994.
[5] Procedure for Treating Common Cause Failures in Safety and Reliability Studies, NUREG/CR-4780, EPRI NP-5613, Volumes 1 and 2, 1988.
[6] VAURIO J.K., Availability of Redundant Safety Systems with Common Mode and Undetected Failures, Nuclear Engineering and Design, Vol. 58, p.415-424, 1980.
46

IAEA-CN-100/54P
[7] WINFIELD D.J., Long Term Reliability Analysis of Standby Diesel Generators, Reliability Engineering and System Safety, Vol. 21, p.293-308, 1988.
[8] JACOBS I.M., Reliability of Engineered Safety Features as a Function of Testing.
Frequency, Nuclear Safety, Vol. 9, No.4, p.303-312, 1968.
[9] ROBERTS S.W., Control Charts Based on Geometric Moving Averages, Technometrics, Vol. 1, No.3, p.239-250, 1959.
[10] HUNTER J.S., The Exponentially Weighted Moving-Average, Journal of Quality Technology, Vol. 18, No.4, p.203-210, 1986.
[11] MARTZ H.F. KVAM P.H., Detecting Trends and Patterns in Reliability Data Over Time Using Exponentially Weighted Moving-Averages, Reliability Engineering and System Safety, Vol. 51, p.201-207, 1996.
47

IAEA-CN-100/71P
Improving the Balance Between Operator Responsibility and Safety Authority Control for Research Facilities C. Eybert-Prudhomme, J. Avérous General Directorate for Nuclear Safety and Radiation Protection, France
Abstract. In 2002 the French nuclear safety authority (ASN) decided to hand over more responsibilities to the operators of the research installations of the French atomic energy commission (CEA). T he ASN drafted provisions enabling the CEA to authorize in-house, without prior agreement by the ASN, changes in the safety reference systems of its nuclear installations, excluding changes compromising the installation safety demonstrations. This new approach thus re-empowers the operators, while obliging them to use procedures for informing the ASN and to update the installation safety reference systems regularly, so that these reference systems are constantly in conformity with the state of the installations they describe. Finally, this approach enables the ASN to focus on topics of major importance for safety.
1. Introduction The Atomic Energy Commission (CEA) is a public body whose tasks include research and development in the civil nuclear field. In this context the CEA operates a total of 39 nuclear installations, including 27 research installations (reactors, laboratories, etc.) and 12 support installations (treatment of effluents and waste, etc.). These installations are located on 5 sites in France. Fifteen of these installations, no longer in use, are in various phases of cleanup and dismantling. Safety and radiation protection of civil nuclear installations are supervised by the nuclear safety authority (ASN).
2. CEA nuclear installation safety reference systems The main elements of the safety reference system for each nuclear installation are:
- an inter-ministerial authorization decree, - technical requirements (PT), drafted by the public authorities, signed by the ministers, - a safety report (RDS), drafted by the operator and submitted to the ASN for examination, - general operating rules (RGE), drafted by the operator and submitted to the ASN for
examination.
According to the regulations, these documents must be kept up to date, and the ASN must be informed of any changes. However, over time it had become customary for an explicit agreement by the ASN to be given before any change was incorporated into these documents. As research installations or installations being dismantled are by nature undergoing frequent changes, this custom resulted in saturation of the expert assessment capacities available to the ASN and in very long response times. Furthermore, the ASN could no longer devote enough time to the most important and long-term safety problems. Eventually the approval times became so long that in practice the documents were not updated very frequently, and in the end did not conform to the actual configuration of the installations. Moreover, long approval times for reasons that were not related to safety were harmful to society as a whole.
It appeared necessary to set up a system that placed the operator, which legally has primary responsibility for the safety of its installations, back at the centre of this responsibility, while enabling the ASN:
48

IAEA-CN-100/71P
- to have sufficient confidence in the operator’s system, - to be kept sufficiently informed of changes that the operator plans for its installations, - to focus more on the most important safety problems.
For this reason the CEA, under certain conditions, was given the power to authorize certain changes in the installations in-house. The authorizations that can be delivered in-house within the CEA concern only the changes that do not conflict with the authorizations given by the public authorities (decrees and technical requirements).
3. Authorizations deliverable by the CEA The director of a CEA centre can thus deliver any change authorization for one of its installations, in compliance with the authorization decree and the technical requirements of the installation, excluding operations significantly affecting the safety demonstration of the installation. The safety demonstration of an installation is considered not to be compromised if: - the inventories of radioactive substances and toxic chemicals, and the hazards related to
the use of such substances, are not increased significantly,
- the radiological or toxic impact in post-accident operation is not increased significantly in comparison with the accidents studied in the safety reference system,
- in terms of criticality hazard prevention, the criticality monitoring method is not changed,
- the lines of defence are improved, or are not degraded and remain adequate, with regard to the design of physical barriers, the operability of organizational barriers, the definition of physical protection and alarm thresholds, and the effectiveness of the arrangements for limiting the consequences of accidents. In the case of extraordinary work, the additional lines of defence installed and the state of the installation when the work is in progress do not result in an increase of the hazard caused by the installation.
The conditions defined above do not express any quantitative limits, as it was considered that such limits would generate threshold effects which could be harmful. Instead it was decided to request the operator to decide whether the safety demonstration was compromised and to inform the ASN in advance so that the authority can react if necessary (refer to paragraph 4).
The power to deliver in-house authorizations was given to the directors of research centres because in the CEA such centres are large institutions which have independent and substantial supervision and safety resources. For other operators, which have smaller sites, the choice was made to give this power to deliver in-house authorizations to a national manager, the only level with sufficient resources, particularly in terms of independent analysis of safety files.
4. In-house authorization delivery conditions The conditions defined in this part have been imposed by the ASN because they seemed necessary to provide adequate guarantees of the quality of the safety analysis carried out by the operator, and also to guarantee the existence of a certain number of internal documents which could be examined during inspections to assess the quality and the soundness of the process.
4.1. Safety file A CEA installation that wants to change its safety reference system or waive the safety reference system temporarily must justify its change or waiver authorization application by submission of a safety file to the centre director for approval. This file must contain at least the following elements:
49

IAEA-CN-100/71P
- a detailed description of the operation concerned by the application, - an analysis of the conformity of the planned operation with the authorization decree and
the technical requirements of the installation, also showing that the installation safety demonstration is not compromised, or that the planned palliative measures compensate the degradation of the existing lines of defence,
- identification of the factors justifying the application, specifying in particular the references of the safety report or the general operating rules that are not strictly complied with; in particular, the impact of the operation on the completion of inspections, periodic tests or preventive maintenance required by the general operating rules of the installation before, during and after the operation will be verified,
- analysis of the risks related to the safety of the installation both during the planned operation (transition phase) and in the final state after the operation, taking into account operating feedback,
- equipment testing and qualification or re-qualification procedures, - the radiation protection optimization approach, with the principal iterations of the
optimization and a description of the adopted solution, - if the operation might necessitate potential urgent procedures identified during the
preparation of the work (equipment corrective maintenance, for example), the radiation protection optimization approach for such procedures; if urgent procedures are really implemented, this initial approach must be updated to take the actual situation into account,
- the radiological and waste zoning planned before, during and after the operation - affected areas other than safety (including environment, occupational safety, pressurized
apparatus, energy, nuclear security, transport security), - the affected documents, - if relevant, the procedure for tracking and supervising contractors employed for the
operation, - the waste and effluents potentially generated and their disposal conditions, - the planned period of use of the authorization, in the case of a non-recurring operation.
4.2. Safety file analysis conditions The centre director must have set up:
- a safety unit capable of analyzing the safety files submitted by the installations of the centre; the members of this unit must be independent of the installations and must not participate in the drafting of the installation safety files; in practice this safety unit is the independent supervision line of the installations on a day-to-day basis,
- a safety committee composed of members independent of the centre installations, including recognized experts in various relevant technical disciplines (civil or earthquake engineering, criticality, reactors, control and command, nuclear ventilation, etc.). It is recommended that some of the experts called upon by the CEA be external experts, who may come from other nuclear operators, for example. The ASN is informed of the composition of the safety committee; the centre safety unit acts as rapporteur of the files to this committee.
When they receive a safety file, the members of the safety unit must carry out a preliminary analysis of the file to determine whether it can be analyzed by the unit or if the significance and the complexity of the safety file necessitate more thorough examination by the safety committee, bringing together several qualified members and, if necessary, experts selected
50

IAEA-CN-100/71P
according to the topic concerned by the change. If it convenes a committee and experts, the safety unit must make sure that none of the persons invited has participated in the preparation of the file submitted by the installation.
After analysis of the file by the unit, or by the committee, the centre safety unit must submit its final opinion and the recommendations resulting from the analysis of the file to the director of the CEA centre for possible authorization of the change or the waiver requested by the installation.
Guided by this opinion, the director delivers the authorization to the installation concerned or withholds it. The authorization granted to the installation may be delivered with additional conditions which the installation must take into account for incorporating the desired change.
The director has the option of not following the opinion delivered by the unit or the committee, as long as the choice is justified in writing in a document made available to the ASN.
5. Procedures for informing the ASN It was considered necessary for the ASN to have the minimum amount of information it needs to ensure adequate supervision. This information has several objectives:
- to verify in principle that the conditions for not compromising the installation safety demonstration (refer to paragraph 2) are met,
- to verify the overall operation of the in-house authorization process, - to have an installation safety reference system that represents the actual physical state of
the installation at any time. - to enable effective supervision (inspections) by knowing what operations are in progress
at what time in the installations. - to enable the ASN to play its role with regard to operating feedback if the operation
carried out generates useful experience.
However, the ASN does not want to receive the whole of the safety analysis carried out by the operator, for that would mean that it assumed responsibility; the requested information remains at a fairly concise and general level. Clearly the balance that must be found with regard to the details of the information is not easy to define and will be the result of jurisprudence to be established.
5.1. Six-monthly schedule Each centre director sends the ASN the planned programme of installation change operations that the director wants to authorize in-house during the coming year, in principle every six months. This information document must include a few concise descriptive elements for each planned change.
5.2. Information before the application of an in-house authorization When the director of a CEA centre authorizes a change for one of its nuclear installations, at least two weeks before the change work starts he or she must send to the ASN a copy of the authorization delivered to the installation and a concise information document describing the operation that will be carried out. The information document must contain the following information:
- a detailed description of the operation concerned by the authorization, in particular the consecutive phases into which it is divided,
51

IAEA-CN-100/71P
- an analysis of the conformity of the planned operation with the authorization decree and with the technical requirements of the installation, also showing that the installation safety demonstration is not compromised,
- the predicted dosimetry of the operation (maximum individual and collective), if the dosimetry attributable to the operation is significant,
- the provisional operation start date and duration.
5.3. Information during the work The director of a CEA centre must inform the ASN when an installation, as a consequence of a technical problem, is obliged to introduce significant changes in the operation defined initially in its safety file.
Similarly, the centre director must inform the ASN when any of the following are observed:
- slippage in the planned schedule for the completion of a change; - significant exceeding of the predicted dosimetry (more than 50% and 10 h.mSv or more
than 50 h.mSv); - any significant deviation from the safety file.
5.4. Updating of safety documents When a change incorporated into a nuclear installation is intended to remain in place for longer than six months, the centre director must transmit the updated safety documents impacted by the change to the ASN six months before the modified installation is returned to service.
5.5. Final assessment For the change operations that have an interest in terms of operating feedback, the director of each centre must transmit a final assessment document to the ASN, for the purpose of obtaining operating feedback from the completed change operations, no later than two months after the completion of the work. This document contains:
- a description of the significant events that occurred during the operation, - in terms of radiation protection, a review of the planned optimization approach, the
predicted dosimetry, the actual dosimetry for each phase of the operation, an account and an explanation of the observed deviations, and the operating feedback obtained by the operator,
- the quantities of waste and effluents produced by the operation, the comparison with the predicted quantities, and their mode of disposal or storage, indicating either the disposal entity or the storage location and methods,
- the organizational and/or technical operating feedback that the operator obtains from the operation.
6. Supervision by the ASN 6.1. Tracking of information files The ASN verifies that the changes planned by the operator do not lead obviously to unacceptable situations in terms of safety and radiation protection and do not compromise the safety demonstration of the installation.
For this reason the ASN analyzes all the information documents that it receives concerning the change operations planned by the CEA nuclear installations. The in-depth knowledge of the installations by the ASN inspectors is employed extensively at this point. At any time the
52

IAEA-CN-100/71P
ASN can request additional information about an operation, with the option of suspending the incorporation of a change.
In the case of a doubt about a change, the ASN can also arrange on-site meetings for better appraisal of the magnitude of the planned change.
6.2. Inspections The ASN inspects the CEA installations very regularly. In these inspections it verifies on site that: - the changes incorporated into the installations conform to the information communicated
by the centre directors, - the authorizations delivered by the centre directors are granted in conformity with the
directives given by the ASN, - the operations authorized by the directors are followed up correctly in order to avoid any
deviation with regard to the authorization delivered by the centre director.
For this, each centre must be able to make the following documents available to the nuclear installation inspectors: - the safety file submitted by the installation to the centre director, - the analysis report by the safety unit, - the opinion of the safety unit or the safety committee, - if relevant, the document justifying any differences between the recommendations issued
by the safety unit or the safety committee and the decision of the centre director, - the reports of the checks or audits conducted by the centre safety unit on the
implementation of the director’s authorization.
6.3. Updating of the safety documents The ASN requires that all the nuclear installations supply a complete update of their safety documents every two years in order to take into account all the changes incorporated into the installation during the preceding two years.
7. Periodic safety reviews Every ten years the ASN conducts a thorough safety review of each nuclear installation in order to ensure the consistency of the entire safety demonstration. This review:
- verifies the conformity of the installation with the description given in the safety reference system,
- reassesses the design of the installation taking into account current knowledge, codes and standards,
- examines the need to proceed with changes intended to take into account any changes in the regulations.
This system of periodic review of the safety of nuclear installations is a fundamental component of the system of in-house authorizations that has been introduced; it verifies, at appropriate intervals, that the accumulation of small changes incorporated into the installation over the preceding ten years does not compromise the overall consistency of the installation design with regard to the demonstration of its safety.
In addition, these periodic safety reviews are the main lever used by the ASN to improve the safety of the installations, since continued operation of an installation is generally subject to the condition of completion of safety improvement work.
53

IAEA-CN-100/71P
8. Conclusion The deployment of this system was decided in mid-2002; it is gradual and at present applies to only about one-third of the CEA installations, mainly those which have recently undergone a safety review and whose safety reference system has been updated recently. Experience shows that the organizational changes this system involves at the CEA have needed time. Initial operating feedback will be assessed at the end of 2003. Nevertheless, the ASN wishes to pursue the deployment of this system at the CEA in a determined manner. The ASN also plans to set up an equivalent system from the end of 2003 at another operator which is dismantling 9 power reactors that have now undergone final shutdown.
This system of re-empowerment of the operators is based on the possibility for them to decide in-house on the incorporation of minor changes into their installations, as long as they set up a safety supervision system that is legible and easily audited by the ASN. The ASN considers that this organization will in the future allow more efficient supervision of safety in these installations, enabling it to commit more resources to the most important safety problems while maintaining constant supervision of the installations through adequate information procedures.
54

IAEA-CN-100/90P
Investigation on Control Rod Interaction in a Conceptual MTR-Type Reactor T. Taryoa, Prayoto b, Muslim b, R. Nabbi c aCenter for development of Research Reactor Technology-BATAN, Serpong, Indonesia, b Physics Department of Gadjah Mada University, Bulaksumur, Yogyakarta, Indonesia, c Forschungszentrum Juelich, Jülich, Germany
Abstract. Investigation on control rod interaction in RSG-GAS reactor as well as in a conceptual MTR-type reactor (material testing reactor) has been attempted. The investigation deals with estimating the reactivity worths of the reactor control rods as well as the simulated behaviour of the neutron fluxes caused by the control rod interaction. To begin with, a model has been developed as a basis of simulation where the RSG-GAS core was represented as mesh points along X, Y and Z direction and a model of the MTR-type reactor was also developed. To simulate all conditions relevant to the above matter, the verified WIMS-D4 and CITATION codes were utilized as the main tools. The results showed that for the same condition and similar channel power detector, the characteristics of the neutron flux depends on the location of each detector in a reactor core In the case of control rod interaction in a conceptual MTR-type reactor equipped with 2 absorber blades and 2 pairs of absorber blades, the results indicated that the shadowing effects in the MTR-type reactor vary depending on the extent of absorber blades insertion into the reactor core and the effect is certainly more dominant for the case of 2 pairs of absorber blades rather than 2 absorber blades. The neutron flux behaviour caused by the rod interaction in those 2 reactors was finally investigated using a LabView-based model combined with Microsoft Excell. The developed new tool is capable to perform the neutron flux behaviour due to control rod interaction in detail and the new tool can be utilized to analyze the phenomena of control rod interaction in any nuclear reactor through performing a 3-D representation of neutron flux behaviour in more detail. This represents an important contribution that would support safety analysis of a nuclear reactor design in detail in the future. (Keywords: MTR-type reactor, control rod interaction, LabView, MS Excell.)
1. Introduction Investigation on control rod interaction in RSG-GAS reactor, as seen in Figure 1, as well as in a conceptual MTR-type reactor (material testing reactor) has been attempted. The investigation deals with estimating the reactivity worths of the reactor control rods as well as the simulated behaviour of the neutron fluxes caused by the control rod interaction. This study was attempted to enhance the safety assurance and analysis of the reactors.
To begin with, a model has been developed as a basis of simulation where the RSG-GAS core was represented as mesh points along X, Y and Z direction and a model of the MTR-type reactor was also developed. Two models were developed, namely, a conceptual MTR-type reactor with 2 absorber blades and with 2 pairs of absorber blades. The models were then utilized to estimate the reactivity worths of single and collective rods and hence the interaction among the rods can be analyzed.
To simulate all conditions relevant to the above matter, the verified WIMS-D4 and CITATION codes were utilized as the main tools. To investigate the neutron flux behaviour at different locations in RSG-GAS reactor core, 5 similar channel-power detectors were simulated in different positions in the pool reactor and for various control rod insertion and the model analysis was developed for steady state condition.
The results showed that for the same condition and similar channel power detector, the characteristics of the neutron flux depends on the location of each detector in a reactor core. For 2 and 7 rod interactions in RSG-GAS reactor using high density silicide fuels, the results showed that anti-shadowing effect dominantly takes place in both cases. The models were then applied to estimate the
55

IAEA-CN-100/90P reactivity worths of a hypothetical MTR reactor by applying some scenarios of typical blade separations. The results showed that, for all rods down, either shadowing or anti-shadowing effect always occurs in the reactor. In the case of control rod interaction in a conceptual MTR-type reactor equipped with 2 absorber blades and 2 pairs of absorber blades, the results indicated that the shadowing effects in the MTR-type reactor vary depending on the extent of absorber blades insertion into the reactor core and the effect is certainly more dominant for the case of 2 pairs of absorber blades rather than 2 absorber blades.
To simulate control rod interaction in RSG-GAS and in the conceptual MTR-type reactors, the neutron flux behaviour caused by the rod interaction in those 2 reactors was finally investigated using a LabView-based model combined with Microsoft Excell. The developed tool is capable to perform the neutron flux behavior due to control rod interaction in detail. The new tool developed can be utilized to analyze the phenomena of control rod interaction in any nuclear reactor through performing a 3-D representation of neutron flux behaviour in more detail. This represents an important contribution that would support safety analysis of a nuclear reactor design in detail in the future.
The structure of the paper is as follows, while Section 1 describes the introduction of the paper, Section 2 explains the theoretical background for the research work. Sections 3 and 4 respectively describe modelling and methodology of analysis, and results and discussions. Finally, Section 5 describes conclusions and recommendations of the paper.
2. Theoretical background
2.1. Problem formulations The phenomena of control rod interaction in a reactor core should be investigated through observing the neutron flux behaviour in the core. In order to do this, there is the need to solve an integro-differential transport theory. Since the solution of the complete transport theory is very complicated, time consuming and in most cases unnecessary, it is usually arrived at by group-diffusion approximation. The group-diffusion equation can then be solved numerically using finite-difference technique. Thus the whole analysis in order to shed light on the neutron flux behaviour as affected by control rod interaction in the reactor requires the development of adequate computer software and hardware due to the complexity of the nuclear properties and the geometry of the reactor.
2.2. Space-time dependent group diffusion equations The time-dependent group-diffusion equations expanded from the transport equation describe the average reaction rates over an interval of energy referred to as a group in terms of neutron group parameters and have the generic form [1] :
;),()/1(),(),(
),(),()1(),(),(
),(),(),(),(),(
M
1m
ggg
mmm
G
gg'
g''gg'gP
G
gg'
g'/gg's
ggs
ga
gg
∑
∑ ∑∑
=
≠≠
∂∂
=++
−+Σ+
Σ+Σ−∇•∇
ttrtrQtrC
trtrtrtr
trtrtrtrtrD
f
φνχλ
φυχβφ
φφ
(1)
g = 1,…….,G.
The quantity Dg is the diffusion coefficient in group g, while Σag, Σs
g, and Σfg represent the macroscopic
absorption, scattering removal, and fission cross sections, respectively, in group g. The probability per unit time per unit neutron flux that a neutron in group g′ is scattered into group g is denoted by Σa
g′/g. The quantity υg′ is the average number of neutrons produced in a fission induced by a neutron in group g′, and vg is the average speed of neutrons in group g. The neutron flux in-group g is denoted by φg, and Qg is the external source of neutrons in group g. The quantity Cm represents the concentration of
56

IAEA-CN-100/90P
delayed neutron precursors of type m, with a decay constant λm and delayed neutron fractions
βm ( ∑=
≡M
1mmββ ). The fractions of neutrons produced directly by fission and by precursor decay that
have energy within the group g are denoted by χpg and χm
g, respectively. The precursors satisfy a simple balance equation
t
CtrCtrtrf ∂
∂=−∑ ∑
=
mmm
G
1g
g ggm ),(),(),( λφυβ ;
(2) m = 1, ..........., M. It is convenient to write Eq. (1) as a matrix equation
∇•D∇− Ra − Rs+ S + (1 − β) χP FT φ + ∑=
M
m 1
λmχmCm + Q = V−1 [∂φ/∂t] (3)
where φ is a G × 1 column vector of group fluxes, χP and χm are G × 1 column vectors of prompt fission and precursor decay neutron spectra, and FT is a 1 × G row vector with elements υgΣf
g. Q is a G × 1 column vector of group sources. The G × G matrices D, Ra, Rs and V−1 are diagonal with elements Dg, Σa
g, Σsg, and 1/vg, respectively, while S is a G × G matrix with elements Σs
g/g′. Thus, Eq. (3) can also be written in matrix notation
βm FT φ − λm Cm = ∂Cm/∂t ; (4) m = 1,........., M. The spatial finite-difference approximation should be employed to obtain solutions to the static group-diffusion equations, and has been applied successfully to the time-dependent group diffusion equations. To obtain the finite-difference approximation, the reactor model is partitioned into a finite number of elemental regions, with each region enclosing a “mesh point”.
Finite-difference equations may be derived by the box integration method for a variety of two and three-dimensional geometries. For N mesh points, the N × N matrix that represents −∇•Dg ∇, Dg, is real, symmetric, and diagonally dominant, with non-positive off-diagonal elements and positive diagonal elements. The N × N matrices that represent Σa
g, Σsg, Σs
g/g′, υgΣfg, and vg are real, diagonal
matrices Rag, Rs
g, Sg′/g, Fg, and Vg, respectively. The group fluxes and precursors are represented by N × 1 column vectors Ψg and dm, respectively, and the group source is represented by the N × 1
column vector Qg, whose elements are 2
∆Q
2∆
Q 11
++
∧
+= igi
ii
gi Q .
The finite-difference approximation to the kinetics group-diffusion equations may be written as supermatrix equations [1], V − ( D + Ra ) − Rs + S + ( 1− β ) χP’ FT Ψ
+ m
M
=∑
1λm V χm’ dm + V Q = ∂Ψ/∂t,
(5) βm FT Ψ − λm dm = ∂dm/∂t ; (6) m = 1,.........,M. By combining supermatrix Eqs. (5) and (6), eigen vector and eigen values can then be determined and detail derivation of this determination can be clearly seen in elsewhere [1, 2].
2.3. Control rod interaction The total worth of a group of n control rods, when inserted into this reference reactor state, may then be expressed in terms of the individual worths as follows [3] :
[ ] [ ] +∆=∆ ∑=
n
ioioN
1
ρρ [INTERACTION TERMS]. (7)
The magnitude of the interaction terms shown in Eq. (7) is defined by the difference between the exact value of the total worth of the group of control rods and the sum of the individual worths. If there are
57

IAEA-CN-100/90P
N control rods considered, each with a reactivity worth ∆ρi, then the rod interaction effect is formulated as [4],
1
1
...3,2,1 −∆
∆≡
∑=
N
ii
N
ρ
ρδ (8)
If the two control rods are close enough to interact each other then 0≠δ , and in this case there are two possibilities of interaction, 0<δ and 0>δ , respectively. The former case 0<δ or
212,1 ρρρ ∆+∆<∆ shows the well known shadowing effect where the existence of one control rod reduces the reactivity worth of another control rod. On the other hand, the latter case, called anti-shadowing effect, suggests that the existence of one control rod increases the reactivity worth of another control rod. This occurs because the flux depression in the vicinity of each rod is countered partially by the rise in the flux outside the region of influence of the other rods.
3. Modelling and method of analysis
3.1. Verification of the codes applied The application of computer codes, WIMS-D4 and CITATION [5,6], has been validated using an IAEA benchmark reactor of 10 MW thermal power [7]. By applying neutronic problems, the results showed very small deviations compared to those achieved by other standard codes, ANL and BATAN-3DIFF.
The results of the 2 codes have been also compared to those achieved by experimental data of the RSG-GAS first core. For first criticality of the RSG-GAS first reactor core, the C/E (Calculation/Experiment) values using CITATION code is 0.992 (0.8 % deviation). For the excess reactivity of the full core, the C/E value using CITATION code is 0.990 (1 % deviation).
3.2. LabView software LabView is a program development environment which uses a graphical programming language, G, to create programs in block diagram form. LabView is also a general-purpose programming system with extensive libraries of functions for any programming task and includes libraries for data acquisition, GPIB (general purpose interface boards) and serial instrument control, data analysis, data presentation and data storage. LabView includes conventional program development tools, so one can set breakpoints, animate the execution to see how data passes through the program and single-step through the program to make debugging and program development easier.
For RSG-GAS, LabView combined with Microsoft Excel was utilized to dynamically perform 3-D thermal neutron flux distribution caused by control rod interaction in RSG-GAS reactor core. Simulation was made for interaction between 2 rods and 8 rods. The simulation was also extended for simultaneous insertion from 0 cm to 60 cm.
3.3. Method of analysis As seen in Figure 1, rods C8, F5, F8, C5, E4, D9, G6 and B7 were designated respectively as CE1 (control element-1), CE2, CE3, CE4, CE5, CE6, CE7 and CE8. Two scenarios are developed to analyze control rod interaction in RSG-GAS using the silicide fuels. The 2 scenarios are as follows : a) 2 rods inserted (CE1 and CE2) and b) 7 rods inserted (CE1,CE2, CE3, CE4, CE5, CE6 and CE7). The results showed that for all rods down and up, the effective multiplication factors are respectively 0.963322 and 1.099312. Reactivity woths of rods, F5, F8, C5, E4, D9, G6 and B7 are respectively 1.17 %, 1.19 %, 1.44 %, 1.26 %, 1.22 %, 1.36 %, 1.05 % and 0.98 % (in ∆k/k). The total worths of collective rods are then 12.842 % ∆k/k and it can be determined that the total worths of all single rods is 8.785 % ∆k/k. The interaction while all rods down is then +46.2 % representing an anti-shadowing effect. The anti-shadowing effect of 42.6 % means that, at fully down condition, the reactivity worth of each RSG-GAS rod has escalated 46.2 % over that of each previous single rod.
58

IAEA-CN-100/90P
K BS+
BE BEPR
BE BE BE BS+
BE BE
J BE BS+
BE TF BE BE BE BE BS+
BE
H BE FE1
FE2
FE5
FE4
FE5
FE1
BE BE BS+
G BE FE3
FE8
IP CE7
FE7
FE6
BE BE BE
F FE2
FE2
CE3
FE6
FE8
CE2
FE7
FE1
BE PNRS
E FE3
CE6
FE4 CIP
FE6
IP FE3
BE HYRS
D FE5
IP FE8
FE4
CE5
FE5
BE HYRS
C FE2
FE7
CE1
FE7
FE6
CE4
FE3
FE1
BE HYRS
B BS+
FE6
FE8
CE8
IP FE8
FE4
BE BE HYRS
A BE FE1
FE7
FE4
FE5
FE3
FE2
BE BS+
BE
10 9 8 7 6 5 4 3 2 1
BERYLLIUM BLOCK REFLECTOR
FIG. 1. Core-reflector configuration of RSG GAS with burn-up class (for typical working core,TWC) in the second rows (FE: fuel element, CE: control element, BE : Be reflector element,BS+: Be reflector element with plug, IP : irradiation position, CIP : central irradiation position,PNRS : pneumatic rabbit system, HYRS : hydraulic rabbit system).
59

IAEA-CN-100/90P For interaction of 2 rods, interaction always shows positive values meaning that anti-shadowing effects always ensue in this scenario. The existence of a control rod lessens neutron flux around another rod hence escalating reactivity worth of collective rods. At 10 cm insertion, the existence of 1 rod decreases neutron flux in the region of another rod and the anti-shadowing effect dominantly increases up to maximum rod insertion of 60 cm. The maximum interaction for the 2-rod insertion is 0.1503 (around 15 %) representing anti-shadowing effect and it occurs while the 2 rods are fully inserted into the RSG-GAS reactor core. At this condition, the value of 15 % means that the reactivity worth of each rod, either CE1 or CE2, augments around 15 % over its single reactivity worth.
For interaction of 7 rods, anti-shadowing effect starts to occur from about 31 cm insertion to 60 cm insertion. From the Figure, it is certain that the interaction is zero when the rod insertion is around 33 cm and the maximum anti-shadowing effect of 9.5 % occurs at 20 cm insertion. In addition, the maximum anti-shadowing effect occurring at 60 cm insertion is around 26 %. The anti-shadowing effect of 26 % means that the reactivity worth of each rod augments 26 % over its original rod worth.
3.4. Modelling of 3-D dynamic behaviour of neutron fluxes For RSG-GAS, LabView combined with Microsoft Excel was utilized to dynamically perform 3-D thermal neutron flux analysis caused by control rod interaction in RSG-GAS reactor core. Simulation was made for interaction between 2 rods and 8 rods. The simulation was also extended with 2 rods simultaneously inserted from 0, 10 cm up to 60 cm and this scenario was also applied for simultaneous insertion of 3 rods, 4 rods up to 8 rods.
Neutron fluxes generated by CITATION are firstly converted in a matrix size of 125 x 100, meaning that there are 12,500 data of neutron values. Actually, there are 88 layers in Z direction, so the total data for all 88 layers is 1,100,000 values of thermal neutron fluxes. For this analysis, only the flux data in 38th layer was taken into account.
4. Results and discussions
4.1. Reactivity worth of each control rod for RSG-GAS typical working core For this analysis, RSG-GAS containing 250 g U-235 of U3O8-Alx fuels has been employed. All calculation results were carried out using the combination of WIMS-D4 and CITATION-3D codes. The reactivity worth of rods G6, F8, F5, E9, D4, C8, C5 and B7 are 1.18 %, 1.41 %, 1.44 %, 1.24 %, 1.31 %, 1.31 %, 1.39 % and 1.13 % ((∆k/k) respectively. It can be estimated that the total worth of collective RSG-GAS rods is 14.328 % ∆k/k, while the total worth of all single rods is 10.393 % ∆k/k. The interaction term with all RSG-GAS rods fully down is 37.9 % representing an anti-shadowing effect. The value of 37.9 % indicated that the reactivity worth of each rod augments 37.9 % over its the original reactivity worth [8].
4.2. Unperturbed neutron flux at different locations in RSG-GAS reactor core To analyze neutron flux behaviour at different locations in RSG-GAS reactor, 4 scenarios were developed based on different location of 5 similar channel-power detectors in the core. As already known, RSG-GAS reactor core has 9 channel power detectors, namely, detectors of JKT 03 CX811(01), CX821(02), CX831(03) and CX841(04) classified as power channel level detectors. Only one detector (JKT 04 DX 001) is classified as long-range power channel detector. The position of each detector is located in the core of RSG-GAS reactor. To analyze the spatial variation of unperturbed neutron fluxes at each detector location, 5 scenarios have been developed, such as,
a) calculated neutron fluxes at JKT-04 detector location with varying RSG-GAS rod insertion, b) calculated neutron fluxes at detector location with additionally various multiple rods insertion, c) calculated neutron fluxes at detector location with 7 control rods fully-up and another rod fully-
down and d) calculated neutron fluxes with 6 control rods fully-up and 2 rods fully-down.
For case a, it is to be noted that, as each rod is inserted into the reactor core, the neutron flux at detector JKT 04 location is also increased. The reason is that the position of the detector is outside the reactor core, but close to beryllium blocks and elements. This causes the neutron flux at the detector
60

IAEA-CN-100/90P increases due to neutron flux donation from the beryllium blocks and elements as neutron reflectors. In addition, the ballooning effect takes place as each rod is more inserted into the reactor core and the neutron flux in the reactor is disturbed or changed. This condition, of course, amplifies the neutron flux in the detector.
For case b, the thermal neutron flux at JKT 03-02 detector location varies significantly compared to those obtained by the other 4 detectors. For each rod fully-down condition, the thermal flux is almost 8 times the least flux value of JKT 03-01 detector location with rod F8 down because the detector is surrounded by beam tubes and also behind the beryllium block reflectors. Those facilities certainly donate a lot of neutrons generated in the reactor core.
For case c, the detector JKT 03-02 has the highest value of thermal neutron flux because the detector is surrounded by beam tubes strongly contributing high flux to the detector. Thermal neutron fluxes at the 3 other detectors are significantly different and it is to be noted that detectors JKT 04 and JKT 03-04 or JKT 03-03 are respectively a long-range power channel-type detector and a power-channel-type detectors having different specifications.
For case d, the results indicated that the thermal flux at JKT 03-02 detector location is still the highest among the other detectors, because the detector is surrounded by beam tubes and behind beryllium blocks which donate a lot of neutrons generated in the reactor core. Although the position of detectors JKT 03-03 and JKT 04 is very close to each other, the flux value at JKT 04 is not the same as that at JKT 03-03 because of the different specifications of the detectors. For each rod insertion, each flux value at JKT 04 is twice those at JKT 03-03. Indeed, all the results showed that, for the same condition and similar channel power detector, the neutron flux behaviour depends on the location of each detector in a reactor core [8].
4.3. Control rod interaction in a conceptual MTR-type reactor An MTR-type reactor with core sizes of 40 cm long, 40 cm wide and 60 cm deep and with 60 cm of water moderator covering each side of the core, constructed with only three kinds of materials, namely, fresh RSG-GAS fuel, fresh RSG-GAS absorber blade and water as moderator, is chosen as the conceptual reactor. Detailed analysis of control rod interaction have been attempted by developing, first, the reactor completed with two RSG-GAS-size absorber blades facing each other and second, the reactor equipped with two pairs of RSG-GAS-size absorber blades facing each other. Either the 2 blades or the 2 pairs of absorber blades are then variously separated commencing from 1 cm up to a maximum of 30 cm. Each rod is inserted into the reactor core from 10 cm up to 60 cm with a 10-cm step.
For the 1st case, the shadowing effects take place more strongly in smaller insertion, namely, 10 cm and 20 cm with any blade separation. The existence of one absorber blade reduces the reactivity worth of the other hence reducing the collective worth of the 2 absorber blades. For blade insertion of more than 20 cm, an absorber blade is enhanced by the presence of the nearby blade. This is because the flux depression in the vicinity of each blade is compensated partially by the rise in the flux outside the region of influence of the other absorber blade. The results also showed that the maximum shadowing effect is 26.5 % which occurs at 20 cm insertion and 1 cm separation. The 26.5 % of the shadowing effect means that the reactivity worth of each blade decreases 26.5 % above the original reactivity worth. The detailed interaction representation of the 1st scenario can be seen in Figure 2.
For the 2nd case, it is to be noted that each blade in a pair of blades around 6 cm apart always causes the shadowing effects between the 2 blades. Therefore, for 10-cm and 20-cm blade insertions and any blade separation, the same effects always take place in the 2-pair of absorber-blades MTR-type reactor. At separation beyond 20 cm, one pair of blades is amplified by the existence of the other pair of absorber blades because the flux depression in the vicinity of each pair of blades is compensated partially by the rise in the flux outside the region of influence of the other pair of blades. This positively results in an addition of the collective worth for the 2 blade hence anti-shadowing effect taking place in the reactor core. The detailed interaction representation of the 2nd scenario is depicted in Figure 3.
61

IAEA-CN-100/90P
????
????
????
?
???
???
? ? ?? ?? ?? ?? ??
Separation between two blades/rods (cm)
Interaction
10 cmI i20 cmI i30 cmI i40 cmI i50 cmI i60 cmI i
FIG. 2. Interaction in a conceptual MTR-type reactor with two absorber blades [8].
−0.3
−0.2
−0.1
0
0.1
0.2
1 5 9 13 17 21Separation of two pairs of absorber blades (cm)
Inte
ract
ion
10-cm Insertion
20-cm Insertion
30-cm Insertion
40-cm Insertion
50-cm Insertion
60-cm Insertion
FIG. 3. Interaction of a conceptual MTR reactor with two pairs of absorber blades [8].
The 23.3 % of shadowing effect is the maximum for 20 cm insertion and 1 cm separation. In addition, the maximum anti-shadowing effect is 15.4 % which occurs at 60 cm insertion and 12 cm separation. The amount of 15.4 % means that the reactivity worth of its pair of absorber blades augments 15.4 % above the original reactivity worth. From all results it can be concluded that the shadowing effects in the MTR-type reactor vary depending on the extent of absorber blades insertion into the reactor core and the effect is certainly more dominant for the case of 2 pairs of absorber blades than for 2 absorber blades [9].
4.4. 3D dynamic display of neutron flux characteristics due to control rod interaction in a reactor.
LabView combined with Microsoft Excel was utilized to dynamically perform 3-D thermal neutron flux analysis caused by control rod interaction in RSG-GAS reactor core and simulation was made for interaction between 2 rods and 8 rods. Neutron fluxes resulted from CITATION is formed in a matrix
Anti-shadowing effect
Shadowing effect
Anti-shadowing effect
Shadowing effect
62

IAEA-CN-100/90P size of 125 x 100, meaning that there are 12,500 data of neutron fluxes. Actually, there are 88 layers in Z direction, so the total of neutron flux for all 88 layers is 1,100,000 data of thermal neutron fluxes. The conceptual MTR-type reactor was modelled respectively in 21 x 19 meshes along X and Y axes. The neutron fluxes resulted from CITATION are then converted into a matrix size of 19 x 21. The reactor has 60 layers in Z direction and one complete data consists of 12 set data, because there are 12 absorber blade separations. The thermal fluxes for 2-absorber-blade MTR reactor with 2-cm and 16-cm separation at 10 cm insertion are shown in Figures 4 and 5, respectively.
1 5 9
13 17 21
S1S7
S13S19
0.00E+001.00E+142.00E+14
3.00E+14
4.00E+14
5.00E+14
6.00E+14
7.00E+14
Thermal flux (n/cm2 s)
Mesh points
Mesh points
6.00E+14-7.00E+14
5.00E+14-6.00E+14
4.00E+14-5.00E+14
3.00E+14-4.00E+14
2.00E+14-3.00E+14
1.00E+14-2.00E+14
0.00E+00-1.00E+14
FIG. 4. Thermal flux for 2 absorber blades with 2-cm separation and 10-cm insertion at 45th layer [9].
1 4 7
10 13 16 19
S1S6
S11S16
0.00E+005.00E+131.00E+141.50E+142.00E+142.50E+14
3.00E+143.50E+14
4.00E+14
Thermal flux (n/cm2 s)
Mesh points
Mesh points
3.50E+14-4.00E+143.00E+14-3.50E+142.50E+14-3.00E+142.00E+14-2.50E+141.50E+14-2.00E+141.00E+14-1.50E+145.00E+13-1.00E+140.00E+00-5.00E+13
FIG. 5. Thermal flux for 2 absorber blades with 16-cm separation and 10-cm insertion at 45th layer [9].
The program developed using LabView combined with MS Excell has been utilized to analyze the neutron flux behaviour both in the conceptual MTR-type reactor and in RSG-GAS reactor in detail. In addition, the tool also performs the perturbed flux values in any mesh point in the reactors.
5. Conclusions The phenomena of control rod interaction, either shadowing or anti-shadowing effect, in RSG-GAS and conceptual MTR-type reactors have been attempted through computer simulation. For investigation on the neutron flux behaviour at different locations in RSG-GAS reactor core, the results
63

IAEA-CN-100/90P showed that for the same condition and similar channel power detector, the characteristics of the neutron flux depends on the location of each detector in a reactor core due to spatial effects.
For RSG-GAS reactor and a hypopthetical reactor, the results showed that the collective absorption of control rods is affected by mutual interaction between the individuals and the sum of the single rod efficiencies differs from the collective absorption of all rods.
In the case of control rod interaction in a conceptual MTR-type reactor equipped with 2 absorber blades and 2 pairs of absorber blades, the results indicated that the shadowing effects in the MTR-type reactor vary depending on the extent of absorber blades insertion into the reactor core and the effect is certainly more dominant for the case of 2 pairs of absorber blades rather than 2 absorber blades.
The neutron flux behaviour caused by the rod interaction in those 2 reactors was finally investigated using a LabView-based model combined with Microsoft Excell. The new tool developed is capable to perform the neutron flux behaviour due to control rod interaction in detail and the new tool can be utilized to analyze the phenomena of control rod interaction in any nuclear reactor through performing a 3-D representation of neutron flux behaviour in more detail. This represents an important contribution that would support safety analysis of a nuclear reactor design in detail in the future.
Since not all of original objectives have been achieved, there is still a need to develop software capable of generating a complete 3-D transient behaviour of neutron flux distribution under the conditions of multiple control rods interaction in a nuclear reactor.
Aknowledgement The main author expresses his gratitude to Mr. Tagor Sembiring and Mr. Saiful Bachri for their support and guidance in applying the computer codes WIMS-D4 and CITATION and in programming of LabView, respectively.
REFERENCES [1] STACEY, Jr., W.M., Space Time Nuclear Reactor Kinetics, Academic Press, New York (1969).
[2] DUDERSTADT, J.J., Nuclear Reactor Analysis, The University of Michigan, John Weley & Son (1976).
[3] BANNERMAN, R.C., Control Rod Interaction Models for Use in 2D and 3D Reactor Geometries, AEEW-R-1409, Winfrith UKAEA, England (1985).
[4] LIEM, P.H., TARYO, T., SEMBIRING, T.M., HIROSHI, S. and YOSHITAKA, N., ”Study on the Control Rod Interaction Effect in RSG-GAS Multipurpose Reactor (MPR-30)”, Annals of Nuclear Energy 29 (2002), pp. 701-716 (2002).
[5] FAYERS, F.J, DAVISION, W and GEORGE, C.H., HALSALL, M.J, LWR WIMS. A Modular Computer Code for the Evaluation of Light Water Reactor Lattices, Part I, Description of Methods AEEW.R 785 (1972).
[6] FOWLER, T.B., VONDY, D.R. AND CUNNINGHAM, G.W, 1971, Nuclear Reactor Core Analysis Code : CITATION, ORNL-TM-2496, Revision 2, ORNL and Union Carbide Corporation.
[7] INTERNATIONAL ATOMIC ENERGY AGENCY, Research Reactor Core Conversion Guide Book Guide Book Vol. 3 : Analytical Verification, IAEA-TECDOC-643, Vienna, Austria (1992).
[8] TARYO, T, “Analysis of Shadowing Effect in a Hypothetical MTR Reactor”, Atom Indonesia 28 (2), Jakarta, Indonesia (2002).
[9] TARYO, T, Control Rod Interaction in a Conceptual Research Reactor, Ph.D. Dissertation, Universitas Gadjah Mada, Yogyakarta, Indonesia (2003).
64

IAEA-CN-100/98P
Research Reactors in Kazakhstan: Conditions, Safety and Utilization S. Talanov Atomic Energy Committee of the Republic of Kazakhstan, Almaty, Kazakhstan
Abstract. A brief overview is provided in this note on the four nuclear research reactors and one critical assembly in Kazakhstan, including their location and status. 1. General There are four research reactors and one critical assembly in Kazakhstan. Three of them: RA, IGR and IWG.1M reactors belong to the Institute of Atomic Energy. The last WWR-K reactor and the critical assembly belong to the Institute of Nuclear Physics. Both institutes are part of the National Nuclear Centre of the Republic of Kazakhstan and all of these reactors are under the supervision of the regulatory body, the Atomic Energy Committee of the Republic of Kazakhstan (KAEC).
1.1. Research reactors One of the reactors is the RA reactor located near the town of Kurchatov at the “Baikal-1” site of the former Semipalatinsk Nuclear Testing Site. Nowadays it is in extended shutdown regime and defuelling.
The IGR reactor is of pulse type and has clumped Uranium-graphite 90% enrichment fuel. It started to operate in 1961 and is located near the town of Kurchatov at the site of the former Semipalatinsk Nuclear Testing Site.
The IWG.1M reactor has 35 MWth power and is working in long pulse regime. It is also located near the town of Kurchatov at the “Baikal-1” site of the former Semipalatinsk Nuclear Testing Site. It has 90% enrichment Uranium-Zirconium fuel and started operation in 1975.
The WWR-K reactor has 6 MWth power and is working in stationary regime during a 20 days campaign. It is located near the city of Almaty with a population of about 1.5 billion inhabitants. It has 36% enrichment Uranium-Aluminum fuel and started operation in 1967.
1.2. Critical assembly The critical assembly is the prototype of the WWR-K reactor and has the same fuel type as the reactor. It is placed at the same reactor building, started operation in 1972 and was modified in 1982.
2. Status It is obvious that Kazakhstan has four different types of nuclear research reactors with high enriched different type of fuel. All of them have an age of about 30 years and are approaching final shutdown. Therefore the main problem for the regulatory body KAEC is to estimate their conditions and the limits of their safe operation. Every three years the special commissions review the conditions of each reactor and make a decision with respect to its further operating. Moreover this commission ought to recommend or to prepare a draft of a decommissioning plan or a plan on modifications in the future.
With support of the NTI (USA) and the ISTC at the WWR-K reactor, a project was started this year on a possibility of using 20% enrichment fuel instead of 36% enrichment. For other two reactors such plans are under first steps of development.
All reactors have both their own programmes for scientific and technical themes with budget funding, and also programmes for special projects with separate funding from different sources. Some of them comprise experiments to simulate accidents with core element melting.
65

IAEA-CN-100/100P
Some Issues on the License for the Design and Operation of a Research Reactor C. Park, H.T.Chae, B.J.Jun, H.Kim, H.R. Kim HANARO Center, Korea Atomic Energy Research Institute, Yuseong, Daejeon, Republic of Korea
Abstract. Most of the research reactors currently in operation were built in the early stages of reactor development before the occurrence of the Three Mile Island (TMI) and Chernobyl accidents. Thereafter the nuclear reactor construction environment such as strengthened regulations, stricter safety requirements, public awareness, increased construction costs etc. has been largely changed. In this paper some issues that a research reactor is currently faced with during the design and operation of a research reactor are presented, which seem to require considerations to solve the difficulties.
1. Introduction Up to date, around 680 research reactors have been constructed over the world, and about 283 of them are now in operation and the others have been shutdown and are in decommissioning [1]. Lots of research reactors currently in operation were built before the occurrences of the TMI and Chernobyl accidents which are very important in nuclear history, thereafter the international regulation environment was strengthened and also strict requirements for the design of a research reactor has been requested and newly established. However, any country still may have no systematic and well-arranged regulations for research reactors, and the detailed regulatory guidance as well. Regulations applicable to power reactors have been generally adapted to research reactors with flexibility considering the differences of design characteristics. So, the research reactor in planning or in licensing process will face different situations and difficult issues than those research reactors that were previously built since the construction environments in the safety, economy and public awareness and so forth have largely changed. This paper describes some issues that research reactors are faced with and it seems necessary to discuss them for gathering consensus:
o Design basis accidents and a research reactor design, o Reactor building features, o Accident analysis code for a research reactor, o Regulation and appropriate application to the design and operation of a research reactor, o Change of environment such as public acceptance, o Limitations of an eligible component supplier and others.
2. Some issues on design and operation of a research reactor
2.1. Design basis accident and research reactor design Nuclear installations should be designed to prevent credible hypothetical accidents and to limit or mitigate their consequences if they occur. However, no matter how we try to design a nuclear reactor completely, a certain hypothetical accident or event can occur unexpectedly and produce a serious consequence such as fuel failures and the release of fission products to the confinement (or containment) and subsequently to the outside environment. Such events are called “design basis accidents (DBA)” if they provide a reference for designing engineered safety features and a confinement/containment. Speaking in more detail, DBA is very closely related to the design and specifications of an emergency core cooling system, reactor
66

IAEA-CN-100/100P
protection system, and confinement/containment including an emergency ventilation system and so on. Hence, which accident is selected as a DBA has effects on the system’s installation, the safety classification of the structure, design of systems and components, the features of reactor building, and the selection of the site. Accordingly it has a relation with the economics of a research reactor. It is also one of the items which a regulatory body considers seriously because the degree of safety may depend on it.
Regarding DBAs of a research reactor, lots of discussions seem to be necessary for a guillotine break LOCA and the assumptions generally used in the analysis. According to references [2, 3], IAEA member countries employ different DBAs for a research reactor design. Some countries adopted a BORAX type reactivity accident while others postulate a large break LOCA in the primary cooling system or certain amount of fuel melting due to flow blockage. Of course, a DBA is dependent on the design and operation characteristics of the reactor. It is noted in relation to operation experiences that accident types occurring in the reactors were changed from the reactivity accident in the early stage of reactor developments in the ‘50s and ‘60s to the core damage accident related to the decrease of heat removal after the ‘70s [4]. In case of water-cooled power reactors, a large LOCA normally results in a most severe consequence including a large amount of fuel failures. So, it is regarded as an important DBA and a set of criteria for ECCS/EWSS and its containment has been established. For instance, ECCS should maintain a coolable geometry of the fuel, and the containment should prevent the release of radioactive materials from the fuel to the environment within the prescribed limit. Then, what is the problem when an instantaneous guillotine break LOCA is considered as a DBA in a research reactor? A research reactor is usually designed to have a very high power density and to usually use aluminium alloys for fuel with a low melting temperature. Hence, when traditional analysis methodology is applied, it is not easy to maintain fuel temperature below melting temperature even in a research reactor with a medium power (say, more than 10 MW) even though an ECCS is installed and subsequently a reactor may undergo full core damage in this accident. To meet the requirement of coolable geometry, lots of effort and cost are necessary to increase the performance of many related safety systems. Of course, it surely leads to a robust design with a large safety margin. However, this double-faced issue in safety and economical benefit should be reconsidered and balanced reflecting all aspects. As one of these activities in a nuclear society, OECD held a workshop on “Redefining the large break LOCA” in June 2003 [5]. In practice, if a leak-before-break (LBB) concept is already adopted in the design not in the safety analysis is accepted or a realistic break size is considered in safety analysis (regulation), much milder consequences are result in. In addition, small changes of assumption in the analysis such as the adoption of a break time duration such as 1∼2 seconds instead of instantaneous rupture may show better results. In a pool type research reactor design, such mild results leads to the emergency water supply system (EWSS) that supply only coolant to the pool for covering core instead of ECCS that need rapid coolant injection for fuel cooling at emergency condition. The application of this kind of realistic modelling was tried by the ANS design together with experiments of a pipe break [6]. From the aspect of operation, the operating condition of low pressure and low temperature, leak detection system, huge amount of coolant water and other surveillance could restrain the limits of sudden pipe rupture and mitigate the consequences.
One more thing to remember is that core damage accidents such as TMI and Chernobyl accidents were caused by other events that were thought less important while most concerns were focused on unrealistic accidents of a large LOCA. Unnecessary conservative designs should be removed and effort should be shifted in the realistic view of safety through a risk-informed and performance-based approach.
67

IAEA-CN-100/100P
Whatever accidents are selected as a DBA, the important thing to consider is that the possibilities of such accidents considered are much decreased due to the developed technologies and accumulated experiences and knowledge in the design and operation of a research reactor. We also have better analytical tools for accurate calculations. Now it may be time for such things to be reflected in the regulations.
2.2. Features of reactor building A reactor building encompasses reactor and building structures, various systems including a ventilation system, engineered safety features and lots of experimental facilities and so on. First of all, a reactor building is very important from the aspect of safety because it is the final physical barrier of the defence-in-depth concept by containing radioactive materials inside reactor hall. It also provides a large space for a variety experiments and the related persons normally work there. So reactor building is required to be designed in harmony with the safety and utilization requirements.
From the view point of safety the main function of a reactor building is to control the release of radioactive material and to protect all the systems and components from the load arising from the internal and external events. The leakage rate of air inside the reactor building and temperature and pressure loads are important design parameters of the reactor building in relation to the containment of the radioactive material for the internal accident. A reactor building can be classified into confinement and containment based on the above two requirements. The choice of confinement or containment is based on the reactor facility design, operating characteristics, postulated accidents and site location. Considering these factors, the confinement is selected when only a leakage rate control is needed while the containment concept is applied if both items are necessary. In general, confinement concept is applied for small and medium research reactors with a low power while containment is adopted in a high power research reactor.
As described before, the design of reactor building is also very closely related to the selection of a DBA since design considerations for reactor building, such as a source term and release behaviour and the internal loads following the accident, are depending on it. For instance, the leakage rate together with emergency ventilation system and the wall thickness for shielding are dependant on the source terms in the accident. The location of the control room, whether it is placed besides the reactor hall or separately, may be affected too. This also should be considered in relation to the selection of DBA at reasonable conservatism.
2.3. Accident analysis code As the design of a reactor such as the specifications for containment and safety systems may depend on the analysis of hypothetical accidents, a reliable and accurate analysis code is necessary for the design and safety analysis. While there are robust tools such as RELAP5, TRAC, RETRAN and various vendor codes for the accident analysis of commercial power reactors, limited codes are available for the comprehensive transient analysis of research reactors. It is generally recommended that the computer codes developed for the transient analysis of power reactors should be applied carefully after modifying them appropriately for a specific research reactor. Generally the limitations of the code come from the valid ranges of the correlations and theoretical approaches used in the codes, and the applicability of the code depends on the operating conditions of the reactor analyzed. As research reactors have their own unique design characteristics and different operating conditions, the necessary correlations and models are usually developed based on their own experimental data and implemented to the code. For the application to a specific reactor, major modifications should be made to the
68

IAEA-CN-100/100P
package of heat transfer and pressure drop correlation since it significantly affects the calculation results.
In order to use a modified code as a licensing tool, wide and careful validation should be done and the approval of the regulatory body is necessary. The problem is that the experimental data for a specific reactor is limited and the validation and verification of the modified code is so insufficient that engineering judgement may often be needed. The regulatory body should be in positive side for an issue which is obvious but not enough test data. In case of lack of experimental data, it may be desirable that the regulatory authority should be flexible to use conditional license. Sometimes the data obtained data during commissioning and operation can be used to validity of the calculation for obtaining license.
Fortunately, most postulated transients in research reactors are terminated in a single-phase and sub-cooled boiling flow conditions. The predictions in these regions by the modified code generally may not give any troubles. However, it is sometimes difficult for the code to calculate the transient behaviours in two-phase flow conditions of a certain accident because most research reactors are operating under a low pressure and low flow conditions where two-phase phenomenon in the core is much more rigorous and complicated, so difficult to deal with than that in high pressure conditions. Hence, the information on experimental data for research reactors should be accumulated and evaluated for the verification of the accident analysis code for research reactors.
2.4. Regulation and adequate application As research reactors usually have different designs and power levels as much as their purposes of utilization, it is not easy to prepare well arranged regulations for all the research reactors. Fortunately, IAEA SS DS 272 and SS No. 35-G1 suggested an international standard for the guidelines on the design of a research reactor. They have been very useful for the review of research reactors by a regulatory authority, but do not provide detailed regulatory requirements for a specific research reactor. This is because the research reactor generally has a variety of design characteristics, wide range of powers, and different utilization purposes and operating conditions [7,8].
Other thing to be considered in the license of a research reactor is the experiences of the regulatory authority for a research reactor. The regulatory review and licensing process can vary among countries, since it depends on the regulatory staff’s experiences under their safety polices and principles. So, the staff of the regulatory authority should have adequate knowledge and experience in legal and technical matters. In a country with a strong nuclear power programme compared to the research reactor programme, it is difficult to maintain competitive and experienced expertise in all areas of a research reactor which has different characteristics from the power reactors. Therefore, the development of a basic review guidance and licensing process is desirable for a systematic regulation for the safety of a research reactor.
From the operation aspects of an existing research reactor, sometimes it requires modifications and installations of new test facilities during long period operation since a research reactor have to carry out a variety of experiments. The regulations also have changed together as time has gone on. Troubles may take place when a part of a research reactor needs modification for an experiment. In view of an operation, the application of newly established strict regulations to the existing reactor that has safely operated, is a heavy burden to the owner who manages the reactor. It often obstructs the conduct of a new experiment.
69

IAEA-CN-100/100P
2.5. Change of environment A research reactor has provided many contributions to the development of nuclear science and technology and the welfare of human beings as well. But, the construction environment at present is faced with many difficulties. Those are the strengthening of the regulation for safety, difficulty of public acceptance, continuous anxiety from radiation, economical and social burdens for nuclear materials and radioactive waste, and so forth. Technically, there is a tendency to replace a proton accelerator with the function of a beam research in a research reactor. Nevertheless, it is expected that the role of a research reactor will be continued and increased gradually for a considerable period.
In order for a research reactor to continue its role, one of the important factors among the above items is public acceptance (PA). It is because public awareness is in front of the license of a research reactor. Difficulty is that it deals with the emotional rather than the technical. Recognizing the importance, most countries have concerns with it and have carried out various activities on it. But, more efforts seem to be required since public awareness of the nuclear facility has been raised and confidence has been relatively lowered. To get an understanding of public for a research reactor, briefly all the activities should be transparent and provide for appropriate involvement of the public, and activities where the public recognize the necessity and usefulness of a research reactor [9, 10].
2.6. Limited eligible component supplier and others Technologies are continuously advanced and new components are developed during the long lifetime of a research reactor. So sometimes it is difficult to get necessary components or systems, particularly in I&C field, because they are no longer manufactured. In some cases, the supplier of safety class components loses the eligible requirement for nuclear quality assurance. Provision may be necessary against such a case, for instance, a QA program should be developed for substituting failure components with general components.
3. Concluding remarks Several issues in relation to the license for the design and operation of a research reactor were described. Basically, as most of the research reactors have their own unique design characteristics, it is difficult to prepare comprehensive regulations for research reactors. However, safety objective of research reactors and power reactors are common, and regulations for a power reactor have been generally applied in many countries to research reactors with flexibility considering the differences of design characteristics. Such flexibility requires lots of reviews and consensus based on much information when implemented. Selection of a realistic DBA may be an example because it is very closely related to the design and specifications of the systems such as confinement/containment and engineered safety features, which affect the safety and the economical benefits of research reactors. An accurate and reliable accident analysis code is also necessary to make correct decisions for proper design. The staff of the regulatory authority should have adequate knowledge and experience in the legal and technical matters for a research reactor. Public acceptance can not be forgotten as it can make the technical license irrelevant. One more thing to consider is that the developed technologies and the accumulated experiences in the design and operation of a research reactor should be reflected in regulations.
REFERENCES [1] INTERNATIONAL ATOMIC ENERGY AGENCY, IAEA Research Reactor Database,
http://www.iaea.org/worldatom/rrdb/.
70

IAEA-CN-100/100P
[2] LEE, A.G., Results of a Survey on the Design Basis for a Research Reactor Containment/Confinement Buildings, 6th Meeting of International Group on Research Reactor, Taejeon, Korea (1996).
[3] HICKMAN, C., MINGUET, J.L., ARNOULD, F., Safety Practice and Regulations in Different IGORR Member Countries, 7th Meeting of International Group on Research Reactor, Bariloche, Argentina (1999).
[4] CHANG, S.H., BAEK, W.P., Nuclear Safety, 2nd Edition, Cheong-Moon Press, (1999).
[5] Responses to the Survey on “Redefining the Large Break LOCA: Technical Basis and Its Implication”, OECD/NEA/CSNI/R(2003)16, Switzerland (2003).
[6] CHEN, N.C.J. et al., Conceptual Design LOCA Analysis for the Advanced Neutron Source Reactor, Nuclear Technology, Vol. 105 (1994).
[7] YANG, C.Y., LEE, J.I. Kim, H.C., On Regulatory review and Safety Analysis of HANARO, 5th Asian Symposium on Research Reactor, Korea (1996).
[8] RUIZ, A. et al., Issue Paper for International Conference on Topical Issues in Nuclear Safety; Safety of Research Reactors, IAEA, Vienna, May (2001).
[9] Review Report for the Direction of Research Reactor in Japan, Japan Atomic Industrial Forum, (1999).
[10] Nuclear Power Project : Policy and Korean Experience, Korea Atomic Energy Research Institute, (2001).
71

IAEA-CN-100/103P
Regulating the Salaspils Research Reactor: Management of Extended Shutdown A. Ozols Radiation Safety Centre, Riga, Latvia
Abstract. This paper discusses the process of management of a research reactor after its shut down in an environment of both organizational and regulatory changes. Since the shut down of the Salaspils Research Reactor (RR), the regulatory mode has been as if the operation continued with some limitations imposed. Dismantling of the unnecessary equipment of the RR was allowed under conditions of the licence. Shortly after the shutdown, the responsibility for the RR was transferred to the then Ministry of Environmental Protection and Regional Development which is now the Ministry of Environment. A conceptual study for the decommissioning of RR has been carried out in 1998 which yielded an initial decommissioning plan termed “Concept of Dismantling and Decommissioning of the Salaspils Research Reactor”. New regulatory body – the Radiation Safety Centre (RDC) – was established in July 2001. In 2002, an international tender was announced for the dismantling and decommissioning of the RR in accordance to the national Law. Tender dossier included the provisions for shipping of the spent fuel from Latvia in 2003 as well as fixed the deadline for completion of decommissioning. Considerable room for the decisions by the Contractor was given with respect to the tasks but the results of the environmental impact assessment were to be taken into account. In addition, the establishment of the Management Group which shall carry out regular consultations with the Project Manager of the Contractor was foreseen. The tender ended up with no bids. In order to initiate a new international tender, two modifications in the Subject Matter1 need to be introduced, reflecting the changed deadlines for completion of the decommissioning and separating the spent fuel management from decommissioning. In summary, the experience of Latvia’s regulatory body in management of the extended shutdown of the RR within the legal infrastructure is reported.
1. Introduction A brief description of the Salaspils research reactor is presented below:
Country: Latvia. Name: Salaspils Research Reactor (Salaspils Nuclear Reactor). Location: 31 Miera street, Salaspils (approximately 25 km from Riga). Reactor Type: IRT-5000 (pool type, light water cooled and moderated). In Operation: 1961-73, 1975-98 (normally 5 days of continuous operation followed by 2
days of shut down). Fuel: EK-10, IRT-2m, IRT-3m. Thermal Power: 2 MW (until 1973), 5 MW (since 1975). Fast flux: Up to 1014 neutrons·cm-2·s-1 Thermal flux: Up to 6×10¹³ neutrons·cm-2·s-1 Owners: Ministry of Education and Science (until 1999), Ministry of Environmental
Protection and Regional Development (Ministry of Environment). Operators: Nuclear Research Centre (NRC, until 1999), State Enterprise “Reaktors”
Ltd. (until 2001), State Enterprise “RAPA”, Ltd. Regulators: Radiation and Nuclear Safety Inspectorate (Radiation and Nuclear Safety
Control Division, 1994-2001), Radiation Safety Centre.
1 The subject matter is part of the Tender documentation describing general terms such as the deadlines to be met and the circumstances for the decommissioning to be observed by a contractor.
72

IAEA-CN-100/103P
Since the nuclear safety of reactor facilities in former Soviet Union were controlled by GOSATOMNADZOR, and sanitary epidemiological station (the laboratory of radiology) were only dealing with radiation safety issues, it took some time after Latvia regained its independence that the full scale state regulatory control over Salaspils RR was established. Initially, an inspector was assigned by Environmental Protection Committee; however, it took until February 1994 to establish the Latvia’s Radiation and Nuclear Safety Inspectorate within the State Environmental Inspection. Later, the Radiation and Nuclear Safety Inspectorate was renamed for Radiation and Nuclear Safety Control Division with its functions remaining in essence as before.
Some sources provide information that there were two research reactors in Latvia. Actually, a critical assembly RKS (or Zero Power Reactor) was in operation from 1966 till 1990, its nominal thermal power was 25 W. Light water served as a moderator and reflector, beryllium and graphite were used as well, different types of fuel assemblies were put to a test. Except for a tank, all components of the critical assembly have been dismantled. There is no concern regarding the radiation safety with respect to further decommissioning of the critical assembly because of very low neutron flux at the time of operation.
2. Method Since the shut down of the Salaspils Research Reactor (RR) in June 1998, the regulatory mode has been as if the operation of the facility continued with some limitations imposed. The main limitation was that the reactor shall operate without power. Shortly after the shutdown, the responsibility for the reactor was transferred from the Ministry of Education and Science to the then Ministry of Environmental Protection and Regional Development which is now the Ministry of Environment.
With the involvement of international co-operation, during 1998 a conceptual study for the decommissioning of RR has been carried out by “Noell-KRC-Energie- und Umwelttechnik GmbH”. The study yielded the following main conclusions:
the RR was erected in a geographical region with earthquakes up to level 6 on Richter scale, but was not designed for the corresponding loadings;
a final disposal for irradiated fuel or a contract for the transport to other countries does not exist at present time. Therefore an interim storage for irradiated fuel elements in Latvia is necessary;
a final disposal for radioactive waste is available in Latvia and in operation; the direct dismantling to “green field" conditions is the best strategic for the
decommissioning of RR considering economical and safety aspects; approximately 2200 t of different materials have to be treated. Approximately 60% of
them can be measured for free release, the rest has to be conditioned for final disposal; the required techniques for decommissioning and dismantling of RR as well as for the
fuel reloading are available on the international market; the estimated costs for the total dismantling to “green field” conditions amount to DM
30-35 million (price basis is 1998); the dismantling can be done within 9 years.
On basis of the conceptual study, an initial decommissioning plan was developed and termed “Concept of Dismantling and Decommissioning of the Salaspils Research Reactor”. The Concept included the time scale of decommissioning activities as well as budgeting of the decommissioning, and foresaw a movement of the spent reactor fuel out of the reactor
73

IAEA-CN-100/103P
building in 2003 the earliest, the time being determined by calculation of the heat production in the fuel elements. The following main stages of the decommissioning were identified:
• Phase 1 (preparation measures) included the establishment of an organisation for the decommissioning, completing the radiological information on RR as well as training of the personnel in the areas of dismantling and decommissioning;
• Phase 2 (design and licensing) included the elaboration of the detailed decommissioning design, which takes into account the spent fuel handling and its storage after its removal from the reactor building. Preparation of the required licensing documents was also included in this phase;
• Phase 3 (modifications and erection of new equipment) included actual reconstruction of the personnel bomb shelter as the interim storage for spent fuel, installation of spent fuel handling equipment and erection of new systems required for further decommissioning progress;
• Phase 4 (dismantling) included the dismantling of systems no longer required, measurements for free release of the material to be recycled, treatment and disposal of radioactive waste arising;
• Phase 5 (fuel removal) included the removal of the fuel from the reactor building by packing it into transport casks and transfer to the interim storage on the site;
• Phase 6 (further dismantling) included full scope dismantling and decommissioning activities resulting in free release of the reactor building followed by its demolishing or reuse.
The dismantling of the unnecessary scientific and operational equipment of the research reactor was allowed under conditions of the licence issued by the Radiation and Nuclear Safety Inspectorate in 2001, shortly after the establishment of the State enterprise “RAPA” Ltd. as the operator.
Latvia has recently achieved significant changes in radiation safety and nuclear safety infrastructure related to the regulation of activities performed at the RR. New independent regulatory authority – the Radiation Safety Centre (RDC) – was established in accordance with the new framework Law “On radiation safety and nuclear safety” adopted by Parliament on October 26, 2000 providing for improvement of regulatory infrastructure and defining more precisely all obligations for users of radiation sources including nuclear fuel. The Radiation Safety Centre undertakes all major tasks pertaining to nuclear safety and radiation safety, and supervision and control.
Functions of the RDC are defined by legislation, and include to: • draft policy proposals for supervision and control of radiation and nuclear safety; • draft proposals of legal documents to maintain adequate legal framework; • licence practices with radiation sources; • assess implementation of international recommendations; • supervise and control radiation safety and nuclear safety; • co-ordinate combat of illicit trafficking of radioactive and nuclear materials; • co-ordinate technical co-operation in the field of radiation and nuclear safety; • ensure adequate competence levels of the Radiation Safety Centre (RDC) staff.
A steering group was established by Order No.11 (10 December 2001) of the Minister of Environmental Protection and Regional Development “in order to lead and co-ordinate activities of both Latvian and foreign institutions and companies in implementation of the project on dismantling of the Salaspils nuclear research reactor”.
74

IAEA-CN-100/103P
In 2002, an international tender was announced for the dismantling and decommissioning of the Salaspils Nuclear Reactor in accordance to the national Law „On Procurement for State or Local Government Needs”. The tender dossier elaborated by firms “Eirokonsultants” Ltd. and “Babcock Nuclear Engineering” included the provisions for the removal of the spent fuel from the reactor and shipping of the fuel from Latvia in 2003 as well as fixed the final date by which a decommissioning had to be completed. The tender dossier left considerable room (within the framework of national legal acts) for the decision making by the Contractor with respect to the decommissioning tasks but stressed that the operator of the decommissioning project will have to take the results of the environmental impact assessment into account. In addition, establishment of the Management Group which shall carry out regular consultations with the Project Manager of the Contractor was foreseen. The tender ended up with no bids.
After the international tender procedure had ended with no bids, concerns were raised that the conditions specified under the tender description were too tough and the deadlines imposed were too difficult to meet. In particulate, there was a dispute whether putting both the requirement to deal with a spent nuclear fuel issue and the requirement to proceed with the decommissioning itself was a cause for failure of a bidding process given the limited time schedule was applied to deal with the issues. In order to initiate a new international tender, two modifications in the Subject Matter (a part of the Tender documentation describing general terms such as the deadlines to be met and the circumstances for the decommissioning to be observed by a contractor) need to be introduced, reflecting the changed deadlines for completion of the decommissioning and separating the spent fuel management from decommissioning. Since the “Concept of Dismantling and Decommissioning of the Salaspils Research Reactor” is taken as a basis for the elaboration of the tender documentation, certain modifications are first to be introduced in this document.
In order to be able to proceed with the decommissioning process despite of apparent lack of progress with respect to the bilateral agreement providing the conditions for the return of spent fuel to the country of origin, as well as considering the limited amount of resources made available for the next financial year by the Government, the RAPA Ltd. will proceed with the reconstruction of a former bomb shelter building to make it suitable for a dry storage of spent fuel in transport containers. For this purpose, a detailed plan shall be submitted to the regulator and a licence shall be obtained for construction. Attention will be paid to the envisaged provisions related to the radiation and nuclear safety as well as to the physical protection measures. The intention is to provide for interim storage of fuel assemblies during the time needed to fix the procedures and arrangements for the return of the spent nuclear fuel to the country of origin at the same time avoiding further corrosion of fuel assemblies currently stored under water.
3. Results Description of the results can only have an intermediate nature since the period of extended shutdown has not ended yet. However, some dismantling and decommissioning activities have been performed under the conditions of operational licence by RAPA Ltd. within the extended shutdown period. These include the following: conditioning of “historical” radioactive wastes such as stored in an on-site radioactive storage since the reconstruction of the research reactor, 1973-75; dismantling of the first and second cooling systems; dismantling of scientific equipment in the reactor’s hall; decontamination of contaminated materials and floor space/buildings; free release (from the regulatory control) of dismantled materials and decontaminated buildings; installation of a cementation facility capable utilising the water from the reactor pool for cementation of the radioactive waste in the reactor’s hall.
During decommissioning activities, RAPA Ltd. has dismantled more than 80 tons of different materials and conditioned more than 12 tons of different radioactive materials in 35 concrete
75

IAEA-CN-100/103P
containers. 68 tons of different materials were accepted by the regulator to be released from the regulatory control. The extent of dismantling activities has had its impact on how the process is perceived – it has been said commonly that the research reactor is in early stages of decommissioning rather than under the extended shutdown.
The regulatory body is being involved closely with any activities performed by the operator since under current conditions the work plans are to be brought to the regulator’s attention before commencing any work that can have consequences related to the safety. Examples include the retrieval from storage and conditioning of “historical” radioactive wastes stored in an on-site radioactive storage since the reconstruction of the research reactor; descriptions of measurements related to the release of material from regulatory control, descriptions of transportation of the conditioned radioactive waste to Baldone. Since the facility is included in the state program for monitoring of the facilities of state significance, frequent inspections are performed involving environmental monitoring by regular analyses of the underground water samples taken from control bore-holes around the reactor building and reactor site. Recently it was discovered that the concentration of tritium was increasing in samples from two of the bore-holes – the finding prompted increase in the sampling frequency as well as interviews with the operator to investigate the cause for such an increase. The preliminary explanation is that there has been some uncontrolled release of water from special sewage system back in 1990ies and that this water is now diffusing towards the bore-hole due to recent intense pumping of water performed nearby the reactor site. The monitoring on the reactor site is strengthened in order to investigate a further development of the scenario, in parallel, remedial actions are being considered.
According to the new draft decommissioning plan, “RAPA” Ltd. will be performing the overall management for decommissioning and will also make subcontracts to companies performing the dismantling and decommissioning. This different approach may help in future international tenders since more detailed information will be given to the applicants. The final deadline for decommissioning is shifted by two years to 2010, whilst the scope for decommissioning is narrowed so that the result of decommissioning will be a restricted use area for development of future non-nuclear applications of radiation sources. Thus, the infrastructure will be preserved and the resources are expected to be saved, allowing for additional safety and security upgrades and continuous monitoring of the tritium levels in the underground water.
At the moment, the environmental impact assessment for the decommissioning is finished and submitted to the State EIA Bureau for revision. A report on the environmental impact assessment is expected to be available in the beginning of 2004. The assessment has elaborated on potential incidents and accidents as well as any contamination that might result consequently. According to the assessment, the radiation doses to both the personnel and critical groups of residents in case of the worst case scenario will still be below the annual dose limits for the respective persons.
4. Conclusions In summary, the experience of Latvia’s regulatory body in management of the extended shutdown of the Salaspils research reactor within the legal infrastructure is reported. Substantial changes have been made in conditions of operation during the last few years as well as in the regulatory infrastructure itself. There have personnel changes occurred as well, however, the radiation and nuclear safety has been maintained throughout the extended shutdown period. The licence allowing for minor dismantling and decommissioning activities is seen as an appropriate way of regulation under the circumstances that were present in the country after the permanent shutdown of the research reactor in 1998.
76

IAEA-CN-100/113P
Training of Operators in the Portuguese Research Reactor J.G. Marques, F.M. Cardeira, A.J.G. Ramalho Reactor Português de Investigação, Instituto Tecnológico e Nuclear, Sacavém, Portugal
Abstract. The most recent training course in the Portuguese Research Reactor took place from 1997 to 1999. The theoretical and practical training given to the new operators was broader than previously, to take into account the need to perform new tasks and to make a better link with the research activities going on in the reactor. The course syllabus is briefly described and assessed vis-à-vis recent recommendations.
1. Introduction The Portuguese Research Reactor (RPI) is a pool-type 1 MW reactor designed by AMF Atomics and built during the period of 1959/61. It is owned by Instituto Tecnológico e Nuclear (ITN), which is the third generation of the main national organisation for nuclear activities in Portugal. The RPI is still using HEU fuel and will be converted to LEU fuel after May 2006 [1]. Like in many other small and medium power research reactors, the continuation of its operation depends strongly on three factors: active users, availability of fuel and ageing of the installation. Ageing of the staff is in general a major concern and being so recognized, its rejuvenation was initiated some years ago.
The RPI operates on a two-shift per day schedule, from 9 a.m. to midnight. Each shift requires a minimum of two operators and a radiation protection technician. In 1997 the RPI had only four licensed operators, with two of them close to retirement age. Therefore the operation in two shifts per day could not continue for very long on a regular basis.
A new two-year training course was started in October 1997 with eleven trainees. It was decided from the beginning that the new operators would have a broader training than previously, to take into account the need to perform new tasks and to make a better link with the research activities in the reactor. Four of the trainees were approved as operators. The good results from this course can be seen now, four years since its ending. The course syllabus is briefly described and assessed vis-à-vis recent recommendations.
2. Initial training courses The initial criticality of the RPI was achieved on April 25, 1961 and full power was reached about one year later after a detailed calibration of the reactor at low power. During this period several training sessions were held, mostly on specific tasks necessary for the calibration of the reactor.
All of the early operators had a university degree in physics or engineering, followed by the Génie Atomique course in same cases. The first operators outside this initial group were selected essentially on a one by one basis among staff of the institution with some experience in nuclear activities. They received an on-the-job training that included theoretical and practical aspects relevant for the job.
The first formal training course was held in 1968, with 15 weeks of classroom training and facility familiarization, followed by one year on-the-job training in the facility. The trainees were selected among candidates with at least a high-school diploma. Most of the candidates had a BA or equivalent, which provided an excellent basis for the training as operator. The trainees were subjected to two examinations: a written one, addressing the aspects given in the theoretical classes, and a practical one, addressing the operation of the reactor itself. The classroom training had the following structure:
• Theoretical classes: 33 classes of 1 hour, covering Nuclear Physics (6 classes), Radiation Detection (3 classes), Radiation Protection (3 classes), Reactor Theory (12 classes), Study of the Reactor (8 classes), Safety Rules and Emergency Plan (1 class).
77

IAEA-CN-100/113P
• Practical classes: 9 classes of 3 hours, covering Radiation Detection (4 classes), Radiation Protection (1 class) and Reactor Calibration (4 classes).
The basic structure of this course and evaluation was maintained during the following decades.
3. Training course of 1997-1999 A new two-year training course was started in October 1997 with eleven trainees. Nine of the trainees were selected from candidates external to ITN; the two other were technicians at the institute. Given the existing restrictions on hiring public servants, grants for the external trainees were obtained from the Portuguese Science and Technology Foundation. ITN only effectively employed the approved new operators in 2001, after a lengthy bureaucratic process.
The trainees were selected among candidates with a high school diploma and technical courses in the areas of chemistry, mechanics or electronics. In addition to standard selection procedures, which already include medical examinations, all candidates were subjected to psychological tests performed at a specialized institution.
Several factors favoured training with a broader spectrum than before. On one hand the decrease in the number of support technicians had made it necessary for the operators to perform tasks that were not traditionally theirs and required specific training, e.g., preparation of irradiations and maintenance of equipment. On the other hand, the presence of an initially large number of trainees made it necessary to have a large number of well defined chores or guided work for small groups and this led to a “natural” distribution and rotation of the trainees through all the activities in the reactor, including research activities.
The course comprised a first semester of classroom training, given by researchers of ITN, with:
• Theoretical classes: 52 classes of 1h15, covering Nuclear Physics (5 classes), Radiation Detection (7 classes), Reactor Theory (12 classes), Reactor Technology (12 classes), Nuclear Safety (4 classes), Radiation Protection (13 classes). These classes were complemented with 9 classes for problem solving, of 2 hours each.
• Practical classes: 19 classes of 3 hours, covering Radiation Detection (15 classes) and Radiation Protection (4 classes).
The time devoted to theoretical classes was effectively doubled when compared with earlier training courses. The largest increases were verified in Reactor Technology and in Radiation Protection. The Reactor Technology block here referred includes besides the main blocks of research reactors also the subjects of reactor shielding and heat transfer. These subjects were lectured before to a smaller extent under the Reactor Theory block in a “Glasstone style” [2]. The increase in the Radiation Protection training reflects mostly the evolution this subject has had in the last decades.
The Radiation Detection block also had a large increase, especially in the practical classes. It is worth to note that the 15 practical classes were given to the trainees divided in 3 groups and thus corresponded to an effective number of 45 sessions. These classes included work with Geiger tubes, scintillation detectors, semiconductor detectors (surface barrier and HPGe) and neutron detectors (fission chambers, ionisation chambers, 3He detectors).
The sessions devoted to the Study of the RPI and Calibration of the Reactor that were formerly included in the classroom training were transferred to later semesters, with the trainees already in the reactor.
No formal refresher courses on mathematics were organized. The eventual difficulties were addressed in the problem-solving classes. Many of the problems required the use of spreadsheets (Excel) for calculations and building of graphics. As a principle, emphasis was placed on the understanding of the basic underlying principles and not on the ability to solve sophisticated problems.
At the end of the semester the trainees had a written examination, followed by an interview to discuss the results of the evaluation. This was conducted as a second step in the selection process to ensure that only the best and more motivated continued in the program. As a result only seven out of the initial eleven trainees were retained.
78

IAEA-CN-100/113P In the second semester the different systems of the reactor were introduced through a three-step approach:
• Classroom introduction of the system (ventilation, water treatment, control system, etc.). • Facility walkthroughs, in operating and non-operating conditions. • Chores or guided work in small groups.
This three-step approach provided increased levels of detail to the trainees. Whenever necessary for clarification, parts of the steps above were repeated. In each of the systems an ample use was made of key operation and maintenance documents:
• Daily check-up list (i.e., explain what parameters are verified on a daily basis and why). • Weekly maintenance list (i.e., explain what tasks are performed weekly and why). • Annual maintenance list (i.e., explain what tasks are performed yearly and why).
Many of the chores given to the trainees were not just training exercises. Two examples are given below:
• Some of the trainees were asked to perform a detailed verification of the status and dimensions of beam tubes that were kept in storage since the refurbishment of the pool in the late eighties [1], with the objective of detecting faults or eventual deformations. The trainees participated later in the reinstallation of three beam tubes in the reactor.
• To gain more confidence in the conditions of the installation, some trainees were asked to sample and measure water collected at various points inside and outside the reactor hall, using the gamma spectroscopy techniques learnt in the classes. The trainees participated later in the sipping tests performed on spent fuel assemblies prior to their return to the USA [3] using the same basic procedures of measurement and quality control.
Regarding guided work, all trainees participated in the annual maintenance, which was longer than usual to allow ample access to all systems. The trainees with previous experience in electronics participated actively in the implementation of a revised plan for preventive maintenance of the control system [4].
This semester provided an excellent opportunity to test the trainees in several aspects relevant for the operator’s work. During the course of the semester three more trainees quit, mostly due to difficulties felt during the work in the reactor. The actual on-the-job training was performed in the following two semesters. The trainees were gradually introduced in the operation of the reactor, under the supervision of a senior operator. At the end of the fourth semester there was a written examination on the facility and a practical examination. All the four trainees that started the second year of training were approved.
4. Conclusions In general it is felt that the selection procedures and the followed program are well in line with the IAEA documents Recruitment, Training and Qualification of Operating Personnel for Research Reactor Facilities (Safety Practice) [4] and Recruitment, Qualification and Training of Personnel for Nuclear Power Plants (Safety Guide) [5], when taking into account the complexity of the RPI.
Four years after the end of the 1997/99 training course we make a clear positive balance of the effort made but there are aspects that will be continuously followed, most of them directly or indirectly connected with the safety of the installation. One such example is the discussion of incidents in research reactors available through the Incident Reporting System for Research Reactors of the IAEA.
Practice has shown that new courses should have classroom training in at least three more subjects:
• Quality Assurance – although not approached as a separate subject in the most recent course, it was present in many parts of the course; a more systematic approach is desirable.
• Water chemistry – some difficulties were found, mostly due to the fact that chemistry education in high school is not as good as was usual and this should be taken into account.
79

IAEA-CN-100/113P
• Electronics – only a hands-on training was given to trainees that had already some experience; a systematic approach of at least basic concepts to all trainees is desirable.
Regarding the link with the research activities, we feel it was generally improved by the fact that the new operators have a better understanding of the activities and associated equipment and are able to perform some tasks when necessary. It is worth noting that the advantage of a small installation like the RPI is that it allows a close contact between the users and the operators, which is beneficial for the installation.
Acknowledgement
The ITN staff engaged in the training of the new operators is gratefully acknowledged for its enthusiastic support. The training course of 1997/1999 was supported by Fundação para a Ciência e a Tecnologia, Portugal, under the PRAXIS program.
REFERENCES [1] RAMALHO, A.J.G., MARQUES, J.G., CARDEIRA, F.M., “The Portuguese Research Reactor:
A Tool for the Next Century”, Research Reactor Utilization, Safety and Management (Proc. Int. Symp., Lisboa, 1999), IAEA, Vienna (2000) IAEA-SM-360/5.
[2] GLASSTONE, S., Nuclear Reactor Engineering, Van Nostrand, Princeton (1951).
[3] RAMALHO, A.J.G., MARQUES, J.G., CARDEIRA, F.M., “Return of Spent Fuel from the Portuguese Research Reactor”, Research Reactor Fuel Management (Proc. Int. Meeting, Colmar, 2000), European Nuclear Society, Berne (2000) p. 75-79.
[4] MARQUES, J.G., RAMALHO, A.J.G., “Operating and Maintenance Experience of the C&I of the Portuguese Research Reactor”, Control and Instrumentation in Nuclear Installations (Proc. Int. Conf., Bristol, 2000), The Institution of Nuclear Engineers, London (2000).
[5] INTERNATIONAL ATOMIC ENERGY AGENCY, “The Recruitment, Training and Qualification of Operating Personnel for Research Reactor Facilities: A Safety Practice”, Draft 3, IAEA, Vienna (1997).
[6] INTERNATIONAL ATOMIC ENERGY AGENCY, “Recruitment, Qualification and Training of Personnel for Nuclear Power Plants”, Safety Guide NS-G-2.8, IAEA, Vienna (2002).
80

IAEA-CN-100/133P
Development of a Diverse Secondary Shutdown System for a Low Power Research Reactor. D.S. Bond, S.J. Franklin, N.J. Chapman, H.J. Phillips, Y. Askan1 Imperial College Reactor Centre, Imperial College London, Silwood Park Campus, Ascot, United Kingdom
Abstract. A second, diverse and redundant method of reactor shutdown has been developed for the CONSORT low-power research reactor. The development of this system has been agreed between Imperial College Reactor Centre and Nuclear Installations Inspectorate, NII in the United Kingdom. This poster-paper discusses the need for this diversity from a regulatory perspective and also looks at the probabilistic and deterministic safety cases for the CONSORT reactor, reviewing existing relevant regulation and guidance.
The system that has been developed relies on the manual insertion of a coupled string of fully encapsulated cadmium absorbers into an irradiation tube normally used for the deployment of pneumatically injected samples. The cadmium absorber string can be inserted manually and pushed into a fixed position with the first absorber positioned at the centre of the core, and subsequent absorbers stacked above to the extent of maximum core-height. The system is deployed manually in order to satisfy the requirements for zero reliance on electrical and pneumatic components. The design of this system has the advantage that it can be readily inserted and easily recovered without risk of damage to the reactor core. In addition there is minimal risk of core contamination as the system is inserted into a fully sealed system. Development was based around one group calculations with excess reactivity measurements and modelling carried out using the Argonne National Laboratory, PARET computer code [1].
It was shown by experiment that the system was capable of shutting and holding the reactor down from a balance point at 78 kW without the further movement of any control-rods. The reactivity time curve measured during the experiments closely matched that predicted by the PARET code, and confirmed the prediction that the system was capable of shutting the reactor down from the full operational power.
1. Introduction The CONSORT reactor is a low power light water moderated research reactor operating at a maximum thermal power of 100kW. This reactor is the only remaining civil research reactor in the United Kingdom and is run by Imperial College of Science Technology & Medicine2 which is the licensee for the facility. This reactor has been operating continuously and safely for 37 years since the first criticality was established on 9th April 1965. The reactor was built originally for the purposes of training nuclear engineers for the UK nuclear power programme and was funded directly by the UK government. The UK nuclear industry operates under the requirements laid down in the UK Nuclear Installations Act, 1965 [2] and is regulated by the Nuclear Installations Inspectorate (NII), a department of the UK Health and Safety Executive (HSE).
1 MSc Project work performed whilst studying at Birmingham University, Department of Physics and Astronomy, Birmingham, UK. 2 The University’s legal entity remains Imperial College of Science Technology & Medicine, ICSTM, although the University has since January 2003 operated under the title of Imperial College London.
81

IAEA-CN-100/133P
2. Regulatory perspective: periodic safety review This section of the poster-paper discusses the need for diversity from a regulatory perspective and also looks at the probabilistic and deterministic safety cases for the CONSORT reactor, reviewing existing relevant regulation and guidance.
The development of this system has been agreed between Imperial College Reactor Centre and the safety regulator, Nuclear Installations Inspectorate (NII), part of the Health and Safety Executive (HSE) in the United Kingdom. Despite the lack of a secondary shutdown system in the original design, the NII have agreed in the report on the periodic Safety Case Review [3] that they are generally satisfied that the CONSORT reactor is adequately safe. The analysis of the reactor operation using the PARET computer modelling code has enabled both a detailed fault analysis to be carried out and also to fully define the claims made for the safety systems in previous safety reports. The licensee has also had a level one Probabilistic Safety Assessment (PSA) completed to further support the assertions made in the deterministic analysis as to the adequacy of the existing provisions. In addition the licensee has instigated further improvements to bring the reactor into line with modern standards. As part of the Probabilistic Safety Revue (PSR), a detailed component level PSA has been produced by a contractor on behalf of Imperial College. The analysis, which has been carried out using linked event trees/fault trees using a modern code is consistent with current PSA practice and has been deemed acceptable for the PSR. However, the introduction of a secondary shutdown mechanism has been agreed in order to demonstrate improvement in a system which was built in 1965.
2.1. Summary of the findings of the safety analysis From the safety analysis using the PARET code, it has been recognised that in the worst possible situation following loss of coolant after a failure to shutdown that the reactor has a window of some tens of minutes if no further action is taken before fuel temperatures approach temperatures at which clad integrity may suffer (~600ºC). The maximum fuel plate temperature calculated was 502ºC using 1–D steady state conduction assumptions. There are many conservatisms built into this assessment. Firstly, this assumes that core rating does not decrease as water level decreases, and secondly, that the decay heat does not decrease on these time-scales for fuel uncovering. One additional problem that CONSORT has is the lack of a coolant depth gauge. Instead, the design relies upon high and low level alarms based upon float switches. Subsequent modifications will address this deficiency. In the meantime, operators are instructed to monitor upwards trend changes in the plant fixed gamma dose-rate monitor readings and electronic personal dosimeter readings which would indicate a loss of shielding resulting from a loss of coolant.
The CONSORT reactor control rods are driven using flexible tapes in conjunction with drums and electromagnetic clutches. Shutdown is achieved by disrupting the power to the electromagnetic clutches which allows the control rods to drop under gravity within dedicated guide channels. This disruption is made by trip circuits causing the breaking of either of two guard-lines. If some mechanism existed to prevent the rods from dropping, the reactor would not shutdown. Such mechanisms identified include:
• Control rod swelling/buckling (unlikely due to low burn-up, this is routinely examined using an underwater camera system).
• Debris in control rod guide channels (unlikely). • Seized bearings on control rod housings (unlikely due to rigorous maintenance
schedule). • Control rod suspension tapes jam (unlikely due to rigorous maintenance schedule).
82

IAEA-CN-100/133P
• Failure of the support brackets for the control rod housings (fixed to the side of the monolithic concrete shield).
• Seismic activity (shown to be frequency of 4 x 10⁻⁶/year therefore this is unlikely). • Impact from the crane (would not affect more than one core quadrant. Movement of
the crane over the reactor top whilst the reactor is at power is prohibited by an Operating Instruction).
None of these mechanisms have been shown to have significant probability for more than one control rod. Drop times are measured monthly, and no adverse trends have been identified. In addition, it has been shown that for most core configurations either the Primary coarse control rod or the Safety rod would in fact shut the reactor down by themselves.
The HSE Safety Assessment Principles (SAPS) [4] require, and best-practice recommends, that a diverse method of shutdown providing an alternative to the control rods should be achievable. In terms of As Low As Reasonably Practicable (ALARP) assessment, a diverse means would be beneficial. IAEA best practice [5] recommends the Operator to consider a second [automatic] independent shutdown system, depending on the characteristics of the reactor. The CONSORT reactor requires two out of the four control rods to insert into the core to provide sufficient negative reactivity to shutdown. Based upon defensible reliability figures and appropriate convolution of uncertainties, the primary shutdown system following a trip has been shown to have a probability of failure of 8 ×10⁻³/demand. This figure seemed quite high, and although the hazard to be mitigated would not be severe, it was decided that on ALARP arguments, an administrative system at least would be required to provide diverse shutdown and hold down of power for the CONSORT reactor.
2.2. Compliance with UK safety assessment principles The licensee’s safety case must demonstrate compliance with a set of principles defined by the HSE and the inspectorate will audit the level of compliance. Each Safety Assessment Principle will be dealt with in turn.
There are two types of control rod mechanism, and two types of control blade material. Although there is diversity between the Safety Rod and other rods in the design of motor drive, the electromagnetic clutches, and the limit switches; there remains the extremely low potential for common mode failure. The absorber material in the three most significant control rods is the same, and could be subject to burn-up or corrosion effects, although these have been previously eliminated. The protection system monitoring and instrumentation channels used are also the same for all control rods. This weakens the claim of compliance with SAP 68 which is shown below, and which is why additional systems are being explored.
P68 The design should make the best use of diversity, redundancy and segregation in the structures, systems and components which are important to safety.
2.3. Best-practice experience and diversity Two commonly used diverse shutdown systems are lowering the moderator and injecting neutron-absorbing material. In most research reactors still in operation and those recently decommissioned within the UK, dumping the moderator is part of the shutdown procedure, and can also be used as a diverse shutdown mechanism in the event of failure of the primary protection systems. In many designs of research reactor, including the UK’s NEPTUNE reactor, and the now decommissioned UTR-300 and JASON, the moderator can be dumped to a below core tank in approximately the same time as rod insertion. This provides a diverse shutdown mechanism, as required by the SAPs:
83

IAEA-CN-100/133P
P80 Diversity and segregation should be used as appropriate where the possibility of common cause failures would otherwise threaten the achievement of the reliability required for a safety function.
P182 The protection system should employ diversity in the detection of fault sequences, preferably by the use of different variables, and in the initiation of the safety system action to terminate the sequences.
2.4. How CONSORT compares Lowering the moderator level at CONSORT to reduce moderation is feasible but not straightforward. The design intent for CONSORT was that it should be possible to pump the moderator to the dump tank in the event of tank failure, not as a diverse shutdown system. Although CONSORT has a dump tank below ground level outside of the reactor hall, it is believed that due to a design flaw, it cannot be used to accept dump water with the current pipework arrangement. This would require additional pipe-work modification, a reversal of the normal flow through the pump and a guaranteed electrical supply for the pump.
The usual method for injection of neutron-absorbing material, such as boron doping of the coolant, is very difficult to recover from, and in this case could also threaten fuel integrity. A proven technique that can be recovered from, if necessary, is required. However, the In-core Irradiation System in CONSORT offers an opportunity not only to deploy neutron-absorbing material into centre of the core, but also to make recovery easy, if required.
2.5. CONSORT transients The transients this system would protect against would be of two main types: unprotected reactivity faults, or transients of low predicted frequency, where core disfigurement might be assumed to have taken place.
The accident sequences when a diverse secondary shutdown system might be required, but the core structure would be in intact, would be unprotected reactivity transients, which are not terminated by other means. Although these transients have not been modelled for extensive periods, the time interval allowing for the first peak in power has been captured. When the consequences of each transient were calculated, the assessment allowed for an estimated radiation exposure time to the operators of 400-600s for unprotected transients (the variation is dependent on whether the transient power tails off or not). This accounted for the width of the power (and therefore dose-rate) peak, and the expected evacuation time, which was set at 10 minutes, based upon the time it would take to recover a sample left in one of the irradiation systems.
Of course, if the reactor failed to shutdown, it would continue to operate at elevated temperatures and power levels. Whilst this is undesirable, there is no hazard to the equipment, and especially no threat to fuel integrity, and the major consequence would be an increase in dose uptake to the operators through increased direct radiation fields. These transients would not require immediate remedial operator action for at least tens of minutes, beyond evacuation of the reactor top area, if the shield doors were open. However, SAPs guide the operator to reduce the impact of such events, and ensure shutdown.
Where core damage had taken place, due to earthquake, or unforeseen structural changes prevented the three out of four control rod insertion required, one would not be as concerned about the recovery of absorber. One might therefore propose one or two systems to cover both classes of event.
P5 All reasonably practicable steps shall be taken to minimise the radiological consequences of any accident.
84

IAEA-CN-100/133P
P180 A reactor should be provided with systems which can shut it down safely in normal operating and fault conditions and maintain it in the shutdown condition with a margin of reactivity that allows for systematic changes and uncertainties in nuclear characteristics, variations in plant state and other processes or mechanisms which might affect the reactivity of the core. The safety systems of non-reactor plant should similarly be capable of achieving and maintaining a defined safe state.
The transients concerned do not have high-consequence outcomes. However, in the absence of a shutdown capability if the built-in shutdown system fails, it is a precautionary step to consider introducing a safety-related system to act as a secondary shutdown system. In relative terms, this system provides an accident management strategy for unprotected reactivity events at CONSORT. It provides a system to reduce dose uptake to any personnel re-entering the building during the transient or working on the system in any remediation or decommissioning phase. This is in line with SAP 331 and 332 listed below.
P331 Accident management strategies should be developed to reduce the risk from severe accidents. The strategies should primarily aim to prevent the breach of barriers to release or, where this cannot be achieved, to mitigate the consequences. The ultimate objective should be to return the plant to a controlled state in which it can be maintained in a safe condition.
For this principle, CONSORT is partially compliant, but requires an emergency shutdown system to meet full compliance. There will be revision to the Emergency Arrangements Instructions to give some “what happens if” scenarios with suggested responses.
P332 The strategies should identify any instrumentation needed to monitor the state of the plant and the level of severity of the accident, and any equipment to be used to control the accident or mitigate its consequences. Where additional hardware would facilitate accident management, this should be provided if reasonably practicable.
The level of compliance is similar to the response to P331 above.
2.6. Requirement for a secondary shutdown system It is a statutory IAEA requirement for all power reactors to have in place a satisfactory secondary shutdown system which can be initiated in the unlikely event that the primary systems fail or are unable to be fully or properly deployed. Although this requirement does not extend to Low Power Test and Research Reactors, it has been agreed with the NII that such a system would be developed for the CONSORT reactor. The system has been developed and implemented to the prototype phase, and this prototype has been successfully tested from 78 kW. The associated procedures for deployment have been developed and operator training has been carried out to allow this system to be deployed in the unlikely event that the primary shutdown systems should fail. The final engineered system is due to be installed and commissioned in early 2004.
3. Development of the system The physics design has been undertaken in conjunction with the University of Birmingham, Department of Physics and Astronomy with the development of the absorber geometry and shutdown test from power, forming part of a postgraduate MSc thesis [6]. As part of this project, a study was undertaken to summarise the techniques currently in use at world-wide test and research reactors in order to summarise the available techniques for consideration in the CONSORT system design.
The techniques that have been used generally fall into three categories which are:
1. Insertion of a neutron absorber;
85

IAEA-CN-100/133P
2. Dumping of the moderator; 3. Removal of fuel.
The option to remove fuel is not practical as no provision was made for this approach at the initial reactor design stage. Dumping of the light water moderator although possible, is not the most desirable option as the modification would require considerable design and engineering work. This option would also reduce the level of shielding provided by the water around the core. The option to insert absorber material was considered the most straightforward and practical means of providing the necessary reduction in reactivity.
3.1. Design considerations One of the primary design considerations was that the system should deployed as far as possible using existing engineered systems and should be retrievable with minimal risk of contaminating the core structure or internal components of the reactor tank with absorber material, an event which would otherwise be likely to cause terminal shutdown for the reactor. For this reason the options for introducing material directly into the reactor cooling water was ruled out. As the CONSORT reactor is fitted with a suite of facilities for the insertion of samples for irradiation in and around the core it was clear that the use of one of these systems would be the most straightforward route. The In-core Irradiation System (ICIS) was chosen for the feasibility study and for the initial design and testing of the absorber material and geometry. The ICIS facility was chosen on the basis that the irradiation tube directs samples to the centre of the reactor core, and consequently would be the optimum point at which to make a negative reactivity insertion. A schematic of the CONSORT reactor showing the location of the ICIS system is shown in Fig 1. The practical advantages of deploying the absorbers into the ICIS system is that access to the ICIS pipe for loading the absorbers can be made without needing to open the concrete shield doors covering the reactor top, consequently maximum biological shielding can remain in place for the duration of the insertion.
It is an overall requirement that the system must be capable of bringing the reactor to the ‘Full Shutdown’ level from full power with all the control rods remaining in their normal operating positions. In addition it is essential that the system has zero reliance on electrical and pneumatic components in order to address the issues associated with loss of power or pneumatic control. The testing of this system with the reactor at power required the associated Modification Proposal to be agreed by the reactor Nuclear Safety Committee. Additionally it was necessary to obtain in advance of the experiment documented agreement from the nuclear industry regulator (NII) to suspend the reactor Operating Rule governing maximum reactivity insertion for the duration of the experiment (Operating Rule 12 sets a limit of 0.1% on the maximum negative reactivity insertion permitted from any sample). Operating Rules have now been agreed which allow deployment of such a system if required.
The system has been designed to ensure that it can be successfully deployed by a team of two persons in line with minimum ‘Duty’ staffing levels required for reactor operations. The experimental deployment described in Section 3.5. includes many extra members of staff who were present due to the experimental nature of the operation for the purposes of information gathering and additional control. This was necessary as the procedure had not been carried out before at the CONSORT reactor. These extra people would not be required in a real Secondary Shutdown event.
86

IAEA-CN-100/133P
FIG. 1. Schematic of the CONSORT reactor showing the location of the ICIS irradiation
system
3.2. Reactor physics design. Thermal neutron absorbance is the most important mechanism in the CONSORT operating environment, and the absorbance of epithermal neutrons is of secondary importance. Consequently materials such as hafnium, indium and boron, although considered as part of the absorber design were rapidly discounted in the absorber selection process. Cadmium was selected as the most practical and cost-effective black thermal neutron absorber.
The geometry and associated reactivity depression resulting from the insertion of a cadmium absorber was optimised on the basis of both one-group and two-group calculations taking into account the constraints of the ICIS pipe dimensions. The details of these calculations are given in [6].
3.3. Experiments In order to verify the results of the calculations and to finally establish which absorber design geometry was the most effective, a series of reactor approach to critical experiments were undertaken (at a reactor power of 5W). For these experiments the absorber material was sealed inside a standard polythene ICIS capsule (of dimensions 69 × 18mm) and lowered into position prior to reactor start-up. These experiments included the consideration of geometries such as sheet shaped in the form of a cruciform. The results showed that a simple 16mm diameter x 0.5mm thick hollow cadmium cylinder that filled the entire height of the ICIS capsule was the most effective material and geometry (16mm is the maximum diameter that can be fitted within an ICIS capsule). A “stringer” arrangement was developed, consisting of five capsules each containing a single cylinder. The capsules were connected to each other by nylon cord giving an effective absorber length of 27cm. This stringer is shown in Fig. 2.
In order to ensure that the absorber stringer can be pushed into place and does not rely on gravity alone for its movement a flexible semi-rigid nylon rod is attached to the stinger. This allows the absorber stringer to be clamped in place once fully deployed in order to minimise
ICIS FACILITY
87

IAEA-CN-100/133P
the risk that the stringer could be ejected or pushed back out of position once inserted. This is of course essential in order to minimise the risk of a transient resulting from sudden withdrawal or movement of the stringer.
FIG. 2. The cadmium absorber stringer
FIG. 3. The access plates showing ICIS
route into the reactor tank (normally fully shielded with concrete shield doors)
FIG. 4. Radiological monitoring during
uncoupling of the ICIS Pipe
FIG. 5. Uncoupling the ICIS Pipe prior to deployment of the absorber
An approach to critical experiment was performed with the stringer arrangement inserted and it was found that criticality could not be achieved and the reactivity addition for the complete stringer was estimated from rod worth curves at –1.17%.
3.4. Modelling of absorber deployment. The computer code PARET was used to model the effect of absorber deployment from a power of 100kW and was carried out in order to confirm the expected effect of inserting the cadmium stringer with the reactor at full power. For these calculations a pessimistic figure of –0.82% negative reactivity worth was used, as this assumed that a sample from reactor operations may remain in the bottom of the ICIS pipe reducing the effective length of absorber insertion that would be possible. The model also assumed that full insertion of the absorber arrangement would take three seconds (a figure based on operational experience). The model showed shutdown from 100kW could be achieved and predicted a steady drop in
88

IAEA-CN-100/133P
power to 10% of the initial power taking place over 80 seconds, in comparison to 10 seconds for the conventional shutdown insertion of all four control rods (usual operational reactor scram method). After ~150 seconds the power was predicted to fall to ~6.5% of the initial level, in common with reactor scram. The actual results matched well with these predictions.
3.5. Shutdown experiment from full power The practical experiment to demonstrate that the system would work, and to provide data to compare with the PARET modelling results, was carried out from a reactor power of 78 kW. The experimental proposal was subjected to the standard Imperial College Reactor Centre risk assessment and dose assessment procedures on the basis of a practice deployment with the reactor not at power and on the basis of radiological measurements undertaken with the reactor at full power. These procedures and figures were used to make an estimate of the expected dose-uptake to the operators who were to carry out the deployment and to ensure that the procedure was in accordance with the ALARP principle. Appropriate hold points were inserted into the procedures in order to control dose-uptake and the experiment only allowed to proceed once monitoring had established that the dose-rates encountered from the open ICIS pipe were comfortably within the agreed limits.
Full insertion of the absorber was made in accordance with the 3 second deployment time assumed by the PARET code and the drop in reactor power monitored on the reactor Control Desk instruments and Log DC Channel chart recorder. The PARET prediction and the experimental results of the shutdown test are shown in Figs 6 and 7.
0
10
20
30
40
50
60
70
80
90
100
0 25 50 75 100 125 150 175 200
Time (s)
Pow
er (k
W)
FIG. 6. PARET prediction of variation of
reactor power with time after insertion of the –0.82% absorber stringer from a power of 100 kW
0
10
20
30
40
50
60
70
80
90
100
0 20 40 60 80 100 120 140 160 180 200
Time (s)
Pow
er (
kW)
FIG. 7. Measured variation of reactor power
with time after insertion of the absorber stringer from a power of 78 kW
3.6. Operator dose-uptake
The maximum dose-uptake resulting from the experimental deployment was 0.8 µSv. This demonstrates that the system can be deployed with acceptable dose uptake. The figures and duties of those involved in the test insertion are set out in Table 1.
89

IAEA-CN-100/133P
Position Duties during insertion (location)
Dose uptake (µSv)
Duty Reactor Supervisor
Reactor supervision (Control Room)
0.10 (nominal)
Duty Reactor Operator Reactor operation (Control Room)
0.10 (nominal)
Deployment Supervisor Reactor top (radiological monitoring and insertion of stringer)
0.80
Deployment Operator
Reactor top (insertion of stringer)
0.31
Radiation Protection Supervisor
Reactor balcony (radiological monitoring & barrier access control)
0.10
Reactor Safety Officer Safety advisor (Control Room)
0.10 (nominal)
MSc Student Data collection and analysis (Control Room)
0.10
Table1: Dose uptake for the deployment team and other reactor staff directly involved with the insertion experiment.
4. Training and implementation The prototype system and the equipment required for its use has been made available on the reactor top as an interim arrangement until the final system is engineered and commissioned. Subject to a cost benefit analysis a final system will be developed which incorporates a dedicated additional feed into the ICIS pipe so that it will not be necessary for the pipe to be dissembled prior to insertion. In the final system the absorber stringer will be permanently loaded in a side arm so that it remains in position ready for insertion but isolated from the ICIS pipe via a manually operated valve.
The standard operating procedure required for the use of the prototype Secondary Shutdown System has been written and issued in accordance with the Imperial College Reactor Centre policy of peer reviewed procedures. All operations staff have also received training in both the decision making process associated with the incident declaration and the instruction to deploy the system, and also in the practical aspects of the system. One particularly important aspect in the instruction is not to remove the secondary shutdown system prior to determining shutdown by other means. This is to avoid the risk of a reactivity transient on removal of the system. The training has included a number of test deployments with the reactor remaining in the Full Shutdown condition for the duration of the training. It is expected that the final system to include mechanical deployment will be installed early in 2004.
5. Conclusions A Secondary Shutdown System has been developed that has practically demonstrated that it is capable of shutting the CONSORT reactor down from nominal full power. The system is capable of being deployed on a time-scale that is consistent with the fault scenarios outlined in the Safety Case by two persons, and does not rely on any electrical or pneumatic controls for its successful deployment. The system has been modelled using the PARET code and the results from the shutdown experiment have been shown to be in good agreement with the PARET predictions. The system can be used with minimal dose-uptake to the operators involved in its deployment and has the additional advantage of simplicity coupled with minimal risk of absorber contamination of the core.
90

IAEA-CN-100/133P
REFERENCES [1] WOOLRUFF, W.L., SMITH, R.S., A users guide for the ANL version of the
PARET Code, PARET /Argonne National Laboratory, USA.
[2] Nuclear Installations Act, 1965.
[3] Report of the Conclusions of the Health and Safety Executive (HSE), Nuclear Installations Inspectorate (NII), Review of the First Periodic Safety Review for the Imperial College Consort Reactor http://www.hse.gov.uk/nsd/impcol.pdf.
[4] Safety Assessment Principles http://www.hse.gov.uk/nsd/saps.htm.
[5] Draft Research Reactor Safety Requirements of Research Reactors, IAEA DS 272.
[6] ASKAN, Y., Development of a secondary Shutdown System for the Imperial College CONSORT reactor, University of Birmingham, Department of Physics, MSc thesis, September 2002.
91

IAEA-CN-100/139P
Simulation of the Syrian Miniature Neutron Source Reactor for Training Operators on the Analysis of its Anticipated Operational Accidents I. Khamis Atomic Energy Commission of Syria, Damaskus, Syria
Abstract. For the purpose of training operators and other educational aspects, a mathematical model capable of assessing potential accidents and safety implications of the research Miniature Neutron Source Reactor ( MNSR) has been developed. The model considers relevant physical phenomena that govern the core such as reactor kinetics, reactivity feed-backs due to coolant temperature and xenon, and thermal hydraulics. Natural convection and point kinetics including the prompt jump and complete mixing approximations were employed. Peak power, reactivity core load, core outlet temperature, and other variables are predicted during self-limiting power excursions. Compared to related references, close results have been obtained. The simulating model proves to be a useful tool to train operators and students to assess qualitatively the transient behaviour of the MNSR as a result of sudden reactivity insertion in the core. In addition, the model was utilized to verify some of the design basis accidents already presented in both the Safety Analysis Report (SAR) and the Commissioning Report (CR) of the reactor, as can be seen in Table 1. Furthermore, the dynamic model generates other core variables that are of interest to update the SAR on one side, and confirms others measured and reported in the CR.
1. Introduction Computer-based training can be very efficient to new recruits in the field of reactor operation. It can also be very useful and beneficial to improve the knowledge and experience of operation personnel of either nuclear power plants or even research reactors. In particular, such training is absolutely essential when conducted on issues that are difficult if not impossible to perform in real world such as sever accident or even to demonstrate operational accidents that are directly related to safety of the reactors.
For the Miniature Neutron Source Reactor (MNSR), computer-based training is not as vital as or comparable to power plant or high power research reactors. Being inherently safe reactor: having small amount of excess reactivity and large negative moderator coefficient of reactivity, the MNSR can easily withstand most conceivable operational incidents without any successive damage to the core. However, frequent demonstration of the inherent safety features of the reactor for operators or for the purpose of education is not considered a wise task since it may jeopardize the operation of MNSR.
In this paper, modelling and simulation of the MNSR will be discussed. The model and consequent simulation is intended mainly for educational and training purposes.
2. Simulation model The MNSR simulation model consists of both neutronics and thermal hydraulic sub-models that are programmed in a simulation language called DESIRE ( Korn, 1986). The neutronics model is a six-group point kinetics model ( Hetrick, 1971; Lewins, 1978; Ash, 1979 ) given as
ii
icnldt
dn ∑=
+−
=6
1λβρ
92

IAEA-CN-100/139P
6,...,2,1=−= icnldt
dcii
ii λβ
where n = Neutron density ρ = Reactivity load
Rcexfmfmmm tTtT ..)(.)(. ρρααρ ++∆+∆=
β = Total fraction of delayed and photo neutrons ∑=
=6
1iiββ
l = Neutron generation time λi = Decay constant for the i-th precursor ci = i-th group of delayed and photo neutrons i.e. precursors βi = the i-th fraction of delayed and photo neutrons
=fmα Fuel reactivity coefficient [∆k/k/Cº], given as
2976 1009.11090.21073.7 fmfmfm TT −−− ×+×−×=α
For training purposes where the most dominant factor is the moderator coefficient of reactivity, it is considered sufficient to concentrate only on this factor and neglect the fuel reactivity coefficient. Hence, the total load of reactivity can be given as
xeinitcoremcr TT ραρρ +−+= )( where
=crρ Reactivity load of the control rod [mk], =mα Moderator reactivity coefficient [∆k/k/Cº], and is given as:
corem T⋅×−×= −− 33 100034752.010026445.0α
=coreT Average core coolant temperature at time t [Cº],
=initT Initial core coolant temperature [Cº], and
=xeρ Xenon reactivity [mk].
The Xenon reactivity is found using the following model (Khamis et. Al, 2000)
Where Xe is the xenon concentration. The xenon reactivity xeρ is given as
The iodine concentration is calculated as
Where ixe γγ , are the yield of xenon and iodine, xef σ,Σ the fission macroscopic and microscopic
cross sections, )(tΦ the thermal neutron flux, xei λλ , the decay constants for iodine and xenon respectively.
)()()( tItdt
tdIifi λγ −ΦΣ=
)()()()()()( ttXetXetItdt
tdXexexeifxe Φ−−+ΦΣ= σλλγ
Xexe151023.1 −×=ρ
93

IAEA-CN-100/139P The thermal hydraulic model is given as the common set of equations that govern heat transfer for single phase of flow. The energy equation can be written in the form of mass flow rate balance( Khamis, 1988). The general form then becomes as
∑∑ ⋅−+++⋅−⋅=⋅ MdtdSP
dtdVV
dtdPQSmSmS
dtdM outin )()(
where M is the mass, S the average enthalpy, m the mass flow rate, P the pressure, and V the total volume. The general energy balance is given in terms of temperature as
)(])([1 tQdt
dTrTk
drd
rdtdT
C vfm
fmfmfm
fmpfm +⋅⋅⋅=⋅⋅ ρ
where C is the specific heat, ρ is the fluid density, T is temperature, r position, and Q is the external energy inflow. The initial boundary conditions are:
)()( fmcrcrc TThtTdtdk −=⋅ =
)()( tTdtdktT
dtdk crfmrfm ⋅=⋅ =
For the MNSR, since the fuel rod diameter is less that 4.5 mm and clad thickness is 0.6 mm, the clad and fuel temperatures are considered to have the same values. Hence,
T t T tfm c( ) ( )≈
Manipulating previous equation, one may reach the final equation that describes the change in cladding temperature as
Where energy transferred from fuel to coolant is given as
)]()([)( tTtTAhtQ coolcsf −⋅=
An approximation for the average coolant temperature in the core is given as
TT t T t
cool =−1 2
2( ) ( )
Other equations that specify the fluid mechanics and state equations are the followings (Khamis, 1986; Khamis, 1988). The heat transfer coefficient h is given as
ma
e
RnDKh ⋅⋅=
where K is the heat transfer coefficient due to conduction, De the hydraulic diameter, n and m are constants, Ra is the Raleigh number and given as a function for both Grashohf and Prandtl numbers. The Grashohf and Prandtl numbers are given as
)(1dt
dTrK
dtd
rdtdT
C cc
ccpc =ρ
0)(0
=∂
∂=rt
tT
)()()(][ tQtQtTdtdCpmCpm ftcccfmfm −=⋅⋅+⋅
Pr.GrRa =
94

IAEA-CN-100/139P
)(2
3
coolce
vr TTD
gG −⋅⋅=ν
β
PC
Krp
=⋅µ
where g is gravity acceleration, vβ comparability, µν , are dynamic and static viscosity.
As a result, the final form of energy balance that is applicable to any control volume is given as
)]()([)()()( tTtTAhtQtTdtdCmCpm coolcstcpccfmfm −⋅−=⋅+
In order to calculate the pressure drop in the model, the general momentum equation i.e. the Bernoulli equation, is given as
∑∑ −∆+= 2.... uFpZgudtdL ωω
where ω is the density of fluid, u the velocity, L the length of the joint of the volume cell, Z the potential elevation, p∆ the pressure drop, and F the friction constant.
For MNSR, we have assumed in our model 4 control volumes i.e. regions, and only one joint for the momentum equation. The overall model consists mainly of the following equations
22
2111 ..).(.).(.).(.2 uuDHHgHgu
dtdHH
e
ωξωψωωωωω −⋅⋅⋅−−+−=⋅−
where H and H1 are the potential heights of the joint, ωωω ,, 1 are specific and average densities in the control volume and at the inlet to the control volume, ξψ , are the pressure drop constants due to friction and expansion. The final energy equations which represents the MNSR loop ( see figure 1) are
1) For the core region
M Cpddt
T Q u A Cp T Tcool cool cool. . . . ( )= − −ρ 2 1
where Q A N h T Tcool cs fe clad cool= −. . ( )
2) For the upper part of the reactor vessel (region 3):
poolp QTCpmTCpmTdtdCm −−−=⋅⋅ 332333 )..()..(
3) For the down-comer region (region 4):
4443444 )..()..( −− +−−=⋅⋅ Bpool QQTCpmTCpmTdtdCpm
with the assumption that T t T t4 1( ) ( )=
4) For the pool region:
poolpoolooo QQTdtdCpM −− += 4..
95

IAEA-CN-100/139P
chimney
Down -comer
Upper plenum
Lower plenum1
core
pool
FIG. 1. Schematic representation of the MNSR model
3. Results and discussion The developed model was tested against some experimental results already performed at the Syrian MNSR. Table 1 summarizes results of simulated and reported transients which involves the insertion of positive reactivities in the MNSR and the Canadian SLOWPOKE reactor, very similar to MNSRs. These transients simulate in general the most expected incidents that may occur in such reactors. The transient that involves low value of reactivity simulates the incidents where almost half of the maximum excess reactivity is introduced due to the miss-calculated addition of top beryllium reflector. The other two medium values simulate the incident where cold clean condition may be obtain with sudden start-up of the reactor but the control rod is failed to be inserted in the core (i.e. control rod is stuck in the upper position out of the core during start-up). The last transient simulates the case where the two previously mentioned transients are created simultaneously i.e. the addition of miscalculated top shim of beryllium followed by a stuck of the control rod.
As seen from results of simulated transient ( see Fig. 2 and Table 1.), results of the simulated model agree well with the experimental data. On the other hand, the simulating model represents an excellent tool for educational and training purposes to verify the inherent safety features of the reactor. It can also be used as a mathematical model to train operating personnel to calculate the effect of the moderator coefficient of reactivity, the expected peak of energy as a function of the inserted reactivity, or temperatures of various regions of the MNSR.
Table 1. Comparison of simulated and reported transients Reactor parameters Simulated Reported Inserted reactivity (mk)
Peak power )kW ( 33.78 N/A Peak thermal neutron flux ( n.cm-
2.s-1) 1.37 x 10¹² 1.40 x 10¹²
Core outlet temperature (OC) 47.34 45.2
2.1*
Peak power ) kW ( 76.6 76 Core inlet temperature (OC) 60.2 60
3.6*
Peak power ) kW ( 87.43 N/A Peak thermal neutron flux ( n.cm-
2.s-1) 3.39 x 10¹² 3.31 x 10¹²
Core outlet temperature (OC) 59.79 63.3
3.8**
Peak power (kW) 164.2 125 Core outlet temperature (OC) 74 86
6.05*
* From the Safety Analysis Report ** From the Commissioning Report N/A Not available
96

IAEA-CN-100/139P
4. Conclusion The dynamic model, being incorporated into the C++ Assembly language, constitutes now an excellent training tool for students and newly recruited operators. The primary task of training using the simulator is to:
• Comprehend the dynamic behaviour of the MNSR at various power levels, including the effects of reactivity feed-backs during both normal and abnormal conditions.
• Study specific aspects of operations. • Compare results with actual characteristics to check validity of theoretical
background. • Increase awareness to the importance of having inherent safety aspects of the MNSR
as can be deduced from Fig. 1.
Proposed modification on the dynamic model such as: to include photo neutron effect resulting from the presence of beryllium as a reflector on the dynamic behaviour, to assess Doppler effect and formulae, and to study build-up of poisons in the MNSR are encouraged and considered as part of the educational and training process.
FIG. 2 Reactor power response for reactivity insertions
REFERENCES [1] HETRICK, D.L. (1971): Dynamics of Nuclear Reactors, Chicago Press Ltd., 1971. [2] KHAMIS, I., and et al., (2000): Dynamic simulator for the miniature neutron source
reactor, Progress in Nuclear Energy, Vol. 36, No. 4, pp. 379-385, 2000. [3] KORN, G.A. (1986): Enhanced Desire Reference Manual, Version V3.1, Rev.
4/26/86.Univ. of Arizona, USA, 1986. [4] KHAMIS, I. (1988): Simulation of a nuclear power plant pressurizer and its application
to inherently safe reactors, Ph.D. Dissertation, Univ. of Arizona, USA, 1988. [5] KHAMIS, I. (1986): Dynamic simulation of a process inherent ultimate safety power
plant, M.Sc. thesis, Univ. of Arizona, USA, 1986. [6] LEWINS, J. (1978): Nuclear Reactor Kinetics and Control, Pergamon Press, Oxford,
1978. [7] The Syrian MNSR. (1992). Safety Report, internal report, 1992. [8] ASH, M. (1979): Nuclear Reactor Kinetics”, McGraw-Hill Inc., 1979.
97

IAEA-CN-100/140P
Recent Licensing Activities on the TR-2 Research Reactor S. Alten Dept. of Nuclear Safety, Turkish Atomic Energy Authority, Istanbul, Turkey
Abstract. This paper presents the licensing activities of TR-2 research reactor carried out since 2001 and describes the main safety concerns arisen during the evaluation of the safety analyses report. The TR-2 research reactor is located in Cekmece Nuclear Research and Training Centre (CNAEM) of the Turkish Atomic Energy Authority in Istanbul. It is a 5 MW pool type reactor commissioned during late 1970s and reached its first criticality in December 1981. Shortcomings in detailed regulations have caused almost all attempts of licensing TR-2 reactor to end with no avail. TR-2 has been kept operational under temporary permissions at various power levels issued by the authority. Even though various attempts of licensing the TR-2 have failed to be completed, another attempt has been initiated in 2001 and about to be finalized. Primary safety issue of TR-2 is the seismic qualification of the reactor building which was built in the late 50s and early 60s. Furthermore, 15 other issues were determined regarding the operational safety of the reactor and the licensee is required either to prove the safety as it is or to provide remedies for these issues. Currently, most of these issues are resolved. Licensing procedure will be completed upon implementation of the solutions developed for seismic retrofitting of the reactor building.
1. History of licensing activities The TR-2 is a pool type research reactor at 5 MW thermal power with MTR fuel, located by the Kucukcekmece lagoon at the Southwest of Istanbul. Currently it has mixed HEU and LEU core on Al-U and U-Si plate fuels.
TR-2 has been designed to up-rate the 1 MW TR-1 research reactor. The same pool for TR-1 has been used for TR-2. TR-1 core and instrumentation have been disassembled and instrumentation has been used for the TR-2. The first Safety Analyses Report (SAR) of TR-2 has been prepared by the vendor Belgonucleaire, in 1980, and TR-2 reached its first criticality by 1981. However, the first SAR was not addressing the seismic safety. The seismic safety of the reactor and particularly the reactor building has been raised as an issue. Hence, licensing process has been halted for further studies on seismic issues, issuing a temporary permit for operating below 3 MW by 1983.
Meanwhile, the regulatory authority has been undergoing through a restructuring phase. The Turkish Atomic Energy Commission, which licensed the TR-1, has been transformed into the Turkish Atomic Energy Authority in 1982, changing all of its organizational structure. First regulation on nuclear safety has been issued as a decree pertaining to the licensing of nuclear installations in 1983, which covered the requirement of a license for operating the nuclear installations and procedures of licensing of these installations. However, no further regulations were prepared regarding details of the licensing activities other than one regulating the licensing of operators, senior operators in research reactors, etc.
Studies on seismic safety of the reactor and the building remained inconclusive owing to the shortcomings in national regulations and conflicting results obtained in different studies. Even though Istanbul Technical University stated in its report that the reactor pool and building can stand 0.4 g and 0.18 g, respectively, another report claimed that reactor can not stand the loads as it was claimed by ITU.
98

IAEA-CN-100/140P
While seismic safety of the building was investigated, the operator has been asked to prepare a new SAR according to IAEA Safety Series 35-G1. The SAR has been revised, but it was not assessed due to non-compliance with IAEA guidelines.
In 1986, the temporary permit has been upgraded to 5 MW. Reactor operated at this power level until 1995, until the seismic issues became greater concern regarding new information on seismic behaviour of surrounding area of the reactor site. A temporary permit has been downgraded to operate at 50 kW in 1997 and it is upgraded back to full power by 1998. Reactor survived the 1998 Kocaeli earthquake registering 0.18 g at free field in the reactor site. Reactor has been shut down for seismic retrofitting in 1999.
2. Recent initiation on licensing of TR-2 By 1999, a new initiation has been started to finalize the licensing of TR-2. Four main issues were identified to deal with. They were the seismic safety of the building, the absence of national regulations particularly on acceptance criteria, the SAR non-complying with IAEA Safety Series 35-G1, and new national regulation on seismic qualification of buildings.
Each issue has been handled separately. An IAEA Technical Cooperation project has been initiated in 1999 to perform in-depth dynamic structure analyses for the reactor building. Complete static and dynamic analyses were performed for the reactor building for postulated earthquake of 0.4 g on free field using well known codes in this context.
In 2000, the project on development of national regulations has been started, focused on both the revising existing regulations and drafting new ones as necessary.
A through assessment and evaluation of existing SAR has been started in 2001. For the assessment and evaluation process, it has been postulated that
• The ultimate responsibility of nuclear safety lies with the licensee,
• TR-2 is an operating reactor in long-term shutdown state,
• No single event should result in breach in fuel integrity,
• Problems are to be classified as ones which are prerequisite to the license or ones which can be dealt with after licensing, but need to be followed up, and
• IAEA Safety Series 35-G1 and NUREG 1537 will be the guides for assessment and evaluation of the SAR.
3. Results The IAEA Technical Co-operation project on seismic behaviour of the reactor building revealed that the building will not endure a seismic movement equivalent to reference seismic load, 0.4 g on free field. Studies showed that seismic loads exceed the strength of various structural junctions and retrofitting is necessary. A follow-up project for the engineering of the retrofitting of reactor building has been tendered in 2002 and it has been completed in 2003. This project will be implemented in 2004, provided that enough financial resources available under current conditions.
Assessment and evaluation of SAR revealed 16 issues prerequisite to the license and 12 others which can be dealt after licensing. Among the prerequisites are the seismic retrofitting of the building, including hermetic characteristic of confinement, seismic retrofitting of some mechanical components, redefinition of fuel integrity, redefinition of safety system settings, revising various thermal-hydraulic analyses including natural circulation cooling, revising the
99

IAEA-CN-100/140P
accident analyses and technical specifications chapters of SAR accordingly, preparing a “re-commissioning plan” including retraining of operating personnel.
Reassessment of plane crash probability for renewed nearby Yesilkoy Airport, preparing material monitoring program and revision of environmental impact report and emergency response plan are some of the issues left to deal with after licensing.
The project on development of national regulations based on IAEA Safety Series is still undergoing, with around 60% of completion ratio, and it is expected to be completed by the end of 2006.
4. Conclusions Since most of the issues prerequisite for the license have been resolved, the licensing process of TR-2 is about to be finalized, subject to retrofitting of the reactor building is implemented in the near future. Operating personnel has been retrained, and TR-2 has been granted a permit to operate below 300 kW according to the “re-commissioning plan.”
Prolonged licensing of TR-2 is identified as another manifestation of problems arising from “effectively not independent”, since TR-2 is operated by a research and training centre of the Turkish Atomic Energy Authority which is also the regulatory body.
100

IAEA-CN-100/3P
The Research Reactor as a Tool in the Master in Nuclear Reactors in Argentina C. Notari Universidad Tecnológica Nacional, Facultad Buenos Aires, Comisión Nacional de Energía Atómica, Instituto de Estudios Nucleares, Buenos Aires, Argentina
Abstract. The Master in Nuclear Reactors was created in 1998, in the frame of an agreement between the National Technological University and the Atomic Energy Commission of Argentina. The career was created in Buenos Aires faculty with an academic order which established the general frame and necessary contents. The career provides the students with a general knowledge about the technology of nuclear reactors and the principal disciplines involved. This allows their insertion in the professional field in any of the principal branches, either in basic studies or applied work. Since the very beginning, the performance of selected experiments in a nuclear reactor was recognized as an extraordinary tool to give the students an insight in the principal phenomena associated with the chain reaction and the related engineering problems.
1. Introduction Education in the Nuclear Engineering field has a long tradition in Argentina. It started with the creation of the Atomic Energy Commission (CNEA) in the early fifties of the past century and had a relevant participation in the start-up of the first Latin-American reactor RA-1 in year 1958. In effect, a good number of engineers, physicists and chemists who took part in the design and construction of the facility, attended the first nuclear reactor course that was organized at CNEA in 1953. A distinguished group of professors: Luis Santaló, Carlos González Domínguez, José Balseiro and Jorge Starico, among others, acted as lecturers and the course was devoted to the study of “The elements of Nuclear Reactor Theory” (Glasstone-Edlund, ed. 1952), a novelty by the time.
Since then a rich and some times contradictory story developed around the capital question of human resources for the argentine nuclear programme. Besides the always necessary and effective on the job-training, which undoubtly gave a number of specialists in different disciplines, a more systematic approach was started at the Reactor Department in Buenos Aires with the annual Nuclear Engineering Course for post-graduate students. Organized jointly with the Engineering faculty of Buenos Aires University, this course covered the period 1980-1994, and was directed by Clara Mattei. It has been the source of a great number of specialists that integrated part of the professional teams of the argentine Nuclear Power Plants and other relevant nuclear installations.
More recently, and following a dramatic change in the argentine nuclear scene, when CNEA was divided in three different sectors related with Operation of Nuclear Power Plants (NASA), regulation (ARN) and Research and Development (CNEA), this course was changed to the orbit of the Instituto Balseiro of Bariloche Atomic Centre and devoted to a more general scope of diffusion of nuclear knowledge.
In 1977 the Nuclear Engineering Career was founded in the Centro Atómico Bariloche. In those years a great need of these engineers was foreseen to feed the demands of a spanning nuclear programme and an important academic level was achieved. The nuclear engineers made a very good performance in the different fields of work even if a crisis overcame as a consequence of the decline of nuclear power world-wide and in particular in Argentina.
101

IAEA-CN-100/3P
The preparation of the Master in Nuclear Reactors (MNR) began in 1996 with multisector meetings, where the necessities and perspectives of different actors of the nuclear area were discussed. This activity, performed at the Instituto de Estudios Nucleares of Ezeiza Atomic Centre (near Buenos Aires), culminated in 1998. In this year, in the frame of an agreement between the National Technological University and CNEA, the career was created in Buenos Aires faculty with an academic order which established the general frame and necessary contents.
The career arose as a response to different necessities: • The reactor projects undertaken in the area of Great Buenos Aires (Atucha I Npp, RA-3
reactor, RA-1 reactor), present a modest but unsatisfied demand of specialists. • The ageing of CNEA’s staff is producing a massive retirement of experts and an un-
bridged gap in many disciplines due to the lack of incorporation of young professionals. • The education in the Nuclear Engineering field has to be effectively shared with and
gradually transferred to the University. Until recently, human resources preparation in nuclear engineering disciplines has been almost monopolized by CNEA. Nowadays this is not only anachronic but also counter effective.
• The choice of a post-grade level is considered adequate because it allows the incorporation of a great variety of professionals in different areas of Engineering, Physics, Chemistry, etc, and provides the candidates with a more flexible profile, a very desirable feature when the nuclear activity is undergoing a transition period.
2. Contents The career is oriented to engineers or graduated in hard sciences. It begins in august every two years. The activity is full time for students with fellowships. Foreign students can attend with an IAEA fellowship and local ones with CNEA fellowships. Besides, a number of professionals, generally from CNEA, NASA or ARN, not specifically interested in the academic degree, attend particular courses according to their necessities. This heterogeneity has allowed the students a broader interaction with argentine nuclear community.
The academic plan comprises a specialization stage lasting one year and covered by five specific courses: Reactor Physics, Thermohydraulics, Instrumentation and Control, Radiation Protection and Safety, Fuel Cycle. The second year allows to complete the Master with a seminar: Nuclear Power Plants and a Thesis. The schedule is completed with a language examination (English) and some short seminars common to all Masters of the Technological University. The career provides the students a general knowledge about the technology of nuclear reactors and the principal disciplines involved. This allows their insertion in the professional field in any of the principal branches, either in basic studies or applied work.
The thesis is performed under the guidance of experts and aims to a deeper knowledge and an original contribution. The subjects are carefully examined in order to relate the academic activity with the resolution of actual problems of the professional activity. In the case of foreign students, additional care is taken so that the thesis subject fulfils the expectations of the institution of origin. The early participation of Argentina in the Nuclear Energy Field with two Nuclear Power Plants in operation an several experimental reactors, has produced an interesting number of senior specialists in many nuclear disciplines. This critical mass is an important support in generating thesis proposals.
3. The use of research reactors for education Since the very beginning, the performance of selected experiments in a nuclear reactor was recognized as an extraordinary tool to give the students an insight in the principal phenomena
102
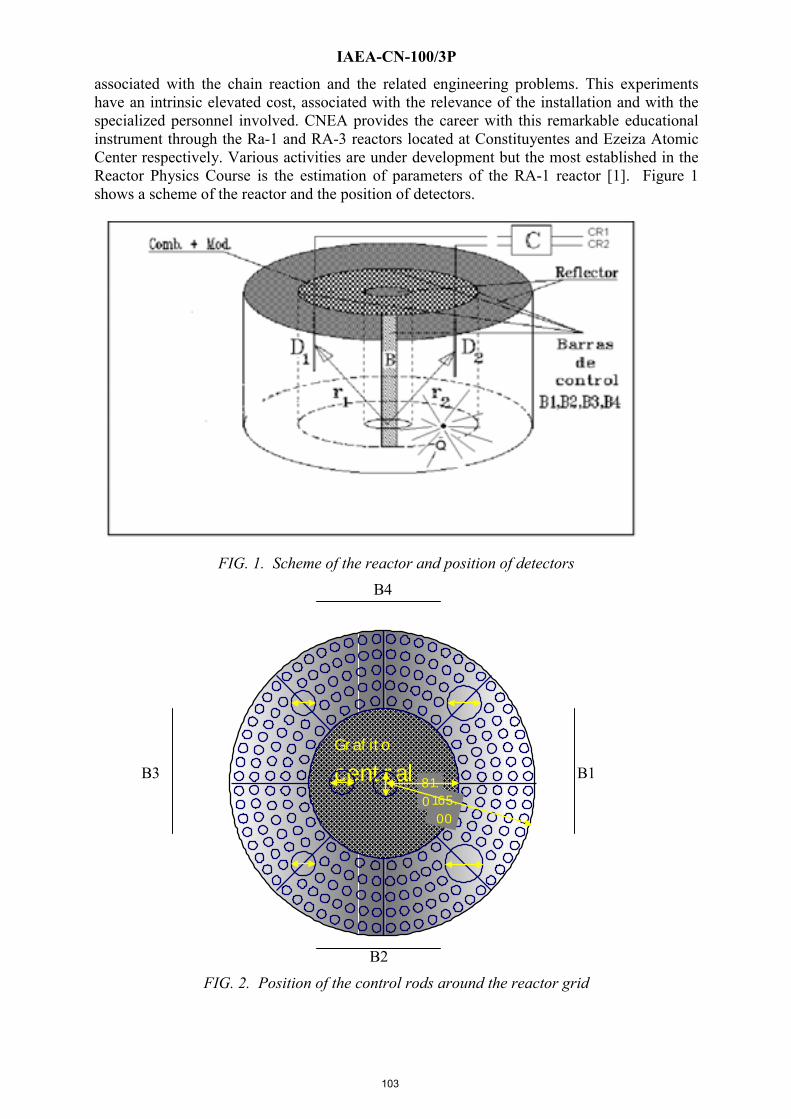
IAEA-CN-100/3P
associated with the chain reaction and the related engineering problems. This experiments have an intrinsic elevated cost, associated with the relevance of the installation and with the specialized personnel involved. CNEA provides the career with this remarkable educational instrument through the Ra-1 and RA-3 reactors located at Constituyentes and Ezeiza Atomic Center respectively. Various activities are under development but the most established in the Reactor Physics Course is the estimation of parameters of the RA-1 reactor [1]. Figure 1 shows a scheme of the reactor and the position of detectors.
FIG. 1. Scheme of the reactor and position of detectors
B4
B3 B1
B2
FIG. 2. Position of the control rods around the reactor grid
Grafito
central 81.00165.
00
103

IAEA-CN-100/3P
Figure 2 indicates the position of the control rods around the reactor grid. Figure 3 shows a representation of the system used for the rod drop measurements. Figure 4 shows the results obtained in an approach to critical experiment.
FIG. 3. System used for rod drop measurements
FIG. 4. results obtained in an approach to critical experiment
Rod drop ∆ tc < 1seg
t < t 0 ; $ = 0
CR
SDS
PC ADC
ICi
t = t 0
Ιj (t) =Sj φj (t)
Vi (t) φj (t)
BW =2Hz
RPM : $p(tk),$op,$od,$oi SMK : $om
Ιi (t) =εi F iq
=εi : chamber absolute efficiency (ICi) F: fission rate
iq : average charge per neutron detected
$(t) = $o R(t) $o : control rod worth
t ≥ t 0
104

IAEA-CN-100/3P
The practice includes three different experiments:
• Approach to critical and calibration of control rods by the compensation method. • Measurement of control rods effectivity by rod drop using the point reactor model. • Measurement of control rods effectivity by rod drop with spatial effects. The students participate in the practice in small groups and are required to inform and discuss the results.
4. Perspective and conclusion The objectives mentioned in the introduction and related with local necessities were the generators of this effort; but from the very beginning the MNR was viewed as an instrument of regional integration in the nuclear engineering field and specifically in nuclear reactors. This was another important argument in the definition of the post-graduate level. In fact, it allows professionals of different universities of the region to acquire a specialization in nuclear reactors in an environment of common objectives, common necessities and common language. We received and continue to receive a reduced number of students of other Latin American Countries. The IAEA sponsors the activity with some fellowships for foreign students but we aim to a broader support and multilateral agreements with countries of the region in order to transform the MNR in a regional undertaking.
REFERENCE [1] ANGEL GÓMEZ, “Cinética de Reactores”, CNEA,1997.
105

IAEA-CN-100/4P
Monte Carlo with Burn-up Calculation Method for Research Reactors F. Leszczynski Centro Atómico Bariloche (CNEA), S.C.de Bariloche, Argentina
Abstract. A method (MCQ) has been developed by introducing a microscopic burn up scheme which uses the Monte Carlo calculated fluxes and microscopic reaction rates as a basis for solving nuclide material balance equations for each spatial region of the particular nuclear device of interest. Energy dependent cross section libraries and full 3D geometry of the system can be input for the calculations. The resulting predictions at successive burn up time steps are thus based on a calculation route where both geometry and cross sections are accurately represented with continuous energy data, providing an independent approach for benchmarking other methods. The growing speed of computers will also allow the use of this method for solving complex problems related with utilization of research reactors. A description of the main characteristics of the method and preliminary tests and applications are included here.
1. Introduction In the last years, the use of Monte Carlo method become more popular for solving complex problems on many fields of nuclear industry and research. The characteristics of this method made almost impossible the introduction of burn-up schemes on applications related with depletion of nuclear fuel and other absorber, and fission product production and decay. The main problem is that the method is very computer time consuming. But computers are more and more fast each year. Then, the idea to coupling burn up with Monte Carlo codes naturally born with this development. Several method are to day for making such a couple from different laboratories in the world, but they are not freely available and contains different limitations.
A general method (MCQ) has been developed by introducing a microscopic burn up scheme which uses the Monte Carlo calculated fluxes and microscopic reaction rates of a complex system, as a basis for solving nuclide material balance equations for each spatial region in which the system is divided. Continuous Energy dependent cross section libraries and full 3D geometry of the system can be input for the calculations.
The resulting predictions for the system at successive burn up time steps are thus based on a calculation route where both geometry and cross sections are accurately represented with continuous energy data, providing an independent approach for benchmarking other methods. The growing speed of computers will also allow the use of this method for solving complex problems related with utilization of research reactors.
The main advantage of this method over the classical deterministic methods currently used is that MCQ System is a direct 3D method without the limitations and errors introduced on the homogenisation of geometry and condensation of energy of deterministic methods.
The objective is to achieve, on successive development steps, a method as exact as possible, introducing improvements on a continuous work. For this task, a full revision of nuclear data used and the development of acceleration techniques and selection of the best calculation scheme is needed.
In the present paper, a description of the main characteristics of the method and preliminary tests and applications are included.
106

IAEA-CN-100/4P
2. Method Basically, the method includes four tasks for each burn up step:
1) Monte Carlo calculation of the full system (criticality or fixed source options) tallying fluxes and nuclide reaction rates for each spatial region of interest integrated over energy;
2) Preparation of burn up code input and cross section libraries from Monte Carlo output, including normalized power density of each spatial zone (MCOR auxiliary program);
3) Burn up calculations of isotope concentrations on the input burn up time-step and option of output other results such as gamma sources of activated materials; and
4) Preparation of Monte Carlo input with the new isotope concentrations output of burn up code, including fuel and control rod changes between burn up steps (ORMC auxiliary program).
This sequence of calculations is implemented in an automatic way by means of a batch file for DOS version and a script file for UNIX version, including a predictor-corrector scheme. These files are automatically generated with other auxiliary program (MCQPRE). The Monte Carlo and burn up codes adopted until now are the widely used MCNP [1] and ORIGEN [2] codes, but the method is open to the use of other codes also. There are no limitations on the number of isotopes and materials, but a selection of the most important fission products and actinides has been made, to speed-up the calculations. Two methods have been developed for burn up calculations of nuclear reactors.
Method 1: direct calculations of full system with MC-ORIGEN codes with MCQ method (Fig.1).
FIG. 1. Diagram of Method 1
Method 2: two steps calculations, like classical cell-core method: step 1: MC-ORIGEN with MCQ for burn up calculations of typical fuel assemblies, storing the numerical densities of isotopes vs. burn up (MWd-ton) and, step 2: MC calculations with auxiliary program for retrieving numerical densities vs. burn up for each spatial region (Fig.2).
Method 1 is designed for burn up calculations of a full system on several time-steps, calling to the Monte Carlo program and ORIGEN code on each step, using auxiliary programs for preparation of input of each main code from output of previous calculation. MC main processed output is the updated integrated ORIGEN-cross section library, constructed by MCOR auxiliary program. ORIGEN main processed output is the new atomic densities after
107

IAEA-CN-100/4P
the step-burn up, used by ORMC auxiliary program for preparation of the new MC input and so on. Several files are needed on these steps for retrieving the codes of isotopes used on burn up and other needed information.
FIG. 2. Diagram of Method 2 Method 2 is a two-stages method, similar to the traditional calculations used in reactor design and fuel management. Stage 1 is dedicated to the preparation of constants (here atomic densities) in function of burn up, for typical fuel assemblies only. Stage 2 uses these constants for performing full system burn up with Monte Carlo program, where the main output is power density distribution in function of space. Special auxiliary programs are used on these process for management of the information. This method is faster than Method 1, because the detailed burn up calculation is made at fuel assembly level only, but there is a loss of accuracy.
3. Results The system MCQ is on its second stage of development. On the first stage, a simplified version has been tested with a set of burn-up dependent numerical benchmarks of MTR fuel assemblies using burnable poisons [3]. On the second stage, the main features improved are related with the management of fission products (quantity and quality of explicit included isotopes and nuclear data), the update of decay and fission yield data, and options for fuel management and control rod changes between steps. A series of experimental and numerical benchmark calculations are programmed for testing the system. Experimental benchmarks were made for LWR and HWR cases. Numerical benchmarks were made for a typical MTR fuel assembly with and without Cd wires. Model and preliminary tests are carried out for: RA3, RA6 (Argentina) and RECH01 (Chile) MTR fuel-type research reactors, all of them modelled for a lattice fuel assembly and for full reactor core and peripheral devices. The cases presented here are:
A. Experimental LWR-Burn-up Credit Criticality Benchmark (NEA). B. Experimental HWR-Burn-up Criticality Benchmark NPD. C. Numerical Benchmarks for MTR Fuel Assemblies with Burnable Poison. Applications-models (on going): D. MTR RA3/RA6 Reactors. E. MTR RECH1 Reactor.
108

IAEA-CN-100/4P Cases A [5] and B [6] were included because they are some of the few known experimental burn up cases for companions with calculation. Calculated concentrations of actinides an fission products for different burn up show good agreement with measured values. Case C [3] show good agreement on results when comparing MCQ with a well validated deterministic transport code (CONDOR). It is an example on the possible application of Method 2 described in Section 2 for normal MTR reactors. Case D is an application to main research reactors of Argentina: RA3 and RA6. Cases E [8] is one MTR type research reactor but with the particular design of fuel assemblies containing two peripheral plates with different enrichment than inner plates. Here fuel assembly and core were modelled.
A. Experimental LWR-Burn-up credit criticality benchmark (NEA). Facility: ATM-104 Approved Testing Material, Combustion Engineering (CE) 14x14 Assembly. Laboratory: Pacific Northwest Laboratory, Richland, Washington (USA). This benchmark compares the computed nuclide inventories for a simple pin cell calculation. The fuel and operating specifications are based on data given in the references for the Combustion Engineering (CE) 14 x 14 assembly designated as Approved Testing Material ATM-104, for a series of experiments designed to characterize spent fuel for light water reactors. The chemical assay data measured in these experiments are of particular value in validating the isotopic predictions used in burn up credit.
Experimental results: Isotopic concentrations (mg/g fuel) on the fuel pin for U-234, U-235, U-236, U-238, Pu-238, Pu-239, Pu-240, Pu-241,Pu-242, Np-237, Cs-133, Cs-135,Nd-143, Nd-145, Sm-149, Sm-150, Sm-152 and Eu-153, for 3 cumulative burn up: 27.35, 37.12 and 44.34 GWd/MTU.
Table 1. Benchmark A. General data
Cell radius (cm) 0.879346 Moderator H2O Moderator Density (g/cm3) 0.7569 Moderator Temperature (K) 558 Fuel material UO2
(3 at.% U235 enr.) Density of fuel material (g/cm3) 10.045 Effective fuel Temperature (K) 841 Radius of fuel rods (cm) 0.47815 Clad material Zry-2 Density of clad material (g/cm3) 6.55 Internal radius of clad (cm) 0.493 Thickness of clad (cm) 0.066 Clad Temperature (K) 620 Cycle 1 avg boron concentration (ppm) 331
Table 2. Benchmark A. Operating history data for isotopic calculation
OPERATING CYCLE BURN
days DOWN
days BORON % cycle 1
1 306.0 71.0 100.0 2 381.7 83.1 141.9 3 466.0 85.0 152.3 4 461.1 1870.0 148.8
BURN is the fuel irradiation time DOWN is the downtime between cycles except for cycle 4 where it includes the decay time from
reactor to measurement (cooling time) BORON is the cycle-average boron concentration as a percent of the cycle 1 concentration.
109

IAEA-CN-100/4P
Table 3. Benchmark A. Specific power
OPERATING CYCLE Specific Power Kw/kgU
Sample 1 Sample 2 Sample 3 1 17.24 24.72 31.12 2 19.43 26.76 32.51 3 17.04 22.84 26.20 4 14.57 18.87 22.12
Cumulative Burn-up
GWd/MTU
27.35
37.12
44.34
Table 4. Benchmark A. Initial fuel number densities
Nuclide Number Density
Ats./(cmx1024) U-234 6.15165E-06 U-235 6.89220E-04 U-236 3.16265E-06 U-238 2.17104E-02 C-12 9.13357E-06 N-14 1.04072E-05
O 4.48178E-02
Table 5. Benchmark A. Cycle 1 coolant number densities
Nuclide Number Density Ats./(cmx1024)
H-1 5.06153E-02 O-16 2.53076E-02 B-10 2.75612E-06 B-11 1.11890E-05
Results for Sample 3: ACTINIDES SIMBOL EXP CALC EXP/EXPu5 CALC/CALCu5 U234 1.600E-01 1.520E-01 0.02 0.02 U235 8.470E+00 7.732E+00 1.00 1.00 U236 3.140E+00 3.243E+00 0.37 0.42 U238 8.425E+02 8.383E+02 99.47 108.42 NP237 2.680E-01 2.268E-01 0.03 0.03 PU238 1.012E-01 4.365E-02 0.01 0.01 PU239 4.264E+00 4.394E+00 0.50 0.57 PU240 1.719E+00 1.570E+00 0.20 0.20 PU241 6.812E-01 6.147E-01 0.08 0.08 PU242 2.886E-01 2.212E-01 0.03 0.03
110

IAEA-CN-100/4P
FISSION PRODUCTS SIMBOL EXP CALC EXP/EXPu5 CALC/CALCu5 CS133 8.500E-01 7.737E-01 0.10 0.10 CS135 3.600E-01 3.765E-01 0.04 0.05 ND143 6.130E-01 5.756E-01 0.07 0.07 ND145 5.100E-01 4.746E-01 0.06 0.06 SM149 2.900E-03 1.981E-03- 0.00 0.00 SM150 2.070E-01 2.154E-01 0.02 0.03 SM152 8.700E-02 8.080E-02 0.01 0.01 EU153 7.900E-02 7.258E-02 0.01 0.01 B. Experimental HWR-Burn-up criticality benchmark NPD. D2O-moderated uranium oxide lattices. Analysis of Isotopic Composition as function of burn-up. Laboratory: AECL Atomic Energy of Canada Limited (Canada) Facility: NPD Nuclear Power Demonstration reactor. NPD is a Canadian demonstration PHWR (25 MW electrical power) shut down on 1987. The moderator and coolant were heavy water. The fuel was in the form of 19 natural UO2 rod CANDU type clusters.
Analysis of Isotopic Composition for 19-rod Fuel cluster: Isotopic measurements of irradiated 19 element fuel bundles have been done in 1971 at the CEA in France. The measurements included a series of eight bundles with irradiation in the range 1000-10000 MWd/TU which were analysed by mass-spectroscopy.
Experimental results: Isotopic concentration ratios for the fuel pins of each ring and bundle average for N235/N238, N236/N238, N239/N238, N240/N239, N241/N239 and N242/N239 for 8 burn-up steps ranged from 1000 to 10000 MWD/T.
FIG. 3. Benchmark B. Geometry
111

IAEA-CN-100/4P
Table 6. Benchmark B. General data
Pitch (cm) 26.035 (square) Coolants D2O Moderator D2O Number of rods 19 (1/6/12) Radius of rod centers (cm) 0.0/1.65/3.18755 Angular dist.from reference axis (radians) 0.0/0.0/0.2617994 Fuel material UO2-nat Density of fuel material (g/cm2) 10.0704 Radius of fuel rods (cm) 0.71247 Sheath material Zry-2 Density of sheath material (g/cm2) 6.57 Internal radius of sheath (cm) 0.71505 Thickness of sheath (cm) 0.04191 Material of pressure tube Zry-2 Density of pressure Tube (g/cm2) 6.556 Internal radius of pressure tube (cm) 4.1402 Thickness of pressure tube (cm) 0.4318 Material of calandria tube 57S Al alloy Density of calandria Tube (g/cm2) 2.68 Internal radius of calandria tube (cm) 5.08 Thickness of calandria tube (cm) 0.12827 Effective fuel Temperature (K) 778.2 Effective coolant Temperature (K) 531.7 Temperature of moderator (K) 311.0 Experimental buckling (cm2) 0.000173
Results:
RING 1 BUP N25/N28 N26/N28 N49/N28 N40/N49 N41/N49 N42/N49 EXP 9100 0.2260 0.0760 0.2560 38.6000 6.8500 1.7600 MCO 9100 0.2199 0.0762 0.2579 37.7588 6.9193 1.7254 DMCO -2.72 0.28 0.76 -2.18 1.01 -1.96 EXP 10800 0.1740 0.0820 0.2640 47.3000 8.8400 3.0600 MCO 10800 0.1734 0.0831 0.2673 44.8865 8.7330 2.6759 DMCO -0.32 1.39 1.25 -5.10 -1.21 -12.55 RING 2 BUP N25/N28 N26/N28 N49/N28 N40/N49 N41/N49 N42/N49 EXP 9100 0.2030 0.0790 0.2520 41.5000 7.7100 2.3300 MCO 9100 0.1951 0.0797 0.2606 40.7383 7.6113 2.1202 DMCO -3.91 0.88 3.40 -1.84 -1.28 -9.00 EXP 10800 0.1560 0.0870 0.2610 49.3000 9.4200 3.5100 MCO 10800 0.1507 0.0862 0.2692 47.8925 9.4801 3.2749 DMCO -3.39 -0.96 3.15 -2.86 0.64 -6.70 RING 3 BUP N25/N28 N26/N28 N49/N28 N40/N49 N41/N49 N42/N49 EXP 9100 0.1430 0.0880 0.2650 47.8000 10.2300 3.9000 MCO 9100 0.1357 0.0877 0.2730 47.6065 10.2611 3.7518 DMCO -5.14 -0.38 3.03 -0.40 0.30 -3.80 EXP 10800 0.1010 0.0910 0.2710 56.1000 12.1200 6.0500 MCO 10800 0.0973 0.0930 0.2794 55.2105 12.3721 5.7178 DMCO -3.71 2.19 3.10 -1.59 2.08 -5.49
112

IAEA-CN-100/4P AVERAGE VALUES BUP N25/N28 N26/N28 N49/N28 N40/N49 N41/N49 N42/N49 EXP 9100 0.1660 0.0850 0.2610 45.4000 9.2600 3.3100 MCO 9100 0.1588 0.0845 0.2683 44.9193 9.2485 3.1299 DMCO -4.31 -0.53 2.80 -1.06 -0.12 -5.44 EXP 10800 0.1220 0.0890 0.2670 53.6000 11.1400 5.1100 MCO 10800 0.1181 0.0903 0.2755 52.3562 11.2673 4.7863 DMCO -3.16 1.48 3.20 -2.32 1.14 -6.34
C. Numerical benchmarks for MTR fuel assemblies with burnable poison [3] A set of numerical benchmarks for MTR Fuel Assemblies uses Cd wires as burnable poisons. Two different systems are defined:
- a fuel plate (FP) with different Cd wire diameter, and - a fuel assembly (FA) with different number of Cd wires.
The main calculated parameter is the infinite multiplication factor, but for specific cases the Cd and U235 numerical densities were also compared.
Two different calculation codes were used: MCQ and CONDOR. The code CONDOR[4] was validated against different experimental benchmarks. This code has the capability to calculate FA (with fuel rods or plates) with full geometrical detail (without homogenisation). A two dimensional Heterogeneous Response Method with angular dependent coupling current is used to calculate the neutron flux.
Benchmark description Fuel Plate: A simplified U3Si2 MTR FA type is used for these benchmark. The main geometrical and material data is given in the Table A.I and Figure A.1. The specific power used for burning is 500 MW/Tn. Different Cd wires diameter were used: None, 0.04, 0.05 and 0.06 cm. Partial results made with an improved MCQ model are presented here.
Fuel Assembly: The FA is a set of 21 Fuel Plates. The external dimensions for the whole FA are 8.1 cm * 8.1 cm. Different number of Cd 0.05 cm wires were used: None, 42, 22 and 14. The geometrical model of the Fuel Assembly with 14 Cd wires is shown in Figure A.2. Preliminary results of these cases are included in [3]. New results with improved model will be presented on a next paper.
Table 7. Benchmark C. Geometrical and material data
Zone Thickness (cm) Width (cm) Material Meat 0.061 3.2 U235 2.435E-03 at/cm-barn
U238 9.740E-03 at/cm-barn Al 2.974E-02 at/cm-barn Si 8.10E-03 at/cm-barn
Plate 0.135 3.5 Density: 2.7 g/cm3 100%Al Coolant 0.380 3.5 Density 0.99837
11.191% H & 88.809% O Frame 0.380 0.5 Density: 2.7 g/cm3 100%Al Water
gap 0.380 0.05 Density 0.99837
11.191% H & 88.809% O Cd wire Center x=3.75 Diameter
Variable Cd113 5.640E-03 at/cm-barn
113

IAEA-CN-100/4P
FIG. 4. Benchmark C. Geometrical model of the Fuel Plate
FIG. 5. Benchmark C. Geometrical model of the Fuel Assembly with 14 Cd wires
Benchmark results Figure 6 shows some of the main results obtained from this benchmark.
1.400E-09
1.000E-03
2.000E-03
3.000E-03
4.000E-03
5.000E-03
0 5000 10000 15000 20000 25000 30000 35000 40000 45000 50000
Burnup [MWd/Tn]
Nd-
Cd
R4C R3C R2C R1C AvgC
R4M R3M R2M R1M AvgM
FIG. 6. Benchmark C. Cd113 numerical densities for FP05 fuel plate.
D. MTR RA3/RA6 reactors A full core model has been made for Monte Carlo code of these two reactors to be used with the MCQ system. The following figures show details of fuel assembly and part of RA3 core.
114

IAEA-CN-100/4P
E. MTR RECH1 reactor A full core model has been made for Monte Carlo code of this reactor to be used with the MCQ system. The following figures show details of fuel assembly and part of the core, including irradiation facilities.
This model has been selected for future applications of it in the frame of ARCAL-Project [7].
115

IAEA-CN-100/4P
3. Conclusions A new method for burn up calculations to be applied on design and safety studies of research reactors has been developed. The main characteristics of the method are its details on geometry, energy and cross sections data. The method uses Monte Carlo techniques and detailed depletion equations to be solved on one step by step process adapted to the features of each system of application. Results of preliminary benchmark calculations show a good agreement with experimental measurements and with other computational methods. The growing speed of computers will allow the use of this method for solving complex problems related with utilization of research reactors.
REFERENCES [1] BRIESMEISTER, J.F. (ed.), MCNP- A General Monte Carlo N-Particle Transport Code,
Version 4B, LA-12625-M (1993). [2] CROFF, A.G., ORIGEN2: A versatile Computer Code for Calculating the Nuclide
Compositions and characteristics of nuclear materials, Nuclear Technology, Vol.62, P.335, Sept.1983.
[3] VILLARINO, E.A., LESZCZYNSKI, F. Numerical Benchmarks for MTR Fuel Assemblies with Burnable Poison, Proc.IGORR 9,24-28 March 2003, Sydney, Australia.
[4] VILLARINO, E.A., “CONDOR Calculation Package”, Physor 2002, "International Conference on the New Frontiers of Nuclear Technology : Reactor Physics, Safety and High-performance Computing.
[5] NUCLEAR ENERGY AGENCY, Burn-up Credit Criticality Benchmark, Isotopic Composition Prediction, NEA/NSC/DOC(92)/10; NEA 1401/02, 1992.
[6] a. DURET, M.F. et. al., Plutonium Production in NPD. A Comparison Between Experiment and Calculation, AECL-3995, 1971.
b. INTERNATIONAL ATOMIC ENERGY AGENCY, In-core fuel management benchmarks for PHWRs, IAEA-TECDOC-887, Task 9.3,Pag.122-127, 1996.
[7] ARCAL LXVIII-Proyecto RLA/9/046, Mejoramiento de la Seguridad de Reactores de Investigacion, Dic.2002.
116

IAEA-CN-100/11P
A CNS Calculation Line Based on a Monte-Carlo Method C. Lecot, D.F. Hergenreder, O. Lovotti INVAP S.E., Nuclear Projects Department, Nuclear Engineering Division, S.C. de Bariloche, Argentina
Abstract. The neutronic design of the moderator cell of a Cold Neutron Source (CNS) involves many different considerations regarding geometry, location, and materials. The decisions taken in this sense affect not only the neutron flux in the source neighbourhood, which can be evaluated by a standard deterministic method, but also the neutron flux values in experimental positions far away from the neutron source. At long distances from the CNS, very time consuming 3D deterministic methods or Monte Carlo transport methods are necessary in order to get accurate figures of standard and typical magnitudes such as average neutron flux, neutron current, angular flux, and luminosity. The Monte Carlo method is a unique and powerful tool to calculate the transport of neutrons and photons. Its use in a bootstrap scheme appears to be an appropriate solution for this type of systems. The use of MCNP as the main neutronic design tool leads to a fast and reliable method to perform calculations in a relatively short time with low statistical errors, if the proper scheme is applied. The design goal is to evaluate the performance of the CNS, its beam tubes and neutron guides, at specific experimental locations in the reactor hall and in the neutron or experimental hall. In this work, the calculation methodology used to design a CNS and its associated Neutron Beam Transport Systems (NBTS), based on the use of the MCNP code, is presented.
1 Introduction The neutronic design of a Cold Neutron Source (CNS), and its associated neutron beams and neutron guides, includes the evaluation of specific magnitudes in locations such as the Reactor Face, the Neutron Guide Entrance, Experimental Breaks, etc. This condition implies the calculation of neutron and gamma fluxes both close to the location of the CNS and far from it. It was observed that changes in a design variable (e.g. moderator vessel diameter) could produce an increase in the neutron flux at a location while producing a decrease in some other location. E.g. an increase at the source or at the neutron guide entrance, and a decrease at the end of the neutron guide. This is due to spectral changes. As the expected change in the magnitudes could be small, to take in account this kind of effects, the neutrons transport must be calculated from the core to the CNS itself in first instance, and through the beam tubes and the neutron guides later.
The use of deterministic transport methods that consider not only detailed geometry but also spectral effects is very difficult for the specific case of the design of a CNS, under the considerations mentioned in previous paragraphs. The increase in the calculation capability of new computers makes it possible to use the Monte Carlo method during the design stage, something prohibitive not so long ago. The Monte Carlo method used in a bootstrap scheme appears to be an appropriate solution for this type of problem, the design of a CNS. The well-known MCNP code [1] is the tool used to simulate the creation of neutrons in the core conditions, their moderation in the reflector and neutron sources and their transport to the guide entrance through the beam tube. From the guide entrance to the experimental location the neutrons are transported through the neutron guide (typically a super mirror). The calculation of the transport in the neutron guides is carried out using the Monte Carlo method also, taking into account the reflective properties as a function of neutron energy, and a full description of the geometrical conditions such as dimensions, curvature radii and misalignment and waviness effects.
117

IAEA-CN-100/11P
2 Description of the calculation line Through the utilization of the MCNP code, detailed description of the core geometry and cross sections can be produced. However, two main drawbacks must be solved to have a complete definition of the model. First of all, the code cannot perform burnup calculations, which implies considering the uranium consumption and distribution through another mean. Second, the code takes into account prompt radiation only. Effects such as 28Al beta and gamma decay, and fission product decay, important in energy deposition assessments, must be considered through modifications of MCNP standard cross section sets.
FIG. 1. CNS Calculation Line
In the scheme of Fig. 1, the complete calculation line is shown. At the left side is the scheme of the core calculation line (CCL), where the core burn-up and control rod position is obtained, with a detailed description of the isotopic variation of the fuel. At the right side of Fig. 1, the CNS calculation line (CNS CL), MCNP being the main code and with some other programs necessary to have a complete description of the model to the end of the neutron guides.
2.1 Core calculation line The core calculation is performed in several steps and using different validated codes. The
118

IAEA-CN-100/11P
CCL is divided in three different methodologies: calculations with Macroscopic Cross Sections, calculations with Microscopic Cross Sections, and Monte Carlo calculations. Each of them has different goals. The CNS CL is based on macroscopic cross sections calculations. This methodology is used for the assessment of almost all the neutronic parameters: being among the most important the equilibrium core burn-up distribution and the control rod positioning. The CCL is divided in 3 steps: (1) library generation, (2) cell calculation, and (3) core calculation. These steps and their interfaces are shown in Fig. 1, which shows several codes. A short description of the most relevant items is given in the following section.
Nuclear data library. Two different primary data are used to generate ESIN type libraries: WIMS-ESIN. This results from the 69 groups WIMS library, which has good thermal detail as well as resonant parameters [2]. Several isotopes have been added from the ENDF/B-IV library mainly for control absorber material isotopes. A new set of isotopes was added from the ENDF/B-VI, namely Ir and Te, using the NJOY system [3]. HELIOS-ESIN. HELIOS library [4] primary data was obtained from the ENDF/B-VI library, with three different group structures: 190, 89 and 34 groups. CONDOR. The CONDOR code [5] for neutronic calculations is used to calculate fuel cells, fuel-rod clusters, as well as fuel plates with slab geometry or 2D geometry. Flux distribution within the region of interest is obtained through the collision probability method or the Heterogeneous Response Method in a multi-group scheme with various types of boundary conditions. HXS. The HXS program [6] (Cross section handler) represents a major utility. It handles macroscopic cross-sections (identified by a name) in library form. CITVAP. The CITVAP reactor calculation code [7] is a new version of the CITATION-II code [8], developed by INVAP's Nuclear Engineering Division. The code was developed to improve CITATION-II performance. In addition, programming modifications were performed for its implementation on personal computers. The code solves 1, 2 or 3-dimensional multi-group diffusion equations in different geometries. Spatial discretization can also be achieved with triangular or hexagonal meshes. Nuclear data can be provided as microscopic or macroscopic cross section libraries.
UTILITIES. A short description of the main utilities is given: ESINLM [9] is an administrative program to handle ESIN type nuclear data libraries. NDDUMP [10] uses the CITVAP "state file" and CONDOR "restart file" to generate information on the burn-up dependent materials to be used in MCNP code. CNV_SV [11] is an administrative program to handle CITVAP "state file".
2.2 CNS calculation line This section of the calculation line is based on the MCNP code and its powerful features: detailed geometry modelling capabilities and reliable and updated cross section libraries.
Nuclear data library. Since version 4C, the recommended cross section sets are based on: ENDF/B-VI data. Additional data originated in other sources, JENDL for instance, is also included in the MCNP libraries via the use of the NJOY code system [3]. ACESMOD [12] is a dedicated program that performs modifications of any ACES-type library [13]. With this utility program some standard MCNP cross section sets were modified in order to have a better estimation of the energy deposition. The modified sets were: (a) cross section set of the fissile isotopes (mainly 235U). During the reactor operation, the Fission
Product Delayed Gamma (FPDG) source reaches an almost asymptotic value in a relatively short time. But this source is not uniform: the higher the fission rate, the higher the number of FPDG emitted. To cope with this fact, the FPDG information was included, i.e., the spectrum and the number of photons per fission (this methodology was previously used in, for example, ref. [14]).
(b) cross section set of the 27Al. When aluminium is used in a CNS as structural material, part of the energy deposited is due to beta particles emitted by 28Al. Following the beta decay of 28Al a gamma ray is emitted. In order to take into account this additional energy deposited in the CNS, a
119

IAEA-CN-100/11P modification to the recommended aluminium cross section set is done in order to include the emission of the mentioned photon after a capture reaction. Because the 28Al beta decay has a half-life time of 2.25 min, in normal operation the 28Al decay rate reaches the equilibrium and is present not only in the CNS but also in any other aluminium component, mainly in the fuel elements.
NG TRANSPORT: Monte Carlo calculations are performed to model the neutron guide (NG) system. The calculation provides the neutron flux at instrument positions, neutron spectra, the horizontal and vertical flux profiles and divergence profiles. Construction and assembling misalignments of the guide elements are also modelled. Three types of deviations are modelled:
(a) discrepancy of the position in both directions (horizontal and vertical), discrepancy in the angle from the ideal direction (horizontal and vertical).
(b) waviness: an extra angle is added to the reflected directions calculated from a two-dimensional sine curve with prescribed wavelength and amplitude, which is determined at each reflection point.
(c) imperfection of the reflectivity.
2.3 Overall methodology The MCNP model includes comprehensive information on details of the core and devices around it. Typical burn-up distribution (radial and axial), burnable poisons, enrichment distribution and critical control rod positions are obtained from the CCL through the use of the NDDUMP program, which is the tool to feed the MCNP model with core data. The detailed description reaches the surroundings of the core where the irradiation facilities, neutron sources and neutron beams are located. Typically this region has Beryllium or heavy water as reflecting material and is contained in the concrete reactor block or the light water tank. Criticality calculations are used by the MCNP to simulate the neutrons generation from fission in the critical core. A Surface Source is modelled to include the region of interest, i.e., the cold neutron source and its associated beam tubes. A high number of neutrons are created by the KCODE source and only those that arrive at the involved region are recorded in the surface source. This methodology, namely the use of a surface source, is adequate while there are no modifications in the operation or geometrical conditions outside the involved region, especially in the path from the core to this region. In the involved region it is possible to make changes, except in the region near the boundary of the surface source.
The design is carried out using the surface source as a neutron source and the particles that arrive at the guide entrance are registered in a ptrack file using the PTRAC card. At this point, the particles recorded in the ptrack file allow calculating the transport through the neutron guide. The calculation of the transport through the neutron guides is carried out using the Monte Carlo implicit transport method. It means the particles that have been scattered in the plates of the neutron guide, with an angle for which the reflectivity of the plate is greater than zero, will arrive at the end of the guide. The weight of these particles will be reduced according to the reflectivity for each collision. The Monte Carlo analogue transport method is also available, but it requires a higher number of particles to obtain the same statistical errors.
The neutron guide transport program allows us to take into account the reflective properties of the neutron guide as a function of the neutron energy, and each plate of the neutron guide could have different reflective properties. The geometrical flexibility admits a comprehensive description of the geometrical conditions such as dimensions, curvature radii and random misalignment effects. It is possible to analyze the particle distribution at different positions of the neutron guide and to make an energy, angle or weight spectrum. Another ptrack file is created with the particles that arrive at the end of guide, allowing the calculation of another neutron guide transport if it were necessary.
The main hardware requirements are the calculation and data storage capacity. Typically, the size of a surface source is 1 GB and the size of a ptrack file is 500 MB.
120

IAEA-CN-100/11P
3 Conclusions The calculation methodology presented in this work, based on a Monte Carlo code as the main tool to calculate the neutron transport, allows a detailed description of the reactor conditions and geometrical characteristics inside and outside the core. The calculation of the transport through the neutron guides using also the Monte Carlo technique allows to continue the calculation with a comprehensive description of the NG elements conditions. The results obtained at the location of experiments have low statistical error and allows determining the behaviour of the neutron flux as a function of each design variable [15]. Due to the capability of the calculation methodology to make a detailed description of the reactor and the CNS, it is possible to analyze, simultaneously, the effects of the design variables on different parameters such as the core reactivity and the neutron fluxes required by the facilities placed around the core.
REFERENCES [1] BRIESMEISTER, J.F., Ed., MCNP - A General Monte Carlo N-Particle Transport
Code, Version 4C, LA13709-M, Los Alamos National Laboratory (April 2000). [2] DIN/GN/001-96. Improvements of the WIMS library from ENDF/B-IV. [3] MACFARLANE, R.E. et al. (1991) NJOY91.13, A Code System for Producing.
Pointwise and Multigroup Neutron and Photon Cross Sections from ENDF/B. Evaluated Nuclear Data, Radiation Shielding Information Centre Peripheral Shielding Routine Collection, PSR-171, Oak Ridge National Laboratory.
[4] FERRI, A.A., FREDIN, B., GIUST, F.D., JONSSON, A., SKARDHAMAR, T., STAMMLER, R.J.J., Helios Methods, Chapter IX: The library.. Studsvik Scandpower, December 1997.
[5] CONDOR v2.5. User Manual. August 2000. [6] MTR_PC v2.6 system. User manual. July 1995. [7] CITVAP v3.1 Improved version of CITATION II - Subgerencia de sistemas - INVAP SE.
MTR_PC v2.6 system: User manual. July 1995. [8] CITATION a Nuclear Reactor Core Analysis Code - T.B.FOWLER, D.R.VONDY and
G.W.CUNNINGAM. ORNL-TM-2496 1972. [9] DIN/GN/001-98, “Programa para el manejo de Bibliotecas tipo ESIN: ESINLM y
ESINPLOT”. [10] DIN/GN/005-2000, “NDDUMP: Desarrollo de interfaces CONDOR-CITVAP-MCNP”. [11] DIN/GN/004-2000, “Programa CNV_SV”. [12] LESZCZYNSKI, F., ACESMOD program, Internal Report, Centro Atómico Bariloche,
CNEA. First version: June 2001 [13] “MCNPDATA: Standard Neutron, Photon and Electron data Libraries for MCNP 4C”,
DLC-200, RSICC Data Library Collection, Oak Ridge National Laboratory, Oak Ridge, Tennessee (July 2000).
[14] WILLIAMS, R.E., KOPETKA, P., ROWE, J.M., An Advanced Liquid Hydrogen Cold Source for the NIST Research Reactor, 7th Meeting of the International Group on Research Reactors, IGORR-7, Bariloche, Patagonia, Argentina, October 26-29, 1999.
[15] HERGENREDER, D.F., LECOT, C.A., LOVOTTI, O P., “Neutronic Design of a Cold Neutron Source with MCNP”, INVAP S.E., International Conference on Research Reactor (Utilization, Safety, Decommissioning, Fuel and Waste Management), Santiago de Chile, Chile, from 10 to 14 November 2003.
121

IAEA-CN-100/13P
MCNP Design of High Performance NTD Facilities D.F. Hergenreder, E.A. Villarino INVAP S.E., Nuclear Projects Department, Nuclear Engineering Division, S.C. de Bariloche, Argentina
Abstract. The commercial requirements of NTD services with very high uniformity in very large irradiation volume lead to the design of high performance NTD Facilities. The NTD facility design requires a powerful tool to transport neutrons with a full description of geometrical and operational conditions that MCNP code fulfils [1]. The increase of the calculation capacity of new computers makes it possible to use the Monte Carlo technique during the detailed design stage. A calculation methodology that permits the design of a NTD facility with high axial uniformity in a relatively short calculation time is presented. This paper covers different aspects of the neutronic design of a Neutron Transmutation Doping (NTD) facility: the calculation methodology, the single crystal cross section generation and the design of a flux-flattener device.
1. Introduction The commercial requirements of Neutron Transmutation Doping services with very high uniformity in very large irradiation volume lead to the design of high performance NTD Facilities. A high performance NTD facility should fulfil the following requirements:
• high axial and radial uniformity in large Silicon target volume. • low thermal neutron flux perturbation during the operation cycle. • low thermal neutron flux perturbation due to the operation of the facilities placed close to
the NTD facility. • high thermal to fast neutron flux ratio. The conception of a high axial uniformity NTD facility is focused in the design of the flux-flattener device and the top and bottom plugs. The radial uniformity is obtained placing the NTD facility where there is not a high gradient of thermal neutron flux and it is improved with the rotation movement of the Silicon Target.
2. MCNP calculation model With MCNP it is possible to make a full description of the operation conditions and geometrical characteristics in three dimensions. The MCNP model includes full details of the core such as: typical burn-up distribution (radial and axial), burnable poisons, enrichment distribution and critical control rod positions. The full detail description extends to the surroundings of the core where the irradiation facilities, neutron sources, neutron beams and NTD facilities are located. The NTD description includes the Silicon single crystal target, its can, the rotator device, the flux-flattener device and the top and the bottom plugs.
Criticality calculations are used by the MCNP to generate neutrons from fission in the critical core. A surface source is created to include the interest region, i.e., the NTD facility and moderator region close to that facility. A high number of neutrons are created by the KCODE source and only those that arrive at the region involved are recorded in the surface source. The technique of using a surface source is adequate while there are no modifications in operation or geometrical conditions outside the region involved, especially in the path from the core to this region. In the region involved it is possible to make changes, except in the region near the boundary of the surface source.
122

IAEA-CN-100/13P
The design is carried out using the surface source as a neutron source. Each particle coming from the surface source is initialized several times (typically 10 to 20 times) with its appropriate weight normalization. The source particles have collisions in the moderator region close to the NTD facility and quickly each particle that was born from a same neutron recorded in the surface source go over a different path, becoming in a different history. The advantage of this technique is that it is possible to obtain neutron flux information with a very low statistical error (lower than 1%) in a short calculation time. To illustrate this advantage, the calculation time spent using the surface source as neutron source and starting each source particle 20 times vary from 1% to 2.5% of the time spent to record the surface source. This variation depends on the size of the facility and the intensity of the neutron flux.
FIG. 1. Schematic view of a NTD irradiation facility.
123

IAEA-CN-100/13P
After several modifications of the NTD design parameters a new surface source is recorded to obtain a feedback on the neutron population of the surface source due to the NTD changes. During the feedback process, it is found differences of about 1 to 5% in the axial profile, especially when large regions of neutron absorber are introduced or removed. The main hardware requirements are the calculation and data storage capacity. Typically, the size of a surface source is 1 or 1.8 GB. Figure 1 shows a typical NTD irradiation facility.
3. Silicon single crystal cross section
The scattering and total cross sections were calculated in the range from 0.0001 to 10 eV with the code CRIPO [2]. The calculated values of scattering cross sections for single crystal Silicon at 296°K was compared with the experimental values obtained from [3]. The scattering cross sections values calculated by the code CRIPO are for energy greater than 10-10 MeV. Due to MCNP cross sections extend to 10-11 MeV the single crystal scattering cross section was considered constant in the range 10-11 to 10-10 MeV. This consideration does not produce a relevant effect because the very low neutron energies involved. The MCNP total cross section is obtained adding the absorption and the scattering cross sections. The modification of the scattering and total Silicon polycrystalline cross sections with the data of single crystal cross sections obtained from CRIPO calculation in the range 10-11 to 2 10-6 MeV leads to the MCNP Silicon single crystal cross sections. The principal effect of the change of polycrystalline Silicon cross section by the Silicon single crystal cross section is made in the scattering cross section at low energy. Consequently this effect is produced also in the total cross section. Figure 2 shows the MCNP scattering cross sections for both polycrystalline and single crystal Silicon. Also they are presented the experimental values for the single crystal Silicon.
0.1
1.0
10.0
1.E-10 1.E-09 1.E-08 1.E-07 1.E-06 1.E-05Energy [ MeV ]
Sca
tterin
g C
ross
Sec
tion
[Bar
n]
PolycrystallineSingle CrystalExperimental Data
FIG. 2. MCNP scattering cross section at low energy.
4. Results The main tool to obtain a high axial uniformity of the thermal neutron flux in large volume NTD facility is the flux-flattener device. The flux-flattener is a cylinder made using a combination of regions with aluminium, stainless steel and nitrogen or void regions. The
124

IAEA-CN-100/13P
stainless steel is more thermal neutron absorber than the aluminium and it is used to reduce the thermal neutron flux. In the regions where there is a higher neutron flux, the thickness of the stainless steel is greater. Another important tool used to obtain a high axial uniformity of the thermal neutron flux are the reflector plugs. At both target extremes (top and bottom) a reflector plug is placed in order to improve the thermal neutron flux and the radial uniformity in the extremes of the Silicon target. Along the target volume, the radial uniformity is obtained with the non-stop rotation of the Silicon target. The low thermal flux perturbation during the operation cycle is obtained with a compact core design, an adequate fuel management strategy and a defined control rod movement during the operation cycle. Figure 3 shows the thermal neutron flux in a NTD facility with a Silicon target of about 8 inches diameter and 60 cm of length.
0.97
0.98
0.99
1.00
1.01
1.02
1.03
0 4 8 12 16 20 24 28 32 36 40 44 48 52 56 60Silicon Target Region [cm]
Ther
mal
Neu
tron
Flu
x [N
orm
aliz
ed V
alue
]
Thermal Neutron Flux
FIG. 3. Thermal neutron flux in a NTD facility with a silicon target of about 8 inches
diameter and 60 cm of length.
The target design is to obtain a thermal neutron flux profile with a non-uniformity lower than 3%, but the result show a non-uniformity lower than 1%.
5. Conclusions It is possible to use the Monte Carlo method to design high performance NTD Facilities. With the use of the surface source it is possible to obtain thermal neutron distribution with a statistical error lower than 1% in a short calculation time. The flux-flattener device made of Aluminium, Stainless Steel and Nitrogen or void regions permit to obtain a very high axial uniformity in large volume NTD facilities.
REFERENCES [1] BRIESMEISTER, J.F., Ed., MCNP - A General Monte Carlo N-Particle Transport Code,
Version 4C, LA13709-M, Los Alamos National Laboratory (April 2000).
[2] KROPFF, F., GRANADA, J.R., Unpublished Report (Centro Atómico Bariloche, Argentina, 1976).
[3] BRUGGER, R.M. et al., Ac3 1979 Knoxville Conference.
125

IAEA-CN-100/16P
ANSTO RRR Simulator for Operating Personnel Training A. Etcheparebordaa, C.A. Flurya, F. Lemab, F. Maciela, N. De Lorenzod, R. Cervierid, D. Alegrechia, G. Ibarraa, M. Muguiroa, M. Giménezc, M. Schlampc, A.Vertulloc aGrupo Control de Procesos, Centro Atómico Bariloche, Comisión Nacional de Energía Atómica bInstituto Balseiro, Comisión Nacional de Energía Atómica, cGrupo Seguridad, Centro Atómico Bariloche, Comisión Nacional de Energía Atómica dILS Group, INVAP, Argentina
Abstract. Some aspects of the ANSTO RRR reactor training simulator (RTS) design are presented. The simulator use is for operating personnel training and it is as a full-scope, training oriented, plant-specific and partial control room replica. It consists of a cluster of interconnected computers running several software modules, such as the Simulator Human-Machine Interface (SHMI), the Instructor Station (IS), the Simulation Manager (SM) and the Model Manager (MM). The scope of the Plant Mathematical Model (PMM) is such that the trainee is required to take the same actions on the simulator to conduct an evolution as on the reactor, using the reference plant operating procedures. The scope of the simulation permits conduct of all of the evolutions required until a stable condition is reached. All the systems relevant to the plant normal evolutions, and to the malfunctions defined in the design basis accident (DBA) list, are included. Within these systems both the variables connected to the plant SCADA and the local variables are included, leading to several thousands input-output variables in the PMM. Some modelling approaches and performance tests for both normal evolutions and malfunctions are presented.
1. Introduction The ANSTO RRR [1] simulator is being developed using FARSim [2] and can be classified as follows:
(a) Full-scope: the scope of the mathematical model is deep enough to present in the simulated control room the same set of variables as in the real plant control room.
(b) Training oriented: Real-time simulation is accomplished to perform satisfactory operators training, meaning that tendency and timing of critical variables and events correspond to equivalent variables and events in the real plant.
(c) Plant-specific: The mathematical model corresponds to the ANSTO RRR plant specifically.
(d) Partial replica: The control room is only partially replicated. A software version simulates hardware components like buttons, switches and keys.
The simulator consists of a cluster of interconnected computers running the Simulator Human-Machine Interface (SHMI), the Instructor Station (IS), the Simulation Manager (SM) and the Model Manager (MM) processes [2]. These are physically located on the Trainee Desk, on the Instructor Desk and on the Simulation Computers Rack. On the trainee desk, two graphical stations are used to display plant mimics of the main systems. These stations use a Foxboro WP70 [3] configuration, similar to the platform used in the RRR Main Console. An additional graphical interface with touch-screen capabilities is used to emulate the hard components of the Main Console (pushbuttons, switches, keys). On the instructor desk a workstation is used for control and administration of the simulation progress (Instructor Station), and a graphical station is used to inspect the simulated process information (Instructor Display Station), using the same software as the SHMI stations.
126

IAEA-CN-100/16P
The main functions that the instructor performs using the Instructor Station are: load plant initial conditions. Start, pause and restart the simulation in real-time, slow-time or fast-time. Save snapshots for later use to backtrack or replay the simulation. Reset an initial condition. Insert and remove component failure scenarios. Execute local actions upon trainee request.
The Normal Evolutions included in the scope of the simulator PMM (for both beginning and end of cycle initial conditions) are: Operator conducted surveillance testing on safety-related equipment or systems. Main components start-up/enabling. Approximation to critical state through the inverse multiplication method. Critical state at zero power, manual holding of the critical state. Manual power increase up to nominal power. Automatic pilot connection. Control rod calibration through period measurement. Normal and fast reactor shutdown. Recovery to rated power after a reactor trip. The Malfunctions included in the scope of the simulator (for both beginning and end of cycle initial conditions) are: Loss of electrical power supplies: including loss of offsite power, loss of emergency power, loss of emergency generators, and loss of power to the electrical distribution buses. Inadvertent insertion of irradiation fissile material. Start-up accident. Inadvertent control rod withdrawal. Inadvertent extraction of a pneumatic channel can with excess irradiation material. Fuel cladding failure. Nucleonic instrumentation failure. Process instrumentation, alarms and control system failure. Failure of First Shutdown System (FSS). Spurious activation of Second Shutdown System (SSS). Loss of primary coolant system forced core coolant flow due to single or multiple pump failure. Loss of heat sink: Pipe or heat exchanger blockage in the secondary cooling system loop. Wrong system configuration (valves position). Simultaneous failure of both SCS pumps. Failure of cooling tower component. Lack of make-up flow. Loss of service water or cooling of individual components. Loss of shutdown cooling. Primary cooling system or irradiation rigs cooling system loss of coolant due to pipe break or valve failure. Erroneous handling or failure of equipment or components: pumps, fans, valves. Excessive rig power to be evacuated by the rigs cooling system, loss of flow in the rigs cooling system. Reactor trip. Small leak, cooling pumps failure and intermediate cooling circuit pumps failure in the reflector heavy water circuit.
Modelling approaches and performance tests for some of the simulator systems for both normal evolutions and malfunctions are presented.
2. Plant mathematical model (PMM) Plant systems included in the PMM are the primary cooling system (PCS), the reactor core (RC), the reactor pool, the service pool (SP), the irradiation rigs, the reactor and service pool cooling system (RSPCS), the first shutdown system (FSS), the secondary cooling system (SCS), the reactor protection system (RPS), the electrical system (ES), the reflector cooling and purification system (RCPS), the second shutdown system (SSS), the nucleonic instrumentation system (NI), the hot water layer system (HWLS), the radiation monitoring system (RMS), the reactor containment and ventilation system (RCVS), and the emergency make-up water system (EMWS). Within these systems both the variables connected to the plant SCADA and the local variables are included.
The general modelling scope of some of these systems are presented in the following sections.
2.1. Primary cooling system (PCS) The PCS model is divided in three sections; the first one includes the piping from the chimney suction to the decay tank, the decay tank, and the piping from the decay tank to the pumps’ header. The second one includes the three pumping and cooling branches to the pumps’ collector; and the third one is from the pumps’ collector to the PCS flap valve input, with the interconnection flow line.
127

IAEA-CN-100/16P
FIG. 1. Pumps and heat exchangers branches in PCS model.
The electrical drivers of the main components are also included. Figure 1 shows a part of the second section model, with the pumps, the heat exchangers, the isolation valves, the check valves, the CRDs’ flushing flow outputs, sensors and actuators. FARSim [2] library of hydraulic components was used to define the flow paths. Single-phase one-dimensional mass and energy balance equations are solved in each of the control volumes. The momentum conservation is solved in an integral form over the flow path. The input parameters for these library components are linked to the data input of a RELAP [4] model of the PCS. Several LOCA valves have been added at pumps’ outlet, in the header and in the collector. Saturation temperature generates an out-of-scope signal.
2.2. Core and chimney The core library component is a flow path that includes the PCS return piping inside the pool, the inlet plenum, five hydraulic nodes for the core average channel, and the lower chimney (from core outlet to PCS suction). For each core average channel node, an adjacent metal node in thermal contact representing the cladding and fuel is defined. Neutron power is modelled through point kinetics, with a six delayed groups neutrons model, and eleven gamma groups to dynamically represent the decay power. Poisoning is contemplated with a dynamic xenon model and burn up with a simple model where core reactivity depends on the days of full power. The fraction of the nuclear power generated within each metal node depends on a pre-defined axial power distribution profile. Reactivity feedback terms from the mean fluid density, from the mean fluid temperature and from the mean fuel temperature are obtained through tabulated feedback coefficients applied to the deviation of these variables from the respective nominal values. These mean values are obtained as weighted averages within the core. The weighting depends on the power distribution within the core. The onset of nucleated boiling temperature and the saturation temperature in the average channel are used to define an "out of scope" state for the component.
128

IAEA-CN-100/16P
The lower chimney is included in the core flow path. The upper chimney is represented with a tank component, with connections with the PCS suction, the control rods’ (CRDs) flushing flow, the residual heat removal (RHR) suction line, the core and the lower pool.
FIG. 2. Reactor and service pools model.
2.3. Reactor and service pools The reactor and service pools are represented with tank components (Fig. 2) of the FARSim [2] library of hydraulic components. The tank components have input, output and skimming connections, each with an altitude with respect to the bottom of the tank. Single-phase one-dimensional mass and energy balance equations are solved in each of the control volumes; pressure head is calculated for each of the connections. They can be connected to flow paths or to special tank-to-tank connections, such as the cascade connections (CC in Fig. 2), that implement the fluid transfer for empty tanks; or the mixing connections (MC in Fig. 2), that implement a flow between the tanks that depends on its temperature differences. This flow dependence with temperature difference is input as a table into the cascade connection component. The service pool (SP) is represented with a single tank component and the reactor pool with three tank components, representing the lower reactor pool (LRP), the upper reactor pool (URP) and the hot water layer (HWL). The SP is connected with the URP through a hydraulic connection (HC in Fig. 2), that represents the transfer channel. The skimming outputs of the LRP and URP are connected to the URP and to the HWL respectively. The HWL skimming is connected to the hot water layer system. Spent fuel is represented as a heat source in the service pool.
The LRP has connections to the PCS flap valve, to the rigs’ flap valve, to the molybdenum rigs suction line, to the generic rigs suction line, and to the RSPCS return line. The HWL has suction and return lines from the hot water layer system and the SP to the RSPCS service pool
129

IAEA-CN-100/16P
suction and return lines. A siphon effect breaker (SEB) signal is used to interrupt pool output flow in the case of pool level lower than SEB level.
Connections to other plant system models include the vapourization flow in the HWL to the RCVS model and the mixing flows that are used to calculate the propagation of radio-nuclides in the RMS model.
FIG. 3. Rigs cooling branch in the RSPCS model.
2.4. Reactor and service pool cooling system (RSPCS) The model includes both the rigs cooling branch; the residual heat removal (RHR) branch from the reactor chimney; and the three-way valve that commutes the connection between these lines and the decay tank. The rigs cooling branch model includes: two parallel branches representing the molybdenum rigs and the generic rigs; the rigs’ suction plenum; the rigs’ flap valve; the SEB orifice and the piping to the three-way valve. The model also includes the decay tank, the service pool suction and return lines (SPSL-SPRL) with isolation valves, the pumps’ header and collector, two main and two auxiliary pumps with isolation and check valves, the heat exchanger with isolation valves, the interconnection line with isolation and check valves, the PCS purification line and the return line to the LRP with isolation valves. The electrical drivers of the main components are also included. As the PCS this model was built using the FARSim [2] hydraulic library components.
2.5. Reactor containment ventilation system (RCVS) The RCVS model is developed using FARSim [2] library of air and hydraulic components. The library of air components includes objects like humid air control volumes, air ducts, isolation valves, control valves, check valves (anti-return dampers), fans, cooling coils and electrical heaters.
130
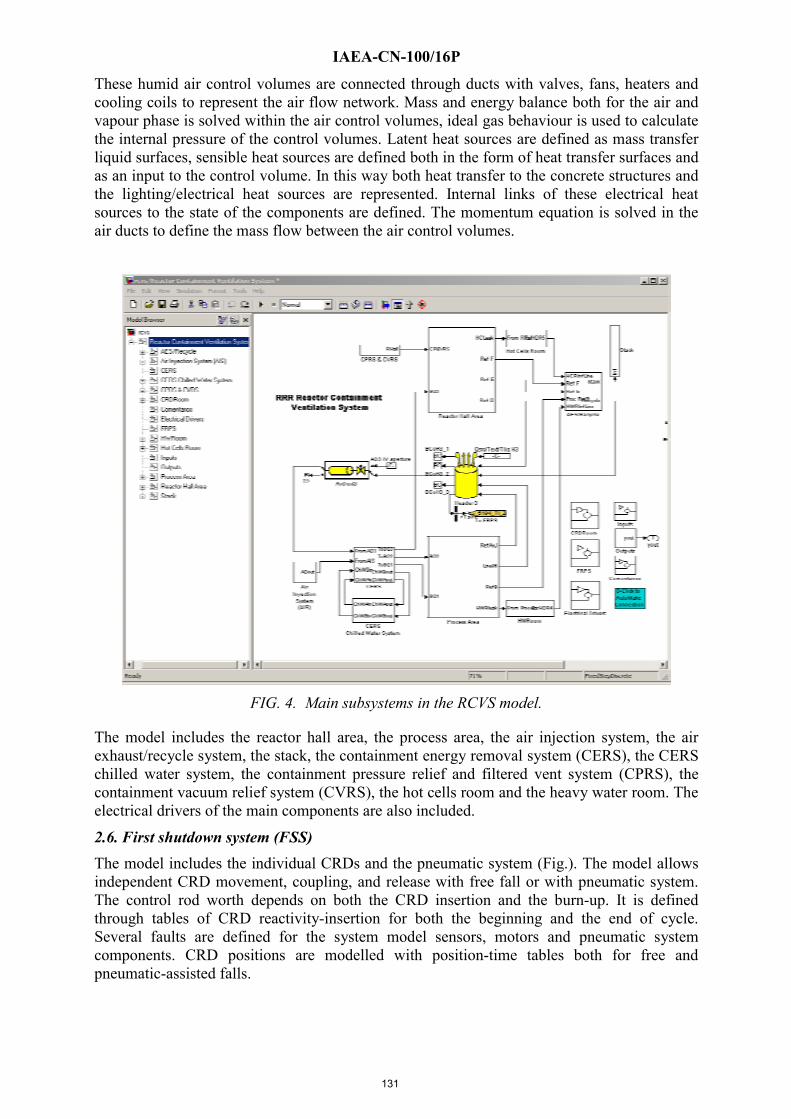
IAEA-CN-100/16P
These humid air control volumes are connected through ducts with valves, fans, heaters and cooling coils to represent the air flow network. Mass and energy balance both for the air and vapour phase is solved within the air control volumes, ideal gas behaviour is used to calculate the internal pressure of the control volumes. Latent heat sources are defined as mass transfer liquid surfaces, sensible heat sources are defined both in the form of heat transfer surfaces and as an input to the control volume. In this way both heat transfer to the concrete structures and the lighting/electrical heat sources are represented. Internal links of these electrical heat sources to the state of the components are defined. The momentum equation is solved in the air ducts to define the mass flow between the air control volumes.
FIG. 4. Main subsystems in the RCVS model.
The model includes the reactor hall area, the process area, the air injection system, the air exhaust/recycle system, the stack, the containment energy removal system (CERS), the CERS chilled water system, the containment pressure relief and filtered vent system (CPRS), the containment vacuum relief system (CVRS), the hot cells room and the heavy water room. The electrical drivers of the main components are also included.
2.6. First shutdown system (FSS) The model includes the individual CRDs and the pneumatic system (Fig.). The model allows independent CRD movement, coupling, and release with free fall or with pneumatic system. The control rod worth depends on both the CRD insertion and the burn-up. It is defined through tables of CRD reactivity-insertion for both the beginning and the end of cycle. Several faults are defined for the system model sensors, motors and pneumatic system components. CRD positions are modelled with position-time tables both for free and pneumatic-assisted falls.
131

IAEA-CN-100/16P
2.7. Electrical system (ES) The electrical system model is represented through a simplified static single phase model; electrical transients are out of scope. The model scope includes the 11kV switchboards; the main power transformers 11 kV/415-240 V; the low voltage supplies from the power transformers to the main low voltage switchboards, the diesel generator sets; the un-interruptible power supply; the low voltage switchboards; the motor control centres. The state of these main electrical components defines the availability of electrical power to the electrical loads (motors, sensors, transducers). The models of the electrical drivers of the main electrical components of the modelled systems are included.
FIG. 5. Control rods models in FSS model.
2.8. Radiation monitoring system (RMS) Water and air specific activities are calculated for some radio-nuclides through out some specific locations of the reactor, these include: reactor and service pools with their associated cooling circuits, reactor hall and stack vent. This model represents the activity measurements in Active Liquid Monitors – ALMO, top of the pool Area Radiation Monitors (ARM) and Air Effluent Monitors – AEM.
A reduced set of radionuclides is used to calculate specific activity changes. These are chosen to estimate activity transients due to nuclear power, water circuit configurations, and operation mode or ventilation system configuration changes during simulation. Every activity of these radionuclides will be added up to a fixed background activity.
Radionuclide election was based on activity magnitude at measured points, taking into account production rate values and time decay constants. For the activity model it is taken into account the activities contribution of 41Ar, 19O, 24Na nuclides, and a generic concentration of inert gases (only Xe and Kr without Ar) inside the Primary Cooling System (PCS) and the
132

IAEA-CN-100/16P
Reactor and Service Pool Cooling System (RSPCS). The activity due to 16N nuclide is low at the measurement point, so it is not modelled. The model also contemplates the release from pool surface to the air of 41Ar and generic inert gases (Xe and Kr); which are the main contribution to aerosol activity (138Cs and 88Rb) in the air effluents. Fission fragments other than inert gases are assumed not to have significant contribution to the measured activities, and are considered as a fixed stationary background in normal operation. For the aerosol detectors in AEM, it takes into account the decay products of the generic inert gases (Xe, Kr without Ar) in the air.
Radionuclide generation is proportional to the nuclear power. Fuel element failure and filter/ion exchanger failure are contemplated in the model.
FIG. 6. PCS and Core pressure and temperature distributions.
3. Model tests Plant system models are tested through contrast against plant design data, which includes both steady state and transient analysis reports. System models relevant to the plant normal evolutions and malfunctions listed in the DBA were tested against RELAP outputs. The results of some of these tests are presented in the following sections.
3.1. Steady state The results of the pressure and temperature distribution along the PCS and Core for full-power steady state operation are presented in Figure 6. In Fig. 6 Simulink input and SS refer to the PCS model initial condition and steady state values respectively; PIP and POP are the core inlet and outlet piping; AChn and HChn are the average and hot channels; LCh and UCh are lower and upper chimney; PDTK is the decay tank; PBAa is the main pump; PBIa is the heat exchanger; and PFV is the PCS flap valve. A close agreement is observed between the FARSim and RELAP PCS models. The flows are also in close agreement, with a maximum discrepancy between the data sets lower than 1.4%.
3.2. Loss of flow accident (LOFA) Figures 7 and 8 show the results of a LOFA simulation for both the RELAP and FARSim PCS models. Both PCS pumps are stopped, reactor trip occurs, flap valves open and flow inverts in the upper chimney. Figure 7 shows the close agreement in both models for the PCS flow and reactor power. Figure 8 shows a good agreement in flow behaviour (in Fig. 8, WSt3fv: flap valves’ flow, WChOut: flow at the chimney outlet, WCh2: core outlet flow) and a difference within specifications in the lower chimney temperature prediction (TCh1 in Fig. 8), mainly due to a small difference both in decay power model and in natural convection flow prediction.
133

IAEA-CN-100/16P
FIG. 7. LOFA simulation: reactor power and PCS flow.
FIG. 8. LOFA simulation: core, upper chimney and flap valve mass flow; lower chimney
temperature.
3.3. Loss of coolant accident (LOCA) Figure 9 shows the results of the simulation of a 0.04 m diameter breakage at the PCS pump outlet. The PCS pumps are not stopped and reactor trip occurs due to low pool level. In Figure 9 some simulation results are presented, such as the pool level (_Lrp), the reactor power (_pot), the core inlet plenum temperature (_TIP), and the lower chimney temperature (_TCh1). Some diffusion is observed in FARSim temperature prediction due to the lower number of nodes used in the model. The same effect is observed in the simulation of a loss of heat sink malfunction.
3.4. Inadvertent insertion of U-Mo target Figure 10 shows the reactor power and core coolant outlet temperature in the simulation of an inadvertent insertion of U-Mo target with failure of FSS and actuation of SSS. Initial state is full power steady state operation and the reactivity insertion is 72 pcm in 0.5s. The agreement with Relap is quite good. For faster reactivity insertions (240 pcm in 0.5 s) a slight temperature delay (30 mseg) is observed with respect to RELAP output due to the different fuel plate models.
4. Current state of development The simulator architecture operation is being tested with versions of the PMM and the SHMI [3] that include the PCS, the reactor core, the reactor and service pools, the irradiation rigs, RSPCS, the FSS and the SCS. System models relevant to the plant normal evolutions and malfunctions listed in the DBA were tested against RELAP outputs. The simulated models represented correctly the steady state, tendency and timing of all plant variables relevant to the
134

IAEA-CN-100/16P
normal evolutions and malfunctions included in the DBA list. The remaining plant system models are being integrated into the PMM.
FIG .9. LOCA simulation: reactor pool level, reactor power, and core inlet and outlet temperatures.
FIG. 10. Inadvertent insertion of U-Mo target with failure of FSS and actuation of SSS.
5. Conclusion The use of FARSim [2] eases the model development process through the use of the specialized hydraulic-air-nuclear components libraries in Matlab®, Simulink® [5] simulation model development environment.
The model scope of the hydraulic and air library components of FARSim [2] proved to be adequate to represent the ANSTO-Replacement Research Reactor normal evolutions and malfunctions included in the design basis accident list.
PMM systems tests were performed with RELAP [4], through the simulation of a representative set of malfunctions taken from the design basis accident list. Plant systems included in these tests were the primary cooling system, the core, the reactor and service pools, the reactor and service pool cooling system. Tests for the remaining plant system models are implemented through contrast against plant design data, which includes both steady state and transient analysis reports.
The simulator architecture operation is being tested with versions of the PMM and the SHMI [3] that include the PCS, the reactor core, the reactor and service pools, the irradiation rigs, RSPCS, the FSS and the SCS. The schedule for the integration into the simulator architecture of newer versions of the PMM, with more system models, follows the RRR [1] HMI development schedule.
135

IAEA-CN-100/16P
All system models within the scope of the simulator have been developed and are being tested. The integration of these system models into the PMM is in progress. The integrated versions of the PMM are tested within the Matlab®, Simulink® development environment before they are integrated into the simulator architecture.
REFERENCES [1] RRR Replacement Research Reactor, Australian Nuclear Science and Technology
Organization. http://www.ansto.gov.au/ansto/RRR/.
[2] ETCHEPAREBORDA, A., et al., “Reactor Simulator Development Facility for Operating Personnel Training”, Research Reactor Utilization, Safety, Decommissioning Fuel and Waste Management (submitted to Proc. Conf. Santiago de Chile, 2003), IAEA.
[3] The Foxboro Company, “Foxboro I/A Series® system”. 33 Commercial Street, Foxboro, Massachusetts 02035 USA. http://www.foxboro.com/iaseries/.
[4] Innovative Systems Software, “RELAP/SCDAPSIM/MOD3.2”. L.L.C, 2000..
[5] MathWorks Inc., “MATLAB®, Simulink® and Real Time Workshop®”. 3 Apple Hill Drive, Natick, MA 01760-2098, http://www.mathworks.com.
136

IAEA-CN-100/19P
Providing the Infrastructure for a BNCT Hyperthermal Neutron Beam N. Rico, R. Juracich Centro Atómico Bariloche, Argentina
Abstract. When the RA-6 reactor's Boron Neutron Capture Therapy (BNCT) facility project commenced, the RA-6 Reactor Maintenance Section, in parallel to the neutron research, was requested to develop the necessary structure for this new facility. This paper describes the solution of this task, in particular with respect to organisation, development and construction.
1. Introduction In the implementation of the RA-6 reactor's Boron Neutron Capture Therapy (BNCT) facility project, there were three distinct areas of consideration and discussion termed 'building area', 'mechanism area' and 'optical area' comprising various elements as follows: Building area: assessment of external thermal column dimensions, fitting the sector to therapy necessities; calculation of the thickness of the shelter; design of the irradiation/operating room based on:
(a) space available around the external thermal column; (b) layout; (c) design for habitability and human comfort; (d) modular wall construction; (e) stability forces of the building structure for the extra weight; (f) anti-seismic study and structure; (g) concrete sliding door system; (h) Poly-Boron internal cover system.
Mechanism area: development of the necessary devices for the new installation such as devices for calibration and measuring of the neutron beam, neutron chamber bench, development and construction of the phantom. Optical area: final laser alignment for positioning the centres of the neutron beam over the phantom from the therapy point of view.
It is hoped that the experience reported in this paper will be useful for those who are in the process of planning or developing a BNCT facility.
2. The areas involved
2.1. Building area The principles underlying the assessment of dimensions and the design and construction of the external thermal column under the responsibility of the director of the project (Project BNCT-RA-6) were stated as: • Every construction made under this project will allow return to the initial point. This
meant that the installation had to be, for strategic reasons, able to be completely reversed (the bunker, the internal and external components of the reactor, the movement of the 10.000 kg external thermal column door, etc.);
137

IAEA-CN-100/19P
• The dimensions of the external thermal column cavity must match the necessities of the therapy (ergonomic dimensions, instrumentation area, video camera and laser installation, articulated bed dimension for sitting and laying position, etc.);
• the resulting new structure, because of high weight, must be verified by engineering calculations with respect to stability of the building, including seismic resistance.
From the very beginning of the BNCT project, the reactor maintenance team planned and designed every step taken according to the requirements described above.
As already mentioned before, there were three areas of consideration and discussion: the building area, the mechanism area and the optical area. Concerning the building area, the dimensions of the external thermal column were narrower than those that a patient needed. Consequently the decision was taken to enlarge the area and fit the sector to human size.
(a) (b)
FIG. 1. The Reactor RA-6 and the external thermal column: (a) under construction (28th April 1982) and (b) today.
After calculation of the thickness of the shield, the irradiation room was designed. This involved various considerations.
(a) Space available around the external thermal column. There was ample space around the external thermal column. The requirements of the researchers were: “a place with ergonomic dimensions for a patient, a medical doctor and a working area for the calibration and setting of tests, instrumentation, an area for video cameras, laser for alignment, electrical board and an aisle for the entrance”.
The calculations to be carried out comprised the static and dynamic forces (seismic situation) applied to the building structure.
To allow for good radiation shielding, the radiation protection specialists needed the existing external thermal column door. The shelter door is a 10.000 kg iron element running on rails with a flying wheel electrical motor. This door was located and fixed at the end of the open position.
The walls of the 'filter zone' to be modified were from the reactor block; this meant reinforced concrete enriched with iron pellets. A pneumatic hammer was the right tool for removing the concrete. Since a significant production of dust was to arise in the caving operation, the area was covered with a convenient plastic (Nylon) tent, and an electrical extractor fan was installed to remove the dust through an exhaust pipe to the outside of the hall building. Another Nylon plane was used to cover the open pool area.
138

IAEA-CN-100/19P
When demolition work had reached the final dimensions (180 cm width and 200 cm height), the walls, ceiling and floor of the irradiation area, and the filters and beam area, were finished with a coating material (Figure 1). Thereafter, the construction of the irradiation room commenced.
FIG. 2. Articulated bed in the irradiation area
(b) Layout The design of the distribution of the inside facilities was based on an ergonomic study applied to narrow spaces. This study included the position of the patient (sitting, laying, see Figure 2) and the connection from the irradiation room (Figures 3, 4) passing across the SAS door, using the elevator up to the patient rest room on the 3rd floor of the auxiliary building.
FIG. 3. General layout of the irradiation room
(c) Design for habitability and human comfort The inside decoration of the irradiation room was designed in such a way as to avoid a psychological shock to the patient. Carpets ware placed on the floor, walls were painted in bright colours and some walls were covered by decorative cloth. All this 'make-up' is a sort of camouflage of the bunker. An illumination system in the irradiation room, with spot-lights in the irradiation area, provides for good conditions for video camera imaging. Also, general illumination in the room and at the entrance was installed. For safe exit in case of a black-out, an emergency light was installed.
(d) Modular type of wall The considerations involved assessment, design and construction of a modular type of wall and roof manufactured outside the reactor hall for clean work in the controlled area, enabling with the modular construction (dismounting every piece) return to the former situation.
139

IAEA-CN-100/19P
FIG. 4. Top view of the irradiation room close to the reactor
The calculations of the concrete structure (with certificate of an engineering study) were made according to the following standards:
GENERAL TENSION ADOPTED: Concrete: 170 Kg/cm2 Steel: 4200 Kg/cm2
TECHNICAL STANDARDS: Seismology Study: C.I.R.S.O.C. 103 (Centro de Investigación de Reglamentos
Nacionales de Seguridad para las Obras Civiles) Book I, II, III. CONCAR 70 Seismic resistant structures - INPRES (Instituto Nacional de Prevención Sísmica)
Concrete Study: C.I.R.S.O.C. 201, 251, 252, 256. Metal Structures Study: C.I.R.S.O.C. 301, 302, 303.
SAFETY FACTOR: 50% (N = 1.5)
Modular panels (shelters) were used for the wall and the roof of the irradiation room. They were manufactured with planking outside the reactor hall in a clean and dry construction. The material used for the modular panels was concrete, reinforced with pellets of iron, and with embedded eyebolt for hoisting the panels, internal iron structure with an individual weight of: 2.000 kg each (the limit load of the reactor crane bridge is 5 tons). After they were finished in the backyard, they were put in the final position, and fixed to the building (floor and block of the reactor) and to each other for obtaining an anti seismic structure. The final size of each panel was calculated from the limit load of the crane bridge. An “L” shape of neutron tramp was made in each vertical edge of the panels. Some of the panels were put up-side down to allow an inverted “L” and to conserve the two planes of both sides of the panels. When the mounting was finished, the bunker was covered (inside and outside) by a plastic paint to give a smooth surface, not to allow the presence of dust inside the reactor hall or the irradiation room.
Two black and white redundant video cameras were installed inside the irradiation room sending signals to one monitor in the medical control area outside the bunker and one monitor in the main control room of the reactor. A point-to-point voice system connects the patient to the medical control area.
A technical neutron tramp wire channel was installed to connect all signals and electrical power sources from the outside area with the irradiation room.
140

IAEA-CN-100/19P
(e) Stability forces of the building structure for the extra weight. Before the construction of the individual shelter panels, and with a professional certificate on the stability with the new building load, the structure of the floor was reinforced from the basement with 'double U' channel iron in vertical position in strategic points of maximum solicitation. A report with documentation and blue prints certifies the calculation.
(f) Anti-seismic study and structure. The state-of-the-art and an engineering certificate marked the specific points to fix each of the panels between them and the reactor building. A report with documentation and blue prints certifies the calculation.
(g) Concrete sliding door system. A 2000 kg door was designed (Figure 5), which can be manually operated from outside or inside. It was mounted with the help of the bridge crane over boogies with bearing mounted rail wheels. It runs smoothly over an inverted “L” shape iron rail fixed at the floor. The door has a micro switch that indicates the open/close position, triggering a SCRAM if somebody tries to open it during an irradiation session.
FIG. 5. Sliding door
(h) Poly-Boron internal cover system. Prior to the interior decorative cover, the researcher's requirement was the installation of Poly-Boron plates (polyethylene boron plates) at the ceiling, the walls and the floor. The dimensions of the plates are 105 x 105 x 5 cm with 60 Kg of weight. The plates were fixed by bolts to the modular panels.
2.2. The mechanism area In order to place from outside the bunker the irradiation target in different positions, a sliding target was designed, powered by a step-by-step electrical engine. The respective different linear doses were measured in the total range between the port and the articulated bed.
Construction of a Phantom. A 'water body' simulator was designed and manufactured from acrylic material. It simulates the different parts of the human body and is used to measure dose delivered by the neutron beam. Head, chest, legs and arms of the phantom are filled with water, representing human mass for the neutrons (see Figures 6 and 7).
2.3. The optical area Another medical requirement was a final alignment system. One vertical and one horizontal laser mounted over each wheel calibration platform allow the alignment between a point made by laser beams crossing over the tumour area and the centre of the neutron beam (Figure 8).
141

IAEA-CN-100/19P
FIG. 6. Phantom in position inside FIG. 7. Phantom the Irradiation Room
FIG. 8. Calibration of the Laser beams inside the Irradiation Room
3. Conclusions The project was successfully implemented. The experience gained at the RA-6 reactor might be useful for those who are in the process of planning or developing a Boron Neutron Capture Therapy (BNCT) facility at their reactor.
REFERENCES: [1] BLAUMANN, H. et al. NCT Facility Development at the RA-6 Reactor. Eighth
International Symposium on Neutron Capture Therapy for Cancer, 1998, La Jolla, USA. [2] KREIMANN, E.L., ITOIZ, M.E., LONGHINO, J., BLAUMANN, H., CALZETTA, O.,
SCHWINT, A.E., “Boron Neutron Capture Therapy for the Treatment of Oral Cancer in the Hamster Cheek Pouch Model”; Cancer Research 2001 Dec 15, 61(24).
[3] DAGROSA, M.A., VIAGGI, M., LONGHINO, J., CALZETTA, O., CABRINI, R.L., EDREIRA, M., JUVENAL, G.J., PISAREV, M.A., “Experimental Application of Boron Neutron Capture Therapy (BNCT) to undifferentiated thyroid carcinoma (UTC)”; sent to Int. J. of Radiat. Oncol. Biol. Physc.
[4] Centro de Investigación de Reglamentos Nacionales de Seguridad para las Obras Civiles.
[5] INPRES -Instituto Nacional de Prevención Sísmica.
142

IAEA-CN-100/21P
The Prompt Gamma Neutron Activation Analysis Facility at the RA-6 Reactor of the Bariloche Atomic Centre, Argentina. F.A. Sánchez, O. Calzetta, H. Blaumann. Centro Atómico Bariloche, Comisión Nacional de Energía Atómica. San Carlos de Bariloche, Argentina.
Abstract. The RA-6 is a research reactor with 500 kW of thermal power, located at the Bariloche Atomic Centre. In one of its five extraction tube facilities a prompt gamma neutron activation analysis system is now under construction. The neutron thermal flux in the position sample is 7 106 n/cm2s using a 5 cm thick bismuth filter. This work presents two facility designs, a preliminary one and another one with some improvements. Shielding optimizing experiences which justify the incorporated improvements are described. The applications of them allow the measurement of a borated sample. Also presented is a new design of the beam catcher and it is compared with the old one by MCNP modelling . New applications are being considered in the frame of the contract with the IAEA under the Co-ordinated Research Project (CRP) on “New Applications of PGNAA”.
1. Introduction The Prompt Gamma Neutron Activation Analysis1 (PGNAA) is a non-destructive isotopic analytic technique based on the measurement of gamma radiation emitted by a sample while it is irradiated with a neutron beam. The difference with the traditional neutron activation analysis is that the sample does not remain active after irradiation due to the low neutron fluence that it is exposed. The PGNAA technique was applied to several fields of science and technology to determinate the trace concentrations of B, Cd, Sm y Gd, and major components of H, C, N, Si, P, S and Cl.
The RA-6 is a pool type experimental reactor situated at the Bariloche Atomic Centre in the city of San Carlos de Bariloche, Argentina. It has 500 kW of thermal power with a core made of uranium of high enrichment (90%), and it is moderated and cooled by light water. A PGNAA system is being set up at one of the five radial extraction tubes. The development of this facility was motivated by the request of 10B analysis in the application of Boron Neutron Capture Therapy. New applications are being considered in the frame of the contract signed with IAEA under the CRP on “New Applications of PGNAA”.
The most important concept in the design of a PGNAA facility is to have the maximum neutron flux at the sample and a very low background of neutrons and gammas at the detector which has to be as close as possible to the sample. The drawback is that in the proximity of an opening in the biological shielding there is an important field of scattered radiation. As low as 105 events per second are sufficient to saturate counting capacity of a common gamma spectrometer and a fluence of 109 fast neutrons can damage seriously an HPGe detector2.
This work presents two designs of the PGNAA system, a preliminary one and other one with some improvements on it. Some shielding experience justifies the incorporated improvements. A new design for the beam catcher is also presented and it is compared with the old one by MCNP3 modelling.
2. Description of a preliminary design. The current design of the RA-6’s PGNAA facility is shown in Figure 1. The beam is extracted from the core by a radial tube and ends its path in the beam catcher. The core -sample distance
143

IAEA-CN-100/21P
is 3.5 m and the sample-beam catcher distance is 1.25 m. The beam catcher is made of borated paraffin wax and concrete. The beam collimation is achieved by using two collimators: a) The first one is positioned 2 m downstream from the reactor core inside the biological
shielding and consists of alternating rings of borated polyethylene and lead in order to absorb the neutrons and gamma rays. The inner diameter of each ring is gradually decreased. The last layer has an inner diameter of 6.8 cm. The total length of this collimator is 52.5 cm. A steel door situated just behind it isolates the beam tube allowing the flooding of the extraction tube to shut the beam.
b) The second collimator configures the beam size at the sample position. It is composed of alternating rings of lead and a mixture of lithium carbonate (66%wt) and paraffin wax. The mixture was designed in order to minimise the generation of gamma rays and maximizing the shielding against fast neutrons. The last ring has an inner diameter of 4 cm. A massive box around the collimator completes the beam shielding.
The gamma detection system consists of a 50 % HPGe detector situated at 80 cm of the sample position inside a low background lead shielding. The spectrum analyser is an ORTEC DSPEC integrated system.
Beam Catcher
Detector shielding
Second collimatorFirst collimator
HPGe detector
Biological shieldingTable
Core
Extraction tube #2
Heavy concrete
Sample position
1 3
2 and 5
Borated paraffin wax
A
FIG. 1. Preliminary design of the facility. The numbered positions indicate the shielding position in the studied experiments.
3. Radiation doses in the preliminary design. When the beam is turned on, the following is observed: (a) The thermal neutron flux at sample position: 1.05 107 n/cm2 s with a Cd relation of 20. (b) The full gamma spectrum counting rate is 90.000 cps with a dead time of 78 %. (c) The counting rate at 478 keV (B line) is 460 cps. (d) The counting rate at 590 keV (Ge thermal line)2 is 580 cps(~0.2 mGy/h) (e) The counting rate at 690 keV (Ge fast line)2 is 270 cps.(~1 mGy/h ) (f) Doses at position “A” are 1.9 mGy/h of neutrons and 0.2 mGy/h of gamma.
144

IAEA-CN-100/21P
In this radiation background it is very difficult to make gamma spectrometry analysis of a sample. Some improvements over the shielding are proposed to reduce the quantity and quality of this radiation. The gamma and neutron dose has to be decreased at least 2 orders of magnitude to reach the adequate radiation levels. In order to protect the HPGe detector against fast neutrons it is moved away during the following experiences. A “long counter neutron dosimeter” of BF3 replaces the HPGe detector to account relative modifications produced by the shieldings. Table 1 shows the result of some experiments whose positions can be seen in Figure 1.
The first experiment consists of moving the beam catcher away 1.6 m downstream, in order to increase the distance 3 times and decreasing 9 times its contribution to the detector dose. It can be observed that the dose doesn’t change too much, suggesting that it is not the principal source of radiation. The second experiment incorporates a lead slab of 5 cm thick in front of the beam exit. The slab has a hole to allow the beam to pass through it and increases the shielding against the radiation transmitted through the massive box. The result shows a small decrease on the neutron dose. The third experiment adds a 10 cm thick borated polyethylene slab between the beam and the detector shielding. It decreases the neutron and gamma doses by 50%. This confirms that the radiation is coming from the beam exit and it is mainly composed by neutrons. In the fourth experiment the last 30 cm of the inner part of the second collimator is removed in order to reduce the angle view of beam exit and to avoid radiation scattering in the region close to the detector shielding. It changes the doses in the same proportion as the third experiment, and confirms again that it is the most important source.
Table I. Relative variation over the gamma and neutron dose. (± 5% of uncertainty) Modification Gamma dose Neutron dose 1 Moving back the BC 1.6 m. Equal 10% Less 2 Increasing shielding at the exit of 2nd
collimator with 5 cm of lead. Equal 20% Less
3 Increasing shielding at the front of the lead castle with borated polyethylene
50% Less 50% Less
4 Extracting the last part of collimator 50% Less 50% Less 5 Incorporating a diaphragm of borated
paraffin between the beam exit and the detector shielding.
90% Less 90% Less
The system is moved 50 cm downstream (not exactly shown in the figure) in the fifth experiment, and a wall of 10 cm wide of borated paraffin wax was constructed between the beam exit and the detector shielding. The wall has a hole wider than the beam. A 5 cm thick borated polyethylene slab is also incorporated in the same position as in experiment three. The result shows the lowest dose.
4. Test measurement of a sample. The spectrum shown in Fig. 2. was obtained with the application of the shieldings of the fifth experiment. Furthermore, a bismuth filter of 5 cm thick was used inside the tube in order to attenuate low energy gammas and the tube’s door was kept open. The improvements are:
(a) The full spectrum counting rate is 750 cps with a dead time of 3 %. (b) No observation of 10B line in 600 s of counting. (c) The counting rate at 590 keV (Ge thermal line) is 14 cps (d) The counting rate at 690 keV (Ge fast line) is 6 cps.
The thermal flux is 7 106 n/cm2 s, lower than the previous measurements due to the bismuth filter. The application of neutron/gamma filters will be evaluated for this facility in future
145

IAEA-CN-100/21P
works. Figure 2 shows the spectrum of 2 g of borated water with 15 ppm of 10B compared with the background without sample. The Ge lines produced by neutrons on the detector can be seen.
2500 3000 3500 4000 45000
50
100
150
200
250
300
350
691 keV 72Ge(n,n'γ)72Ge
596 keV (73Ge(n,γ)74Ge
10B
Cou
nts
in 6
00 s
Channel number
Background without sample 15 ppm of 10B in 2 gr H2O
FIG. 2. Sample measurement in 600 s of counting and background without sample
5. Design of the beam catcher. Although it is proven that the beam catcher (BC) does not represent the most important source of radiation, the need for a reduction by two orders of magnitude requires an improvement
FIG. 3. Old model of the beam catcher.
FIG. 4. Proposed new model for the beam catcher using the main parts of the older.
146

IAEA-CN-100/21P
The new one incorporates the following characteristics:
(a) Neutron shielding: Lithium carbonate (66 wt%) paraffin mixture. (b) The beam does not touch anything until reaching the deepest part where the beam is
stopped. (c) Shielding the view angle of the detector from the deepest part.
The neutron spectrum used in the simulation is composed by three energy ranges: a Maxwellian thermal spectrum, plus other 1/E and a fission Watt spectrum. The relation between them was obtained from a kcode MCNP calculation of the core. The spatial location of the source is between the cell 7 and 8 with a diameter of 5 cm, and the direction is pointing inside the BC. In spite of the artificial construction of the beam, only the relative behaviour between both models is considered
To account the improvement six tallies (type 4) were taken around the beam catcher as shown in the Fig. 3 and 4. The tallies number 7 and 8 are used for calculate the albedo of the system The cells 4 and 5 are the closest to the detector shielding according to Fig. 1. In Table II, the results can be seen.
The new design presents an important improvement in the backward directions (regions 3, 4 and 5), but it is worse in the forward directions, (regions 1 and 2). With the normalization of the tallies to the actual flux in position 7, the dose in those regions does not overpass the radiological limits.
Table II. Relation between the total neutron flux in the new BC design over the old one.
Cell Thermal Error Epithermal Error Fast Error 1 58 30% 64 17% 30 20% 2 13 5% 11 2% 5 3% 3 0.016 7% 0.06 5% 0.15 10% 4 0.0007 5% 0.003 4% 0.01 8% 5 0.005 2% 0.009 2% 0.016 6% 6 0.5 1% 0.7 1% 1 5%
8/7 0.5 Not converged 0.6 The albedo factor calculated is about 5 10-4 for the position 8 in the old design and for the new one it is about half of it. This means that, for example, a forward current of 1 107 n/cm2 s produces 5000 n/cm2s going back to the detector shielding castle. For the new design it is about half, but the most important improvement is the decrease of two or three orders of magnitude of neutrons for cells 4 and 5.
6. Conclusion: proposed design for the RA-6’s PGNAA facility. The shielding suggested by the experiments; the test of it by the measurement of a sample, and the improvements of the beam catcher calculated by MCNP modelling are the facts which determine the conceptual design of the RA-6 PGNAA facility.
The Fig.5 shows the design under construction. Furthermore, a Compton suppression system and two spectrum analysers that work in coincidence and anti-coincidence mode in order to reduce the detection limits and discriminate escape lines, have been incorporated into the facility.
147

IAEA-CN-100/21P
Beam Catcher
Detector Shielding
CoreNeutron filter position
Biological Shielding
Concrete LeadSample
Collimator exit shielding
Collimator
HPGe detector
Compton suppression annulus
FIG. 5. New design of the RA-6’s PGNAA facility
REFERENCES [1] PAUL, R. L., LINDSTROM, R. M.. Prompt gamma-ray activation analysis:
Fundamentals and applications. Journal of Radioanalytical and Nuclear Chemistry, Vol. 243. No. 1 (2000) 181-189.
[2] BRIESMEISTER, J. L., MCNP- A general Monte Carlo N-Particle Transport Code, Version 4B, LA-12625-M, Los Alamos National Laboratory, USA.
[3] ALFASSI, Z. B.,CHUNG, C., (Eds). Prompt gamma neutron activation analysis. Chapter 3. CRC Press. USA. (1995).
148

IAEA-CN-100/22P
Using the RA-6 Reactor for Medical Research and Clinical Trials: The BNCT Hyperthermal Neutron Beam H. Blaumann , O. Calzetta Larrieu, J. Longhino, S. González, G. Santa Cruz, M.A. Dagrosa, M. Pisarev, E. Kreimann, A. Schwint, M. Viaggi. a Centro Atómico Bariloche, S. C. de Bariloche, b Centro Atómico Constituyentes, Buenos Aires Argentina
Abstract. A hyperthermal beam has been developed at the RA-6 reactor Boron Neutron Capture Therapy (BNCT) facility in order to perform human clinical trials for the treatment of skin melanomas in extremities. Based on the previously developed epithermal beam, the objective was to modify it in order to improve its therapeutic gain for the treatment of skin melanomas up to 2 cm in depth. After finishing the beam set up and commissioning stage, a theoretical analysis of such beam performance has been completed, based on a clinical case of malignant melanoma in extremities. In spite of the complexity of the clinical case under review, results showed that only 4% of the tumour volume is under dosed in cases of mean blood 10B concentration values, even in the most unfavourable analysis. The overall results suggest that this BNCT facility is prepared to rigorously explore the clinical efficacy of the RA-6 beam and the BNCT treatment modality for peripheral melanomas. A special configuration was arranged for in vivo experiments with small animals like hamsters and mice. These experiments were successfully performed in order to analyze the potential of BNCT for the treatment of oral cancer in the hamster cheek pouch model and undifferentiated thyroid carcinoma.
1. Introduction BNCT was first proposed almost six decades ago and first performed four decades ago. In the recent years, it has been the subject of renewed world-wide research activity. It is one of the present strategies developed as researchers seek to overcome the historical failure in the effective treatment of brain cancer, like high-grade, multiform glioblastoma. This binary radiotherapy modality combines a stable isotope such as 10B, with thermal neutrons. A tumour-seeking boron delivery agent is administered to the patient, and when the target region is irradiated with thermal neutrons, the products of the 10B(n,α)7Li reactions deposit their energy within ~10 µm of the reaction origin. Thus, because of the enhanced uptake of the boron delivery agent in tumour cells, a higher radiation dose can be delivered to the tumour compared to normal tissue with microscopic selectivity.
RA-6 is a pool type reactor, with 500 kW of nominal power, and U 90% enriched fuel. An epithermal BNCT beam was developed a few years ago by removing its internal and external thermal column [1]. In 2001, the original epithermal beam was modified to produce the current neutron beam with more appropriate characteristics for the treatment of surface tumours. The following were considered as boundary requirements at this stage: (i) use of the same internal filter of the previously developed epithermal beam, (ii) a thermal neutron flux peak with about 1.0E+09 cm-2 s-1 at 1 cm depth, and (iii) easily removable modifications to restore the epithermal beam.
2. Beam set-up and physical dosimetry By simulating the beam configuration and its performance in a water phantom, it was found that a hyperthermal beam could have the best results. Several materials such as graphite, heavy water, and acrylic of different thickness were considered for the thermalization of the original epithermal beam, and to finally achieve the required neutron spectrum and beam
149

IAEA-CN-100/22P
intensity. A selection was made for an acrylic cylindrical block of 62 cm in diameter and 3 cm thick, arranged in several pieces —as in a puzzle— so that it could be easily removed [2].
The beam port configuration of the BNCT facility is shown in Figure 1. The array of the selected materials provides the desired beam tuning, collimation as well as shielding outside the beam.
FIG. 1. Scaled, schematic representation of the BNCT facility showing the main components of the beam port.
The protocol that is due to be implemented at CNEA involves melanomas of extremities —peripheral melanomas. Since the cylindrical phantom represents a suitable approximation for most of the extremities (legs, arms, etc), this system was selected as the reference for performing measurements.
Neutron flux measurements were performed by foil activation, using the well-known cadmium difference method, and the paired ionization chambers technique. Bare and Cd-covered gold wires were activated in an acrylic holder along the central axis of the water phantom. Their activities were determined by using an HPGe gamma spectrometer. The thermal (0 - 0.5 eV) neutron cross section and the cadmium factor were obtained through detailed neutron transport calculations by the Monte Carlo MCNP4C code.
The ionization chambers used were thimble-shaped, with 0.1 cm3 active volume, manufactured by Far West Technology. The highest neutron sensitive chamber was a tissue equivalent chamber, IC-18 model, flushed with methane-based tissue equivalent gas. The other chamber was a graphite, IC-18G model, flushed with carbon dioxide. Both chambers were polarized with a 250 DCV batteries array. Details about the determination of the sensitivity parameters of both ionization chambers have been already reported.
Beam dosimetry results have been confirmed through a world-wide project of dosimetry intercomparison performed throughout the different stages of the beam development.
The thermal neutron flux and the doses rate profiles, measured along the central beam axis are shown in Figures 2(a)-2(c).
150

IAEA-CN-100/22P
FIG. 2. Physical dosimetry along the central beam axis of the RA-6 beam. Comparisons
between measurement and simulation results. (a) Thermal neutron flux vs. depth in phantom. (b)-(c) Fast neutron and total gamma absorbed dose rate profiles specified for muscle tissue vs. depth in phantom.
Uncertainties in the thermal flux have a nearly constant relative value of 7%, mainly due to detector cross-section and other statistical contributions. The present data show a shallow thermal flux maximum, present in the first centimetre from the phantom external wall. This result is consistent with the hyperthermal spectral energy characteristic of the beam.
The relative uncertainties reported for the gamma dose rate are about 5%. The measured profile results from the incoming gamma field (beam contamination) superimposed to an inner source, associated to thermal neutron capture in hydrogenous media.
The uncertainties derived for the fast neutron dose rate are about 25% in the first points. This is fully compatible with similar measurements reported elsewhere. The fast neutron dose rate profile shows the usual exponential decay behaviour in relation with the moderation of fast neutrons in the media.
In order to determine the characteristics of the neutron beam either for reactor source modelling or for the reference physical dosimetry, a series of coupled computations and measurements were performed using MCNP4C radiation transport code, and standard phantoms and measurement methods. The following subsections thoroughly describe the particle source modelling and assessment, and present the system and methods used to perform the beam physical dosimetry and the calibration of the treatment planning system.
151

IAEA-CN-100/22P
3. Beam modelling and computational dosimetry
3.1. RA-6 source modelling and assessment The surface source definition needed to represent in a simple and efficient manner the RA-6 NCT beam so that it can be used in the treatment planning code was obtained by using the MCNP4C transport code, along with a complete and detailed representation of the NCT facility; in such a way that a track-by-track source was obtained at the port’s external surface.
A simple set of software was developed to discretize energy, direction and space in order to attain average values for neutron and photon intensity in the selected intervals, defining two spatial, angular and energy coupled distributions to represent the neutrons and the photons coming out the beam.
Then, the results obtained by using the distribution sources were compared to those deriving from an experimental dosimetry performed in the same phantom. The distribution source was modified in order to achieve a better agreement between measured and calculated dose distributions.
3.2. Computational dosimetry 3.2.1. Treatment planning system calibration
The integration of the experimental dosimetry into the treatment planning system (TPS) implies the determination of normalization factors. These factors are linear adjustments to the computed profiles that provide a better absolute agreement with physical measurements. Although the particle source used in the treatment planning system (discretized distributions) has been previously normalized to reproduce the actual dosimetry, small adjustments could also be necessary due to the effects of the geometry modeling technique of TPS.
The calibration system used to measure both thermal neutron flux and dose rate components is a water-filled cylindrical phantom. NCTPlan v. 1.2 treatment planning system was used to simulate the RA-6 experimental dosimetry. By default NCTPlan considers four material types —air, normal tissue, tumour and bone. Although normal tissue and tumour material types are considered as two distinct materials, they are assumed to have the same elemental composition but a different 10B concentration.
To simulate the physics of the problem as closely as possible in terms of particle transport, normal tissue and bone elemental compositions were assigned water and acrylic compositions, respectively. Now given that muscle tissue stands out in cases of peripheral melanoma, both gamma and fast neutron absorbed dose rates were referred to adult muscle tissue.
Figures 2(a)-2(c) show comparisons between the results of the physical measurements along the central beam axis in the calibration phantom and the results obtained by simulation. All simulation data explicitly include statistical uncertainties but since calculations were run with 10 million particle histories, they amounted to less than 1% and became imperceptible. Figure 2(a) shows that most of the calculation data agree with measured values within the deviation errors. Both curve shapes matched to a great extent and only at large depths (from 3 cm upwards) did calculated values slightly overestimate measurements. Figures 2(b)-2(c) reveal that the agreement for both dose components is excellent within the estimated accuracy of the measured data.
Scaling factors are linear adjustments to the computed profiles that provide a better absolute agreement with physical measurements. As this absolute agreement for both dose rate components is excellent, there is no need to define scaling factors, or, in other words, the scaling factors are equal to one. The thermal flux-scaling factor was also set to one for two reasons. Firstly, the melanoma cases to be treated are shallow tumours (2 to 3 centimetres in
152

IAEA-CN-100/22P
depth) and it is exactly in this region that agreement is excellent. Secondly, even though the computed values had slightly overestimated measurements from under 3 centimetres in depth, it was not considered essential for them to match since computed values had overestimated the measured ones. Thus, calculations will always provide a conservative estimation of the dose delivered to the patient.
3.2.2. Theoretical analysis of the RA-6 beam
A complete treatment planning for a melanoma human subject was performed to show the theoretical performance of the RA-6 beam [3]. The subject of this study was an adult female with a malignant melanoma on the external face of her left leg.
After an initial evaluation of the clinical case, a CT study of the patient’s extremity was performed. The palpable extension of the lesion was delimited by means of a set of fiducial markers, which also served as references for outlining the Clinical Target Volume (CTV) and patient positioning. The CTV was defined by adding a margin of 0.5 cm to the Gross Tumour Volume (GTV).
The treatment planning system, NCT Plan, was used for the generation of the multi-material model that represents the geometry and materials needed for the neutron and gamma transport calculations performed by the Monte Carlo code MCNP. In addition to the material description, the beam orientation, the source definition and flux-to-kerma conversion factors are also included in the preparation of the MCNP input.
The equivalent dose rate distribution is calculated weighting each component of the absorbed dose rates (structural and induced gammas, thermal and fast neutrons and 10B capture reactions) with a set of biological effectiveness factors and 10B concentrations in normal tissue and tumour. RBE and CBE weighting factors assumed for normal skin are: 1, 3, 3 and 2.5, for photons, thermal neutrons, fast neutrons and boron reaction. For cutaneous melanoma those are 1, 3, 3 and 3.8 respectively. The value of ∼16.5 RBE Gy was adopted as the tolerance dose for skin and the value of 24 RBE Gy was adopted as the dose assumed for obtaining 90% of tumour control probability. Figure 3 shows cumulative DVHs, both for normal and tumour tissues. Figure 4 shows the percentage of tumour volume below 24 RBE Gy as well as the minimum dose to tumour, as a function of boron concentration in blood.
FIG. 3. Normal and tumour cumulative DVHs
153

IAEA-CN-100/22P
FIG. 4. Percentage of under-dosed tumour volume (left y-axis) and minimum dose to tumor
(right y-axis), as a function of blood boron concentration. 4. In vivo experiments
4.1. Hamster cheek pouch model Given that the hamster cheek pouch is the most widely accepted model of oral cancer, in vivo experiments were performed in order to assess the response of hamster cheek pouch tumours, precancerous tissue and normal tissue to BPA-mediated BNCT employing the thermalized epithermal beam of the RA-6 Reactor at the Bariloche Atomic Centre.
The everted pouch and, inevitably, part of the head, were placed at the beam port. The rest of the body was shielded by the lead and borated polyethylene that makes up the beam delimiter. Irradiations lasted 62 min, resulting in an average fluence of thermal neutrons for tumour and healthy tissue at the position of the pouch of 1.1 ± 0.1 x 10¹² n/cm2. Boron content values for dose calculations were determined by a previous bio-distribution and pharmacokinetic study of BPA in this model, and were assumed to be 30 ppm in tumour and 10 ppm in normal tissue. The gamma and the fast neutron dose were measured using the paired ion chambers technique and the thermal neutron fluence was determined by gold wire measurements.
Assuming, as weighting factors for each dose component, an RBE value of 3.2 for fast neutrons and induced protons; a CBE factor of 2.5 for Boron component in normal pouch tissue, a CBE factor of 3.8 for the Boron component in pouch tumour, tumour, and an RBE value of 1 for photons, total tumour dose was estimated to be 14.9 Gy-eq. and total normal pouch dose was estimated to be 7.5 Gy-eq.
BNCT leads to complete remission by 15 days post-treatment in 78% of tumours and partial remission in a further 13% of tumours with virtually no damage to normal tissue [4].
4.2. UTC mice model The nude mice model closely resembles the behaviour of undifferentiated thyroid carcinoma, which occurs in human beings. The animals were implanted in their lower back with human UTC ARO cells, and were irradiated with the hyperthermal neutron beam. Irradiations were carried out at a reactor power of 400 KW, lasting 62 minutes. Boron content values were determined in a previous bio-distribution study of BPA in this model and were assumed to be 15.1 ppm and 21.0 ppm in tumor at two different doses, 350 and 600 mg/kg body weight. The ratio tumour/skin was 3. Irradiations were performed in groups of 8 mice placed on a mobile plate against the port’s external shielding, symmetrical respect to the beam central axis and
154

IAEA-CN-100/22P
with their rear exposed in a peripheral position of the raw beam (tumours were placed 7 cm from beam’s centre), while their body and head were shielded by the port.
The animals were distributed into four groups: Control, NCT (no BPA), BNCT #1 (350 mg/kg b.w. BPA) and BNCT#2 (600 mg/kg b.w. BPA). For the BNCT groups, physical doses of 4.3 and 4.8 Gy in tumour were achieved, while the highest physical dose to normal tissue was 2.8 Gy.
According to the experimental results [5], it may be concluded that, in all animals of group 4 (600 mg BPA/kg b.w, irradiation), regardless of the initial tumour volume, a 100% control of tumour growth was obtained at least during the first 30 days of follow-up. Also, when the initial volume of the tumour was 50 mm3 or less a complete regression (. i.e.: disappearance) of the tumours was observed in 50% of the mice, regardless of the BPA dose.
5. Conclusions The RA-6 reactor BNCT facility has been set up and characterized; and its performance for the treatment of peripheral melanomas has been theoretically evaluated.
The results of this theoretical analysis suggest that this BNCT facility is prepared to rigorously explore the clinical efficacy of the RA-6 beam and the BNCT treatment modality for peripheral melanomas.
The hyperthermal beam has also been successfully proved to be suitable for in vivo experiments with small animals like hamsters and mice in order to analyze the potential of BNCT for the treatment of oral cancer in the hamster cheek pouch model and undifferentiated thyroid carcinoma.
REFERENCES [1] BLAUMANN, H. et al. “NCT Facility Development at the RA-6 Reactor”. Eighth
International Symposium on Neutron Capture Therapy for Cancer, 1998, La Jolla, USA.
[2] CALZETTA LARRIEU, O., BLAUMANN, H., LONGHINO, J., “RA-6 Reactor Mixed Beam Design and Performance for NCT Trials,” in Proceedings of the Tenth International Congress on Neutron Capture Therapy, edited by W. Sauerwein, R. Moss and A. Wittig (Monduzzi Editore, International Proceedings Division, Bologna, 2002), pp. 155-158
[3] BLAUMANN, H.R., GONZÁLEZ, S.J., LONGHINO, J., SANTA CRUZ, G.A., CALZETTA LARRIEU, O.A., BONOMI, M.R., ROTH, B.M.C., “Boron neutron capture therapy of skin melanomas at the RA-6 reactor: a procedural approach to beam set up and performance evaluation for upcoming clinical trials”; accepted and to be published by Medical Physics.
[4] KREIMANN, E.L., ITOIZ, M.E., LONGHINO, J., BLAUMANN, H., CALZETTA, O., SCHWINT, A.E., “Boron Neutron Capture Therapy for the Treatment of Oral Cancer in the Hamster Cheek Pouch Model”; Cancer Research (Advances in Brief) 61: 8638-8642, 2001.
[5] DAGROSA, M.A., VIAGGI, M., LONGHINO, J., CALZETTA, O., CABRINI, R.L., EDREIRA, M., JUVENAL, G.J., PISAREV, M.A., “Experimental Application of Boron Neutron Capture Therapy (BNCT) to undifferentiated thyroid carcinoma (UTC)”; accepted and to be published by Int. J. of Radiat. Oncol. Biol. Physic.
155

IAEA-CN-100/38P
Approach to Development of a High Flux Research Reactor with Pebble-Bed Core A. Mikhalevich, V. Kazazyan, D. Zhvirblya Joint Institute of Power and Nuclear Research - «SOSNY» National Academy of Sciences of Belarus, Minsk, Belarus
Abstract. At the Joint Institute of Power and Nuclear Research SOSNY, investigations have been carried out on the feasibility of a research reactor with pebble-bed core. The technical approach, physical calculation of the core, configurations considered and results obtained are described. It was concluded that for reaching maximum thermal neutron flux, frequent refuelling - in one or two days - would be required which could be achieved through hydro transportation of micro fuel elements.
1. Introduction A nuclear research reactor of a basin-type IRT with the designed power of 1 MW had been put into operation in 1962 at the «Sosny» settlement located not far from the city of Minsk in the Republic of Belarus. After its modernization in 1971, the power was increased to 4 MW and the maximum density of neutron flux in the core was 5⋅1013 n/cm2⋅and 2⋅1013 n/cm2⋅s, for thermal and fast (E>0.8 MeV) respectively. The reactor had been used for carrying out investigations in the field of solid-state physics, radiation construction materials, radiobiology, gaseous chemically reacting coolants and others. After the Chernobyl NPP accident, in the former USSR the requirements on safety of nuclear reactors have sufficiently become more strict. As to some parameters these requirements became the same as for reactors of nuclear power plants. In this connection the reactor at «Sosny» settlement could not comply with the new requirements by a number of performances such as seismicity of building, efficiency of control and protection system, corrosion in the reactor vessel and others. Therefore, it was shutdown in 1987 and its decommissioning was performed during 1988-1999.
Last time the need in creation of a stationary source of thermal neutrons with the increased intensity appeared for carrying out material construction, biological and fundamental physical research and isotope production. The main requirements to such source are `the following:
fluxes of thermal neutrons are not lower than (5÷10) 1015 n/cm2⋅s; the value of an experimental volume is by the order of 100 l; a high accessibility to the experimental volume; minimum «contamination» of the experimental space with fast neutrons and γ-irradiation.
The considered concept of high flux research reactor with pebble-bed core is based on technical approaches known by publications [1, 2] and supposes:
application of microfuel spheres brought to an industrial level with the diameter of 500-750 µm as fuel;
organization of reactor operation in the regime with 235U minimum possible loading; implementation of hydraulic loading-unloading of microfuel spheres conducting with the
frequency of one or several days.
156

IAEA-CN-100/38P
Due to favourable relation between heat exchange surface and the volume of microfuel spheres a high power density in the core is reached, what allows sizes and mass of the reactor to be decreased. Thus, when using microfuel spheres with the diameter of approximately 0.5 mm the surface of heat exchange can be obtained of about 100 cm2 per 1 cm3 of charging. A small temperature drop in the volume of microfuel spheres increases its resistance to a thermal impact and fatigue stresses. The reactor can quickly put into operation and also quickly put out of operation without undesirable consequences connected with thermocycling effects. In the reactor with microfuel spheres in comparison with industrial power of the of the same density reactor with rod fuel elements, the reserve as to overheating considerably increases. Duration of fuel overheating of the core which can be executed with hydro- or pneumo transportation of fuel elements without removing the reactor’s cover is sufficiently decreased. Because of the simplicity of the construction the decreasing of manufacture cost of stock core can be supposed. Unification of fuel elements for plant of various power is possible.
The results of themohydraulic experiments with direct water cooling of microfuel elements are presented in work [3]. These results confirm the fact that water is the carrier capable to provide with cooling of thin layers of microfuel elements of high power density. In this connection in a number of publications the using of thin charging of microfuel elements with power density of 10 MW/l cooled by pressure water was suggested [1, 4].
Microfuel element is a fuel bore core surrounded with multi-layer ceramic coating, with definite functions of each layer. The size of microfuel element varies from several hundred of microns to several millimeter. Two configurations of the pebble-bed core in the high flux reactor have been considered. The first configuration, K-1, is an annular charging of microfuel elements, placed between two cylindrical coaxial lattices. Their punch rate is 50%. Cooling of fuel layer is performed by radial flow of the D2O coolant. K-1 configuration is presented in Fig.1. Application of Be or D2O was considered as the material of the centre zone. Porosity of beryllium insertion is 10% and has been chosen because of the necessity to have the channels for irradiation of experimental samples in the trap zone of neutrons and likely placing of operating organs of CPS. Parameters for K-1 configuration are given in Table 1.
FIG. 1. High flux reactor with annular fuel layer (configuration K-1):
1 - layer of microfuel elements; 2 - distribution channel; 3 - removal channel; 4, 5 - likely places for location of control rods of control and protection system (CPS).
157
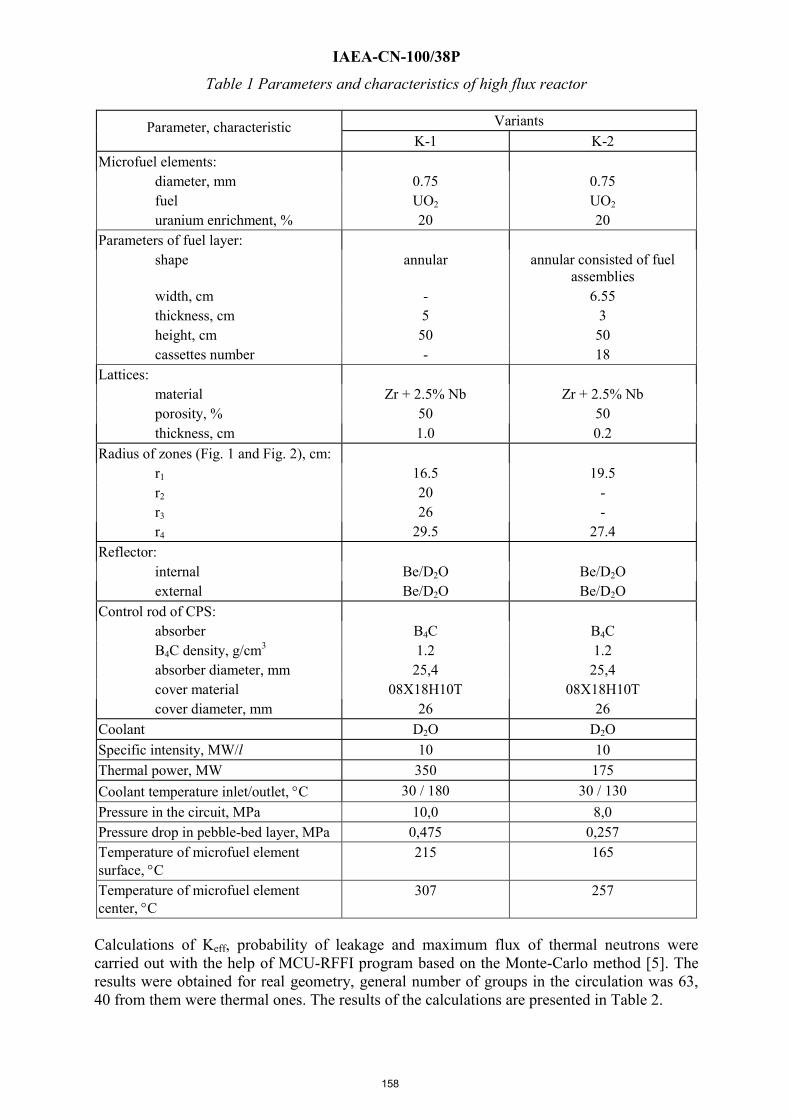
IAEA-CN-100/38P
Table 1 Parameters and characteristics of high flux reactor
Variants Parameter, characteristic K-1 K-2
Microfuel elements: diameter, mm 0.75 0.75 fuel UO2 UO2 uranium enrichment, % 20 20
Parameters of fuel layer: shape annular annular consisted of fuel
assemblies width, cm - 6.55 thickness, cm 5 3 height, cm 50 50 cassettes number - 18
Lattices: material Zr + 2.5% Nb Zr + 2.5% Nb porosity, % 50 50 thickness, cm 1.0 0.2
Radius of zones (Fig. 1 and Fig. 2), cm: r1 16.5 19.5 r2 20 - r3 26 - r4 29.5 27.4
Reflector: internal Be/D2O Be/D2O external Be/D2O Be/D2O
Control rod of CPS: absorber B4C B4C B4C density, g/cm3 1.2 1.2 absorber diameter, mm 25,4 25,4 cover material 08X18H10T 08X18H10T cover diameter, mm 26 26
Coolant D2O D2O Specific intensity, MW/l 10 10 Thermal power, MW 350 175 Coolant temperature inlet/outlet, °C 30 / 180 30 / 130 Pressure in the circuit, MPa 10,0 8,0 Pressure drop in pebble-bed layer, MPa 0,475 0,257 Temperature of microfuel element surface, °C
215 165
Temperature of microfuel element center, °C
307 257
Calculations of Keff, probability of leakage and maximum flux of thermal neutrons were carried out with the help of MCU-RFFI program based on the Monte-Carlo method [5]. The results were obtained for real geometry, general number of groups in the circulation was 63, 40 from them were thermal ones. The results of the calculations are presented in Table 2.
158

IAEA-CN-100/38P
Radial distribution of flux density of thermal neutrons was calculated by multi-group diffusion program KRATER [6] with preliminary preparedness of constants by RYTHM program [7]. Normalization was carried out to the value of absolute maximum flux of thermal neutrons in the trap, obtained by MCU-RFFI program. Radial profile of flux density of thermal neutrons for K-1 configuration is presented in Fig. 2-4. As is it seen in Fig. 2-4 and Table 2 the value of peaking of thermal neutrons flux in the trap depends on 235U loading to a great extent, because under high loading thermal neutrons flux sufficiently decreases both in fuel layer, and in the surrounding moderator (internal and external). In the case when heavy water is used as internal and external reflector, maximum flux of thermal neutrons in the trap under loading decreasing from 10 kg 235U (Keff=1.153) to 2 kg (Keff=0.997) is increased by 1.7 folds. When applying Be as internal and external reflector critical loading of 235U increases due to larger absorption of thermal neutrons by beryllium. In this case under loading decreasing from 10 kg 235U (Keff=1.933) to 3 kg (Keff=1.006) somewhat less increasing of maximum flux of thermal neutrons is respectively observed (by 1.35 folds). Investigations carried out for K-1 configuration showed that the largest flux of thermal neutrons in the trap is reached when applying Be as internal and external reflector. In the variant with Be reflector (internal and external) under 235U loading close to critical one and equal 3 kg (Keff=1.006) maximum flux of thermal neutrons is 2.1 x 10¹⁶ n/cm2⋅s. Advantages of Be as material of reflector from the point of view of formation of thermal neutrons maximum flux in the trap give rise to decreasing of neutron leakage by 10% and contribution of (n, 2n) reaction on Be.
Table 2 Values of Keff and flux density of thermal neutrons in the trap for configuration K-1 depending on 235U loading and material of reflectors
235U loading, kg Keff Leakage
probability
maxtF ⋅10-16 , n⋅cm-2⋅s-1
Reflectors: internal - external
0,9967(9) 0,371 1,81 D2O-D2O 2 0,9584(9) 0,378 2,28 Be-D2O 1,0563(8) 0,346 1,53 D2O-D2O 1,0181(8) 0,355 1,94 Be-D2O 3 1,0060(8) 0,302 2,11 Be-Be 1,1072(7) 0,322 1,28 D2O-D2O 1,0691(7) 0,330 1,69 Be-D2O 5 1,0541(7) 0,284 1,84 Be-Be 1,1319(8) 0,308 1,16 D2O-D2O 1,0956(9) 0,316 1,56 Be-D2O 7 1,0739(6) 0,274 1,71 Be-Be 1,1532(8) 0,295 1,06 D2O-D2O 1,1165(6) 0,304 1,41 Be-D2O 10 1,0934(6) 0,265 1,57 Be-Be
When the high flux reactor operates in the regime with low loading, it has the following advantages:
1) sufficiently small non-uniformity of power in fuel layer; 2) absence of compensation necessity in considerable reactivity reserve.
159
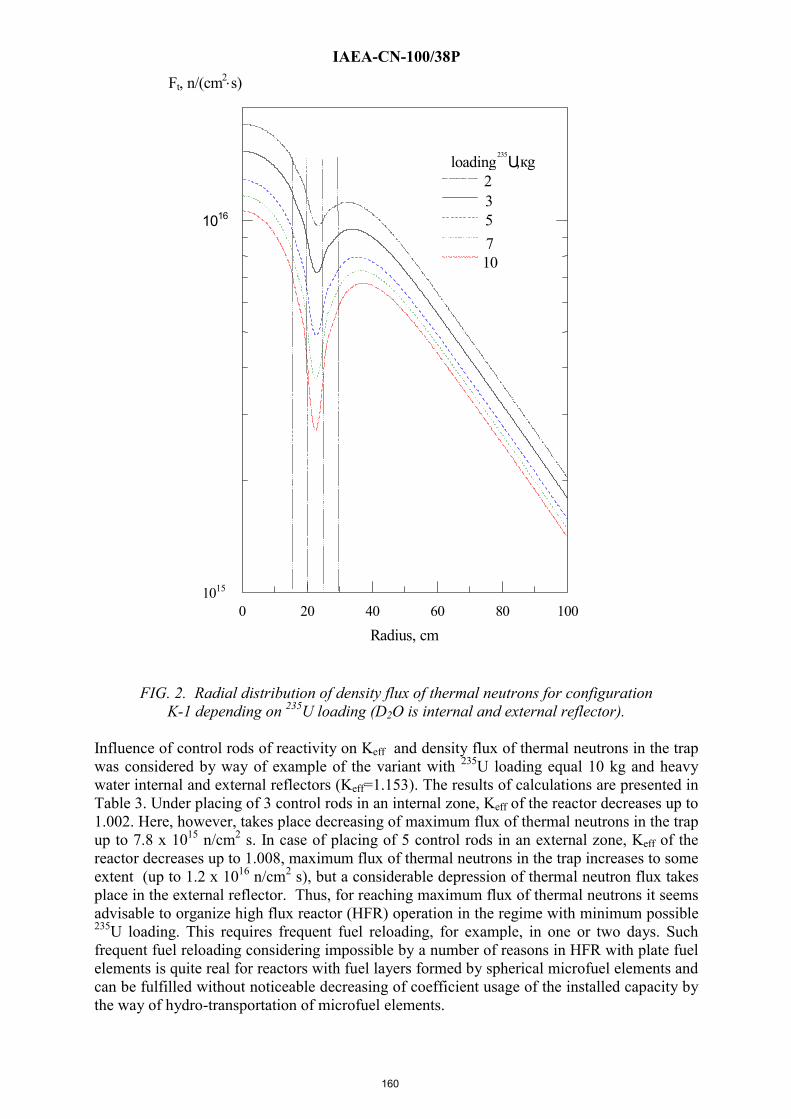
IAEA-CN-100/38P
FIG. 2. Radial distribution of density flux of thermal neutrons for configuration
K-1 depending on 235U loading (D2O is internal and external reflector). Influence of control rods of reactivity on Keff and density flux of thermal neutrons in the trap was considered by way of example of the variant with 235U loading equal 10 kg and heavy water internal and external reflectors (Keff=1.153). The results of calculations are presented in Table 3. Under placing of 3 control rods in an internal zone, Keff of the reactor decreases up to 1.002. Here, however, takes place decreasing of maximum flux of thermal neutrons in the trap up to 7.8 x 10¹⁵ n/cm2 s. In case of placing of 5 control rods in an external zone, Keff of the reactor decreases up to 1.008, maximum flux of thermal neutrons in the trap increases to some extent (up to 1.2 x 10¹⁶ n/cm2 s), but a considerable depression of thermal neutron flux takes place in the external reflector. Thus, for reaching maximum flux of thermal neutrons it seems advisable to organize high flux reactor (HFR) operation in the regime with minimum possible 235U loading. This requires frequent fuel reloading, for example, in one or two days. Such frequent fuel reloading considering impossible by a number of reasons in HFR with plate fuel elements is quite real for reactors with fuel layers formed by spherical microfuel elements and can be fulfilled without noticeable decreasing of coefficient usage of the installed capacity by the way of hydro-transportation of microfuel elements.
Ft, n/(cm2⋅s)
0 20 40 60 80 1001015
1016
loading235U,кg
10
532
7
Radius, cm
160

IAEA-CN-100/38P
FIG. 3. Radial distribution of flux density of thermal neutrons for configuration K-1 depending on 235U loading (Be is internal reflector, and D2O is external one)
The considered configuration K-1 of high flux reactor is not optimum and has some drawbacks, hardly to overcome:
1) annular fuel layer is supposed to have the corresponding annular cylindrical vessel, which form distribution and removal channels of the coolant and being under high pressure. Such design makes difficult both removal of neutrons bundles, and the access to the region of of maximum flux of thermal neutrons;
2) hydraulic loading-unloading of microfuel elements out from annular volume is difficult to be carried out in comparison with alternative configurations being more simple in geometry.
Ft, n/(cm2⋅s)
Be D2O
0 20 40 60 80 1001015
1016 7
Loading 235U,kg3
5
10
Radius, cm
161

IAEA-CN-100/38P
FIG. 4. Radial distribution of flux density of thermal neutrons for configuration
K-1 depending on 235U loading (Be is internal and external reflector)
Fig. 5 presents the second configuration of high flux reactor, configuration K-2. Here, microfuel elements are placed in separate fuel assemblies. Each fuel assembly is a tube ∅ 81.3x2 mm made of Zr-Nb alloy, containing inside microfuel elements charging in the volume, formed by edges of rectangular parallelepiped. The thickness of walls of the parallelepiped is 2 mm, material is Zr+2.5%Nb. Parallelepiped walls adjoining to distribution and removal channels are punched and form lattices for coolant running. The coolant (D2O) under the pressure is conveyed to distribution channel, then, being filtered, it conveys through charging of microfuel elements and lattices, and leaves fuel assemblies through removal channel.
Ft, n/(cm2⋅s)
Be Be D2O
0 20 40 60 80 100
1015
101610753
Loading 235U, kg
Radius, cm
162

IAEA-CN-100/38P
Table 3 Influence of control rods of reactivity on Keff and flux density of thermal neutrons in the trap for K-1 configuration (235U loading is 10 kg, D2O is internal and external reflector)
Number of control rods in
internal band ( r = 12,4 cm)
Number of control rods in
external band ( r = 32.6 cm)
Keff Leakage
probability
maxtF ⋅10-16 , n⋅cm-2 s-1
2 – 1,0460(6) 0,285 0,88 3 – 1,0021(9) 0,280 0,78 – 4 1,0360(10) 0,254 1,16 – 5 1,0084(9) 0,245 1,19 – 6 0,9828(10) 0,2372 1,23
Fuel assemblies are arranged in a circuit, forming discontinuous fuel layer in cross-section. The core is located in the reservoir filled in with D2O with low temperature and pressure. Parameters for K-2 configuration are presented in Table 1. Calculations of Keff, leakage probability and maximum flux of thermal neutrons were carried out by MCU-RFFI program for real geometry.
Values of Keff, average density of thermal neutrons flux in fuel layer and maximum flux of thermal neutrons in the trap for several variants of K-2 configuration are presented in Table 4. The diameter of neutron trap was chosen for K-2 configuration equal 39 cm, and the thickness of fuel layer in the fuel assembly was 3 cm. In variant K-2g the fuel assembly of the same diameter was considered, but with larger thickness of fuel layer. Its dimensions in cross-section are following: thickness is 5 cm, width is 5.14 cm. K-2c variant is the variant of K-2b calculated in homogeneous approximation. Homogenizing in this case is essentially reduced to transformation of K-2 configuration to K-1 configuration.
FIG. 5. Fuel assembly layout of annular fuel layer of high flux reactor (K-2 configuration): 1 - fuel assembly with microfuel elements layer; 2 - distribution channel; 3 - removal channel; 4, 5 - likely places for location of control rods of CPS. When carrying out homogenizing the radius of neutron trap, equivalent radii of fuel layer and its thickness, the balance of fission and construction materials were remained as the former one. Here, lattices which form fuel layer in each cassette were transformed into cylindrical
163

IAEA-CN-100/38P
coaxial lattices of annual fuel layer, and tube walls of each fuel assembly were transformed into cylindrical coaxial walls forming distribution and removal channels of the coolant. Table 4. Values of Keff , average flux density of thermal neutrons in fuel layer and maximum flux of thermal neutrons in the trap for K-2 configuration depending on 235U loading Index of variant
235U loading, kg
Keff
Leakage probability tF ⋅10-15 ,
n⋅cm-2 s-1
maxtF ⋅10-16 , n⋅cm-2 s-1
Reflectors: internal - external
K-2a 1,0 0,9496(11) 0,442 5,5 1,34 D2O-D2O K-2b 1,5 1,0341(8) 0,405 3,7 1,07 D2O-D2O K-2c 1,5 1,0252(8) 0,410 4,7 1.34 D2O-D2O K-2d 1,5 0,9605(10) 0,354 3,7 1.51 Be-Be K-2e 2,0 1,0046(10) 0,339 2,8 1,37 Be-Be K-2f 2,5 1,1148(12) 0,368 2,2 0,86 D2O-D2O K-2g 2,5 1,1295(8) 0,361 2,9 1.07 D2O-D2O
Comparison of K-2b and K-2c variants gives the possibility to estimate the transition effect from annular fuel layer (K-1 configuration) to fuel assembly layout of annular fuel layer (K-2 configuration). Transition to fuel assembly layout of annular fuel layer, as it is seen in Table 4, results, in the case specified, in decreasing of maximum flux of thermal neutrons in the trap approximately by 20%. It explains by the fact that at fuel assembly layout of fuel layer the surface increases through which neutrons from the reflector can leak into fuel layer, and, consequently, reflectors have much more influence on formation of neutron spectrum in fuel layer. This results in softening of the neutron spectrum, and respectively, decreasing of average flux of thermal neutrons in fuel layer by approximately 21%, that, in the final analysis, is unfavourable when forming maximum flux of thermal neutrons in the trap.
3. Conclusion Two configurations of pebble-bed core of a high flux reactor have been considered. Fuel spheres with the diameter of ≈750 mm have been used in both cases, their production technology has been brought to commercial level. The first configuration is the core with the neutron trap and annular fuel layer formed by charging of micro fuel elements, in the second configuration the annular fuel layer is formed by cylindrical fuel assemblies containing inside one section charging of rectangular shape. The results obtained showed that the flux of thermal neutrons of 1±2⋅1016 n/cm2⋅s can be reached when using Be or D2O as internal and external reflectors, and when organizing heat removal by D2O circulation. Here, the average power density in the fuel layer must be 10 MW/l, what seems to be possible and is confirmed by thermal and hydraulic calculations and experimental data presented elsewhere [3].
For attainment of maximum fluxes of thermal neutrons it is necessary to organize HFR operation in the regime with minimum possible loading of 235U and, respectively, with a frequency of fuel reloading in one or two days. Such frequent fuel reloading is impossible, due to some reasons, in HFR with plate fuel elements, but can be implemented in reactors with sphere elements without noticeable decreasing of a load factor by the hydro transportation of micro fuel elements.
164

IAEA-CN-100/38P
REFERENCES [1] POWELL, J.R., TAKAHASHI, H., HORN, F.L.; High Flux Reactors Based on
Particulate Fuel, Nucl. Instr. and Meth. in Physics Research A249 (1986) 66-76.
[2] KATSCHER, W.; Nucl. Technologie. 35(1977)557.
[3] POWELL, J.R.; TAKAHASHI, H.; Very High Flux Research Reactors Based on Particle Fuels, Presented at IAEA, Germany, BNL−35633 (1985).
[4] BELYAVSKY, YA.D.; ZHIRBLYA, D.I.; LITVINENKO, B.A.; High flux research reactor of pebble-bed type with partial fuel reloading, Vestsi AN BSSR. Ser. phys.-energ. navuk. No 1 (1990) 3-8 (in Russian).
[5] GOMIN, E.A.; GUREVICH, M.I.; MAJOROV, L.V.; MARIN, S.V.; Description of Application and Specification for Users of MCU-RFFI Program for Calculation by Monte-Carlo Method of Neutron and Physical Characteristics of Nuclear Reactors, Moscow (1994), 63p. − (Preprint/Inst. atomnoj energii; IAE-5837/5) (in Russian).
[6] RUBIN, I.E.; DNEPROVSKAYA, N.M.; LITVINENKO, B.A.; TETEREVA, N.A.; Program Complex Krater for Calculation of Neutron and Physical Characteristics of Thermal Nuclear Reactors, Minsk (1996) 39 p. (Preprint, Inst. of Power Engineering Problems NANB, IPEP−14) (in Russian).
[7] RUBIN, I.E.; MATVEENOK, K.K.; PUSTOSHILOVA, V.S.; TYUSHKEVICH, I.F.; Program of Multigroup Calculation of Heterogeneous Reactor Cells in the Whole Region of Energies by Albedo Method (RYTHM), Physics of nuclear reactors on dissociating coolant, Minsk (1984), 69-74 (in Russian).
165

IAEA-CN-100/49P
Thermal-Hydraulic Design of a Fuel Mini-Plate Irradiator for the IEA-R1 Research Reactor W.M. Torres, P.E. Umbehaun, D.A. Andrade, M. Yamaguchi, J.A.B. Souza Instituto de Pesquisas Energéticas e Nucleares (IPEN), Centro de Engenharia Nuclear, Cidade Universitária, São Paulo, Brazil
Abstract. A mini-plate irradiator was designed for the IEA-R1 research reactor. A parametric study was carried out with a thermal-hydraulic model to obtain the minimum necessary flow rate through the mini-plates to remove the heat generated during the irradiation. The heat fluxes in the mini-plates were calculated using neutronic codes. An experimental procedure and tests were performed to obtain the geometric characteristics of a Flow Limiting Plate (FLP) to provide suitable flow rate through the mini-plates. The tests were performed in an experimental circuit and the results were used to build pressure drop versus flow rate curves (PD x Q). The desired geometry of the FLP was obtained when the irradiator pressure drop was the same to the fuel element pressure drop for the minimum necessary flow rate.
1. Introduction IPEN IEA-R1 is a 5 MW pool type research reactor, mainly used for radioisotope production for medical application. It uses MTR (Material Testing Reactors) fuel elements in the core and each fuel element has 18 fuel plates assembled on two lateral support plates, forming 17 independent flow channels. Usually, these fuel plates are made of U3O8 – Al or U3Si2 – Al in the meat and an Aluminium cladding. To produce fuel elements with better performance (high burn-up, high corrosion resistance, small swelling, etc.) it is necessary to know the behaviour of fuel plates after their irradiation in the reactor. Irradiation devices are used to irradiate mini-plates of fuel to provide material for post-irradiation studies. Mini-plates with different concentrations, enrichments, widths and types of fuel (U3O8 – Al or U3Si2 – Al) are irradiated during a planned period of time. After that, these mini-plates are removed and checked.
This work presents the thermal-hydraulic design of a device for mini-plates irradiation in the IEA-R1 reactor core. Calculations were performed to obtain the minimum flow rate necessary to cooling the mini-plates during the irradiation. Experiments were performed to define the geometric characteristics of a Flow Limiting Plate to assemble inside the irradiator to limit the flow rate to the calculated value in order to reduce the bypass flow rate from active reactor core.
2. Parametric and experimental studies A thermal-hydraulic model was developed by Umbehaun [1, 2]. This model was used to perform a parametric study to verify the behaviour of mini-plates surface temperature as a function of the parameters: a) flow rate through the irradiation device; b) active width of the mini-plates; c) irradiation position in the core; d) type of fissile material; and e) concentration of fissile material. The surface temperature limit is 95oC. The resulting equations of the model (unidimensional conduction and convection heat transfer equations for rectangular flow channels) were solved with EES (Engineering Equation Solver), the commercial software developed by Klein et al. [3]. The mini-plate heat generation depends on the irradiation position in the core and it is calculated using the CITATION [4] and LEOPARD [5] codes. Figures 1 and 2 show a drawing of the mini-plate irradiator and reactor core. Table 1 shows the results of the parametric study and the most critical condition of flow rate is highlighted.
166

IAEA-CN-100/49P
FLP - f low limiting p late outle t no zzle stand
fue l mini -pla tes
inte rmediate p late
V
FIG. 1. Mini-plate irradiator.
1 ∆P
2 DP
3 DP
4 DP
5 DP
6 DP
7 DP
8 SP
LEGEND
2 SP
SP
SP
SP
SP
SP
NS
R
∆P = core pressure drop measurement DP = double plug
3 R
SP
R
EIRA
R
MPI
R
R
SP = single plug NS = neutron source
4 EIS
EIS
R
EIRA
R
MPI
MPI
R
R = graphite reflector FE = fuel element
5 EIS
EIS
FE 153
FE 168
FE 156
FE 160
FE 150
R
CFE = control fuel element EIGRA´s = irradiators
6 R
EIGRA
I
FE 158
CFE 166
FE 169
CFE 180
FE 171
EIF
EIS = irradiator EIBE = irradiator
7 R
R
FE 164
FE 161
EIBE
FE 162
FE 163
R
GI = irradiator EIF = irradiator
8 R
EIGRA
II
FE 159
CFE 179
FE 170
CFE 167
FE 154
R
EIRA = irradiator MPI = Mini-Plate Irradiator Positions
9 R
R
FE 152
FE 155
FE 157
FE 165
FE 151
R
10 R
R
R
R
R
R
R
R
FIG. 2. IEA-R1 core components and mini-plate irradiator positions.
Table 1. Minimum flow rate to cooling the mini-plates.
active width (mm)
Core Position
U3O8-Al (3.0 gU/cm3)
Q min.(m3/s)/(m3/h)
U3Si2-Al (3.0 gU/cm3)
Q min.(m3/s)/(m3/h)
U3Si2-Al (4.8 gU/cm3)
Q min.(m3/s)/(m3/h)
20 36 1.06 x 10⁻³ / 3.8 1.44 x 10⁻³ / 5.2 2.03 x 10⁻³ / 7.3
20 47 1.97 x 10⁻³ / 7.1 2.00 x 10⁻³ / 7.2 2.83 x 10⁻³ / 10.2
20 46 2.42 x 10⁻³ / 8.7 2.42 x 10⁻³ / 8.7 3.42 x 10⁻³ / 12.3
40 36 1.42 x 10⁻³ / 5.1 1.42 x 10⁻³ / 5.1 1.94 x 10⁻³ / 7.0
40 47 1.97 x 10⁻³ / 7.1 1.94 x 10⁻³ / 7.0 2.69 x 10⁻³ / 9.7
40 46 2.42 x 10⁻³ / 8.7 2.42 x 10⁻³ / 8.7 3.33 x 10⁻³ / 12.0
167

IAEA-CN-100/49P
Experiments were performed to obtain the geometric characteristics of a Flow Limiting Plate (FLP) to be used in the irradiator. The main function of FLP is to provide a suitable flow rate to the mini-plates avoiding unnecessary bypass flow from active core. It was designed maintaining the same core pressure drop in the irradiator for the minimum flow rate (Q=3.42 x 10⁻³ m3/s). The core pressure drop (PD=7.35 kN/m2) was experimentally measured using an instrumented dummy fuel element for 3000 gpm (0.19 m3/s) total flow rate in the reactor primary system. Irradiator with mini-plates and FLP was assembled in a test section simulating the reactor pool of the experimental circuit shown in Fig. 3. All tested FLP´s are 16 mm thick. The flow rate through the irradiator was measured by a calibrated orifice plate and a differential pressure transducer (DPT), and the irradiator pressure drop was also measured by a DPT.
Eighteen irradiator configurations (A to R) were tested and the results are shown in Figs. 4 and 5. Considering a quadratic function between pressure drop and flow rate (PD = K x Q2), we can calculate the irradiator pressure drop coefficient K. Substituting PD and Q in the previous equation we obtain K = 6.3 x 10⁸. Figure 4 shows the irradiator pressure drop versus flow rate for all the tests. Figure 5 shows the K coefficient versus FLP flow area A and the fitted curve K = f (A). The FLP´s that produced the desired results were tested in configurations I (A= 981,19 mm2) and J (A=934.82 mm2 ; 9 holes of 11.5 mm). Substituting K = 6.3 x 10⁸ in the fitted curve we obtain A= 1040 mm2, corresponding to 9 holes of 12.0 mm, near to the FLP of J configuration. Figure 6 shows a photograph of the irradiation device with its internals.
pump
R1 reservoir
filters
orifice plate
DPT1
vent
2,5 m3
drain
V1
V2
V3
V7
V5 V6
V8
V9
V10
V12
V11
V4
P1
P2 P3
DPT2
DPT3
IRRADIATOR
P1 P2 P2 P3
Test Section
T thermocouple K type 1,5mm
mini-plates
FLP
FIG. 3. Experimental circuit used for tests.
168

IAEA-CN-100/49P
0.0 5.0 10.0 15.0 20.0 25.0
flow rate ( m / h )
2pr
essu
re d
rop
( N /
m )
run 1
run 2
run 3
run 4
run 5
run 6
run 7
run 8
run 9
run 10
run 11
run 12
run 13
run 14
run 15
run 16
run 17
run 18
flow rate ( m / s)
4000
8000
12000
16000
20000
0.00700 0.0014 0.0028 0.0042 0.0056
3
3
FIG. 4. Experimental results: pressure drop (PD) versus flow rate (Q).
0 500 1000 1500 2000 2500
FLP flow area - A ( mm )
0.0E+0
2.0E+9
4.0E+9
6.0E+9
2
3
2
irr
adia
tor p
ress
ure
drop
coe
ffici
ent K
[(N
/ m
) /
(m /
s )
]
14 -1.73 K (A) = 1.045 x 10 A
experimental
estimated (run B - 9 holes 6,5 mm)
6.3x10
1040 (~9 holes 12mm)
8
2
FIG. 5. Experimental results: pressure drop coefficient (K) versus FLP flow area (A).
169

IAEA-CN-100/49P
FIG. 6. Mini-plate irradiator with its internals.
3. Conclusions A thermal-hydraulic design of a mini-plate irradiator was performed. Flow rate requirements for cooling the mini-plates during the irradiation in the reactor core were obtained in a parametric study. The minimum flow rate required for the most critical irradiation condition is 3.42x10⁻³ m3/s (12.3 m3/h). Experiments were carried out to obtain the geometric characteristics of a flow limiting plate (FLP), so as to provide this minimum flow rate through the irradiator. This FLP has 9 holes of diameter 11.5 mm, corresponding to a flow area equal to 934.82 mm2. A curve relating pressure drop coefficient K and FLP flow area was obtained as a powerful tool to design other irradiators with different flow rate requirements.
REFERENCES [1] UMBEHAUN, P. E., Metodologia para Análise Termo-Hidráulica de Reatores de
Pesquisa Tipo Piscina com Combustível Tipo Placa, M. Sc. Thesis, IPEN – Instituto de Pesquisas Energéticas e Nucleares, São Paulo, Brasil (2000).
[2] UMBEHAUN, P.E., ANDRADE, D. A., YAMAGUCHI, M., Análise Neutrônica e Termo- Hidráulica do Elemento para Irradiação de Mini-Placas, IPEN – Instituto de Pesquisas Energéticas e Nucleares Internal Technical Report no. P&D.CENT.CENC.005.00 RELT.001.00, São Paulo, Brasil (2001).
[3] KLEIN,S. A., ALVARADO, F. L., EES - Engineering Equation Solver for Microsoft Windows Operating System, Version 4.334, Middleton, WI: F-Chart Software (1996).
[4] FLOWLER, T.B., VONDY, D.R., CUNNIGHAM, G.W., Nuclear Reactor Core Analisys Code: CITATION, ORNL-TM-2496 version 2, Oak Ridge National Laboratory (1971).
[5] KERR, W., KING, J.S., MARTIN, J.C., WEHE, D.K., The nuclear Ford reactor demonstration project goes the evaluation and analysis of low enrichment fuel – Final Report”, ANL/RERTR/TM-17, Argonne National Laboratory, Argonne (1991).
170

IAEA-CN-100/57P
Utilization of the IEA-R1 Reactor for DNA Irradiation M.R. Gual1, A. Deppman2, O.R. Hoyos1 , P.R.P.Coelho3, P.T.D.Siqueira3
1 Instituto Superior de Ciencias y Tecnologías Nucleares(ISCTN), C.Habana, Cuba 2 Instituto de Física, Universidad de Sao Paulo(IFUSP), Brasil 3 Instituto de Pesquisas Energéticas e Nucleares(IPEN-CNEN/SP), Brasil
Abstract. The beam hole #3(BH#3) of the IEA-R1 reactor of IPEN-CNEN, Sao Paulo will be designed for research in boron neutron capture therapy (BNCT). This facility will be used for study of radiation-induced DNA damage. The increasing knowledge of the cellular response to radiation damage has contributed for further improvements in radiation therapy. In order to reduce the gamma contamination and still have sufficiently high neutron fluxes for irradiation of DNA molecule, it will be necessary to place several neutron and gamma filters in the beam hole. The choice of the adequate filter arrangement was carried out with the Monte Carlo MCNP-4C code. The proposal is to irradiate DNA molecules with thermal, epithermal and fast neutron from the BNCT research facility at the IEA-R1m reactor. The first step is the selection of filter configurations, which will allow to irradiate the DNA sample with thermal, epithermal and fast neutrons. The results obtained from simulations are shown in this paper. 1. Introduction The increasing knowledge of the cellular response to radiation damage has contributed to further improvements in radiation therapy. It is important to improve the information about radiation-DNA interaction in order to achieve more secure and efficient cancer treatments by using radiation therapy. Nowadays, one important technique is the boron neutron capture therapy, where neutrons are used to initiate a nuclear reaction at the tumour site. The effects of the neutrons on the healthy tissue, however, must be better understood. The study of neutron-DNA interaction, in this scenario, is of great importance. Research reactors or accelerators can be used as a source of neutrons for DNA irradiation. The research facility for Boron Neutron Capture Therapy (BNCT) at the IEA-R1 Reactor of the IPEN-CNEN/SP [1] will be used for studying the neutron-induced DNA damage. At present, we are evaluating the characteristics of the neutron flux at the biological sample, and we are carrying out simulations of the experimental procedure through Monte Carlo N particle transport code system version 4C (MCNP-4C) [2] to find the experimental conditions necessary to minimize a gamma contamination, and also investigate possible experiments to verify the effects of those gammas on the DNA molecule. The first step is the selection of filter materials, which will allow us to irradiate the DNA sample with thermal, epithermal and fast neutrons. We present the results of our simulations, and describe the experimental set-up showing the best sets of materials necessary to obtain neutron spectra for different neutron energies. 2. Description of simulations. The research facility for Boron Neutron Capture Therapy (BNCT) at the IEA-R1 Reactor of the IPEN-CNEN/SP [2] is schematically shown in Fig. 1.
171

IAEA-CN-100/57P
FIG. 1. Schematic view of the research facility.
In order to reduce the gamma contamination during neutron irradiation was placed some filter material in the beam hole. The first step is the selection of filter material, which will allow us to irradiate the DNA sample with thermal, epithermal and fast neutrons and minimum gamma contamination. These included aluminium (Al), bismuth (Bi), lead (Pb), polyethylene (Poly), graphite (G) and cadmium (Cd). The choice of the adequate filter arrangement was carried out with the Monte Carlo MCNP-4C code.
To irradiate the DNA molecule we projected and constructed a support for the DNA samples. This is done controlling the position of a sample porter. The sample-carrier support consists of a section of a half-tube that is attached to two aluminium disks. The sample support is placed in this beam hole and fixed with screws at different locations as can be observed in Fig. 2. The Fig. 3 shows the facility computational modelling but through a plane perpendicular to the symmetry axis.
The reactor source used in these calculations was the same as in Ref. [1]. The different tests performed for optimal arrangement of filter determinations are summarized in Tables I-III.
FIG. 2. Superior view of beam hole with the support of sample porter.
172

IAEA-CN-100/57P
FIG. 3. Perpendicular view to symmetry axis with the support of sample porter.
3. Results Several filter arrangements were investigated as detailed in the tables presented below. The Cadmium was used to remove thermal neutrons from the neutron current but produce capture gammas. The lead filter allows to reduce the gamma contaminations from the neutron flux. It does not completely eliminate the gamma contamination. The relations of the thermal, epithermal, fast and gamma fluxes (emissions/cm2) per source neutron for thermal neutron irradiations are shown in the Fig. 4 and a comparison of the thermal to epithermal, fast and gamma current ratio for theses arrangements is shown in the Table I.
without reflectors
0,0E+00
2,0E-07
4,0E-07
6,0E-07
8,0E-07
1,0E-06
1,2E-06
1,4E-06
1,6E-06
Air+G+Pb Air+Poly+Pb Air+Pb Air+Al+Pb
ItIeIr Ig
FIG. 4. Relation of the thermal, epithermal, fast and gamma current for some filter materials
located in the sample holder for thermal neutron irradiations.
173

IAEA-CN-100/57P
Table I. Comparison of the thermal to epithermal, fast and gamma current ratio for optimal arrangement with thermal neutrons.
Material In/Iγ It/Ie It/Ir It/Iγ A [Air(30cm)+G(1cm)+Pb(16.8cm)]+Pb 4.14 4.01 2.80 2.55 B [Air(30cm)+Poly(1cm)+Pb(16.8cm)]+Pb 3.81 4.55 1.96 2.20 C [Air(30cm+Pb(17.9cm)]+Pb(4cm) 4.48 4.24 2.88 2.83 D [Air(30cm)+Al(1cm)+ Pb(16.8cm)]+Pb 4.18 4.11 2.88 2.63
The highest thermal neutron current was obtained with the arrangement: C. It turned out that, after lead filter, neutrons are reflected. This configuration permits the highest relation It/Iγ, where It is the thermal neutron flux and Iγ is the gamma flux.
The optimal arrangement for epithermal neutron irradiation was obtained only with the inclusion of a Pb reflector (1cm) (Pb*). This reflector is located in the sample holder and consists of one concentric tube.
The contributions of the epithermal to thermal, the epithermal to fast and the epithermal to gamma fluxes ratio for irradiation with epithermal neutrons are presented below in Table II and the relation of fluxes is presented in the Fig. 5.
* with Pb(1cm) reflector
0,0E+00
2,0E-09
4,0E-09
6,0E-09
8,0E-09
1,0E-08
1,2E-08
1,4E-08
1,6E-08
Air(30cm)+Cd+Pb* Air(40cm)+Cd+Pb* Air+Cd+Li+Pb*
ftfefr fg
FIG. 5. Relation of the thermal, epithermal, fast and gamma fluxes for some filter material
located in the sample holder for epithermal neutron irradiations.
Table II. Comparison of the epithermal to thermal, the epithermal to fast and the epithermal to gamma fluxes ratio for irradiation with epithermal neutrons.
Material Φn/Φγ Φe/Φt Φe/Φr Φe/Φγ
A [Air(30cm)+Cd(1cm)+Pb(16.8cm)]+Pb* 5.60 28.7 3.26 4.16
B [Air(40cm)+Cd(1cm)+Pb(6.8cm)]+Pb* 5.61 30.8 2.03 3.69
C [Air(37cm)+Cd(1cm)+Li(6cm)+Pb(3.7cm)]+Pb* 4.75 29.0 1.70 2.90
174

IAEA-CN-100/57P
The relation of the thermal, epithermal, fast and gamma current (emissions) per source neutron for fast neutron irradiations are shown in the Fig. 6.
Table III summarizes the epithermal to thermal, the epithermal to fast and the epithermal to gamma fluxes ratio for irradiation with fast neutrons.
Table III. Comparison of the epithermal to thermal, the epithermal to fast and the epithermal to gamma fluxes ratio for irradiation with fast neutrons.
Material In/Iγ Ir/It Ir/Ie Ir/Iγ
A [Air(40cm)+Li(6cm)+Pb(1.8cm)]+Pb 3.09 1.60 3.32 1.60
B [Air(37cm)+Li(6cm)+Pb(16.9cm)]+Pb 3.71 1.16 3.04 1.70
C [Air(37cm)+Cd(1cm)+Li(6cm)+Pb(3.7cm)]+Pb 3.35 1.16 3.09 1.53
without reflector
0,0E+00
2,0E-07
4,0E-07
6,0E-07
8,0E-07
1,0E-06
1,2E-06
1,4E-06
1,6E-06
Air+Li+Pb(1.8cm) Air+Li+Pb(16.9cm) Air+Cd+Li+Pb
ItIeIr Ig
FIG. 6. Relation of the thermal, epithermal, fast and gamma current for some filter
material located in the sample holder for fast neutron irradiations.
The optimal arrangement for epithermal neutron irradiation obtained is A. Such a configuration permits the highest Φe/Φγ relation. Note that the Li material provided highest fast neutrons fluxes and it is also very effective in reducing gamma because it produces no capture gammas.
The optimal arrangement for fast neutron irradiation obtained is A. These configuration permits the highest Ir/It and Ir/Ie relation .
The fluxes and current calculations with Monte Carlo code MCNP-4C was performed with relative error lower than 5%.
The neutrons and gamma fluxes will be measured by means of activation foils placed in different positions in the beam hole. The foils will be arranged equidistant from the beam hold centre.
The neutron and gamma dose will be measured with TLD dosimeters.
175

IAEA-CN-100/57P
4. Conclusions In this work we presented results of MCNP simulations for different irradiation set-ups at the BNCT Research facility at the IEA-R1 reactor.
We have shown that it is possible to select filters in order to irradiate DNA samples with thermal, epithermal and fast neutron fluxes.
The experimental facility has been concluded and the experimental part of this work will be performed in the near future.
ACKOWLEDGEMENT We would like to thank the Latin-American Center of Physics (CLAF), Fundação de Amparo à Pesquisa do Estado de São Paulo(FAPESP) and Petróleo Brasileiro SA (PETROBRAS) for support this work.
REFERENCES [1] COELHO, A..C.HERNADES, P.T.D. SIQUEIRA, Neutron Flux Calculation in a BNCT
Research Facility Implemented in IAE-R1 Reactor,10th INTERNATIONAL SYMPOSIUM IN NEUTRON CAPTURE THERAPY FOR CANCER, September 8-13, 2002, Essen, Germany.
[2] F.BRIESMEISTER, MCNP- A general Monte Carlo N-particle transport code, version 4C, Los Alamos National Laboratory, LA-13709-M, (April, 2000).
[3] DUDLEY T. GOODHEAD, The initial physical damage produced by ionizing radiations, Int. J. Radiat. Biol.,1989, vol.56, No.5, 623-634.
[4] M.STOTHEIN-MAURIZOT, M.CHARLIER, R.SABATIER, DNA radiolysis by fast neutrons, Int. J.Radiat.Biol.,1990,vol.57, No.2, 301-313.
[5] A.A.STANKUS, et. al., Energy deposition events produced by fission neutrons in aqueous solutions of plasmid DNA, Int. J. Radiat. Biol., 1995, vol.68, No.1, 1-9.
[6] D.PANG, et. al., Investigations of Neutron-Induced Damage in DNA by Atomic Force Microscopy: Experimental Evidence of Clustered DNA Lesions, Radiation Research 150, 612-618(1998).
176

IAEA-CN-100/60P
Experimental Research Reactor LVR-15: Operation and Use J. Kysela1, V. Broz1, O. Erben1, R. Vsolak1, M. Zmitko1, P. Novosad 2 1Reactor Services Division, 2Integrity and Technical Engineering Division, Nuclear Research Institute Rez plc, 250 68 Rez, Czech Republic
Abstract. The experimental research reactor LVR-15 is situated at the Nuclear Research Institute Rez. The reactor nominal power is 10 MW. Standard reactor cycle is 21 days and the reactor operates 8 - 10 cycles per year. The basic research is carried out using horizontal neutron beams. One horizontal neutron beam is used for development and application of brain cancer tumours treatment by the boron neutron captures therapy. Standard irradiation service comprises irradiation of samples, irradiation of samarium for radio-diagnosis purposes and iridium wires for medical treatment as well as iridium discs for technical radiation sources production and silicon neutron doped crystals production. A neutron activation analysis laboratory is equipped with the pneumatic rabbit facility. BLANKA type rig enables the irradiation of samples (molten salts with additives) with temperature up to 800 °C in the ADTT research project. Reactor rigs are also used for the irradiation of batches of samples produced from reactor pressure vessel, a reactor internals in inert gas for the consequently material properties degradation research. Smaller batches of samples are irradiated in the CHOUCA rig. For irradiation of bigger batches of samples a slab type rigs were developed and are used. Two reactor loops enable the irradiation and research of material behaviour in the PWR environment. They are mainly used for the study of fuel cladding material corrosion and interaction with the surrounding environment under the different chemical regimes. Zinc loops are used for the study of corrosion reduction with zinc injection. Two reactor loops enable the irradiation and research of material behaviour in the BWR environment. They are used for the study of different structure materials and junctions of materials as well as of coolant parameters sensors behaviour under the irradiation and with different hydrogen/oxygen coolant regimes, the IASCC/SCC tests of reactor pressure vessel and core internals steels. 1. LVR-15 research reactor The LVR-15 research reactor is situated in the Nuclear Research Institute Rez plc. The reactor power is of 10 MW. The reactor is operated in 21 days irradiation cycle, with 8 - 10 cycles per year. The fuel assembly consists of 4 concentric tubes, or 3 concentric tubes with a control rod inside the assembly. The fuel IRT-2M contains 36 % enriched uranium.
The reactor is used as a multipurpose facility and its main use [1] is in the following areas:
material research carried out at reactor loops and rigs, production of radiation doped silicon, production of radioisotopes for the radio pharmaceuticals and technical radiation sources, irradiation devices for special irradiation, pneumatic rabbit for activation analysis, development of boron neutron capture therapy at the thermal column channel, neutron physics research (e.g. neutron diffraction for different purposes, SANS) at reactor
horizontal channels.
The irradiation facilities are complemented with good equipped hot cells for removing irradiated specimens from experimental devices and their post-irradiation examination. More details post-irradiation examination of irradiated specimens are performed in hot and semi-hot cells situated in another building near the reactor [2].
177

IAEA-CN-100/60P
In-pile irradiation research performed at reactor loops and rigs is the most important activity carried out at the reactor. Material research on the loops and rigs is mainly used for material embrittlement, corrosion and material-coolant interaction that is very important for plant utilization, plant life aging and general safety. 2. Reactor loops
This research is connected with environmental degradation processes (corrosion, mechanical and radiation effect), cladding - coolant interaction (corrosion of zirconium alloys with and without radiation, deposition of corrosion products and effect of water chemistry components). In-pile water chemistry and corrosion monitoring technique (conductivity, pH, redox potential, dissolved hydrogen and oxygen, water impurity content, corrosion potential (Fig. 1), contact electrical resistance etc.) is developed and implemented at reactor loops [3]. Description of loops and experiments is presented in [4], research in the field of stress corrosion cracking of ferritic and austenitic steels is presented in [5].
FIG. 1. Verification test of ECP responses under hydrogen/oxygen injected conditions. The RVS-3 loop simulating the PWR environment was put into operation in 1983. At present a project of the loop reconstruction is being prepared in order to:
simplify the loop primary circuit, upgrade or replace principal loop components, enable experiments for the EFDA (European Fusion Development Agreement) for the material
development programme.
The RVS-4 loop is now under functional and start-up tests and will be used for the study of PWR environment and fuel cladding interaction with the electrically heated fuel model rods.
Zinc loop is used for the study of activity transport in primary circuits and corrosion reduction with the zinc injection.
-1
-0.8
-0.6
-0.4
-0.2
0
0.2
0.4
0.6
0.8
1
6/14
0:0
0
6/14
4:0
0
6/14
8:0
0
6/14
12:
00
6/14
16:
00
6/14
20:
00
6/15
0:0
0
6/15
4:0
0
6/15
8:0
0
6/15
12:
00
6/15
16:
00
6/15
20:
00
6/16
0:0
0
6/16
4:0
0
6/16
8:0
0
6/16
12:
00
6/16
16:
00
6/16
20:
00
6/17
0:0
0
6/17
4:0
0
6/17
8:0
0
Time [month/day hr:min]
ECP
[V]
0.0
0.1
0.2
0.3
0.4
0.5
0.6
0.7
0.8
0.9
1.0
H2,
O2 [
ppm
]
Zr
Ag/Ag-Cl
Pt
H2
O2
178

IAEA-CN-100/60P
The BWR-1 loop is usually used for testing and development of in-pile water chemistry and corrosion monitoring technique and their components [6, 7] in the BWR environment.
The BWR-2 loop is used for stress corrosion cracking tests of reactor pressure vessel (RPV) and internal steels materials specimens (non irradiated and pre-irradiated in reactor rigs) under simultaneous BWR coolant and irradiation conditions. The cycling and constant load modes can be applied at the specimens. Its test channels can be used in two modifications:
a channel (Fig.2) situated near the core (with the possibility to test specimens up to 2T CT), a channel situated in the core (with the possibility to test specimens up to 1T CT).
FIG. 2. BWR-2 loop channel.
Non-irradiated specimens can be simultaneously tested in the loop comparative channel situated outside the reactor. 3. Reactor rigs BLANKA type rig was developed for the research in the ADTT project. The rig enables the irradiation of samples (molten salts with additives) with temperature up to 800 °C. The rig is not equipped by the external heating sections, the irradiation temperature is generated with reactor gamma heating and controlled either with the reactor power or inert gas pressure in the insulation thimble. The temperature is monitored with thermocouples situated in the irradiation section. The gas samples can be taken for their further analysis.
The reactor rigs CHOUCA (of French production) are used for irradiation of reactor pressure vessel materials for the research of their material properties degradation under radiation. A rig specimen holder enables to irradiate, e.g.:
Charpy V-impact specimens, tensile specimens of different types up to 12 mm in diameter, slow strain rate test specimens,
179

IAEA-CN-100/60P
fracture toughness 0.5T CT specimens.
The specimen holder consists of six sections and is inserted in the rig heating channel (6 heating sections are situated along the rig height and each section has its own thermocouples) which ensures irradiation temperature range from 200±10 °C to 350±10 °C in inert gas [8]. Ar, He or mixture Ar and He can be used as an inert gas [9].
Due to requirements to irradiate larger specimens in the inert gas a new type of rig has been developed in NRI (Fig. 3). Several modifications of the rig enable the irradiation e.g.:
up to six 1T CT specimens, four 2T CT specimens, batch of different specimens of lower dimensions which volume lies between above mentioned
volumes.
FIG. 3. 2T-CT Irradiation Rig.
4. Conclusion The experimental research reactor LVR-15 represents a significant tool for the basic and applied neutron physics, production of radioisotopes for medical and industrial purposes as well as research of structural and prospective nuclear installation. The main target is to be prepared in the future to study problems of nuclear power plant operation and research and development of new Generation IV reactor concepts.
REFERENCES
[1] KYSELA J.: Irradiation Services Provided by the LVR-15 Research Reactor, Nucleon 2 (1995) 35-37.
[2] KRAUS V. et al.: Semi-hot Experimental Facilities and Methods Employed in Mechanical Testing Programs for PWR Pressure Vessel Steels, Nucleon 3-4 (1993) 36-40.
[3] KYSELA J. et al.: In-pile Irradiation Research at NRI Rez for Corrosion and Material Testing, Nucleon 1 (1995) 4-7.
180

IAEA-CN-100/60P
[4] KYSELA J. et al. Research Facilities of LVR-15 Research Reactor Research Facilities for the Future of Nuclear Energy, pp. 154-161. H. A. Abderrahim (Ed.). World Publ. Comp., London, 1996.
[5] RUSCAK M. et al.: Stress Corrosion Cracking Tests of RPV Steels under Simultaneous BWR Coolant and Irradiation Conditions, 9th International Symposium on Environmental Degradation of Materials Power Systems-Water Reactors. Newport Beach, 1-4 August 1999.
[6] SAKAI M.: MTR Irradiation and In-situ ECP Measurement of Ceramic/Metal BWR Water Chemistry Analysis Sensors. ANERI (Advanced Nuclear Equipment Research Institute, Japan) Final Report, February 2000.
[7] SAKAI M. et al.: Durability of Electrical Insulation and Water-Seal Properties of the ECP Sensor Junctures used under BWR Water Chemistry Conditions with Neutron/Gamma Ray Irradiation. 10th Degradation Conference on Environmental Degradation of Materials in Nuclear Power Systems-Water Reactors, Lake Tahoe , August 5-9, 2001.
[8] ANDREJSEK M. et al.: Irradiation Facilities for Material Testing on the LVR-15 Reactor. Nucleon 3-4 (1995) 41-42.
[9] SVOBODA J. et al.: Flat Irradiation Rigs. Nucleon 3 (1998), 29-30.
181

IAEA-CN-100/101P
Experiments of CHF and ONB in a Finned Rod Bundle Under Low Flow and Low Pressure Conditions H.T. Chae, H. Kim, C. Park, S.J. Park, G.Y. Han HANARO Center, Korea Atomic Energy Research Institute, Yuseong, Daejeon, Republic of Korea
Abstract. Rod bundle CHF tests were performed under low flow conditions to supplement the CHF data for HANARO fuel. The test rod had the same geometric configuration as the real HANARO fuel and the aluminium cladding with fins is co-extruded on the stainless steel heating tube. There are 3 types of test sections of which shapes are hexagonal with 7 rods, triangular with 3 rods and rectangular with 4 rods. A test bundle has 3 spacers axially and a view window is located in the upper region of the test section. Flow patterns until the CHF condition are typically varied from bubbly flow to annular flow and then CHF occurs through the long annular flow period. A total of 36 bundle CHF data was obtained in 3 test sections. The results showed that the bundle CHF data is larger than the single rod CHF data by 4%∼ 32%. It is considered that these results are induced by the enhancement of the turbulence and thermal mixing generated by the spacers. In addition, measurement of the ONB in the rectangular bundle was attempted using sound signals. A hydrophone was attached to near the outlet wall of the test section. Hydrophone signals around the ONB point were measured and analyzed based on the frequency through the real FFT. Frequency analysis showed clear differences in the PSDs for 3 different frequency ranges before and after ONB. This behaviour was reproduced for different flow rates
1. Introduction The phenomenon of boiling crisis is characterized by a sharp reduction of the local heat transfer coefficient due to the change of the heat transfer mechanism caused by the replacement of the liquid by the vapour adjacent to the heated surface. The maximum heat flux just before the boiling crisis is called the critical heat flux(CHF). For nuclear reactors, the CHF is a parameter of great importance since it is usually accompanied by a sudden rise in the fuel rod surface temperature which may result in a fuel rod rupture in a short period of time.
HANARO as a research reactor with a thermal power of 30 MW is located at the KAERI(Korea Atomic Energy Research Institute) site and uses hexagonal 36-element and circular 18-element fuel bundles. The fuel element has longitudinal and rectangular fins to enhance heat transfer. However, the heat transfer characteristics on the finned surface are quite different from those for the bare rods without fins used in the power reactors because the heat flux and wall temperature vary considerably along the periphery of fins. And there is little information available in literature on the CHF for a finned geometry. Thus the single rod and bundle CHF tests were performed in the high flow conditions [1,2,3]. On the other hand, Park conducted low flow CHF tests using a single rod to obtain the CHF characteristics in the natural circulation condition and the loss of flow accident [4]. In this study, low flow bundle CHF tests were performed to set-up CHF data set from low to high flow conditions and the bundle effects in the low flow CHF phenomena were evaluated by comparison with the single rod test results.
In a high power research reactor such as HANARO, ONB (Onset of Nucleate Boiling) is one of the important design criteria to maintain a sufficient safety margin during normal operation [5]. Operation with a sufficient ONB margin may prevent the occurrence of flow instability in a parallel channel and reactivity perturbation by a void generation. Accordingly it can continuously provide a good neutron flux distribution in the reactor core. Dimmick [6]
182

IAEA-CN-100/101P
1.2 O.D
6.2
10
4.5
50025
10
700 (Heated Length) ± 0.5 25
75 680750 Alumina Coating
720 Cladding ± 0.5
1980 ± 1.0
I.D2.
5
+
A
10
(Aluminum)E.B.W.
Copper Tube
STS Tube
Copper Tube
E.B.W.
Thermoc ouple
showed that sub-cooled nucleate boiling could be characterized by an acoustic signal analysis using a hydrophone. In the experiment where the growth of the void inside the rod bundle is not visible, it may be difficult to detect the accurate ONB point. Hence, ONB measurement in a rod bundle was additionally tried using sound signals of the hydrophone. In this work, the hydrophone to measure the variation of the sound signal under water was inserted into the outlet region of the test section. Hydrophone signals were measured at slightly different power levels around the ONB point and then frequency analyses were conducted. Three ONB measurements were performed in the range of a mass flux from 100 ~ 250 kg/m2/s.
2. BUNDLE CHF EXPERIMENTS
2.1. CHF experimental set-up 2.1.1. Test rod The rod for the bundle CHF test was made the same as the HANARO fuel geometrically except for the heat generation by the electric heater as shown in Figure 1. The heated rod is 700 mm length and connected to the 500 mm upper and 780 mm lower unheated rods. The heater is a stainless steel tube with an outer diameter of 6.2 mm and a thickness of 0.85 mm and is uniformly heated. A K type thermocouple is attached by electron beam welding at a 10mm position from top end of the heating tube to detect the CHF occurrence. The aluminium (AA 1060) cladding with 8 longitudinal fins as HANARO fuel is extruded over the tube heater and the alumina powder is coated at a 0.12 mm thickness onto the heater surface to provide electrical insulation between the cladding and the tube heater.
FIG. 1. Schematic drawing of test fuel rod
2.1.2. Test bundle
Test bundles are composed of test rods, upper and lower end plates and 3 spacers. They are identified as 3 types of the bundle by the number of rods and geometrical configurations. The first one has 7 rods which are triangularly arranged with a 12 mm pitch and has a hexagonal shape and the second one with 4 rods is rectangular and the last one with 3 rods is triangular as shown in Figure 2.
2.1.3. Test section
The test section is divided into the flow tube region in which the test bundle is located and the upper and lower plenum to get a steady and fully developed flow. The flow tube has the shape of a hexagonal, triangular or rectangular depending on the test bundle geometry. At first, a hexagonal flow tube was made of transparent poly-carbonate to observe the inside but it is incapable of enduring the leakage of cooling water in the hexagonal edges due to the thermal expansion of the materials. Therefore, the material of the flow tube was changed to stainless steel and a small rectangular viewing window was equipped in the upper region where visual observation was made as shown in Figure 3.
183

IAEA-CN-100/101P
1) Hexagonal 2) Triangular 3) Rectangular
FIG. 2. Cross sections of three test bundles
Hydrophone
1) Test section 2) View window
FIG. 3. CHF and ONB test section 2.2. CHF experiment 2.2.1. Test conditions
Test conditions were decided considering a natural convection cooling and low flow conditions in HANARO. Maximum power of the electrical rectifier is 200 kW(40 V, 500 A) and the possible flow range of the mass flux is 50∼ 250 kg/m2/s. Coolant temperature and
pressure were not controlled but maintained in the range of 25∼ 50 for the inlet
temperature and 150∼ 400 kPa for the outlet pressure respectively.
2.2.2. Experimental method
The CHF phenomena under low flow and low pressure are largely affected by a "stiff" or "soft" test facility. In the case that the inlet flow rate is not controlled ("soft" system), CHF can occur early by flow vibration due to a hydraulic instability of the flow rate. Pressure difference between the pump outlet and the test section inlet was maintained above 300 kPa to prevent this instability. Test rod temperatures, coolant temperature, flow rate and outlet pressure are displayed in real time and saved at an interval of 1 second. Distilled water without impurities was used as a coolant and insoluble gas such as air was removed by pre-
184

IAEA-CN-100/101P
heating of test bundle before CHF test. CHF occurrence was judged by a rod temperature jump above 150 during a continuous monitoring by the thermocouples for the test rod
temperatures. The test rods were replaced by new rods after repeating the tests for 3∼ 5 times.
2.2.3. Power calibration test
Before the CHF test, power calibration tests were performed to confirm whether the electrical power from the rectifier and the thermal power transferred to the coolant is consistent or not. In the single phase and constant flow rate condition, the inlet and outlet coolant temperatures of the test section were measured. A good agreement between the thermal and electrical power was confirmed.
2.3. CHF test results and discussion 2.3.1. CHF observation
The whole process of the CHF test was recorded by video camera and the flow characteristics around the CHF occurrence were observed through the view window. It was confirmed by the observation that the low flow CHF occurred in an annular flow region with a high heat flux of the liquid film dry-out level in the top end region of the test rod. The chugging or oscillation phenomena in the low flow boiling condition are caused by the instability of the upstream slug flow. Its period is relatively long and an annular flow with large wave amplitude is mainly observed. Heat generated in the test rod until the CHF occurrence is removed by the liquid film flow by an intense pulsation. As the flow and heat flux are increased, co-current vapour and liquid film velocities become faster and the pulsation period is rapidly shortened and a stable annular flow is established. It is judged that these phenomena are created because an increase of the vapour flow velocity makes the wave amplitude of the liquid film stable and the heated surface is cooled by a fast liquid film flow before the CHF occurrence.
2.3.2. Test results of the bundle CHF
As a whole, 36 experimental data for the rod bundle CHF was obtained from 12 for every three test sections. A variable parameter was the mass flux and 3 or 4 experimental data was generated under a constant flow rate. Geometric data for test bundle and test section are given in Table 1.
Table 1. Geometric data for test bundle and test section Items Hexagonal bundle Triangular bundle Rectangular bundle
Number of heated rods 7 3 4 Heated length 700 700 700
Bottom unheated length 780 780 780 Test rod Top unheated length 500 500 500
Pitch between rods(mm) 12 12 12 Outer diameter at base of fins 7.87 7.87 7.87
Cladding Outer diameter over fins 9.91 9.91 9.91
Number of fins 8 8 8 Height of fins(mm) 1.02 1.02 1.02 Fins Width of fins(mm) 0.76 0.76 0.76
Flat to flat(mm) 32.9 28.5(height) 24.1 Cross sectional area(mm2) 937.7 467.7 578.2 Flow tube
Inner perimeter(mm) 114.0 98.6 96.2 Net flow area(mm2) 553.7 303.1 358.8
Hydraulic diameter(mm) 5.52 5.47 5.51 Test bundle Total heat transfer
area without fins(mm2) 121149 51921 69228
185
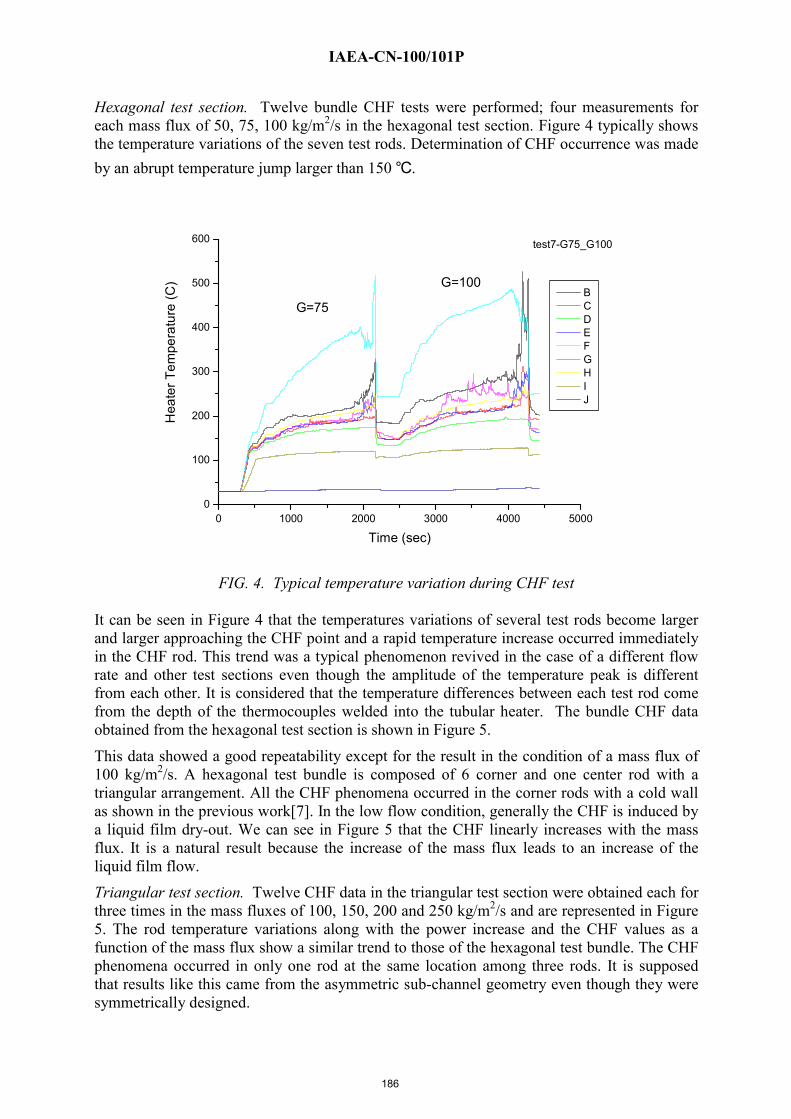
IAEA-CN-100/101P
Hexagonal test section. Twelve bundle CHF tests were performed; four measurements for each mass flux of 50, 75, 100 kg/m2/s in the hexagonal test section. Figure 4 typically shows the temperature variations of the seven test rods. Determination of CHF occurrence was made by an abrupt temperature jump larger than 150 .
FIG. 4. Typical temperature variation during CHF test It can be seen in Figure 4 that the temperatures variations of several test rods become larger and larger approaching the CHF point and a rapid temperature increase occurred immediately in the CHF rod. This trend was a typical phenomenon revived in the case of a different flow rate and other test sections even though the amplitude of the temperature peak is different from each other. It is considered that the temperature differences between each test rod come from the depth of the thermocouples welded into the tubular heater. The bundle CHF data obtained from the hexagonal test section is shown in Figure 5.
This data showed a good repeatability except for the result in the condition of a mass flux of 100 kg/m2/s. A hexagonal test bundle is composed of 6 corner and one center rod with a triangular arrangement. All the CHF phenomena occurred in the corner rods with a cold wall as shown in the previous work[7]. In the low flow condition, generally the CHF is induced by a liquid film dry-out. We can see in Figure 5 that the CHF linearly increases with the mass flux. It is a natural result because the increase of the mass flux leads to an increase of the liquid film flow.
Triangular test section. Twelve CHF data in the triangular test section were obtained each for three times in the mass fluxes of 100, 150, 200 and 250 kg/m2/s and are represented in Figure 5. The rod temperature variations along with the power increase and the CHF values as a function of the mass flux show a similar trend to those of the hexagonal test bundle. The CHF phenomena occurred in only one rod at the same location among three rods. It is supposed that results like this came from the asymmetric sub-channel geometry even though they were symmetrically designed.
0 1000 2000 3000 4000 50000
100
200
300
400
500
600 test7-G75_G100
G=100
G=75
Hea
ter T
empe
ratu
re (C
)
Time (sec)
B C D E F G H I J
186

IAEA-CN-100/101P
FIG. 5. Measured CHF in the different test sections as mass flux
Rectangular test section. Twelve CHF data in the rectangular test section were also obtained for four times in the mass fluxes of 100, 150 and 200 kg/m2/s and are represented in Figure 5. The rod temperature variations along with the power increase also show a similar trend to those of the other test bundles. The hydraulic diameter and the corner sub-channel angle in the rectangular bundle are larger than that of the triangular bundle. The vapour bubbles generated in the corner sub-channel of the rectangular bundle could be easily transferred to the neighbouring sub-channels. Therefore it is judged that the CHF values and the increasing rate of the rectangular bundle as a function of the mass flux in Figure 5 is higher than those of the triangular bundle. The CHFs occurred randomly in all four rods.
2.3.3. Comparison with single rod test results
Figure 6 shows the comparison results between the present bundle CHF and the single rod CHF[4] with the same geometrical heated rod in the low pressure and low flow conditions. The single rod CHF data were selected such that the inlet temperature and pressure as close as possible to the current tests. However, one should be note that the hydraulic diameters of the test bundles, about 5.5 mm, are smaller than the 7.3mm of the single rod. Bundle CHF data shows a 4%∼ 32% larger result than those of the single rod tests performed in similar conditions. It is generally known that the hydraulic diameter effect on the CHF is positive. Therefore, the CHF differences between the bundle and the single rod test could be increased. It is judged that the CHF in the bundles with spacers increases because of the turbulent and thermal mixing by the spacers.
3. ONB Experiments 3.1. ONB experimental set-up 3.1.1. Test section
The rectangular test bundle with four rods was used in this ONB test.
3.1.2. Hydrophone
0 50 100 150 200 250 3000.0
0.5
1.0
1.5
2.0
Crit
ical
Hea
t Flu
x(M
W/m
2 )
Mass Flux(kg/m2 sec)
7 rods 3 rods 4 rods
187
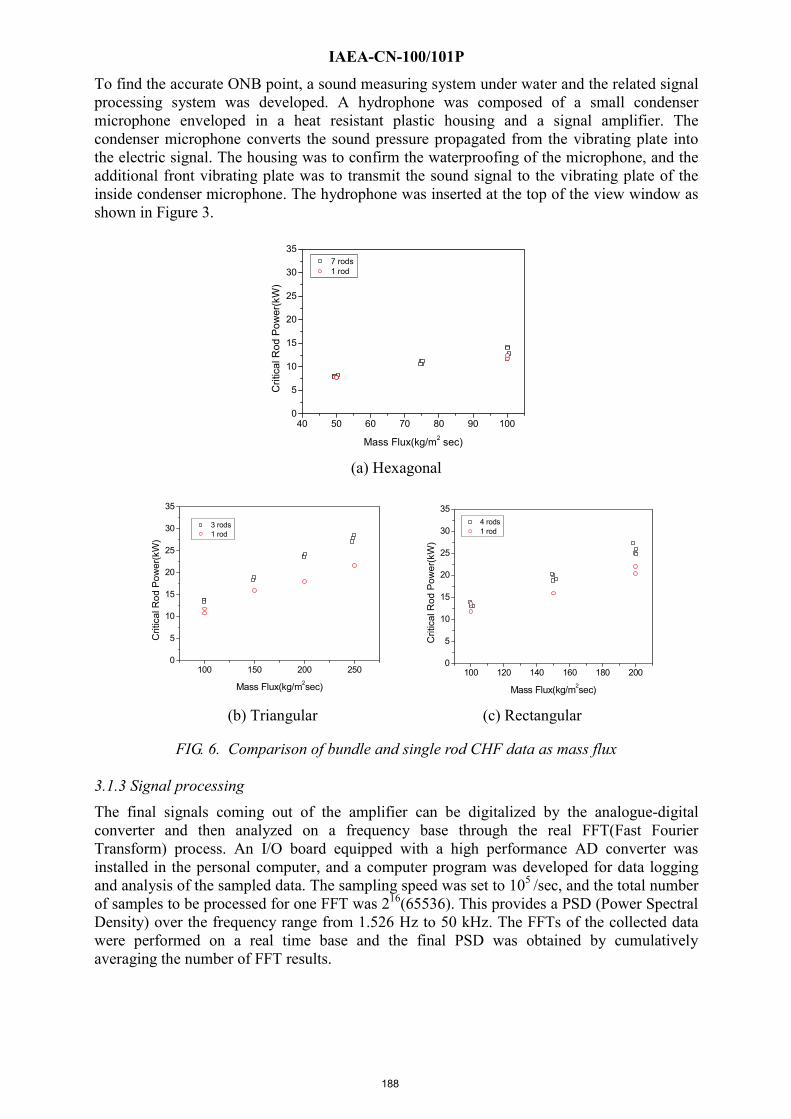
IAEA-CN-100/101P
To find the accurate ONB point, a sound measuring system under water and the related signal processing system was developed. A hydrophone was composed of a small condenser microphone enveloped in a heat resistant plastic housing and a signal amplifier. The condenser microphone converts the sound pressure propagated from the vibrating plate into the electric signal. The housing was to confirm the waterproofing of the microphone, and the additional front vibrating plate was to transmit the sound signal to the vibrating plate of the inside condenser microphone. The hydrophone was inserted at the top of the view window as shown in Figure 3.
(a) Hexagonal
(b) Triangular (c) Rectangular
FIG. 6. Comparison of bundle and single rod CHF data as mass flux 3.1.3 Signal processing The final signals coming out of the amplifier can be digitalized by the analogue-digital converter and then analyzed on a frequency base through the real FFT(Fast Fourier Transform) process. An I/O board equipped with a high performance AD converter was installed in the personal computer, and a computer program was developed for data logging and analysis of the sampled data. The sampling speed was set to 105 /sec, and the total number of samples to be processed for one FFT was 216(65536). This provides a PSD (Power Spectral Density) over the frequency range from 1.526 Hz to 50 kHz. The FFTs of the collected data were performed on a real time base and the final PSD was obtained by cumulatively averaging the number of FFT results.
40 50 60 70 80 90 1000
5
10
15
20
25
30
35
Crit
ical
Rod
Pow
er(k
W)
Mass Flux(kg/m2 sec)
7 rods 1 rod
100 150 200 2500
5
10
15
20
25
30
35
Crit
ical
Rod
Pow
er(k
W)
Mass Flux(kg/m2sec)
3 rods 1 rod
100 120 140 160 180 2000
5
10
15
20
25
30
35
Crit
ical
Rod
Pow
er(k
W)
Mass Flux(kg/m2sec)
4 rods 1 rod
188

IAEA-CN-100/101P
3.2. ONB test results and discussion The collection and processing of the acoustic signals were carried out three times at different power levels: single phase condition (legend_SP1 in Figure 7), first observation of void (legend_ONB), and slightly lower than the ONB power without void (legend_SP2). Each ONB measurement was also performed at different flow rates of 100, 200, and 250 kg/m2/s. Here, the preliminary ONB points were determined at the point of a few void generations on the fuel surface through the view window as shown in Figure 3.
FIG. 7. Sound signal distributions around ONB
The differences between the two conditions can also be seen in the frequencies of 4.1 kHz and 4.5 kHz as shown in Figure 7. Many peaks are found during the experiment but these peaks are not easily identifiable due to the many sources of noises. The only thing we can identify is the difference between the two signals, i.e., the signals before and after the ONB. The two peaks at 4.1 & 4.5 kHz are the only peaks related to the void formation. These differences in PSDs agree well with the experimental results of Dimmick[6] in which the acoustic peak appeared at the frequency of about 3.8 kHz. Although it is not clear if the noise peaks are generated by the void formation or not, it is certain that the changes of PSD in some frequency levels becomes a guide post to the initiation of sub-cooled boiling. The ONB measurement using acoustic signals could be used to detect the ONB in a bundle or a structure without a view window.
4. Conclusion CHF tests using several finned rod bundles such as HANARO fuel assembly were performed under low flow and low pressure conditions. Aluminium cladding of the test rod was co-extruded on the stainless steel tube as a full length heater. Three types of test bundles, typically a hexagonal one with seven rods, a triangular one with three rods and a rectangular one with four rods were used. CHF tests were conducted in the range of a mass flux of 50∼ 250 kg/m2/s, inlet temperature of 25∼ 50 , and outlet pressure of 150∼ 400 kPa. It was confirmed that the low flow CHFs occurred at a high heat flux of the liquid film dry-out level
189

IAEA-CN-100/101P
in the top end region of the test rod after a long period of an annular flow regime. A total of 36 bundle CHF data were obtained from three types of test bundles. The bundle CHF data showed a 4%∼ 32% larger results than those of the single rod tests performed in similar conditions. Such results were believed to be induced by the increase of the turbulence and thermal mixing due to the spacers inserted into the bundle.
In addition, the ONB tests using the hydrophone were performed to confirm the possibility of another detection method for the incipience of boiling. Hydrophone signals around the ONB point were collected and analyzed. Frequency analyses showed clear distinctions in the power spectral densities for 2 different frequency ranges. This behaviour was reproduced for different flow rates. Therefore, this method could be used to detect the ONB in a bundle or a structure without a view window.
REFERENCES [1] HEMBROFF, R.L., et. al., Single-phase and Boiling Heat Transfer Measurements
Conducted in the MAPLE-X10 Heat Transfer Test facility, MX10-03300-233-TN, Technical Note, AECL, (1991).
[2] DIMMICK, G.R., et al., Results from the DRNU5 Bundle CHF Test, MX10-03300-419-TN, ARD-TD-446, 93-06 (1993).
[3] DIMMICK, G.R., et al, Results from the DRNU7 Bundle CHF Test, MX10-03300-429-TN, ARD-TD-460, 94-02 (1994).
[4] PARK, C., CHANG, S.H., BAEK, W.P., Critical Heat Flux for Finned and Unfinned Geometries under Low Flow and Low Pressure Conditions, Nucl. Eng. Des., Vol. 183 (1998).
[5] CHAE, H.T., et al., Statistical Thermal Design of HANARO Core, KAERI/TR-1300/99 (1999).
[6] DIMMICK, G.R., et al., Results from the DRNU5 Bundle CHF Test, MX10-03300-419-TN, ARD-TD-446 (1993).
[7] TONG, L.S., Boiling Heat Transfer and Two-Phase Flow, John Wiley & Sons Inc. (1972).
190

IAEA-CN-100/112P
A Fast Neutron Irradiation Facility at the Portuguese Research Reactor J.G. Marques, N.P. Barradas, A.C. Fernandes, I.C. Gonçalves, A.J.G. Ramalho Reactor Português de Investigação, Instituto Tecnológico e Nuclear Sacavém, Portugal
Abstract. A dedicated irradiation facility was built in the Portuguese Research Reactor and used in the irradiation of electronic components with fast neutrons. Fast neutron fluxes of up to 1.5x10⁹ n/cm2/s are available in the facility. The simultaneous gamma dose rate is 25 Gy/h for a neutron flux of 2x10⁸ n/cm2/s. The gamma dose rate was tailored to keep the neutron/gamma ratio expected at the location of the signal conditioners for temperature measurement at the LHC facility at CERN. The irradiation facility is described and the characterization of the neutron and photon fields is presented.
1. Introduction The performance of electronic components under irradiation is a concern for the nuclear industry, the space community and the high-energy physics community. In many situations the use of radiation hard components is not an option due to the high costs involved and “Commercial Off The Shelf” (COTS) components are used instead. However, the use of COTS components complicates the radiation hardness assurance process since, contrary to radiation hard parts, there is little information on the actual implementation of the circuit. Only testing can give an indication on the radiation tolerance of the component and indicate which malfunctions can occur in a radiation environment [1,2].
In this work we describe a fast neutron irradiation facility built in the Portuguese Research Reactor (RPI). This facility has been used to irradiate electronic components for cryogenic thermometry at the Large Hadron Collider (LHC) facility at CERN [3]. Fast neutron fluxes of up to 1.5x10⁹ n/cm2/s are achievable. The irradiation goal is to achieve during one week of operation of the reactor (about 60 hr) a fast neutron fluence that corresponds to the expected values for 10 years of operation in the LHC. Several parameters of the components are monitored during the irradiation using a PC-controlled data acquisition system.
2. Description of the facility The RPI is a 1 MW pool-type reactor with a maximum thermal neutron flux of 3x10¹³ n/cm2/s. Its irradiation facilities include 7 beam tubes, a thermal column and a rabbit system. It was built by AMF Atomics Inc., in the period of 1959/61 and its design is similar, e.g., to the HOR reactor in Delft, The Netherlands, and the FRM I reactor (“Atomic Egg”) in Munich, Germany. The RPI is currently using HEU fuel until May 2006 and then it will be converted to LEU fuel [4].
The use of the RPI has steadily increased in recent years. As expected, the focus is now in activities that do not depend strongly on a high neutron flux and where the RPI can be competitive. One such area is the irradiation of electronic components, which requires relatively low neutron fluxes. The main problem to solve is the creation of the required irradiation conditions. Initial irradiations in the RPI were performed in a dedicated device immersed in the pool. The device consisted mainly of a 297 mm long cylindrical Al container with 150 mm diameter, placed at 90 mm from the nearest row of fuel assemblies. The container was lined internally by 1 mm Cd and surrounded by a 20 mm thick Pb shield [5]. However, to obtain the target neutron flux of 2x10⁸ n/cm2/s in the central circuit, it was necessary to operate the reactor at a reduced power of 2 kW, which prevented other simultaneous users. Moreover, the relatively high length of the cables to connect to the measuring instruments worsened the signal-to-noise ratio in the data acquisition. Thus, this approach was abandoned in favour of a facility built around a beam tube, where the reactor could be operated at full power.
191

IAEA-CN-100/112P
FIG. 1. Horizontal cut of the fast neutron facility.
Fig. 1 shows a horizontal cut of the installed facility. A dry irradiation chamber with 100 x 60 x 60 cm (l x w x h) was created at the end of beam tube E4. The chamber was prolonged inside the beam tube, through the introduction of a 100 cm long cylinder with 150 mm inner diameter, attached to the face of the beam tube housing. The neutron beam size is 150 mm, as defined by the diameter of the beam tube close to the core.
The inner face of the prolongation of the chamber is approximately 160 cm away from the core. When the facility is not in use the end portion of the beam tube close to the core is flooded, the water acting as a neutron and photon shield. The attenuation for fission neutrons provided by a water shield 160 cm thick is 7x10⁻⁸ [6]. The measured attenuation for the photon dose rate is 1x10⁻². The shielding of the facility is a combination of polyethylene (PE500), lined with Cd, and concrete. In the direction of the beam 20 cm of PE500 are used, followed by 80 cm of high density concrete. In the lateral directions 10 cm of PE500 are used, followed by 30 cm of concrete. An extra 40 cm thick block of high density concrete (not shown in Figure 1) was placed in the beam direction. Provision for passage of cables to the measuring instruments was made. Insertion and removal of the circuits is done with the reactor stopped and the beam tube flooded.
FIG. 2. Schematic view of RPI’s core configuration N2-P1/6 (NS=SbBe neutron source; FC=fission chamber; N1, N4, N6-N11=standard fuel assemblies; C1-C5=fuel assemblies with control rods; Be=Beryllium reflectors; Al=Aluminium reflector in front of beam tube E4). Free grid positions are labelled in italic. The core of the RPI, shown in Figure 2, is reflected by a thermal column on one side and by Be and water on the remaining sides. In previous core configurations the entrance of tube E4 was partially covered with Be reflectors and the remaining surface with water. To increase the fast neutron flux in
192

IAEA-CN-100/112P the tube E4 the core was rearranged, replacing the Be in front of the tube by an Al reflector. A threefold increase in the fast neutron flux was obtained in this way.
The aluminium reflector, shown in Figure 3, has as main element a block with dimensions 240x250x75 mm, made from a set of 5 mm thick Al plates (99.5% purity, Pichney) joined by 6061 Alcoa aluminium rivets. The central plate is longer than the others and has in its upper part a 60x30 mm opening for handling the reflector with the fuel handling tool, as well as two small holes for guiding cables. The reflector has two standard end-fittings for its placement in positions 14 and 16 of the core grid. The reflector covers only the entrance of tube E4 and thus part of the core is still reflected by water. It has a negative effect in the reactivity of 220 pcm (approximately 34 cents).
FIG. 3. Aluminium reflector introduced in the core of the RPI.
In order to obtain a neutron/photon ratio close to the one expected for the location of the cryogenic temperature processing units at the LHC, a Pb filter was placed inside the irradiation tube. The 40 mm thick Pb filter installed attenuates the fast neutrons approximately by a factor of two. The thermal neutron component of the beam was strongly reduced by a 7 mm thick Boral (Al-B4C) disk placed next to the Pb. The power deposited in the Pb and Boral filter is less than 3 W.
The components under test are mounted on several boards, inside assembling boxes (79 x 79 x 25 mm). Up to 18 boxes can be accommodated in the current box holder, which has provisions for cooling the boards using a small flow of compressed air that is rejected through the reactor’s stack. Connection to the measuring instruments is done through four cables with 25 conductors. Normally each irradiation campaign runs from Monday to Friday with approximately 13 hours of irradiation followed by 11 hours of stand-by per day, due to the two-shift per day operation regime of the reactor, and the central box receives a neutron fluence of 5x10¹³ n/cm2.
3. Characterization of the neutron and photon fields The neutron spectrum in the irradiation facility is essentially a leakage spectrum in a water moderated fission reactor, with a reduced thermal component due to the Boral filter. Figure 4 shows a Monte-Carlo simulation, using the MCNP-4C code [7] of the neutron spectrum inside the irradiation chamber, at the point closest to the core. This simulation uses a detailed three-dimensional model of the core validated with extensive measurements in the reactor core [8]. A Watt-Cranberg distribution, normalized to the value at 2 MeV, and a Maxwellian distribution, normalized to the value at 0.1 eV, are also shown for comparison.
193

IAEA-CN-100/112P
10-10 10-8 10-6 10-4 10-2 100 10210-11
10-10
10-9
10-8
10-7
10-6
10-5
MCNP simulation fast: Watt-Cranberg thermal: Maxwell
Eφ(E
) (a.
u.)
E (MeV)
FIG. 4. MCNP simulation of the neutron spectrum in the irradiation chamber. A Watt-Cranberg distribution, normalized at 2 MeV, and a Maxwell distribution, normalized at 0.1 eV, are also shown for comparison. The fast neutron component of the spectrum is well described by the Watt-Cranberg distribution, as expected. The thermal component is well described by the Maxwellian distribution but shifted to 323 K, due to the effect of the Boral filter. The epithermal portion of the spectrum follows closely a 1/E dependence.
Figure 5 shows measured values of the fast neutron flux in several situations: free beam, i.e., no materials being irradiated, irradiations in standard conditions and a high flux irradiation. The neutron fluxes were measured with Ni detectors. They are based on the averaged neutron cross section for the 58Ni(n,p)58Co reaction in a 235U fission spectrum [9]. In the case of the actual irradiations of circuits, two Ni detectors were placed at the ends of each box; the values in Figure 5 are then the average of the measured values and represent the flux at the centre of each box.
0 20 40 60 80 100 120 1400.00.20.40.60.81.01.21.41.6
, standard irradiations high flux irradiation free beam
φ (1
09 n/c
m2 /s
)
Distance from inner face [cm]
FIG. 5. Measured values of the fast neutron flux: free beam, irradiations in standard conditions and a high flux irradiation.
194

IAEA-CN-100/112P
0 20 40 60 80 100 120 1400
20
40
60
80
100
120
Phot
on d
ose
rate
[Gy/
h]
Distance from inner face [cm]
FIG. 6. Measured values of the photon dose rate in free beam condition. The free-beam values shown in Figure 5 can be used to predict the initial fast flux for each position of the box holder. The attenuation of the fast neutron flux by the circuits shows an identical behaviour, with an effective removal coefficient of 0.05 cm-1, which is about half of the one of water for fission neutrons [6].
The photon dose rate in the facility was obtained with thermoluminescent dosemeters (TLD): TLD-700 (7LiF:Mg,Ti) and Aluminium oxide (Al2O3:Mg,Y). The measurements were performed at a reduced power of 50 kW from the inner face of the irradiation chamber until 130 cm downstream. An ionization chamber was also placed at 70 cm from the inner face of the irradiation chamber and the measured value was in good agreement with the one obtained via TLD. Figure 6 shows the profile of photon dose rate at 1 MW in the free beam condition. Measurements were also done with the assembling boxes mounted, but without circuits, to check their influence. The values with the boxes are only 10-15% higher than the free beam values. The ionization chamber was subsequently used to control the gamma dose during the actual irradiation of the circuits at 1 MW power.
The characterization of the circuits is done by the Complutense University of Madrid in collaboration with LHC. A recent report of results can be found elsewhere [10].
4. Conclusions A dedicated irradiation facility was built in the Portuguese Research Reactor and used in the irradiation of electronic components with fast neutrons. Fast neutron fluxes of up to 1.5x10⁹ n/cm2/s are achievable in the facility. The photon dose rate is in the 20-40 Gy/h range in the standard irradiation conditions, maintaining a neutron/photon ratio close to the one expected at the location of the cryogenic temperature processing signals at the LHC.
Acknowledgment The authors are grateful to the operating staff of the Portuguese Research Reactor for their assistance during the irradiation campaigns. This work was partially supported by Fundação para a Ciência e a Tecnologia, Portugal, through projects CERN/P/FIS/43773/2001, POCTI/49559/FNU/2002 and a PhD grant (A.C.F.).
REFERENCES [1] FACCIO, F., “COTS for the LHC Environment: The Rules of the Game”, Electronics for LHC
Experiments 2000 (Proc. Workshop Kracow, 2000), CERN-LHCC-2000-041, CERN, Geneva (2000) 50-65.
[2] ADAMS, L., et al., "3rd RD49 Status Report - Study of the Radiation Tolerance of ICs for LHC", LEB Status Report/RD49, CERN-LHCC-2000-003, CERN, Geneva (2000).
195

IAEA-CN-100/112P [3] CASAS-CUBILLOS, J., GOMES, P., HENRICHSEN, K.N., JORDNUNG, U., RODRIGUEZ-
RUIZ, M.A., “Signal Conditioning for Cryogenic Thermometry in the LHC”, CERN-LHC-Project-Report-333, CERN, Geneva (1999).
[4] RAMALHO, A.J.G., MARQUES, J.G., CARDEIRA, F.M., “The Portuguese Research Reactor: A Tool for the Next Century”, Research Reactor Utilization, Safety and Management (Proc. Int. Symp. Lisboa, 1999), IAEA, Vienna (2000) IAEA-SM-360/5.
[5] RAMALHO, A.J.G., MARQUES, J.G., GONÇALVES, I.C., FERNANDES, A.F., GONÇALVES, I.F., VIEIRA, A., PRATA, M.J., “Use of the RPI to Test the Behaviour Under Irradiation of Electronic Circuits and Components For CERN”, Research Reactor Utilization, Safety and Management (Proc. Int. Symp. Lisboa, 1999), IAEA, Vienna (2000) IAEA-SM-360/17P.
[6] SHAPIRO, J., Radiation Protection, Harvard University Press, Cambridge (1990).
[7] BRIESMEISTER, J.F., “MCNP – A General Monte Carlo n-particle Transport Code”, Version 4A, Los Alamos Report LA-12626-M (1990).
[8] FERNANDES, A.C., GONÇALVES, I.C., BARRADAS, N.P., RAMALHO, A.J., “Monte Carlo Modeling of the Portuguese Research Reactor Core and Comparison with Experimental Measurements”, Nuclear Technology 143 (2003) 358.
[9] BAARD, J. H., ZIJP, W. L., NOLTHENIUS, H. J., “Nuclear Data Guide for Reactor Neutron Metrology”, Kluwer Academic Publishers (1989).
[10] AGAPITO, J.A., et al., “Radiation Tests on Commercial Instrumentation Amplifiers, Analog Switches and DACs”, Electronics for LHC Experiments 2001 (Proc. Workshop Stockholm, 2001), CERN-LHCC-2001-034, CERN, Geneva (2001) 117-121.
196

IAEA-CN-100/115P
Optimizing the Neutron Diffractometers Configurations I. Ionita Institute for Nuclear Research, Pitesti, Romania
Abstract. A new philosophy to optimize the experimental configurations in neutron diffractometry is presented. Focusing conditions are deduced by cancelling the significant contributions to the scan variable variances. Both the crystal and time-of-flight diffraction is considered. The focusing conditions refer to the optimum sample orientation and a proper choice of the monochromator radius of curvature, for the crystal diffractometry, and to the optimum source moderator, sample and detector orientation, for the time-of-flight diffractometry. The focusing conditions deduced for an idealized configuration can serve as a “0”-th order approximation in a numerical optimization process.
1. Introduction The neutron fluxes supplied by the available neutron sources are in the most cases too week to satisfy the experimental requirements. For this reason the optimal use of the available neutrons is of the greatest importance. The general philosophy to do it is to maximize the neutron flux at sample by using neutron guides, supermirrors [1], or spatial focusing effects involving flexible configurations and curved crystals. A different approach [2],[3],[4],[5], is to obtain the required optimum experimental conditions not by getting focused beams at sample or anywhere else, but only by decreasing as much as possible the scan variable variances.
This general procedure is applied to deduce focusing conditions for some idealized significant configurations used in neutron diffractometry. Both the crystal and time-of-flight diffractometry are considered. For the crystal diffractometry both the one and two crystals monochromators are allowed while for the time-of-flight diffractometry both the pulsed and steady state sources are taken into consideration.
2. The general method In the neutron diffractometry the scan variable is X1, the X vector component along the Q0 direction, where X=Q-Q0 and Q = kf-kI; kf, kI are the wave vectors for the incoming respectively the diffracted neutrons and “0” refers to the corresponding most probable value. The scan variable is given by: )(ksink2X ifs1 γ−γ+θ∆= (1) where γI ,γf are the horizontal divergence angles from the most probable trajectories, ∆k is the wave vector spread, 2θs is the scattering angle; the indices i,f refer to the incoming respectively the scattered neutrons. The variables defining the neutron trajectories in phase space are all the spatial relevant co-ordinates to which has to be added, for the time-of-flight diffractometry, the temporal variables defining its emission respectively detection. All the spatial and temporal variables are measured from the corresponding most probable values. The relation defining the temporal variables is: k
kLkk
L0fm2
h )tt( ∆∆π
−=− (2)
where L is the neutron flight path from source (from chopper center for a steady state source) to detector, h is the Plank constant and m is the neutron mass.
For the crystal diffractometry the Bragg constraints have to be considered:
197

IAEA-CN-100/115P
)(signRl2 mm
m
mfi χ+θ=γ−γ (3)
2mficot
kk γ−γθ=
∆ (4)
The relation (2) and (4) defines the ∆k in (1) for the time-of-flight respectively the crystal diffractometry. To these relations must be added the geometrical relations giving the horizontal angular variables expressed through the spatial significant variables l0, ls,, ld, , lm, the source, sample, detector and monochromator lengths; Rm is the crystal radius of curvature. The general procedure is to express the scan variableX1 through spatial and, for time-of-flight diffractometry, temporal variables and to cancel the major contributions, i.e. the l0, ls,, ld, , lm coefficients.
3. The crystal diffractometry 3.1. One crystal monochromator
The geometry of the experimental configuration (Fig.1) gives for the γ0 ,γ1 ,γ2 variables:
0mmm00 l)sin(lL −χ−θ=γ (5) )mmmsss11 sin(l)cos(lL χ−θ+χ+θ=γ (6)
)cos(llL sssd22 χ−θ−=γ (7) where LI are distances between the diffractometer components, θm ,χm are the monochromator Bragg respectively cutting angle and χs is the sample orientation angle.
Following the above-described procedure and cancelling the lm coefficient, one obtains:
)sin()(Lsign
1a2a2
mmm
mmR χ−θχ+θ
−= (8)
where a=-tanθs/tanθm and signα= absα/α. Canceling the “ls” coefficient one obtains: ]1[cottan
1L2L)1a2(1
2ss −+
−θ=χ (9)
If we define αs as the inclination angle measured from the monochromatic beam direction, one obtains:
)2sin(
)1a2()2cos(s
s
1L2L
scotθ
−−θ=α , αs = χs +θs +π/2 (9)’
The relations (8) and (9) represent the focusing conditions for this configuration.
FIG. 1 FIG. 2
l0
2θm
χm
source crystal gm
lm
L0
L1
χsls
sample
gs
2θs
ld
detector
L2
l0
2θm1
χm1
source crystal 1 gm1
lm1
χm2lm2
2θm2
gm2
χsls
crystal 2
sample
gs
2θsld
L0
L1
L2
L3
detector
198

IAEA-CN-100/115P
3.2. Two crystals monochromator
The geometry of the experimental configuration (Fig.2) gives the “γ” variables: )sin(llL 1m1m1m000 χ+θ+−=γ (10) )sin(l)sin(lL 2m2m2m1m1m1m11 χ+θ+χ−θ=γ (11) )cos(l)sin(lL sss2m2m2m22 χ+θ+χ−θ=γ (12) dsss33 l)cos(lL +χ+θ−=γ (13) The Bragg constraints, for the two crystals, are:
1m
1m
Rl
1m1m10 )(sign2 χ+θ=γ+γ (14)
2m
2m
Rl
2m2m12 )(sign2 χ+θ=γ+γ (15)
2cot
10kk 1m1 )( θ∆ γ−γ= (16)
2cot
21kk 21m2 )( θ∆ γ−γ= (17)
To these constraints it has to be added the conditions that the neutrons reflected by the first crystal must have a proper wave-length to be reflected by the second crystal, i.e. ∆kI=∆kf (18) or, from (16) and (17) γ2=γ1(1-am)+amγ0 with am=tanθm2/tanθm1 (18)’ The relations (18),(15),(14) are compatible with the geometrical relations, (10)-(13), only for certain values of the crystals radii of curvature, given by:
)sin()(sign 1m1m1m1mLa1a
R1
1m
m
1
χ−θχ+θ= −
)sin()( 222211
12 mmmmLa
R signm χθχθ ++−= − (19)
If it is used the relations (17), (11), (12) to express the γ1,γ2,∆k in (1) and lm1,lm2 are eliminated using the relations (10)-(13) and (14),(15), it is obtained, by cancelling the “l0” coefficient:
)sin()sin(
a11
LL
1m1m
2m2m
m
a2ma
1
2
χ+θχ−θ
−+= (20)
By cancelling the ”ls” coefficient, it is obtained:
11
ss cottan+ξ−ξθ=χ (21)
with )1(21a2
)1aa)(1(21)aa(2LL
mama2
12ma
2)ma1(1m
mma1
1m
2
3
−− α+α+α−−
−+−α−−+−=ξ (21)’
)sin()sin(
LL
2)sin()sin(
LL
12m2m
2m2m
1
2
1m1m
1m1m
1
0 ,χ+θχ−θ
χ+θχ−θ =α=α (21)”
The relations (19), (20), (21) are the focusing conditions for this geometry.
4. The time-of-flight diffractometry 4.1. Pulsed source The geometry of the experimental setting (Fig.3) gives:
0
00sss
Lcosl)cos(l
0χ−χ+θ
=γ (22)
1
sssdd
L)cos(lcosl
1χ−θ−χ
=γ (23)
L=L0+L1, ∆L=-ldsinχd-2lssinθscosχs+l0sinχ0 (24)
199

IAEA-CN-100/115P
If we introduce (2), (22), (23), (24) in (1) one obtains, by cancelling the “ld” coefficient:
1L2L
sd cottan θ=χ (25)
By cancelling the “ls” coefficient, one obtains:
)(tans1L
10L
1s
0L1
1L1
Ls
2tan4
tan−θ++θ
=χ (26)
By cancelling the “l0” coefficient, one obtains:
0L2L
s0 cottan θ−=χ (27)
The relations (25), (26), (27) gives the optimum orientations for the detector, sample respectively the source moderator.
FIG. 3. FIG. 4.
4.2. Steady state source The geometry of the considered setting (Fig.4) gives:
)cos(cos
)cos(
22
11
000
sssdd
chsss
ch
llLllL
llL
χθχγχθγ
γ
−−=−+=
−= (28)
In this case t0 is the moment when the neutron reaches the chopper center, L=L1+L2 and sdsdd sincosl2sinlL θχ−χ=∆ (29) The constraints introduced by the chopper presence is given by:
ωγ= 2
0t (30)
Introducing (2), (28), (30), (31) in (1) and cancelling the “l0” coefficient one obtains )LL(tan 21hk
ms +−=θ ωπ (31)
Cancelling the “ld” coefficient one obtains:
2
s
L2tanL
dtan θ−=χ (32)
Cancelling the “ls” coefficient one obtains:
1L
1mL
stanhk2L
12L
11L
1s1LLm
hkL
stan4
)1()(tan
stanωπθ
ωπθ
+−+θω++
=χ (33)
The equations (32), (33)gives the optimum detector and sample orientation angles while (31) gives the optimum angular speed.
5. Conclusions The above-described procedure allows for the focusing conditions deduction in the case of the crystal and time-of-flight diffraction idealized configurations. The idealized focusing conditions can serve as “0”-th order approximation in a numerical optimization process.
l0 lch
ls
ld
L0 L1
L2 θs
θs
χs
χd
source chopper
sample
detectorl0
ls
ld
L0
L1 θs
θs
χs
χd
sourcesample
detectorχ0
200

IAEA-CN-100/115P
REFERENCES
[1] BONI, P., J. Neutron Research, 5, 1996, pp 63.
[2] POPOVICI, M., STOICA, A.D., IONITA, I.; J.Appl.Cryst., 20, pag.90-101, 1987.
[3] POPOVICI, M. et al.; Nucl. Instr. and Meth., A 338, 1994, p 99.
[4] IONITA, I., STOICA, A.D., POPOVICI, M., POPA, N.C., Nucl. Instr. and Meth., A 431, 1999, p509.
[5] POPOVICI, M., YELON, W.B., Journal of Nuclear Research, 3, p.1-25, (1995).
201

IAEA-CN-100/116P
The Resolution Function for a Pulsed-Source TOF Neutron Spectrometer with Mechanical Monochromator I. Ionita Institute for Nuclear Research, Pitesti, Romania
Abstract. The matrix procedure to compute the resolution function for a given experimental configuration is briefly given followed by its application to a particular one, a pulsed source TOF neutron spectrometer with mechanical monochromator. As for the matrix procedure a normal 486 PC is quite suited with computing times of 1-2 seconds in comparison with the Monte Carlo computing technique for which special computer configurations are needed, the matrix procedure should be preferred when the normal approximation is still valid and if a precise description of the line profile is not required.
1. Introduction Any attempt to optimize an experimental set-up requires a suited computing procedure to evaluate the corresponding resolution and intensity. The computational method given by Cooper and Nathans [1], is suited only for rather simple configurations as the conventional double and triple axis spectrometers are. The procedure is no longer appropriate when spatial effects are important as is the case of configurations using focusing effects and curved monochromators [7], or for TOF instruments.
The matrix method [2], has proved to be suited both for conventional, focusing or TOF instruments. This computing technique has been successfully used for different configurations as are the TOF diffractometers with pulsed source [3], or with steady state source [5], the crystal diffractometers [6], or the three-axis spectrometers [4]. During the last years the Monte Carlo procedure has begun to be used quite extensively to evaluate the resolution and intensity properties of the neutron spectrometers. The application of the MC technique requires rather powerful computers with increased computing speed while for the matrix method a 486 PC is quite suited with computing times of 1-2 seconds. The matrix procedure is a convenient one and should be preferred if the normal approximation is still valid and a detailed line profile description is not required.
2. The general theory The computational procedure involves several steps. The first one is to choose the initial variables of the problems defining the neutron trajectory between the source and detector. The normal approximation of the probability distribution of the initial variables, defining the vector R, can be computed for a particular experimental setting, giving the corresponding matrix S.
The next step is to characterize the influence of the Soller collimators, neutron guides (defined as a Soller collimator with a wavelength-dependent angular divergence given by the total reflex critical angle), coarse collimators or slits (defined as a coarse collimator of zero length). The effect of the presence of a coarse collimator or slit, characterized by the transmission matrix TI, is to modify S to:
S → S + ΣTi (1)
To characterize the influence of the Soller collimators or neutron guides on has to introduce the vector U of the angular variables, related to R as:
202

IAEA-CN-100/116P
U = CR (2)
Its transmission matrix V is defined by the divergences of the Soller collimators. The effect of the presence of the Soller collimators is to modify S to:
S → S + ΣTI +CTVC (3)
Owing to the existence of the constraints, as the Bragg constraints are, the initial variables are not linearly independent and therefore the initial set R has to be reduced to a linearly independent subset R’. The initial variables can be expressed through R’ variables as:
R = CR’ (4)
The transmission matrix for the subset R’ is:
S’ = DTSD (5)
The final step is to write the relation between X, the resolution function variables (X = Q – Q0, ∆E – ∆E0 , Q = kI – kf, ∆E = E i – Ef and O0 , ∆E0 defines the most probable value of Q) and R’:
X = AR’ (6)
The resolution matrix M is given by:
M = [ AS’-1AT]-1 (7)
The Gaussian approximation of the resolution function is:
R( X ) = R0 (2π)-2 (detM)1/2 exp( -XTMX / 2) (8)
R0 being the normalization factor.
To obtain the line widths for different types of scans it is necessary only to define the scan variables Z, generally not linearly independent, related to X as:
Z = HX (9)
The scan variables covariance matrix is:
< zi zj > = HM-1HT (10)
and therefore the linewidth for the scan “i” is:
wi = (8ln2< zi2 >)1/2 (11)
3. The resolution function for a pulsed-source TOF neutron spectrometer with mechanical monochromator The experimental set-up is given in Figure1. As, in the first-order approximation there is no correlation between the horizontal (scattering) plane variables and the vertical variables, the corresponding computations should be performed separately and put together at the end. Therefore the first step is to define the initial variables vectors RH = (∆ki/ki0, l0, g0, lch), R’H = (lch, ls, gs, ld, gd, t0, tf ), RV = (z0, zch), R’V = (zch, zs, zd ). The co-ordinates g, l are respectively along the thickness and width, t0, tf define the neutron emission respectively detection and the subscript 0, s, d refer respectively to source, sample and detector. All the co-ordinates represent the deviation from the corresponding most probable value. For a given set-up the transmission matrices SH, S1H, SV, S1V can be computed in the normal approximation. In particular, for a given mechanical monochromator the term <(∆ki/ki0)2> can be computed.
203

IAEA-CN-100/116P
l0
Source
χ0
L0
MechanicalMonochromator
L1
L2 θs
θs
χs
χd
ls
ld
Sample
Detector
FIG. 1. The experimental set-up for all pulsed-source TOF spectrometer with
mechanical monochromator
The angular variables vectors UH = (γ0, γ1, γ2), UV = (δ0, δ1, δ2) are related to RH, R’H respectively RV, R’V as:
UH = CHRH, UH = C’HR’H UV = CVRV, UV = C’VR’V (12)
The matrices CH, C’H, CV, C’V are given by the expressions of the angular variables, according the set-up geometry:
22
11
0
0000
)sin()cos(sincos
)sin()cos(
sincos
Lglgl
Llgl
Lgll
ssssssdddd
chssssss
sch
χθχθχχγ
χθχθγ
χχγ
−−−−+=
−+++=
−−=
(13)
2
11
10
00 L
zzL
zzL
zz sdchsch −=
−=
−= δδδ (14)
The subscripts 0, 1, 2 refer respectively to source-monochromator, monochromator-sample and sample-detector regions. The variables χ0, χs, χd represents the moderator, sample and detector orientation angles, all measured in the trigonometric sense while 2θs is the scattering angle. For the angular variables the subscripts 0, 1, 2 refer to source-monochromator, monochromator-sample respectively sample-detector regions.
According to (3) the matrices SH, SV are modified as:
SHm = SH + TH0 +CHTVHCH S1Hm = S1H + ΣTHi +C’H
TVHC’H
SVm = SV + TVi +CVTVVCV S1Vm = S1V + ΣTVi +C’V
TVVC’V (15)
The correlation introduced by the mechanical monochromator is characterized by:
γ0 = γ1 (16)
To take into account this correlation we have to introduce the vector RHint = (∆ki/ki0, γ0, lch) related to RH as:
RHint = BHRH (17)
204

IAEA-CN-100/116P
where the matrix BH is given by the first relation (13), ∆ki/ki0, lch being common elements for RHint, RH. The covariant matrix for RHint is given by:
SHint-1 = BHSHmBH
T (18)
The presence of the mechanical monochromator also introduces of a correlation between RHint and R’Hm = (∆ki/ki0, lch, ls, gs, ld, gd, t0, tf):
RHint = B’HR’Hm (19)
The matrix B’H is given by:
1
10)sin()cos(
Llgl chssssss −+++
==χθχθ
γγ (20)
as ∆ki/ki0, lch are common elements for RHint and R’Hm . The transmission matrix for R’Hm is:
SH1f = B’HTSHintB’H + S1Hm (21)
In (21) the summation of matrix of different dimensions are performed after having added “0” elements for the matrix lines and columns corresponding to the unconsidered variables.
The correlation introduced by the mechanical monochromator is characterized, in vertical plane, by:
δ0 = δ1 (22)
To take into account this correlation we have to introduce the vector RVint = ( δ0, zch) related to RV as:
RVint = BVRV (23)
where the matrix BV is given by the first relation (14), zch being common element for RVint, RV. The covariant matrix for RVint is given by:
SVint-1 = BVSVmBH
T (24)
The presence of the mechanical monochromator also introduces of a correlation between RVint and R’V:
RVint = B’VR’V (25)
The matrix B’V is given by:
1
10 Lzz chs −== δδ (26)
as zch is common element for RVint and R’V . The transmission matrix for R’V is:
SV1f = B’VTSVintB’V + S1Vm (27)
In (27) the summation of matrix of different dimensions are performed after having added “0” elements for the matrix lines and columns corresponding to the unconsidered variables.
The next step is to define the mixed vectors
YH = (∆ki/ki0, γ0, ∆kf/kf0, γ1, lseff, gseff, ∆t), YV = (δ0, δ1, zs) related to RH and RV receptively as:
YH = DHRH YV = DVRV (28)
205

IAEA-CN-100/116P
The matrix DH is given by the following equation (29):
dd
dd
ff
i
i
i
fssss
i
fs
ssssi
fs
i
f
i
f
f
f
Lg
Lltt
mLk
kk
kk
LLL
kk
Lg
kk
Ll
kk
Lg
kk
Ll
kk
χχχθχθ
χθχθχχ
cossin)()cos()cos(
)sin()sin(cossin
220
2
0
00
0
2
10
0
0
2
0
0
20
0
0
2
00
0
0
2
0
0
+−−+∆+
−
−−+
+
−++−+−=
∆
0
)cos()sin(
)sin()cos(
ttt
glg
gll
f
ssssssseff
ssssssseff
−=∆
+++=
+++=
χθχθ
χθχθ
(30)
To these relations, the equation (13) must to be added. The term ∆ki/ki0 is common variable for RH, YH. The relation (29) is obtained from the relation giving the spread of the total time-of-flight, tf - t0:
000000
0 )(f
f
f
f
f
f
i
i
i
i
i
if k
kkL
kL
kk
kL
kLtt
m∆
−∆
+∆
−∆
=− (31)
For the considered geometry
ddddssssssf
ssssssi
fi
glglLglglL
LLLLL
χχχθχθχχχθχθ
cossin)cos()sin(cossin)cos()sin( 0000
210
+−−−−=∆−++++−=∆
=+=
(32)
In the relation (30) lseff, gseff are respectively the effective length and thickness of the sample, dimensions characterizing that part of the sample both illuminated by the incident beam and scattering neutrons capable to reach the detector.
The covariance matrix for the YH variables is given by:
NH-1 = DHS1H
-1DHT (33)
The DV matrix is given by the relation (14) tacking account that zs is a common variable for the two vectors, YH, RV. The covariance matrix for YV is:
NV-1 = DVS1V
-1DVT (34)
The final step is to relate YH to the XH = (X1, X2, X4) vector: XH = A YH (35) The A matrix is given by:
)(
'cos'sincossin
'sin'cossincos
004
10002
10001
ffii
ffii
ffii
kkkkm
X
kkkkX
kkkkX
∆−∆=
−∆++∆−=
−∆−+∆=
γϕϕϕγϕ
γϕϕϕγϕ
(36)
with ssfi
sf
kkk
θϕϕθ
θϕ 2'
)2cos()2sin(
tan00
0 −=−
= (37)
The resolution matrix M is:
M-1 = ANH-1AT (38)
We have only to complete the M-1 with the element M33-1given by:
M33-1 = ki0
2 NV11-1+kf0
2NV22-1 –2ki0kf0NV12
-1 (39)
206

IAEA-CN-100/116P
REFERENCES [1] COOPER, M.J., NATHANS, R., (1967), Acta Cryst., 23, 357-367.
[2] STOICA, A.D., Acta Cryst., (1975), A 31, 189-192.
[3] STOICA, A.D., (1975), Acta Cryst. A 31, 193-196.
[4] M.POPOVICI, A.D.STOICA and I.IONITA, (1987), J.Appl.Cryst., 20, 90-101.
[5] IONITA, I., (2001), J.Appl. Cryst, 34, 252-257.
[6] IONITA, I., STOICA, A.D., (2000), J.Appl. Cryst, 33, 1067-1074.
[7] IONITA, I., STOICA, A.D., POPOVICI, M., POPA, N.C., (1999),Nucl. Instr. and Meth., A 431, 509-520.
207

IAEA-CN-100/126P
Utilisation of Research and Training Reactors in the Study Programme of Students at the Slovak University of Technology J. Lipka, V. Slugen, J. Hascik, M. Miglierini Department of Nuclear Physics and Technology, FEI STU, Bratislava, Slovakia
Abstract. Preparation of operating staff for nuclear industry is and also has to be one of the most serious education processes mainly in the Central-European countries where about 40-50 % of electricity is produced in nuclear power plants. In the central-European Region exists a very extensive and also effective international collaboration in nuclear industry and education. Similarly good situation is also on the level of universities and technical high schools in this area. Slovak university of technology Bratislava established contacts with many universities in abroad in utilization of research and training reactors.
1. Introduction A possible impact of operator failure on safe an economically effective operation of NPP is very high. Despite the fact that the automation in NPP-control made a huge progress, the human activity on all levels of operation is the determining factor for safe and reliable operation of NPP. High level of the operating staff education is determined by:
- expertise of teachers, - motivation of students, - practical exercises, - material condition (textbooks, models, simulation programs), - effectiveness of education and training process (realistic time table, linkage of
knowledge etc.), - high level of basic education, good relation to mathematics, physics, computers,
technical orientation, theoretical knowledge and skills.
Technical universities like the Slovak University of Technology (STU) in Bratislava take responsibility for the level of technical education of graduates. Mathematics, Physics and other technical subjects are accented in the study. Without this theoretical knowledge it is not possible to control such a complicated technological process as nuclear fission reaction in NPP. Therefore, technical high schools and universities play one of the most important roles in the preparing process of NPP operating staff.
2. Education at STU focused on nuclear engineering The Slovak University of Technology is the largest and also oldest technological university in Slovakia. Surely more than 50% of high-educated technicians who work today in the nuclear industry graduated from this university. Its importance increased in the last few years because after political changes there is a small interest in study at Russian and Czech universities, where traditionally a lot of technicians graduated in the past.
Let me please introduce this University and present the education programme in one of its faculties (Faculty of Electrical Engineering and Information Technology) offered for students specialising in nuclear energy.
208

IAEA-CN-100/126P
The study at the Faculty of Electrical Engineering and Information Technology (FEI) STU in Bratislava is split into five basic specializations. They are:
- Automation, - Computer Science, - Electronics, - Material Engineering, - Power Plant Engineering and Power Electronics.
In every specialisation there is a fixed number of compulsory subjects. Also each of 17 Departments offers a group of optional subjects, from which every student can choose a subgroup of courses that interest them most and relate to their future specialisation. Some optional subjects can be studied at another university or university abroad.
Excellent students from all specializations can surely find jobs in the nuclear industry, but for the operating staff it is recommended to study Power Plant Engineering and Power electronics. There is a possibility (beside the obligatory subjects) to choose a batch of 12 optional subjects focused on peaceful use of nuclear energy.
Individual works of students (annual projects, diploma theses) in which they consult the independently earned knowledge with supervisors and experts from practice is very important. An extension of total study-length to 5,5 years created space for more precise elaboration of diploma thesis.
The offered obligatory subjects, oriented towards needs of the nuclear industry, are the following: A Undergraduate Study (Bc.)
Subject, semester, hours per week (lectures - seminars or practical exercises), Sources of Radiation (6th sem., 2-3h) Nuclear Power Facilities (6th sem., 2-2h) Nuclear Physics and Technology (7th sem., 2-3h) Materials of Nuclear Power Plants (7th sem., 2-2h) Reliability and Safety of Nuclear Power Plants (8th sem., 2-2h) Experiments on Research Reactors (8th sem., 0-3h)
Annual project
B Graduate Study ( MSc., Dipl.Ing.)
Theory of Nuclear Reactors (1st sem., 3-2h) Experiments on Research Reactors (1st sem., 0-3h) Decommission of Nuclear Power Plants (1st sem., 2-2h) Control of Nuclear Power Plants (1st sem., 2-3h) Experimental Reactor Physics (1st sem., 2-2h) Dosimetry (2nd sem., 2-2h) Operation of Nuclear Power Plant (2nd sem., 3-2h)
Diploma thesis
C Post-graduate Study (PhD.)
Nuclear and Neutron Physics Theory and Building of Nuclear Reactors Operation and Safety of NPP Dosimetry and Radiation Protection Materials and Decommissioning of Nuclear Facilities
209

IAEA-CN-100/126P
Besides these students there are several interdisciplinary students who attend one or more “nuclear subjects”. For example - in the last 2 years about 45 students attended the course Nuclear power facilities. These students obtained good knowledge, visited NPP and in the future, they will have an impact on the general public, although they will never work in nuclear industry.
3. Post-gradual courses - safety aspects of NPP operation The main goal of the post-gradual courses is to increase safety culture of NPP operation.
Target group: operation staff of NPP, NRA officers, nuclear safety specialists – all graduated from technical universities with at least two years practice in nuclear industry
Contractor: Slovenské elektrárne, Plc. Co-ordinator: Department of Nuclear Physics and Technology FEI STU Bratislava Scope: 191 hours of lectures, visit of experimental reactor (Vienna, Seibersdorf), 12
exams, Final report, final examination.
No Subject Scope (hours) Obligatory subjects 1 Nuclear and reactor physics 23 2 Nuclear safety 20 3 Quality insurance 15 4 Materials of NPP 10 5 Safety aspects of NPP technology 15 6 NPP safety systems 15 7 Accidents and events with impact on 15 the safety of NPP operation 8 Safety culture and human factor 15 9 WANO feedback 3 Final report 60 Optional subjects 10 Reliability of NPP 15 11 Radiation safety 15 12 Economic and ecological aspects 15 13 Fire safety 15 14 Automatic meas. and inspection systems 15 15 Chemical aspects of NPP 10 16 RA-waste and NPP decommission 15 4. International collaboration In general, there exists a very extensive and also effective international collaboration in nuclear industry. Similarly good situation is also on the level of universities and technical high schools. STU Bratislava established contacts with many universities abroad. Thanks to the support from Slovenské elektrárne Plc., student graduates in nuclear power engineering specialisation have had (hopefully will have also in the future) possibilities not only to visit and to get acquainted with VVER-440 NPP technologies, but also to travel to perform practical exercises at foreign training or experimental reactors as:
- TRIGA II Reactor in Atomic Institute of the Austrian Universities, Vienna, Austria (3 practical exercises per study for about 10 students yearly since 1990).
- School Reactor of the Technical University of Budapest, Hungary (one week per study, about 10 students yearly since 1983).
- Training Reactor of the ČVUT, Prague, Czech Republic (3 days per study, about 10 students yearly since 1998).
- Experimental reactor ASTRA in Austrian Research Centre Seibersdorf (1999-2000).
210

IAEA-CN-100/126P
Beside these short visits, there exist long-term fellowships of our students:
- nowadays four of students are studying (last 2,5 year of study) at the Friedrich-Alexander University Erlangen-Nürnberg , Germany, (supported by FRAMATOME-ANP), two new students will start in summer 2001
- since 1994 five Diploma practices at Brennelementlabor of Siemens AG, Erlangen
- ten students graduated (in 2000 and 2001) from the University Center of JINR Dubna, Russia (supported by Slovak Government)
- in 2001one student studied the last semester at Technical University München in area of neutron physics.
4.1. IAEA training course “Safety management and utilisation of research reactors” The 4 weeks IAEA Regional Training Course on Safety, Management and Utilization of Research Reactors was held in Bratislava (Slovakia) and Vienna (Austria) during March 05-30th 2001. IAEA in co-operation with the Department of Nuclear Physics and Technology of the Slovak University of Technology and the Atominstitut of Austrian Universities Vienna prepared and realized this training course with the aim to train junior staff from research reactors in various aspects of safety, management and utilization of research reactors.
All participants had to have at least 4 years experiences in operation, management, utilization or regulation of research reactors. Lectures covered the topics in nuclear design and operation, neutron physics, reactor physics, health physics, dosimetry, reactor instrumentation, fuel management decontamination procedures, preparation of experiments at research reactors and others. Beside theoretical part of the course, the practical exercises at TRIGA II reactor in Vienna constituted an important part of training.
The course was held in English for participants from 6 countries (Slovakia, Russia, Romania, Hungary, Ukraine, Turkey) and thank support of IAEA was fully provided with textbooks and laboratory guides.
4.2. ENEN – European Nuclear Education Network: feasibility study for Central-European region
In the frame of this project, prepared for the Central-European region, students participating in nuclear engineering education visited participating institutes and carried out laboratory practices and student as well as diploma work. Exchange of students and pedagogues between different Universities was performed, too. In the Central-European countries as Austria, Czech Republic, Hungary, Slovak Republic and Slovenia, the distance between participating partners allows to plan an exchange of students interested in nuclear engineering education. In fact, there is a tradition of long-term co-operation between Slovakia, Austria, Czech and Hungary base on the short-term students visits.
The ENEN project covers following basic aspects for creation of higher education network:State of the art,
- Prerequisites to enter the education, - Education curricula, continuing education, - Teachers qualification, - Student and teachers mobility, - Identifying the most adequate organisations to perform the education and training, - Teaching practice (distant learning, Euro-courses), - Co-operation with research institutions, - Needs of industry, - Pilot education sessions.
211

IAEA-CN-100/126P
In frame of ENEN project we organised and during 3 week in May 2003 also performed “Eugene Wiegner training course of reactors physics”
Participants of this course circulated between university laboratories and obtained knowledge through theoretical as well as practical exercises:
At the Budapest University of Technology and Economics (Budapest): - Neutron flux measurements on 100 kW training reactor, - Neutron activation analysis, - Water chemistry experiment, - Practising in control of the training reactor (driving the control of the training reactor), - Estimation of parameters of delayed neutron groups and estimation of the uranium concentration
of ores, - Criticality experiment, - Void effect and its measurement in practice, - Neutron detectors and their use.
At the Czech Technical University (Prague): - Properties of neutron detectors for nuclear reactor control, - Determination of the effect of various materials on the reactivity of the reactor, - Measurement of void coefficient of reactivity, - Measurement of thermal neutron flux density, - Measurements of reactivity by various methods, - Calibration of control rods, - Study of nuclear reactor dynamics, - Digital control systems of the research reactors, - Gamma spectroscopy and Neutron Activation Analyses.
At Slovak University of Technology (Bratislava): - Practical courses on Nuclear Electronics, - Excursions to nuclear power plants (NPP), - Selected techniques of NPP material analyses, - General course on accelerator technology and applications
At University of Technology (Vienna): - Determination of absorption cross sections, - Neutron radiography, - Rod calibration by period method, - Reactivity values of fuel rods in various core positions, - Thermal power calibration, - Temperature coefficient of reactivity, - Reactor transient operation, - Compensated ionisation chambers, - Self-powered neutron detectors, - Fuel temperature measurement
Based on the previous experiences the Slovak Nuclear Engineering Network (SNEN) was created in spring 2003. The following questions were discussed in detail: - WHY: capacities versus possibilities, - WHO: teachers, students, - WHAT: programs for effective study, - WHOW: forms of study, accreditation, - WHERE: practical exercises, technical tours.
212

IAEA-CN-100/126P
In the created network following institutions took part: Universities: Slovak University of Technology in Bratislava,
- Comenius University in Bratislava. Governmental organizations as: - Slovak Regulatory Authority, - St. Elizabeth Institute of Oncology, - State Faculty Health Institute. Industrial organizations as: - Slovenské elektrárne, a.s. - lDECOM Slovakia, - lRELKO, s.r.o. International Organization located in Slovakia: - CENS – Centre for Nuclear Safety.
5. Increasing of nuclear safety via proper education of students at the University Contribution to the increase of nuclear safety via human factor of graduates at the University can be seen in:
- University can contribute not only to the education but also to breeding of students which is a base also for the safety culture at NPP
- Readers at the university (professors, assistants, etc.) can kindle students for nuclear physics or at least, they can relieve them of distress from nuclear issues. The first contact is very important.
- University enables an optimal selection of students. The option for "nuclear education" is completely free and independent. The problem is that the amount of students starting these lectures is low.
- Proper education at the university is a source of knowledge and attitudes for the whole life. Theoretical and practical experiences, cautious attitude and consistence, are very important also from the safety culture point of view.
- During discussions with students, the pedagogue can form their professional orientations according to their abilities and needs. Good teacher encourages also the growth of student and forms his personality. Graduates have to learn to take responsibility for their decisions and their academic level of education.
- University lectures, seminars are open for public and this academic field can be made better use of in public relations area in the future. It is investment mainly to the young generation.
6. Conclusion Several specific features characterize education system in nuclear power engineering in Slovakia. Many of them were caused due to previous development in this field. Nevertheless, this system achieved certain level of quality, which has been confirmed not only through IAEA missions, but also in technical activities of organizations functioning in nuclear area. Slovak University of Technology is ready and would like to contribute to this system also in the future and hopefully on the international level.
213

IAEA-CN-100/126P
TAB. 1. Development of graduates amount in Nuclear Power Engineering at FEI STU since 1975.
REFERENCES [1] SLUGEN, V., HASCIK, J., Preparation of operating staff for German and Slovak NPPs,
Energetika 44, (1994), 58 (in Slovak).
[2] SLUGEN, V., KUCHTA, L., DUGOVIC, M., URBAN, F., Preparation of operating staff for the nuclear power plant, EE - Odborný časopis pre elektrotechniku a energetiku, 4 5 (1998) 52 (in Slovak).
[3] SLUGEN, V., Actual problems of education in physics and application of physicists in world, Obzory matematiky, fyziky a informatiky 52 (1998) 39 (in Slovak language).
[4] SLUGEN, V., LIPKA, J., HASCIK, J., STU Education Program in Nuclear Physics Focused for Nuclear Industry Needs. Physics Education, 17 (2000) 13.
2019
1724
1811
1915
1920
1811
1611
10101010
47
64
7
810
1321
8
prolongation of study f rom 5 to 5,5 years
0 2 4 6 8 10 12 14 16 18 20 22 24 26
1975
1976
1977
1978
1979
1980
1981
1982
1983
1984
1985
1986
1987
1988
1989
1990
1991
1992
1993
1994
1995
1996
1997
1998
1999
2000
2001
2002
2003
Yea
r
Amount of graduates
214

IAEA-CN-100/74P
Radiological Characterization of the Triton Facility Prior to Stage 3 Decommissioning E. Lopes, J. Gaudiau, D. Dubot, L. Pillette-Cousin Unités de Soutien Logistique et Technique, Direction de la Recherche Technologique Ile de France, CEA, Fontenay-aux-Roses, France
Abstract. The CEA Centre of Fontenay-Aux-Roses has launched the project of Stage 3 decommissioning of the Triton facility. The Triton facility, its history, status, dismantling objectives and methodology, together with specific zonings of dismantling, are briefly described.
1. Introduction The CEA Centre of Fontenay-Aux-Roses has launched the project of Stage 3 decommissioning of the Triton facility, classified on environmental protection grounds. At the end of the project, no significant artificial radioactivity will remain in the facility. The remaining buildings will not require particular monitoring.
The Triton facility was first operated in 1959. It was classified as the Basic Nuclear Installation (BNI) n°10. It was located in a hall, 30 m length, 22 m width and 20 m height. The facility comprised notably (see Figure 1) :
- Two research reactors Triton and Nereide, in a pool, - A dry pool called Naiade, used for experiments, - Several waste tanks, - Workshops for liquid waste treatment.
Progressively, some changes were brought in the facility layout and operating conditions: - 1960: creation of a hot cell for waste conditioning; - 1960 to 1965: changes in the operating conditions of the reactors:
o increase in power: Triton’s power increased from 1,2 MW to 6,5 MW, Nereide’s power climbed from few kW to 600 kW.
o mobility of the reactors the Triton reactor was first mobile along the longitudinal direction of the pool,
later on Triton reactor was stacked in the small compartment. The design of Nereide reactor was changed in order to move it from an
irradiation position to a stand-by position.
The Triton facility was used for research work, mainly in the field of: - Radiation shielding studies, - Research related to fundamental physics and structure of matter, - radioisotope production.
The Triton and Nereide reactors were shut down respectively in December 1981 and May 1982. From 1982 to 1987, the facility was decommissioned at the Stage 2. The work consisted of removing:
• the reactors (fuel and structures), • the primary and the secondary circuits, • the neutron beam ports.
215

IAEA-CN-100/74P
Then, the Triton was removed from the BNI list and classified on environmental protection grounds. From 1987 to 2000, this facility was used for some homologation tests of equipment.
FIG. 1. Triton Facility
2. Dismantling As of 2000, The CEA centre of Fontenay-Aux-Roses decided to dismantle this facility in order to install new laboratories and support activities, non related to the nuclear field. The project " Triton: Stage 3 decommissioning " implemented a dismantling methodology to achieve the following objectives:
- 1st objective: to cleanup and dismantle the facility at the IAEA stage 3, i.e. at the end of the decommissioning, no significant artificial radioactivity will remain in the building,
- 2nd objective: to remove the facility Triton from the list of classified facilities, - 3rd objective: to dismantle all the works of civil engineering and all the equipment
located in the building for its further use.
The implementation of the dismantling methodology has required to acquire a comprehensive knowledge of the radiological status of the facility. The artificial radioactivity present in the facility originates from two sources:
- surface contamination and its diffusion into the concrete, - neutron activation, located in the walls of the Triton/Nereide‘s pool and the Naiade
dry pool, close to the reactor positions and inside the neutron beam ports.
216

IAEA-CN-100/74P
The radionuclides present in the facility are beta and beta-gamma emitters, mainly 60Co and 63Ni. The radiological status of the facility was based on :
- a set of measurements realized at the end of the stage 2 decommissioning in 1987 - a second set of measurements performed in 1998, which gave more consistency and
credibility to the 1987 measurements.
Indeed, following complementary cleanup work in the hot cell, the dose rate into the cell dropped significantly, from 450 µGy/h in 1987 to values lower than 0,1 µGy/h in 1998.
This radiological status has allowed to define the “reference zoning“ of the Triton facility, with a classification of ‘non contaminating area’* with 19 risk points**, including the Triton pool, the dry pool Naiade, the hot cell, and the waste tanks...
* Non contaminating area: area where production, treatment, handling, use, storage or transport of radioactive material, except sealed sources are being carried out or have been carried out but where neither contaminating radioactive material nor equipment emitting particles able to activate outgoing waste have been used.
** Risk points: areas potentially contaminated, but whose contamination is currently confined.
The radioactive waste generated by decommissioning operations will come from the cleanup and removal of the risk points.
According to the reference zoning, all waste generated by the cleanup and decommissioning of the Triton pool and the hot cell is radioactive waste. Nevertheless, processing of measurement data showed that the reference zoning could be reviewed in order to reduce radioactive waste streams. So, a ‘specific zoning’ for each part of the facility containing one or several risk points was defined.
A specific zoning for dismantling is composed of 3 parts :
- a first part, describing the risk points, their history and radiological status; - a second part, more analytical, precisely identifies the past events having
consequences on the radiological status: at this point, a preliminary specific zoning can be established;
- a third part allows to finalize the specific zoning by means of radiochemical analysis of samples, use of calculation codes, in situ measurements by gamma spectrometry, ..
As an example, specific zoning of the Triton pool led to state that:
- water was responsible for contamination transport inside the Triton pool. As a result, the contaminated areas are located :
o on the internal walls of the pool, inside the epoxy resin coating and a 2 cm thickness inside the concrete;
o bottom floor of the pool, including tiles, seals and cement coating.
- the radioactivity induced par neutron activation is located:
o one meter around the five neutron beam ports set in the radiological shielding of Triton pool,
o around the irradiation window, between the Nereide reactor and the Naiade dry pool.
217

IAEA-CN-100/74P
Finally, according to the specific zonings of dismantling, waste generated by dismantling work will be:
- 1200 m3 of conventional waste, mainly concrete and metal scrap. This waste is to be disposed of in dedicated facilities, accepted by the CEA centre of Fontenay-Aux-Roses.
- 250 m3 of very low level waste (VLLW), mainly concrete and technological waste. This waste is eventually to be disposed of at the ANDRA’s repository for VLLW.
It is not planned to produce low level radioactive waste.
The implementation of the specific zonings results in a very important reduction (about 60%) of the amount of radioactive waste to be generated. Nevertheless, this strategy has led to an increase of the Triton Project overall cost , due to the need to :
- perform complementary studies; - increase cleanup work: for instance removal by scraping and shaving of the
contaminated inner parts of the pool and cutting into blocks of the activated part of the radiation shielding, instead of cutting into blocks all the pool.
3. Conclusions The dismantling work, currently in progress, is promising in terms of experience feedback, especially concerning the specific zoning methodology and the cleanup and cutting techniques of contaminated concrete.
This experience feedback will be beneficial not only for the future decommissioning projects planned at the CEA centre of Fontenay-Aux-Roses, for which the issue of alpha contamination is more crucial, but also on the other sites where facilities have to deal with activities originating from both contamination and activation.
218

IAEA-CN-100/77P
Decommissioning of the Prototype Fast Breeder Reactor KNK in Germany K. Brockmann, W. Pfeifer, I. Hillebrand Forschungszentrum Karlsruhe, Karlsruhe, Germany
Abstract. The Compact Sodium-cooled Nuclear Reactor Facility (KNK) was an experimental nuclear power plant of 20 MW electric power erected on the premises of the Karlsruhe Research Center. The plant was initially run as KNK I with a thermal core between 1971 and 1974 and then, between 1977 and 1991, with a fast core as the KNK II fast breeder plant. The plant was shut down in August, 1991, after Germany drops out of the fast breeder technology for political reasons. According to the decommissioning concept, the plant shall be dismantled completely (green field) in 10 steps. The first eight steps have been completed already. This means that the fuel elements and the sodium coolant were removed, no longer required facilities and systems were shut down, and the cooling towers and machine hall were demolished. The secondary and primary sodium circuits have been disassembled completely. The rotary lid of the vessel was dismantled in 2002. Only the reactor vessel with its internals, the primary shield, and the biological shield are still inside of the plant and will be dismantled in the next future as step nine. The maximum dose rate in the middle of the vessel was measured in November 2002 to be 27 Sv/h. In the 10th step, the remaining auxiliary are to be dismantled and any buildings remaining are to be decontaminated, measured for clearance, and then demolished, if necessary. Then the site is to be recultivated. The work is to be finished probably at the end of 2007.
1. Introduction The Compact Sodium-cooled Nuclear Reactor Facility (KNK, Fig. 1) was an experimental nuclear power plant of 20 MW electric power erected on the premises of the Karlsruhe Research Centre. The plant was initially run as KNK I with a thermal core between 1971 and 1974 and then, between 1977 and 1991, with a fast core as the KNK II fast breeder plant.
FIG. 1. KNK during operation before 1991
KNK played a central role in the development of fast breeder technology in Germany, as it served as an experimental facility for the investigation of major pertinent issues. After having reached its objectives and following the abandonment of the fast breeder technology in
219

IAEA-CN-100/77P
Germany, KNK was finally shut down on 23 August 1991. Under the decommissioning concept, the plant is to be decommissioned completely to green field conditions till the end of 2007.
All activated and/or contaminated materials are transferred to the Central Decontamination Operation Department (HDB) of the Karlsruhe Research Centre, which processes them under consideration of the final disposal requirements, and stores them in interim storage.
The difficulty involved especially in dismantling KNK, on the one hand, is posed by the residual sodium in the plant, which determines the choice of neither wet nor thermal techniques to be used in disassembly. Another difficulty is caused by the depth of activation by fast neutrons, as a result of which not only the reactor vessel proper, but also the entire primary shield (60 cm of gray cast iron) and large parts of the biological shield must be disassembled and disposed of under remote control.
2. Permits and deadlines Under the decommissioning concept, the plant is to be decommissioned completely to green field conditions in ten steps, i.e. under the corresponding ten decommissioning permits. To this day, nine decommissioning permits have been issued, the first one in 1993 and the most recent one, number nine, in 2001.
The decommissioning and demolition activities covered by decommissioning permits 1 to 7 have been completed. Under the 8th Decommissioning Permit, the components of the primary system and the rotating reactor top shield are to be removed by June 2002.
The 9th Decommissioning Permit covering disassembly of the reactor vessel and the biological shield was submitted in July 1999 and the permit was issued in March 2001. Meanwhile, planning and manufacturing are nearly completed and, at the present time, assembly work is going on. From spring 2004 on, the reactor vessel and its internals are to be dismantled and disposed of; after early 2005, the primary shield and the biological shield will be handled in the same way.
Under the 10th and last Decommissioning Permit, the remaining auxiliary systems (sodium washing plant, ventilation plant, liquid effluent system, gaseous effluent system, etc.) are to be dismantled and any buildings remaining are to be decontaminated, measured for clearance, and then demolished, if necessary. Then the site is to be re-cultivated. The work is to be finished probably at the end of 2007.
3. Disassembly and demolition steps carried out so far
3.1. Disposal of fuel The most important measure taken immediately after the definitive shutdown of KNK was unloading and removal of all fuel elements and blanket elements of the two core loadings. After a reprocessing contract had been signed with CEA, this was achieved in 1993 when the fuel elements were shipped to Cadarache, France. As reprocessing was found to be impossible because of insufficient solubility of the fuel, a concept is being developed under which the fuel pins are to be returned to Germany for interim storage pending final direct disposal.
3.2. Disassembly and demolition work under the 1st and 2nd decommissioning permits The water from the tertiary system (turbine, steam generator etc.) had been drained immediately after permanent shutdown. Finally, also the sodium in the secondary systems was transferred to the tank provided for this purpose.
220

IAEA-CN-100/77P
The first two decommissioning permits covered mainly the conventional parts of the nuclear power plant. On the basis of those permits the turbine, generator, and water treatment plant were dismantled, the external fence around the plant was removed, and the physical protection centre was disbanded. Finally, the technical plant infrastructure was further simplified.
3.3. Disposal of sodium (3rd and 4th decommissioning permits) Removing the sodium is one of the most difficult problems to be solved in decommissioning sodium-cooled nuclear power plants. After completion of extensive technical and radiological studies, a contract was signed with UKAEA in co-operation with the UK Atomic Energy Authority under which the sodium of KNK is to be disposed of in a plant in Dounreay, Scotland, built specifically to dispose of the more than 1500 t of sodium from the Prototype Fast Reactor.
Sodium disposal from the secondary and primary systems was covered by the 3rd and 4th Decommissioning Permits. The roughly 53 t of secondary sodium were only contaminated by tritium. The primary sodium (approx. 36 t) was slightly activated by Na-22 and contaminated with cesium and tritium. The sodium therefore was filled into 200 l drums in specially built filling stations in KNK, and transported to Dounreay. In Dounreay, the sodium is to be converted into caustic soda solution by treatment with water. Radionuclides, especially Cs-137, are to be removed by means of ion exchange resins.
3.4. Disassembly and demolition work under the 5th to 7th decommissioning permits While sodium disposal went on, disassembly and demolition work was performed on the secondary system, most of these steps being covered by the 5th Decommissioning Permit.
The 6th Decommissioning Permit had been developed specifically for those final simplifications to the plant infrastructure which had now become possible because of the further reduced risk. Thus, the use of argon as an inert gas for the primary system was given up in favor of nitrogen; the electric power supply was simplified from a three-line to a single-line design. The remaining emergency power diesel plant had become redundant. In-service inspections and, consequently, the expenditures for maintenance and repair were reduced drastically. Moreover, a number of buildings no longer needed, such as the turbine hall (Fig. 2), the steam generator building, and the auxiliary plants building were demolished.
FIG. 2. Demolition of the turbine hall
The seventh disassembly and demolition step included work preparing for disassembly of the primary systems. Especially the ventilation systems were adapted, the electrical and instrumentation and control systems of the primary systems were removed, and the main entrance lock leading into the containment was replaced by a simple lifting gate.
221

IAEA-CN-100/77P
3.5. Disassembly and demolition of the primary systems (8th Decommissioning Permit) The components of the primary systems had been installed in two shielded, hermetically sealed cells (primary cells), which had been flooded with nitrogen because of the sodium. These cells had been accessible through a small hatch for revision work. For disassembly and dismantling purposes, the 1.40 m thick ceiling of the primary cell had to be removed. The ceiling consisted of very-high-density concrete doped with steel spheres to a density of 4.14 g/cm3. The steel spheres made concrete demolition by conventional techniques, such as drilling and band sawing, impossible. Instead, a chisel combined with a large suction plant was used successfully. Figure 3 shows a view into the open, partly dismantled primary cell; at the top and the bottom of the picture, the two intermediate heat exchangers can be seen which had not been removed at that point in time..
FIG. 3. View into the primary cell
In dismantling the primary systems, special attention had to be paid to residual quantities of sodium as well as the associated contamination, mainly with Cs-137, in components and pipes. This was the reason for the most stringent requirements so far imposed in dismantling and demolition of KNK. In the disassembly phase, some large components had to be removed, among other items, which later had to be taken apart separately and inspected for sodium residues. For this purpose, two special re-disassembly stations were installed. One of these stations was equipped with a log band saw with an opening of 1.20 m for the disassembly of large components. The other re-disassembly station was equipped especially for disassembling components containing large amounts of sodium and, as a consequence, emitting more radiation, such as the intermediate heat exchangers (Fig. 4).
Another large component to be removed was the primary sodium dump tank. It was located below the primary cell and was accessible only after complete disassembly of the primary cell and removal of the ceiling below the cell (Fig. 5). The tank was lifted to the level of the roadway in one piece and then moved into the open air through the installation opening by means of heavy-duty cranes. It was then deposited on a platform car and transported to the
222

IAEA-CN-100/77P
waste facilities (HDB). In order to remove the sodium, the required moisture was applied by KNK staff at HDB for reasons of space.
FIG. 4. Disassembly of an intermediate heat exchanger
FIG. 5. View of the primary sodium dump tank
Immediately after disassembly of the primary systems, disassembly of the rotating tops of the reactor vessel was initiated.
More technical details about the decommissioning of KNK can also be found in the literature [1 - 3].
4. Dismantling the reactor vessel, the primary shield and the biological shield
4.1 Initial condition After completion of the first eight decommissioning permits, the only remnants of the plant still in existence are the reactor vessel with its internals installed in the primary shield and the biological shield. These components are located in the middle of the containment in the
223

IAEA-CN-100/77P
reactor building (Fig. 6). The reactor vessel is inerted with nitrogen and closed with a lid. Other installations still in place are the ancillary plants building, the control room building, and a storage facility. The reactor building and the ancillary plants building are part of the controlled area. They contain some systems important in the decommissioning process, namely the ventilation system, the washing system for components wetted with sodium, and the moderator store, which must be converted into a buffer store.
The residual sodium volume in the reactor vessel was estimated to amount to approx. 30 l. The maximum Co-60 activation is on the order of 107 - 108 Bq/g; the maximum dose rate in the middle of the vessel was measured in November 2002 to be 27 Sv/h.
FIG. 6. Cross section through the KNK containment after
completion of the 8th Decommissioning Permit 4.2 Dismantling of the reactor vessel Before dismantling of the reactor vessel is begun, the gas room inside of the vessel is treated with a wet gas. For this purpose, the nitrogen is added humidity with water so that any particulate sodium deposits can be immobilized. Then the vessel is dried.
The reactor vessel with its internals (Fig. 7) are to be disassembled within the existing shielding, i.e. the biological shield, for radiological reasons. The internals of the reactor vessel are to be dismantled inside out. The internal vessel and the external vessel must be dismantled from bottom to top because they are suspended from an upper flange.
224

IAEA-CN-100/77P
Because of the hazard of sodium fires, only mechanical cutting techniques, such as sawing, milling, drilling, or cutting, may be used to dismantle the reactor vessel and its internals.
For the purpose of dismantling the reactor vessel within the existing shield, a shielding enclosure (Fig. 8) will be erected at the working level above the reactor vessel. The enclosure must have a shielding of 35 cm of steel required for radiological reasons and has to ensure separation from the containment in terms of ventilation. It will be equipped with a handling cell, an intervention cell, a double-lid lock and a transfer lock for building rubbish, and all the necessary auxiliary systems (lifting gear, rails, lead glass windows, manipulators).
FIG. 7. Reactor vessel with internals
On the top of the enclosure a transport flask will be positioned for transportation of the sodium wetted components to the washing plant and the buffer store in the ancillary building. At the bottom of the enclosure a container will be positioned under the double lid lock for transportation of the 200 l drums to the waste facilities at HDB. The transport flask and the containers are also made of a shielding of 35 cm of steel.
To minimize the exposure dose and for saving dose-rate the radioactive components will not be moved to the waste facilities (HDB) in larger sections. All cuts must be made so that the parts can be packaged in 150 l drums or baskets. The number of packages produced is to be optimized in order to save costs of interim storage and final storage.
For cutting the components to the right dimensions a dismantling machine is to be inserted into the reactor vessel (Fig. 9). It can be positioned in a variety of locations and will achieve self-bracing at the level of the cutting position. The manipulator must be designed so that it can handle, by means of a carrier system, all tools needed to disassemble all internals and the vessel proper. The necessary support systems and devices/auxiliary tools are to be harmonized and, as a consequence, minimized in number.
225

IAEA-CN-100/77P
4.3 Disassembly of the primary shield At the level of the reactor core, a niche in the biological shield, contains the primary shield made of cast iron with lamellar graphite. The aggregate mass of the primary shield is approx. 90 Mg. The activation is about 106 Bq/g. Therefore, the primary shield must be dismantled completely by remote handling techniques.
FIG. 8. Hot cell enclosure
FIG. 9. Dismantling machine (as scheme inside the vessel and as picture)
226

IAEA-CN-100/77P
4.4 Dismantling of the biological shield
Fig. 10. Dismantling of the biological shield
The biological shield surrounding the reactor core consists of very high density concrete doped with steel spheres (density, 4.14 g/cm3). The concrete has a maximum Co-60 activation of 8 x 10⁵ Bq/g, which means that disassembly must be carried out mostly by remote techniques (Fig. 10).
The depth of demolition is determined by the depth of activation in the concrete. According to the new Radiation Protection Ordinance, unrestricted clearance of building rubble requires compliance with the clearance level for Co -60 of 0.09 Bq/g. Most probably, a total of 330 Mg of very high density concrete must be disposed of as radioactive waste.
4.5 Handling the waste Within the framework of the 9th decommissioning permit, the following masses and activities must be handled:
Components Mass (Mg)
Total Co-60 activity as per Jan. 1, 2001
(Bq)
Number of packages
Reactor vessel (steel) approx. 43 1,7 E+14 approx. 150 drums of 200 l Primary shield (grey cast iron) approx. 90 2,5 E+13 approx. 220 drums of 200 l Thermal insulation (fire clay) approx. 28 2,6 E+11 approx. 10 type-II containers Biological shield (very high density concrete)
approx. 330 6,2 E+12 approx. 100 type-II containers
The residues steel and grey cast iron will be packaged into 200 l-drums and stored in the HDB interim storage for ILW-Waste. After some half-lifetimes of cobalt and packaging the drums into a shielded container, the waste fulfil the KONRAD repository requirements. The residues fire-clay and concrete will be directly packaged into shielded KONRAD containers and stored in the HDB interim storage for LLW-Waste, ready for final disposal.
5. Last step After removal of the biological shield, the remaining auxiliary systems (sodium washing plant, ventilation system, liquid effluent system, exhaust gas system, etc.) shall be removed. The remaining buildings are to be decontaminated, measured for clearance and demolished. Finally, the premises shall be re-cultivated.
227

IAEA-CN-100/77P
6. Conclusions Decommissioning of KNK started immediately after final shutdown in August 1991 without any technical or organizational preparations being made in advance. The plant is planned to be dismantled to a green field by the end of 2007, i.e. after a dismantling time of 16 years. World-wide, there are several fast breeder reactors that have been shut down for far longer periods. However, none of these plants has been subjected to dismantling, including primary circuit components, so far. In this respect, KNK well assumes a pioneer role.
REFERENCES [1] KATHOL, W., RÜDINGER, V., Proc. Spectrum ´98, Am. Nuclear Society; 1998, La
Grange Park IL; S. 251-261.
[2] HERZOG, G., KATHOL, W., Tagungsband VI. Stilllegungskolloquium Hannover 2000; S. 89-102.
[3] RÜDINGER, V., Forschungszentrums Karlsruhe Nachrichten, Jahrgang 33, 03/2001, Stillegung kerntechnischer Anlagen, S. 235-244.
[4] HILLEBRAND, I., Tagungsband KONTEC 2001; Kontec GmbH, Hamburg; p 318-325.
228

IAEA-CN-100/40P
Corrosion Monitoring of Aluminium Alloys in the TRIGA IPR-R1 Research Reactor C.F.C. Neves, M.M.A.M. Schvartzman, W.R.C. Campos, N.N. Atanazio Filho Centre for Development of Nuclear Energy (CDTN), National Commission of Nuclear Energy (CNEN), Belo Horizonte, Minas Gerais, Brazil
Abstract. Aluminium alloys and stainless steels have been used as cladding materials for nuclear fuel in research reactors, such as the TRIGA IPR-R1 reactor, located at the Centre for Development of Nuclear Energy in Belo Horizonte, Brazil. In order to develop a fundamental understanding of the corrosion problems with aluminium- and stainless steel-clad in the TRIGA IPR-R1 reactor, a monitoring programme has been initiated, as part of an IAEA sponsored Regional Technical Co-operation Project for Latin America (RLA/4/018). The programme consists of in-pool tests using corrosion surveillance coupons made of aluminium alloys and stainless steel. This paper presents the surveillance programme developed for the TRIGA IPR-R1 reactor and the analysis of the first corrosion rack removed from reactor in July 2003, after 1 year of exposure.
1. Introduction The TRIGA IPR-R1 is a pool type, light water refrigerated and graphite reflected research reactor supplied by General Atomics. It is located at the Centre for Development of Nuclear Energy (CDTN), which is part of the Brazilian Nuclear Energy Commission. Its first criticality was achieved in 1960 and the integrated burn-up of the reactor since its first criticality until the present time is about 130 MW-Days. Enrichment of the fuel is 20 % and the diameter and the length of the rods are 37,6 mm and 724 mm, respectively. About 220 operations of the reactor are performed each year to carry out irradiation of materials samples and experiments in the fields of radiochemistry, nuclear physics and reactor physics.
Recently the reactor had its nominal power increased from 100 kW to 250 kW. To the reactor core, previously composed of 59 UZrH rods with 1100-F aluminium alloy cladding, were then added 4 new UZrH rods with AISI 304 stainless steel cladding. In the reactor pool there is one rack capable to store up to 6 spent fuel elements [1]. One of these positions is occupied by a partially burned spent fuel element. The concern about this set of fuel elements with different clad materials recommended that a corrosion-monitoring programme would be carried out, due to a possible galvanic corrosion in contact areas. The operational history of TRIGA type reactors showed that this coupling did not lead to any important security problem, but that advice on careful monitoring is a necessity.
In order to develop a fundamental understanding of the corrosion problems with aluminium- and stainless steel-clad in the TRIGA IPR-R1 reactor, a monitoring programme has been initiated, as part of an IAEA sponsored Regional Technical Co-operation Project for Latin America (RLA/4/018) [2].
The programme consists of in-pool tests using corrosion surveillance coupons made of aluminium alloys and stainless steel. Three corrosion racks were immersed in the TRIGA reactor pool in July 2002. They are expected to be removed after one, two and three years of exposure. Analyses of corroded surfaces will then be made to quantify the extent of surface pitting as a function of pool water parameters.
This paper presents the monitoring programme developed for the TRIGA IPR-R1 reactor and the evaluation of the first corrosion rack removed from the reactor pool in July 2003.
229

IAEA-CN-100/40P
2. Experimental procedure Corrosion coupons included 1050, 6061 and 5052 aluminium alloys and SS 304 stainless steel. They are 100 mm and 70 mm circular disks of 3 mm thickness with a central hole designed to fit over the insulated stainless steel rod rack. The nominal compositions of the aluminium alloys and AISI 304 stainless steel are shown in Table I.
Table I. Nominal compositions of aluminium alloys and stainless steel (Wt. %) [3].
Element Al 1050 Al 6061 Al 5052 AISI 304
Al Min. 99.5 98 97.25 – C – – – Max. 0.08 Cr – 0.04 – 0.35 0.15 – 0.35 18 – 20 Cu Max. 0.05 0.15 – 0.4 Max. 0.1 – Fe Max. 0.4 Max. 0.7 Max. 0.4 66.345 – 74 Mg Max. 0.05 0.8 – 1.2 2.2 – 2.8 – Mn Max. 0.05 Max. 0.15 Max. 0.1 Max. 2 Ni – – – 8 – 10.5 P – – – Max. 0.045 S – – – Max. 0.03 Si Max. 0.25 0.4 – 0.8 Max. 0.25 Max. 1 Ti Max. 0.03 Max. 0.15 – – V Max. 0.05 – – – Zn Max. 0.05 Max. 0.25 Max. 0.1 –
Surface preparation and treatment of the aluminium alloy coupons were identical to that given to Al-clad fuel plates. All of the coupons were machined, polished to semi-bright, identified, degreased and given the same surface treatment (pickling in hot sodium hydroxide solution, cleaning, rinsing, neutralization and drying). One machined and polished Al 1050 coupon per rack was rinsed, degreased and pre-oxidized in water at 368.15 K for 24 hours. One of the surfaces of this coupon was scratched with a 0.5-mm scriber to simulate a damaged fuel element surface. Ceramic disks of non-porous alumina separate the individual coupons and the coupled coupons, one from the other. A 150-mm acrylic disc was added to avoid contact with the reactor walls and internals. The coupons were assembled in a corrosion rack (see Figure 1) in the order shown in Table II.
Three corrosion racks (numbered 41, 42 and 43) were immersed in the TRIGA reactor pool in July 2002 at 3.4 m above the reactor core and at 2.7 m below the level of the water. Prior to exposure, photographs of all of the coupons (front and reverse sides) were taken. Figure 2 shows the corrosion racks position in reactor pool.
230

IAEA-CN-100/40P
Table II. Description of the corrosion rack. Order Description of the coupon
1 Al 1050 2 Al 6061 3 Al 1050 (pre-oxidized and scratched) 4 Al 1050 - Al 1050 (couple) 5 Al 1050 - Al 6061 (couple) 6 Al 6061 - Al 6061 (couple) 7 Al 1050 - AISI 304 (couple) 8 Al 6061 - AISI 304 (couple) 9 Al 5052 - AISI 304 (couple)
FIG. 1. Corrosion test rack.
FIG. 2. Position of the corrosion racks in the reactor pool.
A detailed characterization of the reactor pool water during the exposure period has been made from the existing water sampling and analysis program of TRIGA reactor. The species Cl-, F-, NO2
-, NO3- and SO4
- were determined by liquid chromatography, Na and Cs, by atomic emission spectroscopy and Sr, Li, Mn and Zn, by atomic absorption spectroscopy.
The conductivity of water samples was determined by conductimetry and pH by potentiometry. After withdrawal, the corrosion rack 41 was evaluated according to the test protocol developed for Project RLA/4/018 [1], comprising visual inspection, pH determination, photographs of all the coupons and qualitative observation of pitting corrosion.
231

IAEA-CN-100/40P
3. Experimental results The corrosion rack 41 was removed from reactor in July 2003 and examined for corrosion detection. Measure of pH of water on the external surface of coupons was done prior to disassembly and compared with pH of bulk water. About the same value was verified in both samples (pH = 6.5). The corrosion rack 41 after 1 year of exposure in TRIGA IPR-R1 reactor pool is shown in Figure 3. It can be seen that the coupons have different colours, specially the coupled ones. The third uncoupled coupon (alloy AA 1050 pre-oxidized and scratched) is the only one with the same appearance as before exposure. The water chemistry and conductivity of TRIGA IPR-R1 reactor pool is shown in Table III.
FIG. 3. Corrosion rack 41 after 1 year of exposure in TRIGA IPR-R1 reactor.
Table III. TRIGA IPR-R1 water conditions.
Cl- NO2- NO3
- SO4- Na Li Sr Mn Cs Zn
(mg/ ) (mg/ ) (mg/ ) (mg/ ) (mg/ ) (mg/ ) (mg/ ) (mg/ ) (mg/ ) (mg/ ) < 0.10 < 0.10 < 0.25 < 0.25 < 0.02 < 0.02 < 0.02 < 0.02 < 0.02 < 0.02
pH = 6.7 (22.7 ºC) Conductivity = 1.30 µS/cm (23.8 ºC)
The coupons were removed from rack The front and reverse sides of each coupon were photographed and examined for pitting corrosion detection. Figure 4 shows the appearance of the uncoupled aluminium alloys coupons. Except for the pre-oxidized and scratched coupon, it can be seen that the coupons present pitting corrosion, mainly near the centre.
232

IAEA-CN-100/40P
a) Uncoupled Al 1050 Side A
b) Uncoupled Al 1050 Side B
c) Uncoupled Al 6061 Side A
d) Uncoupled Al 6061 Side B
e) Uncoupled Al 1050 Side A
pre-oxidized and scratched f) Uncoupled Al 1050 Side B pre-oxidized and scratched
FIG. 4. Uncoupled 1050 and 6061 Al alloy coupons after 1 year of exposure in the TRIGA IPR-R1 reactor.
Figures 5 to 7 show corrosion results for the couples Al 1050/Al 1050, Al 6061/Al 1050, Al 6061/Al 6061, Al 1050/AISI 304, Al 6061/AISI 304 and Al 5052/AISI 304.
233

IAEA-CN-100/40P
a) External surfaces of: 1050
and 1050 Al alloy couple
b) Crevice surfaces of: 1050
and 1050 Al alloy couple
c) External surfaces of: 6061
and 1050 Al alloys couple
d) Crevice surfaces of: 6061
and 1050 Al alloys couple
FIG. 5. Coupled 1050 and 6061 Al alloys Coupons after 1 year of exposure in TRIGA IPR-R1 reactor.
234

IAEA-CN-100/40P
a) External surfaces of: 6061
and 6061 Al alloy couple
b) Crevice surfaces of: 6061
and 6061 Al alloy couple
c) External surfaces of : AISI 304
and 1050 Al alloy couple
d) Crevice surfaces of: AISI 304
and 1050 Al alloy couple
FIG. 6. Coupled 1050 and 6061 Al alloys and AISI 304 coupons after 1 year of exposure in TRIGA IPR-R1 reactor.
235

IAEA-CN-100/40P
a) External surfaces of: AISI 304
and 6061 Al alloy couple
b) Crevice surfaces of: AISI 304
and 6061 Al alloy couple
c) External surfaces of: 5052 Al alloy
and AISI 304 couple
d) Crevice surfaces of: 5052 Al alloy
and AISI 304 couple
FIG. 7. Coupled 6061 and 5052 Al alloys and AISI 304 coupons after 1 year of exposure in TRIGA IPR-R1 reactor.
236
IAEA-CN-100/40P
The following observations could be made from analysis of rack 41:
— Pitting corrosion attacked most of Al alloys coupons. — The top surfaces of uncoupled coupons had more pits than their reverse sides due to
dust settling. — The uncoupled Al 1050 coupon had more pits than the uncoupled Al 6061 coupon. — The crevice surfaces of 1050/1050, 1050/6061 and 6061/6061 Al alloy coupons were
stained but apparently there were no pits on them and no evidence of crevice corrosion.
— The surfaces of the Al alloys within the crevices of 1050/AISI 304, 6061/AISI 304 and 5052/AISI 304 were pitted, indicating corrosion of aluminium coupled to stainless steel. The steel surfaces were only stained.
4. Conclusions The corrosion-monitoring programme at CDTN, formally in place since the middle of 2002, has provided a means to evaluate the corrosion of aluminium alloys in the TRIGA IPR-R1 reactor, especially regarding galvanic corrosion. The examination of the first corrosion rack, withdrawn in 2003, showed that pitting corrosion is the dominant mechanism involved and that the most important parameter affecting this corrosion was galvanic coupling between aluminium and stainless steel coupons. The reactor pool water conditions do not indicate any aggressive ions responsible to promote pitting corrosion on aluminium alloys. The presence of pitting corrosion on uncoupled 1050 and 6061 Al alloy coupons may be due to scratches and imperfections in protective oxide coating on their surfaces. This can also be confirmed by the absence of pitting corrosion on pre-oxidized 1050 Al coupon.
The next steps of the corrosion rack evaluation are to carry out a quantitative analysis of pitting corrosion with the help of an optical microscope and an image analyser and to perform metallographic examination of the coupons to determine pit depth.
Acknowledgement This paper was done with information from the work developed under the IAEA sponsored Regional Technical Co-operation Project for Latin America (RLA/4/018). The authors would like to thank the IAEA for the financial support.
REFERENCES [1] VELOSO, M. A. Análise Termo-Hidráulica do Reator TRIGA IPR-R1 a 250 kW, Belo
Horizonte, CDTN/CNEN, 141 p., (1999), Nota Interna NI-CT4-02/99.
[2] RAMANATHAN, L.V., HADDAD, R., RITCHIE, I., Corrosion surveillance programme for Latin American research reactor Al-clad spent fuel in water, RERTR 2002, Proceedings of the International Meeting on Reduced Enrichment for Research Reactors, Bariloche, Argentina, November (2002).
[3] MatWeb – Material Property Data. http://www.matweb.com.
BIBLIOGRAPHY [4] CHANDLER, G.T., SINDELAR, R.L. and LAM, P.S. Evaluation of water chemistry on
the pitting susceptibility of aluminium. NACE Corrosion/1997, paper No. 104, Houston, Texas: National Association of Corrosion Engineers (1997).
[5] HOWELL, J.P. Criteria for corrosion protection of aluminium-clad spent nuclear fuel in interim wet storage. NACE Corrosion/2000, paper No. 200, Houston, Texas: National Association of Corrosion Engineers (2000).
237

IAEA-CN-100/40P
[6] HOWELL, P.H., Corrosion surveillance in spent fuel storage pools. NACE Corrosion/1997, paper No. 107, Houston, Texas: National Association of Corrosion Engineers (1997).
[7] HOWELL, P.H. Corrosion of aluminium-clad spent fuel in reactor basin water storage. NACE Corrosion/1995, Houston, Texas: National Association of Corrosion Engineers (1995).
[8] MICKALONIS, J.I., WIERSMA, B.J., Test protocol for aluminium based spent nuclear fuel. NACE Corrosion/1999, paper No. 477, Houston, Texas: National Association of Corrosion Engineers (1999).
[9] PEACOCK, H.., SINDELAR, R.L., LAM, P.S. and MURPHY, T.H. Experiments for evaluation of corrosion to develop storage criteria for interim dry storage of aluminium-alloy clad spent nuclear fuel, Proceedings of the Topical Meeting on DOE Spent Nuclear Fuel-Challenges and Initiatives, Salt Lake City, Utah, December (1994) pp. 76-82.
238

IAEA-CN-100/42P
Shielding and Criticality Safety Analyses of a Latin American Cask for Transportation and Interim Storage of Spent Fuel from Research Reactors
H.M. Dalle1, 2
, E.B. Tambourgi2
1Centro de Desenvolvimento da Tecnologia Nuclear – CDTN/CNEN,
Cidade Universitária Pampulha, Belo Horizonte, 2Faculdade de Engenharia Química - UNICAMP,
Cidade Universitária "Zeferino Vaz", Campinas,
Brazil Abstract. Shielding and criticality safety calculations carried out for the Latin American interim storage and transportation cask are presented. Such a dual purpose cask is being designed for the spent fuel elements of research reactors in the region. The Monte Carlo transport code MCNP4B was utilized for the criticality safety analysis part, and SCALE4.4A for shielding. The analyses considered two types of fuel assemblies utilized in the region and the results show that both types can be loaded in the designed cask baskets in compliance with the safety criteria.
1. Introduction The IAEA Technical Co-operation Project RLA/4/018 “Management of Spent Fuel from Research Reactors” started in 2001. It constitutes a joint effort of Latin American nuclear institutions from Argentina, Brazil, Chile, Mexico, and Peru to accomplish the following objectives: “to define the basic conditions for a regional strategy for managing spent fuel which will provide solutions that are in the economic and technological realities of the countries involved, and in particular, to determine what is needed for the temporary wet and dry storage of spent fuel from the research reactors in the countries of the Latin American region”. Such work gets considerable importance since the USA spent fuel take-back program will end in May, 2006. Thereafter the Latin American research reactor operators will need to identify and assess all possible options to deal with their spent fuel by themselves.
Part of the project consists of designing a cask for interim storage and transportation of the spent fuel produced by these research reactors. In Latin America there are two main types of research reactors under operation: TRIGA and MTR reactors. Accordingly, this is being taken into account in the cask design that must be suitable for the different fuel elements used in these reactors. The shielding analysis of the cask is being carried out with SCALE4.4A [1]. The SCALE package is a codes system for licensing purposes well known and frequently used for criticality safety, source terms determination, shielding and heat-load analyses of similar casks manufactured by different vendors around the world. The criticality safety analysis of the cask also is being carried out with SCALE4.4A. However, this paper will present only criticality simulations performed by utilizing the Monte Carlo transport code MCNP4B [2].
2. Design criteria As recommended by IAEA [3, 4] the shielding and criticality safety criteria for the cask can be summarized as follows:
The maximum dose values at the highest intensity point must be, for the sum of the gamma and neutron dose rates, lower than 10000 µSv/h (1 Rem/h) local dose rate on the surface of the cask which can be easily touched during transport under exclusive use.
239

IAEA-CN-100/42P
Concerning criticality safety the calculated neutron multiplication factor, using Monte Carlo transport methods must be, for normal conditions as well as under accident conditions, lower than 0.95. Such condition can be mathematically expressed as,
(keff +2σ) < 0.95.
This condition must be guaranteed under an optimally moderated situation that will be assumed here as corresponding to the cask totally water flooded.
3. Fuel elements data Several fuel element types have been used in the Latin American research reactors, however, only two types were analyzed in this paper. The first one refers to the MTR fuel elements, box type. Actually, these fuel elements are the standard type manufactured by CNEA (Argentinean Atomic Energy Commission) for its RA-3 research reactor [5-7]. The other fuel element type considered is the TRIGA type, indeed the fuel elements used in the Brazilian TRIGA IPR-R1 reactor [8, 9]. The main characteristics of these two types of fuel elements are summarized in tables I and II and in Figures 1 and 2. The RA-3 standard fuel elements have 19 fuel plates fuelled with U3O8-Al in an Aluminium cladding assembled in an Aluminium structure and the IPR-R1 (TRIGA) fuel elements are cylindrical bars fuelled with a metallic Uranium and Zirconium-Hydride homogenous alloy also in Aluminium cladding.
Table I. Composition of the fuel. MTR Fuel Elements
(RA-3) TRIGA Fuel
Elements (IPR-R1) Mass of U3O8 (g) 1743.2 ---- Mass of HZr (g) ---- 2250 Mass of H (g) ---- 24.5 Mass of Uranium (g) 1475.7 188 Mass of U235 (g) 290.7 37.2 Mass of Aluminum (g) 626.1 ---- Enrichment (% mass) 19.75 19.81 Density (g/cm3) 4.8 6,2
Table II. Dimensions and materials data
Component Dimension (cm) Material MTR Fuel Plates Active Zone Thickness 0.07 U308-Al (ρ=4.8 g/cm3) Width 6.0 U308-Al Height 61.5 U308-Al Cladding thickness 0.04 Aluminum (ρ=2.7 g/cm3) Plates Height 65.5 Aluminum Others as figure 1 TRIGA Fuel Elements Active Zone Outer diameter 3.73 Fuel Height 35.56 Fuel diameter 3.56 U-ZrH (ρ=6.2 g/cm3) Cladding thickness 0.076 Alumínio (ρ=2.7 g/cm3) Lenght 72.24 Axial reflectors 10.16 Graphite (ρ=1.7 g/cm3) Others as figure 2
240

IAEA-CN-100/42P
FIG. 1. MTR fuel element
FIG. 2. TRIGA fuel element
241

IAEA-CN-100/42P
4. Cask geometry and materials modelling The geometry and materials modelling of the cask follows the characteristics showed in Figure 3. All dimensions in the figure are in mm and no component tolerances are taken into account. This means that these dimensions shall be the minimum accepted for the manufacturing process. The cask has an inner and an outer shell (liner) made of stainless steel ANSI 304. A lead shield in between the shells completes the model. Due to the different types of fuel elements used in the region, many baskets shall be designed. Currently, the calculations were performed considering only two types of basket, both made of SS304: one for MTR elements, which hosts 21 fuel elements (Figure 3) and another basket for TRIGA with 78 locations (see Figure 4).
FIG. 3. Schematic drawing of the cask with the 21-MTR basket
5. Radiation source terms determination Two types of radiation sources were determined. The first one refers to the MTR fuel elements, the other to the TRIGA type. T he ORIGEN-ARP module of SCALE package was used to determine the gamma and neutron sources using libraries produced using the SAS2 module. The gamma and neutron sources were estimated considering a burn-up of 50% (U235 depleted) for MTR and 25% for TRIGA fuel. Furthermore, a 5 (five) years decay time (cooling time) was adopted in the model. The gamma and neutron spectra as well as the source strengths can be seen in Table III. Those values are per fuel element, it means that in order to get the total source strength inside the cask the values in the table III must be multiplied by the number of fuel elements. The energy group structure for neutrons and gamma are as the 27N-18Couple SCALE library.
242

IAEA-CN-100/42P
FIG. 4. Schematic drawing of the TRIGA-basket
Gamma with low energy, which are strongly shielded, are the majority and the high energy gamma are just a few. It is a favourable condition from shielding point of view. The same is observed for neutrons. The gamma and neutron source intensity is assumed flattened over the entire fuel element active length (that is a short length). Due to the weak neutron source intensity, after five years cooling time, no neutron-induced gamma radiation is assumed. Neutron source considers the contribution of spontaneous fission neutrons and neutrons from the α-n reactions in the oxygen of the fuel.
Table III. Calculated neutron and gamma source for MTR and TRIGA fuel Energy (MeV)
Gamma (photons/s/element) Energy (MeV)
Neutrons (neutrons/s/element)
MTR TRIGA MTR TRIGA 10.0 to 8.0 2.8249E+00 1.0 20.0 to 6.43 8.018E+01 1.342E+00 8.0 to 6.5 1.3357E+01 1.0 6.43 to 3.0 1.263E+03 2.563E+01 6.5 to 5.0 6.8483E+01 1.3068E+00 3.0 to 1.85 2.004E+03 4.627E+01 5.0 to 4.0 1.7173E+02 3.2915E+00 1.85 to 1.40 8.357E+02 1.735E+01 4.0 to 3.0 2.9648E+07 6.1579E+05 1.40 to 0.90 9.196E+02 1.725E+01 3.0 to 2.5 2.6175E+08 5.4300E+06 0.90 to 0.40 8.828E+02 1.530E+01 2.5 to 2.0 3.3792E+10 6.9080E+08 0.40 to 0.10 1.711E+02 2.949E+00 2.0 to 1.66 5.6799E+09 1.5103E+08 1.66 to 1.33 7.3329E+10 1.6087E+09 1.33 to 1.0 1.8011E+11 5.0044E+09 1.0 to 0.8 7.4752E+11 1.4928E+10 0.8 to 0.6 1.2597E+13 6.8141E+11 0.6 to 0.4 2.0304E+12 4.7645E+10 0.4 to 0.3 5.4545E+11 2.4711E+10 0.3 to 0.2 7.3889E+11 3.3934E+10 0.2 to 0.1 2.6894E+12 1.1497E+11 0.1 to 0.05 3.3567E+12 1.5790E+11 0.05 to 0.01 1.1223E+13 5.3731E+11 Total 3.4221E+13 1.6203E+12 6.157E+03 1.261E+02
243

IAEA-CN-100/42P
6. Calculation method
6.1. Shielding The shielding calculations were performed using the SAS4 module of SCALE4.4A. The Shielding Analysis Sequence No. 4 (SAS4) performs a three-dimensional (3-D) Monte Carlo shielding analysis of a nuclear fuel transport or storage cask using an automated biasing procedure. In a Monte Carlo shielding analysis of a deep-penetration problem such as a spent fuel cask, variance reduction techniques must be used to calculate reasonably good results at an affordable cost. Generation of biasing parameters and application of the parameters to solve a particular problem are no trivial tasks. The entire procedure for cross-section preparation, adjoined flux calculation, automatic generation of Monte Carlo biasing parameters, and a Monte Carlo calculation has been implemented in this control module to provide calculated radiation dose levels exterior to the cask at a reasonable computational cost. The response function (dose factor) utilized in the calculation is the Neutron and Gamma Ray Flux-to-Dose Rate Factors ANSI/ANS-6.1.1, 1977.
Regarding the fuel region simulation, the homogeneous model IGO=0 was adopted. The cask cavity has a radius of 30 cm and a height of 94 cm. However, the active zones of fuel elements have a height of 61.5 cm and 38.1 cm respectively, for MTR and TRIGA fuel. Therefore, the model assumes conservatively two void zones in the bottom and top of the cask cavity due to the negligible activation of the aluminium end fittings of the fuel elements. No radial void is assumed.
In the model, the basket is represented as a homogeneous cylindrical source zone with a radius of 30 cm and a height of 61.5 cm (for MTR) or 38.1 cm (for TRIGA) located at the axial mid-plane. The source material fulfilling the source zone is modelled having one third of the fuel density and the concentration of heavy metal (Uranium) in the fuel is reduced by the same factor in order to conservatively to reduce the self-shielding of the source.
6.2. Criticality The main concern of the cask criticality safety analysis is to guarantee that the nuclear fuel inside the cask will be maintained safely sub-critical, under both, normal conditions as well as under accident conditions. The cask leak-tight containment shall be able to prevent water penetration into the cask cavity. This is applicable for normal conditions and also after the cask suffers the Type B tests.
The criticality safety calculations were performed using the MCNP4B code. It is a multipurpose Monte Carlo program used for stochastic simulation of particles transport (neutrons, photons and electrons). MCNP is a 3D code and has graphical resources very useful for modelling visualization.
In the adopted model every criticality calculation assumes that the fuel elements are fresh, which means that no burn-up is considered. This is a very conservative hypothesis as such situation definitively is not the standard for a spent fuel elements cask. The information on masses of fissile material in the fresh fuel elements were provided by the reactors operators. No poisoning effect is considered and, in particular for TRIGA fuel, the Samarium burnable poison discs are not taken into account.
All calculations were carried out using the point-wise cross-sections library based on ENDF/B-VI data. The calculations were performed considering room temperature, equal to 293 Kelvin. No temperature corrections were applied to the MCNP cross-section data. A very accurate geometrical model for each fuel element of the basket is used. All simulations used 5000 neutron histories and 750 cycles, skipping the 50 first cycles in order to avoid fluctuations coming from statistical uncertainties.
244

IAEA-CN-100/42P
Regarding the neutrons moderation, three situations were analyzed. The first is the normal operational condition in which the cask is fully dry and just air surrounds the fuel elements. The two others consist in accident conditions in which the cask is totally water flooded, being one situation corresponding to only the cavity flooded and in the another situation the cavity is flooded and also the whole cask is surrounded by a 30 cm thick layer of water. Furthermore, only to the MTR21 basket, a case was simulated in which the dimensions of the internal basket cells were reduced from 10.0 cm to 8.74 cm in order to simulate a situation in which the fuel elements are as close to each other as possible.
7. Results
7.1. Shielding The shielding calculation results are summarized in Tables IV and V. They present the dose values at the highest intensity point at cask outermost side wall and bottom as well as at 1 m and 2 m away from the cask surfaces for both fuel element types. Results shown in Table IV were obtained using SAS4 and refer to MTR21 basket, while Table V refers to TRIGA basket.
Table IV. SAS4 dose rates for basket with 21 MTR fuel elements Side Dose Rates (µSv/h)
Distance (m) Distance (m) Distance (m) Case Source 0 1 2
N_rad_21 Neutron 4.33 0.39 0.13 G_rad_21 Gamma 229.13 30.29 10.37
Total 233.5 30.7 10.5
Top/Bottom Dose Rates (µSv/h)
Distance (m) Distance (m) Distance (m) Case Source 0 1 2
N_bot_21 Neutron 4.39 0.31 0.09 G_bot_21 Gamma 1515 240.5 72.35
Total 1519.4 240.8 72.4
Table V. SAS4 dose rates for basket with 78 TRIGA fuel elements Side Dose Rates (µSv/h)
Distance (m) Distance (m) Distance (m) Case Source 0 1 2
N_rad_78 Neutron 0.08 0.006 0.002 G_rad_78 Gamma 22.3 2.17 0.8
Total 22.4 2.2 0.8
Top/Bottom Dose Rates (µSv/h)
Distance (m) Distance (m) Distance (m) Case Source 0 1 2
N_bot_78 Neutron 0.08 0.005 0.002 G_bot_78 Gamma 111.2 21.1 7.2
Total 111.3 21.1 7.2
245

IAEA-CN-100/42P
The neutron dose contribution to the total dose rate is not significant. The main contribution comes from gamma radiation, as expected, since the analysis was carried out considering a five years cooling time. The highest dose rates occur at the top (or bottom) surface of the cask. In any case such values are below the limit for shielding criterion.
7.2. Criticality The criticality calculation results are summarized in Tables VI and VII. They present the keff.±.2σ to the cask loaded with the MTR basket and with the TRIGA basket. In both cases the results refer to the aforementioned moderation conditions.
The highest keff is to the cask loaded with MTR21 basket, inside and outside flooded and with reduced dimensions of the internal basket cells. One may note that under normal conditions, in which the cask is dry, the keff of the MTR basket is too small while for TRIGA basket it is almost half of the value of the cask flooded. Such a fact represents well the importance of the Zirconium-hydride alloy as moderator in the TRIGA fuel.
Table VI. Criticality results for MTR Fuel Case (keff ± 2σ) Remarks
CA21AR 0.05073 ± 0.00008 21 MTR elements and Air inside the cask CA21AG 0.86348 ± 0.00084 21 MTR elements and water inside the cask CA21AGF 0.86412 ± 0.00084 21 MTR elements and water inside and outside the cask CA21AX 0.89890 ± 0.00082 21 MTR elements, water inside and outside the cask and
8.74 cm side length of the internal basket cells
Table VII. Criticality results for TRIGA Fuel Case (keff ± 2σ) Remarks
CA78AR 0.41213 ± 0.00066 78 TRIGA elements and Air inside the cask CA78AG 0.87049 ± 0.00072 78 TRIGA elements and water inside the cask CA78AGF 0.87165 ± 0.00070 78 TRIGA elements and water inside and outside the cask
In any case, concerning the criticality safety criterion, it is guaranteed that for both fuel element types and baskets the cask can be loaded and unloaded safely. Thus, the fuel elements may also be stored or transported safely sub-critical even in the hypothetical situation of the cask to be water flooded.
As a design requirement the cask and baskets shall keep their integrity after the Type B tests. Nevertheless, there may be local deformations of the cask inner liner and basket. This situation must be analyzed, concerning both criticality safety and shielding, after the Type B tests. Moreover, further calculations are necessary in order to analyze the other fuel element types currently used in other Latin American research reactors.
8. Conclusions The SCALE4.4A package was used for shielding calculations of a Latin American dual purpose cask, and MCNP4B for criticality safety. The analyses just considered two types of fuel elements (one TRIGA type and another MTR type) among several utilized for the Latin American research reactors. Moreover, two types of baskets were considered for loading of these fuel elements, one for 21 MTR elements and another for 78 TRIGA elements. In any case the results show compliance with the shielding and criticality safety criteria.
The simulations show that the highest dose rates occur at the top (or bottom) surface of the cask. The dose rates for TRIGA basket are well below the values of the MTR basket. In any
246

IAEA-CN-100/42P
case such values are below the limit. Concerning the criticality safety, the sub-criticality is also guaranteed for the cask loaded with both types of baskets and fuel elements. Thus, these two types of fuel elements can be safely stored or transported by the cask under the point of view of shielding and criticality safety.
Acknowledgement The authors acknowledge the support of the International Atomic Energy Agency (IAEA) through the project RLA/4/018 which made the accomplishments here described possible. Such support has strongly contributed to the development of the Latin American strategy for management of the research reactors spent fuel.
REFERENCES [1] OAK RIDGE NATIONAL LABORATORY. SCALE4.4A Eletronic Manual.
ORNL/RSICC, 2000.
[2] BRIESMEISTER J.F., MCNP – A General Monte Carlo N-Particle Transport Code, Version 4B, LA-12625-M, 1997.
[3] INTERNATIONAL ATOMIC ENERGY AGENCY, Safety Series Nº 6. Regulations for the Safe Transport of Radioactive Materials, Vienna 1985.
[4] INTERNATIONAL ATOMIC ENERGY AGENCY, Safety Series Nº 37. Advisory Material for the IAEA Regulations for the Safe Transport of Radioactive Materials, Vienna 1985.
[5] MEDINA E.G., NASSINI H.E., Informe de Diseno en Condiciones Normales de Operacion de los Elementos Combustibles de Bajo Enriquecimiento (ECBE) Normal y de Control Destinados al RA-3. CNEA, UPESN, IT-IEC 02/90, Argentina.
[6] PEREZ E.E., Descripción del Prototipo ECBE de 19 Placas Combustibles para Irradiacion en el RA-3. CNEA, Departamento Combustibles Nucleares, Argentina.
[7] Personal communication of Mr. Jorge Quintana from Centro Atômico Ezeiza, Argentina, at IPEN/CNEN, May of 2002, São Paulo, Brazil.
[8] DALLE H.M., Cálculo Neutrônico do Reator Triga IPR – R1 Utilizando WIMSD4 e Citation. Dissertação de Mestrado, UFMG, 1999, Belo Horizonte, Brazil.
[9] DALLE, H.M., PEREIRA, C., SOUZA, R.G.P. Neutronic calculation to the TRIGA IPR-R1 Reactor using the WIMSD4 and CITATION codes. Annals of Nuclear Energy, Vol 29, August 2002, pp. 901-912.
247

IAEA-CN-100/46P
Development of MTR-Type Fuel Using UO2 Microspheres Dispersed in Stainless Steel W.B. Ferraz, D.M. Braga, J.B. de Paula, A. Santos Centre for Development of Nuclear Technology (CNEN/CDTN) Belo Horizonte, Minas Gerais, Brazil
Abstract. This work describes the development of an MTR-type cermet fuel using UO2 microspheres dispersed in stainless steel. The use of fuel microspheres instead of UO2 powder offers many advantages to fuel performance. Possibly, the greatest benefit is the increase in UO2 fuel loading, which is necessary to set off the disadvantages of the lesser neutronic economy of stainless steel. As a result, it is sufficient to have a low enriched fuel of 20 % 235U, which is a suitable solution for nuclear non-proliferation. As in MTR, fuel manufacture stages consist in obtaining pressed UO2 microsphere pellets homogeneously dispersed in stainless steel powder, followed by conventional hot-rolling picture frame technique. 45 %-weight loading of UO2 microspheres was used, instead of the practical limit of only 20 – 30 % weight used for UO2 powder. The densities and microstructures of the plates obtained were analysed and the results are discussed.
1. Introduction The MTR-type cermet fuel is widely used as a nuclear fuel in test and research reactors, and the fuel manufacture stages consist in obtaining pressed fissile ceramic phase pellets homogeneously dispersed in a metallic powder matrix, followed by the conventional hot-rolling picture frame technique [1-3]. In this work, it was used UO2 microspheres as ceramic fissile phase and stainless steel as metallic matrix. Stainless steel was chosen because its use is technologically well developed and it has a relatively low cost. Stainless steel affords nuclear fuel of higher thermo-hydraulic performance at elevated temperatures in comparison to those of aluminium alloys frequently used in MTR reactor fuel. These requirements are necessary for test/research high performance and small power reactors. As a disadvantage, the use of stainless steel results in low neutronic economy due to the high neutronic cross-section of stainless steel constituents. Two main features can be used to compensate this deficiency, the UO2 loading onto the metallic matrix, and the fissile phase enrichment. To avoid increasing UO2 enrichment over 20% 235U with the purpose of assuring nuclear non-proliferation, it was attempted to raise UO2 loading onto the metallic matrix. It is known in literature that UO2 loading of dispersed powder in a metallic matrix is only feasible up to an amount of about 30% weight UO2 [1-3]. It is more difficult to obtain an acceptable fuel plate microstructure with higher amounts of fuel powder in the meat. Therefore, a possible way to obtain higher UO2 loading with a high quality fuel microstructure is to use UO2 microspheres. This can be achieved due to the fact that microspheres, in comparison with powder, yield a smaller surface-vs.-loading ratio, and optimise the metallic matrix volume for a determined UO2 loading. This question is of fundamental importance to develop a fuel with comparatively higher thermal conductivity and mechanical strength, and thus to obtain a fuel element with high thermal-hydraulic performance.
In this work, the development of fuel plates with UO2 microspheres dispersed in stainless steel with 45 %-weight loading is reported. UO2 microsphere and fuel meat densities, as well as microstructural characterizations are presented. Results obtained with the use of the UO2 microspheres in this work and of UO2 powder determined in previous work [4] are compared and discussed.
248

IAEA-CN-100/46P
2. Experimental procedure 2.1. Materials UO2 microspheres, powder and plates of 304 and 347 stainless steel respectively, were used in this work as raw materials. The powders and stainless steel plates are commercially available.
The UO2 microspheres were prepared by external gelation process by adapting the routines used in the production of (Th,U)O2 microspheres by external gelation process. This Th-based microspheres development was carried out in our Research Centre in co-operation with German partners in the scope of the Programme of Research and Development on the Thorium Utilization in PWRs [5]. The procedure used in this programme afforded (Th,U)O2 microspheres of high density and sphericity, and the facilities and the knowledge acquired in that project were also used in this research. Microspheres were produced from a colloidal dispersion containing uranium as a heavy metal and using a column adapted to a stainless steel nozzle for sol drop formation. The drops were hardened by an external gelation precipitation reaction under ammonia [5-7]. he sphericity of the microspheres depends mainly on the interfacial tension of the source sol, the drop forming medium, and the difference in density between the drop and liquid ammonia. After that, the drops transformed into gel microspheres were washed with diluted alcohol to avoid that the microspheres adhere to each other. The microspheres were aged using two different procedures, namely: (i) normal ageing at 90oC in air for 2 hours, and (ii) autoclave ageing at 225oC. The aged microspheres were heat-treated at 700oC for 24 hours in air. Next, the microspheres were reduced in hydrogen at 600oC for 4 hours to obtain the UO2 phase. Finally, the reduced microspheres were sintered at 1700oC under H2 for two hours.
The microspheres presented the following average characteristics:
— Density: from 90 to 99 % of theoretical density, — Specific surface: approx. 0.5 m2/g, — Fracture strength: from 5 to 6 N/microsphere, — Diameter: (200 ± 30) µm.
Differently from thorium microspheres obtained by external gelation process, which have high sphericity and small porosity, a significant fraction of the sintered UO2 microspheres of each batch obtained in this work presented some irregularities such as low sphericity, grooves, cracks and high porosity. This is important because the microsphere characteristics influence the microstructure of the fuel plate meat, as will be shown in the next section.
In spite of the better fuel meat homogeneity attained with the use of microspheres produced by external gelation instead of powder, it is necessary to enhance the quality of UO2 microspheres. Works with this objective and for the optimization of the ageing stage are under way. Alternatively, the activities to obtain UO2 microspheres through internal gelation process have been started as well. A precipitation column is being assembled and tested in laboratory scale. The literature shows that UO2 microspheres with high sphericity and low porosity can be achieved through internal gelation process more easily [8-10]. Since ammonium is generated uniformly inside the droplets, with resulting uniform gelation, shell structure and internal stress through the particle radius are not so large as compared with those of microspheres obtained by external gelation process.
2.2. Fuel plate The first step was to produce a compact core which will be used as dispersion fuel meat. Dispersion fuel compacts are produced by a powder metallurgy process by mixing UO2 fuel microspheres with stainless steel powder and pressing at high pressure [1-3]. The mixed fuel material loaded with 45 % weight UO2 microspheres in stainless steel powder was compacted
249

IAEA-CN-100/46P
in a hydraulic press at 30 to 70 kN/cm2 with a floating die system and double pressing action. The measured geometric densities of the green pellets obtained were in the range from 6.20 to 6.90 g/cm3. Next, the pellets were sintered in H2 at 1200oC for 2 hours.
The compact was placed into a stainless steel frame, and two cover plates of the same material were welded on by means of TIG method to produce a rolling plate. The rolling plate was then preheated to 1200oC and rolled through several passes with intermediate re-heating in argon atmosphere. After hot rolling, the plates were cleaned by chemical etching, and cold rolled. Plate thickness was mostly reduced to about 75% of its initial value during hot rolling. Cold rolling was performed in only two steps and led to a thickness reduction of only about 10%, which is important to preserve microsphere integrity and to assure that dimensional specifications are met. This procedure was sufficient to reach the specified plate roughness of 0.5 to 1 µm.
3. Results and discussion The results of the development of fuel plates using UO2 powder dispersed in a stainless steel metallic matrix previously reported [4] will be compared with those of fuel plates in stainless steel dispersion with UO2 microspheres.
The UO2 powder and the meat of a fuel plate from UO2 sintered powder dispersed in a stainless steel matrix of the previous work are shown in Figs. 1A and B. The fuel plate matrix was loaded with 45% weight UO2 powder, size ≤ 88 µm (Fig. 1A), and rolled at 1200oC. Fig. 1B presents the microstructure of the meat of this fuel plate after the final cold rolling. This microstructure is typical and comparable with those in literature under the same experimental conditions. It can be noticed that the microstructure of UO2 fissile phase particles show a considerable degree of fragmentation and stringering in the longitudinal rolling direction, which is compatible with experimental results for UO2 powder.
A B FIG. 1. (A) Sintered UO2 powder. (B) Microstructure of the fuel plate meat of sintered UO2
powder (white phase) dispersed in stainless steel matrix (dark phase).
The results of the present work with UO2 microspheres aged in different conditions are shown in Figs. 2 to 5. Figs. 2A and B present the micrographs of the microspheres aged in air at 90oC, and Figs. 3A and B the respective fuel plate meat. The inspection of the microstructure shown in the micrographs reveals that the microspheres possess low porousities, which suggests high densities. As a disadvantage, it can be observed that some microspheres are deformed and present grooves and cracks. On the other hand, an important behaviour of these microspheres is that they keep almost the same form before and after rolling. This characteristic can be easily observed in the respective sets of micrographs for the corresponding microspheres before and after rolling. This experimental observation is of great
250

IAEA-CN-100/46P
importance because it demonstrates that microspheres with small porousities are not deformed during the rolling process. Therefore, a high quality microstructure can be reached practically without any fragmentation and stringering. Fuel plates with these characteristics have elevated thermal conductivity and mechanical strength, affording great thermal-hydraulic performance in use in reactor.
A B
FIG. 2. Micrographs of UO2 microspheres aged in air at 90oC. It can be observed (A) spherical microspheres mixed with some defective microspheres with grooves and cracks, and (B) dense microspheres
A B
FIG. 3. Microstructures of the fuel plate meat. (A) It can be observed that the microspheres kept almost the same form before and after rolling, and (B) shows details of some uniform microspheres.
Finally, the fuel plate meat made of aged UO2 microsphere obtained by autoclave at 225oC are discussed. Figs. 4A and B and 5A and B show the micrographs of the microspheres and of the fuel plate meat, respectively. As can be seen in Fig.4A and B, autoclave aged microspheres are spherical in their almost totality, but they present heterogeneous porosity. By inference, microspheres with high porosity present low density. By comparing micrographs 4A and B, and 5A and B, it can be observed that after rolling, one part of the microspheres remains spherical, but the other becomes oval and fragmented. As can be deduced from the micrographs, the high porosity microspheres are deformed during the rolling process, and the fuel meat presents little microstructure fragmentation and stringering. Independently from this observation and in general terms, it can be affirmed that the fuel meat microstructures obtained with UO2 microspheres have a quality superior to that of UO2 powder.
251

IAEA-CN-100/46P
A B
FIG. 4. Micrographs of autoclave aged UO2 microspheres. (A) almost all the microspheres are regularly spherical, and (B) detail showing porous microsphere.
A B
FIG. 5. Microstructures of the fuel plate meat. It can be deduced that (A) before rolling, dense microspheres are undeformed, and after rolling, the porous microspheres show slight stringering and become deformed. (B) uniform dense microsphere surrounded by deformed porous microspheres.
4. Conclusions The present study compares the results of fuel plates with UO2 microspheres obtained by internal gelation process and with different ageings dispersed in stainless steel matrix with those of fuel plates with UO2 powder dispersed in stainless steel from a previous work [4]. The following conclusions can be drawn from the experimental results obtained:
— The fuel plate meat with microspheres aged in air at 90oC presented good homogeneity without stringering in the rolling direction and almost no fragmentation. Some irregular microspheres observed in the meat resulted from gel ageing rather than from fuel plate rolling;
— The fuel meat with microspheres aged in autoclave at 225oC presented slight fragmentation and stringering in the rolling direction due to microsphere porosity. It can be deduced that microspheres with low porosity, thus with high density, remain unaltered during rolling;
— In general, the fuel meat microstructures obtained with UO2 microspheres presented good homogeneity and superior quality in comparison to those obtained with UO2 powder.
252

IAEA-CN-100/46P
New studies are under way to improve the ageing thermal treatment of UO2 microspheres obtained by external gelation process with the objective of optimizing microsphere and fuel meat properties. Studies on obtaining UO2 microspheres by internal gelation are also under way.
REFERENCES [1] HOFMAN, G.L., SNELGROVE, L., Dispersion Fuels. In: Materials Science and
Technology - A Comprehensive Treatment, Vol. 10A, Nuclear Materials, (1997).
[2] BELLE, J., Uranium Dioxide: Properties and Nuclear Applications. Ed. by Atomic Energy Commission, Washington, (1961).
[3] SMITH, C.O., Nuclear Reactor Materials, Ed. by Addison-Wesley Publishing Company, (1967).
[4] BRAGA, D.M., PAULA, J.B., FERRAZ, W.B., Desenvolvimento de Combustível Tipo Placa em Dispersão UO2/Aço Inox com Emprego de Lamionador Quádruo. In: XIII ENFIR – National Meeting of Reactor Physics and Thermal Hydraulics, Rio de Janeiro, (2002).
[5] PINHEIRO, R.B. et al., Program of Research and Development on the Thorium Utilization in PWRs. Final Report (1979-1988). Belo Horizonte: Nuclebrás/CDTN, (1988).
[6] NAEFE, P., ZIMMER, E., Preparation of Uranium Kernels by an External Gelation Process. Nuclear Technology, 42: 163-71, (1979).
[7] FOERTHMANN, R., BLASS, G., Preparation of UO2 Microspheres with Controlled Porosity from an Uranyl Nitrate Solution. Journal of Nuclear Materials, 47: 259-261, 1973.
[8] KADNER, M., BAIER, J., Production of Fuels Kernels for High Temperature Reactor Fuel Elements. Kerntechnick, 18(10):10-14, (1976).
[9] IDEMITSU, K., et al., Manufacturing of Zirconia Microspheres Doped with Erbia, Yttria and Ceria by Internal Gelation Process as a Part of a Cermet Fuel. Journal of Nuclear Materials, 319: 31-36, (2003).
[10] IAMAGISHI, S., A New Internal Gelation Process for Fuel Microsphere Preparation without Cooling Initial Solutions. Journal of Nuclear Materials, 254: 14-21, (1988).
253

IAEA-CN-100/50P
Benchmark Measurements and Calculations of U3Si2-Al MTR Fuel Plates with Burned Fuel
H.M. Dalle1, 3
, G.R. Ruggirello2, G. Estryk2, A. Stankevicius2, D.A. Gil2, J.A. Quintana2, M. Sanchez2, C.A. Devida2, E.B. Tambourgi
3, T. Cuya4, R. Jeraj
5, J.
Medel6, O. Mutis6 1Centro de Desenvolvimento da Tecnologia Nuclear, CDTN/CNEN, Belo Horizonte, Brazil.
2Comisión Nacional Energía Atómica, Buenos Aires, Argentina.
3Faculdade de Engenharia Química - UNICAMP, Campinas, Brazil.
4Instituto Peruano de Energía Nuclear, Lima, Perú 5Jozef Stefan Institute, Ljubljana, Slovenia.
6Comisión Chilena de Energía Nuclear, Santiago, Chile. Abstract. Experimental and calculated results of burn-up of a MTR fuel assembly irradiated at the Ezeiza Atomic Centre research reactor RA-3, Buenos Aires, Argentina, are presented. Two fuel plates among the nineteen that compose a silicide-based Low Enriched Uranium (LEU) fuel assembly were analyzed. Burn-up of these two fuel plates was experimentally determined by destructive chemical analyses through the measurement of U-235 depletion using mass spectrometry. In addition, relative burn-up profile had been previously evaluated in both plates by gamma scanning spectroscopy using Cs-137 activity as a burn-up monitor. This profile was used to select locations of the samples for destructive analysis. Burn-up calculations were performed using two different methodologies. With the first method a unit cell calculation of the effective cross sections with the WIMS code was combined with the CITATION diffusion code. The second method was based on the MONTEBURNS calculation, where the burned fuel isotopic vector is calculated with the ORIGEN code and automatically linked to the MCNP Monte Carlo transport code. The results obtained with different methodologies agreed within 6% with the U-235 depletion measurements.
1. Introduction The IAEA Technical Co-operation Project RLA/4/018 “Management of Spent Fuel from Research Reactors” started in 2001. It constitutes a joint effort of Latin American nuclear institutions from Argentina, Brazil, Chile, Mexico, and Peru to accomplish the following objectives: “to define the basic conditions for a regional strategy for managing spent fuel which will provide solutions that are in the economic and technological realities of the countries involved, and in particular, to determine what is needed for the temporary wet and dry storage of spent fuel from the research reactors in the countries of the Latin American region”.
Such work gets considerable importance since the USA spent fuel take-back program will be end in May, 2006. After that the Latin American research reactors operators will need to identify and assess all possible options to deal with their spent fuel by themselves.
Part of the project consists of the characterization of the spent fuel through reactor calculations since this is the easiest way for determining fuel burn-up and moreover, it does not interfere with reactor operation. In order to improve and check the burn up calculation methodologies in the different countries of the region a burn-up benchmark experiment was initiated. The experiments were performed on a MTR prototype fuel assembly, called the test P04, irradiated in the Argentinean RA-3 research reactor. This prototype has been tested as a part of the qualification program of the LEU (19.7% U-235) and high-density meat silicide-based fuel. The Argentine Nuclear Energy Commission (CNEA) performed the experiments
254

IAEA-CN-100/50P
in the hot cell facilities and then shared the results with other participant countries, to perform calculations using the methodologies and codes typically used for such analyses in their home countries. The burn-up was determined through destructive chemical analysis, measuring the U-235 depletion by mass spectrometry. Two plates, one inner and one outer, of the nineteen that constituted the fuel assembly were analyzed to evaluate the burn-up.
The geometry and material data of the reactor and core components that are relevant for benchmark calculations are given in the next section. Further details can be found in References [1 to 6].
2. Geometry and material data of the RA-3 research reactor The RA-3 is a typical Material Testing and Research Reactor (MTR) located at Ezeiza Atomic Centre in Buenos Aires, Argentina, built and operated by CNEA. It is a tank reactor, moderated and cooled with light water. Currently, the reactor operates at 10 MW thermal power. However, when the test P04 fuel assembly was in the core, the reactor power was kept at 5 MW. The RA-3 core grid has 80 locations in which different core configurations can be formed. Only the components shown in Figure 1 were considered in the calculation models described below. Other components placed in the grid are considered outside the core and estimated to have a negligible effect on the investigated parameters.
FIG. 1. RA-3 reactor (core 53).
255

IAEA-CN-100/50P
All the fuel assemblies are of the MTR box plate type. During the test P04 irradiation period the RA-3 core was constituted of 27 LEU fuel elements. Figure 1 shows the core configuration at the beginning of the test P04 irradiation. The core was formed with the test P04, 22 standard fuel assemblies and 4 control fuel assemblies. Both, the standard fuel and control fuel assemblies have the U3O8-Al fuel meat matrix with the aluminum-6061 cladding, and contain 19 and 14 fuel plates, respectively.
The control rods have the absorber plates made of Ag-In-Cd alloy with the SS-316 cladding. The test P04 was an unique assembly in the core with U3Si2-Al fuel meat matrix and aluminium 6061 cladding and contains 19 fuel plates. The RA-3 core also has 5 open aluminium irradiation boxes that can be filled with samples for irradiation. Outside the core there are 23 graphite blocks that work as a reflector. The geometric dimensions and materials data of all components of the core are given in Figs. 2 to 6 and in Tables I and II.
FIG. 2. RA-3 standard fuel assembly. Dimensions are in cm.
FIG. 3. Test P04 fuel assembly. Dimensions are in cm.
256

IAEA-CN-100/50P
FIG. 4. RA-3 control fuel assembly Dimensions are in cm.
FIG. 5. RA-3 graphite element. FIG. 6. MTR fuel assembly.
257

IAEA-CN-100/50P
Table I. Dimensions and materials data Component Dimension (cm) Material
Graphite Assembly Graphite (ρ = 1.78 g/cm3) Length 7.0 Width 6.8 Height 67.5 Cladding thickness 0.3 Aluminium 6061
Standard Fuel Plates Meat Zone U308-Al matrix Thickness 0.07 Width 6.0 Height 61.5 Cladding thickness 0.04 Aluminium 6061 Plates Height 65.5 Others as figure 2
Control Fuel Plates as figure 4 Meat Zone U308-Al Thickness 0.07 Width 6.0 Height 61.5 Cladding thickness 0.04 Aluminium 6061 Plates Height 65.5
Control Rods Guide Plates as figure 4 SS AISI 316/304 Absorber Zone (not shown in fig. 4) Ag (80%)-In (15%)-Cd (5%) Thickness 0.26 Width 6.3 Height 64.8 Cladding thickness 0.05 SS AISI 316
Test P04 Fuel Plates Meat Zone U3Si2-Al Thickness 0.054 Width 6.0 Height 60.0 Cladding thickness 0.038 Aluminium Plates Height 65.5 Others as figure 3
Irradiation Box Water Length 7.5 Width 7.1 Height 67.5 Cladding thickness 0.3 Aluminium
Table II. Compositions of the fuel. Composition Standard Fuel
Assembly (19 plates) P04 Fuel Assembly
(19 plates) Control Fuel Assembly
(14 plates)
Mass of U3O8 (g) 1743.2 ---- 1284.5 Mass of U3Si2 (g) ---- 1827.8 ---- Mass of Uranium (g) 1475.7 1727.3 1087.4 Mass of U-235 (g) 290.7 340.29 214.2 Mass of Aluminium (g) 626.1 421.0 461.3 Enrichment (wt. % ) 19.7 19.7 19.7 Meat Density (g/cm3) 4.8 6.13 4.8
258

IAEA-CN-100/50P
3. Burn-up history The test P04 fuel assembly was inserted in the RA-3 core on April 23, 1996 (core configuration Nº 53) and removed on October 27, 1997 (core configuration Nº 71). During this time P04 was moved in the core twice, from the initial position I2 to I3 and from I3 to F6. It should be emphasized that the core 53 was not a fresh core, which introduces uncertainties in the P04 burnup calculations. This problem was tried to be minimized by accounting for the core burn-up as determined by reactor operators (see Table III). Furthermore, Table IV gives the operation steps for each configuration between the core configurations Nº 53 and 71, when the test P04 fuel assembly was in the core.
Table III. Calculated burn-up distribution for core Nº 53. Location of the
Assembly Initial Burn-up
(%U-235) Location of the
Assembly Initial Burn-up
(%U-235)
D3 32.5 G3 4.0 D4 30.3 G5 10.9 D5 41.0 G6 35.8 D6 37.2 G7 42.0 E2 39.4 H2 35.1 E3 17.7 H3 22.4 E4 25.4 H4 13.2 E5 17.1 H5 21.5 F2 35.4 H6 43.5 F3 45.3 I2 0.0 F4 16.1 I3 40.3 F5 28.8 I4 32.8 F6 29.9 I5 39.5 F7 36.5
Table IV. Burn-up steps of P04 irradiation. Core Number
P04 Location
Date
BOC EOC
Burn-up Step (days)
53 I2 96/April 96/May 7.92 54 I2 96/May 96/Jun 31.97 55 I2 96/Jun 96/Aug 28.76 56 I2 96/Aug 96/Sept 24.7 57 I3 96/Sept 96/Oct 13.76 58 I3 96/Oct 96/Oct 13.82 59 I3 96/Oct 96/Nov 18.62 60 I3 96/Nov 97/Feb 19.12 61 I3 97/Feb 97/Feb 4.02 62 I3 97/Mar 97/Mar 16.63 63 I3 97/Mar 97/Apr 20.74 64 I3 97/May 97/May 7.99 65 I3 97/May 97/May 3.98 66 I3 97/May 97/May 3.38 67 I3 97/May 97/Jul 19.67 68 I3 97/Jul 97/Aug 19.85 69 F6 97/Aug 97/Sept 16.71 70 F6 97/Sept 97/Oct 15.57 71 F6 97/Oct 97/Oct 12.7
259

IAEA-CN-100/50P
4. Experimental results On 18 May 2000, the test P04 fuel assembly was transported to the hot cell at Ezeiza Atomic Centre for the post-irradiation examinations. After visual and dimensional inspection of the entire element, P04 was dismantled and all the plates were carefully inspected. Some plates were selected for thickness measurements, gamma scanning and volume measurement by the immersion method. One inner and one outer plate were also tested for blister threshold temperature and behaviour of the meat clad bonding. The other two outer and inner plates that were gamma scanned were also selected for destructive examination to obtain samples for microstructural observation and chemical burn-up analyses. The discussion here will be restricted to the gamma scanning and the destructive analyses for obvious reasons.
4.1. Plate gamma scanning The inner Nº 9 and outer Nº 19 plates were used for gamma scanning. The plates were moved on a track in front of a collimator. This consists of a hole with 2 mm diameter and 150 mm long, made in a Pb block. The high resolution HP Ge detector was installed at a distance of 3 meters from the collimator to avoid the incidence of scattered rays. Gamma energy spectra were obtained at intervals of 1 cm, along the axial and transverse center lines of the plates. The main peaks found, in decreasing order of intensity, are Cs-137, Ce-144, Pr-144 and Cs-134, as shown in Figure 7.
Both profiles, axial and transverse, can be obtained from the net area under the corresponding peak in each measurement. Figure 8 shows the gamma activity axial profile normalized with respect to the maximum value for the four nuclides mentioned above for the plate Nº 19. The square root of the Cs-134 activity accounts for the fact that a double neutron capture is needed for its information. This figure also includes the normalized values of the axial thermal neutron fluxes measured during irradiation of P04, obtained by the foil activation method. A good agreement between the profile shape and the foil activation data is observed for all the nuclides.
FIG. 7. Gamma spectrum obtained at the maximum activity position for outer plate Nº 19.
260

IAEA-CN-100/50P
The form-factor Countmax/Countaverage of the center line axial profile, with the average value calculated from the integral of the values in each measurement interval, is 1.30 to 1.33 for plates Nº 9 or Nº 19, respectively, and for all the nuclides considered. However, for our analyses the results of Cs-137 are used, as this nuclide is recognized to be the one that best reflects the U-235 depletion profile in the fuel plate.
Normalized Activ ity Profile P04 Prototype
OUTER PLATE Position 19
0,0
0,2
0,4
0,6
0,8
1,0
0 100 200 300 400 500 600
Length (center line mm)
Rel
ativ
e G
amm
a A
ctiv
ity
Cs137 Ce144 SQR(Cs134) Activate Foil
FIG. 8. Normalized gamma activity axial profile for the main peak.
Figure 9 shows the Cs-137 activity axial profile for both plates, normalized to the maximum value. The meat position along the length of the plate can be clearly seen, as well as a very significant effect of active material accumulation during manufacturing of the plate, “dog boning effect” at the both plate ends, which is shown by large activity peaks. It is consistent with the maximum area loading of about 28% estimated for the manufacturing process for these plates. The fact that this effect could be detected in a very narrow zone, indicates the effectiveness of the collimating arrangement.
COMPARATIIVE NORMALISED PROFILE FOR 137Cs PEAK
0,000
0,200
0,400
0,600
0,800
1,000
0 100 200 300 400 500 600
Length (center line mm)
Rel
ativ
e co
unts
Outer plate 19 Inner plate 09 FIG. 9. Normalized Cs-137 activity axial profile for both plates.
261

IAEA-CN-100/50P
The Cs-137 activity profile was the main guide for the selection of the places where the puncturing will be performed to obtain samples for destructive analysis.
Figure 10 shows the Cs-137 activity transverse profile at maximum axial activity for both plates, in comparative counts for the same counting conditions. The end peak effect caused by the different neutron thermal flux in the assembly box, decreasing from the edge to the center of each plate and from the outer to the inner plate, can be noticed.
Comparative count peak Cs137
0
2000
4000
6000
8000
10000
12000
14000
16000
0 10 20 30 40 50 60 70
wide plate (mm)
Net
cou
nt
Inner plate 09 Outer plate 19 FIG. 10. Relative Cs-137 activity transverse profile for both plates.
4.2. Destructive analyses Appropriate size of samples for destructive analysis were obtained by puncturing dies driven by a manual hydraulic pump. Seven equi-spaced 4x4 mm samples are bound for chemical burn-up analyses along the axial center line and one sample close to the meat edge, of both, the inner plate Nº 9 and the outer plate Nº 19 (see figure 11). The purpose is to evaluate the burn-up distribution along the entire fuel plate and then, to have the best estimation of the average burn-up.
FIG. 11. Locations of the samples punctured for chemical burn-up analyses.
The samples were processed by the acid dissolution and ion-chromatographic separation [7]. The isotopic analyses was performed on an appropriate aliquot of the solution. The thermo-ionization mass spectrometry was used, calibrated with the 15% enriched U-235 (U-150 NIST) standard. Isotopic composition of uranium was determined to evaluate the local depletion of U-235 as an indicator of burn-up.
262

IAEA-CN-100/50P
Table V shows the obtained values of burn-up distribution (%U-235 depletion) in both plates and figure 12 plots these values. The results reveal a higher burn-up of the outer plate (Nº 19) and also a higher burn-up at the edge of the meat than at the centre line. These variations show the influence of the neutron thermal flux distribution in the RA-3 reactor fuel.
Table V. Burn-up distribution for plates Nº 9 and Nº 19 (mass spectrometry). The initial enrichment of the fuel was 19.75 wt.%. The average was estimated including the thermalization effect in the meat edge.
Inner plate Nº 09
Center Line Meat Edge Line
Axial Position
(cm from top)
Isotopic comp.
U-235 (wt.%)
Depleted
(% U-235)
Isotopic comp.
U-235 (wt.%)
Depleted
(% U-235)
7 17.22 12.81% 15 16.24 17.77% 23 15.63 20.86% 31 15.54 21.32% 14.71 25.52% 39 15.66 20.71% 47 16.21 17.92% 55 17.29 12.46% Average 18.2%
Outer plate Nº 19
Center Line Meat Edge Line
Axial Position
(cm from top)
Isotopic comp.
U-235 (wt.%)
Depleted
(% U-235)
Isotopic comp.
U-235 (wt.%)
Depleted
(% U-235)
7 16.52 16.35% 15 15.53 21.37% 23 14.87 24.71% 31 14.61 26.03% 13.89 29.67% 39 14.83 24.91% 47 15.49 21.57% 55 16.66 15.65% Average 22.2%
The normalization process from point burn-up results to the average in the whole plate was done by a simple geometric normalization procedure. It leads to the average values of 18.2% and 22.2% of depleted U-235 for plates Nº 9 and Nº 19, respectively. Due to the relatively low amount of point samples taken from the plates no estimation of the normalization accuracy was done, nevertheless, it is expected to be lower than the accuracy of the mass spectrometry process. Currently, further experiments are scheduled to take and measure more samples from the plates in order to improve the normalization and to estimate the associated uncertainties.
In the same samples, the Nd-148, total U and Pu concentrations were also analyzed in order to obtain an exact evaluation of the percentage of the fissioned heavy metal (HM) regarding to the total pre-irradiated HM.
263

IAEA-CN-100/50P
FIG. 12. Burn-up distribution for plates 09 and 19.
5. Calculation results 5.1. Monte Carlo Due to the increased speed of computers, use of Monte Carlo methods for burn-up calculations is becoming more practical. The MONTEBURNS [8] code, tested before for the TRIGA fuel [9] was used for this purpose. The code is a fully automated tool that links the Monte Carlo transport code MCNP [10] with the radioactive burn-up and decay code Origen2.1 [11]. The main function of Monteburns is to transfer one group cross-section and neutron flux values from MCNP to Origen, and then transfer the resulting material compositions after irradiation and/or decay from Origen back to MCNP. The number of these iterations is defined by the user. The code system is able to supply quantitative information about the keff as a function of the irradiation time (burn-up), mass of practically almost all fission products and transuranic elements produced and/or removed from the system, radionuclides activity, heat-load, ingestion and inhalation radiotoxicity. All the standard information supplied by Origen and MCNP like criticality, neutron spectrum, etc, can be obtained with just few system modifications.
The calculations were performed with the kcode option in MCNP. Water temperature was assumed 23 oC. No temperature corrections were applied to the MCNP cross-section data. 5000 neutrons per cycle and 800 cycles, skipping the 50 first cycles were used. The material cross-sections from ENDF/B-VI continuos-energy library were used whenever possible. The ENDF/B-V library was used for those fission products not available in the ENDF/B-VI library.
A burn-up history, as shown in Table IV, was simulated. The core 53 was assumed to be at the beginning of life (BOL), which means that all fuel assemblies were assumed fresh. No shuffling of the fuel assemblies in the cores was considered, except the P04 fuel assembly position changes that occurred from cores Nº 56 to Nº 57 and Nº 68 to Nº 69.
The cores were irradiated at constant and continuous power of 5 MW until the requested burn-up was achieved. The whole burn-up of the cores was divided in three burn-up steps – from cores Nº 53 to Nº 56; Nº 57 to Nº 68; and Nº 69 to Nº 71 – just following the position changes
264

IAEA-CN-100/50P
of P04 assembly. After that, a 5 year decay time was considered. The library Thermal.lib was used in the Origen2.1 calculations of the isotopic compositions.
The following nuclides (fission products and transuranic elements) were considered “important” in the simulation: Xe-135, Sm-149, Sm-151, Pu-239, Nd-143, U-236, Pm-147, Rh-103, Xe-131, Cs-133, Tc-99, Nd-145 and Pu-240. Besides these nuclides, also the elements with atom fraction, weight fraction, fraction of absorption and/or fraction of fission in the overall material greater than 0.0001 were automatically considered important by Monteburns.
Results: Results of burn-up simulation for test P04 fuel assembly are presented in Table VI. It presents the burn-up and mass contents of U-235 for fuel plates Nº 9, Nº 19 and the total for P04 assembly, which allows direct comparison with the experimental values presented in the previous section.
Table VI. Average calculated (Monteburns) burn-up. Initial mass of
U-235 (grams) Mass of U-235 after
burning (grams) Depleted Uranium (%U-235 burned)
Plate Nº 9 17.91 14.5 19.0 Plate Nº 19 17.91 14.2 20.7 Total of P04 (19 plates)
340.29 273.83 19.5
After 5 years of cooling time considered in the burned fuel simulation of the test P04 assembly the activity has a strong contribution of the fission products Pm-147, Cs-137 and Cs-134. Nuclides with atomic mass equal 144 were not evaluated (they are not in the MCNP4B library), and therefore comparison with other fission products detected in the gamma scanning like the Ce-144 and Pr-144 was not possible.
5.2. Diffusion In parallel to the Monte Carlo burn-up calculation, the burn-up using the unit cell calculation of the macroscopic cross sections combined with a neutron diffusion code was also employed. The in-house developed Peruvian code WIMCIT was used for this purpose. This code uses WIMS [12] and CITATION [13] to perform fuel management of a MTR reactor with a mixed core. It is capable of performing two- as well as three-dimensional calculations
The methodology is based on the WIMS code for cell calculations in order to obtain macroscopic cross sections (see Figure 13). They are calculated in 18 groups and then collapsed to 4 groups in the range from 0.0 to 10.0 MeV with the following energy cut-offs: 0-0.625eV, 0.625eV-15.03keV, 15.03keV-1.35MeV, 1.35 MeV-10MeV.
The problem dependent library is created as function of the irradiation to be subsequently used in the diffusion calculation. For the diffusion calculation the CITATION code is used. The main calculation steps are described in Figure 14.
In this model the core was divided into 21 planes, 13 of them in the active length (meat zone), and each plane was divided into 190 zones. Since the meat zone heights are different for P04 and standard fuel assemblies the density of U3Si2 fuel in the P04 fuel was changed to compensate for the lower value of the meat zone. In this way the dimensions were preserved in the diffusion model. Since the fuel elements do not have the same weight of U-235, a virtual burn up was defined in each element, to compensate for small differences in weight of U-235 and to start with the same composition. The calculation started using burn up data provided by CNEA for the core 53, which leads to an additional error.
265

IAEA-CN-100/50P
FIG. 13. Cell calculation methodology.
FIG. 14. Diffusion calculation methodology.
266

IAEA-CN-100/50P
Results: The total burn-up for the P04 fuel assembly for each core configuration is shown in Table VII. WIMCIT also calculates the burn-up profile, which in this case results in 13 planes in the meat zone of 615 mm. The first plane is located at 2.365 cm, the second at 7.095 cm, etc. The burn-up value is accumulated for each partial calculation in a burn-up library. This model used a fine mesh, therefore allowing to calculate density power in every plate. The burn-up profile for the plate Nº 9 of the P04 fuel assembly is given in Figure 15.Table VIII gives the average burn-up for both plates, Nº 9 and 19.
Table VII. Burn-up calculated for the P04 in each RA-3 core.
Core MWd/Ton Depleted Uranium (%U-235 burned)
53 911.9 0.58 54 4036 2.56 55 6764.7 4.28 56 9116.9 5.77 57 10721.5 6.79 58 12374.1 7.84 59 14614.2 9.25 60 16871.1 10.68 61 17331.8 10.98 62 18757.7 11.88 63 21626.3 13.69 64 22539.6 14.27 65 22996.3 14.56 66 23385.2 14.81 67 25604.3 16.21 68 27829.5 17.62 69 30740.9 19.47 70 33411.1 21.16 71 36649.2 23.21
FIG. 15. Calculated burn-up distribution for plate Nº 09.
267

IAEA-CN-100/50P
Table VIII. Average burn-up calculated for the fuel plate Nº 9 and Nº 19. Plate (%U-235 burned)
Nº 9 17.0 Nº 19 20.9
6. Conclusions The burn-up of two fuel plates, among the nineteen that compose a silicide-based Low Enriched Uranium (LEU) of a MTR fuel assembly was experimentally determined by destructive chemical analyses through the measurement of U-235 depletion using mass spectrometry. The relative burn-up profile had been previously evaluated in both plates by gamma scanning spectroscopy using Cs-137 activity as a burn-up monitor. This profile was used to select the location of the samples for destructive analysis. In addition, burn-up calculations were performed using two different methodologies. With the first method a unit cell calculation of the effective cross sections with the WIMS code was combined with the CITATION diffusion code. The second method was based on the MONTEBURNS calculation, where the burned fuel isotopic vector is calculated with the ORIGEN code and automatically linked to the MCNP Monte Carlo transport code.
Seven equi-spaced samples for chemical burn-up analyses were taken along the axial center line and one sample close to the meat edge of both plates. The purpose was to evaluate the burn-up distribution along the fuel plates and to estimate the average burn-up for the entire plates. The average burn-up for the whole plate was done by a simple geometrical normalization procedure.
Monte Carlo and diffusion burn-up calculations have shown good agreement with the experimental values. The average experimental burn-up for plates Nº 9 and Nº 19 was estimated 18.2% and 22.2% of U-235 depleted, respectively. The Monte Carlo calculation gave 19.0% and 20.7%, while the diffusion calculation gave 17.0% and 20.9%. The comparison between these results shows that calculation agrees within approximately 6% with the measurements.
Acknowledgement The authors acknowledge the support of the International Atomic Energy Agency (IAEA) through the project RLA/4/018 which made the accomplishments here described possible. Such support has strongly contributed to the development of the Latin America strategy for management of the research reactors spent fuel.
REFERENCES [1] RUGGIRELO G., CALABRONI H., SANCHEZ M., ZAWERUCHA A., Desarrollo de
un Sistema Versátil para la Caracterización del Quemado de los Elementos Combustibles tipo Placa. CNEA, UACN, Argentina.
[2] MEDINA E. G., NASSINI H. E. Informe de Diseno en Condiciones Normales de Operacion de los Elementos Combustibles de Bajo Enriquecimiento (ECBE) Normal y de Control Destinados al RA-3. CNEA, UPESN, IT-IEC 02/90, Argentina.
[3] GOMEZ, J., Propuesta de Irradiacion en el RA-3 de EC placa de Bajo Enriquecimiento con Siliciuros de Uranio. CNEA, Division ECRI, Departamento Combustibles Nucleares, Argentina.
[4] PEREZ, E.E., Descripción del Prototipo ECBE de 19 Placas Combustibles para Irradiacion en el RA-3. CNEA, Departamento Combustibles Nucleares, Argentina.
268

IAEA-CN-100/50P
[5] CNEA, Fabricación EC Prototipo 04 de Alta Carga de U3Six/Al. Departamento Combustibles Nucleares, Division ECRI, Argentina.
[6] NOTARI, C., CALABRESE, R., Introducción de un EC Prototipo com Siliciuro de Uranio en el RA3. CNEA, Centro Atomico Constituyentes, Argentina, 1995.
[7] DEVIDA, C., GAUTIER, E., GIL, D., STANKEVICIUS A., The LFR Facility (CNEA) for Burn-up Determination in Uranium Silicide Fuels 20% 235U. RERTR 2002, Bariloche, Argentina.
[8] POTTON, D.I. and TRELLUE H. R., User’s Manual, Version 2.0 for Monteburns Version 1.0, LA-UR-99-4999 (September 1999).
[9] DALLE H, M. and JERAJ R., Validation of the Monteburns Code for Criticality Calculations of Triga Reactors. XIII ENFIR, INAC 2002, Rio de Janeiro, Brazil, 2002.
[10] BRIESMEISTER, J.F., MCNP – A General Monte Carlo N-Particle Transport Code, Version 4B, LA-12625-M, 1997.
[11] CROFF, A.G., A User’s Manual for the ORIGEN2 Computer Code. ORNL/TM-7175, 1980.
[12] AHNERT, I., Programa WIMS-TRACA para el calculo de elementos combustibles. Manual de usuario y datos de entrada, Junta de Energia Nuclear; Madrid, 1980.
[13] FOWLER et al. Nuclear Reactor Core Analysis Code: CITATION. Oak Ridge National Laboratory. July 1969.
269

IAEA-CN-100/56P
Fuel Burn-up Measurements using Gamma Spectrometry Technique C. Pereda, C. Henríquez, J. Medel, J. Klein, G. Navarro Comisión Chilena de Energía Nuclear, Santiago de Chile, Chile
Abstract. This paper presents the burn up results obtained using gamma spectroscopy technique, during the present year in the in-pool facility built in the RECH-1 Research Reactor, from a set of measurements with analogue short decay periods, for the fuel assembly LR-04L (LEU) included in the project for testing the 19.75%235U enriched MTR-type fuel elements, that are made in the Chilean Nuclear Energy Commission (CCHEN). Additionally, it shows burn up measurements for three 45% 235U FE, that had relatively long cooling times, in order to check on the whole system and to compare the results with the previously obtained by neutronic codes. The principal conclusion, it is the verification of Cs-137 as burn-up monitor, even at short cooling times, (50 decay days). As for the shorter cooling times the conclusions are hopeful, but not yet reliable.
1. Introduction In the near future, the RECH-1 research reactor will be completely converted to the use of LEU fuel. The current core configuration loaded uses 26 HEU (45% of 235U) fuel assemblies made by the UKAEA in Dounreay, Scotland, and 8 LEU fuel assemblies made by the Chilean Fuel Fabrication Plant (PEC). The first two LEU fuel assemblies were loaded in the reactor core on December 1998, and the second two on July 1999. Other four LEU fuel assemblies have been gradually loaded to replace spent HEU fuel assemblies. The reason of loading the first four LEU fuel assemblies was to start an evaluation local programme to know the behaviour under irradiation of the assemblies made by the PEC.
In order to measure the fuel burn-up of irradiated fuel assemblies, the CCHEN has two completely independent facilities using gamma spectroscopy technique: a hot cell facility and an in-pool facility. The first facility is mainly used to measure burn-up of spent fuel assemblies with decay periods larger than three months. With the purpose to measure burn-up of fuel assemblies with shorter decay periods, it was decided to build an in-pool facility.
For decay periods of about 2 years 137Cs is an excellent fission monitor [1]. In previous papers it was shown that this monitor could be used up to a decay period of 94 days with good reproducibility of the measurements and reliable results [2], [3]. This paper confirms again the quality of the 137Cs as monitor and it presents results using 137Cs with decay period of 50 days.
The measurement of burn-up using gamma spectroscopy technique after long decay period is very well known and 137Cs as monitor gives reliable results. However, the same measurement with short decay periods (few days) produces serious difficulties in the treatment of the collected experimental data. The origin of these difficulties is the high activity generated by a large number of fission products of short life time, which increases the death time and background reducing the quality of the statistics of the monitor. Monitors like 95Zr, 140La, 103Ru, 95Nb, etc. have good statistics; however, they have too short life to keep the accumulated burn-up for long irradiation time.
The burn-up of some fuel assemblies of the RECH-1 research reactor with short decay period was measured at the in-pool facility using 95Zr as monitor. The methodology presented in this paper should be taken as a first attempt to use 95Zr as a monitor. The results achieved were compared with those obtained with 137Cs for the same measurements.
270

IAEA-CN-100/56P
2. Measurements
Before doing the burn-up measurements it is necessary to determine the absolute efficiency, ε, of the measuring system, which includes a set of careful measurements performed outside of the reactor pool. Consequently, it was necessary to recreate the geometry that allows to find proper conditions once the system is placed in the reactor pool. To evaluate the absolute efficiency, a LEU fuel assembly was fabricated with removable fuel plates. In the experimental arrangement, the attenuation factors due to water inside plates and the 7.4 mm water gap between the outer plate and the lower end of the collimators scanning tube were considered. The measurements were performed using a high activity 152Eu source with an initial activity of 3.66 mCi ± 3.5%, obtained on 28 January 1995 in accordance with the calibration certificate. Once the system was calibrated it was installed in the reactor pool. The fuel assemblies are placed about 2.5 meters deep on a horizontal support, see Photograph below.
The LEU fuel assembly identified as LR-04L, which was made by the PEC, was measured six times with a decay period of 5 days. After each measurement the fuel assembly returned to the reactor core. Due to problems of reproducibility and difficulties with the electronic, the analysis was finally concentrated in 3 spectra obtained on 30 January 2003, 13 March 2003, and 12 June 2003. Later on an additional measurement was taken on 24 September 2003 with a decay period of 50 days to be confronted with those obtained with short decay periods.
271

IAEA-CN-100/56P
The selected spectra were analyzed in accordance with the algorithm known for the 137Cs [2], where the factor f [4,5] was re-evaluated in each case. Fig. 1 shows a spectrum after a decay period of 5 days, and Fig. 2 shows the spectrum obtained after a decay period of 50 days.
FIG. 1. Spectrum after a decay period of 5 days
LR-04L Spectrum (13/03/03)
0
2000
4000
6000
8000
10000
12000
0,0 300,0 600,0 900,0 1200,0 1500,0
Energy [keV]
Cou
nts
Nb-95 La-140
Co-60
5 Cooling Days
Zr-95
Co-60
Figure 1
I-132
Ru-103
I-131
Te-132
Central Position
272

IAEA-CN-100/56P
FIG. 2. Spectrum after a decay period of 50 days The burn-up was determined taking 95Zr as monitor and its peak of 724 keV (gamma yield of 44.15%) using the same algorithms for 137Cs [1] with appropriated modifications of those parameters which depend on the energy and monitor itself. A factor F depending on decay of 95Zr during the period between reactor operations was included. To formulate the F factor, two assumptions were taken into account:
a) In each operation approximately the same net amount of 95Zr is generated;
b) The amount of 95Zr measured is approximately equal to the amount of nuclides generated during each operation.
LR-04L Spectrum (24/09/03)
0
20000
40000
60000
80000
100000
120000
0,0 200,0 400,0 600,0 800,0 1000,0 1200
Energy [keV]
Cou
nts
Figure 2 50 Cooling days
Nb-95
Cs-137
Co-60
Zr-95
Ru-103
Central Position
273

IAEA-CN-100/56P
The first approximation is more relevant than the second because the average operation power remains about the same (5 MW). The second approximation should be justified through the average values of the thermal neutron parameters of the reactor core: σa(235U) = 694 barns, σa(95Zr) = 5.4 barns, φth = 3×10¹³ [n/cm2.s]. Taking into account the typical operation time, maintenance period, and time between operations of the RECH-1 reactor, the following expression for the factor F applied to 95Zr is proposed:
( 1 )− − = + + − −
TF k e p k peλτ λ , (1)
where: k: total numbers of reactor operations, τ: time between operations, T: maintenance period, and p: number of maintenance periods while the fuel assembly was in the reactor core.
λ: 95Zr Disintegration Constant. The burn-up results obtained for the fuel assembly LR-04L are shown in Table 1. Fuel Assembly Date of Decay Period, Burn up (Cs-137) Burn up (Zr-95) Calculated Identification Measurement Days % % Burn up, %
LR-04L 30-Jan-03 5 20.63 27.88 22.78 LR-04L 13-Mar-03 5 22.09 23.68 23.00 LR-04L 12-Jun-03 5 17.13 25.08 24.52 LR-04L 24-Sep-03 50 22.75 - 25.40
Table 1. Burn-up results obtained for the LR-04L fuel assembly
using 95Zr and 137Cs as monitors and CITATION code. Additionally to the measurements presented before, a routine to measure three HEU fuel assemblies, was done which are now decaying in the reactor pool with a decay period from 4 months to 2 years. The purpose of those measurements was (a) to verify the right behaviour of the experimental system using 137Cs as monitor, and (b) to fulfil with the burn-up experimental measurements programme. The results are shown in Table 2, where the burn-up results obtained by code were included. The experimental results show that those obtained using 137Cs as a fission monitor give values less than those obtained using the neutronic code CITATION. This behaviour was previously observed [1,2,3]; however, these results have an acceptable statistic range.
Fuel Assembly Date of Decay Period, Burn up (Cs-137) Calculated Identification Measurement Days % Burn up, %
LR-06 11-Sep-02 102 36.55 42.67 LR-06 25-Jun-03 389 37.05 42.67 LR-25 16-Jul-03 749 37.99 41.03 LR-01 09-Sep-03 141 35.00(*) 44.25
(*)This measurement was achieved with 10 areas instead of 12.
Table 2. Burn-up results obtained for HEU fuel assembly using 137Cs as monitors and CITATION code.
274

IAEA-CN-100/56P
In relation with the determination of the experimental error, it recognized the existence of many sources: efficiency, algorithms (factor f and F), geometry, statistic factors, the system itself, calibration, data, etc. The obtaining of a representative error could be very difficult due to the correlation among the factors involved. In accordance with the previous experience, it could establish that the greatest effect has as origin in the first two factors; i.e., efficiency and algorithms to determine the factors f and F. Thus, the estimated error is between 10% - 15% depending on the monitor and associated algorithm.
Figures 3, 4 and 5 show profile of activities for the fuel assembly LR-04L (Fig. 3 and 4) and LR-06 (Fig. 5).
LR-04L (LEU) Compared Activity Profile (13/03/03)
0
50
100
150
200
250
100 200 300 400 500 600 700 800
Position [mm]
Act
ivity
Figure 3
Measurement Time: 100 s
Monitor: Zr-95
Monitor: Cs-137
275

IAEA-CN-100/56P
3. Conclusions The most relevant results of this work, in relation to the measurements with low cooling time, are the burn-up values that, in spite of the rude approximation used for the 95Zr and the low statistic of the 137Cs, they are reasonably within the range calculated using codes.
LR-04L Activity Profile (24/09/03)
0.00
5.00
10.00
15.00
20.00
25.00
30.00
35.00
40.00
100 200 300 400 500 600 700 8
Position [mm]
Act
ivity
Figure 4
Measurements Time : 1 800 s
Monitor : Cs-137
Cooling Time: 50 days
LR-06 (MEU) Compared Activity Profile
0,00
5,00
10,00
15,00
20,00
25,00
30,00
35,00
40,00
45,00
100 200 300 400 500 600 700 800
Position [mm]
Act
ivity
Figure 5
First Cooling Time: 102 daysSecond Cooling Time: 389 daysMeasurement Time: 1800 s
11/09/0225/06/03
276
IAEA-CN-100/56P
Nevertheless, it is easy to see that these evaluations show an anomalous behaviour but, it can be expected that these behaviours could be comprehensible and improved in further and detailed analyses.
One of the very next steps consists, precisely, in refining the correction F factor for the 95Zr, taking into account the power history of the reactor in a very much detailed way and to use a greater number of neutron energy groups in the solution of the pertinent equations.
During the course of this work, several technical difficulties were verified which only contribute to difficulty in reproduction of the measurements and, consequently they must be reduced and controlled during further measurements. Amongst these factors are the use of a portable detector which is to be taken out from its measurement position, to be recharged of liquid N, which obviously conspires to keep the geometrical conditions. Electronics is also highly sensitive to external changes which generate mathematical errors. It is planned to verify the behaviour of these factors and others during the next periods of measurements.
As to HEU fuel measurements, with cooling times larger than 4 month, and the LEU, yet with only 50 cooling days, the excellency of the 137Cs as a burn-up monitor is confirmed. Nevertheless, measurement methods shall be refined with the mayor reason of reducing the different causes of error.
Acknowledgement The authors wish to express their gratitude to Dr. Abe Kestelman, from Bariloche Atomic Centre, for his great scientific assistance and support along all the first steps of this work.
REFERENCES
[1] HENRÍQUEZ, C., NAVARRO, G., PEREDA, C., MUTIS, O., TERREMOTO, L.A.A.,
ZEITUNI, C.A., “Burnup measurements of experimental Fuel Element, using gamma spectroscopy”, XIII Enfir, Rio de Janeiro, Brasil, August 2002
[2] HENRÍQUEZ, C., NAVARRO, G., PEREDA, C., STEINMAN, G., “Medición de Quemado de un Elemento Combustible Experimental Mediante Espectroscopía Gamma”, Nucleotécnica, 35, 71-83, 2001.
[3] HENRÍQUEZ, C., NAVARRO, G., PEREDA, C., TORRES, H., PEÑA, L., KLEIN, J., CALDERÓN, D., KESTELMAN, A.J., “Burnup Measurements at the Rech-1 Research Reactor”, RETR 2002, Noviembre 2002, Bariloche, Argentina.
[4] KESTELMAN, A.J., RIBEIRO GUEVARA, S., “Determinación del Quemado en Combustible tipo MTR Mediante Espectrometría Gamma con Cristal de INa (Tl)”, Informe Técnico CNEA-CAB 88/034.
[5] TERREMOTO, L.A.A, ZEITUNI, C.A., PERROTA, J.A., DA SILVA, J.E.R., “Gamma-ray spectroscopy on irradiated MTR fuel elements”. Nucl. Instr. Meth. A 450(200) 495-514.
[6] SUAREZ, P., KESTELMAN, A., “Determinación no destructiva del quemado en elementos combustible tipo MTR mediante espectroscopía gamma de alta resolución”, Memoria de Título, Instituto Balseiro Universidad Nacional de Cuyo, CNEA , Junio 1989.
[7] ZEITUNI, C.A., “ Espectrometria Gamma em Elementos Combustìveis tipo Placa Irradiados” , Instituto de Pesquisas Energéticas e Nucleares, Sao Paulo, 1998.
[8] Determination of research reactor fuel burn-up, IAEA-TECDOC-633,January 1992.
277

IAEA-CN-100/68P
FiR 1 Reactor and the Plans for the Spent Fuel Management S.E.J. Salmenhaara VTT Processes, Technical Research Centre of Finland (VTT), Espoo, Finland
Abstract. The FiR 1 –reactor, a 250 kW Triga reactor, has been in operation since 1962. The main purpose to run the reactor has been lately the Boron Neutron Capture Therapy (BNCT). According to the current operating license of our reactor we have to achieve a binding agreement between our Research Centre and the domestic Nuclear Power Companies about the possibility to use the Olkiluoto final disposal facility for our spent fuel. There is also the possibility to make an agreement with USDOE about the return of our spent fuel back to USA with the well known time limits. If we want, however, to continue the reactor operation beyond the year 2006, the domestic final disposal is the only possibility. At the moment the domestic final disposal is naturally the primary alternative, but it seems still to be reasonable to be prepared to both possibilities: the domestic final disposal and the return to the USA offered by USDOE. Because the cost estimates of the both possibilities are on the same order of magnitude, the near future of the reactor itself will decide, which of the spent fuel policies will be obeyed. During one year’s time we must have an opinion about the future of the reactor and at the same time we have to decide, who will be the partner when making the agreement about the final disposal of our spent fuel. If the BNCT and other irradiations develop satisfactorily and seem to have a positive future, the reactor can be kept in operation beyond the year 2006 and the domestic final disposal will be implemented.
1. Introduction The FiR 1 reactor, a 250 kW Triga reactor, has been in operation since 1962. The main purpose to run the reactor has been lately the Boron Neutron Capture Therapy (BNCT). The epithermal neutrons (1 eV – 10 keV) needed for the irradiation of brain tumour patients are produced from the fast fission neutrons by a moderator block consisting of Al+AlF3 (FLUENTAL) developed and produced by VTT. The material gives excellent beam values both in intensity and quality and enables the use of a small research reactor as a neutron source for BNCT purposes. Twenty-four patients have been treated since May 1999, when the license for patient treatment was granted to the responsible BNCT treatment organization. The treatment organization has a close connection to the Helsinki University Central Hospital. The BNCT work dominates the current utilization of the reactor: three or four days per week for BNCT purposes and the rest for other purposes such as the neutron activation analysis and isotope production. Figure 1 describes the general layout of the BNCT facility at the FiR 1 reactor. The facility gives a high epithermal neutron field, 1.1×10⁹ n/cm2s with a very low fast neutron and gamma component.
During the next two years the back end solutions of the spent fuel management will have a very important role in our activities and in the possibility to continue the operation of the reactor. According to our current operating license we have now about two years’ time to achieve a binding agreement between VTT and the domestic Nuclear Power Plant Companies about the possibility to use the final disposal facility of the Nuclear Power Plants for our spent fuel. In this case we can continue the operation of the reactor as long as there is reasonable work to do with the reactor and as long as the funding is in order. Naturally we can also make an agreement with the USDOE within the well-known time limits.
278

IAEA-CN-100/68P
FIG. 1. BNCT facility at the FiR 1 reactor
2. Final disposal solution of spent fuel in Finland The Finnish Nuclear Power Companies founded in 1995 a separate company Posiva to develop the technology and carry out safety analysis and site investigations for implementing the spent fuel final disposal. In 1999 Posiva submitted an application for a decision in principle for a final repository to be built at Olkiluoto, on the western coast of Finland. Olkiluoto is also one of the two nuclear power plant sites in Finland. At the end of the year 2000 the Finnish government approved the application and sent it to the parliament for ratification. The ratification took place in May 2001. Separate licenses still will be needed for the construction of the facility, scheduled to start in 2010, and also for the operation, 10 years later. The government alone will grant these licenses.
For the final repository the spent fuel will be encapsulated in airtight copper canisters and situated in the bedrock at a depth of 500 m. The safety of this deep underground repository is based on multiple natural and engineered barriers. Each canister contains 12 normal fuel assemblies from nuclear power plants. The present concept for Triga fuel elements is that the elements will be loaded in containers, which have the same outer dimensions as the nuclear power plant fuel assemblies. This ensures that the Triga fuel will be easily handled in the final disposal facility and also loaded in the heavy copper canisters.
3. Nuclear waste management at the FiR 1 reactor In Finland also the research reactor must have a nuclear waste management plan, which contains among others a part for spent fuel management. The plan describes the methods, the schedule and the cost estimate of the whole spent fuel management procedure starting from the removal of the fuel from the reactor core and ending to the final disposal. The cost estimate of the nuclear waste management plan has to be updated annually and every fifth year the plan will be updated completely. The plan has been based on the assumption that the final disposal site will be somewhere in Finland. Now we know that the final disposal facility for the spent fuel of the nuclear power plants will be situated in Olkiluoto. The final disposal facility is supposed to be in operation in 2020.
279

IAEA-CN-100/68P
In Finland the producer of nuclear waste is fully responsible for its nuclear waste management. The financial provisions for all nuclear waste management have been arranged through the State Nuclear Waste Management Fund. The cost estimate of the nuclear waste management will be sent annually to the authorities for approval. Based on the approved cost estimate the authorities are able to determine the assessed liability and the fees to be paid to the Fund [1]. The main objective of the system is that at any time there shall be sufficient funds available to take care of the nuclear waste management measures caused by the waste produced up to that time. The system is applied also to the government institutions as FiR 1 research reactor operated by the VTT.
VTT has had already for thirteen years an agreement in principle about the possibility to use the final disposal facility of one of the Finnish Nuclear Power Companies. Later the agreement was transferred to the joint nuclear waste management company Posiva owned by the said Finnish Nuclear Power Companies. According to the current operation license of our reactor we have to achieve a binding agreement about the back end solution of the spent fuel in 2005 at the latest. This means that the said agreement in principle is not sufficient any more. The binding agreement has to be established during the time when there are still two possible agreement partners left. The binding agreement with Posiva is the only alternative, if we want to continue the reactor operation beyond the year 2006. Before we can start the real negotiations about the final disposal of our spent fuel with Posiva, we have to prepare a safety study about the behaviour of the Triga fuel in the final disposal surroundings.
The current operation license of our reactor will expire in 2011. It is very probable that there will be certain waiting time from the shut down of the reactor to the opening of the final disposal facility. Therefore there have to be a sufficient interim storage for the spent fuel before the transportation to the final disposal facility. After the renovation of the reactor building in 1997 we have sufficiently storage capacity for the fuel. So far we have used it as a dry storage.
4. Safety of the TRIGA fuel in the final disposal repository In order to start the negotiations with the Nuclear Power Companies or their representative Posiva we have to prepare a safety study about the long-term behaviour of the Triga fuel in the final disposal repository. As was already mentioned the Triga fuel elements will be loaded in containers, which have the same outer dimensions as the nuclear power plant fuel assemblies. We need from 3 to 5 such containers for all the Triga fuel elements. The containers can easily be loaded into the heavy copper canisters, which have 12 positions to be loaded. For the criticality reason the Triga containers will be situated in the outer zone of the canister and the inner zone will be left empty. In practice the empty positions will be loaded with dummy assemblies made of cast iron. It can be shown that the system is critical safe. This is important, because if the criticality safety would demand the fuel to be divided to two or more canisters, the expenses would also be about twice or more compared to the one canister alternative.
5. The connection between the bnct-work and the spent fuel management If we want to utilize the USDOE policy and return our fuel back to USA, it means in practice that the whole inventory of the irradiated fuel should be sent to USA at the same time. Thus the return of the fuel back to USA means in other words the shutting down of the reactor permanently, which is against our plans to continue the development of the BNCT-project.
The BNCT work is today the main purpose to run the reactor. The amount of BNCT irradiations is still rather low: twenty-four irradiations during the first four years. However, at the end of last year (2002) the funding of the BNCT project was reorganised and the new
280

IAEA-CN-100/68P
arrangement ensures sufficient funding both for the reactor operation and the BNCT work for the next two or three years. During that time we together with the treatment organization have the opportunity to show that the BNCT irradiations will have positive influence to the patients and will be needed also in the future. If the BNC treatment results are promising and the positive trend seems to continue, the funding of the BNCT project will continue. In this case there is no reason to use the USDOE alternative. Instead it is reasonable to continue the reactor operation beyond the year 2006, which means also the choosing of the domestic alternative for the treatment of the spent fuel. If, however, the results of the BNC treatments do not fulfil the expectations, the funding of the reactor can be stopped after the said period. This leads inevitably to the permanent shut down of the reactor. In that case the USDOE alternative seems to be the right one.
6. Conclusions It is reasonable to keep so far both of the possibilities open: the domestic final disposal and the return to the USA offered by USDOE. The cost estimates of the both possibilities are on the same order of magnitude. Next year (2004) we will have an opinion about the future of the reactor and we will be able decide, which of the spent fuel policies will be obeyed. Meanwhile the necessary safety assessments concerning the behaviour of the spent fuel in the final disposal surroundings will be completed and based on the safety assessments the draft of the binding agreement will be written.
REFERENCES [1] VÄÄTÄINEN, A.E., MANNINEN, J., Funding of future dismantling and
decommissioning costs in the Finnish State Nuclear Waste Management Fund. Safe Decommissioning for Nuclear Activities. Proceedings of an International Conference Berlin, 14–18 October 2002, IAEA, Vienna (2003)
281

IAEA-CN-100/114P
Maintenance Programme for a Safe Prolonged Wet Storage of the Nuclear Spent Fuel at IFIN-HH Bucharest-Magurele Site C.A. Dragolici, A. Zorliu, C. Petran, I. Mincu, G. Neacsu National Institute of Research and Development for Physics and Nuclear Engineering "Horia-Hulubei", Nuclear Research Reactor Department, Bucharest-Magurele, Romania
Abstract. In order to ensure that the spent nuclear fuel that resulted from the WWR-S research reactor utilization will be maintained in a safe stable state until the shipment to the country of origin will be available, a complex maintenance programme was formalized in our department. Owing to the lack of funds, this programme was delayed to be carried out, only some parts of it were implemented to improve the water quality. To help our institute to accomplish safety measures regarding the wet storage and maintenance of the spent nuclear fuel, the United States Department of Energy provides technical and financial assistance. In the framework of the contract between IFIN-HH and DOE a scheduled operational maintenance programme was issued.
1. Introduction Storage of aluminium-clad spent nuclear fuel (SNF) at the National Institute of Research and Development for Physics and Nuclear Engineering (IFIN-HH) has been a concern over the past four years because of the long time interim storage requirements in water. Regardless of burn-up, plenty of Fuel Assemblies (FA) were discharged during time from the reactor core, for the final time. It is then normally placed in pools for cooling and interim storage until a final disposition is made. As a result of 40 years of intense utilization of the WWR-S research reactor from IFIN-HH, 223 FAs of burned fuel were produced and stored in special ponds. Some of this aluminium-clad spent fuel has been in water storage for more than 40 years and remains in pristine condition until three years ago. Corrosion concerns on the spent fuel have been minimal over the years of fuel storage. The water in these basins is currently being maintained but no special issues were applied to improve water quality. Some pitting was reported on aluminium outer surface of some FAs, but this was attributed to material defects and fabrication concern. An intensive effort was made at our department to understand the corrosion problems [1] and to be able to improve the basin storage conditions for extended storage requirements (in accordance with the demands from [2] and [3]). A complex maintenance program was formalized but due to lack of funds it was delayed to be carried out. Even so, despite financial problems some parts of this program were implemented to improve the water quality [4].
2. Description of the maintenance programme Since March 2003 a completion of the initial programme was possible due to US financial assistance to make it feasible. As part of the contract between National Atomic Energy Agency (ANEA) and Department of Energy (DOE) that should be in force on 01 May 2003, a scheduled operational maintenance program was issued. This programme contains:
(a) Baseline characterization and storage life prediction. Water sample (approx. 1 litre) is taken from one established location in each of the 4 pool basins which will be sent to the on-site radiochemistry lab. Scientist setting up the baseline characterization process, writing the procedure and getting it approved, overseeing sample extraction, evaluating sample results and documenting them in the water basin baseline characterization report.
282

IAEA-CN-100/114P
This report and the approved procedure will form the DOE contract submittal for this task.
(b) Formalize water characterization program. Scientist setting up the weekly (Category A parameters) and the monthly (Category B parameters) characterization process, writing the procedure and getting it approved, overseeing sample extraction, evaluating sample results and documenting them in the new format (Excel spreadsheet and graph for trend analysis). The report covering 3 months of data and the approved procedure will form the DOE contract submittal for this task.
(c) Formalize corrosion surveillance program. Developing the technical program, analyzing data results, generating the conclusions; submit DOE report. Develop techniques and procedures; submit DOE report of task and procedure. Fabricate coupons and rack; one for each pool; rack contains three types of aluminium coupons (EK-10, C-36, Al pool walls, etc.).
(d) Visual examination of longest stored assemblies (EK-10 and C-36). Extracting the assembly and manipulating it, the underwater camera, and the lighting for examination performance. Perform underwater camera engineering and software interface for examination performance. Oversee examinations and perform data analysis; writing DOE deliverable report.
(e) Identification and disposition of the failed fuel assemblies in Pool #3. Internal project planning and oversight; maintaining site fuel movement records; co-ordinating the maneouvering of the fuel assemblies, writing the procedure, and ensuring personnel training and safety. Fuel assembly manipulation for each of 60 assemblies in the pool #3; 4 operators on team will work simultaneously. Setting up the method and procedures; optimizing parameters of experiment; analysis of information that is discovered, developing implementation methodology, and writing the final DOE deliverable report.
(f) Vacuum silt and water change. Task performance: 2 weeks duration per pool; 4 operators on crew; 8 month total effort. Writing procedures and developing the technique; overseeing the task; developing DOE report submittal.
(g) Relocate fuel from reactor cooling pond to AFR (Away from Reactor) Pool #1. This is simply a placeholder to track the work in the contract; the majority of effort will be funded by Romania for this effort.
(h) Pool basin purification system. Submitting and overseeing license process. Develop the license application documentation for regulatory body; developing methodology and procedures; oversight; DOE report development submittal.
(i) Pool water level monitoring. Specify equipment to procure and oversee installation; write procedure; submit DOE report.
The activities mentioned above should improve the conditions of temporary storage of the spent nuclear fuel in the pools, minimize further corrosion of the fuel cladding and provide information about the state of the fuel. The main goal of this strategy is to ensure that the fuel is maintained in a safe stable state until the shipment to origin country becomes available.
3. Characterization and corrosion surveillance programme In present, the signed agreement between IFIN-HH and DOE has another order of priorities. Most of them are focused on equipment procurement and testing, upgrading of pools ventilation system, replacement of exhausted filters a.o.. Even in this conditions the main program was not aborted, some of its tasks are already accomplished or are in progress.
283

IAEA-CN-100/114P
Thanks to the IAEA co-ordinated research project “Corrosion of research reactor aluminium-clad spent fuel in water, Phase II”, a number of 4 racks with coupons were provided to our department, to be immersed in each of the 4 basins where the fuel is stored, as in Fig 1. On this racks, site specific Al alloy coupons were added, see Fig 2.
FIG. 1. Position of rack in basin. FIG. 2. Rack with coupons.
Starting in May of the current year, the corrosion surveillance programme was started. The immersed racks are periodically monitored in accordance with IAEA provided procedures. Water sampling is performed weekly. The testing analyses cover yet the activity, conductivity and pH parameters, chloride, oxygen and constant residuals content. Oxygen content analysis is performed once at 6 month and the constant residuals once at 3 month. The rest are done monthly. Complete water analyses are necessary, specially to identify of heavy metals, sulfates, carbonates, nitrates and nitrites. Unfortunately, such kind of analysis are some how delayed, due to the lack of funds to procure the necessary equipment and materials. Some values obtained during the last four years of water parameters monitoring are presented in Table 1. As arising from Table 1, increased values of conductivity and activity of Cs-137 are observed. The history diagram from Pond #3 show also large values for conductivity and Cs-137 activity (see Fig. 3 and 4) that was assigned to fuel leakage. The random variation of the activity, even after complete water change, and the presence in this pond of 2 distorted FAs guide us to the idea that some of this may be responsible for worsen the water parameters.
284

IAEA-CN-100/114P
Table 1. Water parameters during the last 4 years, for pond #3.
Date [dd.mm.yy]
Cond. [µS/cm]
pH Cs-137 [Bq/l]
Co-60 [Bq/l]
Res. [mg/l]
Cl [mg/l]
O [mg/l]
24 01 00 15 18 7 01 22120 - - <0 02 -28.02.00 7.92 7.1 22105 - - <0.02 -27.03.00 5.36 6.7 3769 - 3.8 0.05 -24.04.00 7.03 6.68 3807 - - 0.05 -29.05.00 6.7 6.75 4721 - - 0.05 -20.06.00 7.52 6.63 4759 - 3.8 0.05 825.07.00 9.24 6.74 4530 - - 0.05 -27.08.00 8.53 6.63 - - - 0.05 -15.09.00 7.78 6.59 6065 - 4.5 0.05 -23.10.00 8.64 6.63 5914 - - 0.05 -27.11.00 7.5 6.88 8224 - - 0.05 -30.12.00 2.4 - - - - 0.05 -22.01.01 13.86 4.55 1048 - - 0.020 -19.02.01 21.44 4.46 1321 - - 0.020 -
Date
[dd.mm.yy] Cond.
[µS/cm] pH Cs-137
[Bq/l] Co-60 [Bq/l]
Res. [mg/l]
Cl [mg/l]
O [mg/l]
19 03 01 26 40 4 38 1635 1030 18 9 0 015 -23.04.01 27.72 4.25 - - - - -21.05.01 28.71 4.26 - - - - -18.06.01 29.20 4.38 1675 355 - 0.015 -23.07.01 7.53 5.90 559 - - 0.015 -17.09.01 14.57 5.55 2102 - 9 0.015 -21.10.01 15.16 5.72 2166 - - - -21.11.01 7.32 5.55 3073 - - - -19.12.01 16.02 5.80 - - - - -11.02.02 16.02 5.73 2577 - - 0.100 -25.03.02 14.06 6.63 1641 - 7.6 0.1 -29.04.02 16.38 6.90 - - - 0.250 -27.05.02 16.38 6.84 - - - 0.422 -10.06.02 15.00 6.87 - - 6.4 0.738 22.527.08.02 12.33 6.63 5200 - - - -30.09.02 7.16 6.25 2700 - - <0.02 -28.10.02 6.91 6.61 2871 - - <0.02 -18.11.02 6.53 6.74 2850 26 4.9 <0.02 -09.12.02 6.85 6.81 2837 - - 1.25 20.6613.01.03 7.24 6.81 2964 - - 0.929 -10.02.03 6.6 6.98 3368 94 5.8 0.914 -10.03.03 12.68 7.04 3277 - - 0.973 -07.04.03 12.33 6.98 3336 - - 1.2 -12.05.03 11.47 7.15 3686 - - 0.6 -10.06.03 12.72 6.58 4037 - 13.3 1.59 22.08
285

IAEA-CN-100/114P
P O N D #3
0
5
10
15
20
25
30
11.09
.96
14.11
.96
04.03
.97
27.05
.97
20.10
.97
01.11
.97
10.12
.97
23.02
.98
23.04
.98
17.07
.98
31.08
.98
26.10
.98
30.11
.98
16.12
.98
25.01
.99
22.02
.99
29.04
.99
31.05
.99
28.06
.99
19.07
.99
30.08
.99
Date [dd.mm.yy]
pH
C
ondu
ctiv
ity [ µ
S/cm
] Conductivity pH
FIG. 3. History of water parameters from Pond #3.
Water activity from ponds #2, 3 and 4 [Cs137] [1996-2000]
0
10000
20000
30000
40000
50000
60000
D at e
Pond 2 Pond 3 Pond 4
FIG. 4. History of activity from Pond #3 in comparison with Pond #2 and #4.
In order to identify the FAs with leakage, a special device for detecting and isolation was designed for this purpose. Every FA can be isolated in a special vessel [5] and the water around it is evacuated. After that, fresh clean water is pumped inside the vessel until the fuel is complete immersed in water. After 24 hours, to promote the leaching of nuclides in the liquid environment, water sampling is performed and the sample is sent for measurements (activity and nuclides components). To try out this technique, the 2 distorted assemblies from pond #3 were chosen for testing. For this purpose, the sipping test device was positioned in
286

IAEA-CN-100/114P
pond #3, as shown in Fig. 5. Before the test, the sipping container was rinsed with clean distilled water to reduce contamination from residual radionuclides. The first FA (see Fig. 6 and 7) was withdrawn from the spent fuel storage rack and inserted inside of the aluminium sipping tube. After that, the cover lid was put in his place and tight.
FIG. 5. Sipping test device. Functional view
FIG. 6 and FIG. 7. Distorted fuel assembly No. 7-35.
The entire amount of water around the tested FA was pumped out through the bottom plastic hose. After 10 minutes waiting, to see if the container preserve its tightness, an amount of about 30 litres of distilled water was pumped through the top hose, flushing the fuel to rinse it. The FA was left in the sipping vessel for 24 hours and after that, (repeating the procedure described above) 96 hours. Samples from the sipping tube water were collected and measured. The results are as follows:
FA No. 7-35; Cs-137 activity 8800 Bq/l after 24 hours and 23600 Bq/l after 96 hours;
FA No. 7-31; Cs-137 activity 5800 Bq/l after 24 hours.
287

IAEA-CN-100/114P
No other nuclides or fission products were detected after performing the γ-ray spectrometric analysis. The Cs-137 activity is much higher than in the water specimen collected for routine analysis. The results showed above encourage us that this method is efficient in detecting the leaky fuel. An underwater camera was used to take pictures of the entire process, see Fig. 8-13. In present, a complete work to test all the 60 FAs one by one, from Pond #3 is in progress. After identification, the fuel having flaws will be isolated, preferably in an a special empty pond.
FIG. 8 and FIG. 9. The FA is introduced in the sipping device for testing.
FIG. 10 and FIG. 11. The lid is closed to begin the test.
FIG. 12 and FIG. 13. The water is evacuated from the container and clean water is introduced.
288

IAEA-CN-100/114P
4. Conclusions The current activities to improve the conditions of SNF storage should provide valuable information regarding the state of the fuel, and decrease the possibility of further corrosion. These measures are taken only to extend the wet storage longer and safer as possible, the onely long term solution for the aluminium-clad spent fuel is the shipment back to the supplier for reprocessing or proper storage. The causes of the delays in full implementation of the above programme are the lack of necessary equipment and low material resources, as well as general economic difficulties at our institute.
REFERENCES
[1] JAMES P. HOWELL, Corrosion Fundamentals for Aluminium-Clad Spent Nuclear Fuel, Workshop on Characterization, Management and Storage of Spent Fuel from Research and Test Reactors, Warsaw (2000).
[2] INTERNATIONAL ATOMIC ENERGY AGENCY, Durability of spent nuclear fuels and facility components in wet storage, IAEA-TECDOC-1012, Vienna (1998) 48-50.
[3] INTERNATIONAL ATOMIC ENERGY AGENCY, Procedures and techniques for the management of experimental fuels from research and test reactors, IAEA-TECDOC-1080, Vienna (1999).
[4] C. A. DRAGOLICI, A. ZORLIU, C. PETRAN, I. MINCU, Experience during 21 years of spent fuel management and site exploitation at IFIN-HH Bucharest-Magurele, Proc. 6th International Topical Meeting on RRFM, Ghent (2002).
[5] LALGUDI V. RAMANATHAN, Spent fuel assessment, isolation of leakers, studies with corrosion coupons and preparations for shipment abroad, Workshop on Characterization, Management and Storage of Spent Fuel from Research and Test Reactors, Warsaw (2000).
289

IAEA-CN-100/138P
Control Rod Effect on Correlation of 95Nb/95Zr and Cooling Time K. Haddad Nuclear Engineering Dept., Atomic Energy Commission of Syria, Damascus, Syria
Abstract. Control rods can be adjusted inside a specially designed six-tube-fuel assembly of the IRT research reactor at the State Engineering-Physics Institute (MEPHI) in Moscow, Russian Federation. Gamma spectrometric measurements of 95Nb and 95Zr of the IRT irradiated fuel were used to investigate the effects of burn-up and control rods on the correlation between 95Nb/95Zr ratio and cooling time. The results showed that the burn-up has no noticeable effect, whereas the continuous adjusting of control rod inside the six-tube-fuel assembly has in some cases a severe effect. Using this correlation to estimate cooling time results in a high degree of uncertainty.
1. Introduction The 95Nb/95Zr ratio is usually used to determine the cooling time of the irradiated fuel for safeguards purposes when cooling time is not more than one year [1, 2]. In this work we have studied experimentally the control rod and burn-up effects on the 95Nb/95Zr ratio-cooling time correlation. Measurements were carried out on the fuel of research reactor IRT in MEPHI. Gamma-spectrometric measurements were carried out for 13 fuel assemblies, which were irradiated simultaneously in the reactor core during period from 18.05.1999 to 10.07.1999[3]. These assemblies had different burn-up values and different irradiation histories. In addition to that, different types of control rods were operating inside different six tube fuel assemblies. However, before the last irradiation, which lasted 4 months, these assemblies were not irradiated more than 14 months. Such irradiation mode has significantly affected the fission product accumulation in the fuel. Thus, fission products were accumulated in different fuel assemblies in totally different modes. The opportunity has appeared to investigate the effects of burn-up and control rods on 95Nb/95Zr ratio-cooling time correlation.
2. IRT fuel assembly IRT-3M fuel assembly consists of eight or six coaxial tubular fuel elements (to form six tube fuel assembly or eight tube fuel assembly), cap, ending part and displacer. Control rods can be adjusted inside six tube fuel assembly. Each fuel element is composed of three-layer pipe (core and coverings). Material of cap, ending part and displacer is aluminium alloy. Material of fuel element cores is uranium dioxide, dispersed in aluminium matrix. The initial fuel assembly enrichment (mass fraction) was- 90%. Fuel assembly general length is 880 mm, length of active layer containing uranium is 580 ± 20 mm.
3. Experimental set-up Measuring set-up was constructed in reactor hall. The main components: hot cell for irradiated fuel assembly; scanning system; collimator system and gamma spectrometer of coaxial HРGe (resolution of 2,41 keV for gamma line 60Co (1173,2 keV), efficiency 10%). The lead protection surrounding the detector has kept the ratio background/peak less than 1% (Fig.1).
290

IAEA-CN-100/138P
FIG. 1. Experimental set-up:
1. vertical displacement winch , 2. hot cell, 3. fuel assembly, 4. transferring bucket, 5. transferring channel, 6. collimators, 7. lead protection, 8 filter, 9. HPGe-detectors, 10. dewar vessel.
4. Evaluation of measurements Gamma spectra of each irradiated fuel assembly central section were acquired and peak areas of 95Zr (756,7 keV) and 95Nb (765,8 keV) were measured (Fig.2). The 95Nb/95Zr ratio was calculated using the relationship [3]:
( )( )
( )( )EABSEABS
EE
BB
PP
NNt
j
j
j
j
Nbj
Zrj
j
j
Nb
Zr
Zr
NbcR
1
2
1
2
1
2
2
1)( ⋅⋅⋅==εε
λλ ……………..(1)
where: N i - number of atoms of i-th element for cooling time of tc; λi- decay constant; Pj- the net peak area under the j-th energy peak; (j1, j2- denote 765,8 keV and 756,7 keV respectively); Bij- branching ratio; ε(Ej)- efficiency of the measuring setup for j-th energy; ABS(Ej)- self absorption correction. As the energies of the peaks are adjacent, so they have approximately equal ABS(Ej) and accordingly the ratio is simplified to the following relation, which was used to calculate the 95Nb/95Zr ratio:
( )( ) B
BEE
PP
NNt
Nbj
Zrj
j
j
j
j
Nb
Zr
Zr
NbcR
1
2
1
2
2
1)( ⋅⋅==εε
λλ ……………..(2)
0
4
8
650 750 1600E, keV
coun
ts r
ate,
10
3
661,
59
keV
137 C
s
724,
23 k
eV 95
Zr
756,
77
keV
95Zr
765,
85 k
eV 95
Nb
795,
99
keV
134 C
s
1596
,17
keV
140 La
FIG. 2. Gamma spectrum of fuel assembly (burn-up 48,6 %).
1
37
9
2
6
10
4
5
8
291

IAEA-CN-100/138P
5. The effects of burn-up and control rods on 95Nb/95Zr ratio-cooling time correlation Full energy gamma peaks of 95Nb and 95Zr rest on a background continuum caused by the Compton scattering of higher gamma rays. However the concentrations of long-lived fission products in irradiated fuel assembly rise as the burn-up increases. Many of these fission products emit gamma rays of high energies. So, it is expected that, the burn-up value will affect background continuum, which in turn will affect the full energy gamma peaks of 95Nb and 95Zr. To study these effects we determined the logarithm of 95Nb/95Zr ( )(tcRLn ) as a function of cooling time. According to theoretical consideration this function must be linear [5] and the effect of burn-up and control rods will appear as a perturbation of this linearity. This perturbation was estimated quantitatively by the deviation from linearity. The variation of )(tcRLn versus tc was determined experimentally for the fuel assemblies (Tab.1). By analyzing the resulting curve (Fig.3) we found that: by fitting experimental results corresponding to three eight-tube-fuel assemblies (133,183,185, which had different burn-up), using the least squares method we got the equation of fitted curve:
0.3952-0.0031)( tc×=tcRLn …….(3) The coefficient of determination for relation (3) is equal to 0.99. This result shows that, the effect of burn-up is negligible. This result is interpreted as follows: the concerned two peaks (765,8 keV and 756,7 keV) are adjacent, so the effects of background on each of them are approximately equal. Thus the ratio of these peaks will be insensitive to the background effect. According to that, any observed deviation from linearity can not be attributed to different burnup. Thus the correlation (3) will be used as reference curve to study the effects of control rods on 95Nb/95Zr ratio-cooling time correlation.
Table.1: Experimental results. ass. No. burnup % tc, days ln R err.% ln Rpo dev. %
133 46.50 71.59 -0.176 5.57 -0.175 0.12185 10.09 75.54 -0.163 8.12 -0.163 -0.29183 47.69 78.53 -0.154 4.43 -0.154 0.17009 15.54 79.53 -0.138 6.21 -0.151 -8.69008 11.72 80.59 -0.150 8.40 -0.148 1.52001 34.75 81.59 -0.118 6.23 -0.145 -18.32004 36.80 85.52 -0.110 7.28 -0.133 -16.68003 44.05 86.56 -0.152 3.56 -0.129 17.12005 32.61 87.54 -0.108 6.82 -0.126 -14.63002 36.88 88.55 -0.119 2.09 -0.123 -3.28007 19.49 89.58 -0.115 6.04 -0.120 -3.92010 11.37 92.56 -0.105 4.49 -0.111 -5.81006 30.58 94.51 -0.094 7.56 -0.105 -10.90
Control rod adjustment inside six tube fuel assemblies (1 up to 10) complicated the modes of fission product accumulation in these assemblies. This causes severe perturbation to the
)(tcRLn linearity. This effect was estimated quantitatively by the relative deviation, which is defined as:
pocpocc tttdev RLnRLnRLn )(/])()([100 −= × …………..(4)
where poctRLn )( is the value interpolated using relation 3. For assemblies (1, 3, 4, 5), in which automatic control rods adjustment was logged, the deviation from linearity was up to ±20%. So using these values to estimate cooling time will result in high degree of uncertainty. For cooling period not more than two months, it is expected that using 140La/95Zr ratio for cooling time measurement would give better results. This is because of less half life of 140La [T1/2
140Ba(140La) = 12.47 d] [6], so this fission product will be less sensitive to the past adjustment of control rods.
292

IAEA-CN-100/138P
-0,19
-0,17
-0,15
-0,13
-0,11
-0,09
70 75 80 85 90 95Cooling time, days
Ln(95
Nb/
95Zr
)
ref6t
FIG. 3. The variation of Ln(95Nb/95Zr) as a function of cooling time.
6. Conclusion The fuel assembly burn-up has no noticeable effect on the 95Nb/95Zr ratio-cooling time correlation, while control rod adjustment inside six tube fuel assembly has in some cases a severe effect. This effect causes up to ±20% deviation of the Ln(95Nb/95Zr) value from the expected one.
Acknowledgement The author would like to thank Prof. I. Othman (G.D. of AECS) for his encouragement and support. The author also expresses gratitude to Prof. A.V. Bushuev and the staff of the IRT reactor in MEPHI.
REFERENCES [1] GRABER, H.; HOFMANN, G.; NAGEL, S. KEDDAR, A, Gamma-spectrometric
determination of burnup and cooling time of irradiated ECH-1 fuel assemblies. Symposium on nuclear material safeguards, International Atomic Energy Agency (IAEA), Vienna, Austria. 2 - 6 Oct. 1978.
[2] GRABER, H., KEDDAR, A., HOFMANN, G., Gamma- spectrometric determination of burn-up and cooling time of irradiated ECH-1 fuel assemblies, Proceedings of a Symp. on Nuclear Safeguards Technology, IAEA, Vienna, 1978, v.1, p.p. 353-368.
[3] BUSHUEV, A.V., HADDAD, K.H., ZUBAREV, V.N., PORTNOV, A.A., SHUROVSKAYA, M.V., KOJIN, A.F., ALFEROV, V.P, Experimental and calculation research of heat generation field and burn-up of fuel IRT, Atomnaya-Energiya (Moscow) June 2000.
[4] INTERNATIONAL ATOMIC ENERGY AGENCY, IAEA-TECDOC-633, Determination of research reactor fuel burn-up, Vienna IAEA, 1992.
[5] HANSEN, H.H., DE-ROOST, E., VAN-DER-EIJK, W., VANINBROUKX, R., Absolute standardization of the radioactive pair 95Zr/95Nb.
[6] JEF- PC Version.2. A PC program for displaying data from the jointly evaluated file (JEF) library.
293


