Over the last three decades, policy makers of both developed and developing
nations have undertaken various measures to eradicate the barriers to the flow of
resources across national boundaries. This has significantly contributed to the
globalization of financial markets across the world. With increasing globalization,
investors are more aware of global opportunities, and the accessibility of these
markets has substantially increased. This provides considerable incentive for
investors to look for international investment opportunities. Therefore, research
into co-movements (or correlations) between equity markets is very important for
portfolio managers who wish to diversify their portfolios into other markets for
higher risk-adjusted returns. An understanding of the degree of stock market
interdependence is also very important to enable policy makers to formulate
appropriate policies to determine the flow of resources between national
boundaries.
Recently, researchers have begun to explore what economic fundamentals
determine stock market interdependence. There are limited numbers of studies on
the issue to date, and the studies which have been undertaken provide either
contradictory or inconclusive evidence. Findings from few studies suggest that
trade linkage is the most significant economic determinant of stock market
interdependence (Chen and Zhang, 1997; Bracker et al., 1999; Pretorius, 2002;
Beine et al., 2010 and Wälti, 2011). In contradiction to these evidences, other
studies argue that bilateral trade linkages between countries have no effect on their
stock market linkages (Elyasiani et al., 1998; Gupta and Guidi, 2012). Some
empirical studies also attempt to investigate the stock market long-run relationship
and direction of causality between Australia and its major trading partners. It is
important to mention that these empirical studies have also brought mixed results
(Roca, 1999; Shamsuddin and Kim, 2003; Hatemi-J and Roca, 2007; and Kazi,
2008)
The primary motivation of this study is that previous studies which examine the
degree and manner of interdependence between Australia and its trading partners
have several flaws. For instance, these studies do not empirically test the
relationship between stock market correlations and trade linkages, but conclude
that trade either is important or is not important for stock market interdependence.
These studies also largely rely on the assumption that bilateral trade relations
among the countries drive their stock market co-movements. None of these
researchers has systematically analysed the short run dynamics in a time-varying
framework of this interdependence, based on the AGDCC GARCH model. This
model has the advantage of capturing the asymmetric and asset-specific news
impact on correlations over time. In addition to these, it is also important to
understand whether increasing economic integration among the countries have any
effect on their stock market linkages. This knowledge is particularly important to
policy makers and practitioners for taking appropriate economic policies and
investment decisions, respectively. Thus, these unaddressed issues, contradictory
evidences and its significance motivate us to undertake a systematic investigation
between the stock markets of Australia and its trading partners.
This study therefore addresses this important gap in the context of Australia and its
trading partners. We aim to investigate the extent and manner of stock market
interdependence between Australia and its trading partners and examine whether
this is affected by their trade intensity. Based on trade intensity, we classify
Australia’s trade partners into major (Japan, China and the USA), medium
(Germany, Malaysia, Indonesia, Thailand and India) and minor (Sri Lanka, Greece
and Portugal)1. We examine the long-run (cointegration)2 relationship between the
stock markets of Australia and its major, medium and minor trading partners using
multivariate cointegration methodology. However, this is not the main focus of the
study and it is only for our preliminary understanding of long-run relationship
among these markets. Particularly, we estimate dynamic time-varying conditional
correlations between the stock markets of Australia and its trading partners by
employing AGDCC GARCH models. We then empirically examine the
relationship between the stock market correlations and the intensity of bilateral
trade linkages using panel regression models.
The results of this study have interesting findings. First, our preliminary results on
stock market long-run relationship show that the Australian stock market is
cointegrated only with its major trading partners. Second, the results on time-
varying correlations indicate that an average Australian stock market has higher
correlations with its major trading partners. Finally, panel regression results
display that trade intensity significantly and positively affect the correlations of
Australia with its major trading partners. Hence, the findings of this study confirm
our hypothesis that trade intensity drives stock market interdependence between
Australia and its trading partners. These findings contributes to the body of
1 Australia’s bilateral trade linkage with its partners and a detailed discussion about the classification of the markets is provided in Section 3. 2 Cointegration is a statistical tool that measures the linear relationship between two non-stationary variables (Engle and Granger, 1987). If we find a cointegration relationship between two or more variables, this implies that they share a common stochastic trend and move together in the long-run.
knowledge on stock market interdependence and trade linkages in the context of
Australia and its trading partners and also have important practical and policy
implications. Knowledge of the linkage between Australian stock market and its
trading partners would be helpful to Australian investors in their quest to find
international diversification for their portfolios. This knowledge would also
provide an indication of the contagion or spill over risks, and therefore would be
important to policymakers in formulating strategies to contain these risks.
The rest of the paper is organized as follows: Section 2 presents the theory of stock
market interdependence and intensity of bilateral trade linkage between Australia
and its trading partners. Section 3 describes the econometric methodology which is
used in this study to estimate time-varying correlations and to explore the
relationship between trade linkages and return correlations. Section 4 documents
the nature of data and preliminary statistics. Section 5 discusses the empirical
results of the study, and finally, the conclusion and contributions of the study are
presented in Section 6.
2. Literature Review
The issue of stock market integration has been of interest among academia, policy
makers and practitioners for many years due to the significant effect it has on flow
or reallocation of resources. Researchers have begun to explore whether economic
integration (bilateral trade) between the countries has any impact on their stock
market relationship. One stream of researchers argues that higher economic
integration between countries can have substantial influence on their stock market
correlations and cointegration relationships. While, othere stream of researchers
argues that economic integration has no impact on their stock market relationship.
These findings indicate either contradictory or inconclusive. We therefore provide
critical literature review on stock market interdependence and trade linkages.
Trade linkage and stock market interdependence: In general
A number of studies in the literature document that the bilateral trade linkages
between countries can have significant influence on their stock market
interdependence. For instance, the relationship between financial markets’
interdependence and bilateral trade linkages in the Pacific basin markets is
examined by Chen and Zhang (1997). Their findings show that bilateral trade
linkages between the countries have a significant influence on the stock market
correlations. Authors document that the financial markets of countries which have
stronger economic ties tend to move together. Bracker et al. (1999) report that
macroeconomic factors such as trade, stock market size differential, real interest
differential, geographic distance and time trend are significantly associated with
the degree of stock market integration over time. Another study by Pretorius
(2002) examines the determinants of stock market co-movements in ten emerging
stock markets. This study uses both cross-section and time-series models for the
empirical analysis and uses sample data from 1995 to 2000. The results of the
cross-section analysis show that only the bilateral trade and the industrial
production growth differentials are statistically significant variables for explaining
stock market correlations. This study also finds similar results for time series
analysis. A study by Johnson and Soenen (2003) shows evidence that higher trade
linkage between the Latin America and the USA has strongly contributed for their
stock market co-movement.
The direct foreign trade linkage between the countries has considerable influence
on developing cross-country linkages and markets throughout the world (Forbes
and Chinn, 2004). Chambet and Gibson (2008) investigate the relationship
between bilateral trade linkages and financial market integration. These authors
find that financial markets are more integrated among countries which have a
homogeneous trade structure. Their analysis further suggests that the increase in
openness of foreign trade between countries may positively contribute to higher
financial market integration. Further, authors argue that financial markets are more
segmented among nations which have restricted their foreign trade openness. Walti
(2005) examines the macroeconomic determinants of stock market synchronization
in fifteen industrialised countries using data from 1973 to 1997. The results of this
study show that trade, financial integration and the similarity of economic structure
can positively contribute to stock market synchronization. As other studies by
Calderon et al. (2007) and Frankel and Rose (1998) document, close trade linkages
lead to an increase in the correlation of business cycles.
The bilateral indicators of economic integration have any impact on the stock
market correlations of 40 developed and emerging markets for the period 1970-
1990 is examined by Morgado and Tavares (2007). The empirical results of this
study show that bilateral trade intensity has a significant positive effect on stock
market correlations. Similarly, Tavares (2009) finds that higher trade linkages
between countries can increase their stock market co-movements. The recent
studies by Wälti (2011) and Beine et al. (2010) argue that international trade is
considered to promote synchronization of the business cycle across countries,
which can then effect the degree of stock market interdependence.
Some other studies argue that bilateral trade linkages between countries have no
impact on the cointegration relationship of their stock markets. For example, a
recent study by Gupta and Guidi (2012) investigates the long-run relationship
between India and its major trading partners using the daily data on the closing
price indices for the period of August 31st, 1999 to June 17th, 2009. Empirical
results from the cointegration models suggest that there is no long-run relationship
between India and its major trading partners. Similarly, Elyasiani et al. (1998)
investigate the interdependence and association between Sri Lanka and its major
trading partners. Their results reveal that these stock markets are segmented rather
than being interdependent.
Trade linkage and stock market interdependence: In the context of Australia
Since last two decades researchers have begun to explore whether bilateral trade
linkages between Australia and its trading partners have any impact on the
interdependence of their stock markets. Some studies document that bilateral trade
linkage among Australia and its trading partners have significant impact on their
stock market co-dependence. For instance, Shamsuddin and Kim (2003) explore
the long-run relationship between Australia and its two major trading partners, i.e.,
Japan and the USA, using weekly data. The empirical results of this study show
that there was a long-run relationship between these markets up until the time of
the Asian financial crisis. However, results suggest that following the crisis, there
was no evidence of a cointegration relationship among these markets. Another
study by Kazi (2008) investigates the long-run relationship between the stock
markets of Australia and its major trading partners (the UK, the USA, Japan,
Canada, Germany and France) using annual data from 1945 to 2002. The evidence
from this study confirms the long-run relationship between Australia and its major
trading partners.
However, some other studies find contradictory results. For example, a study by
Roca (1999) explores the price linkages between the equity market of Australia
and its major trading partners (the USA, the UK, Japan, Hong Kong, Singapore,
Taiwan and Korea). This study uses weekly data from December 27th 1974 to
December 8th 1995, and the findings show no evidence of a long-run relationship
between Australia and its trading partners. Similarly, Hatemi-J and Roca (2007)
investigate the equity market interactions between Australia and its major trading
partners (Japan, the USA, the UK, Hong Kong, Singapore Taiwan and Korea). The
authors employ a bootstrap causality test with leveraged adjustments to explore the
causal relationship between Australia and its trading partners. The findings of this
study show no significant long-term causal linkages in the pre- and post-crisis
periods of Asia. Further, results show low correlations between Australia and its
trading partners. Based on these results, the authors suggest that Australian
investors can benefit by diversifying their portfolios into these markets.
Our review of the existing literature on stock market interdependence in the
context of Australia and its trading partners reveal that these studies also brought
mixed results as the general literature. Further, studies on Australia and its trading
partners have several weaknesses. For instance, the previous studies relied on the
assumption that trade linkages among the countries drive their stock market co-
dependence. These studies have not demonstrated the time-varying conditional
correlations between the stock markets of Australia and its trading partners. These
studies also not empirically tested the relationship between bilateral trade linkage
and stock market correlations. Therefore, these unaddressed issues and
contradictory results motivate us to undertake a systematic investigation in the
context of Australia and its trading partners.
Bilateral trade
A number of studies in the literature argue that international trade is believed to
foster business cycle synchronization across the countries, and therefore affect the
level of their stock market interdependence (Wälti, 2011; and Beine et al., 2010). A
study by Wälti (2011) provides an interesting argument that the effect of bilateral
trade operates through both the demand and supply side of economies. On the
demand side, an increase in aggregate demand of country X will lead to more
imports from country Y, thus increasing the output of country Y, which induces
business cycle synchronization across the countries. On the supply side, the author
argues that the influence of international trade may be ambiguous, as it depends on
the nature of the various countries and their industrial structures. Another study by
Pretorius (2002) argues that through the exports and imports of goods and services
between two countries can have significant influence on their stock market co-
movements.
In this study, we measure the intensity of bilateral trade linkage between Australia
and its trading partners using the following approach:
titi
tijtijtij MX
MXZ
,,
,,, +
+= (1)
Where ijZ indicates the intensity of bilateral trade linkage of country i with
country j and t is the time period, ijX indicates total exports from country i to
country j while ijM shows total imports of country i from country j and ii MX +
denotes total exports and imports of country i .
Intensity of trade linkage between Australia and its trading partners
Table 1 provides the percentage of Australia’s bilateral trade (exports and imports)
linkage with its trading partners for the period of 1993 to 2013. We classified
Australia’s trade partners into major, medium and minor, based on the intensity of
their trade linkages 3 . The table shows that among the major trading partners,
Australia’s trade linkage is increasing only with China, while with Japan and the
USA, it is declining. It is noteworthy to mention that Australia’s trade relationship
with China has significantly increased from 4.2% in 1993 to 28.15% by 2013. In
contradiction to this, its trade association with the USA is rapidly declining from
year to year. Similarly, in the case of medium trading partners, Australia’s trade
association with Germany and Indonesia it is slightly decreasing, while with
Malaysia, Thailand and India it is increasing over time. Australia’s trade relations
with its minor trading partners are marginally changing over the period. From this
table, we can observe that Australia’s trade relations with China have significantly
increased from the time of the GFC onwards, that is, particularly from 2008.
Further, this table shows that in the year 2013, Australia shares 48% of its total
trade only with its three major trading partners. This indicates that how strongly
these economies are interdependent.
3 To classify Australia’s major, medium and minor trading partners, we use Australia’s average bilateral trade with its trading partners from 1993 to 2013. The countries that have an average bilateral trade of 15% to 11%, 4% to 2% and 0.12% to 0.07% are considered to be Australia’s major, medium and minor trading partners, respectively. The rationale for selecting these ranges is to show significant distance in terms of trade intensity among these groups. Bangladesh falls under the category of minor trading partners; however we have excluded this country from our analysis due to unavailability of stock price data for the given sample period.
[Insert Table 1 Here]
3. Methodology
The aim of this study is to examine the extent and manner of stock market
interdependence between Australia and its trading partners and examine whether
this is affected by trade intensity. For our preliminary understanding of stock
market linkage, we explore the long-run relationship between Australia and its
major, medium and minor trading partners, using the multivariate cointegration
methodology4 . As shown in Figure 1, we first estimate time-varying dynamic
conditional correlations between these markets using the AGDCC GARCH
approach. Finally, in order to investigate whether trade intensity is significantly
affecting stock market correlations, we employ panel regression models.
[Insert Fig.1 Here]
Asymmetric Generalized DCC GARCH Model
To examine the time dynamics in the correlations of pairwise stock returns
(Australia and each of its trading partners) we use the asymmetric generalized
dynamic conditional correlation (AGDCC) GARCH model. The results of this
model will convey whether stock markets are becoming more or less
interdependent over time. The higher the correlations between the markets, then
the lower will be the diversification opportunities for investors and vice versa. This
methodology was initiated by Engle (2002), who was the first author to introduce a
new class of M-GARCH model, which is known as DCC-GARCH. This is an
important model for measuring the time dynamics in correlations. However, to
4 First we apply two unit root tests such as ADF (Dickey and Fuller, 1979) and PP (Phillips and Perron, 1988) to confirm that all the variables are integrated of order I (1) and then we apply Johansen (1991, 1995) multivariate cointegration test on the stock prices of Australia and its major, medium and minor trading partner markets to explore the long-run relationship.
allow for series-specific news impact and conditional asymmetries in correlations,
we use the modified version of the DCC model i.e. the AGDCC GARCH of
Cappiello et al. (2006)5. This AGDCC GARCH model is also a better model for
capturing the heterogeneity that is present in the data series. This model can be
Where Q is the correlation matrix; BA, and G are k x k parameter matrices,
and ttt oIn εε ]0[ <= , [.](I is a k x 1 indicator function which takes the value of 1
if the argument is true and otherwise 0, while ""o indicating Hadamard product),
][ tt nnEN ′= . If the matrices of BA, and G are replaced by scalars, then
asymmetric DCC model can be obtained as a special case of the AGDCC model. In
the same way, if matrix 0=G , then generalized DCC is a special case of AGDCC.
The expectations are infeasible for P and N are replaced with sample analogues,
tT
t tT εε ′∑ =−
11 and t
T
t t nnT ′∑ =−
11 , respectively.
Panel regression model
To empirically examine the relationship between bilateral trade linkages and stock
market correlations of Australia and its major, medium and minor trading partners,
we utilize panel regression models. For this purpose, we use the conditional
correlations of the stock returns of Australia and its trading partners as the
dependent variable, and the bilateral trade intensity as an independent variable.
More specifically, we construct panel data for Australia’s major, medium and
5 There are also other models for estimating time-varying correlations between the stock market returns such as; DCC, ADCC, GDCC and etc., however, this model has advantage over other models, particularly to incorporate both asset-specific news impact and asymmetries in the correlations which other models do not.
minor trading partners separately. This is to identify whether higher trade intensity
is significant for stock market interdependence. Further, in the analysis we also use
two control variables which are exchange rates (local currency against the
Australian dollar) and inflation differentials (calculated based on CPI) and two
dummy (1 fro crisis and otherwise 0) variables to represent the AFC (Asian
financial crisis) and GFC (global financial crisis). The panel regression model is
where Corr is the conditional correlations of the pairwise stock market returns; C
is the constant variable; 54321 &,,, βββββ are the coefficients of the respective
variables; BTI is the bilateral trade intensity; ER is the exchange rates; ID is the
inflation differential; the AFC and GFC are the dummy variables for identifying
the impact of the crises on the stock market correlations; υ is the error term; and
finally i and t represent cross-section and time period, respectively.
Hypothesis
Based on the review of the theoretical and empirical literature that we have
conducted, the majority of the studies indicate that trade linkage significantly
affects stock market linkages. Hence, we hypothesise that markets with greater
(lower) trade intensity will be more (less) interdependent with Australia. In this
regard, we expect that Australia would be cointegrated and highly correlated with
its major trading partners and that trade intensity would have a statistically
significant impact on the correlations between Australia and its major trading
partners.
4. Data and preliminary analysis
Data
To investigate the long-run equilibrium relationship and dynamic time-varying
conditional correlations we use weekly (Wednesday)6 closing price data on MSCI
indices for Australia, Japan, China, the USA, Germany, Malaysia, Indonesia,
Thailand, India, Sri Lanka, Greece and Portugal for the period from January 6th,
1993 to April 23rd, 20147. The selected indices for this study are denominated in
local currency8 to avoid the problems associated with exchange rate fluctuations.
There are also several other advantages to use data in local currency instead of a
common currency. For instance, Mink (2010) argues that stock price data in the
local currency can truly reflect the supply and demand forces that are present in
that national stock market. Further, the author suggests that by converting data into
a common currency (e.g. the Australian dollar) we may miss out on the true picture
of the stock market dynamics, and hence it would be inappropriate to do this. In
addition, when stock returns are converted into a common currency. The results are
significantly driven by exchange rate fluctuations which then contribute to biased
results.
6 We select week day as a Wednesday to avoid beginning of the week effect and end of the week affect on stock prices. 7 Weekly data causes fewer problems because of the non-synchronous trading and short-term correlations due to noise. Therefore, in this study we use weekly closing price data for the empirical analysis. The selection of the sample size is based on the availability of data. 8 Several studies in the literature use local currency denominated stock price indices for measuring stock market integration and to investigate the affect of economic integration on the stock market interdependence, e.g. Bracker, et al. (1999), Phylaktis and Ravazzolo (2002) and etc.
Similarly, Mierau and Mink (2013) argue a practical possibility that when two
non-synchronous stock returns are changed into a common currency, and if both
currencies at the same time appreciate or depreciate against this common currency,
this will then indicate that the stock returns are seem to be synchronous, while in
reality they are not. Therefore, authors suggest that to avoid these problems, it
would be a good idea to use the returns in local currency to focus on correlations
across the markets, rather than across currencies. The data on above indices are
collected from DataStream. For our empirical analysis all the indices data are
converted into natural logarithms.
To investigate whether the intensity of bilateral trade linkages matters for stock
market interdependence, we constructed panel data for Australia’s major, medium
and minor trading partners separately which will suggest whether higher trade
linkage between countries has an effect on their stock market correlations. For this
purpose, we use quarterly data from the 1st quarter of 1993 to the 4th quarter of
2013 on the following variables: the pairwise stock return correlations that is
Australia and each of the trading partners (weekly average of the last month of
each quarter), the intensity of bilateral trade, exchange rates (local currency against
the Australian dollar), inflation (based on the consumer price index, CPI)
differentials9 and two dummy variables that are representative of the AFC and the
GFC 10 . The bilateral trade data are collected from the Australian Bureau of
9 The last month of each quarter data is used for intensity of bilateral trade, exchange rates and inflation differentials in the analysis. To avoid model misspecification, we have used exchange rates and inflation differential variables as the control variables in the models. 10 The AFC period is considered to be from the 4th quarter of 1997 to the 4th quarter of 1998 while the GFC period is considered to be from the 4th quarter of 2007 to the 1st quarter of 2009. The selection of the crises periods is based on the closing stock price index movements. For instance, we consider the start of the crisis period to occur when the majority of the indices start declining and we treat the end of crisis period as being when the majority of the indices starting rising.
Statistics (ABS), while data on exchange rates and inflation differentials are
obtained from the International Financial Statistics (IFS)11. Before the application
of the panel regression econometric model, only the exchange rate data is
converted into natural logarithms and all other variables are in their original
form12.
Preliminary statistics
Table 2 reports the summary statistics of the weekly stock index returns of
Australia and its trading partners13. This table shows that all the indices have
positive mean returns except for those of Japan, China and Greece14. The highest
mean returns were acquired by Indonesia (0.240) and India (0.200). Among all the
markets, China (0.375), Malaysia (0.274), Thailand (0.259), Sri Lanka (0.249) and
Indonesia (0.221) have the maximum mean returns. The minimum mean returns
indicate that all the markets have gone through negative returns. The standard
deviation is higher for China (0.048), Thailand (0.045), Greece (0.044), Indonesia
(0.043) and Sri Lanka (0.040) while the lowest standard deviation is exhibited by
Australia (0.021), the USA (0.023), Portugal (0.027) and Japan (0.029). Thus, the
former group of markets are more volatile while the latter are less risky. Further,
our analysis indicates that all of the markets display negative skewness with the
exception of China, Malaysia, Thailand and Sri Lanka, and have higher kurtosis
values. The results of the Jarque-Bera test for normality show that the null
11 We collected exchange rates data on local currency against the US dollar from IFS, and then we converted these data into local currency against the Australian dollar, since our focus is on Australia and its trading partners. 12 Since correlations and inflation differentials are in percentages, while the intensity of bilateral trade is in proportion to total trade, therefore we have not converted these variables into natural logarithms. 13 Returns are calculated using natural log of continuously compounded rates of returns for all the indices. 14 Mean returns are multiplied by 100.
hypothesis of normal distribution is rejected at a 5% significance level for all the
indices, which indicates that the return series are not normally distributed15.
[Insert Table 2 Here]
Table 3 presents the results of unit root (ADF and PP) tests. The results of ADF
and PP tests suggest that the null hypothesis of unit root is not rejected for the log
prices at levels. We then apply unit root tests on the log first differences and the
null hypothesis of a non-stationarity is rejected at 5% significance levels for all the
indices. This therefore indicates that all the indices have the same order of
integration, i.e., I (1). Hence, these results suggest that there may be a long-run
relationship between Australia and its trading partners.
[Insert Table 3 Here]
Analysis of long-run equilibrium relationship between the stock markets
We test the cointegration or long-run equilibrium relationship between the stock
markets of Australia and its major, medium and minor trading partners using the
natural log of weekly closing price indices data. The long-run relationship between
these markets is explored by employing Johansen multivariate cointegration
approach and the results of this test are presented in table 4. The cointegration test
results demonstrate that the Australian stock market is cointegrated only with its
major trading partners16. Hence, these results indicate that the higher bilateral trade
linkage between the countries may have played an important role for their stock
market long-run equilibrium relationship. However, in the following section, we
empirically confirm whether higher bilateral linkage has any impact on stock
15 This indicates that GARCH-based models, such as the AGDCC model can estimate better correlations between two market returns than conventional correlation models. 16 We have added the USA index as a control market to the medium and minor trading partner groups, however there is no change in the results.
market correlations using panel regression models. Based on these results we
accept the hypothesis that higher trade linkages among the countries lead to their
stock market long-run relationship. Our cointegration test results are similar to
those of Kazi (2008); Shamsuddin and Kim (2003) who found a long-run
relationship between Australia and its major trading partners. Although, our
approach is significantly different from these previous studies, for example, we
have used more than 20 years data and we have classified markets into major,
medium and minor based on the intensity of trade linkage with Australia.
Therefore, our study results are more robust than previous studies.
[Insert Table 4 Here]
5. Empirical results
In this section, we provide the empirical results of the study. First, we examine the
degree of interdependence between the stock markets of Australia and its major,
medium and minor trading partners using correlation analyses based on
unconditional and conditional models (using AGDCC GARCH models). We then
investigate the impact of bilateral trade intensity on the stock market correlations
of Australia and its trading partners by employing panel regression models. The
empirical results of these models are presented and discussed in the following sub-
sections.
Overview of stock market linkage between Australia and its trading partners based
on unconditional correlations
We first provide an overview of the stock market linkage between Australia and its
trading partners using the natural log of continuously compounded rates of returns.
Table 5 presents unconditional correlations, which indicate that Australian stock
market has higher correlations (0.519) with its major trading partners and has
lower correlations (0.326) with its minor trading partners, as a group. This suggests
that higher trade intensity leads to higher stock market correlations. Similarly, we
also provide pairwise unconditional correlations. These results demonstrate that the
Australian stock market has higher correlations with Germany (0.59), the USA
(0.58) and Japan (0.541) and has lower correlation with Sri Lanka (0.123). These
unconditional correlation results suggest that the Australian stock market, largely,
has higher correlations with its major trading partners and has lower correlations
with minor trading partners. We further investigate the significance of these
unconditional correlations and found that all the correlations are statistically
significant at 1% level. Given the limitations of unconditional correlations, we
undertake further rigorous analysis. In this regard, we conduct cointegration and
DCC analyses between the stock markets of Australia and its trading partners. The
results of these models are presented in the following section.
[Insert Table 5 Here]
Stock market linkages based on conditional correlations
The dynamic time-varying interdependence between the stock markets of Australia
and its trading partners is explored using conditional correlation models. We
applied AGDCC GARCH model, based on Cappiello et al. (2006), which uses a
two-step estimation procedure. As shown in the descriptive statistics, the data is
characterised by non-normalities and hence, the use of a GARCH-based model
would be advantageous. This AGDCC model stands out from all other DCC
models as being a robust model to capture time dynamics in the return correlations,
as it incorporates the asset-specific news and asymmetries in the analysis. The
purpose of measuring the time-varying correlations is to understand the degree of
linkage between the stock markets of Australia and its trading partners over time.
Further, with this analysis we can identify the impact of Asian and global financial
crises on stock market correlations. This is also an important issue to research
because it has not been addressed in the previous studies which have explored the
stock market linkage between Australia and its trading partners.
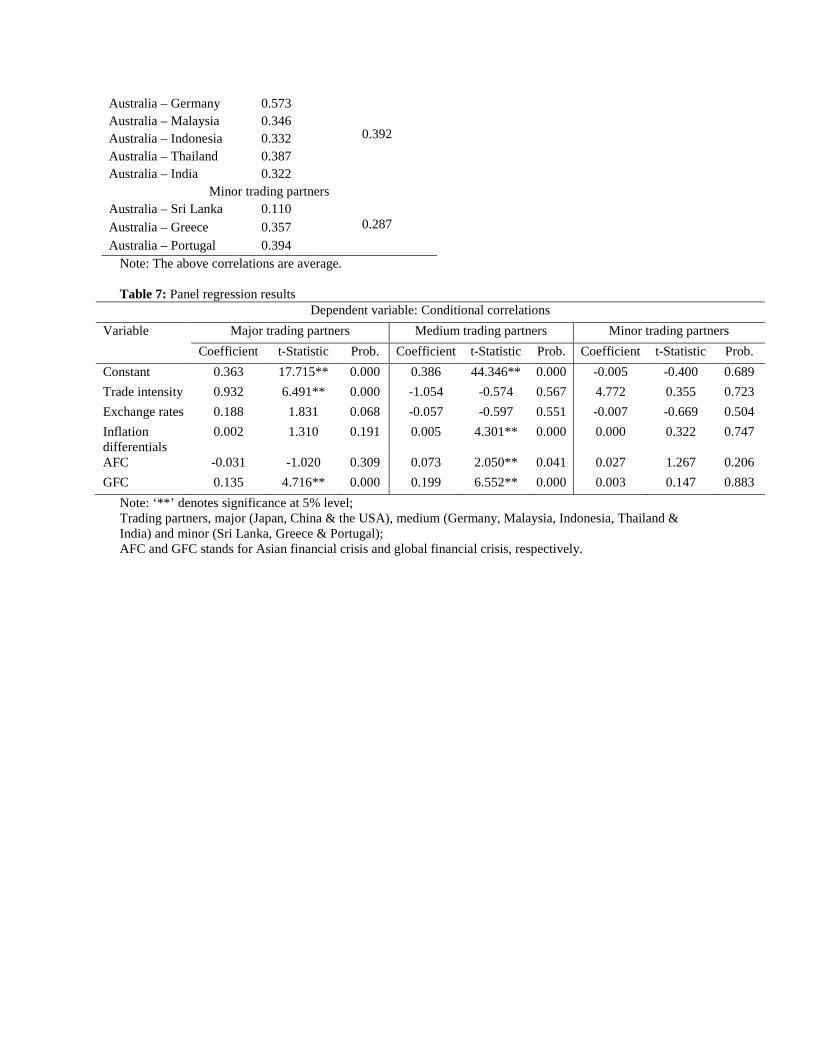
Table 6 reports the conditional correlations of the Australian stock market with its
major, medium and minor trading partners. These correlations confirm that
Australia has higher correlations (0.494) with its major trading partners (as a
group) and has lower correlations (0.287) with its minor trading partners (as a
group). We also present Australia’s average conditional correlations with each of
its trading partners. This indicates that, on average, Australia has higher
correlations with Germany (0.573), the USA (0.549), Japan (0.498) and China
(0.437) while its lowest correlation is with Sri Lanka (0.110).
Further, in Figure 2 we present Australia’s time-varying conditional correlations
with each of its trading partners. These graphs show that Australian stock market
correlations with all of its trading partners are time-varying and are mostly
increasing over time period with the exception of Germany, Sri Lanka and
Portugal, where correlations are almost stagnant. These correlations also indicate
that the impact of the AFC on stock market correlations is almost negligible.
However, the recent GFC has had a significant influence on stock market
correlations, with the exception of that of Sri Lanka. This has resulted in higher
stock market interdependence during the period of the GFC. Our analysis further
suggests that, following the GFC, correlations between the Australian stock market
and its trading partners have substantially declined. However, in most cases
correlations are still higher than during the pre-GFC period. These pairwise
conditional correlations give an indication that the Australian stock market
correlations with its trading partners may have been driven by their bilateral trade
linkages, as the results show that, on the whole, Australia has higher correlations
with its major trading partners. Hence, we accept the hypothesis that higher trade
linkages lead to higher stock market interdependence. However, to confirm this
empirically, we test this hypothesis using the panel regression models, and the
results are presented in the next section.
[Insert Table 6 Here]
[Insert Figure 2 Here]
The empirical relationship between bilateral trade and stock market correlations
The aim of this section is to empirically investigate the relationship between the
intensity of bilateral trade linkages and stock market correlations of Australia and
its trading partners using panel regression models. To avoid model
misspecification, we use two control variables in the analysis, and these are
exchange rates and inflation differentials. In order to identify the impact of the
financial crises on stock market correlations we have used two dummy variables
that represent the AFC and the GFC. The panel regression analysis is carried out
separately for major, medium and minor trading partners. The empirical results of
these panel regression models are reported in Table 717.
[Insert Table 7 Here]
17 In the panel regression analyses all the variables are stationary and have no multicollinearity problem.
As the panel regression results show, the intensity of the bilateral trade linkages
between Australia and its major trading partners has significant influence on their
stock market correlations. These results indicate that if one unit of bilateral trade
linkage increases between Australia and its major trading partners, then their stock
market correlations will increase by about 93% of it. Further, our analysis shows
that the GFC also has substantial impact on the correlations of Australia and its
major trading partner markets. The panel regression results of medium trading
partners show that the intensity of bilateral trade linkages has no effect on their
stock market correlations. However, the results show that both the AFC and the
GFC have significant influence on these stock market correlations. In the case of
minor trading partners, none of the variables is statistically significant.
stock market interdependence between Australia and its trading partners. Our study
results are similar to those of Chen and Zhang (1997); Pretorius (2002); Forbes and
Chinn (2004); Chambet and Gibson (2008); and Tavares (2009) who argue that
bilateral trade linkages between countries can significantly increase their stock
market interdependence. However, our study is different from previous studies as
we argue that having modest or weak trade linkages (our classification of markets
into major, medium and minor) between countries has no effect on their stock
market correlations.
6. Conclusion
The issue of stock market integration has been of interest among the policy
makers, practitioners and academia for many years due to the effect it has on the
flow of resources. There are several studies examined the stock market integration.
Although, only few studies explored what economic fundamentals determine stock
market linkages. Evidence from these studies is either contradictory or
inconclusive. For instance, some studies argue that trade linkage is the most
significant economic determinant of stock market co-movements; while other
studies document that trade relations have no effect on stock market linkages. In
the context of Australia and its trading partners also we found mixed results.
This therefore motivates us to systematically investigate the extent and manner of
co-movement or interdependence between the stock markets of Australia and its
trading partners by taking into account the intensity of their trade linkages. We
hypothesise that markets with greater (lower) trade intensity will be more (less)
interdependent with Australia. For our preliminary understanding of the market
linkage, we first examine the long-run relationship between the stock markets of
Australia and its major, medium and minor trading partners. We then explore the
time-varying conditional correlations between these markets. Finally, we
empirically investigate the relationship between trade intensity and stock market
correlations, and also address the impact of the Asian and global financial crises on
these correlations.
The results on our preliminary analysis of long-run relationship show that the
Australian stock market is cointegrated only with its major trading partners. This
result confirms our expectation that strong bilateral trade linkages are important for
the long-run relationship between the stock markets of trade partners. Our primary
results from the dynamic conditional correlations of the AGDCC GARCH model
show that the correlations between the Australian stock market and its trading
partners are time-varying and increasing, in most cases, over the time period. This
analysis also shows that correlations have significantly declined in the post GFC.
The results of panel regression models suggest that there is a significant
relationship between trade intensity and the stock market correlations of Australia
and its major trading partners. These findings indicate that higher bilateral trade
linkages lead to higher stock market co-movements. In addition, our findings
reveal that the GFC has had a significant impact on the correlations of Australia
with its major and medium trading partners. The impact of the AFC on stock
market correlations is limited to medium trading partners. This might be due to the
fact that among the five medium trading partners, four are from Asia.
Our empirical results suggest that strong economic integration between countries
can have considerable influence on their stock market correlations and
cointegration relationships, particularly in the context of Australia and its trading
partners. Our results are similar to those of Chen and Zhang (1997), Pretorius
(2002), Forbes and Chinn (2004), Tavares (2009), Beine et al. (2010) and Wälti
(2011) who document that higher trade linkages lead to higher stock market
interdependence.
In spite of that, our study is significantly different from previous studies as we
adopted different approaches. For example, 1) the previous studies concluded that
trading partners have higher stock market interdependence but have not clearly
distinguished trading partners such as; major, medium and minor. This study
addresses this gap by classifying markets into major, medium and minor based on
the intensity of their trade linkage. 2) The previous studies have not used the
AGDCC GARCH model to measure time-varying correlations, and we find that
this is a robust model for estimating correlations as it incorporates asymmetries
and asset-specific news impact on the correlations. 3) Further, in this study we use
a large data set which covers more than 20 years, which significantly improve the
reliability of the results. Given the advantages of our study, these results make
important contributions to the body of knowledge and are also valuable for policy
makers and portfolio managers. From the standpoint of policy makers, these results
give a good understanding of trade linkage and stock market interdependence. The
understanding of return correlations among the markets is important for portfolio
managers when making appropriate decisions about diversification of their
portfolios into other markets for higher risk-adjusted returns.
References
Beine M., Cosma A. and Vermeulen R. (2010) The dark side of global integration: Increasing tail dependence, Journal of Banking & Finance, 34, 184-192.
Bracker K., Docking D.S. and Koch P.D. (1999) Economic determinants of evolution in international stock market integration, Journal of Empirical Finance, 6, 1-27.
Calderon C., Chong A. and Stein E. (2007) Trade intensity and business cycle synchronization: Are developing countries any different?, Journal of International Economics, 71, 2-21.
Cappiello L., Engle R.F. and Sheppard K. (2006) Asymmetric dynamics in the correlations of global equity and bond returns, Journal of Financial econometrics, 4, 537-572.
Chambet A. and Gibson R. (2008) Financial integration, economic instability and trade structure in emerging markets, Journal of International Money and Finance, 27, 654-675.
Chen N-f. and Zhang F. (1997) Correlations, trades and stock returns of the Pacific-Basin markets, Pacific-Basin Finance Journal, 5, 559-577.
Dickey D.A. and Fuller W.A. (1979) Distribution of the estimators for autoregressive time series with a unit root, Journal of the American statistical association, 74, 427-431.
Elyasiani E., Perera P. and Puri T.N. (1998) Interdependence and dynamic linkages between stock markets of Sri Lanka and its trading partners, Journal of Multinational Financial Management, 8, 89-101.
Engle R. (2002) Dynamic conditional correlation: A simple class of multivariate generalized autoregressive conditional heteroskedasticity models, Journal of Business & Economic Statistics, 20, 339-350.
Engle R.F. and Granger C.W. (1987) Co-integration and error correction: representation, estimation, and testing, Econometrica,55, 251-276.
Forbes K.J. and Chinn M.D. (2004) A decomposition of global linkages in financial markets over time, Review of Economics and Statistics, 86, 705-722.
Forbes K.J. and Rigobon, R. (2002) No contagion, only interdependence: Measureing stock market comovements, The Journal of Finance, 57, 2223-2261.
Frankel J.A. and Rose A.K. (1998) The endogenity of the optimum currency area criteria, The Economic Journal, 108, 1009-1025.
Gupta R. and Guidi F. (2012) Cointegration relationship and time varying co-movements among Indian and Asian developed stock markets, International Review of Financial Analysis, 21, 10-22.
Hatemi-J A. and Roca E.D. (2007) Equity market price interdependence based on bootstrap causality tests: evidence from Australia and its major trading partners, Applied Financial Economics, 17, 827-835.
Johansen S. (1991) Estimation and hypothesis testing of cointegration vectors in Gaussian vector autoregressive models, Econometrica, 59, 1551-1580.
Johansen S. (1995) Likelihood-based inference in cointegrated vector autoregressive models, New York.
Johnson R. and Soenen L. (2003) Economic integration and stock market comovement in the Americas, Journal of Multinational Financial Management, 13, 85-100.
Kazi M.H. (2008) Is Australian stock market integrated to the equity markets of its major trading partners?, International Review of Business Research Papers, 4, 247-257.
Lin, C.H. and Cheng, W.H. (2008) Economic determinants of co-movement across international stock markets: the example of Taiwan and its key trading partners, Applied Economics, 40, 1187-1205.
Mierau J.O. and Mink M. (2013) Are stock market crises contagious? The role of crisis definitions, Journal of Banking & Finance, 37, 4765-4776.
Mink M. (2010) Is Contagion in the Eye of the Beholder?: De Nederlandsche Bank.
Morgado P. and Tavares J. (2007) Economic Integration and the Co-movement of Stock Returns. CEPR Discussion Papers.
Phillips P.C. and Perron P. (1988) Testing for a unit root in time series regression, Biometrika, 75, 335-346.
Phylaktis K. and Ravazzolo F. (2002) Measuring financial and economic integration with equity prices in emerging markets, Journal of International Money and Finance, 21, 879-904.
Pretorius E. (2002) Economic determinants of emerging stock market interdependence, Emerging Markets Review, 3, 84-105.
Roca E.D. (1999) Short-term and long-term price linkages between the equity markets of Australia and its major trading partners, Applied Financial Economics, 9, 501-511.
Shamsuddin A.F. and Kim J.H. (2003) Integration and interdependence of stock and foreign exchange markets: an Australian perspective, Journal of International Financial Markets, Institutions and Money, 13, 237-254.
Tavares J. (2009) Economic integration and the comovement of stock returns, Economics Letters, 103, 65-67.
Walti S. (2005) The macroeconomic determinants of stock market synchronization, Journal of International Banking Law, 11, 436-441.
Wälti S. (2011) Stock market synchronization and monetary integration, Journal of International Money and Finance, 30, 96-110.
Fig.1: Structure of methodology Stock market interdependence Bilateral trade partners
Note: The summary statistics are calculated using log returns. The mean returns are multiplied with 100. ‘**’ denotes the rejection of null hypothesis of normal distribution at 5% significance level. Table 3: Unit root tests results Markets
Minor trading partners Sri Lanka -1.821 0.694 -28.681** 0.000 -1.975 0.614 -28.991** 0.000 Greece -1.335 0.878 -32.568** 0.000 -1.455 0.844 -32.817** 0.000 Portugal -2.215 0.480 -34.339** 0.000 -2.271 0.449 -34.516** 0.000 Note: All the unit root tests regression models are estimating using constant and trend variables. ‘**’ denotes rejection of null hypothesis of unit root (non-stationary) at 5% significance level. Table 4: Multivariate cointegration test results Hypothesized Trace 5% Max-Eigen 5% No. of CE(s) Statistic Critical Value Prob. Statistic Critical Value Prob.
Major trading partners (Japan, China & the USA)
None 40.517** 40.175 0.046 27.373** 24.159 0.018 At most 1 13.144 24.276 0.609 9.191 17.797 0.573 At most 2 3.953 12.321 0.718 3.825 11.225 0.656 At most 3 0.128 4.130 0.769 0.128 4.130 0.769
Medium trading partners (Germany, Malaysia, Indonesia, Thailand & India) None 90.430 95.754 0.110 36.908 40.078 0.109 At most 1 53.522 69.819 0.482 22.628 33.877 0.559 At most 2 30.894 47.856 0.672 14.197 27.584 0.809 At most 3 16.697 29.797 0.662 9.435 21.132 0.796 At most 4 7.261 15.495 0.548 5.358 14.265 0.696 At most 5 1.903 3.841 0.168 1.903 3.841 0.168
Minor trading partners (Sri Lanka, Greece & Portugal) None 34.692 47.856 0.464 20.581 27.584 0.302 At most 1 14.111 29.797 0.834 9.749 21.132 0.768 At most 2 4.362 15.495 0.872 4.099 14.265 0.849 At most 3 0.263 3.841 0.608 0.263 3.841 0.608 Note: ‘**’ denotes rejection of null hypothesis of no cointegration at 5% significance level. Table 5: Unconditional correlations
Markets Correlations t-test Prob. Group correlations Major trading partners
Australia – Japan 0.541 21.415*** 0.000 0.519 Australia – China 0.437 16.175*** 0.000
Australia – USA 0.580 23.735*** 0.000 Medium trading partners
Australia – Germany 0.591 24.423*** 0.000
0.412 Australia – Malaysia 0.333 11.760*** 0.000 Australia – Indonesia 0.365 13.041*** 0.000 Australia – Thailand 0.402 14.641*** 0.000 Australia – India 0.368 13.189*** 0.000
Minor trading partners Australia – Sri Lanka 0.123 4.115*** 0.000
0.326 Australia – Greece 0.418 15.301*** 0.000 Australia – Portugal 0.438 16.120*** 0.000
Note: unconditional correlations are estimated using log returns. Table 6: Time-varying conditional correlations (AGDCC)
Markets Correlations Group correlations Major trading partners
Australia – Japan 0.498 0.494 Australia – China 0.437
Australia – USA 0.549 Medium trading partners
Australia – Germany 0.573
0.392 Australia – Malaysia 0.346 Australia – Indonesia 0.332 Australia – Thailand 0.387 Australia – India 0.322
Minor trading partners Australia – Sri Lanka 0.110
0.287 Australia – Greece 0.357 Australia – Portugal 0.394
Note: The above correlations are average. Table 7: Panel regression results
Dependent variable: Conditional correlations Variable Major trading partners Medium trading partners Minor trading partners
Note: ‘**’ denotes significance at 5% level; Trading partners, major (Japan, China & the USA), medium (Germany, Malaysia, Indonesia, Thailand & India) and minor (Sri Lanka, Greece & Portugal); AFC and GFC stands for Asian financial crisis and global financial crisis, respectively.