Strategic Analysis of an Electricity Deficit in British Columbia by Adam Brooks B.A.Sc., University of British Columbia, 2003 Project Submitted in Partial Fulfillment of the Requirements for the Degree of Master of Business Administration in the Executive MBA of the Faculty of Business Administration Adam Brooks 2015 SIMON FRASER UNIVERSITY Summer 2015
Transcript
Strategic Analysis of an Electricity Deficit in
British Columbia
by
Adam Brooks
B.A.Sc., University of British Columbia, 2003
Project Submitted in Partial Fulfillment of the
Requirements for the Degree of
Master of Business Administration
in the Executive MBA
of the
Faculty of Business Administration
Adam Brooks 2015
SIMON FRASER UNIVERSITY
Summer 2015
ii
Approval
Name: Adam Brooks
Degree: Master of Business Administration
Title of Project: Strategic Analysis of an Electricity Deficit in British
Columbia
Supervisory Committee:
______________________________________
Dr. Michael Parent, Professor
Senior Supervisor
Professor of Management Information Systems and
Marketing Faculty of Business Administration
______________________________________
Dr. Leyland Pitt, Professor
Second Reader
Professor, Marketing and Dennis F. Culver EMBA
Alumni Chair of Business Faculty of Business
Administration
Date Approved: June 18th, 2015
iii
Partial Copyright Licence
iv
Abstract
The British Columbia (BC) Government introduced the Clean Energy Act in 2010. With
the new legislation, BC Hydro has been mandated to be electricity self-sufficient by 2016.
BC Hydro may not have enough generation capacity to meet the regulatory requirement
in time. This project explores three potential options for Teck’s Zinc Smelter to provide
made-in-BC generation capacity to BC Hydro. After evaluating the options, this author
recommends for Teck to make an offer to swap BC Hydro’s imports with Teck’s made-in-
BC generation.
v
Dedication
For my family – Janet, Simon, Oliver, and Esme
vi
Acknowledgements
Thank you to my cohort and instructors for a rewarding experience.
vii
Table of Contents
Approval .......................................................................................................................... ii Partial Copyright Licence ............................................................................................... iii Abstract .......................................................................................................................... iv Dedication ....................................................................................................................... v Acknowledgements ........................................................................................................ vi Table of Contents .......................................................................................................... vii List of Tables .................................................................................................................. ix List of Figures.................................................................................................................. x List of Acronyms ............................................................................................................. xi Glossary ........................................................................................................................ xii Executive Summary ......................................................................................................xiv
2.5. Industry Dynamics .................................................................................................. 7 2.5.1. Porter’s Five Force Analysis ...................................................................... 7
The Threat of Entry .................................................................................................. 8 The Power of Suppliers ............................................................................................ 8 The Power of Buyers................................................................................................ 9 The Threat of Substitutes ......................................................................................... 9 Rivalry Among Existing Competitors........................................................................ 9
2.5.2. Factors Affecting Porter’s Five Forces (Macro Analysis) .......................... 10 Technology and Innovation .................................................................................... 10 Government and Stakeholders .............................................................................. 10 Complements ......................................................................................................... 11 Cannibalization ....................................................................................................... 11
2.5.3. Long Run Assessment ............................................................................. 11 2.6. Gap Analysis ........................................................................................................ 12
2.6.1. Integrated Resources Plan ...................................................................... 12 2.6.2. Willingness to Pay ................................................................................... 13 2.6.3. Industry Valuation .................................................................................... 14
2.7. Summary of Opportunity in the Industry ................................................................ 14
Very large industrial electrical load ........................................................................ 22 Capability to ramp up/down a large portion of load quickly ................................... 23 Zinc and co-products available in the market ........................................................ 23 Own hydroelectric generation in BC ...................................................................... 24 Own transmission links to BC and US utilities ....................................................... 24 Zinc Smelter operates at full capacity .................................................................... 25 Not a direct customer of a public utility .................................................................. 25
3.4. Summary of Strengths and Weaknesses of Firm in the Industry ........................... 26 3.5. Opportunity Statement .......................................................................................... 27
4.1.1. Alternative 1: Offer Surplus Generation Up to 10 MW ............................. 29 4.1.2. Alternative 2: Offer Curtailable Load Up to 32 MW .................................. 30
Trail’s Curtailment Price Model .............................................................................. 30 Expected Value of Load Curtailment ..................................................................... 32
4.1.3. Alternative 3: Offer Generation Swap Up To 225 MW .............................. 32 4.2. Evaluation ............................................................................................................. 34 4.3. Recommendation ................................................................................................. 38
References 44 Appendix A. Hydroelectric Turbines on Raw Water Outflows ............................... 47
ix
List of Tables
Table 2.1. Participants in the Peak Capacity Industry in BC ...................................... 6
Table 3.1. Relative Ranking of Teck’s Trail Operations compared to Other Zinc Smelters ......................................................................................... 17
Table 3.2. Summary of Trail Operations’ Strengths and Weaknesses for Providing Peak Capacity to Public Utilities ............................................. 26
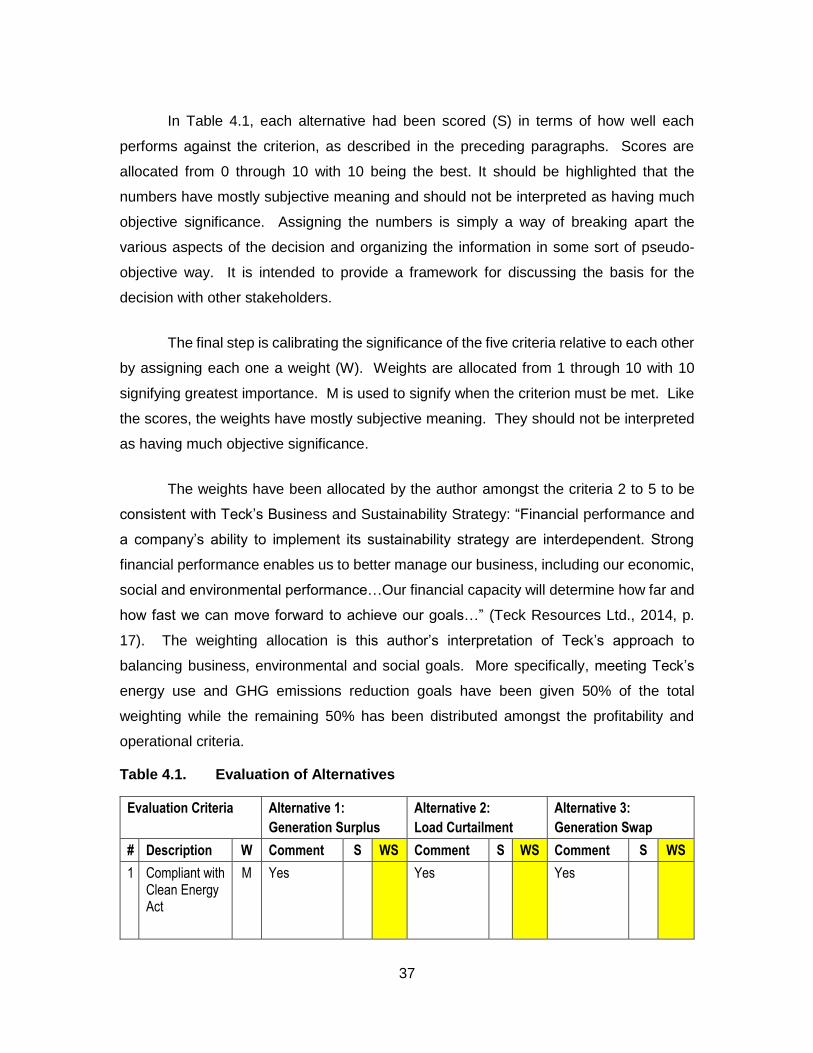
Table 4.1. Evaluation of Alternatives ....................................................................... 37
x
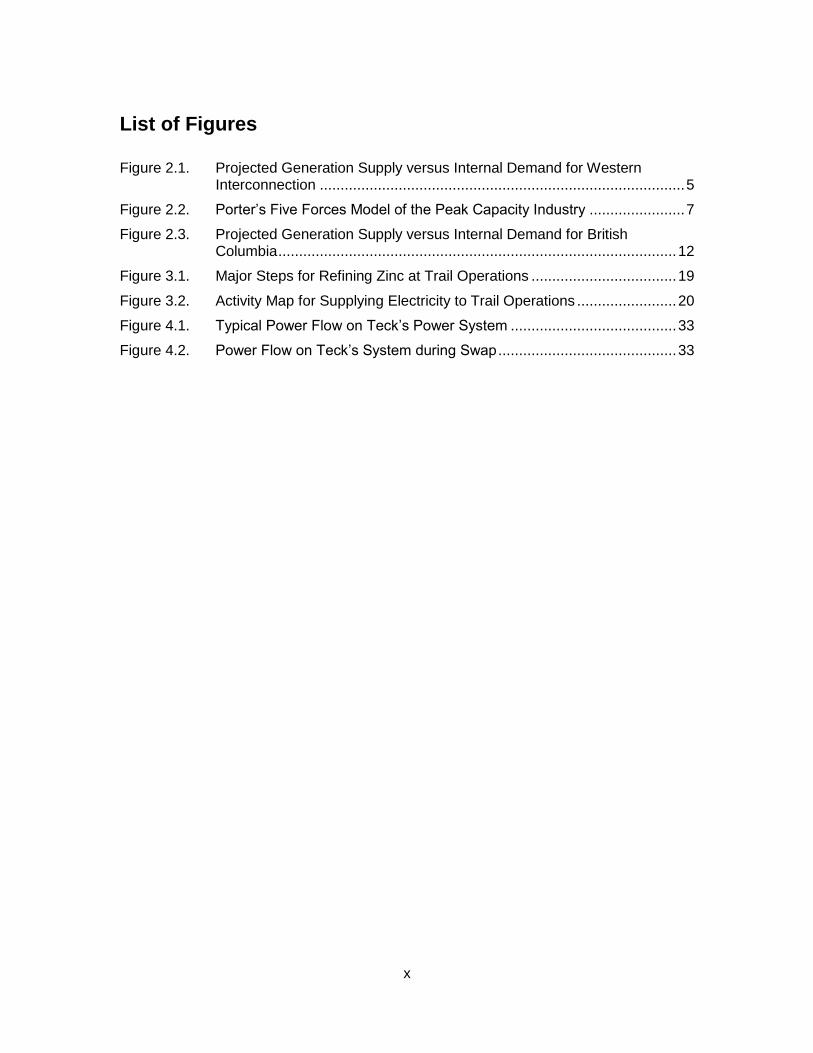
List of Figures
Figure 2.1. Projected Generation Supply versus Internal Demand for Western Interconnection ........................................................................................ 5
Figure 2.2. Porter’s Five Forces Model of the Peak Capacity Industry ....................... 7
Figure 2.3. Projected Generation Supply versus Internal Demand for British Columbia ................................................................................................ 12
Figure 3.1. Major Steps for Refining Zinc at Trail Operations ................................... 19
Figure 3.2. Activity Map for Supplying Electricity to Trail Operations ........................ 20
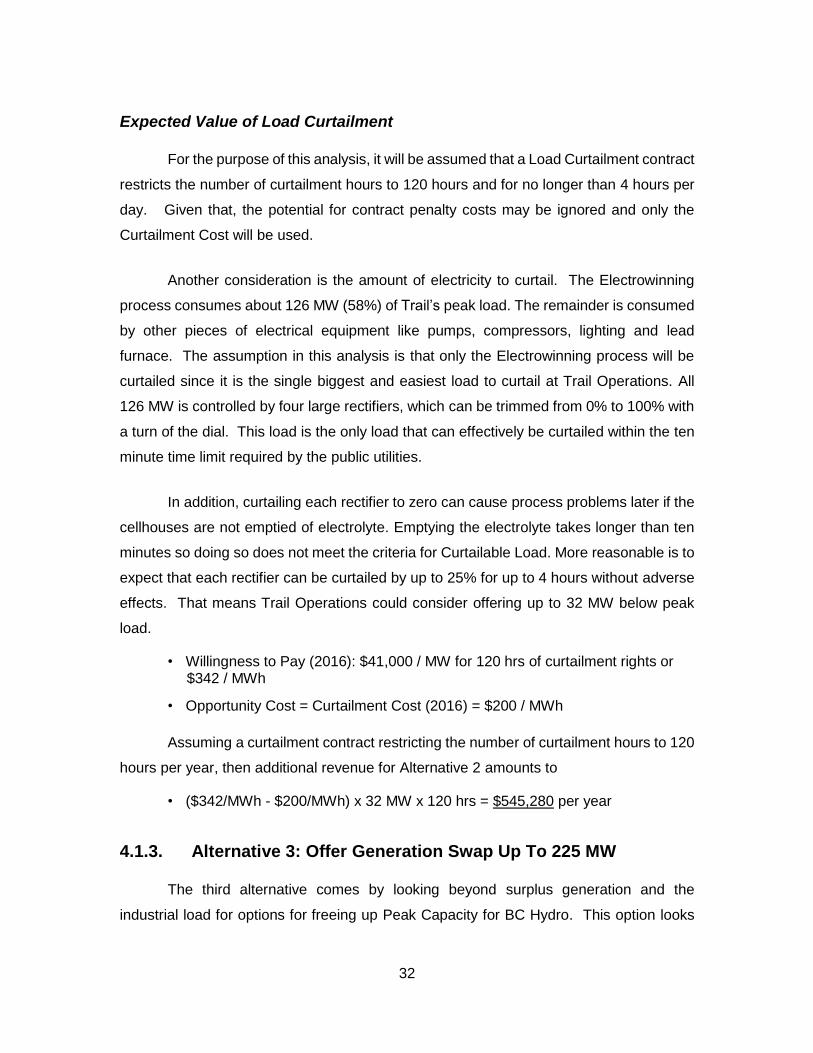
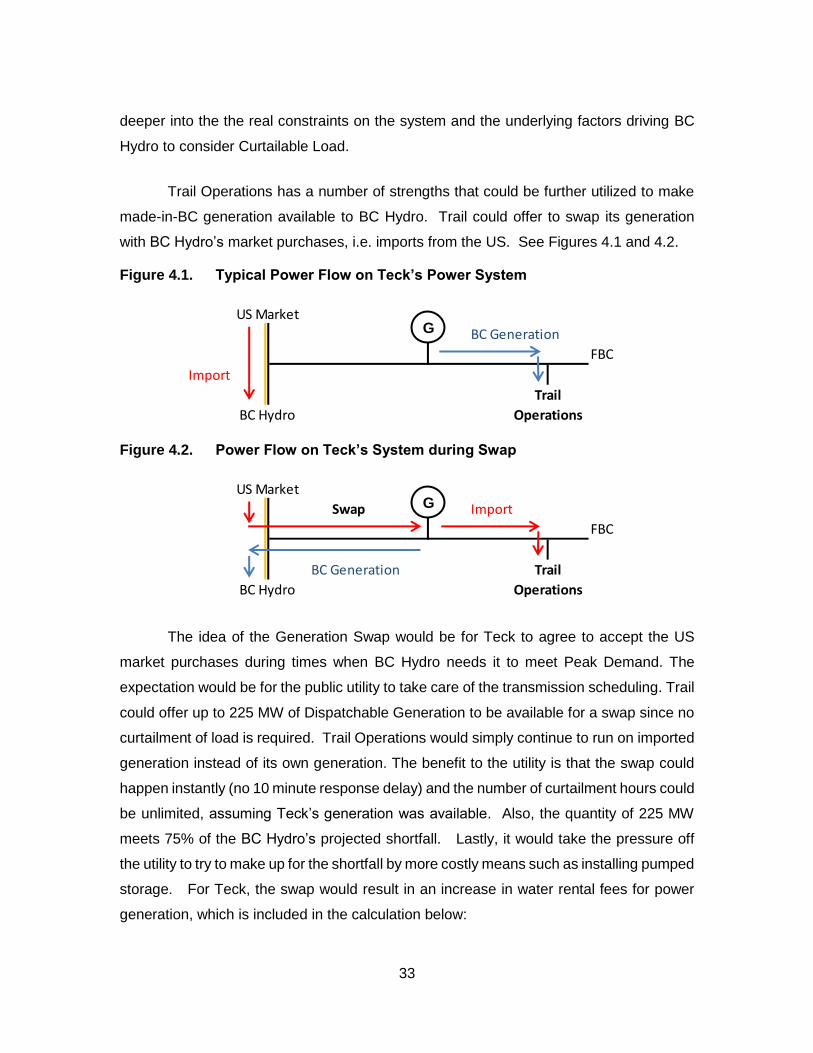
Figure 4.1. Typical Power Flow on Teck’s Power System ........................................ 33
Figure 4.2. Power Flow on Teck’s System during Swap ........................................... 33
xi
List of Acronyms
BC British Columbia
BC Hydro BC Hydro and Power Authority
CEA Clean Energy Act
CPA Canal Plant Agreement
DSM Demand Side Measure
GHG Greenhouse Gas
IRP Integrated Resources Plan
kW Kilowatt
kWh Kilowatt-hour
M Must
MW Megawatt
MWh Megawatt-hour
S Score
SCCT Simple Cycle Combustion Turbine
Teck Teck Metals Ltd. (A subsidiary of Teck Resources Ltd.)
US United States
VRIL Value Rarity Imitability Leverage
W Weight
WS Weighted Score
xii
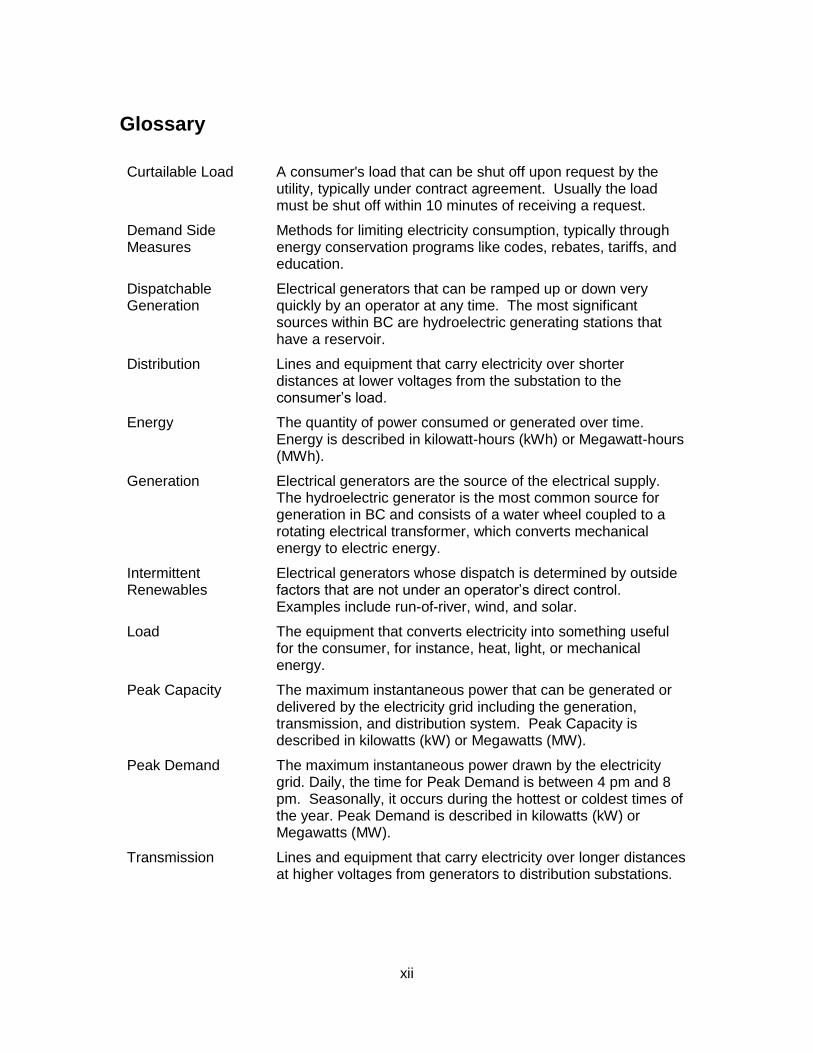
Glossary
Curtailable Load A consumer's load that can be shut off upon request by the utility, typically under contract agreement. Usually the load must be shut off within 10 minutes of receiving a request.
Demand Side Measures
Methods for limiting electricity consumption, typically through energy conservation programs like codes, rebates, tariffs, and education.
Dispatchable Generation
Electrical generators that can be ramped up or down very quickly by an operator at any time. The most significant sources within BC are hydroelectric generating stations that have a reservoir.
Distribution Lines and equipment that carry electricity over shorter distances at lower voltages from the substation to the consumer’s load.
Energy The quantity of power consumed or generated over time. Energy is described in kilowatt-hours (kWh) or Megawatt-hours (MWh).
Generation Electrical generators are the source of the electrical supply. The hydroelectric generator is the most common source for generation in BC and consists of a water wheel coupled to a rotating electrical transformer, which converts mechanical energy to electric energy.
Intermittent Renewables
Electrical generators whose dispatch is determined by outside factors that are not under an operator’s direct control. Examples include run-of-river, wind, and solar.
Load The equipment that converts electricity into something useful for the consumer, for instance, heat, light, or mechanical energy.
Peak Capacity The maximum instantaneous power that can be generated or delivered by the electricity grid including the generation, transmission, and distribution system. Peak Capacity is described in kilowatts (kW) or Megawatts (MW).
Peak Demand The maximum instantaneous power drawn by the electricity grid. Daily, the time for Peak Demand is between 4 pm and 8 pm. Seasonally, it occurs during the hottest or coldest times of the year. Peak Demand is described in kilowatts (kW) or Megawatts (MW).
Transmission Lines and equipment that carry electricity over longer distances at higher voltages from generators to distribution substations.
xiii
Western Interconnection
The group of electric utilities in western North America that are electrically connected during normal conditions. The geographic area covers from BC to Mexico and from the Pacific Ocean to the Great Plains.
Zinc Smelter An industrial operation that produces refined zinc metal and possibly co-products from mined concentrates using hydro and pyro metallurgical processes.
xiv
Executive Summary
With the introduction of the Clean Energy Act, BC Hydro has been mandated to be
electricity self-sufficient by 2016. BC Hydro can no longer rely on imports to cover
electricity shortfalls. According to their most recent resource plan, BC Hydro may not have
enough capacity to meet the regulatory requirement in time.
Teck’s Zinc Smelter located in Trail, BC uses a lot of electricity, enough to supply
a small city. It is the second largest single electrical load in BC and has the ability to
quickly ramp up or down a large portion of its electrical load. Teck also owns a
hydroelectric generating station and transmission system for supplying its Zinc Smelter.
While Teck’s Zinc Smelter is not a direct customer of BC Hydro, it may be in a position to
provide additional electricity capacity to BC Hydro.
The genesis for this strategic analysis was to consider the opportunity for Teck’s
Zinc Smelter to curtail production for the purpose of freeing up capacity for BC Hydro to
use. After further review, it became evident that Teck could offer two more alternatives
that were more dependable and convenient than curtailing load yet still cheaper than
constructing new generation. The two other alternatives were (1) to offer Teck’s surplus
generation capacity or (2) to swap BC Hydro’s imports with Teck’s made-in-BC generation.
All three alternatives were evaluated based on criteria for regulatory,
environmental, profitability, and quality. This author concluded that swapping generation
would be the best fit for Teck, even though it would increase reportable Greenhouse Gas
emissions for the Zinc Smelter. It is anticipated that the emissions could be offset by other
social and environmental improvement projects, financed from going forward with the
alternative. Swapping generation could increase profit by $9 million per year for Teck’s
Zinc Smelter based on typical rates.
1
Chapter 1. Introduction
The British Columbia (BC) Government introduced the Clean Energy Act in 2010.
With the new legislation, the crown owned utility BC Hydro has been mandated to be
electricity self-sufficient, meaning it can no longer rely on imports to cover electricity
shortfalls. BC Hydro is moving forward with major capital projects like Site C to increase
its generation capacity within the province; however, according to their most recent
resource plan, BC Hydro may not have enough capacity to meet the regulatory
requirement soon enough. Consequently, BC Hydro is currently looking for short term
options including ways to reduce demand (BC Hydro, 2014).
Teck’s Zinc Smelter located in Trail, BC uses a lot of electricity, enough to supply
a small city. It is the second largest single electrical load in BC and has the ability to
quickly ramp up or down a large portion of its electrical load. Teck also owns a
hydroelectric generating station and transmission system for supplying its Zinc Smelter.
While Teck’s Zinc Smelter is not a direct customer of BC Hydro, it may be in a position to
provide additional electricity capacity for BC Hydro to use.
The purpose of this strategic analysis is to explore whether there is a business
opportunity for Teck’s Zinc Smelter to provide made-in-BC electricity to BC Hydro.
Please note that the following analysis was written primarily to meet the
requirements of the Teck-SFU Executive MBA Program. The opinions expressed in this
analysis are the author's own and do not necessarily reflect the view of Teck, BC Hydro,
or SFU.
2
Chapter 2. Industry Analysis
2.1. Industry Definition
The electricity industry is well established and highly regulated in BC. In recent
years, the industry has been under pressure to develop renewable generation and to
promote energy conservation. In 2010, the BC Government enacted the Clean Energy
Act (CEA) (B.C. Ministry of Energy and Mines, 2010) to further encourage large-scale
renewable generation projects and conservation programs.
One particular requirement in the CEA is influencing the electricity industry for BC
and creating new demand for electricity from within BC. The requirement, in Section 6 of
the CEA, is that: “The authority [BC Hydro] must achieve electricity self-sufficiency by
holding …by the year 2016 and each year after that, the rights to an amount of electricity
that meets the electricity supply obligations…solely from electricity generating facilities
within the Province,..” (B.C. Ministry of Energy and Mines, 2010). To understand more
precisely what affect this is having on BC’s electricity industry starts with understanding
the electricity supply chain.
2.2. Supply Chain
Production, delivery and consumption of electricity occur in the following
sequence:
• Generation – Electrical generators are the source of the electrical supply. The hydroelectric generator is the most common source for generation in BC and consists of a water wheel coupled to a rotating electrical transformer, which converts mechanical energy to electric energy.
• Transmission – Transmission lines and equipment carry electricity over long distances at high voltages from generators to distribution substations.
• Distribution – Distribution lines and equipment carry electricity over shorter distances at lower voltages from the substation to the consumer’s load.
3
• Load – The consumer’s load is the final destination for electricity in the supply chain. The load is the equipment that converts electricity into something useful for the consumer, for instance, heat, light, or mechanical energy.
Electrical energy is delivered to a consumer’s load at the instant it is produced by
the generator. There is no warehousing or buffering of electricity in the supply chain.
Therefore, it is critical for the capacity of the generation, transmission, and distribution
system to be capable of supplying all the power at the instant it is needed. The entire
supply chain must be big enough to handle the greatest possible demand. This is called
the Peak Demand and is measured in kilowatts (kW) or Megawatts (MW). Typically, the
time for peak demand is between 4:00 pm and 8:00 pm during very hot or very cold times
of the year.
2.3. Peak Capacity
Peak Demand must be matched by the Peak Capacity of the generation,
transmission, and distribution system. Otherwise the load must be curtailed to prevent the
electrical grid from becoming unstable. Another requirement is that the Peak Capacity of
the generation must be dispatchable at the particular time it is needed.
2.3.1. Dispatchable Generation
Dispatchable Generation is an electrical generator that can be ramped up or down
very quickly by an operator at any time. The most significant sources of Dispatchable
Generation within BC are hydroelectric generating stations that have a reservoir and the
Burrard Thermal Generating Station. Operating Burrard Thermal will be prohibited after
2016 (B.C. Ministry of Energy and Mines, 2010), and the most recent large hydroelectric
and reservoir project built in BC was the Revelstoke Generating Station, completed in
1984 (Wikipedia, 2015a).
While there have been developments of run-of-river, wind, and solar in BC through
the 1990s and 2000s (BC Hydro, 2015a), these are not considered sources of
Dispatchable Generation. They are Intermittent Renewables (BC Government, p. 23).
4
Their dispatch is determined by outside factors that are not under an operator’s direct
control:
• Run-of-river generation can be dispatched only when the river flows;
• Wind generation can be dispatched only when the wind blows;
• Solar generation can be dispatched only when the sun shines.
For the purpose of this paper, the only sources for Dispatchable Generation within
BC are considered to come from large hydroelectric generating stations that have water
reservoirs.
2.3.2. Curtailable Load
If the demand for electricity cannot be met by the capacity of the system, then load
must be curtailed. One way is to arbitrarily disconnect load. This can upset customers
and even present hazards. Another way is through proactive measures called Demand
Side Measures (DSMs).
BC Hydro has implemented DSMs before and is further expanding their use but
mostly for energy conservation. BC Hydro is also considering a capacity-focused DSM
called Curtailable Load (BC Hydro, 2013b), which is new for BC. Curtailable Load is where
a consumer sells to the utility the right to curtail the consumer’s load. That right gives the
utility the ability to reduce demand for one consumer in order to deliver electricity to
another. The utility typically pays a flat fee or credit for the year under a contract agreement
that specifies the terms for the curtailment. For example, the utility might buy the right to
curtail the consumer up to 25 times and for up to 4 hours per occurrence over a year.
The benefit of Curtailable Load to the utility is that it can reduce Peak Demand,
allowing the utility to defer capital investments for new Dispatchable Generation. It can
also be implemented quickly. Curtailable Load does not reduce total energy consumption
over time. It just defers energy usage to time when demand is lower. Ideally, a consumer
who can be curtailed will catch up and experience no negative impact overall. Curtailable
Load also has environmental benefits by not expending resources to build new generation.
5
2.4. Industry Boundaries
The products, geography, and participants considered in the industry analysis for
Peak Capacity are as follows.
2.4.1. Products
The product being sold as Peak Capacity is either Dispatchable Generation or
Curtailable Load. From the buyer’s perspective, BC Hydro’s, Curtailable Load has the
same effect as Dispatchable Generation by enabling the utility to match supply with
demand. The difference is that the former reduces the demand for electricity and the later
increases the supply. In this respect, Dispatchable Generation and Curtailable Load can
also be considered to be direct substitutes of each other as Peak Capacity.
2.4.2. Geography
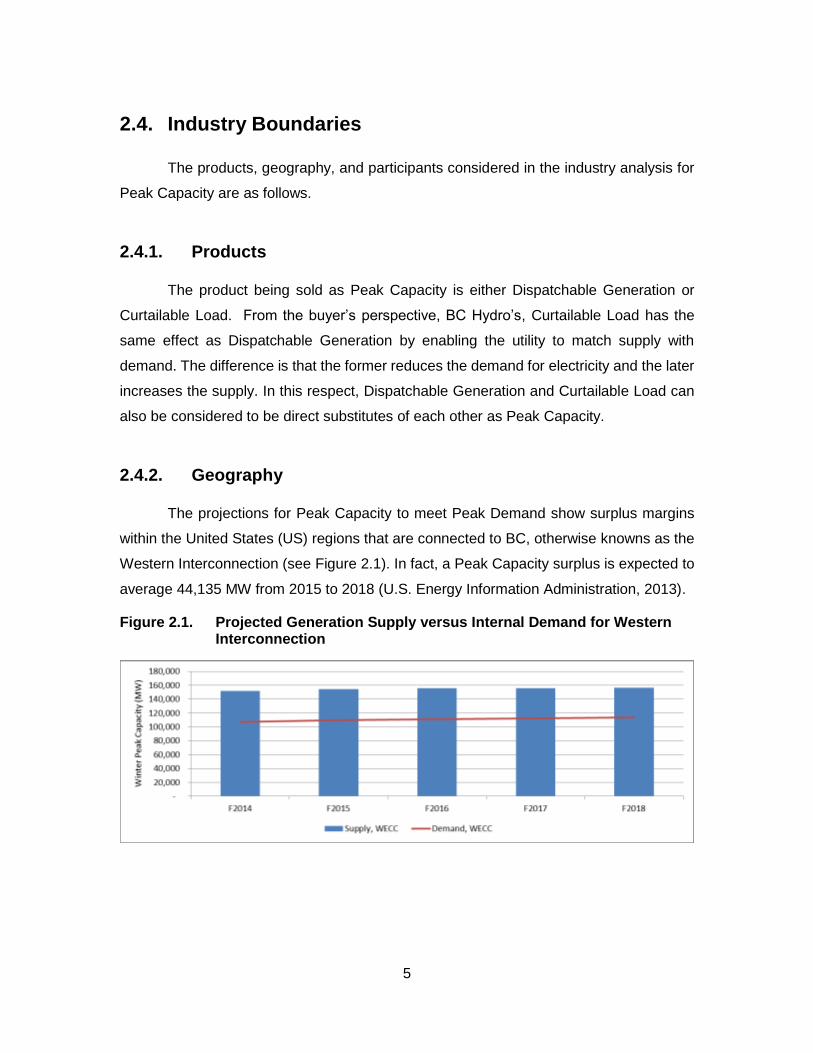
The projections for Peak Capacity to meet Peak Demand show surplus margins
within the United States (US) regions that are connected to BC, otherwise knowns as the
Western Interconnection (see Figure 2.1). In fact, a Peak Capacity surplus is expected to
average 44,135 MW from 2015 to 2018 (U.S. Energy Information Administration, 2013).
Figure 2.1. Projected Generation Supply versus Internal Demand for Western Interconnection
6
Note. Chart produced by author using data from U.S. Energy Information Administration. (2013, December 12). Table 8.9.B. Winter Net Internal Demand, Capacity Resources, and Capacity Margins by North American Electric Reliability Corporation Assessment Area, 2012 Actual, 2013-2017 Projected. Retrieved February 28, 2015, from Demand, capacity resources, and capacity margins: http://www.eia.gov/electricity/data.cfm#demand
BC’s electrical system has relied on about 400 MW of US surplus Peak Capacity
in the past (BC Hydro, 2013a); however, with the objective of the CEA for BC to achieve
electricity self-sufficiency, BC Hydro has been mandated not to rely on imports after 2016
(B.C. Ministry of Energy and Mines, 2010). Because of the BC regulatory objectives, the
deficit for Peak Capacity is isolated to BC. Those competing to supply Peak Capacity to
BC Hydro would need to be located within BC.
2.4.3. Participants
Table 2.1 outlines participants in the Peak Capacity industry in BC. How each
influences competition will be explained later in Section 2.5.1 using Porter’s Five Force
Analysis.
Table 2.1. Participants in the Peak Capacity Industry in BC
Buyers • Crown owned electric utility – BC Hydro
• Other public utilities (potentially in the future under the CEA)
Suppliers • Crown owned electric utility or generation owner – BC Hydro, Columbia Power Corporation
• Investor owned electric utilities – FortisBC
• Municipally owned utilities – City of Nelson
• Private companies with generation assets – Teck, Rio Tinto Alcan
Competitors • Private companies with generation assets – Teck, Rio Tinto Alcan
• Electrolytic-based smelters – Teck, Rio Tinto Alcan
• Other large industrial loads – Pulp and Paper Mills, Mines
Substitutes • New generation – BC Hydro’s Site C, Mica 5 & 6, Revelstoke 6, Waneta Expansion Plant, Independent Power Producers classed as Storage Hydro
• Energy conservation – codes and standards, tariffs, education
New Entrants • Load aggregators – EnerNOC
7
2.5. Industry Dynamics
This section begins with a look at the industry dynamics using Porter’s Five Force
Analysis (Porter, 2008). It concludes with a long term outlook of the market sector.
2.5.1. Porter’s Five Force Analysis
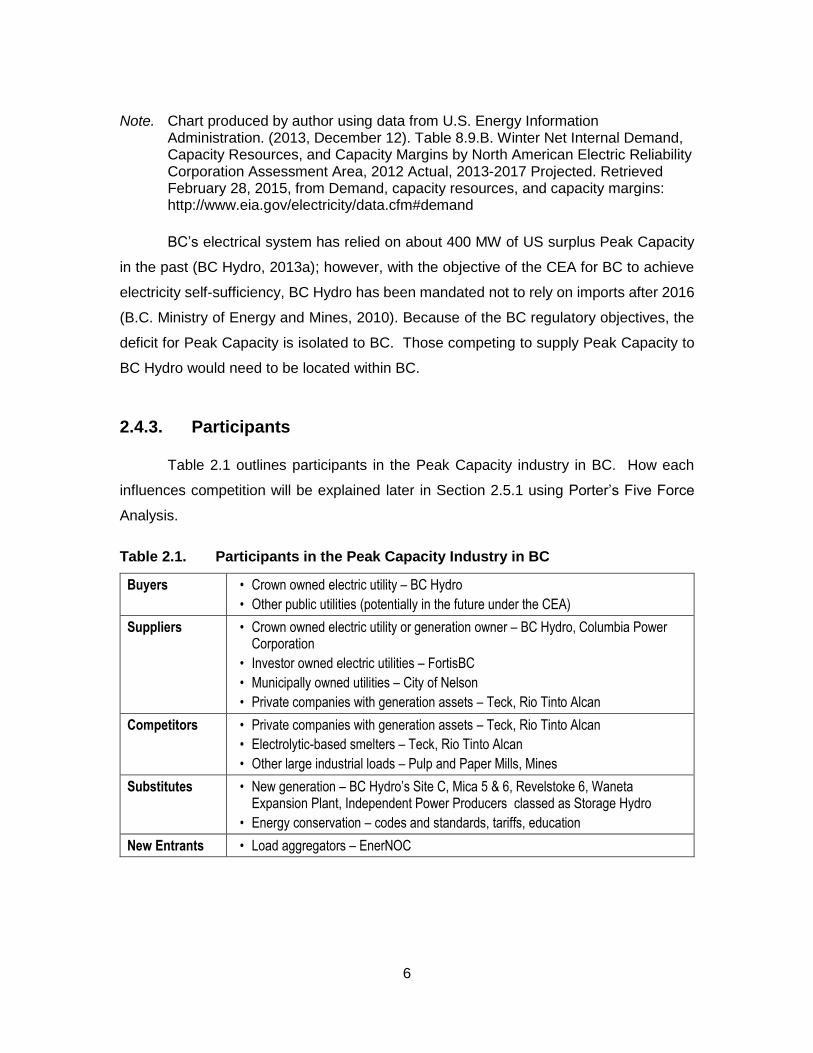
Porter’s Five Fore Analysis is used to assess the key drivers and overall strength
of each competitive force and has been illustrated diagrammatically in Figure 2.2.
Figure 2.2. Porter’s Five Forces Model of the Peak Capacity Industry
Note. Diagram produced by author based on Porter, M. E. (2008, January). The Five Competitive Forces That Shape Strategy. Harvard Business Review, pp. 78-93.
8
The Threat of Entry
The threat of other new entrants is weak. At this time, retaliation by competitors is
not expected since there is no head to head competition, but the barriers to entry are
assessed as follows:
• Supply side economies of scale – Peak Capacity providers must have a large presence on the electrical grid to be of value to the utility. A new entrant would have to have a large hydroelectric station, have a large electrical load, or be an Aggregator of smaller loads (e.g. EnerNOC).
• Demand side benefits of scale - BC Hydro may prefer to deal with existing customers who also purchase energy from them, preferring to enter Curtailable Load agreements with their direct customers as a credit incentive. They may also not want to buy Dispatchable Load from another party if that means redirecting funds from their internal projects.
• Customer switching costs – There are high switching costs for the buyer if he has signed a long term contract agreement for Peak Capacity rights.
• Capital requirements – The capital requirement for new large Dispatchable Generation facilities in BC is massive, $8.8 billion for Site C (BC Hydro, 2015b). And it would be uneconomical for new entrants to add load to the grid simply for Curtailable Load purposes. The investments in smart grid technology, an operations centre, and marketing for an Aggregator would require moderate capital.
• Incumbency advantage independent of size – Having generation or load that can be dispatched or curtailed at a moment’s notice would be an incumbency advantage, especially if the incumbent has excess generation of can make up for the curtailment at a later time.
• Unequal access to distribution channels - The location of the Peak Capacity influences the value of it. If the capacity is not located where it is needed, or the system cannot be balanced to benefit from it, then it is of no value to the utility.
The Power of Suppliers
The power of suppliers is weak if the Peak Capacity provider generates its own
electricity. For instance, the two largest industrial loads in BC (Teck and Rio Tinto Alcan)
supply their own electricity. In this case, by curtailing load the entity is actually making
available its own Dispatchable Generation to BC Hydro.
9
In another case, the power of suppliers is very strong if BC Hydro is supplying the
electricity already to the consumer and is offering to buy it back as a credit.
The Power of Buyers
Buyer power is very strong since there is only one main buyer at this time, BC
Hydro. Also, Peak Capacity is generally undifferentiated other than the location in the grid
where it is made available. Buyer power weakens as the quality and size of the Peak
Capacity gets better, i.e. how quickly it can be dispatched, what portion of the BC Hydro’s
deficit it covers.
The Threat of Substitutes
The threat of substitutes is weak at this point in time. New Dispatchable Generation
in BC is by far the greatest threat to demand for more Peak Capacity in the long run.
Generation, particularly from large hydroelectric, is highly dependable and low-cost to
operate; however, it is capital intensive, takes time to build, and can impact the
environment.
Energy conservation will reduce the amount of Peak Capacity needed in the short
and medium terms; however, typical programs are less dependable to a utility for
managing Peak Demand compared to a contract for Curtailable Load, or even better,
Dispatchable Generation.
Rivalry Among Existing Competitors
Rivalry among existing competitors is a weak threat. The supply of existing Peak
Capacity within BC is small outside of what BC Hydro already owns or has purchased the
rights to. BC Hydro already has the capacity and energy rights for all of the generation
from Columbia Power Corporation and Independent Power Producers. These entities are
not considered rivals unless they can bring new sources of Dispatchable Generation
online. Competition to supply existing Peak Capacity is from a small number of single
large firms, mostly in the form of Curtailable Load by large industrial loads.
There are only two large electrolytic-based smelters in BC, Teck’s Trail Smelter
and Rio Tinto Alcan’s Kitimat Smelter. Both smelters produce their own electricity supply
10
but are connected to BC Hydro’s grid. The concentration ratio for Teck’s Zinc Smelter in
Trail is equivalent to 10% of BC Hydro’s entire industrial sector in terms of annual energy
use. Other competitors include Pulp and Paper Mills and Mines.
Exit barriers are low since since providing Curtailable Load would not be a core
function of the business. For instance, the core business of the smelters is to produce
refined metal (zinc or aluminum).
There can be a high degree of differentiation in response time and magnitude of
curtailment. There can also be differentiation in terms of proximity to demand. Ideally, the
load or generator is located near to the region with greatest demand.
2.5.2. Factors Affecting Porter’s Five Forces (Macro Analysis)
The following sections focus on the factors that influence the five forces (Porter,
2008), making the Peak Capacity opportunities more or less attractive over time.
Technology and Innovation
New smart grid technology that enables real-time measurement and control of
electrical loads make rivalry and the threat of entry by Aggregators stronger over time.
Energy conservation initiates also make rivalry and the threat of substitution stronger over
time.
Adding more generation derived from Intermittent Renewables like wind and solar
increases the need for Peak Capacity if there is not enough Dispatchable Generation like
large hydroelectric or gas fired turbines, weakening buyer power overtime.
Government and Stakeholders
The CEA effectively mandates the buyer (BC Hydro) to participate in the market
for made-in-BC Peak Capacity, making buyer power weaker.
New hydroelectric development, especially those that dam rivers, could see delays
due to opposition from environmental groups, making the threat of substitution weaker or
uncertain.
11
The Mandatory Reliability Standards applicable to British Columbia require the
buyer, BC Hydro, to maintain 3% in supplemental emergency reserves, which can be
Dispatchable Generation or Curtailable Load. A severe non-compliance to maintain full
emergency reserves can result in financial penalties. This factor makes buyer power
weaker.
Complements
If the Peak Capacity provider also produces its own energy and has energy
surplus, then the provider could arrange to deliver the energy when called upon to supply
capacity. Therefore, the Peak Capacity provider could capture both the curtailment price
for the capacity and the peak price for the energy.
Cannibalization
The ideal scenario for Curtailable Load is to curtail load for a short period when
called upon by the utility, then catch up after the curtailment period has ended. In theory,
there should be no production loss; however, in reality, curtailing load usually presents
some risks and the potential for unrecoverable production losses. A Curtailable Load
provider must carefully weigh the cost versus benefit prior to signing a contract with a
utility. The cost benefit will vary amongst competitors, which will strengthen or weaken
rivalry.
2.5.3. Long Run Assessment
The demand for Peak Capacity in BC for the purpose of ensuring delivery of energy
from generation derived within BC is driven by regulation. Over time the demand for Peak
Capacity is expected to be met by new Dispatchable Generation, so the need for
Curtailable Load to manage Peak Demand will diminish. However, Mandatory Reliability
Standards and increased generation from Intermittent Renewables will likely sustain a
need for additional sources of Dispatchble Generation and Curtailable Load in the long
run.
12
2.6. Gap Analysis
The following gap analysis looks to the most recent Integrated Resources Plan
(IRP), published by BC Hydro (BC Hydro, 2013a) to quantify the gap between Peak
Capacity and Peak Demand in BC. Following the review of the gap is a review of Manitoba
Hydro’s Curtailable Rate Program as a basis for assessing a utilities willingness to pay for
Peak Capacity.
2.6.1. Integrated Resources Plan
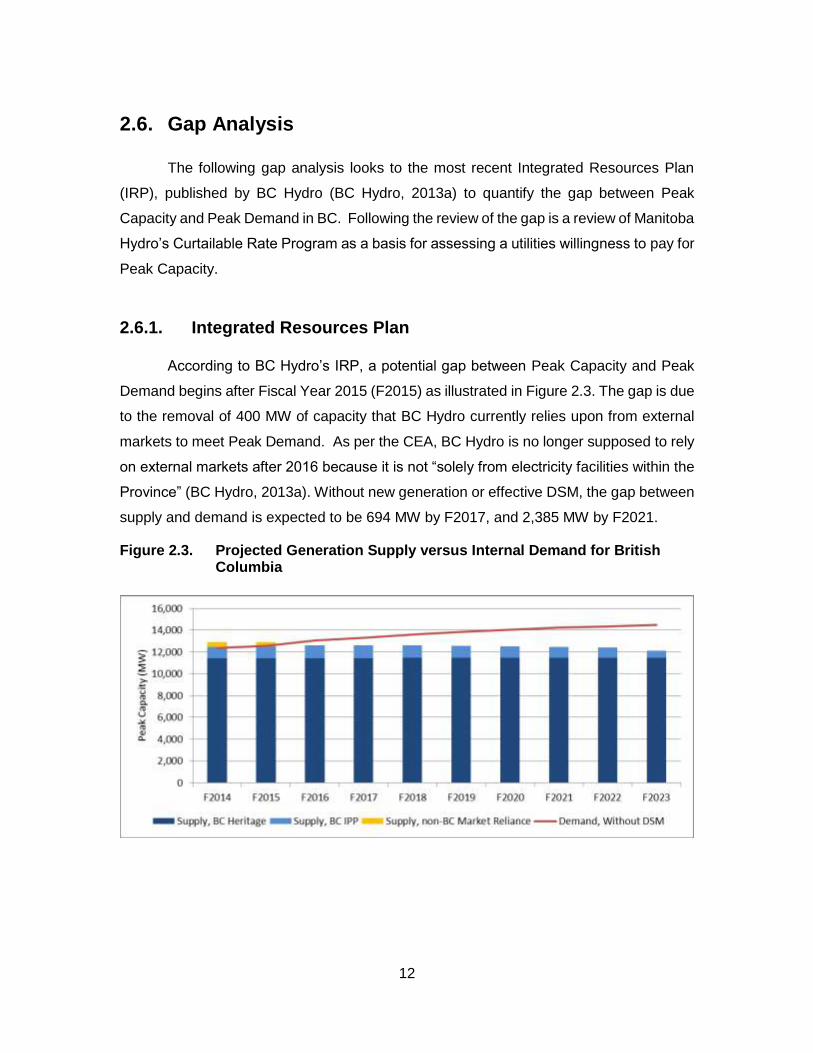
According to BC Hydro’s IRP, a potential gap between Peak Capacity and Peak
Demand begins after Fiscal Year 2015 (F2015) as illustrated in Figure 2.3. The gap is due
to the removal of 400 MW of capacity that BC Hydro currently relies upon from external
markets to meet Peak Demand. As per the CEA, BC Hydro is no longer supposed to rely
on external markets after 2016 because it is not “solely from electricity facilities within the
Province” (BC Hydro, 2013a). Without new generation or effective DSM, the gap between
supply and demand is expected to be 694 MW by F2017, and 2,385 MW by F2021.
Figure 2.3. Projected Generation Supply versus Internal Demand for British Columbia
13
Note. Chart produced by author using data from BC Hydro. (2013, November 15). Appendix 9A: Load-Resource Balances, Base Resource Plans and Contingency Resource Plans. Retrieved February 22, 2015, from Integrated Resources Plan: https://www.bchydro.com/energy-in-bc/meeting_demand_growth/irp/document_centre/reports/november-2013-irp.html
Within the IRP, BC Hydro lays out a plan to span the gap. The plan includes
construction of new Dispatchable Generation, most significantly Site C, and additional
DSMs that focus on energy conservation. According to the plans, conservation based
DSMs are expected to allow BC Hydro to meet CEA target of a 66% reduction in new
energy demand; however, BC Hydro still anticipates a shortfall with the capacity of its
generators to deliver energy during peak hours until Site C is completed in 2024. To
bridge the capacity gap, BC Hydro has cited in the IRP that it may need external market
purchases of up to 300 MW from F2019 to F2023. Since this contradicts the regulatory
obligation, one of the recommendations from the IRP is to pursue Curtailable Load
beginning in F2015.
2.6.2. Willingness to Pay
Manitoba Hydro has a Curtailable Rate Program (Manitoba Hydro, 2015) that
primarily focuses on having Curtailable Load for emergency reserves. Manitoba Hydro’s
program offers different curtailment options and different credits based on the quality of
the curtailment. Most of the options are designed to meet reliability obligations, but one
option is designed to manage Peak Demand, similar to what BC Hydro is looking for as
one of their options to meet their capacity shortfall.
According to the 2014 Curtailment Rate Program Report to the Public Utilities
the marginal cost of building new long term Dispatchable Generation. The most
economical long term generation option to Manitoba Hydro at the time of the report was a
Simple Cycle Combustion Turbine (SCCT). For F2014, the carrying cost of an SCCT was
estimated to be $94,000 per MW per year (rounded to the nearest thousand). In their
valuation, Manitoba Hydro asserted that Curtailable Load was less valuable than SCCT
because it is less flexible to dispatch, has less capability to deliver energy over longer
14
peak periods, and has no guarantee to be available in the long run. Consequently,
Manitoba Hydro gave curtailable load a value of 42% of the annual carrying cost of an
SCCT, which equated to $39,000 per MW per year in F2014 (rounded to the nearest
thousand). In F2014, Manitoba Hydro had three customers participating in their program.
One was compensated $5,372,052 in credits and was curtailed 14 times for a total of
15.88 hours for the year. Manitoba paid for the rights to curtail more than that but did not
exercise its rights fully.
Looking at Manitoba Hydro’s Curtailable Rate Program as proxy to BC Hydro’s
willingness to pay, the best positioned players to provide Curtailable Load are those who
are already direct customers of the utility. Also, to be of value to the utility, the providers
need to be able to respond to a curtailment request within ten minutes. Lastly, a consumer
who is considering to participate in a Curtailable Rate Program should plan for the worst
case of frequency and duration of curtailments as specified in the curtailment agreement,
ensuring that in the worst case there is adequate profit with the curtailments. As
demonstrated in Manitoba, the frequency and duration of curtailments may be much less
resulting in greater profit potential for the Curtailable Load provider.
2.6.3. Industry Valuation
Based on Manitoba Hydro’s Curtailable Rate Program and adjusting for 3%
inflation, this valuation of Peak Capacity is $41,000 per MW per year in 2016 dollars. Given
the shortfall of 300 MW projected by BC Hydro, the estimate of the total market value in
BC from now until 2023 is $12,300,000 per year (in 2016 dollars).
2.7. Summary of Opportunity in the Industry
In summary, BC Hydro is currently exploring options for Curtailable Load with its
customers due to regulatory obligations to achieve electricity self-sufficiency and a
projected shortfall of Dispatchable Generation of up to 300 MW before 2024. Using
Porter’s Five Force Analysis of the situation in BC, this author thinks that the opportunity
for providing Curtailable Load or Dispatchable Generation to BC Hydro is favorable. The
industry is relatively uncontested except for BC Hydro’s position as the primary utility for
15
the province; however, the Clean Energy Act is prompting BC Hydro to secure more Peak
Capacity within BC by 2016. Initially, the price paid by BC Hydro is expected to be $41,000
per MW per year for Curtailable Load and likely more for Dispatchable Generation.
16
Chapter 3. Firm Analysis
This analysis of the firm begins with an assessment of how a Zinc Smelter like
Teck’s Trail Operations earns profit, and how Zinc Smelters in general compete relative
to each other. While the intent of this paper is to analyze the potential for Trail Operations
to provide Peak Capacity to BC Hydro, it is useful to begin with understanding the primary
industry that Teck’s Trail Operations competes in as a Zinc Smelter. The intent is to outline
the context and factors that must be considered when a Zinc Smelter chooses to make
available its Curtailable Load or Dispatchable Generation.
3.1. Financial Analysis
The following discussion draws upon a market analysis by Wood Mackenzie
(Wood Mackenzie, 2015). The report outlined the key activities that define the profitability
of a Zinc Smelter, in particular operating income (revenue less operating expenses).
Supplemental information was also obtained from Wood Mackenzie’s Zinc Smelter Cost
Model.
To begin, a Zinc Smelter earns revenue through Treatment Charges, Bonus Zinc,
and Co-products:
• Treatment Charges are the fees paid by the mines to the smelter to refine the ore concentrate into highly pure zinc metal.
• Bonus Zinc is the additional revenue that comes from extracting more zinc metal from the ore concentrate than the amount that was agreed to be credited to the mine.
• Co-products include all other metals and non-metals that are extracted from the ore concentrate. Co-products are sold by the smelter but may or may not be credited to the mine. The Co-products extracted at Trail Operations include lead, copper, silver, gold, cadmium, indium, germanium, and various sulphur products including sulphuric acid, elemental sulphur, sulphur dioxide, and fertilizer.
17
On the other side of the equation, operating expenses for a Zinc Smelter are mainly
Labour, Energy, Maintenance, Consumables, Onsite Services and Depreciation:
• Labour costs are a function of labour rates and productivity. In regions like Canada, high labour rates can be offset by higher productivity through automation and machinery, keeping labour costs competitive.
• Energy costs are critical for electrolytic-based Zinc Smelters. Having access to cheap and secure energy like hydroelectricity significantly reduces energy costs.
• Maintenance, Consumables, Onsite Services, and Depreciation make up the remainder of Operations Costs. The fact that Trail Operations fairs relatively poorly for expenses for Maintenance, Consumables, and Onsite Services but relatively well for Depreciation is likely a function of the age of the major assets (Plant, Property, and Equipment). Trail Operations has been been operating since 1896. Although the major process Plants have been modernized over time, many parts of the operation are still in service beyond the original estimated useful life used for Depreciation.
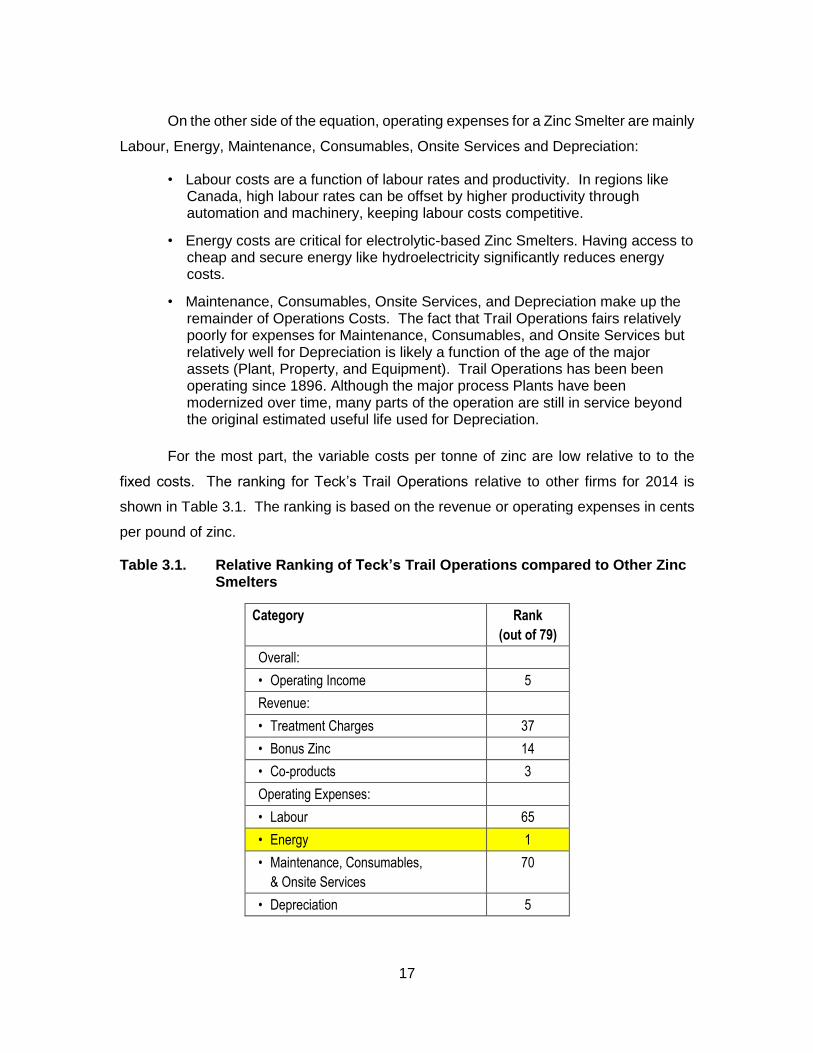
For the most part, the variable costs per tonne of zinc are low relative to to the
fixed costs. The ranking for Teck’s Trail Operations relative to other firms for 2014 is
shown in Table 3.1. The ranking is based on the revenue or operating expenses in cents
per pound of zinc.
Table 3.1. Relative Ranking of Teck’s Trail Operations compared to Other Zinc Smelters
Category Rank
(out of 79)
Overall:
• Operating Income 5
Revenue:
• Treatment Charges 37
• Bonus Zinc 14
• Co-products 3
Operating Expenses:
• Labour 65
• Energy 1
• Maintenance, Consumables,
& Onsite Services
70
• Depreciation 5
18
The rankings above show that Trail earns better than average operating income,
ranked 5 out of 79 firms globally. Trail overcomes disadvantages for Treatment Charges,
Labour, Maintenance, Consumables, and Onsite Services with advantages in Bonus Zinc,
Co-products, Depreciation, and Energy.
Transportation costs are also an important factor for Trail Operations. Trail is
located 400 km inland from the nearest seaport. Today, most ore concentrates are
shipped from the mines by sea and then hauled by rail and truck from the seaport to Trail.
The Transportation costs were not analyzed in the Wood Mackenzie report. However,
these costs are significant for Trail and have been factored into Chapter 4, the Opportunity
Analysis.
Finally, Trail Operations had one advantage that was ahead of all other
competitors in 2014. That was having the lowest Energy costs. The remainder of this
Firm Analysis will focus on the operations functions of the value chain, and in particular
the activities that make Trail Operations the leader in lowest Energy costs.
3.2. Value Chain Analysis
As a zinc commodity producer, Trail Operations competes on low cost. It competes
very little by product differentiation. It produces at low cost primarily through activities in
the operations. All other primary and secondary activities are common if compared to
other Zinc Smelters, except for inbound logistics where Transportation costs are relatively
high because of Trail’s inland location.
This Firm Analysis will now shift focus from the Zinc Smelter industry to the Peak
Capacity industry in BC. For this it is necessary to examine Trail’s core zinc refining
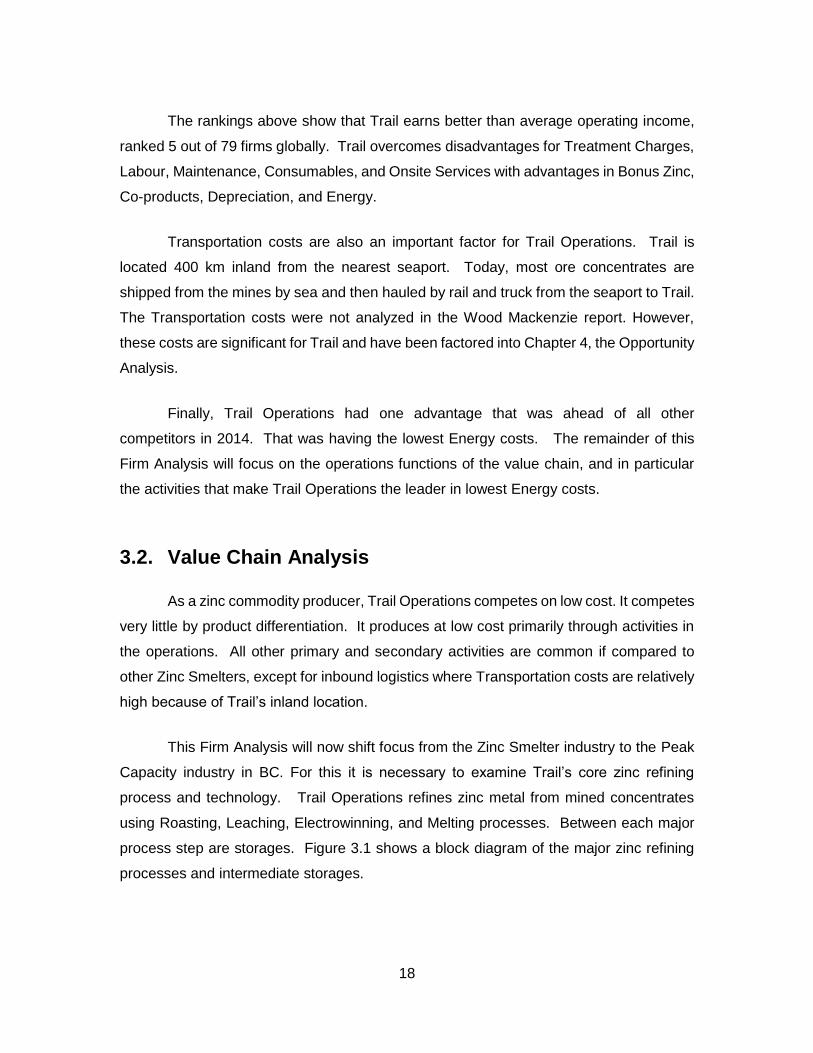
process and technology. Trail Operations refines zinc metal from mined concentrates
using Roasting, Leaching, Electrowinning, and Melting processes. Between each major
process step are storages. Figure 3.1 shows a block diagram of the major zinc refining
processes and intermediate storages.
19
Figure 3.1. Major Steps for Refining Zinc at Trail Operations
Electricity is a key input to the process step of Electrowinning. At this stage the
electrolyte, which contains zinc ions in solution, is pumped between alternating lead
anodes and aluminum cathodes. As electric current is applied between the anodes and
cathodes, the zinc ions in the electrolyte plate on to the cathode sheets as pure zinc metal.
The process is electrically intense, requiring about 3.75 MWh of electricity to produce one
tonne of zinc.
The nameplate capacity for Trail Operations is 295,000 tonnes of zinc per year. In
order to produce that much zinc, the operation requires 1,106,250 MWh of electricity just
for the Electrowinning process. That works out to an average demand of 126.3 MW and
is enough electricity to supply the city of Chilliwack, BC1.
At this point, it would be easiest to stop the Firm Analysis and conclude that Trail
Operations is a strong contender to provide Curtailable Load to BC Hydro simply because
the electrical load is very big. However, Trail’s unique electrical load is only part of the
potential opportunity. Trail’s electricity supply is also unique and valuable, not only for Zinc
Smelting, but also for possibly supplying made-in-BC Dispatchable Generation to BC
Hydro.
1 Calculation: (1 household / 37 MWh) x (34,340,000 people / 13,320,615 households) x
(1,106,250 MWh) = 77,077 people. Refer to Statistics Canada Energy Use Tables (Statistics Canada, 2011).
20
3.2.1. Trail’s Electricity Supply
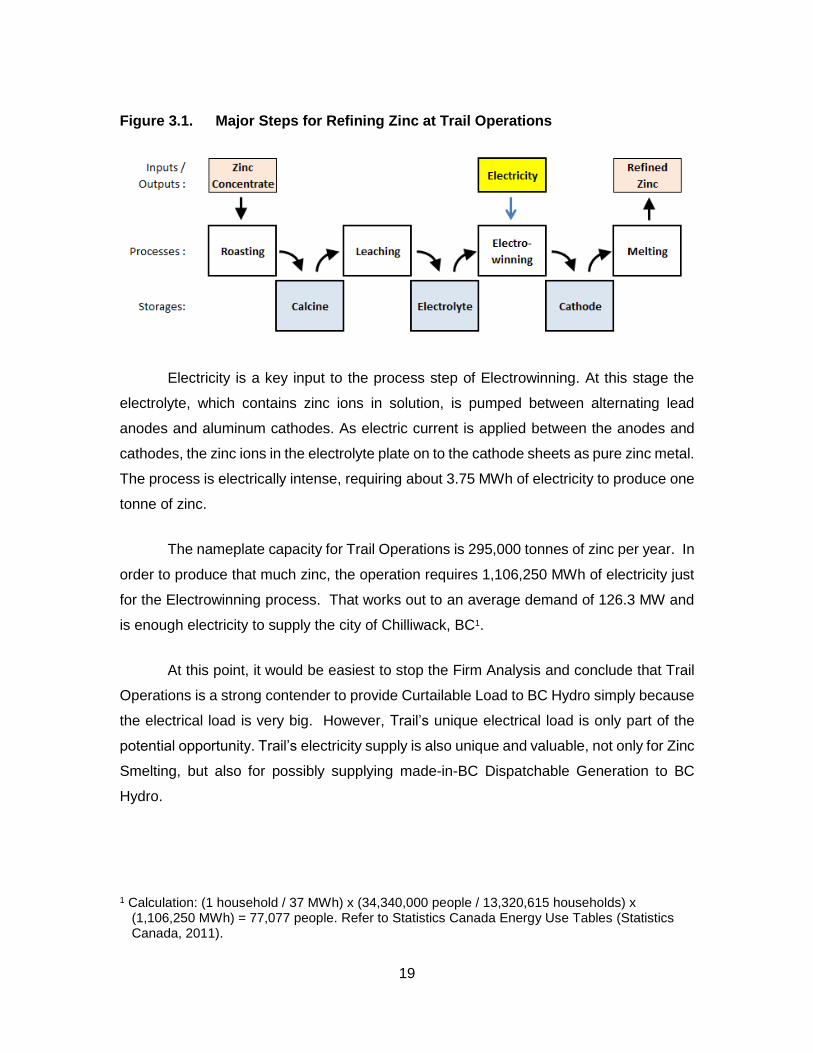
On the surface, one might assume Trail Operations has a competitive advantage
as a Zinc Smelter only because it owns a hydroelectric generating station. Further
examination of Trail’s electricity supply reveals a web of activities and attributes that are
more complex and unique than simply owning a hydroelectric generating station. The
complex web is essential for providing Trail with its “secure low-cost source of electricity”.
Figure 3.2 shows an activity map for Trail’s electricity supply.
Figure 3.2. Activity Map for Supplying Electricity to Trail Operations
There is no denying that owning a hydroelectric generating station plays a major
part; however, a myriad of other activities and attributes are also essential for having a
secure source of electricity at a lower cost than its competitors.
21
First, what really makes a hydroelectric generating station valuable is holding the
water licenses on the river for the purpose of generating electricity. Without the licenses,
the hydroelectric generating station cannot be built. Furthermore, Teck has direct control
over operations, maintenance, and capital expenditures at the generating station through
direct ownership of the asset.
Second, Teck owns approximately 45 km of transmission lines and right of ways.
A 20 km line connects the generating station to Trail Operations. At that point, Teck also
interconnects with the FortisBC grid. Teck owns another 25 km line from the generating
station to the US border. A critical attribute of this line is the associated National Energy
Board permit that Teck has, which gives Teck transmission rights for firm capacity to either
import or export between BC and the US. The transmission line to the US also connects
into BC Hydro’s grid just before crossing the border.
Finally yet most importantly, Teck is party to the Canal Plant Agreement (CPA).
The Agreement was first created in 1972 to facilitate BC Hydro’s construction of the Canal
Plant on the Kootenay River. At the time, Teck owned four of the five generating stations
on the Kootenay River. Since then, the CPA has been expanded. Presently the
Agreement includes five parties and covers nearly all generating stations on the Kootenay
and Pend d'Oreille Rivers not owned by BC Hydro. The CPA works by each party giving
BC Hydro control of their generating stations to dispatch and optimize generation. In
exchange, each party receives capacity, energy, and storage entitlements based on
historical water flows and generation capabilities of each party’s respective generating
stations. For Trail Operations, this is extremely useful as capacity, energy, and storage
entitlements remain fixed for a thirty year period (subject to penalties for generator or
transmission outages). Coordination not only affords optimal efficiency of generation for
the province of British Columbia but also reliability by having interconnected resources.
All of the above activities and attributes working in concert are essential for how
Trail Operations achieves a “secure low-cost source of electricity” and maintains a
competitive advantage as the lowest energy cost producer in the Zinc Smelter industry.
The activities and attributes explained above will be examined further as part of
the strengths or weaknesses for Trail Operations to supply Peak Capacity to BC Hydro.
22
Resources and capabilities related to the zinc refining process will also be explored further
from the perspective of supplying Curtailable Load.
3.3. Resources and Capabilities Analysis
Certain resources and capabilities that were identified in Section 3.2, Value Chain
Analysis, will be explored further in terms of Trail Operations providing Peak Capacity to
BC Hydro. The analysis will employ the VRIL Framework (Wikipedia, 2015b). VRIL is an
abbreviation for Value, Rarity, Imitability, and Leverage. Each word forms parts of a
question used to assess the competitive implication of a particular resource or capability:
• Value? Can the resource or capability provide value to the firm? I.e. can it increase Return on Capital Employed?
• Rarity? Is the resource or capability scarce? How unique is it amongst competitors?
• Costly to Imitate? Is the resource or capability costly or difficult to duplicate? Can it be substituted?
• Leveraged? Is the firm ready and able to capture value using the resource or capability?
The next subsections describe each resource or capability considered for Peak
Capacity, including the VRIL Framework analysis. Section 3.4 contains a summary table
of the results.
Very large industrial electrical load
The electricity load for Trail Operations is very large relative to the load in the rest
of the province. Having this resource to participate in a Curtailable Load program is a
competitive advantage and a potential strength for Trail.
VRIL Analysis:
• Value? Yes – The load is big. In fact, the Trail Zinc Smelter is second only to the Aluminum Smelter and utilizes electricity equivalent to about 10% of BC Hydro’s total industrial load. The reason the load is so big is primarily due to the Electrowinning process. The process alone consumes enough electricity to supply the city of Chilliwack, BC. Curtailing Trail’s Electrowinning process could meet 50% of BC Hydro’s projected capacity shortfall.
23
• Rarity? Yes - In the context of Peak Capacity, Trail Operations is valuable because of its size. It is also rare. Only one other single load in BC is bigger.
• Costly to Imitate? Yes - No firm would add electrical load to the system for the sole purpose of supplying a market for Curtailable Load. If anything, new generation would be added. As already indicated in BC Hydro’s IRP, new generation cannot be built soon enough before the capacity is needed in BC. That said, there are companies, like EnerNOC, that aggregate many small loads and coordinate curtailment. This would be a more costly, but not unreasonable, to pay for network communications equipment and overhead for managing a Network Operations Centre.
• Leveraged? No –Trail Operations has curtailed zinc production and sold electricity instead in the past. It did this in 2001 when energy prices were high and in 2009 when the zinc market was weak. In both cases, the curtailments were planned well in advance and lasted for many weeks. Trail Operations has not participated in a Curtailable Load program; that is, curtailing production on short notice and for short periods for the purpose of freeing up generation on the system in a long term arrangement.
Capability to ramp up/down a large portion of load quickly
Another important capability for Trail Operations is that the Electrowinning process
can be ramped up or down very quickly. Theoretically, it is as simple as turning a dial.
Trail’s capability to curtail load quickly is neither a strength nor a weakness in the context
of Curtailable Load, but it does keep Trail a contender as a suitable participant.
VRIL Analysis:
• Value? Yes – While theoretically easy to do, curtailing the Electrowinning process gets practically more difficult as the magnitude or duration increases and if operations are unprepared. Risks of large or extended curtailments that are unplanned include overfilling storages, plugging process pipes, and damaging electrolytic cells. However, if operations are prepared and the duration of curtailment is short then these risks can be managed.
• Rarity? No - This capability would not be rare amongst other industrial loads, although curtailing a Zinc Smelter is typically easier than curtailing an Aluminum Smelter. Typically, other electricity consumers can turn on or off loads relatively easy if motivated.
Zinc and co-products available in the market
Zinc and the various co-products produced by Trail Operations are commodities.
This is neither a strength nor a weakness for Trail to supply Curtailable Load, keeping Trail
at competitive parity with other load curtailment providers.
24
VRIL Analysis:
• Value? Yes - As long as market inventories are adequate, Trail’s products could be purchased from elsewhere to meet contract obligations if curtailment results in unrecoverable production losses. As long as the price paid to curtail covers the cost to replace lost production through market purchases, then having the capability to buy form the market provides value.
• Rarity? No - Others competing for Curtailable Load opportunities may or may not produce commodities and may or may not lose production forever. Although valuable for Trail in the context of Curtailable Load, this would not be rare. It would be a way for Trail to mitigate risk of unrecoverable production losses caused by load curtailment.
Own hydroelectric generation in BC
A very special resource for Trail Operations is owning a hydroelectric generating
station within BC, in particular for supplying Peak Capacity to BC Hydro to use. It is a
competitive advantage for Trail and a strength.
VRIL Analysis:
• Value? Yes - Physically, when Trail Operations curtails load, generation from its station becomes available for another party to use.
• Rarity? Yes - This resource is rare for an industrial consumer. The only other industrial load that possesses its own large hydroelectric station in BC is the Aluminum Smelter.
• Costly to Imitate? Yes - Imitating this resource is nearly impossible nowadays, given scarcity of suitable locations for large hydroelectric facilities and the fact hydroelectric facilities are highly regulated and rarely for sale.
• Leveraged? No - Currently Trail Operations does not make its generation available to other parties for the purpose of meeting peak demand or as substitute for Curtailable Load.
Own transmission links to BC and US utilities
Another very unique resource for Trail Operations is its transmission network. It is
a strength for Trail Operations and a competitive advantage for supplying Peak Capacity.
VRIL Analysis:
• Value? Yes - Although very short with a total distance covering 45 km, Trail’s transmission lines are in important locations. One 20 km long section runs west from the Waneta Generating Station to Trail Operations, at which point
25
the system also interconnects with the FortisBC grid. Running east from the Waneta Generating Station, a 25 km section links to the Bonneville Power Administration’s grid at the US border. Just before the border, the line also interconnects with BC Hydro’s transmission system. The connections are extremely valuable in making the physical impact of curtailed load or surplus generation from Waneta available to either BC Hydro or to FortisBC.
• Rarity and Costly to Imitate? Yes - Not only does no other industrial load in BC have this, but no other firm could replicate this without extraordinary costs to buy right of ways and to build transmission infrastructure.
• Leveraged? No - At this time, Trail Operations does not leverage this resource for the purpose of making peak capacity available to either FortisBC or to BC Hydro.
Zinc Smelter operates at full capacity
The Electrowinning process at Trail runs at full capacity except during process
upsets and maintenance shutdowns. This aspect is a competitive disadvantage for
Curtailable Load when compared to others that have catch up capacity.
VRIL Analysis:
• Value? No - Trail has no catch up capacity. If there is a call to curtail production to free up Peak Capacity, then unrecoverable production losses will most likely occur. That will be a cost for Trail. The only way for it to be of value would be for the price for curtailment to outweigh the costs of lost production. The costs would have to consider the lost margin for each tonne of lost zinc and co-product, any risks to equipment associated with curtailment, and any penalties for not meeting sales obligations.
Not a direct customer of a public utility
Because Trail Operations owns and operates its own generation and transmission
system, Trail Operations is not a direct customer of any public utility. Overall, this is a
competitive disadvantage for Trail Operations and considered a weakness if competing
against direct customers of the public utilities for Curtailable Load opportunities.
VRIL Analysis:
• Value? No - Trail Operations would not be considered as part of the existing load base of BC Hydro. BC Hydro has neither approached nor likely considered Trail Operations as an option to their approaching problem of a capacity shortfall. BC Hydro may also be less inclined to pay the curtailment rate to a non customer. Existing Curtailment Rate Programs, like Manitoba
26
Hydro’s, offer a credit to their customer. They do not make a payment. Trail Operations would not be eligible to participate directly in BC Hydro’s Load Curtailment Program. Teck and BC Hydro would need to negotiate a different kind of agreement. The agreement would actually be to make generation capacity from Waneta to be available to the utility though curtailing the electrical load at Trail Operations. On the flip side, this could be an attractive option to the utility since it means the utility would not need to inconvenience any of its direct customers by asking them to curtail.
3.4. Summary of Strengths and Weaknesses of Firm in the Industry
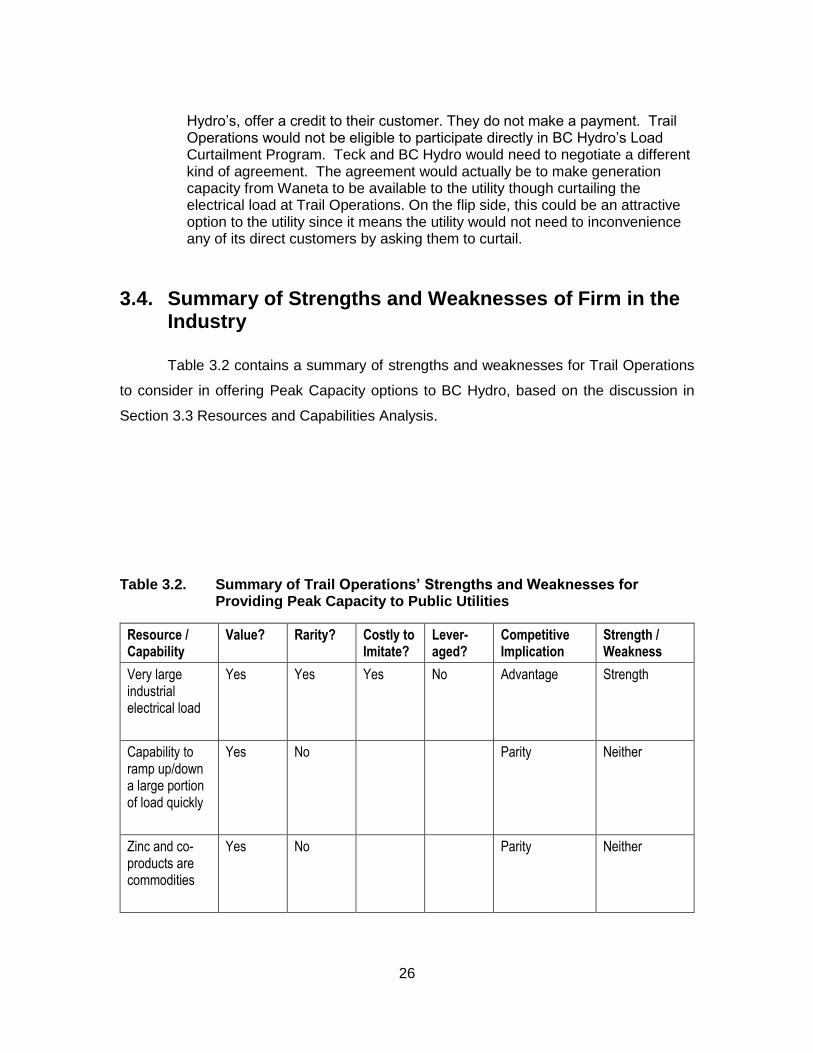
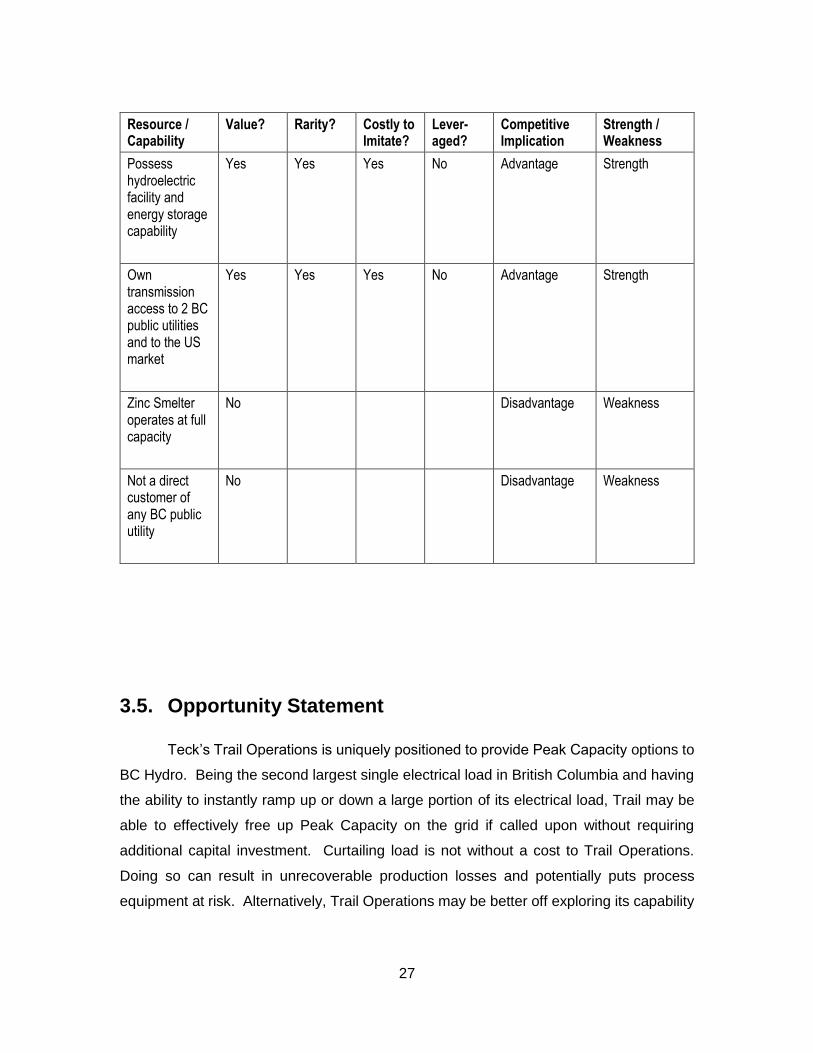
Table 3.2 contains a summary of strengths and weaknesses for Trail Operations
to consider in offering Peak Capacity options to BC Hydro, based on the discussion in
Section 3.3 Resources and Capabilities Analysis.
Table 3.2. Summary of Trail Operations’ Strengths and Weaknesses for Providing Peak Capacity to Public Utilities
Resource / Capability
Value? Rarity? Costly to Imitate?
Lever-aged?
Competitive Implication
Strength / Weakness
Very large industrial electrical load
Yes Yes Yes No Advantage Strength
Capability to ramp up/down a large portion of load quickly
Yes No Parity Neither
Zinc and co-products are commodities
Yes No Parity Neither
27
Resource / Capability
Value? Rarity? Costly to Imitate?
Lever-aged?
Competitive Implication
Strength / Weakness
Possess hydroelectric facility and energy storage capability
Yes Yes Yes No Advantage Strength
Own transmission access to 2 BC public utilities and to the US market
Yes Yes Yes No Advantage Strength
Zinc Smelter operates at full capacity
No Disadvantage Weakness
Not a direct customer of any BC public utility
No Disadvantage Weakness
3.5. Opportunity Statement
Teck’s Trail Operations is uniquely positioned to provide Peak Capacity options to
BC Hydro. Being the second largest single electrical load in British Columbia and having
the ability to instantly ramp up or down a large portion of its electrical load, Trail may be
able to effectively free up Peak Capacity on the grid if called upon without requiring
additional capital investment. Curtailing load is not without a cost to Trail Operations.
Doing so can result in unrecoverable production losses and potentially puts process
equipment at risk. Alternatively, Trail Operations may be better off exploring its capability
28
to free up Dispatchable Generation from the Waneta Generating Station for BC Hydro to
use. The remainder of the paper will identify and evaluate alternatives further.
29
Chapter 4. Opportunity Analysis
This Chapter will explore three alternatives for Teck to supply either Dispatchable
Generation or Curtailable Load to BC Hydro for the purpose of meeting their regulatory
obligation to be electricity self-sufficient by 2016.
4.1. Alternatives
Three alternatives are considered:
1. Offer Surplus Generation Up to 10 MW
2. Offer Curtailable Load Up to 32 MW
3. Offer Generation Swap Up To 225 MW
Each is explained more fully in the following sections 4.1.1 to 4.1.3.
4.1.1. Alternative 1: Offer Surplus Generation Up to 10 MW
Despite selling most of its surplus electricity to BC Hydro in 2009 (Teck Resources
Ltd., 2009 ), Trail Operations retains a small amount of residual surplus generation
capacity. Currently, Trail Operations utilizes this surplus capacity to schedule sales of
surplus energy. The surplus capacity averages 10 MW in the winter, when the need for
Peak Capacity in BC is expected to be greatest.
Offering surplus capacity rights means there is no impact to metal production for
Trail Operations, assuming production levels stay the same as today. For this alternative,
the cost to Trail Operations would be the opportunity cost of not using that capacity to sell
surplus energy to the market. During the time of the day when Peak Capacity would
typically be required, the price Trail Operations could get for the electricity would be the
Mid-Columbia (Mid-C) On-Peak price minus the cost of transmission ($4.00 per MWh). If
the electricity could not be sold during On-Peak, it could be sold later that night during the
30
Off-Peak hours. Therefore, the lost opportunity cost for Trail Operations of not using the
surplus Peak Capacity would be the difference between the On-Peak and Off-Peak prices.
The lost opportunity cost would be as follows:
• Willingness to Pay (2016): $41,000 / MW for 1,600 hrs of curtailment rights
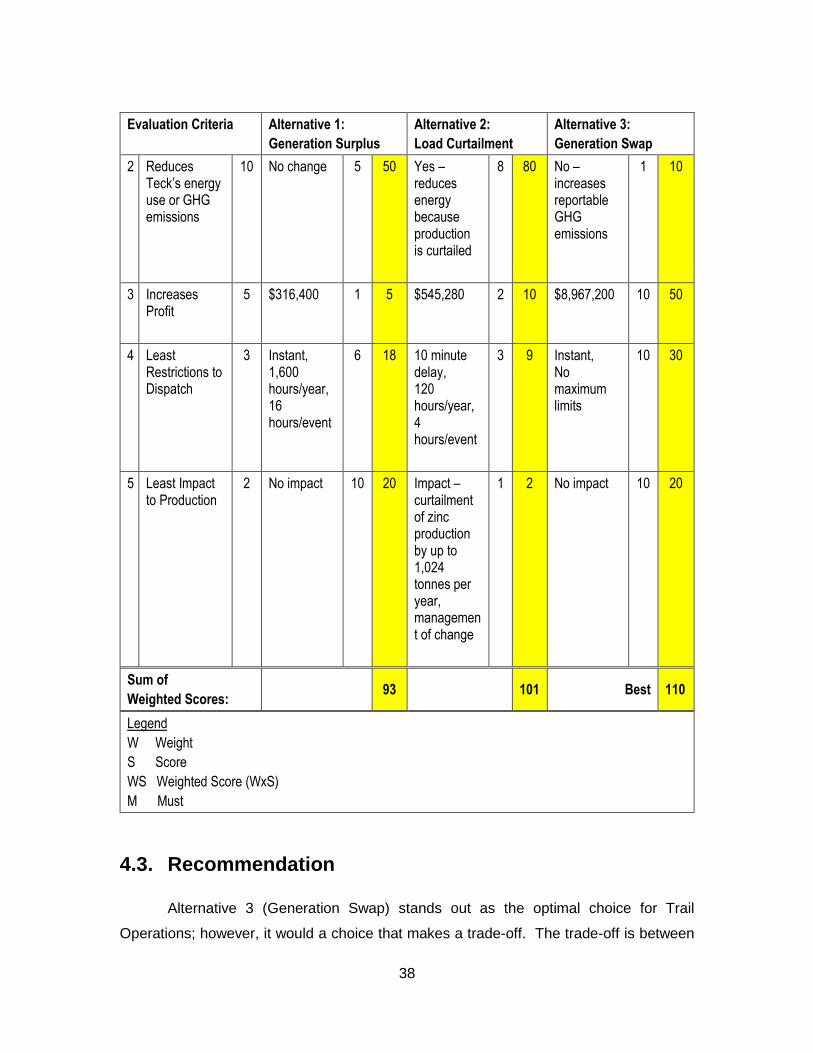
2 No impact 10 20 Impact – curtailment of zinc production by up to 1,024 tonnes per year, management of change
1 2 No impact 10 20
Sum of
Weighted Scores: 93 101 Best 110
Legend
W Weight
S Score
WS Weighted Score (WxS)
M Must
4.3. Recommendation
Alternative 3 (Generation Swap) stands out as the optimal choice for Trail
Operations; however, it would a choice that makes a trade-off. The trade-off is between
39
profitability for Trail Operations and reportable GHG emissions. The trade-off is not trivial.
Increasing reportable GHG emissions goes against Teck’s established GHG reduction
goal. However, the potential to increase profitability of Trail Operations by almost $9
million per year for Trail is also significant. To put it in perspective, gross profit for Trail
Operations in 2014 was $76 million (Teck Resources Ltd., 2015, p. 28). The additional
contribution from a Generation Swap means an immediate 12% increase, with no capital
expenditure. Furthermore, the additional revenue would increase Trail’s financial capacity
to fund other social and environmental improvement projects. Thus, this author
recommends for Teck to consider offering a Generation Swap to BC Hydro.
40
Chapter 5. Implementation
The recommendation to offer the Generation Swap of Up to 225 MW to BC Hydro
requires no organizational change within Teck. The challenge in implementation will be
negotiating with internal stakeholders and inducing the interest of BC Hydro.
5.1. Internal Stakeholders
The first step is to discuss the idea internally at Teck, in particular with Environment
and Public Affairs representatives. Their support is needed given the trade-off between
reportable GHG emissions and increasing profitability. The first task will be to calculate
exactly how much reportable emissions will change if Trail’s electricity consumption profile
changes from 100% hydroelectricity to 97% hydroelectricity and 3% derived from fossil
fuels.
Regardless of how big the increase will be, this author anticipates that there will
be pushback because it goes against one of Teck’s Strategy for Sustainability goals. As
stated in Section 4.4, one reason to proceed is that the additional revenue from a
Generation Swap will increase Trail’s financial capacity to fund other social and
environmental improvement projects such as Trail’s Smelter Recycles Building (Teck
Metals Ltd., 2014) and Ground Water Treatment Plant (Teck Metals Ltd., 2015). Looking
at it as balanced approach is consistent with Teck’s overall Business and Sustainability
Strategy (Teck Resources Ltd., 2014).
In addition, another projects could be considered to offset the GHG increase. For
example, a portion of the additional profit could go to funding the installation of
Microhydroelectric Turbines on the raw water outflows at Trail Operations (Appendix A).
This project has been uneconomical to justify in the past using market electricity prices.
The installation cost for turbines is roughly $1.5 million, but they have the potential to
reduce energy use by 90,000 MWh over their lifetime. Using a portion of the revenue
41
from the Generation Swap for conservation projects like the Microhydro Turbines is
actually better than Alternative 2 (Load Curtailment) because it results in a sustained
efficiency improvement.
5.2. External Stakeholders
If the idea is endorsed internally, then the idea can be floated to BC Hydro. The
challenge at this step is to induce their interest. The incentive programs being developed
by BC Hydro for Curtailable Load are aimed at their direct customers (BC Hydro, 2014).
Why would they want to engage with an outside party?
The author’s answer is that it is the best alternative for BC Hydro to meet their
capacity shortfall in the short term. The deal would provide them with:
• Rights to 225 MW of additional made-in-BC generation during peak demand
• A cheaper and quicker alternative compared to capital projects
• A more dependable and convenient alternative compared to load curtailment
Teck would need assurances that electricity supply to Trail Operations would not
be interrupted, and BC Hydro’s electricity marketer would need take care of the swaps in
real time at no cost to Teck.
If they are interested, then the next step is to negotiate a contract. On both sides,
development of the contract would involve legal counsel. It would also require a review of
existing transmission and generation contracts to ensure there is nothing that conflicts
with a Generation Swap arrangement.
The bulk of the effort in implementing the Generation Swap is contract reviews and
negotiation. There is no organizational change, so no management of change effort is
required. However, Teck should be prepared to manage external stakeholder
perceptions. Even though Teck is not a public utility, the deal would be made with a public
utility so aspects would be made public and scrutinized. Teck should be prepared to
respond to inquiries from the public and the media.
42
43
Chapter 6. Conclusion
In conclusion, BC Hydro is currently exploring options for increasing its Peak
Capacity due to regulatory obligations to achieve electricity self-sufficiency and a projected
shortfall of generation capacity of up to 300 MW before 2024. Using Porter’s Five Force
Analysis of the need for Peak Capacity in BC, this author thinks there could be a
commercial opportunity to provide BC Hydro with Curtailable Load or Dispatchable
Generation. Initially, the price paid is expected to be $41,000 per MW per year for
Curtailable Load and likely more for Dispatchable Generation.
The genesis for this strategic analysis was to consider the opportunity for Teck’s
Trail Operations to provide Curtailable Load to BC Hydro. After reviewing the strengths
and weaknesses of the firm, it became evident that Trail could offer other alternatives to
the utility that were more dependable and convenient. The two additional alternatives
were to offer Trail’s Generation Surplus or to swap BC Hydro’s imports with Trail’s own
made-in-BC Generation at times when there was not enough capacity to meet demand in
BC.
The alternatives were evaluated based on criteria that it must comply with the
Clean Energy Act, it should reduce energy use and GHG emissions, it should increase
profitability for Trail Operations, and it should be convenient to manage. The result of the
evaluation showed that the Generation Swap had the greatest overall potential for Trail,
despite the trade-off that that it would increase reportable GHG emissions. It is anticipated
that the emissions could be offset by other social and environmental improvement projects
that Trail could take on using the additional profit, an approach that this author thinks fits
with Teck’s Business and Sustainability Strategy. Based on rates for Load Curtailment in
the industry, the Generation Swap could increase Trail’s profit by $9 million per year.
44
References
B.C. Ministry of Energy and Mines. (2010). BILL 17 — 2010: Clean Energy Act. Retrieved February 28, 2015, from https://www.leg.bc.ca/39th2nd/1st_read/gov17-1.htm
Barnes, A. (2008, November 20). Teck Reduces Zinc Production in Response to Global Recession. Retrieved June 6, 2015, from Rossland Telegraph: http://rosslandtelegraph.com/node/1334#.VXOrhM9Vikp
BC Government. (n.d.). The BC Energy Plan: A Vision for Clean Energy Leadership. Retrieved June 6, 2015, from http://www.energyplan.gov.bc.ca/PDF/BC_Energy_Plan.pdf
BC Hydro. (2013a, November 15). Chapter 2: Load-Resource Balance. Retrieved February 22, 2015, from Integrated Resources Plan: https://www.bchydro.com/energy-in-bc/meeting_demand_growth/irp/document_centre/reports/november-2013-irp.html
BC Hydro. (2013b, November 15). Chapter 9: Recommended Actions. Retrieved February 22, 2015, from Integrated Resources Plan: https://www.bchydro.com/energy-in-bc/meeting_demand_growth/irp/document_centre/reports/november-2013-irp.html
BC Hydro. (2014, June 27). Load Curtailment / Interruptible Rate. Retrieved June 6, 2015, from Meeting Summary: https://www.bchydro.com/content/dam/BCHydro/customer-portal/documents/corporate/regulatory-planning-documents/regulatory-matters/capacity-discussion-with-ampc-june-2014.pdf
BC Hydro. (2015a, May 1). IPP Supply List – In Operation. Retrieved June 6, 2015, from https://www.bchydro.com/content/dam/BCHydro/customer-portal/documents/corporate/independent-power-producers-calls-for-power/independent-power-producers/ipp-supply-list-in-operation.pdf
BC Hydro. (2015b). Why Site C: Cost Estimate. Retrieved June 6, 2015, from https://www.sitecproject.com/why-site-c/cost-estimate
Hilts, S. (2010, June). Improvements to Riverbank below Teck . Retrieved October 26, 2013, from Panoramio: Google Maps: http://www.panoramio.com/photo_explorer#view=photo&position=1&with_photo_id=37339740&order=date_desc&user=2350328
Kepner, C. H., & Tregoe, B. B. (1997). The New Rational Manager. Kepner Tregoe.
45
Manitoba Hydro. (2015, January 23). Appendix 6.11. Retrieved March 6, 2015, from Report to the Public Utilities Board: Curtailable Rate Program: http://www.hydro.mb.ca/regulatory_affairs/electric/gra_2014_2015/pdf/appendix_6_11.pdf
Porter, M. E. (2008, January). The Five Competitive Forces That Shape Strategy. Harvard Business Review, pp. 78-93.
Statistics Canada. (2011). Households and the Environment: Energy Use. Retrieved June 6, 2015, from http://www.statcan.gc.ca/pub/11-526-s/2013002/tablesectlist-listetableauxsect-eng.htm
Teck Metals Ltd. (2014, September 10). Teck Trail Operations Announces Construction of New Facility to Reduce Dust and Improve Community Air Quality. Retrieved June 6, 2015, from News Releases: http://www.teck.com/Generic.aspx?PAGE=Teck+Site%2fMedia+Pages%2fMedia+Detail&releaseNumber=3&portalName=tc
Teck Metals Ltd. (2015, March 3). Teck Trail Operations Begins Construction of Groundwater Treatment Plant. Retrieved June 2015, 6, from News Releases: http://www.teck.com/Generic.aspx?PAGE=Teck+Site%2fMedia+Pages%2fMedia+Detail&releaseNumber=5&portalName=tc
Teck Resources Ltd. (2009 , June 17). Teck Announces Proposed Sale of One-Third Interest in Waneta Dam. Company News Release. Vancouver, BC: Teck Resources Ltd.
Teck Resources Ltd. (2015, February 12). 2014 Fourth Quarter Results. Retrieved June 2015, from News Release: http://www.teck.com/res/tc/documents/_ces_portal_meta/downloads/investors/quarterly%20shareholder%20report/q4_2014_report_february_12.pdf
U.S. Energy Information Administration. (2013, December 12). Table 8.9.B. Winter Net Internal Demand, Capacity Resources, and Capacity Margins by North American Electric Reliability Corporation Assessment Area, 2012 Actual, 2013-2017 Projected. Retrieved February 28, 2015, from Demand, capacity resources, and capacity margins: http://www.eia.gov/electricity/data.cfm#demand
Wikipedia. (2015a). Revelstoke Dam. Retrieved June 6, 2015, from Wikipedia, the free encyclopedia: http://en.wikipedia.org/wiki/Revelstoke_Dam
Wikipedia. (2015b). VRIO. Retrieved June 6, 2015, from http://en.wikipedia.org/wiki/VRIO
46
Wood Mackenzie. (2015, February 17). Top of the league - But why? A review of zinc smelter cost leagues. Insight. Wood Mackenzie Ltd.
47
Appendix A. Hydroelectric Turbines on Raw Water Outflows
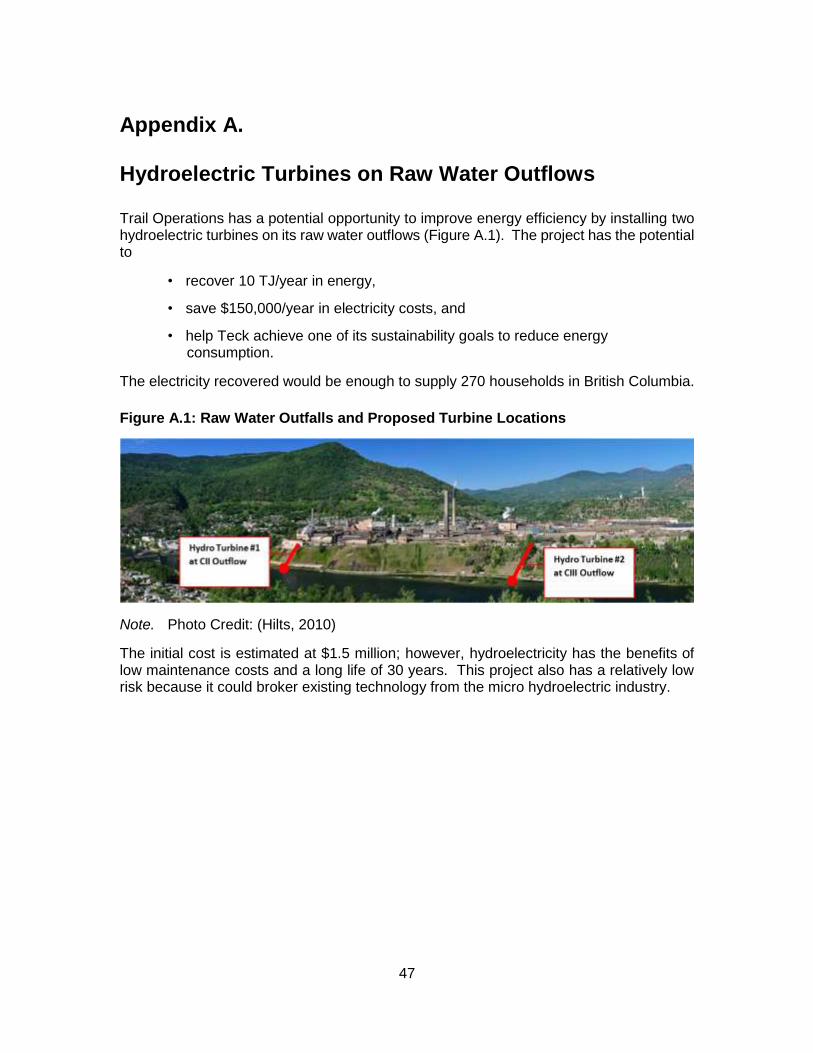
Trail Operations has a potential opportunity to improve energy efficiency by installing two hydroelectric turbines on its raw water outflows (Figure A.1). The project has the potential to
• recover 10 TJ/year in energy,
• save $150,000/year in electricity costs, and
• help Teck achieve one of its sustainability goals to reduce energy consumption.
The electricity recovered would be enough to supply 270 households in British Columbia.
Figure A.1: Raw Water Outfalls and Proposed Turbine Locations
Note. Photo Credit: (Hilts, 2010)
The initial cost is estimated at $1.5 million; however, hydroelectricity has the benefits of low maintenance costs and a long life of 30 years. This project also has a relatively low risk because it could broker existing technology from the micro hydroelectric industry.