245
TALEH ZIYADOV JUNE 2011 Strategic Assessment of Euro‐Asian Trade & Transportation Azerbaijan as a Regional Hub in Central Eurasia
| Date post: | 08-Feb-2017 |
| Category: |
Documents |
| Upload: | hoangquynh |
| View: | 233 times |
| Download: | 9 times |
TALEH ZIYADOV
JUNE 2011
Strategic Assessment of Euro‐Asian Trade & Transportation
Azerbaijan as a Regional Hub in Central Eurasia

Strategic Assessment of Euro‐Asian Trade and Transportation
Azerbaijan as a Regional Hub in Central Eurasia
TALEH ZIYADOV
June 2011
Publisher Information (TBD): Azerbaijan Diplomatic Academy Baku, Azerbaijan Johns Hopkins University Washington, DC Please cite this work as: ….. ….
Cover Photo: Design Concept of New International Terminal at Heydar Aliyev International Airport in Baku, Azerbaijan. Courtesy of ARUP Engineering Company.
ISBN: Copyright ©
AZERBAIJAN AS A REGIONAL HUB IN CENTRAL EURASIA
TABLE OF CONTENTS
TABLE OF CONTENTS .......................................................................................................................................... V
PREFACE ........................................................................................................................................................... IX
ACKNOWLEDGEMENTS ................................................................................................................................... XIII
FOREWORD ...................................................................................................................................................... IX
EXECUTIVE SUMMARY ...................................................................................................................................... IX
ABBREVIATIONS ............................................................................................................................................. XVII
FIGURES & MAPS ............................................................................................................................................ XXI
TABLES .......................................................................................................................................................... XXIII
INTRODUCTION.................................................................................................................................................. 1
PART I: EURO‐ASIAN TRADE: THE BIG PICTURE ................................................................................................... 7
THE EURO‐ASIAN TRADE AND CENTRAL EURASIA ................................................................................................................. 9
The Euro‐Asian Trade: Overview ........................................................................................................................... 9 The EU‐China Trade .......................................................................................................................................................... 12 The EU‐ASEAN Trade ........................................................................................................................................................ 14 The EU‐India Trade ........................................................................................................................................................... 15
Euro‐Asian Maritime Trade and Containerization .............................................................................................. 17
PART II: ASSESSING THE PRESENT: TRANSPORT, CORRIDORS, AND LOGISTICS IN EURASIA ................................ 21
MOTORWAYS AND RAILWAYS OF AZERBAIJAN .................................................................................................................... 23
Roads and Highways ........................................................................................................................................... 23
Railways .............................................................................................................................................................. 26
EURASIAN TRANSPORT CORRIDORS .................................................................................................................................. 29
The Central Corridor: Transport Corridor Europe, Caucasus, Asia (TRACECA) .................................................... 29 A Limping Leg of the New Silk Road ................................................................................................................................. 29 Truck Transit via TRACECA vs. Alternatives ...................................................................................................................... 33
The Central Route to Afghanistan ............................................................................................................................... 33 The Southern Route ..................................................................................................................................................... 36 The Northern Route .................................................................................................................................................... 37 The Fastest Route ........................................................................................................................................................ 38 Advantages and Disadvantages of TRACECA for Trucking ........................................................................................... 38
TRACECA and Rail Transportation .................................................................................................................................... 40 The Northern Corridors ....................................................................................................................................... 46
Trans‐Eurasian Express (TEE) ............................................................................................................................................ 46 Trans‐Siberian Railway (TSR) ............................................................................................................................................ 48 Trans‐Kazakhstan Routes ................................................................................................................................................. 55
The China Angle ........................................................................................................................................................... 64 The Southern Corridor ......................................................................................................................................... 66
STRATEGIC ASSESSMENT OF EURO‐ASIAN TRADE AND TRANSPORTATION
vi TABLE OF CONTENTS
The North‐South Transport Corridor (NSTC) ....................................................................................................... 74 The Western NSTC Route ................................................................................................................................................. 80
The western NSTC route: Highways ............................................................................................................................ 80 The western NSTC route: Railways .............................................................................................................................. 83
The Eastern NSTC Routes ................................................................................................................................................. 85 MARITIME TRANSPORTATION AND CASPIAN PORTS ............................................................................................................. 89
Overview ............................................................................................................................................................. 89
Caspian Ports ...................................................................................................................................................... 92 Baku .................................................................................................................................................................................. 92 Aktau ................................................................................................................................................................................ 95 Turkmenbashy .................................................................................................................................................................. 99 Astrakhan ....................................................................................................................................................................... 103 Ola .................................................................................................................................................................................. 105 Makhachkala .................................................................................................................................................................. 106 Iranian Ports ................................................................................................................................................................... 107 Anzali ............................................................................................................................................................................ 111 Amirabad ...................................................................................................................................................................... 112 Nowshahr ...................................................................................................................................................................... 113 Neka .............................................................................................................................................................................. 114
LOGISTICS & SUPPLY CHAIN ................................................................................................................................... 116
Logistics Market: Domestic vs. International .................................................................................................... 119
AIR TRANSPORTATION .......................................................................................................................................... 126
Passenger Traffic via Azerbaijan ....................................................................................................................... 127
Air Cargo Traffic via Azerbaijan ........................................................................................................................ 132 Baku Cargo Terminal & Silk Way Airlines ....................................................................................................................... 134
PART III: FREE ECONOMIC ZONES AND PORT DEVELOPMENT IN THE 21ST CENTURY .......................................... 141
FREE ECONOMIC ZONE DEVELOPMENT .......................................................................................................................... 143
FEZ Development in Azerbaijan ........................................................................................................................ 145
Strategic Planning for FEZ Development ........................................................................................................... 149
FEZ Administration and Operation Models ....................................................................................................... 151
Challenges in FEZ Development ........................................................................................................................ 152
THE ALYAT PORT AND 21ST CENTURY PORT DEVELOPMENT ................................................................................................ 155
The Global Port Industry and Port Reform Process ........................................................................................... 156
Main Actors in Port Development ..................................................................................................................... 157
Port Management Models ................................................................................................................................ 158
Modes and Forms of Privatization .................................................................................................................... 161
Global Operators and Global Shipping Lines ..................................................................................................... 165
The New Baku International Sea and Trade Port at Alyat ................................................................................ 169
The Alyat Port and Hinterland Development .................................................................................................... 172
PART IV: A PATH TO SUCCESS .......................................................................................................................... 177
VISION FOR AZERBAIJAN: A BIRD’S EYE VIEW .................................................................................................................. 179
Overview ........................................................................................................................................................... 179
FREE ECONOMIC ZONE CONCEPT FOR AZERBAIJAN ........................................................................................................... 183
PSA‐type Legal Regime and FEZ Development .................................................................................................. 183
A Marketable Product/Project .......................................................................................................................... 184
AZERBAIJAN AS A REGIONAL HUB IN CENTRAL EURASIA
TABLE OF CONTENTS vii
The Jewel of the Caspian: The Alyat Project ................................................................................................................... 184 Eurasian Aviation & Logistics Hub: Baku International Airport FEZ ................................................................................ 186
Stability and Political Support ........................................................................................................................... 187
A FINAL WORD .......................................................................................................................................................... 187
ABOUT THE AUTHOR ....................................................................................................................................... 189
APPENDICES .................................................................................................................................................... 191
APPENDIX A: MAP OF AZERBAIJAN ............................................................................................................ 191
APPENDIX B: IRU’S NELTI CORRIDORS ........................................................................................................ 192
APPENDIX C: MAJOR ONGOING & COMPLETED RAILWAY PROJECTS IN IRAN .......................................... 193
APPENDIX D: DISTANCES AND STEAMING TIMES BETWEEN CASPIAN PORTS ............................................ 195
NOTES............................................................................................................................................................. 197

STRATEGIC ASSESSMENT OF EURO‐ASIAN TRADE AND TRANSPORTATION
viii TABLE OF CONTENTS
AZERBAIJAN AS A REGIONAL HUB IN CENTRAL EURASIA
PREFACE
The present study is the result of a year‐long research project commissioned by the Azerbaijan
Diplomatic Academy as part of its “Azerbaijan 2025” series. The official start date of the
research is May 2010, though my personal interest in the subject goes back to 2006, when I first
authored a chapter on Azerbaijan’s transport sector for The New Silk Roads: Transport and
Trade in Greater Central Asia (published by the Central Asia‐Caucasus Institute at the Johns
Hopkins University in 2007). The initial goal of this study was to assess current and potential
Euro‐Asian trade and transportation links and answer one simple question: What are
Azerbaijan’s chances of becoming a transportation hub in Eurasia?
The aim was to do an in‐depth investigation of Euro‐Asian commerce and to produce an
independent and comprehensive work on how, if at all, Azerbaijan could be developed into a
transportation hub in Eurasia. Soon, as I got deeper into the research, I became convinced that
the issue of transportation cannot be studied in isolation from Azerbaijan’s overall
development strategy, in general, or from its non‐oil economy in particular. For this reason the
study you are about to read is no longer merely an assessment of the transportation sector per
se, but a comprehensive blueprint for Azerbaijan’s grand hub vision that goes beyond the issue
of transportation. This vision requires an integrated ‘bird’s eye approach’ in developing the
non‐oil economy in a way that mobilizes all of the country’s resources and projects towards
achieving one goal: Building Azerbaijan of 2030.
Once a vibrant route for the Silk Road trade, Central Eurasia is poised to regain its historical role
as a commercial bridge between east and west, north and south. Azerbaijan has the
ingredients to become one of the major commercial and transportation hubs in the region and
to be the country that facilitates regional transformation. Its location, abundance of natural
resources and dynamic new generation will help realize this vision. But for this vision to unfold,
one must have a clear understanding of the vision itself and how to achieve it. The present
study will offer one of many views about what this vision of the future might be and how it
could be successfully implemented. The ideas sketched out here are by no means set rules and
should not be viewed as fixed propositions. It is rather a logical framework analysis that has
been built upon a year‐long investigation in attempt to contribute to the understanding and
development of Azerbaijan’s hub vision.
The question of envisaging the future of Azerbaijan and the region of which it is part has been
at the heart of this study, thus, its main focus is on transportation, logistics and issues
associated with non‐oil sector development such as Free Economic Zones (FEZ). I hope that I
STRATEGIC ASSESSMENT OF EURO‐ASIAN TRADE AND TRANSPORTATION
x PREFACE
have done due diligence when drafting the hub strategy for Azerbaijan and while examining the
structure of Euro‐Asian commerce, comparing alternative Eurasian land corridors, transport
and logistics sectors and proposing the FEZ concept for the country.
Audience
The findings of the study are aimed at the decision makers in the Republic of Azerbaijan as well
as other countries of Central Eurasia. Although it focuses on a particular hub strategy for
Azerbaijan, the analyses presented here go beyond a single state and are equally relevant to
any other regional state that aspires to become a transportation hub in Eurasia. The sections of
the study that assess the Euro‐Asian trade and transportation linkages (Part I), Eurasian
corridors and the region’s land‐, air‐ and maritime‐based trade, transportation and logistics
networks (Part II) and the FEZ and port development (Part III) will be interesting for regional
specialists, transportation and logistics experts, government officials, business people, and
students of economics, area studies, and political science.
Methodology
The study has drawn on primary and secondary sources in English, Russian, Turkish, Persian and
Azerbaijani and has built its core empirical analysis on several field trips and more than 100
interviews (in person, by phone or by email) with transport and logistics experts, trade
specialists, representatives of international organizations and private sector, government
officials, academics, freight forwarders, truck drivers, port authorities, and ordinary citizens. A
considerable part of the study is dedicated to the interpretation of statistical data collected
from existing databases as well as from the interviews and surveys conducted during the
research.
Note on Statistics
Working with statistical data is challenging and doing so with the official data of regional
countries is even more so. Although little can be done to improve or guarantee the accuracy of
published official statistics, I have nonetheless tried to crosscheck official data with statistics
collected by myself from other government agencies, private institutions, or interviewees.
There are some discrepancies that I have addressed by adding explanatory footnotes. It is
important also to be aware that fiscal years of some countries differ. For example, the trade
statistics on EU‐India may appear to differ depending on the source of the data. While most
statistics cover the period from January 1 to December 31 of the year, the Indian financial
calendar (like the Iranian financial calendar) runs from April to March. Therefore, if trade data is
provided by the Indian government and indicated as “2008‐2009”, it implies the period from 1
AZERBAIJAN AS A REGIONAL HUB IN CENTRAL EURASIA
PREFACE xi
April 2008 till 31 March 2009. These differences have been noted at various points to minimize
the risk of confusion.
Definitions and Terminology
A few terms and definitions need clarification. Additional terms can be found in the Glossary.
Central Eurasia: Although the term “Central Eurasia” has a number of different definitions, in
this study it refers to eight Eurasian countries, namely the three South Caucasus states of
Armenia, Azerbaijan, and Georgia and the five Central Asian states of Kazakhstan, Kyrgyzstan,
Tajikistan, Turkmenistan, and Uzbekistan.
Hub: A hub here means simply a center or focal point of activity.
Hub Vision or Hub Strategy: Terms such as “grand hub strategy” or “future hub vision” are used
interchangeably to mean the strategy of developing the country as a major trade,
transportation and logistics center in the region. Such a strategy encompasses and includes
other sector‐specific hub strategies such as transportation, aviation or logistics. When referring
to a particular hub strategy, a specific limiting term will be used (e.g. transportation hub
strategy).
Relay Hub: The term “relay hub” is used to describe a place that acts as a transiting point for
cargo or passenger shipments.
Hub and Spoke: The term “hub and spoke” refers to an area that acts as a major distribution
center for freight or passenger traffic. Such centers operate as regional focal points for many
businesses and airline carriers. Services offered at the ‘hub and spoke’ center go beyond transit
shipments and could involve re‐distribution, consolidation, labeling, packaging and so on.
Intermodal or Multimodal Transportation: Transportation that involves more than one mode of
transport such as air, rail, sea and road.
Currency Signs
Several currency signs are used throughout the study. All “$” signs refer to US Dollars, while “€”
is for Euro. The national currency of Azerbaijan is “Azerbaijani manat” indicated as “AZN” (1
AZN = $1.25 or €0.87).
Taleh Ziyadov Cambridge, UK May 31, 2011

STRATEGIC ASSESSMENT OF EURO‐ASIAN TRADE AND TRANSPORTATION
AZERBAIJAN AS A REGIONAL HUB IN CENTRAL EURASIA
ACKNOWLEDGEMENTS
It was at the Azerbaijan Diplomatic Academy (ADA), an institution that is very close to my heart,
that the idea of this research was first conceived a few years ago. I am grateful for the support
and assistance I have received from the ADA while conducting this research. This study would
have been incomplete if not for the crucial interventions at different stages by the ADA Rector,
Ambassador Hafiz Pashayev. He acted as a facilitator, motivator, and mentor, never turning
down my frequent requests for help with setting up meetings or getting much‐needed
statistical data or interviewing important state officials. Moreover, Ambassador Pashayev was
the person who convinced me to undertake this important research when I hesitated. I
therefore thank him for his foresight and kind attention throughout the making of this study. I
am also grateful for the encouragement and support of other colleagues at the ADA, including
Galib Mammad, Fariz Ismailzade, Murad Ismayilov, and Turgut Mustafayev, and of ADA faculty,
including Elkin Nurmammadov, Elnur Soltanov, Kavus Abushov and Anar Valiyev.
Special thanks go to a regional guru, Professor Frederick Starr at the Johns Hopkins University,
who has acted as an academic advisor for this research. I have benefited greatly from his
constructive comments and interesting observations. In addition, a number of background case
studies have contributed to the conceptual framework of this work. I am especially grateful to
James Graham for his analysis on Europe‐China freight activity and for his comments and
reviews, and to Erdal Erkut, who investigated the opportunities for Azerbaijan in the logistics
sector and has commented on the logistics section of the study. I would like to express my
gratitude to Professor Gulshan Sachdeva at Jawaharlal Nehru University (India) for sharing his
work on EU‐South East Asia trade linkages and for assisting with finding statistics on EU‐India
trade. A number of people have reviewed parts of the study and have shared their opinions. In
particular, I am grateful to Pablo Ruiz Del Real, Michel Gueriot, Jan Tomczyk, Emin Huseynov,
Nijat Valiyev, Hadji Huseynov and Jamil Manizade for their comments and suggestions.
I would also like to acknowledge a number of individuals, institutions, and agencies that have
made this study possible. Several public agencies and private sector representatives in
Azerbaijan have provided valuable assistance during the research. I would like to mention Akif
Mustafayev, Azerbaijan’s National Secretary at the European Commission’s TRACECA program,
Elman Aliyev and Rafael Mirgulamov at the Port of Baku, Ilham Mammadov at CASPAR, Jamil
Manizade at AZAL, Ilgar Alekperov and Vugar Zeynalov at Baku Cargo Terminal; and Anar
Rzayev at Van der Wal Company – Azerbaijan. Despite their busy schedule, they have always
found time to discuss my questions and have been encouraging throughout the process. Thanks
STRATEGIC ASSESSMENT OF EURO‐ASIAN TRADE AND TRANSPORTATION
xiv ACKNOWLEDGMENTS
also go to Musa Panahov, Sadraddin Mamadov, Ravil Iskenderov, and Qafqaz Adigozelov (MoT);
Aqil Usubov (State Customs Committee); Niyazi Safarov and Fakhri Hasanov (MED); Elnur
Aslanov (Office of President); Ayaz Bayramov and Aysel Askerova (MCIT); Vahid Aliyev (Port of
Baku); Yusif Yusifov and Anar Orujov (State Statistical Committee); Mikayil Jabbarov and Samir
Nuriyev (Administration of State Historical‐Architectural Reserve Icherisheher); Nazim
Mammadov (CASPAR); Teymur Mammadov and Ilgar Mustafayev (ADY); Bulent Karani and
Ismet Kale (Azerinshaat); Nurid Aliyev and Movsum Muslum‐zada (Caspian Logistics); David H.
Watkins and Amin Melikzadeh (Royal Haskoning); Akif Babayev and Javanshir Askerov (A‐
Logistics), and Nigar Resulova (AZPROMO).
I have benefited greatly from the views of international experts and specialists in the field who
have contributed to my learning and knowledge. I would like to thank Gohkan Akinci at
International Finance Corporation (IFC) for his valuable insight about the FEZ development. A
word of thanks also goes to members and participants of UNECE and OSCE Inter‐Regional
Workshops on developing Euro‐Asian Transport Links (EATL), including Michalis Adamantiadis,
Robert Nowak, Jan Tomczyk, Azer Tagiyev, Anthony Pearce, Gabriel Leonte, Stig Nerdal, Erik
Evtimov, Professor Dimitrios A. Tsamboulas, Panayota Moraiti, Constantinos Alexopoulos,
Mohammad Mirzaei Kahagh, Tahir Aliyev and Abdusamad Muminov (Uzbekistan), Yazgeldi
Nazarov and Davut Pomanov (Turkmenistan), Alexey Alekseev (Russia), Murat Bekmagambetov
(TRACECA‐Kazakhstan), Abdulhakim Tohirov (Tajikistan), Marc Abeille, and Helmut Meelich.
In addition, I want to express my appreciation to Professor Mehmet Tanyaş, Jawad Kamel,
Fereydun Kousedghi, Hamed Kazemzadeh, Mehdi Hoseini Taghi Abad, Khalil Karimi, Abbas
Maleki, Brenda Shaffer, Nariman Mamedov, John Wensveen, Muzaffar Behlulov, Valerian
Akhalaia, Fariz Rzayev, George Katcharava, David Abesadze, Irakly Chkhenkely, Mamuka
Tsereteli, Udo Witulski, Yves Goulin, Marcel Sames, Radoslaw Wegrzyn, Christos Kostopoulos,
Svante Cornell, Solmaz Rustamova‐Tohidi, Goshqar Goshqarli, Azer Mursagulov, Afgan Isayev,
Fahrettin Yagci, Thomas Farole, Stephan Baertges, Nurzhan Zhambekov, Khayal Rahbarli, Ali
Gara, Said Ismayil, Ismayil Hasanov, Abbas Hummatov, Olga Smirnova, Olga Frolova, Vadim
Fedoseev, David Owens, Tolkyn Yerkinkyzy, Sally Marshak, Bayram Atayev, Jeyhun Mammadov
and Farid Ahmadov.
Finally, I am grateful to Celia Davies for her meticulous editing of the entire manuscript, which
has improved it greatly. Also thanks to Vincent Ercolano and James Graham for their editing
contributions to parts of this study. I claim responsibility for any oversights and shortcomings.

AZERBAIJAN AS A REGIONAL HUB IN CENTRAL EURASIA
FOREWORD

AZERBAIJAN AS A REGIONAL HUB IN CENTRAL EURASIA
EXECUTIVE SUMMARY

AZERBAIJAN AS A REGIONAL HUB IN CENTRAL EURASIA
ABBREVIATIONS
ABADA – Azerbaijan International Road Carriers Association ADA – Azerbaijan Diplomatic Academy ADB – Asian Development Bank ADC – Alyat FEZ Development Corporation ADDY – Azerbaijan State Railways Company (predecessor of ADY) ADIF – Administrator of Spanish Railway Infrastructures ADY – Azerbaijan Railways JSC AIC – Azerbaijan Investment Company AIOC – Azerbaijan International Operating Company ALG – Advanced Logistics Group AMTRAK – The US National Railroad Passenger Corporation ASK – Available Seat‐Kilometers ASEAN – Association of Southeast Asian Nations ATI – Air Transport Intelligence AZAL – Azerbaijan National Airlines AZN – Azerbaijani manat (currency code) AZPROMO – Azerbaijani Export & Investment Promotion Foundation BAH – Booz Allen Hamilton BAM – Baikal‐Amur Mainline BCT – Baku Cargo Terminal BIADC – Baku International Airport FEZ Development Corporation BISP – Baku International Sea Port BOO – Build‐Own‐Operate BOOT – Build‐Own‐Operate and Transfer BOT – Build‐Operate‐Transfer bpd – Barrels per day BRIC – Brazil, Russia, India and China BTC – Baku‐Tbilisi‐Ceyhan pipeline BTK – Baku‐Tbilisi‐Kars railway project CACI – Central Asia‐Caucasus Institute (CACI) at Johns Hopkins University CAREC – Central Asia Regional Economic Cooperation CASPAR – The Azerbaijan State Caspian Sea Shipping company CCTT – Coordinating Council on Transsiberian Transportation CFS – Container Freight Stuffing CIS – Commonwealth of Independent States CIM – Uniform Rules concerning the Contract of International Carriage of Goods by Rail CIT – International Rail Transport Committee CJSC – Closed Joint Stock Company CPC – Caspian Pipeline Consortium
STRATEGIC ASSESSMENT OF EURO‐ASIAN TRADE AND TRANSPORTATION
xviii ABBREVIATIONS
CPMM – CAREC Corridors Performance Measurement and Monitoring CRCT – China Railway Container Transport Corporation CRIMT – China Railway International Multimodal Transport CROS – Caspian Sea Republics’ Oil Swap Project DB – Deutsche Bahn DWT – Deadweight Tonnage EATL – Euro‐Asian Transport Links (UNECE) EBRD – European Bank for Reconstruction and Development EC – European Commission ECO – Economic Cooperation Organization EMS – Environmental Management System EPZ – Export Processing Zones EU – European Union EurAsEC – Eurasian Economic Community FCL – full container load FDI – Foreign Direct Investment FEZ – Free Economic Zone ft – feet FTK – Freight Ton‐Kilometers FTZ – Free Trade Zones GDP – Gross domestic product GPS – Global Positioning System GSP+ – Generalized System of Preferences plus GYD – Heydar Aliyev International Airport, Baku ha – hectare HPH – Hutchison Port Holdings IATA – International Air Transport Association IBRD – The International Bank for Reconstruction and Development ICD – inland container depot ICT – information and communications technology IGC – Intergovernmental Commission ILC – International Logistics Center IsDB – Islamic Development Bank IRU – International Road Transport Union ISO – International Organization for Standardization IT – Information Technology JSC – Joint Stock Company JV – Joint Venture km – Kilometer km/h – Kilometers per hour KMS – Kaveh Marine and Services of Islamic Republic of Iran KTS – Kaztransservice KTZ – Kazakhstan Temir Zholy (Kazakhstan Railways)
AZERBAIJAN AS A REGIONAL HUB IN CENTRAL EURASIA
ABBREVIATIONS xix
kV – Kilovolt LCL – less than container load LLC – Limited Liability Company LNG – Liquefied Natural Gas LP – Logistic Park LPI – Logistics Performance Index MCIT – Ministry of Communications and Information Technologies MED – Ministry of Economic Development mln – Million MoT – Ministry of Transport MoU – Memorandum of Understanding NATO – The North Atlantic Treaty Organization NAR – Nakhichevan Autonomous Republic of Azerbaijan NELTI – New Eurasian Land Transport Initiative NIOC – National Iranian Oil Company NSTC – The North‐South Transport Corridor OAG – Official Airline Guide OECD – Organization for Economic Co‐operation and Development OILCECA – Oil Corridor Europe, Caucasus, Asia OJSC – Open Joint Stock Company OSCE – Organization for Security and Co‐operation in Europe OSJD – Organization for Cooperation Railways PMO – Ports and Maritime Organization of Islamic Republic of Iran PPP – public‐private partnership PRD – Lao People's Democratic Republic PSA – Port of Singapore Authority PSA – Production Sharing Agreement RAI – Iranian Railways RENFE – Spanish National Railway Network RIZ – Regional Innovation Zone RO‐RO – Roll‐on Roll‐off RoPax – Roll On, Roll Off Passenger RPK – Revenue Passenger‐Kilometers RTK – Revenue Ton‐Kilometers RZD – Russian Railways SES – Single European Sky SEZ – Special Economic Zone SMGS – Agreement on International Freight Traffic by Rail SPM – Single Point Mooring SOCAR – State Owned Company of Azerbaijan Republic TAR – Trans‐Asian Railway (UNESCAP) TEE – Trans‐Eurasian Express TEL – Trans Eurasia Logistics
STRATEGIC ASSESSMENT OF EURO‐ASIAN TRADE AND TRANSPORTATION
xx ABBREVIATIONS
TEM – Trans‐European Motorways (UNECE) TEN – Trans‐European Transport Networks TER – Trans‐European Railway (UNECE) TEU – Twenty‐foot equivalent unit TIKA – Turkish International Cooperation & Development Agency TIR – Convention on International Transport of Goods Under Cover of TIR Carnets TKTR – Trans‐Kazakhstan Trunk Railway TSR – The Trans‐Siberian Railway TRACECA – Transport Corridor Europe, Caucasus, Asia UIC – The International Union of Railways UN – United Nations UNCTAD – United Nations Conference on Trade and Development UNECE – United Nations Economic Commission for Europe UNESCAP – United Nations Economic and Social Commission for Asia and the Pacific US – United States WTO – World Trade Organization XUAR – Xinjiang Uygur Autonomous Region of the People's Republic of China
AZERBAIJAN AS A REGIONAL HUB IN CENTRAL EURASIA
FIGURES & MAPS
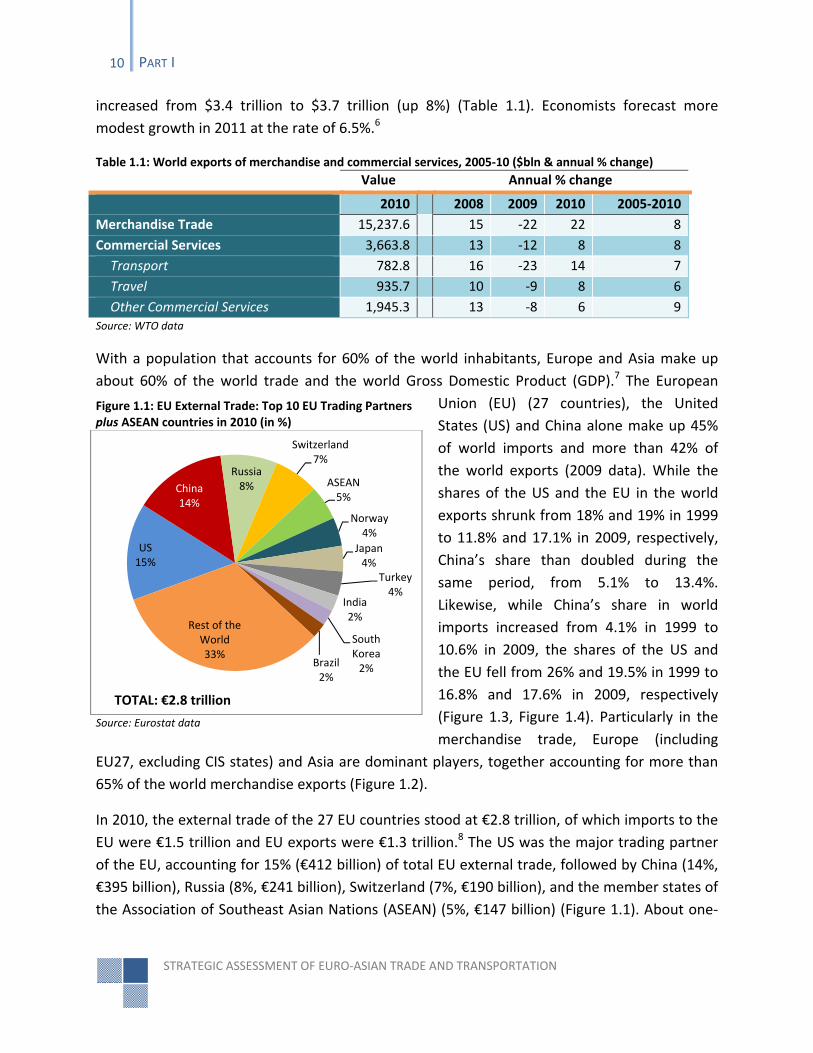
FIGURE 1.1: EU EXTERNAL TRADE: TOP 10 EU TRADING PARTNERS PLUS ASEAN COUNTRIES IN 2010 (IN %) .................................. 10
FIGURE 1.2: REGIONAL SHARES IN WORLD MERCHANDISE EXPORTS (2000 AND 2008) (IN %) ...................................................... 11
FIGURE 1.3: SHARE OF NATIONAL EXPORTS IN WORLD EXPORTS (IN %)...................................................................................... 11
FIGURE 1.4: SHARE OF NATIONAL IMPORTS IN WORLD IMPORTS (IN %) ..................................................................................... 11
FIGURE 1.5: SHARE OF EXPORTS TO CHINA BY EU27 COUNTRIES IN 2010 .................................................................................. 12
FIGURE 1.6: SHARE OF IMPORTS FROM CHINA TO EU27 COUNTRIES IN 2010 .............................................................................. 12
FIGURE 1.7: DISTRIBUTION OF THE EU‐ASEAN TRADE VOLUME BY COUNTRIES IN 2010 (TONS IN %) .............................................. 14
FIGURE 1.8: DISTRIBUTION OF THE EU‐ASEAN TRADE TURNOVER BY COUNTRIES IN 2010 (EUROS IN %) ......................................... 14
FIGURE 1.9: SHARE OF EXPORTS TO INDIA BY EU27 COUNTRIES IN 2010 ................................................................................... 16
FIGURE 1.10: SHARE OF IMPORTS FROM INDIA TO EU27 COUNTRIES IN 2010 ............................................................................ 16
FIGURE 1.11: TOTAL GOODS PROCESSED BY EU PORTS BETWEEN 2002 AND 2009 (EU27 VS. EU15) (IN 1000 TONS) ..................... 17
FIGURE 1.12: SHARE OF ASIAN COUNTRIES IN THE EU‐ASIA CONTAINER TRADE IN 2009 (TEU IN %) .............................................. 18
FIGURE 1.13: DISTRIBUTION OF THE EU‐CHINA (EXCLUDING HONG KONG) CONTAINER TRADE BY COUNTRIES IN 2009 (TEU IN %) ...... 19
FIGURE 1.14: DISTRIBUTION OF THE EU‐INDIA CONTAINER TRADE BY COUNTRIES IN 2009 (TEU IN %) ........................................... 19
FIGURE 2.1: DISTRIBUTION OF CARGO SHIPMENTS IN AZERBAIJAN BY TRANSPORT MODE (2000‐2010) (IN %) ................................ 23
FIGURE 2.2: CARGO SHIPMENTS VIA AZERBAIJAN’S SEGMENT OF TRACECA (2000‐2010) (IN 1,000 TONS) ................................... 31
FIGURE 2.3: TREND IN TRANSIT AND RUSSIA‐CHINA CONTAINER TURNOVER VIA TSR (IN 1,000 TEU) ............................................. 51
FIGURE 2.4: MODAL SPLIT IN CARGO TRANSPORT IN KAZAKHSTAN IN 2009 (IN %) ...................................................................... 56
FIGURE 2.5: INTERNATIONAL CARGO TRANSPORTATION IN KAZAKHSTAN IN 2009 (IN %) ............................................................... 57
FIGURE 2.6: ORIGIN COUNTRIES OF TRANSIT CARGO THROUGH KAZAKHSTAN IN 2010 (IN 1,000 TONS) .......................................... 58
FIGURE 2.7: DESTINATION COUNTRIES FOR TRANSIT CARGO THROUGH KAZAKHSTAN IN 2010 (IN 1,000 TONS) ................................ 58
FIGURE 2.8: ANNUAL CONTAINER THROUGHPUT VIA DOSTYK VS. OTHER LOCATIONS IN KAZAKHSTAN (IN UNITS & TEU) ...................... 59
FIGURE 2.9: ANNUAL CONTAINER EXCHANGE BETWEEN CHINA AND KAZAKHSTAN VIA DOSTYK (IN TEU) .......................................... 60
FIGURE 2.10: ESTIMATED TREND OF CONTAINER TURNOVER IN KAZAKHSTAN (2009‐2015) (IN TEU) ............................................ 60
FIGURE 2.11: AVERAGE SPEED OF THE ISLAMABAD‐TEHRAN‐ISTANBUL INAUGURAL TRAIN (AUGUST 14‐28, 2010) ........................... 70
FIGURE 2.12: CONTAINER SHIPPING COST FROM ISLAMABAD TO ISTANBUL (IN $) ........................................................................ 71
FIGURE 2.13: CARGO EXCHANGE WITH EUROPE AND CENTRAL ASIA, AFGHANISTAN AND PAKISTAN (IN TONS) ................................... 72
FIGURE 2.14: EXPORTS BY ROAD FROM IRAN ‐ IRANIAN VS. FOREIGN TRUCKS (IN %) .................................................................... 73
FIGURE 2.15: IMPORTS BY ROAD TO IRAN ‐ IRANIAN VS. FOREIGN TRUCKS (IN %) ........................................................................ 73
FIGURE 2.16: INDIAN TRADE WITH SCANDINAVIAN COUNTRIES (2008‐2009/2009‐2010) (IN MLN $) .......................................... 78
FIGURE 2.17: INDIAN TRADE WITH CIS (EXCLUDING CENTRAL ASIAN STATES AND AZERBAIJAN) & BALTIC STATES ............................... 79
FIGURE 2.18: TRUCKS AND MOTOR VEHICLE CARGO TRAFFIC AT AZERBAIJAN’S MAIN BORDER CROSSING POINTS IN 2010 (IN TONS) ....... 82
FIGURE 2.19: THE NUMBER OF TRUCKS CROSSING AZERBAIJAN’S MAIN BORDER CROSSING POINTS IN 2010 ....................................... 82
FIGURE 2.20: TOTAL CARGO HANDLED BY CASPIAN PORTS IN 2010 (IN %) ................................................................................ 91
FIGURE 2.21: BAKU PORT CARGO THROUGHPUT TREND (1970‐2010) (IN 1,000 TONS).............................................................. 93
FIGURE 2.22: CARGO TRAFFIC BY TERMINAL (IN 1,000 TONS) .................................................................................................. 94
FIGURE 2.23: COMPOSITION OF PROCESSED CARGO (IN 1,000 TONS) ....................................................................................... 94
FIGURE 2.24: MAIN CARGO TERMINAL TRAFFIC (IN 1,000 TONS) ............................................................................................ 94
FIGURE 2.25: FERRY TERMINAL TRAFFIC (IN 1,000 TONS) ....................................................................................................... 94
FIGURE 2.26: OIL TERMINAL TRAFFIC (IN 1,000 TONS) ........................................................................................................... 94
FIGURE 2.27:CONTAINER TERMINAL TRAFFIC (IN UNITS) ........................................................................................................ 94
STRATEGIC ASSESSMENT OF EURO‐ASIAN TRADE AND TRANSPORTATION
xxii FIGURES & MAPS
FIGURE 2.28: AKTAU PORT CARGO COMPOSITION AND TRAFFIC (1996‐2010) (IN 1,000 TONS) ................................................... 97
FIGURE 2.29: TOTAL CARGO TRAFFIC AT AKTAU PORT: OIL VS. NON‐OIL CARGO (1996‐2010) (IN %) ........................................... 98
FIGURE 2.30: OIL VS. NON‐OIL CARGO TRAFFIC AT TURKMENISTAN’S PORTS (2008‐2010) (IN 1,000 TONS) ................................ 101
FIGURE 2.31: DISTRIBUTION OF OIL CARGO BY PORTS AND JETTIES (2008‐2010) (IN %) ............................................................ 101
FIGURE 2.32: IRAN'S CONTAINER TRADE OVER TIME (2000‐2010) (IN TEU) ........................................................................... 108
FIGURE 2.33: NON‐OIL CARGO HANDLED BY ALL IRANIAN PORTS VS. FOUR CASPIAN PORTS (2008‐2010) (IN MLN TONS) ............... 108
FIGURE 2.34: NON‐OIL CARGO TRAFFIC TREND AT IRANIAN PORTS (2004‐2010) (IN MLN TONS) ................................................ 109
FIGURE 2.35: OIL CARGO TRAFFIC TREND AT IRANIAN PORTS (2004‐2010) (IN MLN TONS) ........................................................ 109
FIGURE 2.36: CARGO TRAFFIC TREND AT IRAN’S CASPIAN PORTS (2004‐2010) (IN MLN TONS) ................................................... 110
FIGURE 2.37: OIL VS. NON‐OIL CARGO PROCESSED AT FOUR CASPIAN PORTS (2008‐2010) (IN 1,000 TONS) ............................... 110
FIGURE 2.38: LOGISTICS PERFORMANCE INDEX (LPI) IN COMPARISON ..................................................................................... 117
FIGURE 2.39: LPI CUSTOMS ............................................................................................................................................. 118
FIGURE 2.40: LPI LOGISTICS COMPETENCE ......................................................................................................................... 118
FIGURE 2.41: A NODE‐LINK SYSTEM ................................................................................................................................... 123
FIGURE 2.42: WORLD AIRPORTS’ INTERNATIONAL PASSENGER TRAFFIC IN 2010 ....................................................................... 127
FIGURE 2.43: INTERNATIONAL PASSENGER TRAFFIC TO/FROM GYD AND AZAL’S SHARE 2008‐2010 (PASSENGERS AND %) ............. 127
FIGURE 2.44: TOTAL NUMBER OF PASSENGERS CARRIED BY AZAL: INTERNATIONAL VS. DOMESTIC (2008‐2010) (IN %) ................. 128
FIGURE 2.45: PASSENGER TRAFFIC FORECAST (IN MLN) ......................................................................................................... 129
FIGURE 2.46: AIR HUB AND NETWORK DEVELOPMENT ......................................................................................................... 131
FIGURE 2.47: AIR CARGO TRAFFIC BETWEEN EUROPE AND ASIA (IN MLN TONS) .......................................................................... 133
FIGURE 2.48: THE STRUCTURE OF EUROPE‐ASIA AIR CARGO TRAFFIC ..................................................................................... 133
FIGURE 2.49: AIR CARGO TRAFFIC VIA BAKU CARGO TERMINAL (IN 1,000 TONS) ...................................................................... 136
FIGURE 2.50: AIR CARGO TRAFFIC VIA BAKU AND NAVOI (UZBEKISTAN) (IN 1,000 TONS) ........................................................... 137
FIGURE 2.51: THE PRICE OF JET FUEL ON APRIL 15, 2011 (PER METRIC TON) ........................................................................... 138
FIGURE 3.1: PUBLIC/PRIVATE CONTROL OF CONTAINER TERMINALS (IN MILLION TEU) ............................................................... 166
FIGURE 3.2: A CONCEPTUAL MODEL OF PORT DEVELOPMENT ............................................................................................... 173
FIGURE 3.3: PORT HINTERLAND CONCEPT ........................................................................................................................... 174
FIGURE 3.4: HINTERLAND CONCEPT FOR THE ALYAT PORT ...................................................................................................... 175
FIGURE 4.1: POSSIBLE ORGANIZATIONAL STRUCTURE OF FEZ CONCEPT FOR AZERBAIJAN ............................................................. 185
MAP 1 ‐ MAIN ROAD NETWORKS OF AZERBAIJAN (M1 – M8) ................................................................................................. 24
MAP 2: ALTERNATIVE ROUTES FOR CARRYING CARGO TO AFGHANISTAN IN THE WEST‐EAST DIRECTION ........................................... 34
MAP 3: TRANS‐SIBERIAN RAILWAY AND EXTENSIONS .............................................................................................................. 49
MAP 4: EXISTING RAILWAYS IN IRAN .................................................................................................................................... 67
MAP 5: M1 ROAD (FROM SAMUR/YALAMA, AZERBAIJAN‐RUSSIA BORDER, TO BAKU) ................................................................. 81
MAP 6: M3 ROAD (FROM BAKU TO ASTARA, AZERBAIJAN‐IRAN BORDER) .................................................................................. 81
MAP 7: POSSIBLE LOCATIONS FOR LOGISTICS CENTERS IN AZERBAIJAN ...................................................................................... 121
MAP 8: ALYAT ILC AS MAJOR INTERMODAL HUB IN THE CASPIAN REGION ................................................................................ 124
MAP 10: SILK WAY AIRLINES FLIGHT ROUTES IN EUROPE AND ASIA ......................................................................................... 135
MAP 11: A CAPTION OF PROPOSED LAYOUT FOR THE ALYAT PORT .......................................................................................... 171
AZERBAIJAN AS A REGIONAL HUB IN CENTRAL EURASIA
TABLES
TABLE 1.1: WORLD EXPORTS OF MERCHANDISE AND COMMERCIAL SERVICES, 2005‐10 ($BLN & ANNUAL % CHANGE) ........................ 10
TABLE 1.2: EU‐CHINA TRADE BY VOLUME AND MODE OF TRANSPORT (IN TONS, %) .................................................................... 13
TABLE 1.3: DISTRIBUTION OF EU‐CHINA TRADE BY MODE OF TRANSPORT IN 2010 (IN € AND %) ................................................... 13
TABLE 1.4: EU‐ASEAN TRADE IN QUANTITY AND VALUE IN 2010 ............................................................................................ 14
TABLE 1.5: DISTRIBUTION OF EU‐INDIA TRADE BY MODE OF TRANSPORT IN 2010 (IN € AND %) .................................................... 15
TABLE 1.6: EU‐INDIA TRADE BY VOLUME AND MODE OF TRANSPORT (IN TONS, %) ...................................................................... 16
TABLE 1.7: MAJOR MARITIME TRADE PARTNERS OF EU IN ASIA IN 2010 ................................................................................... 18
TABLE 2.1–MAIN ROADS OF AZERBAIJAN AND ONGOING REHABILITATION WORK ........................................................................ 25
TABLE 2.2: TRANSPORTATION OF CARGO ALONG AZERBAIJAN’S SEGMENT OF TRACECA (IN 1000 TONS) ........................................ 30
TABLE 2.3: TURKISH TRUCKS TRANSPORT STATISTICS TO CENTRAL ASIA, AFGHANISTAN AND PAKISTAN (NUMBER OF TRIPS) ................. 33
TABLE 2.4: COMPARATIVE ROAD JOURNEYS ALONE NELTI CENTRAL CORRIDOR .......................................................................... 35
TABLE 2.5: ALTERNATIVE TRANSPORT ROUTES FROM ISTANBUL (TURKEY) TO DOSTIK (KAZAKHSTAN‐CHINA BORDER) ......................... 41
TABLE 2.6: SHIPPING TIME AND COST FOR ONE TEU (OR EQUIVALENT IN SIZE CARGO) FROM CHINA TO GERMANY ............................. 46
TABLE 2.7: BLOCK TRAIN SERVICES FROM RUSSIA’S FAR EAST ................................................................................................... 50
TABLE 2.8: STRUCTURE OF INTERNATIONAL CARGO IN KAZAKHSTAN IN 2009 (IN 1,000 TONS) ...................................................... 56
TABLE 2.9: BLOCK TRAIN OPERATION IN KAZAKHSTAN ............................................................................................................ 61
TABLE 2.10: CONTAINER SHIPMENTS FROM RIGA, LATVIA TO CENTRAL ASIA (TIME/DISTANCE) ....................................................... 61
TABLE 2.11: COMPARATIVE ROAD JOURNEYS ALONG NELTI NORTHERN CORRIDOR ..................................................................... 63
TABLE 2.12: CONTAINER SHIPMENTS FROM CHINA TO CENTRAL ASIA AND NORTHERN EUROPE (TIME/DISTANCE) .............................. 64
TABLE 2.13: THE SHIPPING COST FOR A 40 FT CONTAINER FROM SHANGHAI ............................................................................... 65
TABLE 2.14: IRANIAN RAIL LINES CONSTRUCTED SINCE THE 1990S ........................................................................................... 68
TABLE 2.15: NEW RAILWAYS TO BE BUILT BY CHINA ............................................................................................................... 68
TABLE 2.16: COMPARATIVE ROAD JOURNEYS ALONG NELTI SOUTHERN CORRIDOR ..................................................................... 71
TABLE 2.17: DISTANCE AND TRANSIT TIMES BY RAIL FROM DELHI TO HELSINKI USING THE NSTC VIA AZERBAIJAN ............................... 76
TABLE 2.18: CARGO HANDLED BY TEN MAJOR CASPIAN PORTS IN 2008, 2009 AND 2010 ........................................................... 90
TABLE 2.19: AKTAU PORT CARGO COMPOSITION AND TRAFFIC (1996‐2010) (IN 1,000 TONS) .................................................... 96
TABLE 2.20: CARGO THROUGHPUT AT IRAN’S CASPIAN PORTS (2004‐2010) (IN TONS) ............................................................. 110
TABLE 2.21: DOMESTIC AND INTERNATIONAL TRAFFIC AT BAKU (GYD) AIRPORT (IN # OF PASSENGERS AND %) ............................... 128
TABLE 2.22: AZAL EXISTING AND PLANNED FLIGHTS ............................................................................................................. 130
TABLE 2.23: COMPARISON OF JET FUEL USAGE ON FLIGHT FROM SHANGHAI TO FRANKFURT VIA BAKU VS. DUBAI (IN TONS ) ............ 134
TABLE 2.24: DISTANCES BETWEEN MAJOR WEST EUROPEAN AND ASIAN CITIES (IN NAUTICAL MILES) ............................................ 134
TABLE 3.1: TYPES AND FEATURES OF ECONOMIC ZONES ........................................................................................................ 144
TABLE 3.2: VARIOUS TYPES OF ECONOMIC ZONES ................................................................................................................ 144
TABLE 3.3: PRIVATE AND PUBLIC SECTOR ZONES IN DEVELOPING AND TRANSITION ECONOMIES .................................................... 146
TABLE 3.4: EXAMPLES OF PUBLIC‐PRIVATE PARTNERSHIP IN ZONE DEVELOPMENT ...................................................................... 151
TABLE 3.5: BASIC PORT MANAGEMENT MODELS ................................................................................................................. 158
TABLE 3.6: STRENGTHS AND WEAKNESSES OF PORT MANAGEMENT MODELS ............................................................................ 159
TABLE 3.7: PROJECTED DEVELOPMENT OF CONTAINER PORT CAPACITY BY OWNERSHIP (2009‐2015) (MLN TEU / %) .................... 160
TABLE 3.8: TYPICAL OWNERSHIP AND OPERATING STRUCTURES IN GLOBAL CONTAINER PORT INDUSTRY ........................................ 161
TABLE 3.9 LISTS SOME EXAMPLES OF CONCESSION AGREEMENTS REACHED DURING 2009 AND 2010. ............................................ 164
TABLE 3.10: SELECTED CONCESSION ACTIVITY BY GLOBAL/INTERNATIONAL OPERATORS IN 2009/10 ............................................ 164
STRATEGIC ASSESSMENT OF EURO‐ASIAN TRADE AND TRANSPORTATION
xxiv TABLES
TABLE 3.11: TOP 25 WORLD SHIPPING LINERS (AS OF DECEMBER 31, 2010) ........................................................................... 166
TABLE 3.12: GLOBAL OPERATORS’ THROUGHPUT LEAGUE TABLE IN 2009 ................................................................................ 167
TABLE 3.13: WORLD CONTAINER PORT HANDLING BY REGION AND OWNERSHIP (2008‐2009) ................................................... 168
TABLE 3.14: BASIC FUNCTIONS OF A PORT HINTERLAND ........................................................................................................ 173
AZERBAIJAN AS A REGIONAL HUB IN CENTRAL EURASIA
INTRODUCTION
The Need for a Vision for the Future
In 1965, the late Sheikh Rashid bin Said Al‐Maktum, the visionary ruler of Dubai, asked his
British advisers to draw up a plan for the construction of a port. It took a British engineering
firm two years to complete a comprehensive master planning study for the proposed port site,
adjacent to the centuries‐old Al Shindagah neighborhood in downtown Dubai. Based on the
market assessment and future traffic forecasts, the advisers concluded that the new port would
need only four berths. Having carefully considered the proposal, Sheikh Rashid demanded that
the plan be altered to include sixteen berths instead of four. The British advisers reluctantly
complied. The port was finally opened in 1971, and all sixteen berths were oversubscribed by
the end of the first year of operation. Further expansions followed, and more berths were built
in subsequent years.1 Sheikh Rashid was convinced that Dubai was bound to become the most
important transport hub in the Middle East, and even beyond. Today, the Rashid Port, the Jabal
Ali Port and Free Zone, Dubai International Airport, and many other state‐of‐the‐art projects in
the Dubai emirate stand as testaments to Sheikh Rashid’s foresight and vision.
In a similar fashion, it was the vision of Lee Kuan Yew, one of the longest‐serving prime
ministers of the twentieth century, that transformed the tiny city‐state of Singapore from a
relatively underdeveloped former colonial settlement to a modern and competitive economy
and the major distribution hub in Southeast Asia. As early as 1973, just eight years after
independence, Singapore was being hailed as “the world’s fourth busiest port,” serving more
than 200 shipping carriers and some fifty maritime states.2 By becoming the region’s oil refining
and distribution center, Singapore managed to turn itself into an oil‐rich state even though it
was virtually devoid of any oil of its own. Capitalizing on its strategic location at the crossroads
of the major maritime routes between Europe and Asia, Lee Kuan Yew seized every opportunity
that came his way. He established an attractive business environment for foreign direct
investment (FDI) and pursued an aggressive diversification policy. Today, the country enjoys a
strong economy with a high level of FDI, and booming trade, manufacturing, and finance
sectors. In 2009, Singapore’s gross domestic product (GDP) per capita exceeded $36,000, up
from a mere $395 in 1960.3
Even though both Dubai and Singapore have undoubtedly benefited from their coastal locations
and the entrepôt trade generated by maritime traffic, the vision of their respective leaders was
essential to these cities’ resounding economic success, for without it they would be utterly
different places today. The paths taken by Sheikh Rashid in Dubai and Prime Minister Lee in
STRATEGIC ASSESSMENT OF EURO‐ASIAN TRADE AND TRANSPORTATION
2 INTRODUCTION
Singapore offer a lesson for every national leader and every country aspiring to make an
enduring mark in the world: it is necessary to possess a vision for the future.
Unlike the world’s great seaports, the prominent commercial cities of Central Eurasia have
historically been land‐based hubs. It took months and even years for the ancient Silk Road
traders to travel between Europe and Asia, and Central Eurasia’s hubs served as critical regional
logistics and distribution centers. Each of them had a number of caravanserais, where goods
and ideas exchanged hands, and people and cultures met and mixed. These trading centers
were connected with other regional hubs and megacities through a vast network of corridors
across Eurasia and the Middle East. The Silk Road corridors were for centuries the source of
prosperity for many nations in Central Eurasia.
As a result of technological advances in the twenty‐first century, Central Eurasia is poised to
regain its former prominence as a land‐based hub between Europe and Asia. By 2030, a tourist
will be able to jump on a high‐speed train in Istanbul and arrive in Baku the same day; he will
even have time to take a free bus tour of Tbilisi en route. He will continue his trip on an express
ferry to Turkmenbashy, from where another high‐speed train will take him all the way to
Urumqi in China’s Xinjiang Autonomous Region. The entire territory of Central Eurasia will be
covered with a great infrastructure of highways, railways, airports, and logistics centers that will
handle goods and passengers moving between Europe and Asia.
For many countries in Central Eurasia, however, envisioning the future is a complex matter.
Political, economic, and social crises caused by the sudden collapse of the Soviet Union have
dominated the relatively short history of independence enjoyed by these states. In 2011, they
celebrate only the twentieth anniversary of the end of Soviet rule. Memories of wars,
unresolved conflicts, economic hardships, and coups still haunt the generation old enough to
remember the days of communist control. Fortunately, the most difficult times have been left
behind, though a few crucial challenges persist. The countries of Central Eurasia are now at the
stage of development where they must complete their political and economic transitions and
choose a path that would lead them into the ranks of prosperous developed nations.
The Process of Becoming: Central Eurasia Twenty Years Later
In the 1990s, many people in the resource‐rich states of Central Eurasia, including Azerbaijan,
believed that their respective countries would soon become the “Kuwaits” and “Switzerlands”
of the twenty‐first century. The abundance of natural resources made this notion so alluring
and so palpable that few really thought about the process by which this goal would be realized,
if it were to be realized at all. Becoming another Kuwait or Switzerland would have required
AZERBAIJAN AS A REGIONAL HUB IN CENTRAL EURASIA
INTRODUCTION 3
different development strategies, with a strategic vision supported by the presence of other
essential components, such as a business friendly environment, political and economic
capabilities, the effective management of revenues from the sale of natural resource and an
advantageous location.
In the past twenty years, the regional countries, especially the resource‐rich ones, have
achieved a great deal. In 2009, the GDPs of Azerbaijan, Kazakhstan, Uzbekistan, and
Turkmenistan exceeded $43 billion, $115 billion, $32 billion, and $19 billion, respectively.4 On
the other hand, the combined GDP of the remaining four, more poorly endowed, states—
Armenia, Georgia, Kyrgyzstan, and Tajikistan—was less than $30 billion. Azerbaijan and
Kazakhstan have attracted billions of dollars in FDI and have completed key energy
infrastructure projects that guarantee their future development. A latecomer, Turkmenistan,
has started opening its doors to investors only recently, with the great expectations still to be
met. The most populous state in the region, Uzbekistan, has chosen a gradual domestic
demand‐led development path that does not seek external FDI, but it too promises to
contribute to the future hub vision of Central Eurasia.
There is no doubt that the chief engine of growth in the region has been the abundant natural
resources of Azerbaijan, Kazakhstan, Uzbekistan, and Turkmenistan. The governments of these
states, particularly Azerbaijan and Kazakhstan, have been mindful of the perils of resource
dependence and have tried to implement policies to minimize potential risks. They also have a
strategy as far as development of their energy sectors is concerned. Azerbaijan and Kazakhstan,
for example, have used Production Sharing Agreements (PSAs) to attract foreign energy
companies and inject the most needed investments into their economies. It was this energy
strategy that allowed Azerbaijan and its Western multinational partners to reach agreement on
the “Contract of the Century” in 1994 and subsequently to construct the Baku‐Tbilisi‐Ceyhan oil
pipeline in 2005 and the Baku‐Tbilisi‐Erzurum natural gas pipeline in 2006. Azerbaijan’s energy
sector alone has attracted more than $35 billion in FDI. Moreover, the revenues from these two
pipelines account for the lion’s share of the current state budget. In short, the resource‐rich
states are reaping the fruits of energy strategies they conceptualized in the 1990s.
Whether resource rich or resource poor, the countries of Central Eurasia share the same future,
and they are bound to find new synergies that will give their region a prominent place on the
economic and political map of the twenty‐first century. Indeed, each country in the region has
its own destiny, and each has reason to hope that one day it will become a prosperous and
developed state in its own right, like no other state but itself. To achieve this goal, however,
each of them would need a clear vision of itself as an individual state and also as a member of a
broader regional framework that could economically, and even politically, unite them by 2030.
STRATEGIC ASSESSMENT OF EURO‐ASIAN TRADE AND TRANSPORTATION
4 INTRODUCTION
They will have to cooperate, integrate, and adapt to the rapidly changing world around them
and forge a common vision for the years ahead. What is the common vision that one day these
mostly landlocked countries might share? Will it be a vision that will make the region a
periphery for another central power? Or a geopolitical playground for powers aiming to control
the region’s riches? Or will the ancient Silk Road be revived, with the region reclaiming its
status as a vibrant commercial hub between major economic blocs such as Europe, East Asia,
South Asia, and the Middle East? Whatever the answers to these questions, one thing is clear:
international trade will play a central role in the transformation of the region.
Azerbaijan: Potential Catalyst for Regional Dynamism
Azerbaijan is, and will remain, a pivotal state in Central Eurasia, helping to shape a common
vision for the region and facilitate its transformation. The country’s vast natural resources will
act as catalyst for developing its non‐oil economy and reviving the non‐oil trade of the region—
thus restoring Central Eurasia’s historical position as a commercial hub along the ancient Silk
Road. But for this to happen, Azerbaijan needs to formulate a comprehensive vision to guide its
development and lead it to the desired goal.
Azerbaijan is located at the crossroads of major Eurasian land and air transport corridors—a
feature that will play a vital part in its long‐term success, if utilized properly. Potentially, the
country could serve not only as a commercial bridge between Europe and Asia, but also as a
major distribution hub in Eurasia. Unlike its energy strategy, however, Azerbaijan’s vision for
development of its non‐oil economy is still a work in progress. Nearly 95% of the country’s
exports and more than 55% of GDP come from the sale of oil and natural gas—a situation that
is unlikely to change in the immediate future. The mid‐ and long‐term prospects of the country
are promising, albeit conditioned upon successful development of the non‐oil sector.
Looking Beyond Energy
Though many Azerbaijani government officials have repeatedly acknowledged that the country
is ideally situated to become a regional transportation hub between Europe and Asia, these
statements are yet to be translated into a long‐term strategic vision that is coherent and
sustainable. Nonetheless, the idea of “wanting to become a regional hub” at least is in place. In
fact, a number of transportation and infrastructure projects have already been launched to
advance this strategy. Among them is the strategic Kars‐Akhalkalaki railway, which will link the
Georgian and Turkish rail networks and thus create a rail corridor between China and Europe
via Azerbaijan. In addition, the government is investing billions of dollars in modernization of
AZERBAIJAN AS A REGIONAL HUB IN CENTRAL EURASIA
INTRODUCTION 5
the country’s international highways along the East‐West and North‐South axes in an attempt
to better prepare for anticipated land‐based traffic through Azerbaijani territory. Moreover, the
new state‐of‐the‐art Baku International Sea Trade Port and Logistics Center at Alyat and the
new Baku International Airport will both have a central place in the vision of Azerbaijan as a
global transport hub. Last, but not least, the government plans to establish Free Economic
Zones (FEZs) and invest more than $60 billion in real estate projects in and around Baku,
essentially aiming to transform the national capital into the “Dubai of the Caspian.”
These projects will genuinely strengthen Azerbaijan’s position in the region and enable it to
become a magnet for land‐ and air‐based trade between and among the states of Europe and
Asia. Baku will act as a gateway to Central Asia for Europe and a door to Europe for Central Asia
and China. It has the potential to become a “hub of hubs” on the Caspian Sea, but this will
require articulation of a clear vision today for the Azerbaijan of 2030.
The Need for an Integrated Development Strategy
Close examination of the ongoing and planned infrastructure and transportation projects in
Azerbaijan would reveal a lack of coherence in the country’s strategy for its non‐oil economy.
Important and useful projects are being planned and initiated independently of one another,
without the necessary cross‐sector and intra‐sector coordination. In other words, these projects
do not seem to be guided by a unified objective or directed by a cohesive state policy. Unless a
clear, integrated “big picture” strategy is set forth today, the development trajectory of
Azerbaijan, or of any other country in the region, for that matter, is likely to be halting and
subject to chance. This is not to say that Azerbaijan could not achieve high per capita income or
social‐welfare advancement without such a vision. The “trial and error” approach certainly
offers one type of problem‐solving strategy. But in addition to being risky, such an approach
would consume far more in terms of resources, time, and energy in the long run, and its success
would not be guaranteed.
The study you are about to read has been written in the hope of contributing to the vision of
the future of Azerbaijan. It focuses on Euro‐Asian trade, transportation and logistics, FEZ, and
port development, and draws some lessons for Azerbaijan and other countries in Central
Eurasia aspiring to become regional commercial hubs and take advantage of the growing trade
between two major economic blocs, namely Europe and Asia. In particular, it proposes a
specific development scheme for Azerbaijan’s hub strategy. As is noted throughout the study,
the opportunities for Azerbaijan are many, and the realization of this potential will benefit the
whole region, not just a single state. This means that for Azerbaijan to achieve its national
objectives, it needs to coordinate its efforts with those of neighboring countries in the region.
STRATEGIC ASSESSMENT OF EURO‐ASIAN TRADE AND TRANSPORTATION
6 INTRODUCTION
Most of the states of Central Eurasia are landlocked, and they depend on each other’s
transportation infrastructure. Building highways, railways, ports, and airports is a necessary
part of Azerbaijan’s hub strategy, but it is not a sufficient one. Without a bird’s‐eye approach
and a coherent policy, which will view all these projects as components of a single strategy, the
transportation and infrastructure projects are likely to have outcomes that will be insufficiently
efficacious, because they lack complementarity. Hence, the compartmentalized mindset has to
give way to an integrated vision that will direct each project towards a common goal.
An Overview of the Study
Part I of the present study will give a brief overview of the structure of the Euro‐Asian trade and
its major players and the means through which this trade is conducted. In particular, it looks at
the European Union’s commercial relations with a number of Asian states relevant to the future
hub strategy of Central Eurasia.
Part II assesses the current state of affairs in the transportation, infrastructure, and logistics
sectors of Azerbaijan and Central Eurasia. It illuminates a number of challenges in these sectors
and points to current and potential competition between the Euro‐Asian transport corridors
that bypass Azerbaijan and the Transport Corridor Europe‐Caucasus‐Asia (TRACECA), which
transits the country. In particular, it highlights the importance of establishing an effective trans‐
Caspian maritime transportation system, which is essential to the success of TRACECA. Part II
also stresses the importance of creating a well‐connected national and regional logistics
network and supply chain that will connect the nodes in the global land‐ and air‐based supply
chain via Azerbaijan.
Becoming a transportation and transit hub will not be sufficient for the successful development
of Azerbaijan as a non‐oil economy. Hence Part III discusses the FEZ and port development in
general and identifies best practices that could be applied in Azerbaijan and could help
establish a competitive and sustainable non‐oil sector. A gradual approach to implementing the
hub vision is advocated, one that entails focusing on two projects within the context of the FEZ
concept: the new Baku International Sea Trade Port and Logistics Center FEZ at Alyat and the
Baku International Airport FEZ.
The core of a successful hub strategy for Azerbaijan must include FEZ development within a
PSA‐type legal framework, as only under such an arrangement can Azerbaijan generate trade
and attract FDI on a level that could make a lasting difference in the non‐oil economy. This
specific vision is outlined in detail in Part IV.

AZERBAIJAN AS A REGIONAL HUB IN CENTRAL EURASIA
PART I
EURO‐ASIAN TRADE: THE BIG PICTURE

AZERBAIJAN AS A REGIONAL HUB IN CENTRAL EURASIA
1. THE EUROASIAN TRADE AND CENTRAL EURASIA
The countries of Central Eurasia have always acted as a land bridge along the major commercial
routes between Europe and Asia. The Silk Road trade brought wealth and prosperity to the
region’s inhabitants at different stages in history. The exchange of goods introduced new ideas
and technologies, enriching and advancing the development of these societies. The disruption
of the ancient trade routes, however, brought suffering and hardship to the region with long‐
lasting impact. Some regions were gradually able to recover, while others never did. Over time,
a number of commercial cities faded away as they lost the prominence they once held in the
Silk Road trade, and new vibrant megacities emerged in their places. Euro‐Asian trade was the
economic backbone of Central Eurasia for centuries.
Today, the majority of this trade bypasses the region, and so do the attendant benefits. Large
ships that can carry thousands of containers at a time have replaced the ancient caravans of the
Silk Road. Most of the trade between Europe and Asia is conducted by maritime transportation
via Suez Canal, which makes up more than 90% of total cargo exchanged between the two
continents. The success of Central Eurasian hub strategy largely depends on the ability of the
regional states to attract some of this Euro‐Asian continental container trade by creating
integrated and competitive intermodal transportation and logistics networks across Eurasia.
An assessment of the potential impact of land‐ and air‐based Euro‐Asian commerce on the
countries of Central Eurasia requires an analysis of its current structure. A closer look at Euro‐
Asian trade exposes a number of opportunities for the region, including Azerbaijan, and reveals
issues and challenges associated with attracting this commerce. This section will examine Euro‐
Asian trade and its structure in attempt to reveal the bigger picture: whether or not this trade
has prospects and whether Central Eurasia can benefit and once again become a conduit, which
would allow it to regain its historical position as a commercial hub between Europe and Asia.
The EuroAsian Trade: Overview*
Since the sharp decline in 2009, world trade has bounced back, with a record‐high 14.5%
increase in the volume of exports in 2010.5 The highest ever surge in the volume of exports was
recorded in developing economies and the Commonwealth of Independent States (CIS), which
together made up of 45% of all exports in 2010. The Asian economies, led by China and Japan,
saw the fastest real export growth with 23.1%. The world merchandise exports rose from $12.5
trillion in 2009 to $15.2 trillion in 2010 (up 22%), while exports of commercial services
* The statistical data used in this section is drawn primarily from the World Trade Organizations (WTO) and European Commission’s Eurostat databases, unless indicated otherwise.
STRATEGIC ASSESSMENT OF EURO‐ASIAN TRADE AND TRANSPORTATION
10 PART I
increased from $3.4 trillion to $3.7 trillion (up 8%) (Table 1.1). Economists forecast more
modest growth in 2011 at the rate of 6.5%.6
Value Annual % change
2010 2008 2009 2010 2005‐2010
Merchandise Trade 15,237.6 15 ‐22 22 8
Commercial Services 3,663.8 13 ‐12 8 8
Transport 782.8 16 ‐23 14 7
Travel 935.7 10 ‐9 8 6
Other Commercial Services 1,945.3 13 ‐8 6 9Source: WTO data
With a population that accounts for 60% of the world inhabitants, Europe and Asia make up
about 60% of the world trade and the world Gross Domestic Product (GDP).7 The European
Union (EU) (27 countries), the United
States (US) and China alone make up 45%
of world imports and more than 42% of
the world exports (2009 data). While the
shares of the US and the EU in the world
exports shrunk from 18% and 19% in 1999
to 11.8% and 17.1% in 2009, respectively,
China’s share than doubled during the
same period, from 5.1% to 13.4%.
Likewise, while China’s share in world
imports increased from 4.1% in 1999 to
10.6% in 2009, the shares of the US and
the EU fell from 26% and 19.5% in 1999 to
16.8% and 17.6% in 2009, respectively
(Figure 1.3, Figure 1.4). Particularly in the
merchandise trade, Europe (including
EU27, excluding CIS states) and Asia are dominant players, together accounting for more than
65% of the world merchandise exports (Figure 1.2).
In 2010, the external trade of the 27 EU countries stood at €2.8 trillion, of which imports to the
EU were €1.5 trillion and EU exports were €1.3 trillion.8 The US was the major trading partner
of the EU, accounting for 15% (€412 billion) of total EU external trade, followed by China (14%,
€395 billion), Russia (8%, €241 billion), Switzerland (7%, €190 billion), and the member states of
the Association of Southeast Asian Nations (ASEAN) (5%, €147 billion) (Figure 1.1). About one‐
Table 1.1: World exports of merchandise and commercial services, 2005‐10 ($bln & annual % change)
Figure 1.1: EU External Trade: Top 10 EU Trading Partners plus ASEAN countries in 2010 (in %)
Source: Eurostat data
US15%
China14%
Russia 8%
Switzerland 7%
ASEAN5%
Norway 4%
Japan 4%
Turkey 4%
India2%
South Korea2%Brazil
2%
Rest of the World33%
TOTAL: €2.8 trillion
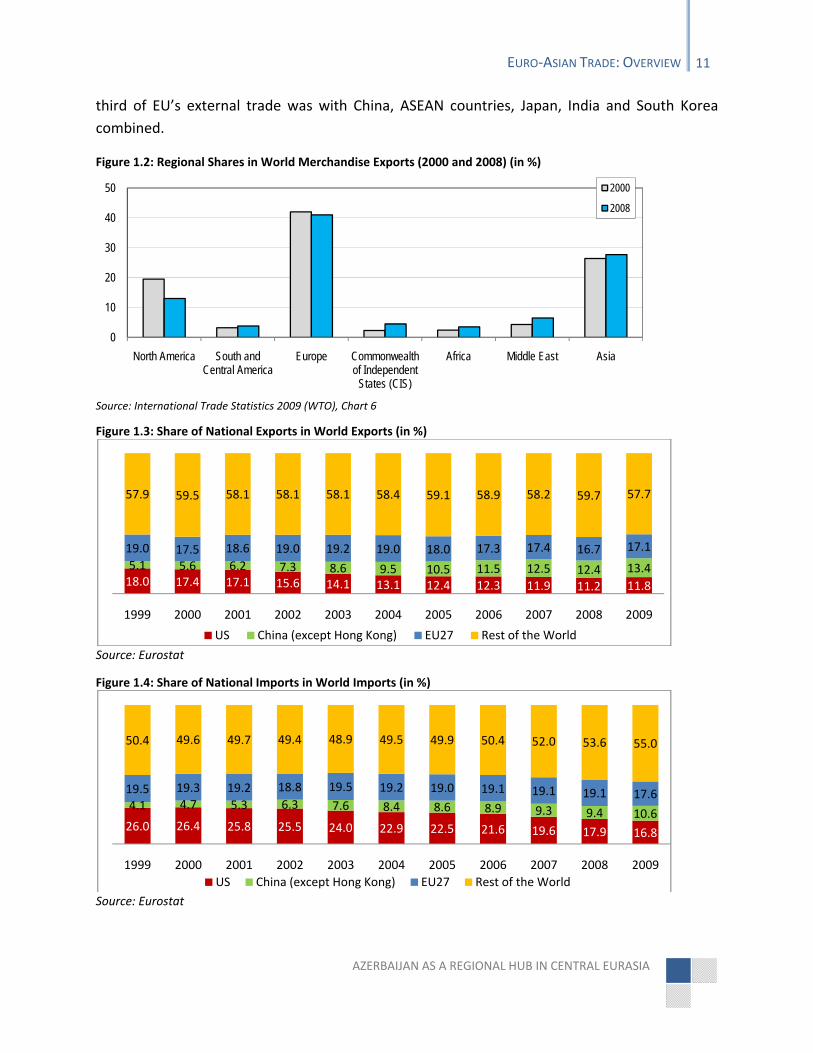
AZERBAIJAN AS A REGIONAL HUB IN CENTRAL EURASIA
EURO‐ASIAN TRADE: OVERVIEW 11
third of EU’s external trade was with China, ASEAN countries, Japan, India and South Korea
combined.
Figure 1.2: Regional Shares in World Merchandise Exports (2000 and 2008) (in %)
Source: International Trade Statistics 2009 (WTO), Chart 6
Figure 1.3: Share of National Exports in World Exports (in %)
Source: Eurostat
Source: Eurostat
0
10
20
30
40
50
North America South and Central America
Europe Commonwealth of Independent
States (CIS)
Africa Middle East Asia
2000
2008
18.0 17.4 17.1 15.6 14.1 13.1 12.4 12.3 11.9 11.2 11.8
5.1 5.6 6.2 7.3 8.6 9.5 10.5 11.5 12.5 12.4 13.4
19.0 17.5 18.6 19.0 19.2 19.0 18.0 17.3 17.4 16.7 17.1
57.9 59.5 58.1 58.1 58.1 58.4 59.1 58.9 58.2 59.7 57.7
1999 2000 2001 2002 2003 2004 2005 2006 2007 2008 2009
US China (except Hong Kong) EU27 Rest of the World
26.0 26.4 25.8 25.5 24.0 22.9 22.5 21.6 19.6 17.9 16.8
4.1 4.7 5.3 6.3 7.6 8.4 8.6 8.9 9.3 9.4 10.6
19.5 19.3 19.2 18.8 19.5 19.2 19.0 19.1 19.1 19.1 17.6
50.4 49.6 49.7 49.4 48.9 49.5 49.9 50.4 52.0 53.6 55.0
1999 2000 2001 2002 2003 2004 2005 2006 2007 2008 2009
US China (except Hong Kong) EU27 Rest of the World
Figure 1.4: Share of National Imports in World Imports (in %)
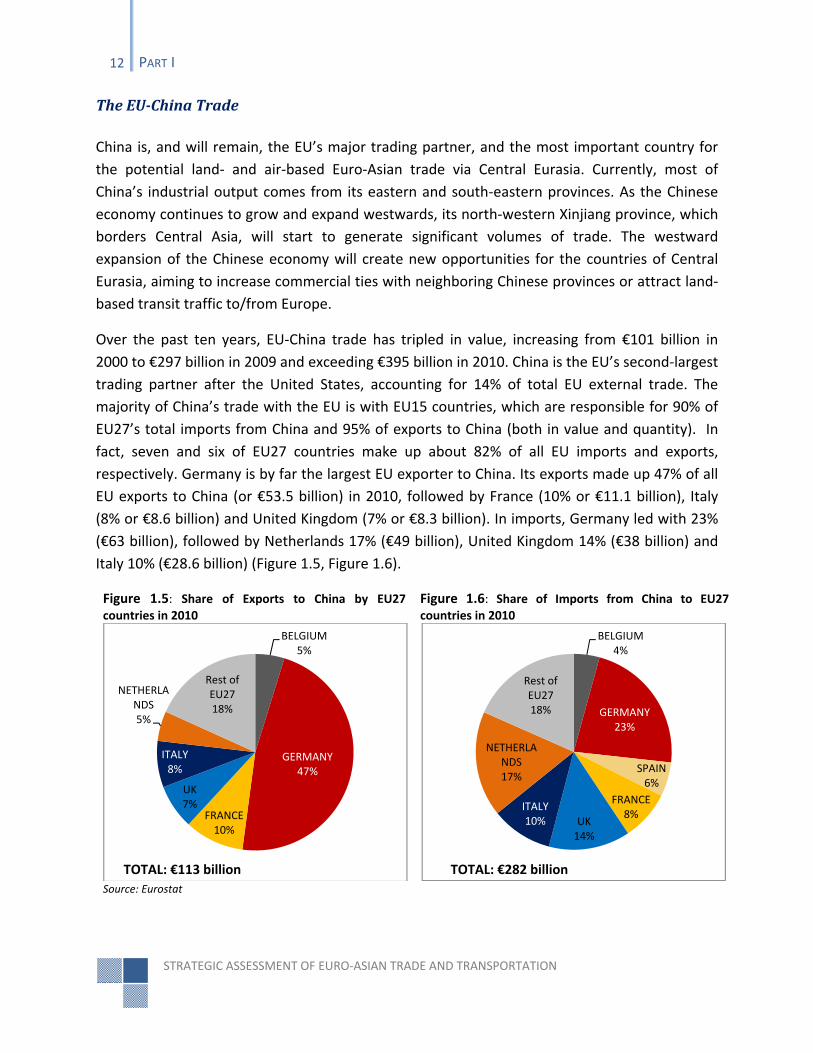
STRATEGIC ASSESSMENT OF EURO‐ASIAN TRADE AND TRANSPORTATION
12 PART I
The EUChina Trade
China is, and will remain, the EU’s major trading partner, and the most important country for
the potential land‐ and air‐based Euro‐Asian trade via Central Eurasia. Currently, most of
China’s industrial output comes from its eastern and south‐eastern provinces. As the Chinese
economy continues to grow and expand westwards, its north‐western Xinjiang province, which
borders Central Asia, will start to generate significant volumes of trade. The westward
expansion of the Chinese economy will create new opportunities for the countries of Central
Eurasia, aiming to increase commercial ties with neighboring Chinese provinces or attract land‐
based transit traffic to/from Europe.
Over the past ten years, EU‐China trade has tripled in value, increasing from €101 billion in
2000 to €297 billion in 2009 and exceeding €395 billion in 2010. China is the EU’s second‐largest
trading partner after the United States, accounting for 14% of total EU external trade. The
majority of China’s trade with the EU is with EU15 countries, which are responsible for 90% of
EU27’s total imports from China and 95% of exports to China (both in value and quantity). In
fact, seven and six of EU27 countries make up about 82% of all EU imports and exports,
respectively. Germany is by far the largest EU exporter to China. Its exports made up 47% of all
EU exports to China (or €53.5 billion) in 2010, followed by France (10% or €11.1 billion), Italy
(8% or €8.6 billion) and United Kingdom (7% or €8.3 billion). In imports, Germany led with 23%
(€63 billion), followed by Netherlands 17% (€49 billion), United Kingdom 14% (€38 billion) and
Italy 10% (€28.6 billion) (Figure 1.5, Figure 1.6).
Figure 1.5: Share of Exports to China by EU27 countries in 2010
Figure 1.6: Share of Imports from China to EU27 countries in 2010
Source: Eurostat
BELGIUM5%
GERMANY47%
FRANCE10%
UK7%
ITALY8%
NETHERLANDS5%
Rest of EU2718%
TOTAL: €113 billion
BELGIUM4%
GERMANY23%
SPAIN6%
FRANCE8%
UK14%
ITALY10%
NETHERLANDS17%
Rest of EU2718%
TOTAL: €282 billion
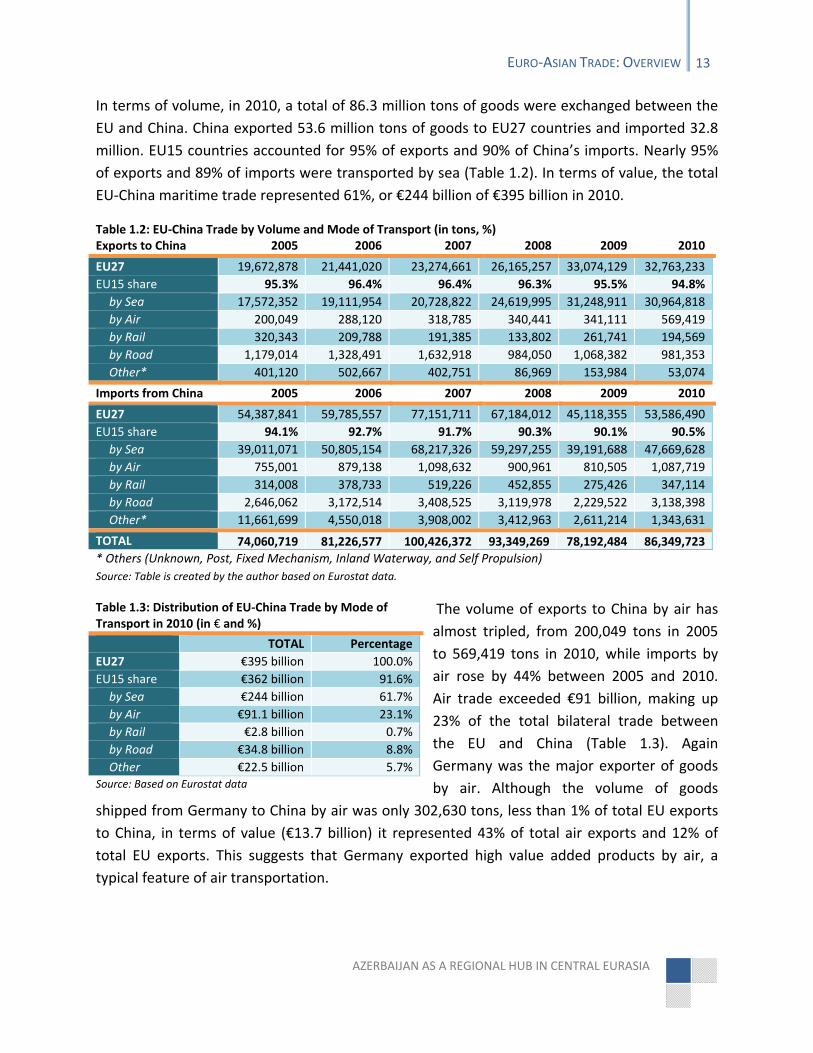
AZERBAIJAN AS A REGIONAL HUB IN CENTRAL EURASIA
EURO‐ASIAN TRADE: OVERVIEW 13
In terms of volume, in 2010, a total of 86.3 million tons of goods were exchanged between the
EU and China. China exported 53.6 million tons of goods to EU27 countries and imported 32.8
million. EU15 countries accounted for 95% of exports and 90% of China’s imports. Nearly 95%
of exports and 89% of imports were transported by sea (Table 1.2). In terms of value, the total
EU‐China maritime trade represented 61%, or €244 billion of €395 billion in 2010.
Exports to China 2005 2006 2007 2008 2009 2010
EU27 19,672,878 21,441,020 23,274,661 26,165,257 33,074,129 32,763,233
EU15 share 95.3% 96.4% 96.4% 96.3% 95.5% 94.8%
by Sea 17,572,352 19,111,954 20,728,822 24,619,995 31,248,911 30,964,818
by Air 200,049 288,120 318,785 340,441 341,111 569,419
by Rail 320,343 209,788 191,385 133,802 261,741 194,569
by Road 1,179,014 1,328,491 1,632,918 984,050 1,068,382 981,353
Other* 401,120 502,667 402,751 86,969 153,984 53,074
Imports from China 2005 2006 2007 2008 2009 2010
EU27 54,387,841 59,785,557 77,151,711 67,184,012 45,118,355 53,586,490
EU15 share 94.1% 92.7% 91.7% 90.3% 90.1% 90.5%
by Sea 39,011,071 50,805,154 68,217,326 59,297,255 39,191,688 47,669,628
by Air 755,001 879,138 1,098,632 900,961 810,505 1,087,719
by Rail 314,008 378,733 519,226 452,855 275,426 347,114
by Road 2,646,062 3,172,514 3,408,525 3,119,978 2,229,522 3,138,398
Other* 11,661,699 4,550,018 3,908,002 3,412,963 2,611,214 1,343,631
TOTAL 74,060,719 81,226,577 100,426,372 93,349,269 78,192,484 86,349,723
* Others (Unknown, Post, Fixed Mechanism, Inland Waterway, and Self Propulsion)
Source: Table is created by the author based on Eurostat data.
The volume of exports to China by air has
almost tripled, from 200,049 tons in 2005
to 569,419 tons in 2010, while imports by
air rose by 44% between 2005 and 2010.
Air trade exceeded €91 billion, making up
23% of the total bilateral trade between
the EU and China (Table 1.3). Again
Germany was the major exporter of goods
by air. Although the volume of goods
shipped from Germany to China by air was only 302,630 tons, less than 1% of total EU exports
to China, in terms of value (€13.7 billion) it represented 43% of total air exports and 12% of
total EU exports. This suggests that Germany exported high value added products by air, a
typical feature of air transportation.
Table 1.2: EU‐China Trade by Volume and Mode of Transport (in tons, %)
Table 1.3: Distribution of EU‐China Trade by Mode of Transport in 2010 (in € and %)
TOTAL Percentage
EU27 €395 billion 100.0%
EU15 share €362 billion 91.6%
by Sea €244 billion 61.7%
by Air €91.1 billion 23.1%
by Rail €2.8 billion 0.7%
by Road €34.8 billion 8.8%
Other €22.5 billion 5.7%Source: Based on Eurostat data
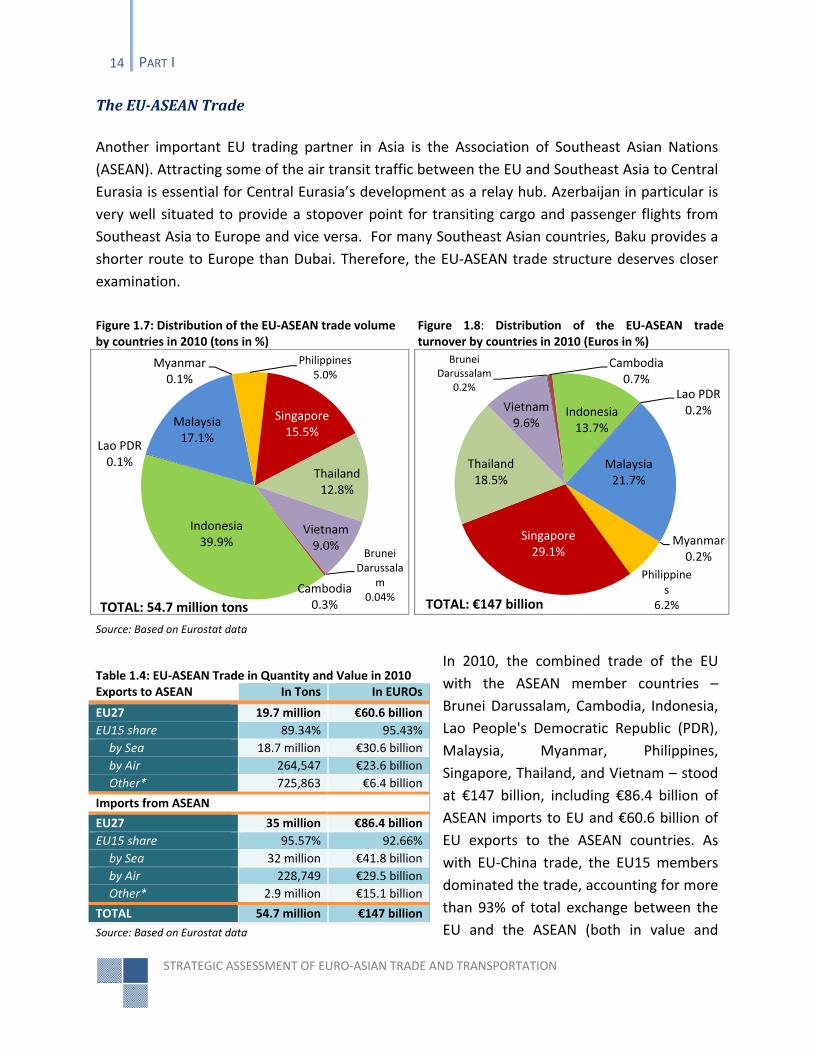
STRATEGIC ASSESSMENT OF EURO‐ASIAN TRADE AND TRANSPORTATION
14 PART I
The EUASEAN Trade
Another important EU trading partner in Asia is the Association of Southeast Asian Nations
(ASEAN). Attracting some of the air transit traffic between the EU and Southeast Asia to Central
Eurasia is essential for Central Eurasia’s development as a relay hub. Azerbaijan in particular is
very well situated to provide a stopover point for transiting cargo and passenger flights from
Southeast Asia to Europe and vice versa. For many Southeast Asian countries, Baku provides a
shorter route to Europe than Dubai. Therefore, the EU‐ASEAN trade structure deserves closer
examination.
In 2010, the combined trade of the EU
with the ASEAN member countries –
Brunei Darussalam, Cambodia, Indonesia,
Lao People's Democratic Republic (PDR),
Malaysia, Myanmar, Philippines,
Singapore, Thailand, and Vietnam – stood
at €147 billion, including €86.4 billion of
ASEAN imports to EU and €60.6 billion of
EU exports to the ASEAN countries. As
with EU‐China trade, the EU15 members
dominated the trade, accounting for more
than 93% of total exchange between the
EU and the ASEAN (both in value and
Figure 1.7: Distribution of the EU‐ASEAN trade volume by countries in 2010 (tons in %)
Figure 1.8: Distribution of the EU‐ASEAN trade turnover by countries in 2010 (Euros in %)
Source: Based on Eurostat data
Table 1.4: EU‐ASEAN Trade in Quantity and Value in 2010 Exports to ASEAN In Tons In EUROs
EU27 19.7 million €60.6 billion
EU15 share 89.34% 95.43%
by Sea 18.7 million €30.6 billion
by Air 264,547 €23.6 billion
Other* 725,863 €6.4 billion
Imports from ASEAN
EU27 35 million €86.4 billion
EU15 share 95.57% 92.66%
by Sea 32 million €41.8 billion
by Air 228,749 €29.5 billion
Other* 2.9 million €15.1 billion
TOTAL 54.7 million €147 billion
Source: Based on Eurostat data
Brunei Darussala
m 0.04%
Cambodia0.3%
Indonesia 39.9%
Lao PDR 0.1%
Malaysia 17.1%
Myanmar 0.1%
Philippines 5.0%
Singapore 15.5%
Thailand 12.8%
Vietnam9.0%
TOTAL: 54.7 million tons
Brunei Darussalam
0.2%
Cambodia0.7%
Indonesia 13.7%
Lao PDR 0.2%
Malaysia 21.7%
Myanmar 0.2%
Philippines
6.2%
Singapore 29.1%
Thailand 18.5%
Vietnam9.6%
TOTAL: €147 billion
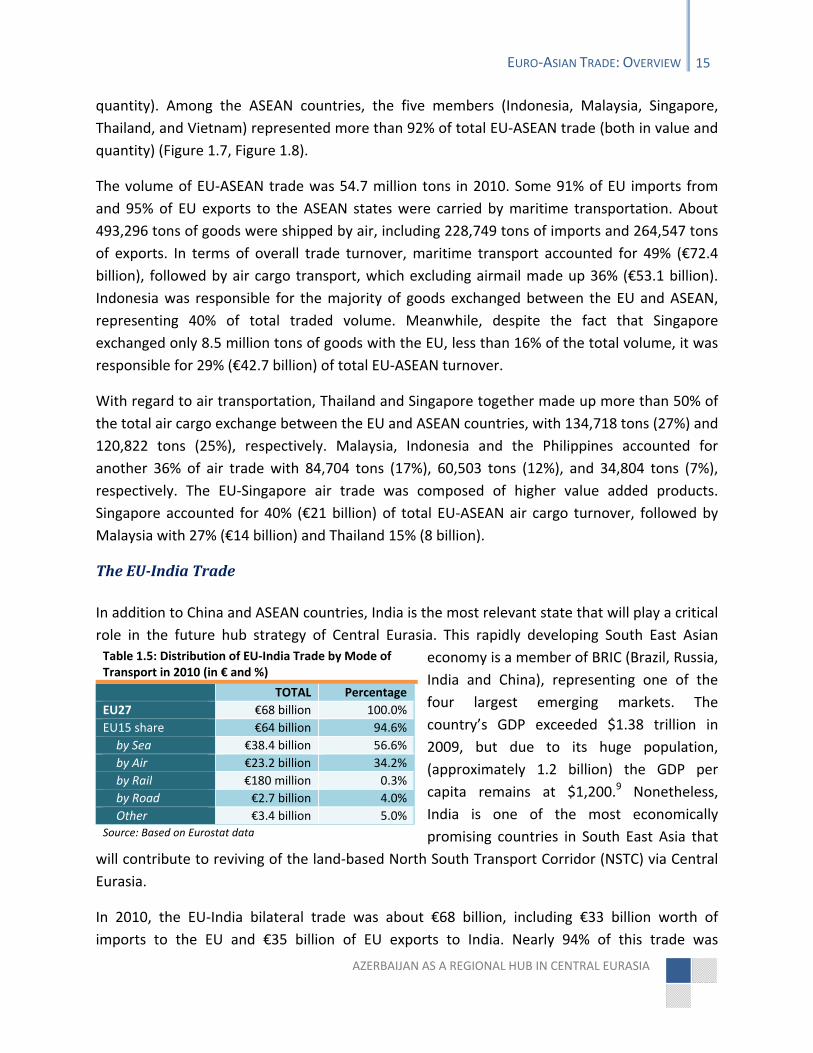
AZERBAIJAN AS A REGIONAL HUB IN CENTRAL EURASIA
EURO‐ASIAN TRADE: OVERVIEW 15
quantity). Among the ASEAN countries, the five members (Indonesia, Malaysia, Singapore,
Thailand, and Vietnam) represented more than 92% of total EU‐ASEAN trade (both in value and
quantity) (Figure 1.7, Figure 1.8).
The volume of EU‐ASEAN trade was 54.7 million tons in 2010. Some 91% of EU imports from
and 95% of EU exports to the ASEAN states were carried by maritime transportation. About
493,296 tons of goods were shipped by air, including 228,749 tons of imports and 264,547 tons
of exports. In terms of overall trade turnover, maritime transport accounted for 49% (€72.4
billion), followed by air cargo transport, which excluding airmail made up 36% (€53.1 billion).
Indonesia was responsible for the majority of goods exchanged between the EU and ASEAN,
representing 40% of total traded volume. Meanwhile, despite the fact that Singapore
exchanged only 8.5 million tons of goods with the EU, less than 16% of the total volume, it was
responsible for 29% (€42.7 billion) of total EU‐ASEAN turnover.
With regard to air transportation, Thailand and Singapore together made up more than 50% of
the total air cargo exchange between the EU and ASEAN countries, with 134,718 tons (27%) and
120,822 tons (25%), respectively. Malaysia, Indonesia and the Philippines accounted for
another 36% of air trade with 84,704 tons (17%), 60,503 tons (12%), and 34,804 tons (7%),
respectively. The EU‐Singapore air trade was composed of higher value added products.
Singapore accounted for 40% (€21 billion) of total EU‐ASEAN air cargo turnover, followed by
Malaysia with 27% (€14 billion) and Thailand 15% (8 billion).
The EUIndia Trade
In addition to China and ASEAN countries, India is the most relevant state that will play a critical
role in the future hub strategy of Central Eurasia. This rapidly developing South East Asian
economy is a member of BRIC (Brazil, Russia,
India and China), representing one of the
four largest emerging markets. The
country’s GDP exceeded $1.38 trillion in
2009, but due to its huge population,
(approximately 1.2 billion) the GDP per
capita remains at $1,200.9 Nonetheless,
India is one of the most economically
promising countries in South East Asia that
will contribute to reviving of the land‐based North South Transport Corridor (NSTC) via Central
Eurasia.
In 2010, the EU‐India bilateral trade was about €68 billion, including €33 billion worth of
imports to the EU and €35 billion of EU exports to India. Nearly 94% of this trade was
Table 1.5: Distribution of EU‐India Trade by Mode of Transport in 2010 (in € and %)
TOTAL Percentage
EU27 €68 billion 100.0%
EU15 share €64 billion 94.6%
by Sea €38.4 billion 56.6%
by Air €23.2 billion 34.2%
by Rail €180 million 0.3%
by Road €2.7 billion 4.0%
Other €3.4 billion 5.0%Source: Based on Eurostat data
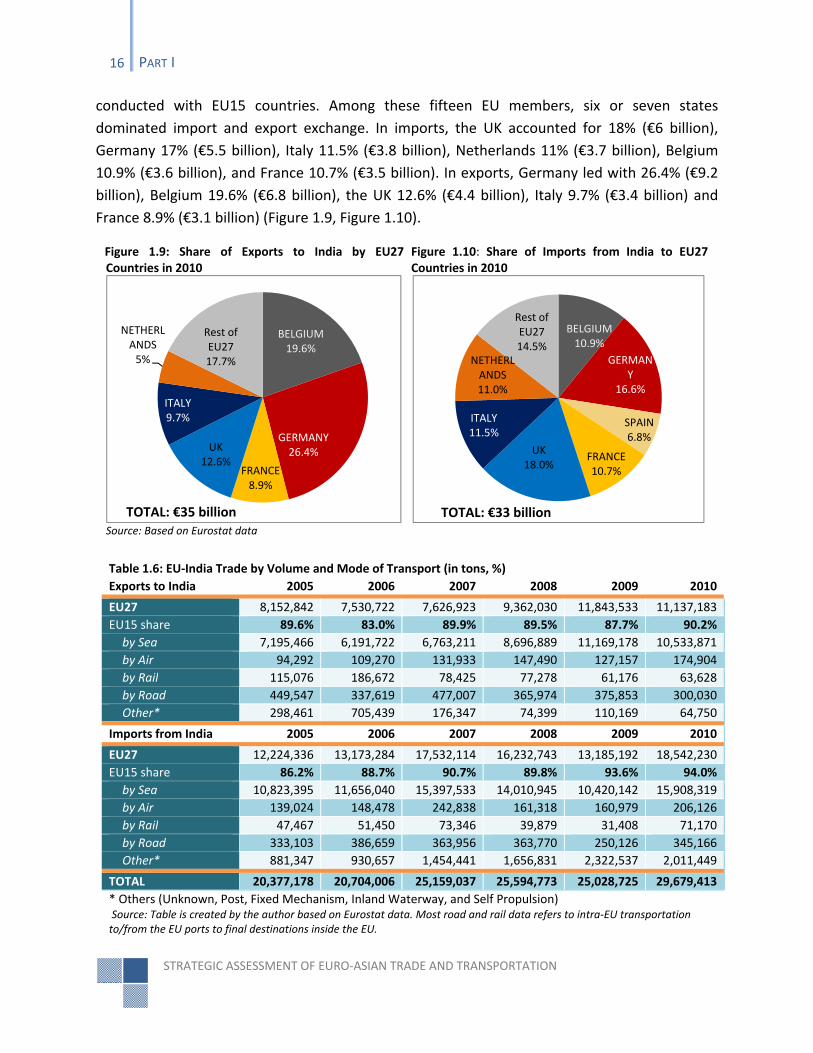
STRATEGIC ASSESSMENT OF EURO‐ASIAN TRADE AND TRANSPORTATION
16 PART I
conducted with EU15 countries. Among these fifteen EU members, six or seven states
dominated import and export exchange. In imports, the UK accounted for 18% (€6 billion),
Germany 17% (€5.5 billion), Italy 11.5% (€3.8 billion), Netherlands 11% (€3.7 billion), Belgium
10.9% (€3.6 billion), and France 10.7% (€3.5 billion). In exports, Germany led with 26.4% (€9.2
billion), Belgium 19.6% (€6.8 billion), the UK 12.6% (€4.4 billion), Italy 9.7% (€3.4 billion) and
France 8.9% (€3.1 billion) (Figure 1.9, Figure 1.10).
Figure 1.9: Share of Exports to India by EU27 Countries in 2010
Figure 1.10: Share of Imports from India to EU27 Countries in 2010
Source: Based on Eurostat data Table 1.6: EU‐India Trade by Volume and Mode of Transport (in tons, %)
Exports to India 2005 2006 2007 2008 2009 2010
EU27 8,152,842 7,530,722 7,626,923 9,362,030 11,843,533 11,137,183
EU15 share 89.6% 83.0% 89.9% 89.5% 87.7% 90.2%
by Sea 7,195,466 6,191,722 6,763,211 8,696,889 11,169,178 10,533,871
by Air 94,292 109,270 131,933 147,490 127,157 174,904
by Rail 115,076 186,672 78,425 77,278 61,176 63,628
by Road 449,547 337,619 477,007 365,974 375,853 300,030
Other* 298,461 705,439 176,347 74,399 110,169 64,750
Imports from India 2005 2006 2007 2008 2009 2010
EU27 12,224,336 13,173,284 17,532,114 16,232,743 13,185,192 18,542,230
EU15 share 86.2% 88.7% 90.7% 89.8% 93.6% 94.0%
by Sea 10,823,395 11,656,040 15,397,533 14,010,945 10,420,142 15,908,319
by Air 139,024 148,478 242,838 161,318 160,979 206,126
by Rail 47,467 51,450 73,346 39,879 31,408 71,170
by Road 333,103 386,659 363,956 363,770 250,126 345,166
Other* 881,347 930,657 1,454,441 1,656,831 2,322,537 2,011,449
TOTAL 20,377,178 20,704,006 25,159,037 25,594,773 25,028,725 29,679,413
* Others (Unknown, Post, Fixed Mechanism, Inland Waterway, and Self Propulsion) Source: Table is created by the author based on Eurostat data. Most road and rail data refers to intra‐EU transportation to/from the EU ports to final destinations inside the EU.
BELGIUM19.6%
GERMANY26.4%
FRANCE8.9%
UK12.6%
ITALY9.7%
NETHERLANDS5%
Rest of EU2717.7%
TOTAL: €35 billion
BELGIUM10.9%
GERMANY
16.6%
SPAIN6.8%
FRANCE10.7%
UK18.0%
ITALY11.5%
NETHERLANDS11.0%
Rest of EU2714.5%
TOTAL: €33 billion
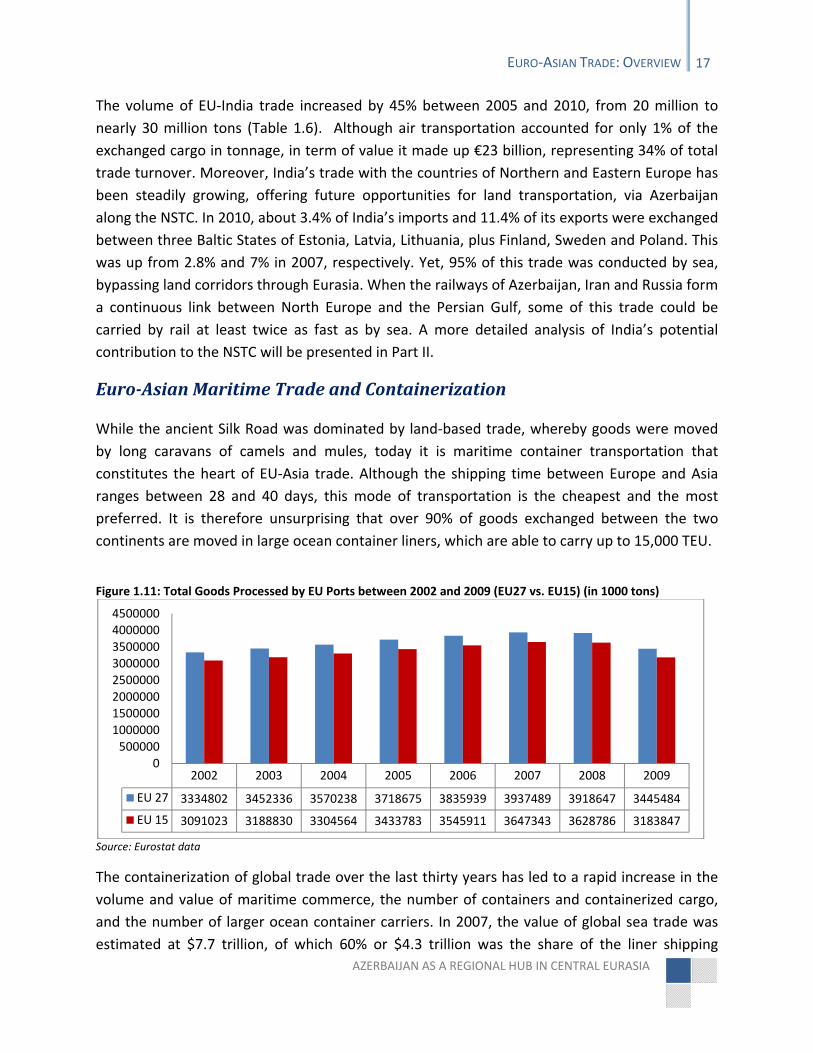
AZERBAIJAN AS A REGIONAL HUB IN CENTRAL EURASIA
EURO‐ASIAN TRADE: OVERVIEW 17
The volume of EU‐India trade increased by 45% between 2005 and 2010, from 20 million to
nearly 30 million tons (Table 1.6). Although air transportation accounted for only 1% of the
exchanged cargo in tonnage, in term of value it made up €23 billion, representing 34% of total
trade turnover. Moreover, India’s trade with the countries of Northern and Eastern Europe has
been steadily growing, offering future opportunities for land transportation, via Azerbaijan
along the NSTC. In 2010, about 3.4% of India’s imports and 11.4% of its exports were exchanged
between three Baltic States of Estonia, Latvia, Lithuania, plus Finland, Sweden and Poland. This
was up from 2.8% and 7% in 2007, respectively. Yet, 95% of this trade was conducted by sea,
bypassing land corridors through Eurasia. When the railways of Azerbaijan, Iran and Russia form
a continuous link between North Europe and the Persian Gulf, some of this trade could be
carried by rail at least twice as fast as by sea. A more detailed analysis of India’s potential
contribution to the NSTC will be presented in Part II.
EuroAsian Maritime Trade and Containerization
While the ancient Silk Road was dominated by land‐based trade, whereby goods were moved
by long caravans of camels and mules, today it is maritime container transportation that
constitutes the heart of EU‐Asia trade. Although the shipping time between Europe and Asia
ranges between 28 and 40 days, this mode of transportation is the cheapest and the most
preferred. It is therefore unsurprising that over 90% of goods exchanged between the two
continents are moved in large ocean container liners, which are able to carry up to 15,000 TEU.
Figure 1.11: Total Goods Processed by EU Ports between 2002 and 2009 (EU27 vs. EU15) (in 1000 tons)
Source: Eurostat data
The containerization of global trade over the last thirty years has led to a rapid increase in the
volume and value of maritime commerce, the number of containers and containerized cargo,
and the number of larger ocean container carriers. In 2007, the value of global sea trade was
estimated at $7.7 trillion, of which 60% or $4.3 trillion was the share of the liner shipping
2002 2003 2004 2005 2006 2007 2008 2009
EU 27 3334802 3452336 3570238 3718675 3835939 3937489 3918647 3445484
EU 15 3091023 3188830 3304564 3433783 3545911 3647343 3628786 3183847
0
5000001000000
15000002000000
2500000
30000003500000
40000004500000
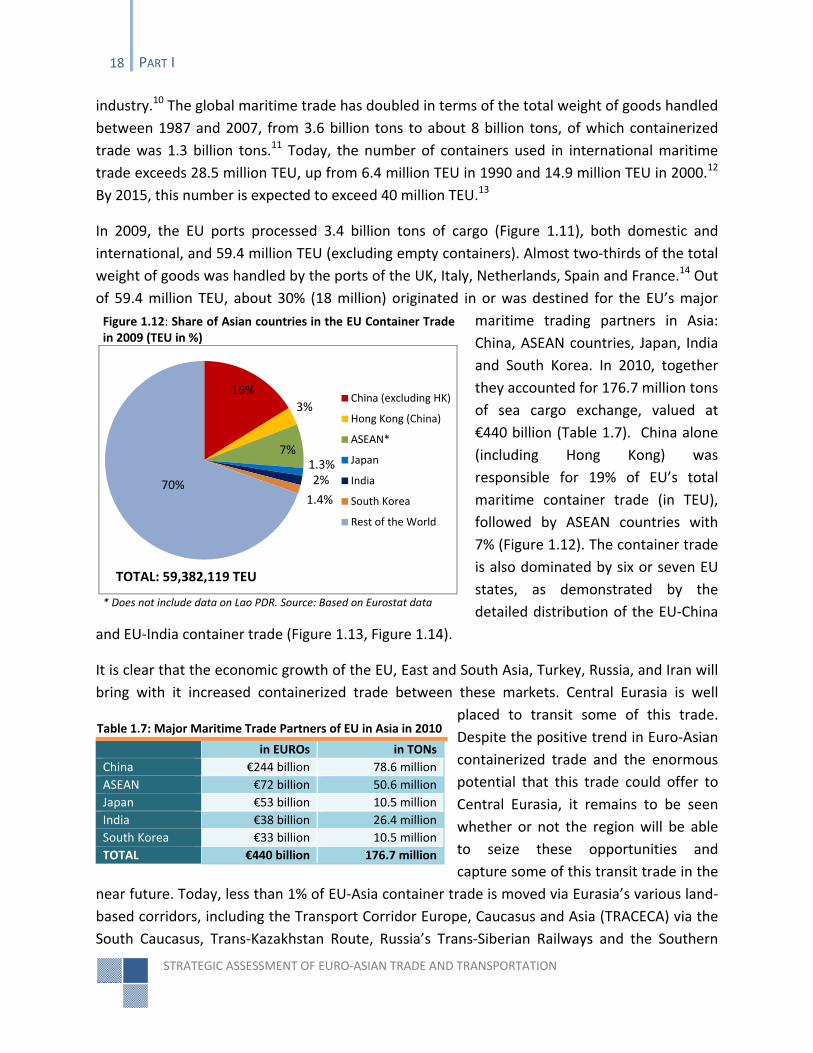
STRATEGIC ASSESSMENT OF EURO‐ASIAN TRADE AND TRANSPORTATION
18 PART I
industry.10 The global maritime trade has doubled in terms of the total weight of goods handled
between 1987 and 2007, from 3.6 billion tons to about 8 billion tons, of which containerized
trade was 1.3 billion tons.11 Today, the number of containers used in international maritime
trade exceeds 28.5 million TEU, up from 6.4 million TEU in 1990 and 14.9 million TEU in 2000.12
By 2015, this number is expected to exceed 40 million TEU.13
In 2009, the EU ports processed 3.4 billion tons of cargo (Figure 1.11), both domestic and
international, and 59.4 million TEU (excluding empty containers). Almost two‐thirds of the total
weight of goods was handled by the ports of the UK, Italy, Netherlands, Spain and France.14 Out
of 59.4 million TEU, about 30% (18 million) originated in or was destined for the EU’s major
maritime trading partners in Asia:
China, ASEAN countries, Japan, India
and South Korea. In 2010, together
they accounted for 176.7 million tons
of sea cargo exchange, valued at
€440 billion (Table 1.7). China alone
(including Hong Kong) was
responsible for 19% of EU’s total
maritime container trade (in TEU),
followed by ASEAN countries with
7% (Figure 1.12). The container trade
is also dominated by six or seven EU
states, as demonstrated by the
detailed distribution of the EU‐China
and EU‐India container trade (Figure 1.13, Figure 1.14).
It is clear that the economic growth of the EU, East and South Asia, Turkey, Russia, and Iran will
bring with it increased containerized trade between these markets. Central Eurasia is well
placed to transit some of this trade.
Despite the positive trend in Euro‐Asian
containerized trade and the enormous
potential that this trade could offer to
Central Eurasia, it remains to be seen
whether or not the region will be able
to seize these opportunities and
capture some of this transit trade in the
near future. Today, less than 1% of EU‐Asia container trade is moved via Eurasia’s various land‐
based corridors, including the Transport Corridor Europe, Caucasus and Asia (TRACECA) via the
South Caucasus, Trans‐Kazakhstan Route, Russia’s Trans‐Siberian Railways and the Southern
Figure 1.12: Share of Asian countries in the EU Container Trade in 2009 (TEU in %)
* Does not include data on Lao PDR. Source: Based on Eurostat data
Table 1.7: Major Maritime Trade Partners of EU in Asia in 2010
in EUROs in TONs
China €244 billion 78.6 million
ASEAN €72 billion 50.6 million
Japan €53 billion 10.5 million
India €38 billion 26.4 million
South Korea €33 billion 10.5 million
TOTAL €440 billion 176.7 million
16%
3%
7%1.3%2%
1.4%70%
China (excluding HK)
Hong Kong (China)
ASEAN*
Japan
India
South Korea
Rest of the World
TOTAL: 59,382,119 TEU
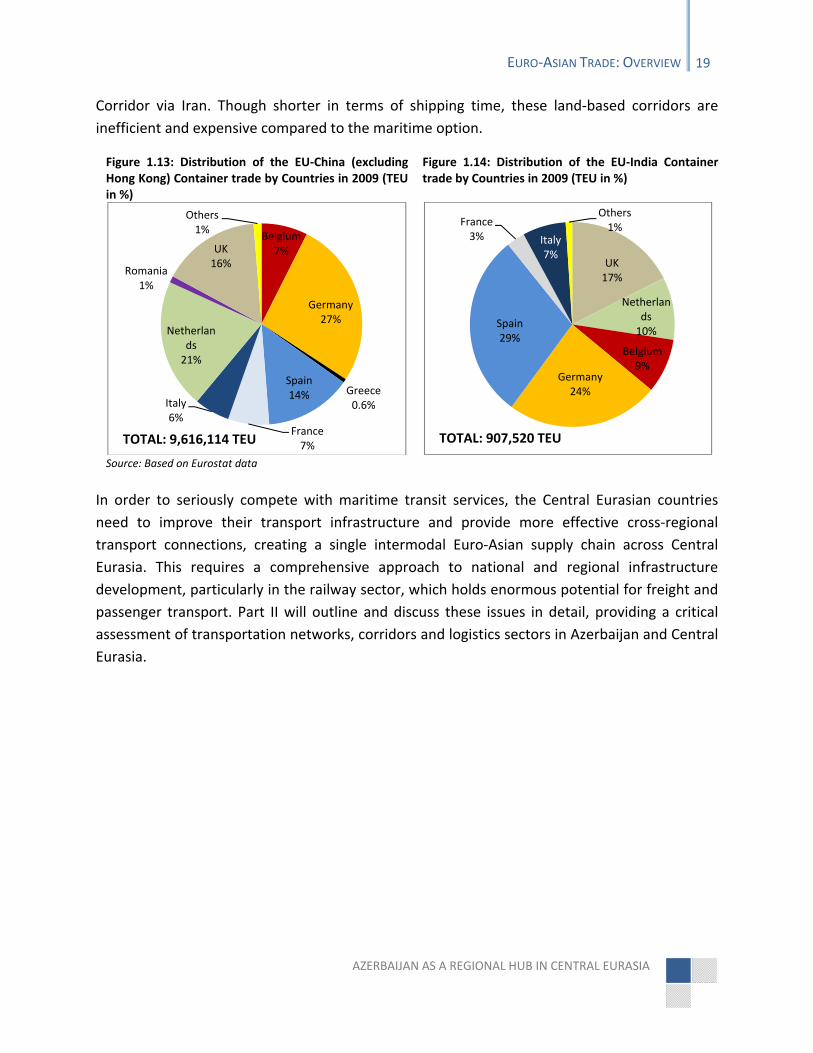
AZERBAIJAN AS A REGIONAL HUB IN CENTRAL EURASIA
EURO‐ASIAN TRADE: OVERVIEW 19
Corridor via Iran. Though shorter in terms of shipping time, these land‐based corridors are
inefficient and expensive compared to the maritime option.
Figure 1.13: Distribution of the EU‐China (excluding Hong Kong) Container trade by Countries in 2009 (TEU in %)
Figure 1.14: Distribution of the EU‐India Container trade by Countries in 2009 (TEU in %)
Source: Based on Eurostat data In order to seriously compete with maritime transit services, the Central Eurasian countries
need to improve their transport infrastructure and provide more effective cross‐regional
transport connections, creating a single intermodal Euro‐Asian supply chain across Central
Eurasia. This requires a comprehensive approach to national and regional infrastructure
development, particularly in the railway sector, which holds enormous potential for freight and
passenger transport. Part II will outline and discuss these issues in detail, providing a critical
assessment of transportation networks, corridors and logistics sectors in Azerbaijan and Central
Eurasia.
Belgium7%
Germany27%
Greece0.6%
Spain14%
France7%
Italy6%
Netherlands21%
Romania1%
UK16%
Others1%
TOTAL: 9,616,114 TEU
UK17%
Netherlands10%
Belgium9%
Germany24%
Spain29%
France3% Italy
7%
Others1%
TOTAL: 907,520 TEU

STRATEGIC ASSESSMENT OF EURO‐ASIAN TRADE AND TRANSPORTATION
20 PART II
AZERBAIJAN AS A REGIONAL HUB IN CENTRAL EURASIA
PART II
ASSESSING THE PRESENT:
TRANSPORT, CORRIDORS, AND LOGISTICS IN EURASIA

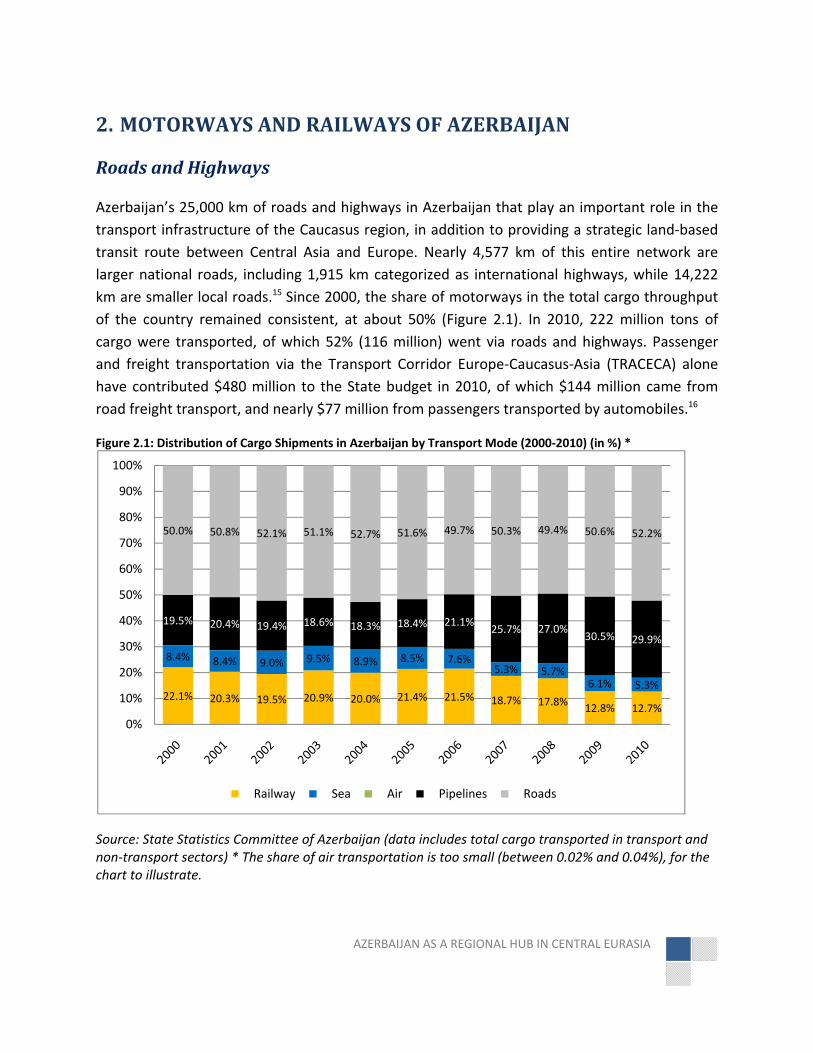
AZERBAIJAN AS A REGIONAL HUB IN CENTRAL EURASIA
2. MOTORWAYS AND RAILWAYS OF AZERBAIJAN
Roads and Highways
Azerbaijan’s 25,000 km of roads and highways in Azerbaijan that play an important role in the
transport infrastructure of the Caucasus region, in addition to providing a strategic land‐based
transit route between Central Asia and Europe. Nearly 4,577 km of this entire network are
larger national roads, including 1,915 km categorized as international highways, while 14,222
km are smaller local roads.15 Since 2000, the share of motorways in the total cargo throughput
of the country remained consistent, at about 50% (Figure 2.1). In 2010, 222 million tons of
cargo were transported, of which 52% (116 million) went via roads and highways. Passenger
and freight transportation via the Transport Corridor Europe‐Caucasus‐Asia (TRACECA) alone
have contributed $480 million to the State budget in 2010, of which $144 million came from
road freight transport, and nearly $77 million from passengers transported by automobiles.16
Source: State Statistics Committee of Azerbaijan (data includes total cargo transported in transport and non‐transport sectors) * The share of air transportation is too small (between 0.02% and 0.04%), for the chart to illustrate.
22.1% 20.3% 19.5% 20.9% 20.0% 21.4% 21.5% 18.7% 17.8%12.8% 12.7%
8.4% 8.4% 9.0% 9.5% 8.9% 8.5% 7.6%5.3% 5.7%
6.1% 5.3%
19.5% 20.4% 19.4% 18.6% 18.3% 18.4% 21.1%25.7% 27.0%
30.5% 29.9%
50.0% 50.8% 52.1% 51.1% 52.7% 51.6% 49.7% 50.3% 49.4% 50.6% 52.2%
0%
10%
20%
30%
40%
50%
60%
70%
80%
90%
100%
Railway Sea Air Pipelines Roads
Figure 2.1: Distribution of Cargo Shipments in Azerbaijan by Transport Mode (2000‐2010) (in %) *
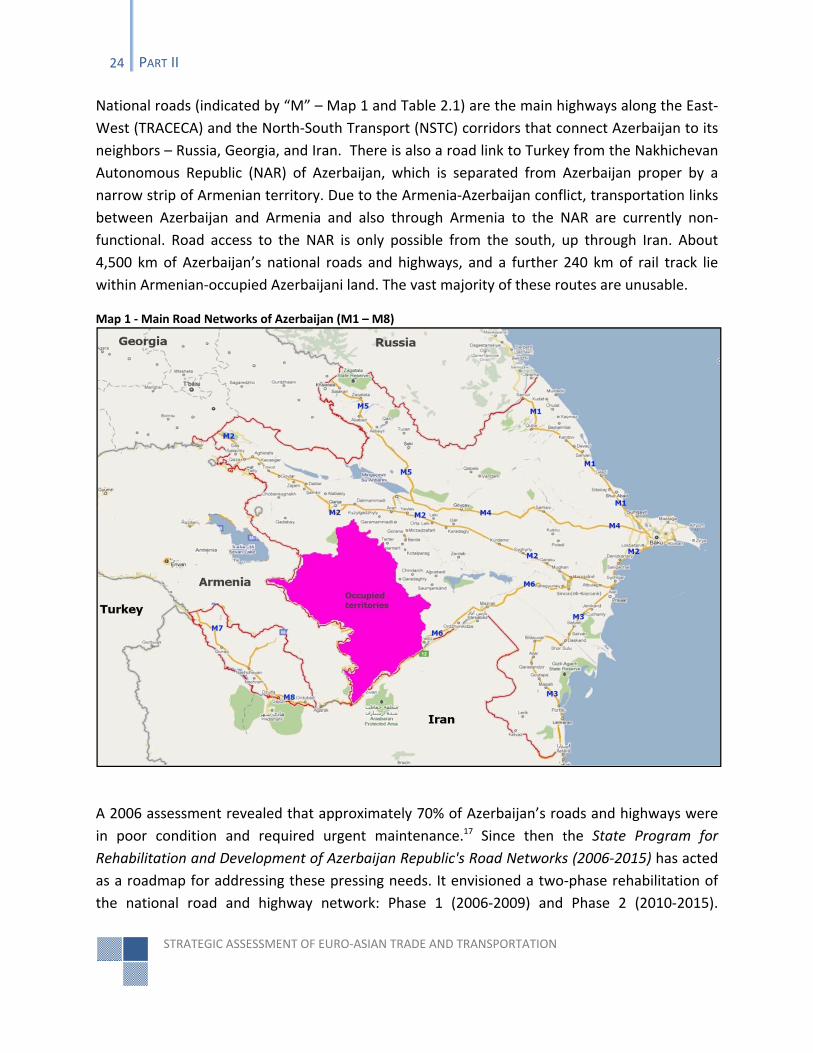
STRATEGIC ASSESSMENT OF EURO‐ASIAN TRADE AND TRANSPORTATION
24 PART II
National roads (indicated by “M” – Map 1 and Table 2.1) are the main highways along the East‐
West (TRACECA) and the North‐South Transport (NSTC) corridors that connect Azerbaijan to its
neighbors – Russia, Georgia, and Iran. There is also a road link to Turkey from the Nakhichevan
Autonomous Republic (NAR) of Azerbaijan, which is separated from Azerbaijan proper by a
narrow strip of Armenian territory. Due to the Armenia‐Azerbaijan conflict, transportation links
between Azerbaijan and Armenia and also through Armenia to the NAR are currently non‐
functional. Road access to the NAR is only possible from the south, up through Iran. About
4,500 km of Azerbaijan’s national roads and highways, and a further 240 km of rail track lie
within Armenian‐occupied Azerbaijani land. The vast majority of these routes are unusable.
Map 1 ‐ Main Road Networks of Azerbaijan (M1 – M8)
A 2006 assessment revealed that approximately 70% of Azerbaijan’s roads and highways were
in poor condition and required urgent maintenance.17 Since then the State Program for
Rehabilitation and Development of Azerbaijan Republic's Road Networks (2006‐2015) has acted
as a roadmap for addressing these pressing needs. It envisioned a two‐phase rehabilitation of
the national road and highway network: Phase 1 (2006‐2009) and Phase 2 (2010‐2015).
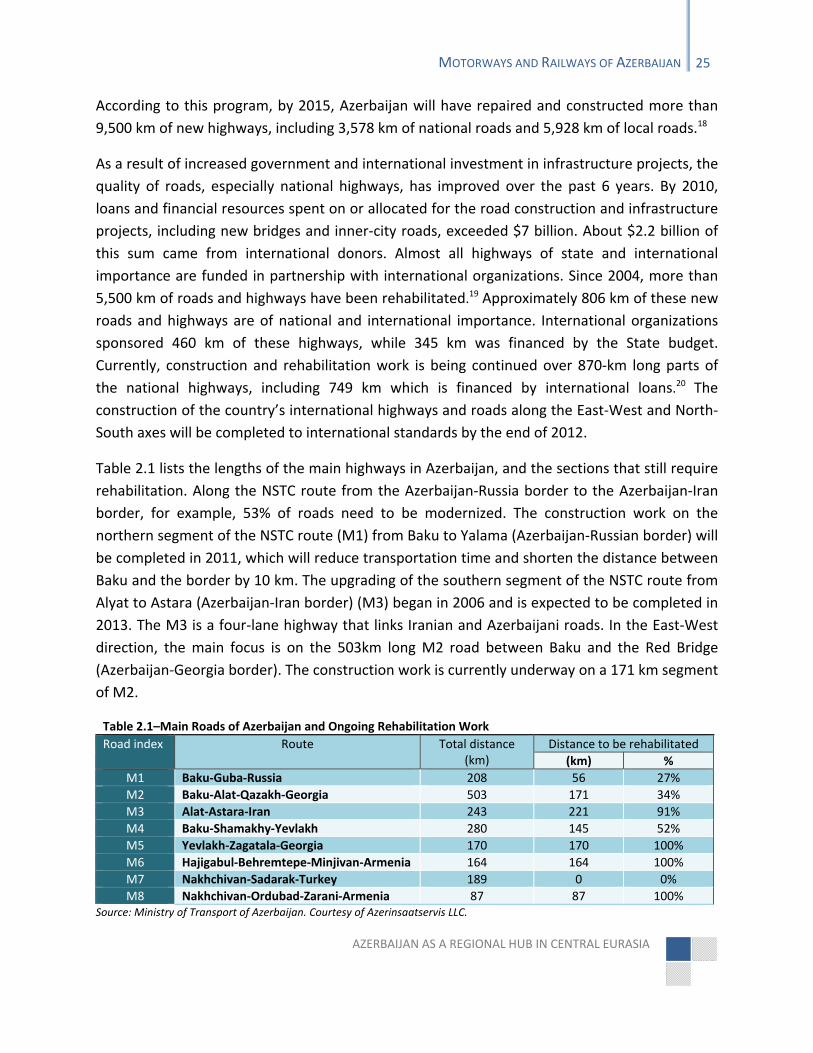
AZERBAIJAN AS A REGIONAL HUB IN CENTRAL EURASIA
MOTORWAYS AND RAILWAYS OF AZERBAIJAN 25
According to this program, by 2015, Azerbaijan will have repaired and constructed more than
9,500 km of new highways, including 3,578 km of national roads and 5,928 km of local roads.18
As a result of increased government and international investment in infrastructure projects, the
quality of roads, especially national highways, has improved over the past 6 years. By 2010,
loans and financial resources spent on or allocated for the road construction and infrastructure
projects, including new bridges and inner‐city roads, exceeded $7 billion. About $2.2 billion of
this sum came from international donors. Almost all highways of state and international
importance are funded in partnership with international organizations. Since 2004, more than
5,500 km of roads and highways have been rehabilitated.19 Approximately 806 km of these new
roads and highways are of national and international importance. International organizations
sponsored 460 km of these highways, while 345 km was financed by the State budget.
Currently, construction and rehabilitation work is being continued over 870‐km long parts of
the national highways, including 749 km which is financed by international loans.20 The
construction of the country’s international highways and roads along the East‐West and North‐
South axes will be completed to international standards by the end of 2012.
Table 2.1 lists the lengths of the main highways in Azerbaijan, and the sections that still require
rehabilitation. Along the NSTC route from the Azerbaijan‐Russia border to the Azerbaijan‐Iran
border, for example, 53% of roads need to be modernized. The construction work on the
northern segment of the NSTC route (M1) from Baku to Yalama (Azerbaijan‐Russian border) will
be completed in 2011, which will reduce transportation time and shorten the distance between
Baku and the border by 10 km. The upgrading of the southern segment of the NSTC route from
Alyat to Astara (Azerbaijan‐Iran border) (M3) began in 2006 and is expected to be completed in
2013. The M3 is a four‐lane highway that links Iranian and Azerbaijani roads. In the East‐West
direction, the main focus is on the 503km long M2 road between Baku and the Red Bridge
(Azerbaijan‐Georgia border). The construction work is currently underway on a 171 km segment
of M2.
Table 2.1–Main Roads of Azerbaijan and Ongoing Rehabilitation Work
Road index Route Total distance (km)
Distance to be rehabilitated
(km) %
M1 Baku‐Guba‐Russia 208 56 27%
M2 Baku‐Alat‐Qazakh‐Georgia 503 171 34%
M3 Alat‐Astara‐Iran 243 221 91%
M4 Baku‐Shamakhy‐Yevlakh 280 145 52%
M5 Yevlakh‐Zagatala‐Georgia 170 170 100%
M6 Hajigabul‐Behremtepe‐Minjivan‐Armenia 164 164 100%
M7 Nakhchivan‐Sadarak‐Turkey 189 0 0%
M8 Nakhchivan‐Ordubad‐Zarani‐Armenia 87 87 100%Source: Ministry of Transport of Azerbaijan. Courtesy of Azerinsaatservis LLC.
STRATEGIC ASSESSMENT OF EURO‐ASIAN TRADE AND TRANSPORTATION
26 PART II
In terms of road and highway construction, the two major challenges awaiting the government
in the short and medium term are quality control and maintenance. To guarantee both a
consistent flow of transit cargo through Azerbaijan and the long‐term sustainability of national
and international highways, the government must ensure that roads and highways, particularly
those being built in the East‐West and North‐South directions, meet the highest international
standards. Under the current system, each administrative region of Azerbaijan is responsible for
the maintenance of the segment of the state highway that passes through its administrative
boundaries. There is no centralized approach to road and highway maintenance. The
government needs to think about implementing a toll system on future express highways, as
well as creating a state agency to oversee and regulate the maintenance of all internationally
important roads and highways. These international road networks and their maintenance
should be accorded priority status in Azerbaijan’s hub strategy.
Railways
According to official statistics, there are more than 2,932 km of railways in Azerbaijan, with
2,117 km currently in use. This includes 815 km of double track railways, mostly in the northern
(Baku‐Yalama) and western (Baku‐Boyuk Kesik) directions. Some 60% of the railways or 1,272
km are electric, which are mostly along the international corridors with the exception of the
183 km southern segment of the NSTC linking Yeni Osmanli to Astara. Out of 121 rail stations
that could be used for freight handling, at least three (Ganja, Keshla and Khirdalan) have the
capacity to store and handle large containers.21 The Port of Baku also has a rail access point
where containers can be processed.
In 1987, the Azerbaijani railways carried 44.5 million tons of cargo, of which only 12.9 million
(29%) were oil and petroleum products.22 Although the total cargo carried by railways (in tons)
has increased from 23.2 million to 28.3 million between 2000 and 2010, rail transport in 2010
accounted for only 13% of total cargo transportation, having dropped from 22% in 2000 (Figure
2.1). This decrease is largely due to the significant increase in the volume of exported and
transited oil, of which the majority is carried by pipelines rather than rail. Today, oil and
petroleum products constitute 76% of the outgoing rail freight (2009 data).23 Construction
materials are another important export, making up 16% of total outgoing cargo in 2009.
Most of the cargo is transported in tank cars and wagons owned by Azerbaijan Railways (ADY),
which was transformed into a Joint Stock Company by a Presidential decree from July 20, 2009.
It was further divided into four subsidiaries: Infrastructure, Passenger Services, Freight, Capital
Rehabilitation and Maintenance. This was the first step towards reforming the inefficient state‐
owned Azerbaijan State Railway Company (ADDY), the predecessor of ADY, and to create a
financially stable railway sector in the country, which is yet to happen.
AZERBAIJAN AS A REGIONAL HUB IN CENTRAL EURASIA
MOTORWAYS AND RAILWAYS OF AZERBAIJAN 27
Although the ADY fleet directory still lists a large number of railway locomotives (237 in 2009),
passenger coaches (725), and freight cars/wagons (18,526),24 most of them are either obsolete
(about 40‐45 years old) or in need of repair. In addition, the level of investment in motorways
has been far higher than in railways. For example, between 2004 and 2008, just $83 million was
invested in the country’s railway sector, while in 2008‐2009 alone, the motorways received
over $3.3 billion.25
As of 2010, the railway sector is finally receiving the attention and investment it deserves. The
State Program on Improvement of Railway Systems in 2010‐2014, signed by President Aliyev on
6 July 2010, will increase the competitiveness of ADY and help the company rebuild its
outdated fleet. This document highlights the railway sector’s short‐ and mid‐term objectives
and investment schemes up until 2014. If it is adhered to, this program will eliminate the
majority of the outstanding issues in this sector and bring the country’s railway system up to
international standards. Specific actions include: the ADY will be subject to further
corporatization reforms in order that it can adequately respond to the demands of the market
economy, and prepare for increased traffic via Azerbaijan; the railways along the TRACECA and
the NSTC routes will be modernized; the electric lines will be upgraded to a 25 kV alternate
constant current; and the ADY fleet will be substantially renovated (by rehabilitating existing
wagons, tank cars, depots and more than 50 locomotives, and by purchasing additional 50 AC
electric locomotives, tank cars for oil, dry cargo wagons and new equipment).26
The modernization of ADY will coincide with the completion of the strategic railway link
between Azerbaijan, Georgia and Turkey (Baku‐Tbilisi‐Kars (BTK) project). Thanks to the $200
million long‐term loan Azerbaijan gave to Georgia, construction of the Kars‐Akhalkalaki railway
(Georgia‐Turkey segment) started in 2009 and is expected to be completed by 2012. The
Azerbaijani government is currently negotiating another soft loan for Georgia in the amount of
$500 million. A 29 km segment of the railway is under construction in Georgia, and another 76
km segment is being built in Turkey. Once finished, the railway will process between 2 and 5
million tons of cargo per year in the short term, and up to 20 million tons of cargo and 3 million
passengers annually by 2034. The Kars‐Akhalkalaki railway will eliminate the missing link in
Euro‐Asian rail transportation and effectively create a new Eurasian rail corridor through
Azerbaijan stretching from China to Europe.

AZERBAIJAN AS A REGIONAL HUB IN CENTRAL EURASIA
EURASIAN TRANSPORT CORRIDORS
Tracing many of its ancient paths, today’s New Silk Road crosses Eurasia via a number of
transport corridors and routes. There are various rail and road corridors across Eurasia
categorized by different international organizations, including UNECE, UNESCAP, ABD’s CAREC
and IRU. Each corridor is important in its own right, and each merits an in‐depth analysis.
However, this study will limit itself to an examination of three main East‐West corridors
connecting Asia to Europe via Central Eurasia. The three main East‐West corridors are the
Central Corridor (TRACECA) via the South Caucasus; the Northern Corridors (Trans‐Eurasian
Express (TEE), Trans‐Siberian Railway (TSR) and Trans‐Kazakhstan Route) across Russia and
Central Asia; and the Southern Corridor that runs through Iran.
The Central Corridor: Transport Corridor Europe, Caucasus, Asia (TRACECA)
A Limping Leg of the New Silk Road
The Transport Corridor Europe, Caucasus and Asia (TRACECA) program is an EU‐led
international intermodal transport initiative. It dates back to the May 1993 Brussels conference
between three South Caucasus and five Central Asian countries. The program received
additional impetus with the signing of the “Basic Multilateral Agreement on International
Transport for Development of the Europe‐the Caucasus‐Asia Corridor”, which took place during
a historical summit in Baku in September 1998. Member states established an
Intergovernmental Commission (IGC) and the TRACECA Permanent Secretariat, based in Baku.
The original signatories included twelve countries: Armenia, Azerbaijan, Bulgaria, Georgia,
Kazakhstan, Kyrgyzstan, Moldova, Romania, Tajikistan, Turkey, Ukraine, and Uzbekistan. The
13th member, the Islamic Republic of Iran, joined the TRACECA in 2009, while Lithuania has
acted as an observer. 27
Since 1998, the European Union (EU) has implemented almost 80 technical assistance and
investment projects, together worth more than €163 million. The EBRD alone has allocated
€700 million for capital projects on ports, railways, and road along the TRACECA route. The
TRACECA signatories have worked together to better integrate their infrastructures and to
establish a sustainable multi‐modal transport chain, which will in turn ensure the gradual
integration of the corridor into the Trans‐European Transport Networks (TENs), the UNECE
Trans‐European Motorways (TEM) and the Trans‐European Railways (TER) initiatives. Member
states are pursuing this strategy with the aim of creating a reliable transit bridge between
major markets in Europe and East and South Asia. The success of TRACECA program and the EU
investments will depend on further regulatory and institutional reforms within the transport
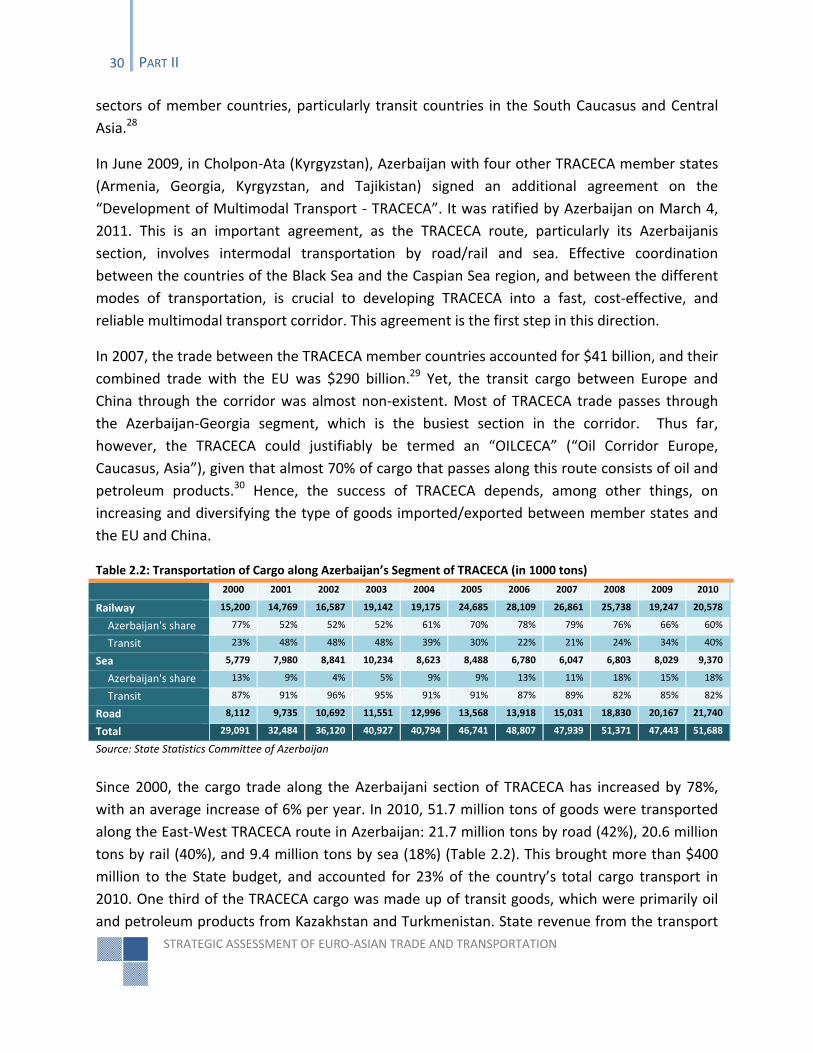
STRATEGIC ASSESSMENT OF EURO‐ASIAN TRADE AND TRANSPORTATION
30 PART II
sectors of member countries, particularly transit countries in the South Caucasus and Central
Asia.28
In June 2009, in Cholpon‐Ata (Kyrgyzstan), Azerbaijan with four other TRACECA member states
(Armenia, Georgia, Kyrgyzstan, and Tajikistan) signed an additional agreement on the
“Development of Multimodal Transport ‐ TRACECA”. It was ratified by Azerbaijan on March 4,
2011. This is an important agreement, as the TRACECA route, particularly its Azerbaijanis
section, involves intermodal transportation by road/rail and sea. Effective coordination
between the countries of the Black Sea and the Caspian Sea region, and between the different
modes of transportation, is crucial to developing TRACECA into a fast, cost‐effective, and
reliable multimodal transport corridor. This agreement is the first step in this direction.
In 2007, the trade between the TRACECA member countries accounted for $41 billion, and their
combined trade with the EU was $290 billion.29 Yet, the transit cargo between Europe and
China through the corridor was almost non‐existent. Most of TRACECA trade passes through
the Azerbaijan‐Georgia segment, which is the busiest section in the corridor. Thus far,
however, the TRACECA could justifiably be termed an “OILCECA” (“Oil Corridor Europe,
Caucasus, Asia”), given that almost 70% of cargo that passes along this route consists of oil and
petroleum products.30 Hence, the success of TRACECA depends, among other things, on
increasing and diversifying the type of goods imported/exported between member states and
the EU and China.
Table 2.2: Transportation of Cargo along Azerbaijan’s Segment of TRACECA (in 1000 tons)
2000 2001 2002 2003 2004 2005 2006 2007 2008 2009 2010
Railway 15,200 14,769 16,587 19,142 19,175 24,685 28,109 26,861 25,738 19,247 20,578
Azerbaijan's share 77% 52% 52% 52% 61% 70% 78% 79% 76% 66% 60%
Transit 23% 48% 48% 48% 39% 30% 22% 21% 24% 34% 40%
Sea 5,779 7,980 8,841 10,234 8,623 8,488 6,780 6,047 6,803 8,029 9,370
Azerbaijan's share 13% 9% 4% 5% 9% 9% 13% 11% 18% 15% 18%
Transit 87% 91% 96% 95% 91% 91% 87% 89% 82% 85% 82%
Road 8,112 9,735 10,692 11,551 12,996 13,568 13,918 15,031 18,830 20,167 21,740
Total 29,091 32,484 36,120 40,927 40,794 46,741 48,807 47,939 51,371 47,443 51,688
Source: State Statistics Committee of Azerbaijan
Since 2000, the cargo trade along the Azerbaijani section of TRACECA has increased by 78%,
with an average increase of 6% per year. In 2010, 51.7 million tons of goods were transported
along the East‐West TRACECA route in Azerbaijan: 21.7 million tons by road (42%), 20.6 million
tons by rail (40%), and 9.4 million tons by sea (18%) (Table 2.2). This brought more than $400
million to the State budget, and accounted for 23% of the country’s total cargo transport in
2010. One third of the TRACECA cargo was made up of transit goods, which were primarily oil
and petroleum products from Kazakhstan and Turkmenistan. State revenue from the transport
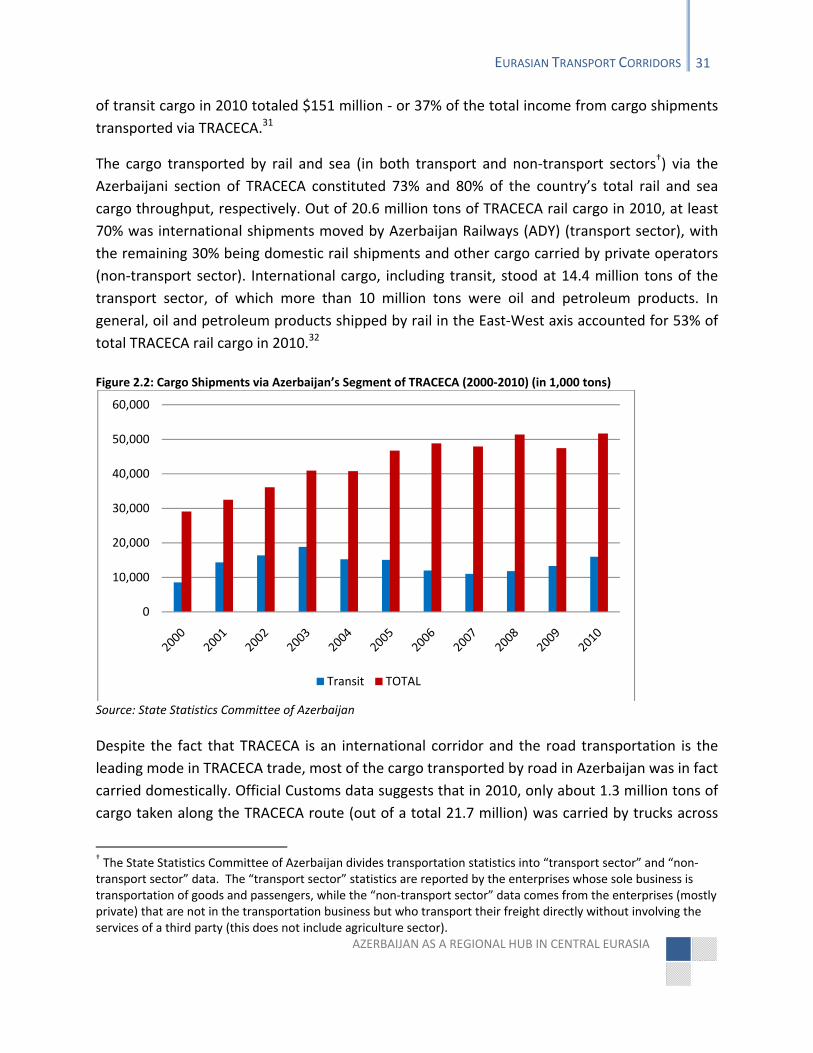
AZERBAIJAN AS A REGIONAL HUB IN CENTRAL EURASIA
EURASIAN TRANSPORT CORRIDORS 31
of transit cargo in 2010 totaled $151 million ‐ or 37% of the total income from cargo shipments
transported via TRACECA.31
The cargo transported by rail and sea (in both transport and non‐transport sectors†) via the
Azerbaijani section of TRACECA constituted 73% and 80% of the country’s total rail and sea
cargo throughput, respectively. Out of 20.6 million tons of TRACECA rail cargo in 2010, at least
70% was international shipments moved by Azerbaijan Railways (ADY) (transport sector), with
the remaining 30% being domestic rail shipments and other cargo carried by private operators
(non‐transport sector). International cargo, including transit, stood at 14.4 million tons of the
transport sector, of which more than 10 million tons were oil and petroleum products. In
general, oil and petroleum products shipped by rail in the East‐West axis accounted for 53% of
total TRACECA rail cargo in 2010.32
Figure 2.2: Cargo Shipments via Azerbaijan’s Segment of TRACECA (2000‐2010) (in 1,000 tons)
Source: State Statistics Committee of Azerbaijan
Despite the fact that TRACECA is an international corridor and the road transportation is the
leading mode in TRACECA trade, most of the cargo transported by road in Azerbaijan was in fact
carried domestically. Official Customs data suggests that in 2010, only about 1.3 million tons of
cargo taken along the TRACECA route (out of a total 21.7 million) was carried by trucks across
† The State Statistics Committee of Azerbaijan divides transportation statistics into “transport sector” and “non‐transport sector” data. The “transport sector” statistics are reported by the enterprises whose sole business is transportation of goods and passengers, while the “non‐transport sector” data comes from the enterprises (mostly private) that are not in the transportation business but who transport their freight directly without involving the services of a third party (this does not include agriculture sector).
0
10,000
20,000
30,000
40,000
50,000
60,000
Transit TOTAL
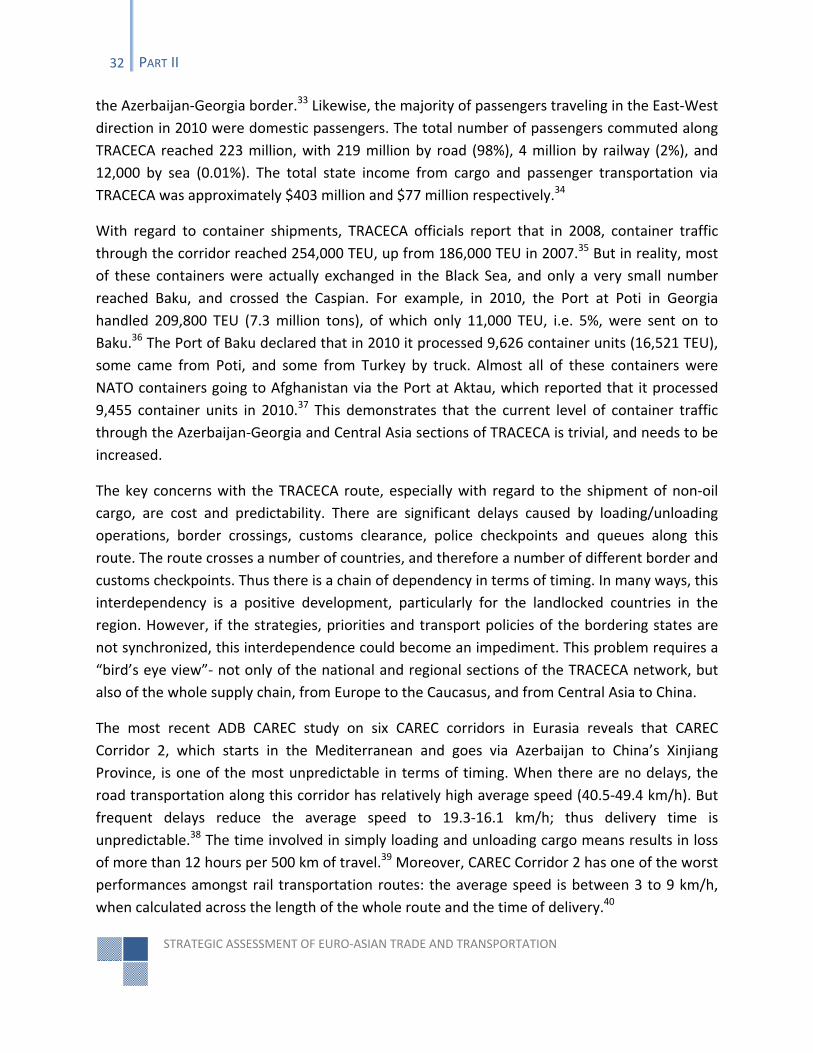
STRATEGIC ASSESSMENT OF EURO‐ASIAN TRADE AND TRANSPORTATION
32 PART II
the Azerbaijan‐Georgia border.33 Likewise, the majority of passengers traveling in the East‐West
direction in 2010 were domestic passengers. The total number of passengers commuted along
TRACECA reached 223 million, with 219 million by road (98%), 4 million by railway (2%), and
12,000 by sea (0.01%). The total state income from cargo and passenger transportation via
TRACECA was approximately $403 million and $77 million respectively.34
With regard to container shipments, TRACECA officials report that in 2008, container traffic
through the corridor reached 254,000 TEU, up from 186,000 TEU in 2007.35 But in reality, most
of these containers were actually exchanged in the Black Sea, and only a very small number
reached Baku, and crossed the Caspian. For example, in 2010, the Port at Poti in Georgia
handled 209,800 TEU (7.3 million tons), of which only 11,000 TEU, i.e. 5%, were sent on to
Baku.36 The Port of Baku declared that in 2010 it processed 9,626 container units (16,521 TEU),
some came from Poti, and some from Turkey by truck. Almost all of these containers were
NATO containers going to Afghanistan via the Port at Aktau, which reported that it processed
9,455 container units in 2010.37 This demonstrates that the current level of container traffic
through the Azerbaijan‐Georgia and Central Asia sections of TRACECA is trivial, and needs to be
increased.
The key concerns with the TRACECA route, especially with regard to the shipment of non‐oil
cargo, are cost and predictability. There are significant delays caused by loading/unloading
operations, border crossings, customs clearance, police checkpoints and queues along this
route. The route crosses a number of countries, and therefore a number of different border and
customs checkpoints. Thus there is a chain of dependency in terms of timing. In many ways, this
interdependency is a positive development, particularly for the landlocked countries in the
region. However, if the strategies, priorities and transport policies of the bordering states are
not synchronized, this interdependence could become an impediment. This problem requires a
“bird’s eye view”‐ not only of the national and regional sections of the TRACECA network, but
also of the whole supply chain, from Europe to the Caucasus, and from Central Asia to China.
The most recent ADB CAREC study on six CAREC corridors in Eurasia reveals that CAREC
Corridor 2, which starts in the Mediterranean and goes via Azerbaijan to China’s Xinjiang
Province, is one of the most unpredictable in terms of timing. When there are no delays, the
road transportation along this corridor has relatively high average speed (40.5‐49.4 km/h). But
frequent delays reduce the average speed to 19.3‐16.1 km/h; thus delivery time is
unpredictable.38 The time involved in simply loading and unloading cargo means results in loss
of more than 12 hours per 500 km of travel.39 Moreover, CAREC Corridor 2 has one of the worst
performances amongst rail transportation routes: the average speed is between 3 to 9 km/h,
when calculated across the length of the whole route and the time of delivery.40
AZERBAIJAN AS A REGIONAL HUB IN CENTRAL EURASIA
EURASIAN TRANSPORT CORRIDORS 33
Truck Transit via TRACECA vs. Alternatives
Truck transit is the most commonly used mode of cargo transportation in TRACECA, and it
promises to be extremely beneficial for Azerbaijan. Unfortunately, Azerbaijan does not have a
large fleet of trucks with Euro 3 or higher standard and the majority of transit trucks running
between Europe/Turkey and Central Asia currently bypass Azerbaijan. There are a number of
reasons for this, which will be analyzed in detail below. This section will also examine the two
main trucking routes from Western Europe (i.e. the Netherlands) to Baku: the Southern Route
via Turkey and Georgia, and the Northern Route via Russia.41
The Central Route to Afghanistan
The Central or TRACECA Route is often used to deliver cargo and freight to Baku and onward to
Central Asia and Afghanistan. Shipments to Afghanistan via the TRACECA route have increased
in recent years, and could be advantageous for the Azerbaijani trucking industry. Currently,
however, most of this cargo is carried by Turkish trucking companies, and they experience
countless delays and difficulties along the Azerbaijani section of TRACECA route. This is one of
many reasons they choose to avoid this route. In 2009, 36,291 Turkish trucks traveled to
Central Asia, Afghanistan, and Pakistan, and only 3% of them (917 trucks) passed through
Azerbaijan (on a CASPAR ferry service) (Table 2.3). In 2010, the total number of Turkish trucks
increased to 41,099, but 98% bypassed Azerbaijan, using the Russian or Iranian routes instead.
Table 2.3: Turkish Trucks Transport Statistics to Central Asia, Afghanistan and Pakistan (Number of trips) 3175
Countries 2005 2006 2007 2008 2009 2010
Kazakhstan 4789 6548 9490 5814 3936 5161
Uzbekistan 3028 2899 4381 4537 3973 4013
Kyrgyzstan 1045 1100 1639 1973 1637 1089
Tajikistan 811 991 2017 2749 2325 2278
Turkmenistan 4884 5690 7002 11752 21542 24947
Afghanistan 2264 1364 1762 1580 2715 3175
Pakistan 100 306 47 7 163 436
TOTAL 16921 18898 26338 28412 36291 41099
Source: The National Association for Transport Companies in Turkey (UND). Courtesy of Mr. Marc Abeille.
A Turkish trucking company charges about $12,000 (including all expenses) for a full truck
carrying NATO humanitarian cargo, traveling from Istanbul to Afghanistan via Bishkek,
Kyrgyzstan. From Bishkek, local Kyrgyz truckers deliver the goods to their final destinations in
Afghanistan. Turkish trucks use three different routes when traveling to Central Asia:
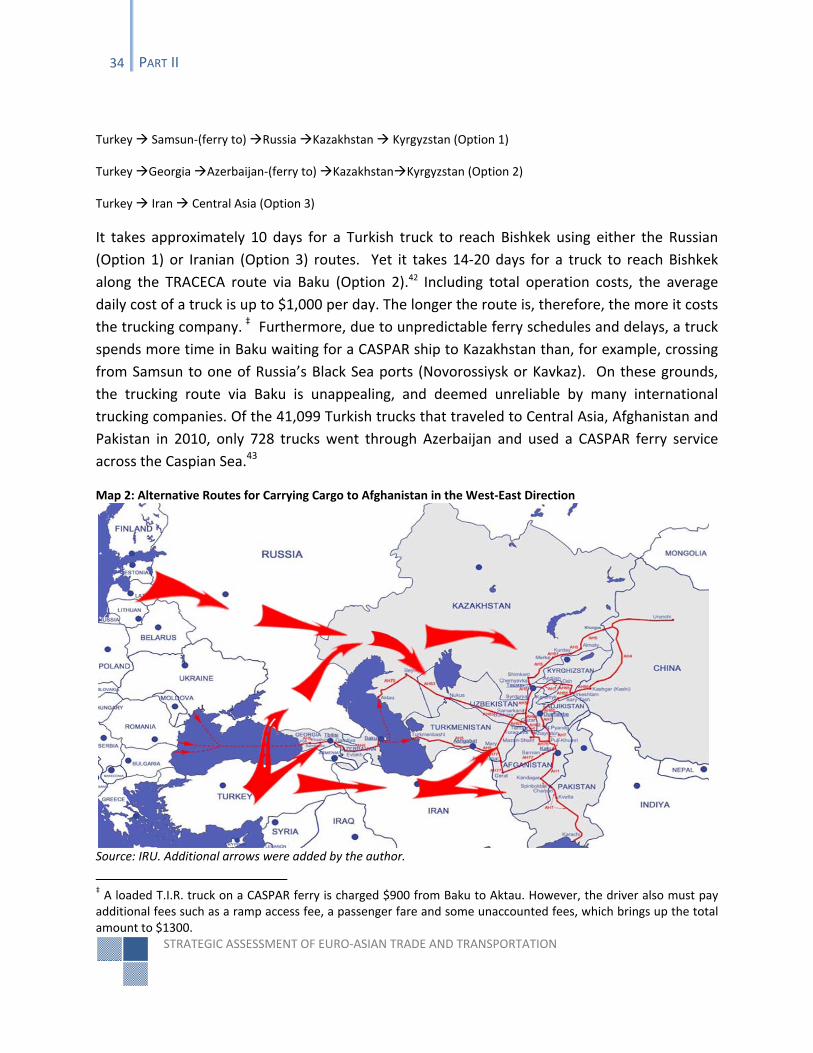
STRATEGIC ASSESSMENT OF EURO‐ASIAN TRADE AND TRANSPORTATION
34 PART II
Turkey Samsun‐(ferry to) Russia Kazakhstan Kyrgyzstan (Option 1)
Turkey Georgia Azerbaijan‐(ferry to) KazakhstanKyrgyzstan (Option 2)
Turkey Iran Central Asia (Option 3)
It takes approximately 10 days for a Turkish truck to reach Bishkek using either the Russian
(Option 1) or Iranian (Option 3) routes. Yet it takes 14‐20 days for a truck to reach Bishkek
along the TRACECA route via Baku (Option 2).42 Including total operation costs, the average
daily cost of a truck is up to $1,000 per day. The longer the route is, therefore, the more it costs
the trucking company. ‡ Furthermore, due to unpredictable ferry schedules and delays, a truck
spends more time in Baku waiting for a CASPAR ship to Kazakhstan than, for example, crossing
from Samsun to one of Russia’s Black Sea ports (Novorossiysk or Kavkaz). On these grounds,
the trucking route via Baku is unappealing, and deemed unreliable by many international
trucking companies. Of the 41,099 Turkish trucks that traveled to Central Asia, Afghanistan and
Pakistan in 2010, only 728 trucks went through Azerbaijan and used a CASPAR ferry service
across the Caspian Sea.43
Map 2: Alternative Routes for Carrying Cargo to Afghanistan in the West‐East Direction
Source: IRU. Additional arrows were added by the author.
‡ A loaded T.I.R. truck on a CASPAR ferry is charged $900 from Baku to Aktau. However, the driver also must pay additional fees such as a ramp access fee, a passenger fare and some unaccounted fees, which brings up the total amount to $1300.
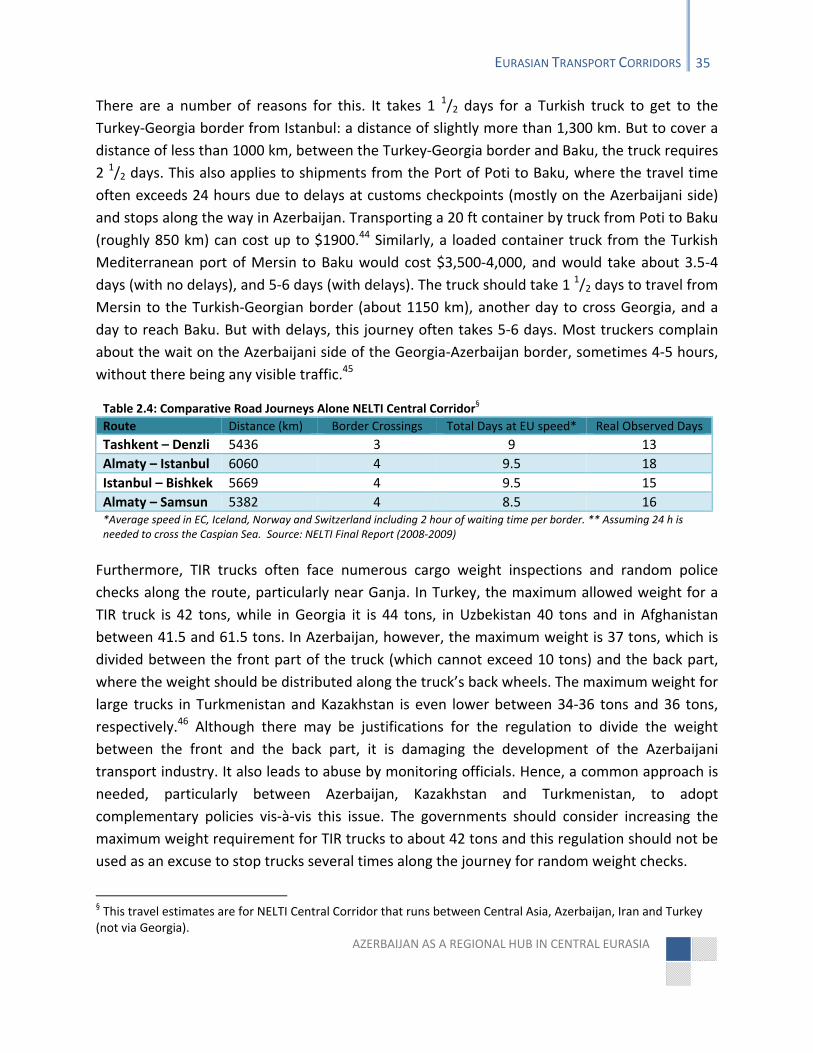
AZERBAIJAN AS A REGIONAL HUB IN CENTRAL EURASIA
EURASIAN TRANSPORT CORRIDORS 35
There are a number of reasons for this. It takes 1 1/2 days for a Turkish truck to get to the
Turkey‐Georgia border from Istanbul: a distance of slightly more than 1,300 km. But to cover a
distance of less than 1000 km, between the Turkey‐Georgia border and Baku, the truck requires
2 1/2 days. This also applies to shipments from the Port of Poti to Baku, where the travel time
often exceeds 24 hours due to delays at customs checkpoints (mostly on the Azerbaijani side)
and stops along the way in Azerbaijan. Transporting a 20 ft container by truck from Poti to Baku
(roughly 850 km) can cost up to $1900.44 Similarly, a loaded container truck from the Turkish
Mediterranean port of Mersin to Baku would cost $3,500‐4,000, and would take about 3.5‐4
days (with no delays), and 5‐6 days (with delays). The truck should take 1 1/2 days to travel from
Mersin to the Turkish‐Georgian border (about 1150 km), another day to cross Georgia, and a
day to reach Baku. But with delays, this journey often takes 5‐6 days. Most truckers complain
about the wait on the Azerbaijani side of the Georgia‐Azerbaijan border, sometimes 4‐5 hours,
without there being any visible traffic.45
Table 2.4: Comparative Road Journeys Alone NELTI Central Corridor§
Route Distance (km) Border Crossings Total Days at EU speed* Real Observed Days
Tashkent – Denzli 5436 3 9 13
Almaty – Istanbul 6060 4 9.5 18
Istanbul – Bishkek 5669 4 9.5 15
Almaty – Samsun 5382 4 8.5 16 *Average speed in EC, Iceland, Norway and Switzerland including 2 hour of waiting time per border. ** Assuming 24 h is needed to cross the Caspian Sea. Source: NELTI Final Report (2008‐2009)
Furthermore, TIR trucks often face numerous cargo weight inspections and random police
checks along the route, particularly near Ganja. In Turkey, the maximum allowed weight for a
TIR truck is 42 tons, while in Georgia it is 44 tons, in Uzbekistan 40 tons and in Afghanistan
between 41.5 and 61.5 tons. In Azerbaijan, however, the maximum weight is 37 tons, which is
divided between the front part of the truck (which cannot exceed 10 tons) and the back part,
where the weight should be distributed along the truck’s back wheels. The maximum weight for
large trucks in Turkmenistan and Kazakhstan is even lower between 34‐36 tons and 36 tons,
respectively.46 Although there may be justifications for the regulation to divide the weight
between the front and the back part, it is damaging the development of the Azerbaijani
transport industry. It also leads to abuse by monitoring officials. Hence, a common approach is
needed, particularly between Azerbaijan, Kazakhstan and Turkmenistan, to adopt
complementary policies vis‐à‐vis this issue. The governments should consider increasing the
maximum weight requirement for TIR trucks to about 42 tons and this regulation should not be
used as an excuse to stop trucks several times along the journey for random weight checks.
§ This travel estimates are for NELTI Central Corridor that runs between Central Asia, Azerbaijan, Iran and Turkey (not via Georgia).
STRATEGIC ASSESSMENT OF EURO‐ASIAN TRADE AND TRANSPORTATION
36 PART II
Once in Baku, depending on traffic, the trucks sometimes have to wait 2‐3 days for a free spot
on a CASPAR ship to Aktau. Although CASPAR has daily trips to Aktau, priority is given to rail
freight and containers. In addition, CASPAR mainly operates ferries (rather than Ro‐Ro (Roll‐on
Roll‐off) type vessels) between Baku and Aktau. This limits the number of trucks the ship can
take: not more than 30‐35. There is only one berth (№ 6) at the Port of Aktau, with the capacity
to receive a Ro‐Ro type ship, and it is almost always busy with grain shipments. Therefore, a
regularly scheduled Ro‐Ro connection between Baku and Aktau and between Baku and
Turkmenbashy is required. Moreover, while the loading and uploading of the ship is done
relatively quickly (in less than an hour), it takes about 4‐5 hours to complete all the procedural
paperwork (border and customs clearance, etc.). Normally, all trucks should be booked and
checked‐in in advance so that they can board the ship as soon as it is ready for loading. But
because there is no certainty about how many trucks will be able to board, the advance check‐
in is not done, and the trucks are forced to wait at the port entrance, or outside of Baku. With
more effective truck flow management and introduction of pre‐booking system for CASPAR
ships, this concern could be addressed.
The Southern Route
Rotterdam Germany Austria Hungary Bulgaria Turkey Georgia Baku, Azerbaijan (Option 1)
(ferry to) ‐ Georgia Baku, Azerbaijan (Option 2)
Turkey Iran Baku, Azerbaijan (Option 3)
There are several alternative trucking routes from West Europe to Baku. One of them is the so‐
called Southern Route, which has several options (see above). The length of the Southern route
is 5,600 km, with an estimated transit time of 9‐11 days. The total ‘route cost’** for a standard
truck (excluding fixed and some variables costs) from Rotterdam to Baku is approximately
€2,700‐2,800. This route has an extension in Bulgaria, indicated above as Option 2. Option 2
involves taking a Ro‐Ro ferry from Burgas, Bulgaria to Poti, Georgia, the cost of which is
approximately €1,200. The distance from Rotterdam to Burgas is 2,300 km and the driving time
is about 3 ½ days. It takes additional 2‐2 ½ days for the Ro‐Ro ferry to cross the Black Sea to
Poti, and 2 more days for the truck to reach its final destination in Baku (8 days in total).
However, since there is only one scheduled ferry from Burgas to Poti each week, Option 2 is
unattractive. This route could increase its profile with the expansion of the ferry schedule, and
more importantly, with the introduction of a pre‐booking system that would enable the port to
guarantee advance reservations for trucks.
** The “route cost" refers to all‐in transportation expenses of a single truck en route from point A to point B, including its fuel,
custom duties and extra fees collected at the borders and in transit. It does not include fixed costs (depreciation etc.) and other variable operation costs (salary, administrative costs etc.). The route cost is approximately 33% of all costs.
AZERBAIJAN AS A REGIONAL HUB IN CENTRAL EURASIA
EURASIAN TRANSPORT CORRIDORS 37
There is an additional route that runs from Turkey to Azerbaijan via Iran (Option 3). This option
adds 400 km to the Southern route, and it is not currently used for cargo shipments to
Azerbaijan (It was mainly used during the war in Georgia in August 2008). This route via Iran is
used primarily for shipments to Turkmenistan and other Central Asian countries.
The Northern Route
Rotterdam Germany Poland Belarus Russia Baku, Azerbaijan (Option 1)
Ukraine Russia Baku, Azerbaijan (Option 2)
The second trucking route is the Northern route via Belarus or Ukraine and Russia. The length
of the route via Belarus and Ukraine is 4,900 km and 4,400 km, respectively and the estimated
transit time from Rotterdam to Baku is 8‐10 days. The route cost of the Belarus extension
(Option 1) is €1600 per truck, and €1500 for the Ukraine extension (Option 2). The major
sections of both routes fall under Pan‐European Corridors 2 (to Moscow) and 3 (to Kiev). In a 10
day trip from Europe to Azerbaijan along the Poland‐Belarus‐Russia‐Azerbaijan route, an
estimated 3 days (i.e. 30% of the total duration) are spent at customs and border checkpoints.
Yet the Northern route is still the cheapest and most practical route, preferable to the available
alternatives.
Unsanctioned fees and bribes paid at the border checkpoints between the EU and Baku (i.e. EU‐
Belarus border, Belarus‐Russia crossing, Russia‐Azerbaijan border) make up about 8% of the
total cost of the route, and roughly 1.5‐2% of total trucking operation costs. While many
international organizations and international trade facilitation programs are concerned with
this type of activity at borders and checkpoints, many truck companies consider illicit payments
or delays at borders less significant than the time they would have to spend in the country for
customs clearance procedures (for the export and import of goods). A truck costs the company
about $1000 per day, and so the company is interested in loading or unloading and clearing the
customs as fast as possible. In Azerbaijan, it might take up to 2 days to load or unload a truck
and to clear customs, compared to less than 3 hours in Western Europe.47
These delays are not only detrimental to the trucking industry, but also to Azerbaijani
companies involved in exports. In an export operation, a truck is usually loaded on the
exporter’s premises. From there it goes to a Customs terminal in Khirdalan, near Baku, or to
one of the regional customs terminals. Here, export procedures generally take 1 or 2 days to
complete, which delays delivery time and increases the cost of exports. Thus it is also extremely
important to develop effective and efficient mechanisms for the speedy clearance of goods
inside the country’s customs points.
STRATEGIC ASSESSMENT OF EURO‐ASIAN TRADE AND TRANSPORTATION
38 PART II
The Fastest Route
Rotterdam Germany Latvia Russia Baku, Azerbaijan
Among the alternative routes from Rotterdam to Baku, there is also the fastest option, which
runs through Germany, Latvia, and Russia. This takes about 6‐6 ½ days and costs €2,300. To
make it to Baku in 6 days, the truck should leave Rotterdam in the morning and catch the night
ferry from Rostock in Germany, which arrives the following day in Riga, Latvia. From Riga, the
truck takes about a day to drive up to the Latvia‐Russia border at Sebej. It takes 3 more days for
it to reach Baku, excluding the ½ day spent at the Latvia‐Russia border and the ½ day at the
Russia‐Azerbaijan border.48
Advantages and Disadvantages of TRACECA for Trucking
As demonstrated by the cases mentioned above, TRACECA is currently a limping ‘leg’ in the
Euro‐Asian transportation network. It requires close scrutiny, and an urgent solution. Firstly,
the Azerbaijan‐Georgia border crossing and customs checkpoint must improve its efficiency and
be more accountable for delays along the TRACECA route. Secondly, there needs to be better
coordination between government agencies working at the Port of Baku, in order to ensure
that there are no delays in processing ships. In particular, the Port and CASPAR need to
introduce a pre‐booking system whereby freight forwarders or trucking companies can secure a
place on the ship in advance, and avoid delays. This would also help CASPAR to improve its
shipping schedule. When there is high demand for a particular line, additional ships could be
scheduled to avoid interruptions or delays. Similarly, the border services and customs should
check the freight and trucks in advance, so that they can board on time.
In spite of the difficulties, a comparison of different land routes, particularly where truck
transportation is concerned, makes it clear that the TRACECA route has the capacity to become
a competitive corridor when the cargo is destined for Turkmenistan, Uzbekistan, Afghanistan,
or parts of Kazakhstan. This applies to goods and products being transported from Western
Europe to Central Asia, and international freight being shipped from or through Turkey.
However, in addition to issues of cost and the cumbersome procedures en route, this corridor
has only a limited capacity, due to Azerbaijan’s annual quota for foreign trucks. This is a
common protective measure that is employed by some countries, including Russia and Iran. The
Azerbaijan trucking sector does not have the capacity to match demand, and this restriction
only discourages international trucking companies from going through Azerbaijan. Azerbaijan’s
quota for Turkish trucks is never filled, but nor is the corresponding demand met (due to the
small size of the Azerbaijani fleet, and the lack of coordination between Turkish and Azerbaijani
trucking companies). Therefore, this sector offers an opportunity for the development of
AZERBAIJAN AS A REGIONAL HUB IN CENTRAL EURASIA
EURASIAN TRANSPORT CORRIDORS 39
trucking business in Azerbaijan and Turkmenistan. These two countries should coordinate their
efforts to increase truck transit capacity via the TRACECA corridor and the ports of Baku and
Turkmenbashy.
The annual trip turnover for trucks in Azerbaijan is about 200,000. For this number of trips, a
country needs a truck fleet of approximately 7,000. However, the estimated size of Azerbaijan’s
current TIR truck fleet is about 630 trucks in total,49 of which only 36%50 actually meet Euro‐3 or
higher emission standards, which has become a standard for TIR trucks traveling to/within
Europe. The Azerbaijani government has recently announced that the country will gradually
move to the Euro‐3 emission standards by 2012 and Euro‐4 by 2015.51 In addition, while
European trucks average 12,500‐13,000 km per month, Azerbaijani trucks average just 8,000
km, which increases the costs associated with the return on the initial investment.52 Therefore,
the private Azerbaijani truck fleet should be expanded, as this will help the country to capture
some of the market share, which is currently either taken by trucking companies in neighboring
countries, or is not utilized at all. This will also create new jobs in Azerbaijan’s non‐oil sector.
Increasing the size of the Azerbaijani truck fleet to 7,000 could create an additional 10,000 jobs
in the trucking and logistics sector, which would include new drivers, mechanics, dispatchers
and other personnel and managers.53
TRACECA’s main competition for Turkish truck traffic comes from the northern route via Russia
and the southern route via Iran. The route via Iran is disadvantaged by increased fuel prices and
the longer distance involved, while the Russian route only seems attractive if the cargo is being
shipped to Kazakhstan. Nonetheless, these are currently the preferred routes for Turkish
truckers for trips to Central Asia or Afghanistan. For Azerbaijan and the TRACECA route to
reclaim the market and to attract Turkish trucks, several things need to happen, including:
The development of a common approach between Azerbaijan, Georgia, Turkmenistan and Kazakhstan for the transit of goods to Central Asia (this strategy should also resolve the issue of annual quotas for Turkish trucks);
The establishment of a private and competitive Azerbaijani trucking fleet that can work with Turkish companies to transport cargo to Central Asia and Afghanistan;
The synchronization of procedures, to eliminate obstacles at the Azerbaijan‐Georgia border and at the Port of Baku customs checkpoints, so that trucks can be processed faster and more efficiently;
The provision of competitive prices (i.e. package deals) to trucks crossing the Caspian Sea on CASPAR ferries to Aktau and Turkmenbashy;
The implementation of pre‐booking services at CASPAR ferries.
STRATEGIC ASSESSMENT OF EURO‐ASIAN TRADE AND TRANSPORTATION
40 PART II
TRACECA and Rail Transportation
The second major mode of transportation along TRACECA is rail transport. There are two
TRACECA rail routes in the South Caucasus linking Europe, the Caucasus, Central Asia and China:
the Baku‐Tbilisi‐Batumi rail link, and the Baku‐Tbilisi‐Poti rail link. The rail connection between
Azerbaijan and Armenia, which had an extension to Turkey, no longer exists, and the line
between Armenia and Turkey is outdated and non‐functioning. The Baku‐Tbilisi‐Batumi/Poti
railway is connected to the European rail networks via the Black Sea rail ferry service in the
West (i.e. Romania, Bulgaria and Ukraine), and the Kazakh and Turkmen rail networks to the
East. From 2012, the Kars‐Akhalkalaki railway will link Georgia and Turkey, and the TRACECA rail
network will extend overland to South East Europe via Turkey. It will also have access to Turkish
ports in the Mediterranean Sea. Together these railways will constitute part of a 7,000 km‐long
rail link between Europe and Asia.54
The Boyuk Kesik border crossing point between Azerbaijan and Georgia is among the main rail
junctions of TRACECA and Azerbaijan’s key rail gateway to Europe with the largest rail cargo
throughput. According to the official data by the Azerbaijan Railways (ADY), in 2010, about 13
million tons of freight was moved by ADY via the Boyuk Kesik rail border crossing, of which 10.9
million was the outgoing traffic. About 93% (10.1 million tons) of all outgoing cargo was oil and
petroleum products, of which transit oil was 6.6 million tons. The incoming traffic was split
between imports (1 million tons or 51%) and transit (979,300 tons or 49%). The transit rail
cargo accounted for 7.2 million tons or 66% of total cargo throughput at Boyuk Kesik, followed
by exports with 3.7 million tons or 34%. In general, the rail transit cargo via TRACECA’s
Azerbaijan section accounted for 87% of total transit goods carried by ADY in 2010.55
An analysis of the current and potential alternative rail links between Istanbul and Dostik (at
the Kazakh‐Chinese border) shows that the shortest rail links are through Turkmenistan and
Uzbekistan (Table 2.5). The second and third shortest railways pass through Armenia, which are
currently not in use due to the territorial conflict with Azerbaijan. If the Armenia‐Azerbaijan
conflict is resolved, which does not seem imminent at the moment, these two countries would
have enormous potential as transportation routes between the two countries provide the
shortest routes to the Mediterranean Sea ports of Turkey, and alternative access points to Iran,
Iraq and Syria.
The Kazakh segment of the TRACECA railway network has the potential to become the shortest
route, if the Kazakh government completes the planned railway from Beineu to Shalkar. This
rail extension will reduce the distance between Dostik and the Port of Aktau by 485 km, and cut
delivery time to 10‐11 hours, by avoiding the Makat‐Kandiagash segment of the Kazakh
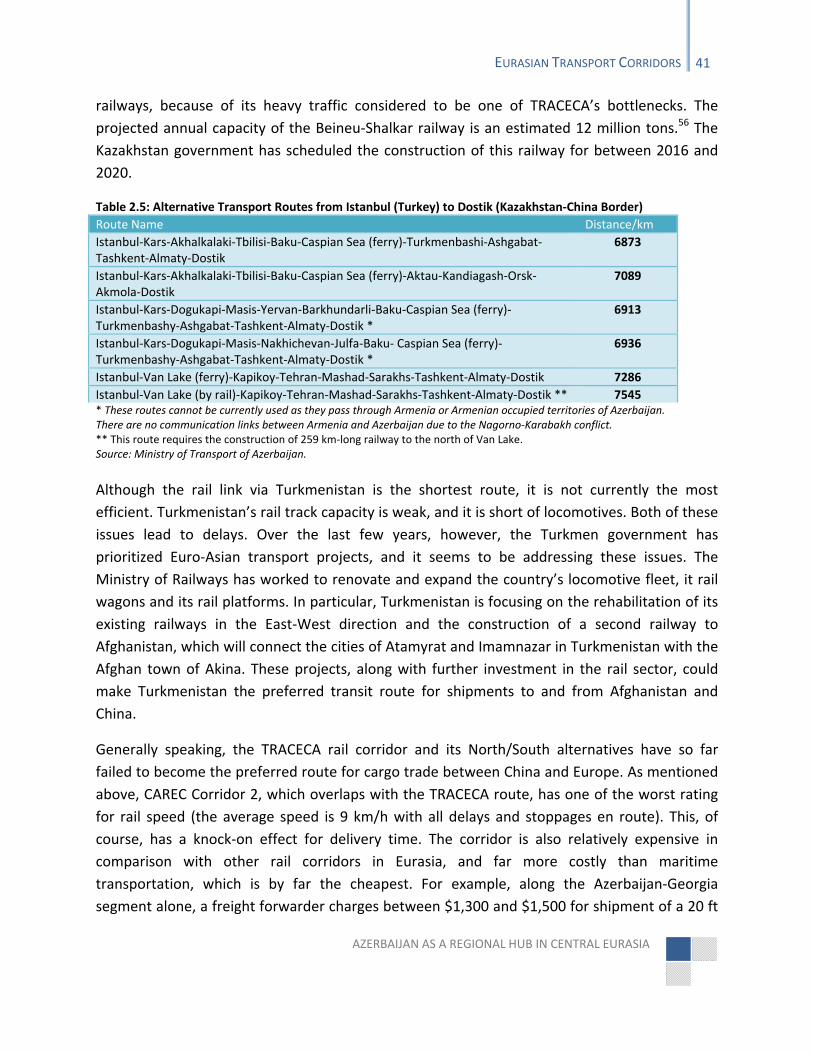
AZERBAIJAN AS A REGIONAL HUB IN CENTRAL EURASIA
EURASIAN TRANSPORT CORRIDORS 41
railways, because of its heavy traffic considered to be one of TRACECA’s bottlenecks. The
projected annual capacity of the Beineu‐Shalkar railway is an estimated 12 million tons.56 The
Kazakhstan government has scheduled the construction of this railway for between 2016 and
2020.
Table 2.5: Alternative Transport Routes from Istanbul (Turkey) to Dostik (Kazakhstan‐China Border)
Route Name Distance/km
Istanbul‐Kars‐Akhalkalaki‐Tbilisi‐Baku‐Caspian Sea (ferry)‐Turkmenbashi‐Ashgabat‐Tashkent‐Almaty‐Dostik
6873
Istanbul‐Kars‐Akhalkalaki‐Tbilisi‐Baku‐Caspian Sea (ferry)‐Aktau‐Kandiagash‐Orsk‐Akmola‐Dostik
7089
Istanbul‐Kars‐Dogukapi‐Masis‐Yervan‐Barkhundarli‐Baku‐Caspian Sea (ferry)‐Turkmenbashy‐Ashgabat‐Tashkent‐Almaty‐Dostik *
6913
Istanbul‐Kars‐Dogukapi‐Masis‐Nakhichevan‐Julfa‐Baku‐ Caspian Sea (ferry)‐Turkmenbashy‐Ashgabat‐Tashkent‐Almaty‐Dostik *
6936
Istanbul‐Van Lake (ferry)‐Kapikoy‐Tehran‐Mashad‐Sarakhs‐Tashkent‐Almaty‐Dostik 7286
Istanbul‐Van Lake (by rail)‐Kapikoy‐Tehran‐Mashad‐Sarakhs‐Tashkent‐Almaty‐Dostik ** 7545 * These routes cannot be currently used as they pass through Armenia or Armenian occupied territories of Azerbaijan. There are no communication links between Armenia and Azerbaijan due to the Nagorno‐Karabakh conflict. ** This route requires the construction of 259 km‐long railway to the north of Van Lake. Source: Ministry of Transport of Azerbaijan.
Although the rail link via Turkmenistan is the shortest route, it is not currently the most
efficient. Turkmenistan’s rail track capacity is weak, and it is short of locomotives. Both of these
issues lead to delays. Over the last few years, however, the Turkmen government has
prioritized Euro‐Asian transport projects, and it seems to be addressing these issues. The
Ministry of Railways has worked to renovate and expand the country’s locomotive fleet, it rail
wagons and its rail platforms. In particular, Turkmenistan is focusing on the rehabilitation of its
existing railways in the East‐West direction and the construction of a second railway to
Afghanistan, which will connect the cities of Atamyrat and Imamnazar in Turkmenistan with the
Afghan town of Akina. These projects, along with further investment in the rail sector, could
make Turkmenistan the preferred transit route for shipments to and from Afghanistan and
China.
Generally speaking, the TRACECA rail corridor and its North/South alternatives have so far
failed to become the preferred route for cargo trade between China and Europe. As mentioned
above, CAREC Corridor 2, which overlaps with the TRACECA route, has one of the worst rating
for rail speed (the average speed is 9 km/h with all delays and stoppages en route). This, of
course, has a knock‐on effect for delivery time. The corridor is also relatively expensive in
comparison with other rail corridors in Eurasia, and far more costly than maritime
transportation, which is by far the cheapest. For example, along the Azerbaijan‐Georgia
segment alone, a freight forwarder charges between $1,300 and $1,500 for shipment of a 20 ft
STRATEGIC ASSESSMENT OF EURO‐ASIAN TRADE AND TRANSPORTATION
42 PART II
container from Poti to Baku, with an additional $350‐400 for a CASPAR ferry transfer to
Turkmenbashy. Thus it costs around $1,650‐1,900 to ship a 20 ft container just from Poti to
Turkmenbashy, which is more expensive than shipping the same container by sea from
Castellón (Spain) to Poti ($1,725), from Shanghai to Rotterdam ($1,200‐$1,400) or from Bandar
Abbas to Rotterdam ($650).57
The distance between Poti and Baku is just over 960 km, but it takes as long as 4‐5 days for a
rail shipment to go from Poti to Baku. Similarly, it can take up to 2 days for a train to go from
Yalama, near the Azerbaijan‐Russia border, to Baku, though the two cities are only 200 km
apart. One of the reasons for the length of these journeys is the redistribution method or
shunting services for wagons, containers and platforms provided by Georgian and Azerbaijan
Railways. On the TRACECA route, all the cargo in Poti that is destined for Baku, Tbilisi or Eastern
Georgia and Central Asia is taken to Tbilisi by train for further redistribution. A single train
would often carry between 52‐64 wagons or railcars of different type. This means that if the
train has not reached its maximum carry load, it will stop in every regional station (i.e.
Samtredia, Kutaisi, Zestafoni, Khashuri), where additional wagons would be manually attached
to the train. Moreover, because both in Azerbaijan and Georgia the trains, wagons and
platforms are old, their brakes are frequently checked, which takes additional time. Hence, a
distance of about 300 km from Poti to Tbilisi is covered only in 10‐12 hours.58
In Tbilisi, the freight is redistributed, and wagons and containers for Baku or Central Asia are
taken to Azerbaijan in a separate train. This is generally a day‐long procedure, and a regular
freight train service cannot cross the Azerbaijan‐Georgia border in less than two days. Only
special shipments (i.e. NATO containers for Afghanistan) are able to cross the border in less
than 2 days, but even they cannot get to the Port of Baku in less than 4 days. Like in Georgia, in
Azerbaijan trains with general cargo may stop en route at Ganja and other cities before
reaching a major shunting station at Bilajari, near Baku. Here the cargo is once again sorted and
distributed, which takes an additional day to day and a half.
Average rail speed also impedes speedy delivery times. The obsolete rail infrastructure in
Azerbaijan and Georgia means that trains are frequently forced to slow down to make turns,
cross bridges or pass through residential areas. Particularly in Azerbaijan, where the quality of
railway track is considerably lower, trains are forced to slow down at a number of unmanned
road crossings where the train’s speed gets down to 5 km/h, and also to avoid derailments that
could cause oils spills. In 2010, the average speed of Azerbaijan’s freight trains was 29.1 km/h:
less than the average speed of the first commuter train between St. Petersburg and Moscow in
the mid‐19th century.59 The average speed of freight trains in Georgia is also low around 30‐35
km/h on the Poti‐Tbilisi section and 25‐30 km/h between Tbilisi and Gardabani (Azerbaijan‐
AZERBAIJAN AS A REGIONAL HUB IN CENTRAL EURASIA
EURASIAN TRANSPORT CORRIDORS 43
Georgia border).60 By contrast, intermodal trains in North America have an average commercial
speed of 51‐52 km/h.61 In addition, trans‐regional passenger trains have frequent stops and
passport control procedures at the Azerbaijan‐Georgia border sometimes require stops of up to
3 hours.
Both the Azerbaijani and Georgian governments are investing in the modernization of national
railway networks, and will soon be able to reduce the travel time for journeys between Baku
and Poti or Tbilisi. In particular, under new regulations the length of a freight train in Georgia
will not exceed 35‐40 wagons, which will speed up the transit time and avoid frequent stops.62
The Georgian Railways LLC has implemented several rail improvement initiatives, including the
“Tbilisi Railway Bypass project” and “Batumi to Tbilisi ‐ in 3 hours”. The projected completion
date of the latter is July 2013.63 However, to become a reliable, fast, and cost‐effective section
of the TRACECA corridor, the Poti‐Baku rail link should be viewed as a single, uninterrupted
route. This requires freight express block train services that can go between Poti and Baku in
under 20 hours. The long term aim should be a high‐speed rail freight service that can complete
the journey in fewer than 12 hours.
The new high speed rail links between the United Kingdom, France and Italy could serve as a
model for long haul rail freight operation. In January 2011, a container freight company, DFDS,
ran its first 28 platform train from Daventry (UK) to Navarro (Italy). This 1,427‐km long journey
starts in the UK, crosses into France via the Channel Tunnel, goes through Switzerland, and
finishes its journey in Italy. The total journey time is approximately 32 hours 22 minutes, which
includes three locomotive changes as well as stops at the border crossings. Without temporary
and procedural stops, the train’s average speed is over 50 km/h for the entire route (the speed
through the Channel Tunnel goes up to 120 km/h).64 Despite the length of the journey, DFDS
offers competitive rates. Shipping a 20 ft container from the UK to Italy would only cost about
€928 one‐way.65
For further examples of high speed freight infrastructure, one can look to the multimodal
freight train between Scotland and Paris, which covers just over 900 km in less than 9 hours,
traveling at an average speed of 121 km/h (excluding stops).66 The US passenger carrier
AMTRAK briefly offered a coast‐to‐coast express freight service for express cargo. This service
took just 66 hours to cover some 5,000 km, compared to the 5‐6 days needed by trucks. The
travel speed was between 125 and 145 km/h.67
To achieve such efficiency, Azerbaijan should realize further progress in transforming ADY JSC
into a commercially viable entity and allow private operators, which could share the cost of rail
stock, maintenance, and operation. Spain’s newly reformed state‐owned company, RENFE,
provides a useful model for the restructuring of ADY. RENFE operates both passenger and
STRATEGIC ASSESSMENT OF EURO‐ASIAN TRADE AND TRANSPORTATION
44 PART II
freight services in Spain. The company has been heavily subsidized by the Spanish state for
many years. Following the Railway Sector Act of 2003, in 2005, RENFE was split into two
companies: Renfe‐Operadora (in charge of railway operations), and ADIF (responsible for
railway infrastructure).
Since 2005, the Spanish government has been working to turn RENFE into a competitive and
profitable component in the country’s intermodal transport network. Currently, the company
controls 95% of Spain’s rail cargo market. The share of rail cargo transportation in Spain is only
4% (compared to the EU average of 12% in the EU), but RENFE is aiming to increase it to 10% in
the near future.68 Spain has one of the largest high‐speed rail networks and most modern high‐
speed train fleets in Europe. RENFE can offer various competitive services to passengers and
shipping companies both inside and outside of Spain. The high‐speed RENFE (AVE) train
between Madrid and Barcelona covers approximately 600 km (close to the distance between
Baku and Tbilisi) in 2 hours and 38 minutes, with a travel speed of 300 km/h.69 To ship a loaded
20 ft/40 ft container from Madrid to Barcelona, RENFE only charges €183/€223. The shipment
takes around 15 hours.70 RENFE is currently extending its rail networks to include Spanish ports,
and is building additional hinterland rail depots and logistical centers in cities such as Zaragoza
(in the middle of Spain) and Vilamalla (near the Spanish‐French border).71 In the near future,
the company’s freight business will undergo further restructuring. It will be partially privatized,
creating five sub‐companies, to provide different services, including intermodal and logistics
services, as well as the transportation of automobiles, bulk and mixed cargo.72
In the short term, Azerbaijan and Georgia should consider improving the efficiency of their
railway infrastructure, railway operators and general rail operations. The two countries should
adopt a common rail strategy on transit tariff policy, offering a single fee for shipments
between Poti and Central Asia via Baku, or vice versa. The involvement of private companies
should be encouraged. Private investment would make the use of railway stock more efficient,
in addition to distributing operation costs, currently the exclusive burden of ADY. While
cooperating on set up of the Poti/Batumi‐Baku freight expressway, the two countries also need
to improve passenger transportation. Currently, rail passengers traveling to Georgia or
Azerbaijan spend 17 hours on the train, including a 2‐3 hour wait at the border for passport
control. The introduction of a Baku‐Tbilisi express passenger train (using the current rail tracks)
could reduce this time and make the journey a much more attractive option. In line with
Eurostar practice (London‐Paris‐London), passport control could be completed prior to the
departure of the train in Baku or Tbilisi.
The long term development vision should include the separation of freight and passenger rail
tracks along TRACECA, by allowing private or public‐private joint ventures to construct and
AZERBAIJAN AS A REGIONAL HUB IN CENTRAL EURASIA
EURASIAN TRANSPORT CORRIDORS 45
operate a new rail expressway (using a standard European gauge) linking Azerbaijan, Georgia
and Turkey. This would open up new opportunities for high‐speed passenger and freight
transportation in Central Eurasia. Given low passenger turnover and low levels of container and
non‐oil cargo traffic, this might seem premature. However, it is never too early to consider
potential innovations and start planning in advance; the future of overland freight and
passenger transportation lies in intermodal trains and high‐speed railways. On the eastern
shore of the Caspian, China already has plans to extend its massive and rapidly growing high‐
speed rail network to connect Urumqi in the North‐West province of Xinjiang with Kyrgyzstan,
Kazakhstan, Uzbekistan and Turkmenistan. Azerbaijan can lead efforts on the western shore of
the Caspian. If a new expressway for freight or passenger is to be constructed, Azerbaijan
should consider building the infrastructure that would enable intermodal trains to carry
containers in double‐stack formations.73 This has been a key innovation in the development of
rail freight transport. Double‐stock capacity allowed American railway companies to revive the
rail transportation between the West coast and the Midwest. Similarly, India is preparing to
construct a high‐speed corridor between Delhi and Mumbai, which will be able to transport
double‐stacked containers.74
Last, but not least, Azerbaijan and other countries along TRACECA need to address the issue of
rail transport interoperability. There are currently two different legal regimes that governing
international rail transport between Europe and Asia. These are CIM (Uniform Rules concerning
the Contract of International Carriage of Goods by Rail), used mostly in Europe, and some parts
of Middle East and North‐West Africa, and SMGS (Agreement on International Freight Traffic by
Rail), applied primarily in the CIS and China. Both legal regimes are exercised during preparation
of a consignment note (i.e. shipping document). Although there are some countries that accept
both CIM/SMGS systems, including Albania, the Baltic States, Bulgaria, Hungary, Iran, Poland,
and Ukraine, the majority of countries use only one of the two. Hence, if cargo is shipped from
a SMGS country (i.e. China) to a CIM country (i.e. Germany), the carrier has to prepare two
consignment notes – one for the SMGS country and another one for the CIM country –
essentially writing the same information twice and delaying the shipment time. More recently,
the International Rail Transport Committee (CIT) and the Organization for the Collaboration
between Railways (OSJD) have jointly developed a common electronic CIM/SMGS consignment
note, which is the first step towards a single legal regime for Euro‐Asian transportation.75
STRATEGIC ASSESSMENT OF EURO‐ASIAN TRADE AND TRANSPORTATION
46 PART II
The Northern Corridors
TransEurasian Express (TEE)
In 2008, RZD and DB Schenker (Germany) set up a Joint Venture (JV) company known as Trans
Eurasia Logistics (TEL). DB Schenker is a subsidiary of Deutsche Bahn, which combines DB
Schenker Rail and DB Schenker Logistics. Other partners include Polzug, Kombiverkehr and
Transcontainer, the freight subsidiary of RZD. The JV was established to bring together the
logistics expertise of Deutsche Bahn and RZD, in order to channel container traffic by rail
between Germany, Russia/CIS, and China. Together, DB Schenker and the RZD operate the
Trans Eurasia Express (TEE) line between Germany, Moscow, CIS, and China. TEE uses the Trans‐
Siberian Railway (TSR) for transporting containers between Europe and China. The JV has
offices in Berlin, Moscow, and Beijing, and discussions are underway to incorporate China
Railways.76
In 2008, maritime cargo transport dropped to a record low, and the average base ocean freight
rates for westbound Asia‐Europe trade were $500 per TEU. Despite the cost‐advantage being
taken by sea freight, the rail freight rates were competitive and lower than sea‐air freight rates.
The latter method was often used to transport high‐value IT products and involves a
combination of sea and air transport, whereby high value freight is shipped to Dubai or to
another hub in the Middle East, and is then flown to its final destination in Germany. While
direct air transportation remains the fastest mode of cargo shipment between China and
Europe, it is also the most expensive. The ship‐air combination is 50% cheaper than the direct
air option, but delivery time is about 10‐12 days (Table 2.6).
Table 2.6: Shipping time and cost for one TEU (or equivalent in size cargo) by different modes of transportation from China to Germany
Mode Delivery Time Shipping Cost *
Air Less than 1 day €22,000
Sea/Air 10‐12 days €11,000
Rail 15‐19 days €3,500
Sea 32‐35 days €1,850* These prices are adopted from the 2008 study77 and may vary from season to season and year to year. The rail
shipment is estimated with a 10% profit margin and today it is likely to be higher than €3,500. Source: Railway
Market, CEE Review.
The rail transport from China and the Asia‐Pacific region has the potential to offer a good
alternative to the sea‐air option, if it can lower prices and offer a reliable service. Reliability and
delivery times are common issues in rail transport since it often involves crossing a number of
countries with different legal regimes and gauge systems. DB, RZD and their partners have tried
AZERBAIJAN AS A REGIONAL HUB IN CENTRAL EURASIA
EURASIAN TRANSPORT CORRIDORS 47
to address these issues by offering scheduled and competitive block trains between Europe and
East Asia. On January 9, 2008, DB and its partners sent their first test container train – the
Beijing‐Hamburg Container Express – from China to Germany. The block train took 15 days,
arriving in Hamburg on January 24, five days earlier than planned.78 The journey was about
12,000 km, passing through China, Mongolia, Russia, Belarus, Poland and Germany.
In October 2008, another express container train carrying 50 TEU of Fujitsu Siemens IT products
left Xiangtang, China for Hamburg. The whole journey only took 17 days. 79 The train went
through Mongolia, crossing into Russia near Irkutsk, then continuing along the TSR route, via
Novosibirsk, Omsk and Yekaterinburg to Moscow, and finally through Belarus and Poland to
Germany. Global Positioning System (GPS) was utilized to track the containers along the transit
route. On arrival, the fifty containers were sent on in two directions: the monitors to Fujitsu
Siemens' European distribution centre in Worms, Germany, and the chassis directly to the
assembly plant in Augsburg, Germany. Gauge changes occurred twice during the trip: once at
the Mongolia‐Russia border and the second time at the Belarus‐Poland border.††
Subsequently, Trans Eurasia Logistics ran an east‐bound block train comprising of almost 85
TEU, mostly 40 ft containers. It carried goods from a variety of shippers representing different
industries, including engineering goods and raw materials. This was an indication that the TEL
would serve more than one firm and would carry more than one type of product. In June 2010,
DB Intermodal and Transcontainer introduced a regular block train called “Moskvich”, which
covers approximately 2,200 km in 4 days and 11 hours.80 Today, the company offers three
services: 1) Public train, a scheduled block train serving more than one client (currently used
between Europe and CIS; however a new Europe‐China line is planned in 2011); 2) Company
Train, an exclusive intermodal train dedicated to one company that wishes to move its goods
from China to Europe or CIS, or vice versa; and 3) Einzelwagen‐Transport, a train primarily used
by clients who wish to ship one or two containers at any time.81
Starting in January 2011, TEL entered into an Operations Partnership with InterRail Services
GmbH to operate the “Ostwind” (East Wind) container block trains that run between Germany
and CIS. Clients can send their containers to Berlin‐Großbeeren main freight village from 12
container terminals across Germany, as well as terminals in Antwerp and Rotterdam. The block
train runs at least twice a week and goes to Brest (Belarus), Moscow, Vladivostok and other
Russian cities, as well as Baku and Mongolia. The train uses the TSR route to reach the Far
East.82
†† China, Mongolia, Germany and most of other EU countries use 1,435 mm standard gauge tracks, while Russia and CIS countries use 1,520 mm wide gauge.
STRATEGIC ASSESSMENT OF EURO‐ASIAN TRADE AND TRANSPORTATION
48 PART II
Also in 2009, DB Schenker and Transcontainer established a joint container hub at the DB
Schenker Logistics terminal in Riga, Latvia. This container hub will act as a major distribution
center in Eastern Europe, serving the Baltic and Scandinavian states and Russia/CIS countries. It
will offer multimodal road and rail services, and gradually shift more containers to rail. The
freight will be consolidated at DB Schenker’s terminal in Riga (where customs clearance will be
completed as well) then shipped by rail. Crossing the Latvia‐Russia border will be significantly
quicker by rail than by road.83
The RZD and DB Schenker partnership, to include China Railways in the near future, provides a
perfect example of mutually advantageous cooperation, which has enabled them to build
successful supply chain networks across Eurasia. In line with RZD and DB Schenker policy, which
aims to reduce tariffs along the entire Trans Eurasia Express route, Azerbaijan should work
closely with Georgia, Kazakhstan and Turkmenistan to set common tariff policy for international
shipments. Moreover, Azerbaijan should aim to establish its own logistics company that could
partner with regional and international rail and logistics operators. While an Azerbaijani
company would not be able to compete with major international corporations, it could still
offer competitive services if Azerbaijan develops distribution and logistics centers across the
country ‐ for example, in Baku, Astara, Ganja, Boyuk Kesik, Yalama and Alyat. This would allow
these locations to act as domestic distribution hubs in the region and attract rail traffic destined
for the Caucasus, Central Asia, and Iran as well as Azerbaijan. This issue will be discussed at
greater length under Logistics section of this study.
TransSiberian Railway (TSR)
The Trans Eurasia Express (TEE) uses the Trans‐Siberian Railway (TSR) to get to China and the
Asia‐Pacific region. The TSR is the longest double track and electrified railway in the world,
covering 9,852 km (6,122 miles) and connecting Far East Russia with Europe via Moscow (Map
3). Through the TEE, the TSR is linked to destinations in Europe such as Germany, Poland,
Belarus and Finland. It also has connections to tracks in North‐Eastern China, the Democratic
People’s Republic of Korea, Mongolia, and Central Asia. Moreover, via Russia’s far eastern ports
like Vladivostok and Vostochny, the line is linked by coastal and deep water shipping to the
Republic of Korea, Japan, Chinese coastal regions and Vietnam. Like the majority of Russian
railways, the TSR is a broad gauge at 1520 mm.
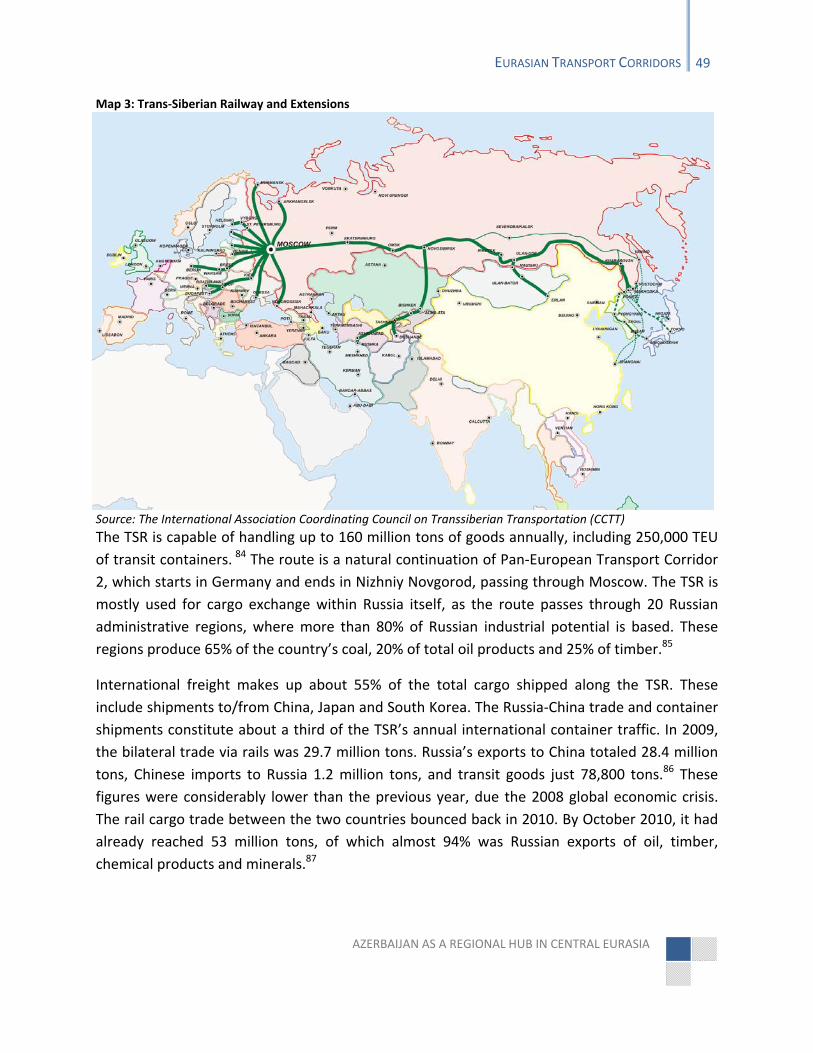
AZERBAIJAN AS A REGIONAL HUB IN CENTRAL EURASIA
EURASIAN TRANSPORT CORRIDORS 49
Map 3: Trans‐Siberian Railway and Extensions
Source: The International Association Coordinating Council on Transsiberian Transportation (CCTT) The TSR is capable of handling up to 160 million tons of goods annually, including 250,000 TEU
of transit containers. 84 The route is a natural continuation of Pan‐European Transport Corridor
2, which starts in Germany and ends in Nizhniy Novgorod, passing through Moscow. The TSR is
mostly used for cargo exchange within Russia itself, as the route passes through 20 Russian
administrative regions, where more than 80% of Russian industrial potential is based. These
regions produce 65% of the country’s coal, 20% of total oil products and 25% of timber.85
International freight makes up about 55% of the total cargo shipped along the TSR. These
include shipments to/from China, Japan and South Korea. The Russia‐China trade and container
shipments constitute about a third of the TSR’s annual international container traffic. In 2009,
the bilateral trade via rails was 29.7 million tons. Russia’s exports to China totaled 28.4 million
tons, Chinese imports to Russia 1.2 million tons, and transit goods just 78,800 tons.86 These
figures were considerably lower than the previous year, due the 2008 global economic crisis.
The rail cargo trade between the two countries bounced back in 2010. By October 2010, it had
already reached 53 million tons, of which almost 94% was Russian exports of oil, timber,
chemical products and minerals.87
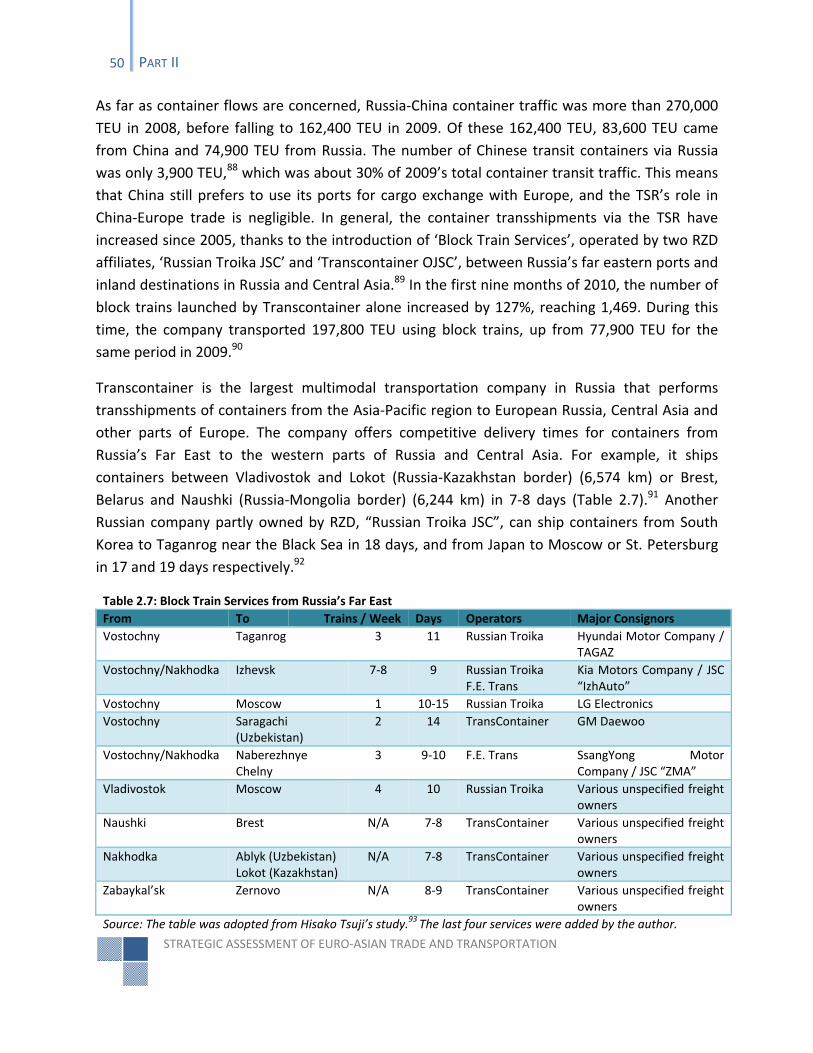
STRATEGIC ASSESSMENT OF EURO‐ASIAN TRADE AND TRANSPORTATION
50 PART II
As far as container flows are concerned, Russia‐China container traffic was more than 270,000
TEU in 2008, before falling to 162,400 TEU in 2009. Of these 162,400 TEU, 83,600 TEU came
from China and 74,900 TEU from Russia. The number of Chinese transit containers via Russia
was only 3,900 TEU,88 which was about 30% of 2009’s total container transit traffic. This means
that China still prefers to use its ports for cargo exchange with Europe, and the TSR’s role in
China‐Europe trade is negligible. In general, the container transshipments via the TSR have
increased since 2005, thanks to the introduction of ‘Block Train Services’, operated by two RZD
affiliates, ‘Russian Troika JSC’ and ‘Transcontainer OJSC’, between Russia’s far eastern ports and
inland destinations in Russia and Central Asia.89 In the first nine months of 2010, the number of
block trains launched by Transcontainer alone increased by 127%, reaching 1,469. During this
time, the company transported 197,800 TEU using block trains, up from 77,900 TEU for the
same period in 2009.90
Transcontainer is the largest multimodal transportation company in Russia that performs
transshipments of containers from the Asia‐Pacific region to European Russia, Central Asia and
other parts of Europe. The company offers competitive delivery times for containers from
Russia’s Far East to the western parts of Russia and Central Asia. For example, it ships
containers between Vladivostok and Lokot (Russia‐Kazakhstan border) (6,574 km) or Brest,
Belarus and Naushki (Russia‐Mongolia border) (6,244 km) in 7‐8 days (Table 2.7).91 Another
Russian company partly owned by RZD, “Russian Troika JSC”, can ship containers from South
Korea to Taganrog near the Black Sea in 18 days, and from Japan to Moscow or St. Petersburg
in 17 and 19 days respectively.92
Table 2.7: Block Train Services from Russia’s Far East
From To Trains / Week Days Operators Major Consignors
Vostochny Taganrog 3 11 Russian Troika Hyundai Motor Company / TAGAZ
Vostochny/Nakhodka Izhevsk 7‐8 9 Russian TroikaF.E. Trans
Kia Motors Company / JSC “IzhAuto”
Vostochny Moscow 1 10‐15 Russian Troika LG Electronics
Vostochny Saragachi (Uzbekistan)
2 14 TransContainer GM Daewoo
Vostochny/Nakhodka Naberezhnye Chelny
3 9‐10 F.E. Trans SsangYong Motor Company / JSC “ZMA”
Vladivostok Moscow 4 10 Russian Troika Various unspecified freight owners
Naushki Brest N/A 7‐8 TransContainer Various unspecified freight owners
Nakhodka Ablyk (Uzbekistan)Lokot (Kazakhstan)
N/A 7‐8 TransContainer Various unspecified freight owners
Zabaykal’sk Zernovo N/A 8‐9 TransContainer Various unspecified freight owners
Source: The table was adopted from Hisako Tsuji’s study.93 The last four services were added by the author.
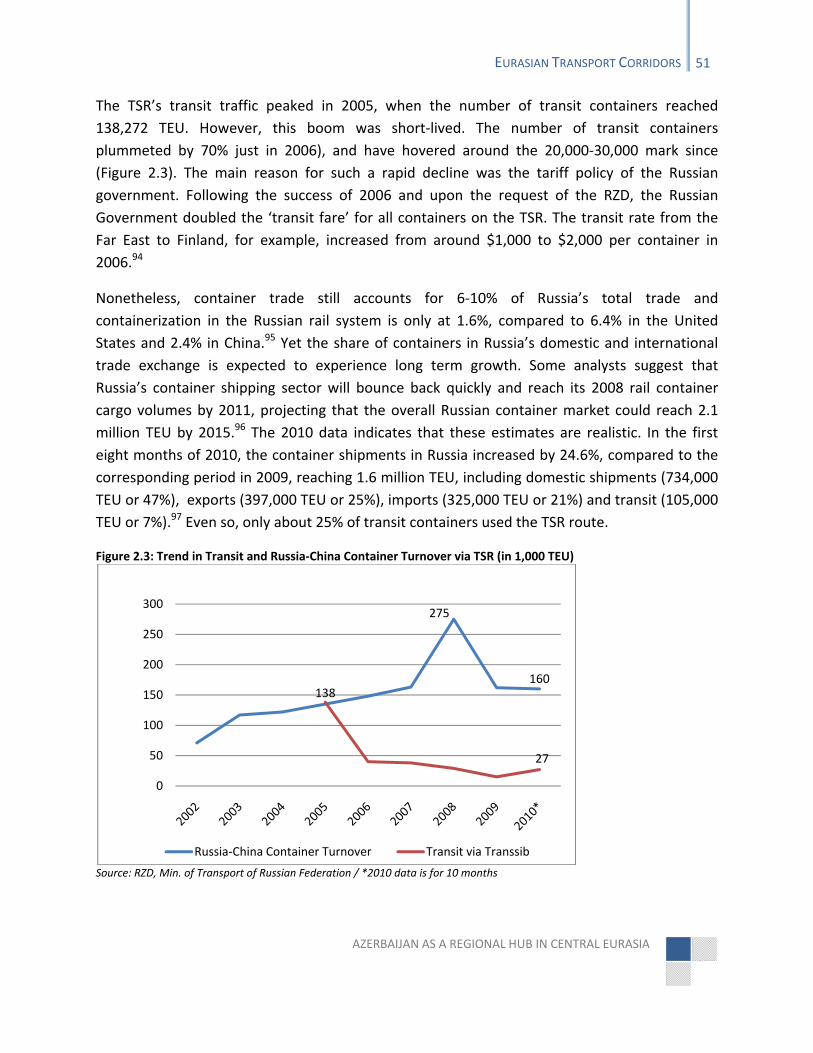
AZERBAIJAN AS A REGIONAL HUB IN CENTRAL EURASIA
EURASIAN TRANSPORT CORRIDORS 51
The TSR’s transit traffic peaked in 2005, when the number of transit containers reached
138,272 TEU. However, this boom was short‐lived. The number of transit containers
plummeted by 70% just in 2006), and have hovered around the 20,000‐30,000 mark since
(Figure 2.3). The main reason for such a rapid decline was the tariff policy of the Russian
government. Following the success of 2006 and upon the request of the RZD, the Russian
Government doubled the ‘transit fare’ for all containers on the TSR. The transit rate from the
Far East to Finland, for example, increased from around $1,000 to $2,000 per container in
2006.94
Nonetheless, container trade still accounts for 6‐10% of Russia’s total trade and
containerization in the Russian rail system is only at 1.6%, compared to 6.4% in the United
States and 2.4% in China.95 Yet the share of containers in Russia’s domestic and international
trade exchange is expected to experience long term growth. Some analysts suggest that
Russia’s container shipping sector will bounce back quickly and reach its 2008 rail container
cargo volumes by 2011, projecting that the overall Russian container market could reach 2.1
million TEU by 2015.96 The 2010 data indicates that these estimates are realistic. In the first
eight months of 2010, the container shipments in Russia increased by 24.6%, compared to the
corresponding period in 2009, reaching 1.6 million TEU, including domestic shipments (734,000
TEU or 47%), exports (397,000 TEU or 25%), imports (325,000 TEU or 21%) and transit (105,000
TEU or 7%).97 Even so, only about 25% of transit containers used the TSR route.
Figure 2.3: Trend in Transit and Russia‐China Container Turnover via TSR (in 1,000 TEU)
Source: RZD, Min. of Transport of Russian Federation / *2010 data is for 10 months
275
160138
27
0
50
100
150
200
250
300
Russia‐China Container Turnover Transit via Transsib
STRATEGIC ASSESSMENT OF EURO‐ASIAN TRADE AND TRANSPORTATION
52 PART II
It is important to note that TSR is a more attractive route for imports from East Asia and Asia‐
Pacific region to Russia rather than for imports to Western Europe. A number of private
companies consider TSR as a viable alternative to sea shipping. For example, in 2008, Mazda
conducted a number of test runs which included shipping its cars from Japan by rail via TSR. The
company’s traditional supply chain scheme involves the shipment of large number of cars
(about 6,000 cars) on a large ocean vessel directly from Japan to four European ports –
Barcelona, Antwerp, Rotterdam, and Bremerhaven – from where the cars are taken to Finland
on smaller ships and onward to Russia on trucks. The whole process takes up to 70 days.
Instead the shipping time of a dedicated full block train of 33 rail cars, which carries 330
vehicles, from Russia’s Far Eastern port of Zarubino to Moscow via TSR only takes 10‐13 days,
with the whole trip from Japanese port to Moscow lasting 13‐18 days.98 Among Mazda’s
concerns were the issues of throughput capacity of the Russian railways, the lack of modern
fully closed rail cars, and the unpredictability of rail tariff rates in Russia.
Though the transit tariff price did not change radically until 2006, the sudden jump in prices in
2006 deterred clients from using TSR, and they quickly returned to their traditional mode of sea
shipping. Since then, the RZD has worked to find a flexible solution that would satisfy clients as
well as allowing the company to operate without financial losses. In 2010, RZD announced that
it would reduce door‐to‐door tariff rates by 30% for shipments from Japan to European parts of
Russia, mostly to help Russian factories dependent on spare auto parts imported from Japan.
The transit fee was still $1000 higher than the cost of ocean freight, but the Japanese exporters
would have saved about 20 days in shipping times.99 This arrangement is potentially viable, and
could allow Japanese businesses to switch to the TSR. However, Russian experts believe that for
the TSR as a whole to become competitive, the RZD should be aiming for a tariff rate below
$3,000 for a 40 ft container traveling from the Asia‐Pacific region to the EU, which under
current circumstances seems difficult.100 This is because the ‘through tariff rate’ for shipments
between Europe and Asia is calculated as the sum total of tariffs from several different
countries – not just Russia – and there is a certain bottom line below which the transit of
containers through TSR is no longer commercially viable for RZD.
For example, in 2009, the structure of an official tariff for a 40 ft container from Vladivostok to
Germany (excluding other fees) looked like this: the share of RZD ($1,328 for 9,852 km);
Belarusian Railways ($282 for 609 km); Polish and German Railways ($1,292 for 1,094 km).101
But when additional fees and transshipment charges are applied, the cost goes up. To ship a 40
ft container from the Port of Busan, South Korea to the Poland‐Germany border would have
cost $5,112: the shipping fee from Port of Busan to Port of Vostochniy (Russia) ‐ $1,350;
services fee at the Port of Vostochniy ‐ $400; customs broker fee ‐ $122; RZD tariff ‐ $1,290;
AZERBAIJAN AS A REGIONAL HUB IN CENTRAL EURASIA
EURASIAN TRANSPORT CORRIDORS 53
Polish Railways tariff ‐ $1,034; payment to a rail car owner ‐ $600; as well as other security fees
and payments in Belarus (again using 2009 figures).102
The cost of transporting a 40 ft container from Shanghai to Moscow using TSR was $5,600‐
5,800 in 2009, while shipping it via the traditional ocean route to the Port of St. Petersburg and
onwards by truck would have cost $3,470.103 Similarly, shipping a 40 ft container from Japan to
St. Petersburg by sea would have cost $5,300 (this was before the ocean shipping rates fell
considerably), while transporting it via the TSR system would have cost $6,800.104
Despite these challenges, RZD President Vladimir Yakunin has committed to increasing the
numbers of containers moved between the Asia‐Pacific region and Europe to 1 million TEU in
the long term. According to Yakunin, the annual market of Asia‐Pacific region ‐ Europe
container shipments is worth $600 billion, and capturing a 1% of this trade would mean an
additional $6 billion for the State budget.105 DB Schenker plans to run one block train per day in
the medium term (with 89 or 90 TEU per train). If this service runs without interruption
throughout the entire year, the total number of containers moved in one direction would still
be less than 33,000 TEU per year, which is only about 1% of the total annual container
exchange between China and Germany. Nonetheless, the planned expansion of the wide gauge
(1520 mm) railway from Russia to Vienna could help boost the TSR’s cargo capacity, reduce
shipment costs, and cut shipping time to 15 days. The cost of the proposed 450 km extension is
estimated at €6.3 billion, with an additional €240 million for terminals and €130 million for
rolling stock.106 The project is currently in the feasibility drafting stage, and it is likely to be
several years before the construction begins.
In order to increase the competitiveness of TSR, and achieve the goal of a 560,000 TEU
exchanged between Europe and the Asia‐Pacific by 2015, the Russian government plans to
invest approximately $23 billion over the next 9 years for infrastructure improvements. 107
About $4.3 billion is scheduled for investment by 2015.108 In addition, the RZD has developed a
project called “TSR in 7 Days”, the aim of which is to increase the speed of intermodal trains,
enabling them to cover 1,500 km per day, up from the current 910 km per day.109 Test runs
have already achieved a 7 day travel time between Vladivostok and Moscow (9,270 km).
However, to achieve its goal of 560,000 TEU by 2015, Russia needs to get China onboard, since
more than 60% of these containers (358,000 TEU) would need to be exported (273,000 TEU)
and imported (85,000 TEU) by China.110
In November 2010, the RZD announced the establishment of a trilateral JV with participation of
Russian, German and Chinese partners,111 advancing previously signed bilateral agreements
between Russia and Germany and Russia and China. In 2009, “Transcontainer OJSC” and China
Railway Container Transport (CRCT) Corporation’s subsidiary China Railway International
STRATEGIC ASSESSMENT OF EURO‐ASIAN TRADE AND TRANSPORTATION
54 PART II
Multimodal Transport (CRIMT) established the first JV to provide international rail freight
services along the TSR and Trans‐Kazakhstan routes. The CRIMT has a majority stake (51%) in
the JV.112 The Chinese side seems to have indicated that most of the cargo will be shipped from
the remote North‐West regions of China that do not have access to ports. More recently,
Transcontainer also acquired a majority stake (67%) in Kazakhstan’s major container terminal
operator JSC KedenTransService. The latter offers a wide range of services in Kazakhstan
including transshipments from/to China at the Kazakh‐Chinese border near Dostyk.113
In April and September of 2010, two pilot runs were conducted by RZD to show the viability of
long haul rail transport via TSR. A train left from Hamina (Finland) with 64 40 ft containers and
traveled via the TSR to Port of Vostochniy, and from there to China, South Korea and Taiwan.
The TSR segment of the journey only took 10 days.114 Moreover, in January 2011, the Japanese
government rented a block train to test the feasibility of shipping Japanese goods to Moscow
via the TSR. On January 27, the train left the Japanese city of Hamada and headed towards the
South Korean Port of Busan. After crossing the Korean Peninsula, it reached Vladivostok on
February 8, and left for Moscow on February 13. The whole journey was about 30 days.115
Yet, further work is required if the Northern Eurasian rail corridor via TSR is to be a competitive
supply chain route. More recently, the RZD has introduced fast container trains that can cover
1200 km in 24 hours.116It has improved the service quality and cargo security by developing
software to track wagons and containers in real time. In 2011, RZD plans to introduce a Ro‐Ro
rail service for trucks along the Moscow‐ St. Petersburg‐Helsinki route, which could reduce the
wait at the Russian‐Finish border.117
The TSR is not in direct competition with the Central Corridor (TRACECA) via Azerbaijan since its
main purpose has been to serve Russian suppliers and customers, as reflected by the volume of
import and export trade along the TSR. While the RZD might be interested in offering favorable
terms for imports from Japan, China and other Asia‐Pacific countries to Russia, the same terms
are unlikely to be sustainable for transit traffic to Europe. However, when the RZD’s wide gauge
extension to Austria is completed, the TSR will have a greater chance of becoming a serious
transit bridge between the Asia‐Pacific region and the EU. In the future, the number of
dedicated block trains from Japan, South Korea and China to domestic factories in Russia and
Central Asia is expected to rise. But the TSR is not likely to attract transit cargo from China and
other Asian countries in big volumes since the set transit tariff will be too high for them.
Moreover, the TSR line serves the Asia‐Pacific regions, including eastern China, rather than
North‐West China. For this reason, the Trans‐Kazakhstan route, closer to the remote parts of
North‐West China and Afghanistan, has a better chance to become a transit bridge between
China and Europe.
AZERBAIJAN AS A REGIONAL HUB IN CENTRAL EURASIA
EURASIAN TRANSPORT CORRIDORS 55
TransKazakhstan Routes
Kazakhstan occupies an important position in the Euro‐Asian transportation network and will
gradually become a strategic Central Asian transit bridge between Europe and China. There are
4 international railway and 6 international motorway transport corridors within its borders.
Additionally, it is in the prime position for transiting goods to/from China. The country borders
the Xinjiang Uygur Autonomous Region (Xinjiang) of China – one of the Chinese regions that will
play a key role in the Euro‐Asian trade and transportation via Azerbaijan in the long term. Yet,
today the country’s share in Euro‐Asian container transshipments is less than 1%.118 As the rail
and road networks in Eurasia become more efficient and are better integrated, Kazakhstan’s
importance is likely to increase.
In 2009, 2.1 billion tons of cargo was transported in Kazakhstan. More than 80% of this cargo
was carried by road, followed by railway (11.8%) and pipeline (7.7%). The cargo carried by
water and air accounted for less than 1% (Figure 2.4).119 As in Azerbaijan, the majority of road
cargo is transported internally within the country. In 2010, the total cargo moved by all modes
of transportation stood at 2.2 billion tons, of which only 16.2 million tons were transit
freight.120
Kazakhstan’s railway network exceeds 15,000 km, including 4,054 km of electrified routes (27%
of the total).121 Its road and highway network exceeds 93,000 km, including national highways
(23,500 km) and local roads (70,100 km).122 Although railway transportation accounts for 11.8%
of the total transportation, the railway sector carries most of Kazakhstan’s strategic resources
such as coal, crude oil, grain, ferrous metals, and other minerals (2009 data). In 2010, railways
transported 268 million tons of cargo, of which 141 million tons were domestic cargo (53%), 96
million tons were exports (36%), 17 million tons were imports (6%), and about 14 million tons
were transit goods (5%).123 In 2010, railways carried more than 85% of all transit cargo in
Kazakhstan.
Kazakhstan’s major foreign partner in rail cargo exchange is Russia, accounting for 23% of the
total rail trade in 2010. Exports to Russia came to 49.3 million tons, or 18% of total rail cargo.
Imports from Russia amounted to 10.7 million tons (4%); transit to Russia was 6.5 million tons
(2%); transit from Russia was 1.5 million tons (1%). Kazakhstan’s exports to China stood at 8.8
million tons (3% of total rail cargo), imports at 1.8 million tons, and transit from and to China at
approximately 2 million and 749,110 tons respectively. The transit cargo to Afghanistan via
Kazakhstan exceeded 1 million tons.124 In 2010, the average speed of a freight train in
Kazakhstan was about 42 km/h.
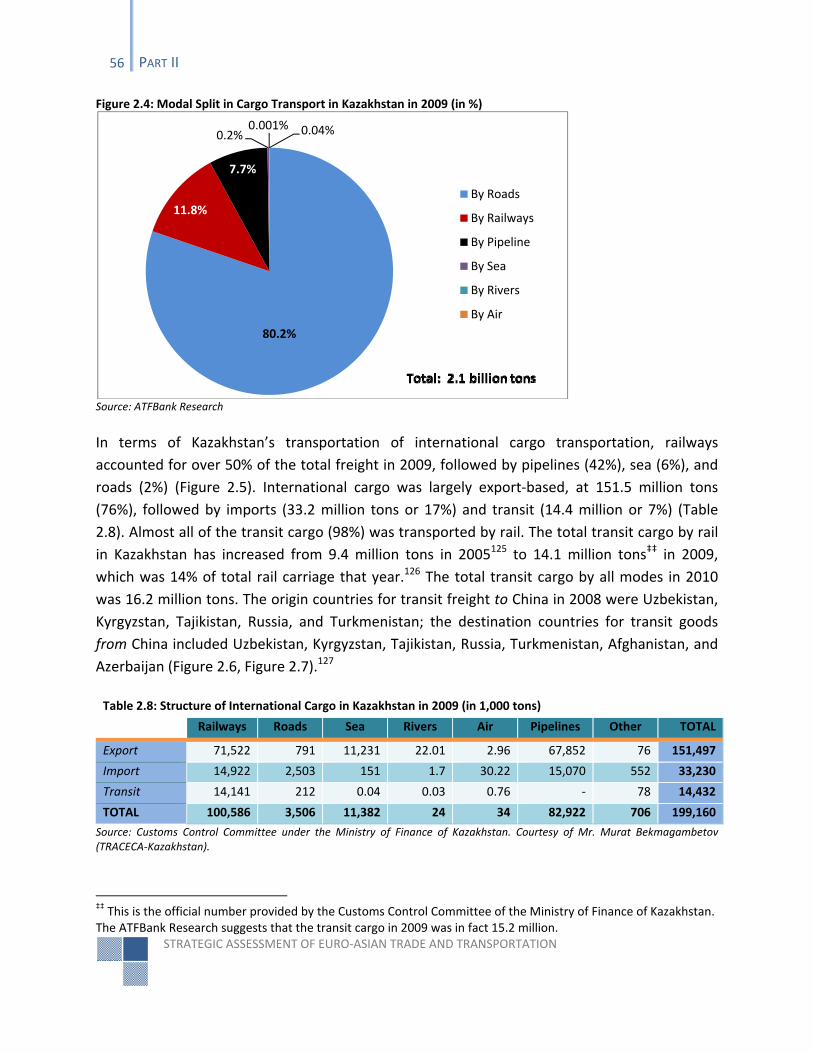
STRATEGIC ASSESSMENT OF EURO‐ASIAN TRADE AND TRANSPORTATION
56 PART II
Figure 2.4: Modal Split in Cargo Transport in Kazakhstan in 2009 (in %)
Source: ATFBank Research
In terms of Kazakhstan’s transportation of international cargo transportation, railways
accounted for over 50% of the total freight in 2009, followed by pipelines (42%), sea (6%), and
roads (2%) (Figure 2.5). International cargo was largely export‐based, at 151.5 million tons
(76%), followed by imports (33.2 million tons or 17%) and transit (14.4 million or 7%) (Table
2.8). Almost all of the transit cargo (98%) was transported by rail. The total transit cargo by rail
in Kazakhstan has increased from 9.4 million tons in 2005125 to 14.1 million tons‡‡ in 2009,
which was 14% of total rail carriage that year.126 The total transit cargo by all modes in 2010
was 16.2 million tons. The origin countries for transit freight to China in 2008 were Uzbekistan,
Kyrgyzstan, Tajikistan, Russia, and Turkmenistan; the destination countries for transit goods
from China included Uzbekistan, Kyrgyzstan, Tajikistan, Russia, Turkmenistan, Afghanistan, and
Azerbaijan (Figure 2.6, Figure 2.7).127
Table 2.8: Structure of International Cargo in Kazakhstan in 2009 (in 1,000 tons)
Railways Roads Sea Rivers Air Pipelines Other TOTAL
Export 71,522 791 11,231 22.01 2.96 67,852 76 151,497
Import 14,922 2,503 151 1.7 30.22 15,070 552 33,230
Transit 14,141 212 0.04 0.03 0.76 ‐ 78 14,432
TOTAL 100,586 3,506 11,382 24 34 82,922 706 199,160
Source: Customs Control Committee under the Ministry of Finance of Kazakhstan. Courtesy of Mr. Murat Bekmagambetov (TRACECA‐Kazakhstan).
‡‡ This is the official number provided by the Customs Control Committee of the Ministry of Finance of Kazakhstan. The ATFBank Research suggests that the transit cargo in 2009 was in fact 15.2 million.
80.2%
11.8%
7.7%
0.2%0.001% 0.04%
By Roads
By Railways
By Pipeline
By Sea
By Rivers
By Air
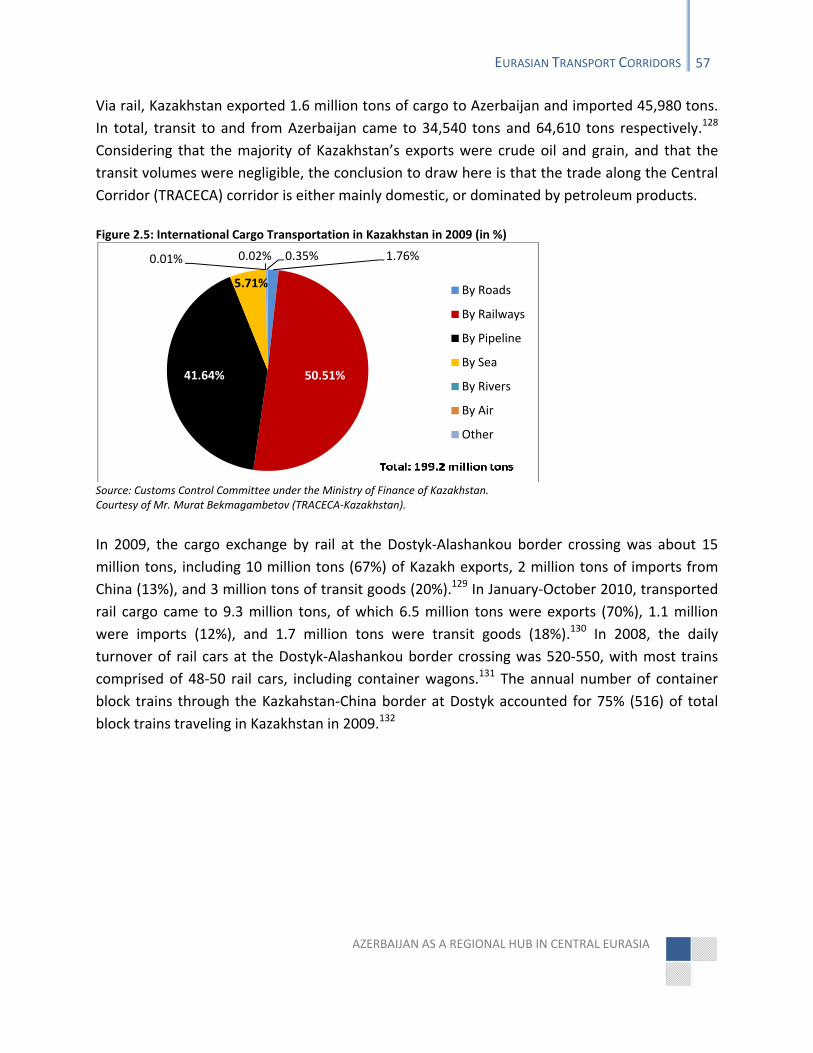
AZERBAIJAN AS A REGIONAL HUB IN CENTRAL EURASIA
EURASIAN TRANSPORT CORRIDORS 57
Via rail, Kazakhstan exported 1.6 million tons of cargo to Azerbaijan and imported 45,980 tons.
In total, transit to and from Azerbaijan came to 34,540 tons and 64,610 tons respectively.128
Considering that the majority of Kazakhstan’s exports were crude oil and grain, and that the
transit volumes were negligible, the conclusion to draw here is that the trade along the Central
Corridor (TRACECA) corridor is either mainly domestic, or dominated by petroleum products.
Figure 2.5: International Cargo Transportation in Kazakhstan in 2009 (in %)
Source: Customs Control Committee under the Ministry of Finance of Kazakhstan. Courtesy of Mr. Murat Bekmagambetov (TRACECA‐Kazakhstan).
In 2009, the cargo exchange by rail at the Dostyk‐Alashankou border crossing was about 15
million tons, including 10 million tons (67%) of Kazakh exports, 2 million tons of imports from
China (13%), and 3 million tons of transit goods (20%).129 In January‐October 2010, transported
rail cargo came to 9.3 million tons, of which 6.5 million tons were exports (70%), 1.1 million
were imports (12%), and 1.7 million tons were transit goods (18%).130 In 2008, the daily
turnover of rail cars at the Dostyk‐Alashankou border crossing was 520‐550, with most trains
comprised of 48‐50 rail cars, including container wagons.131 The annual number of container
block trains through the Kazkahstan‐China border at Dostyk accounted for 75% (516) of total
block trains traveling in Kazakhstan in 2009.132
1.76%
50.51%41.64%
5.71%
0.01% 0.02% 0.35%
By Roads
By Railways
By Pipeline
By Sea
By Rivers
By Air
Other
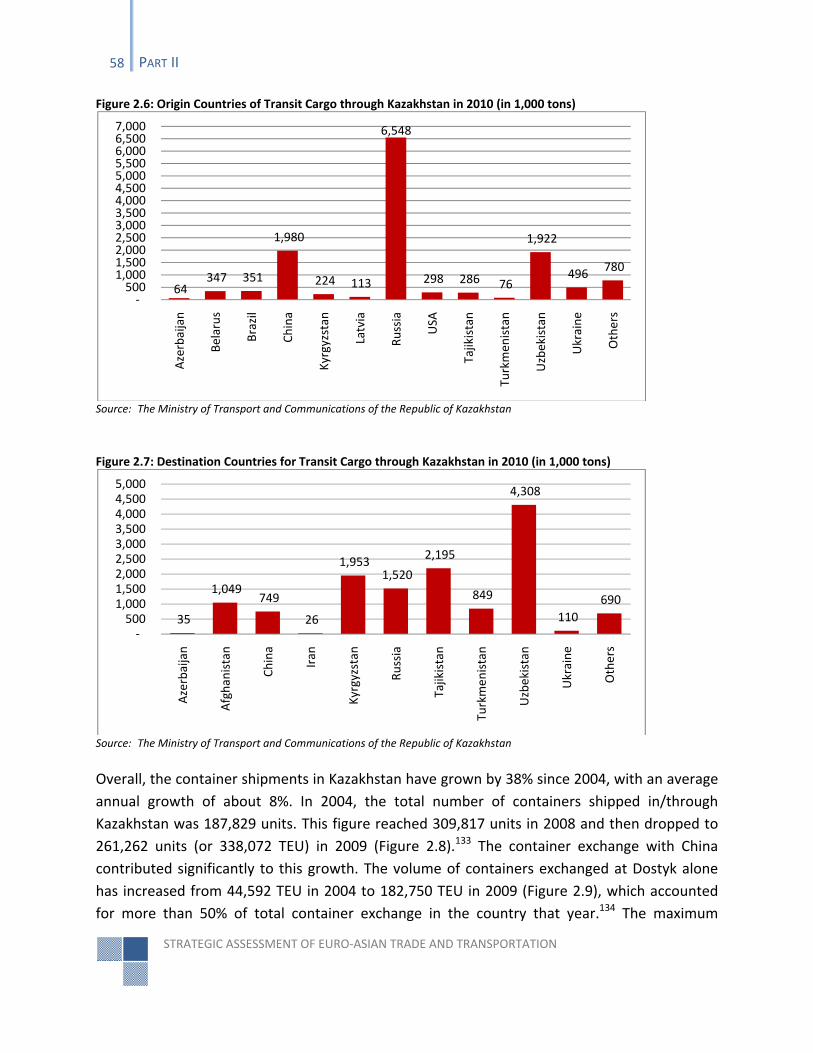
STRATEGIC ASSESSMENT OF EURO‐ASIAN TRADE AND TRANSPORTATION
58 PART II
Figure 2.6: Origin Countries of Transit Cargo through Kazakhstan in 2010 (in 1,000 tons)
Source: The Ministry of Transport and Communications of the Republic of Kazakhstan
Figure 2.7: Destination Countries for Transit Cargo through Kazakhstan in 2010 (in 1,000 tons)
Source: The Ministry of Transport and Communications of the Republic of Kazakhstan
Overall, the container shipments in Kazakhstan have grown by 38% since 2004, with an average
annual growth of about 8%. In 2004, the total number of containers shipped in/through
Kazakhstan was 187,829 units. This figure reached 309,817 units in 2008 and then dropped to
261,262 units (or 338,072 TEU) in 2009 (Figure 2.8).133 The container exchange with China
contributed significantly to this growth. The volume of containers exchanged at Dostyk alone
has increased from 44,592 TEU in 2004 to 182,750 TEU in 2009 (Figure 2.9), which accounted
for more than 50% of total container exchange in the country that year.134 The maximum
64 347 351
1,980
224 113
6,548
298 286 76
1,922
496 780
‐500
1,000 1,500 2,000 2,500 3,000 3,500 4,000 4,500 5,000 5,500 6,000 6,500 7,000
Azerbaijan
Belarus
Brazil
China
Kyrgyzstan
Latvia
Russia
USA
Tajikistan
Turkmen
istan
Uzbekistan
Ukraine
Others
35
1,049 749
26
1,953 1,520
2,195
849
4,308
110
690
‐500
1,000 1,500 2,000 2,500 3,000 3,500 4,000 4,500 5,000
Azerbaijan
Afghanistan
China
Iran
Kyrgyzstan
Russia
Tajikistan
Turkmen
istan
Uzbekistan
Ukraine
Others
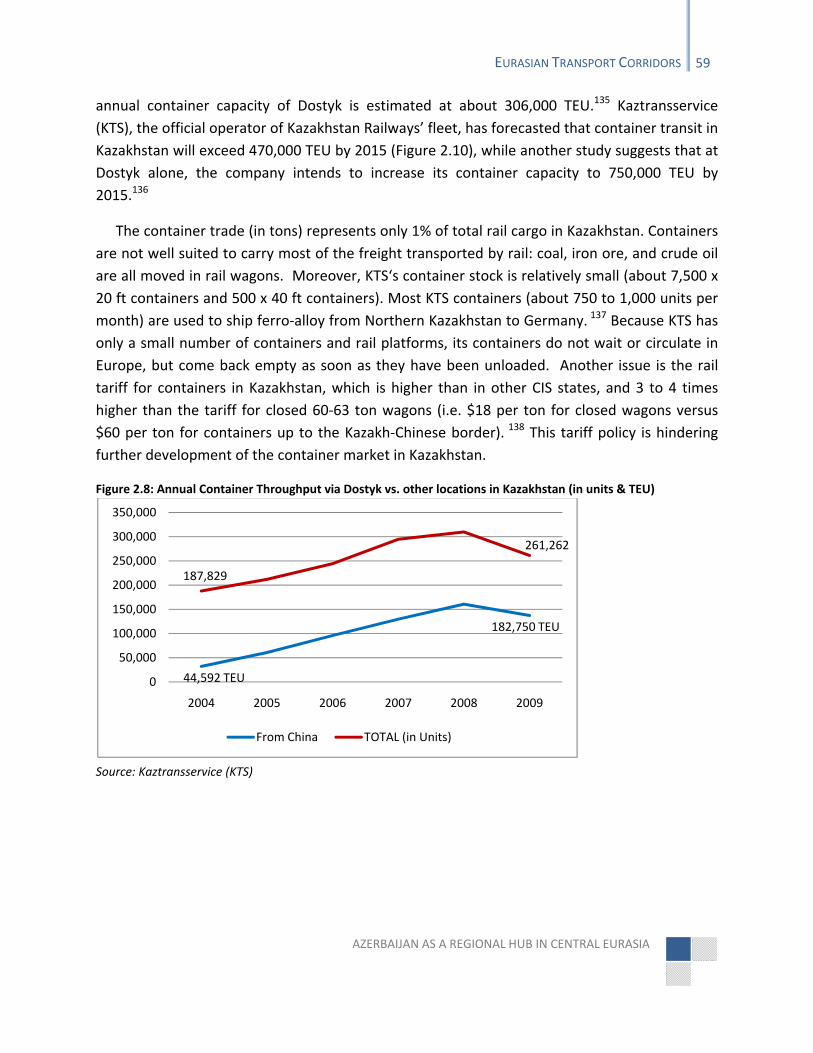
AZERBAIJAN AS A REGIONAL HUB IN CENTRAL EURASIA
EURASIAN TRANSPORT CORRIDORS 59
annual container capacity of Dostyk is estimated at about 306,000 TEU.135 Kaztransservice
(KTS), the official operator of Kazakhstan Railways’ fleet, has forecasted that container transit in
Kazakhstan will exceed 470,000 TEU by 2015 (Figure 2.10), while another study suggests that at
Dostyk alone, the company intends to increase its container capacity to 750,000 TEU by
2015.136
The container trade (in tons) represents only 1% of total rail cargo in Kazakhstan. Containers
are not well suited to carry most of the freight transported by rail: coal, iron ore, and crude oil
are all moved in rail wagons. Moreover, KTS‘s container stock is relatively small (about 7,500 x
20 ft containers and 500 x 40 ft containers). Most KTS containers (about 750 to 1,000 units per
month) are used to ship ferro‐alloy from Northern Kazakhstan to Germany. 137 Because KTS has
only a small number of containers and rail platforms, its containers do not wait or circulate in
Europe, but come back empty as soon as they have been unloaded. Another issue is the rail
tariff for containers in Kazakhstan, which is higher than in other CIS states, and 3 to 4 times
higher than the tariff for closed 60‐63 ton wagons (i.e. $18 per ton for closed wagons versus
$60 per ton for containers up to the Kazakh‐Chinese border). 138 This tariff policy is hindering
further development of the container market in Kazakhstan.
Figure 2.8: Annual Container Throughput via Dostyk vs. other locations in Kazakhstan (in units & TEU)
Source: Kaztransservice (KTS)
44,592 TEU
182,750 TEU
187,829
261,262
0
50,000
100,000
150,000
200,000
250,000
300,000
350,000
2004 2005 2006 2007 2008 2009
From China TOTAL (in Units)
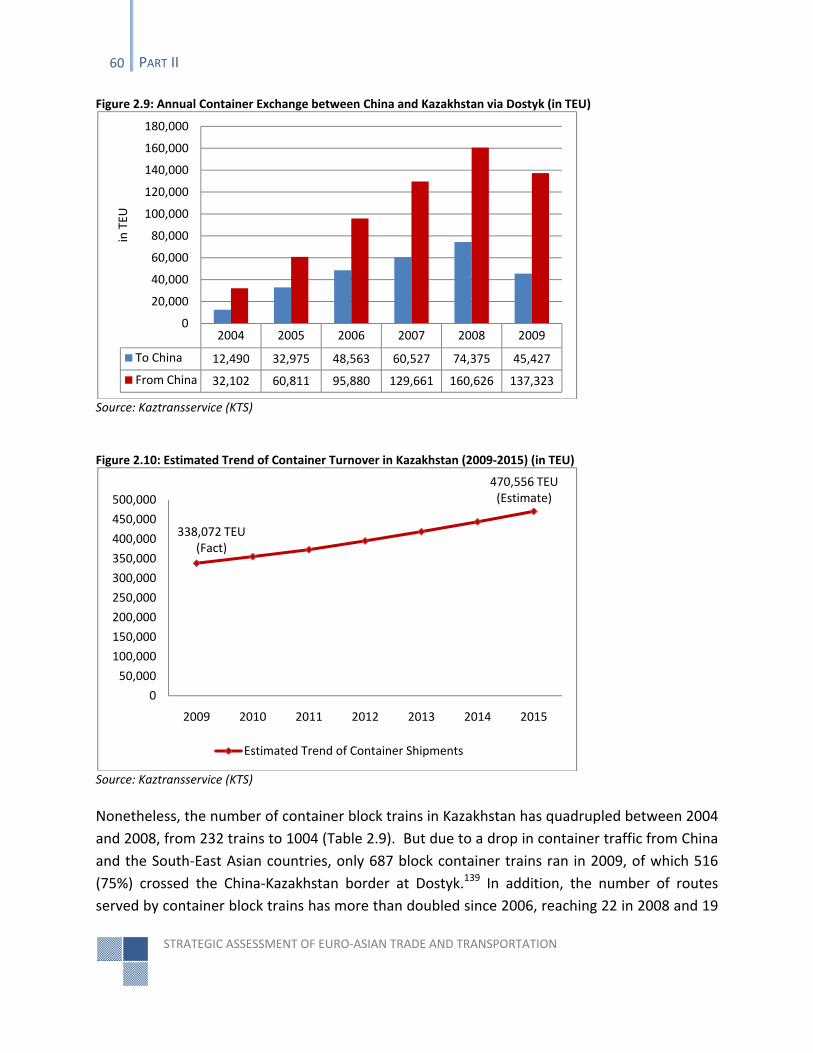
STRATEGIC ASSESSMENT OF EURO‐ASIAN TRADE AND TRANSPORTATION
60 PART II
Figure 2.9: Annual Container Exchange between China and Kazakhstan via Dostyk (in TEU)
Source: Kaztransservice (KTS)
Figure 2.10: Estimated Trend of Container Turnover in Kazakhstan (2009‐2015) (in TEU)
Source: Kaztransservice (KTS)
Nonetheless, the number of container block trains in Kazakhstan has quadrupled between 2004
and 2008, from 232 trains to 1004 (Table 2.9). But due to a drop in container traffic from China
and the South‐East Asian countries, only 687 block container trains ran in 2009, of which 516
(75%) crossed the China‐Kazakhstan border at Dostyk.139 In addition, the number of routes
served by container block trains has more than doubled since 2006, reaching 22 in 2008 and 19
2004 2005 2006 2007 2008 2009
To China 12,490 32,975 48,563 60,527 74,375 45,427
From China 32,102 60,811 95,880 129,661 160,626 137,323
0
20,000
40,000
60,000
80,000
100,000
120,000
140,000
160,000
180,000in TEU
338,072 TEU (Fact)
470,556 TEU (Estimate)
0
50,000
100,000
150,000
200,000
250,000
300,000
350,000
400,000
450,000
500,000
2009 2010 2011 2012 2013 2014 2015
Estimated Trend of Container Shipments
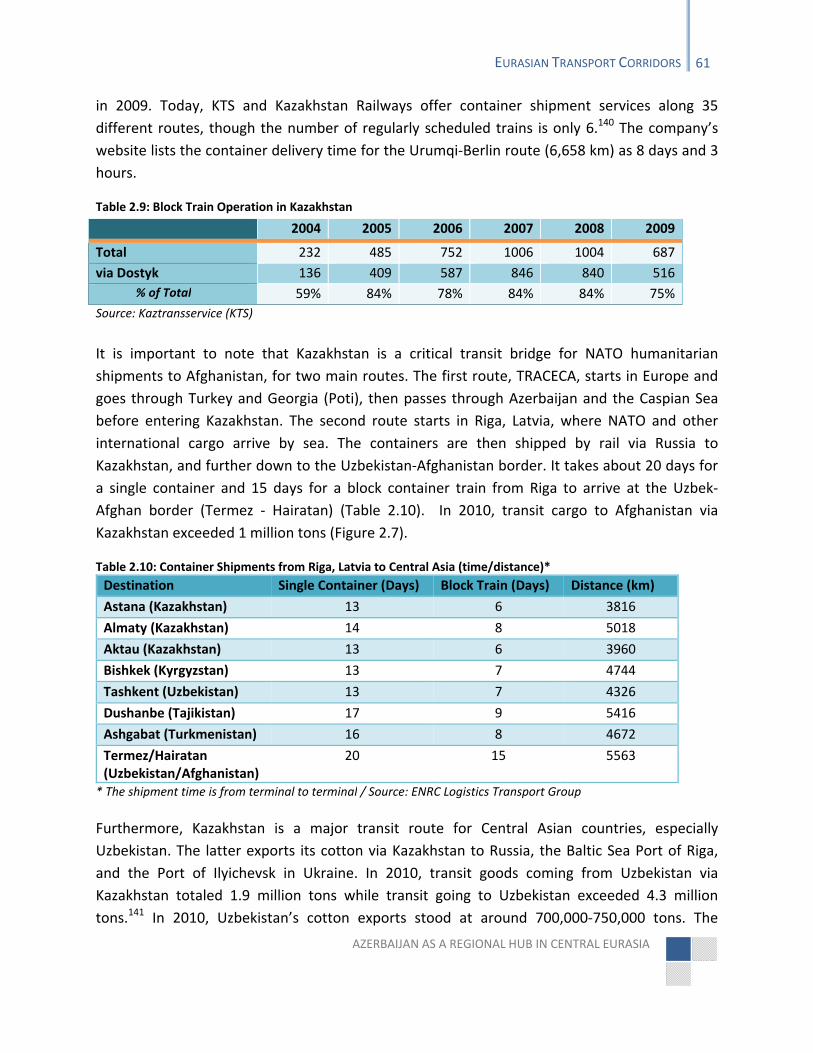
AZERBAIJAN AS A REGIONAL HUB IN CENTRAL EURASIA
EURASIAN TRANSPORT CORRIDORS 61
in 2009. Today, KTS and Kazakhstan Railways offer container shipment services along 35
different routes, though the number of regularly scheduled trains is only 6.140 The company’s
website lists the container delivery time for the Urumqi‐Berlin route (6,658 km) as 8 days and 3
hours.
Table 2.9: Block Train Operation in Kazakhstan
2004 2005 2006 2007 2008 2009
Total 232 485 752 1006 1004 687
via Dostyk 136 409 587 846 840 516
% of Total 59% 84% 78% 84% 84% 75%
Source: Kaztransservice (KTS)
It is important to note that Kazakhstan is a critical transit bridge for NATO humanitarian
shipments to Afghanistan, for two main routes. The first route, TRACECA, starts in Europe and
goes through Turkey and Georgia (Poti), then passes through Azerbaijan and the Caspian Sea
before entering Kazakhstan. The second route starts in Riga, Latvia, where NATO and other
international cargo arrive by sea. The containers are then shipped by rail via Russia to
Kazakhstan, and further down to the Uzbekistan‐Afghanistan border. It takes about 20 days for
a single container and 15 days for a block container train from Riga to arrive at the Uzbek‐
Afghan border (Termez ‐ Hairatan) (Table 2.10). In 2010, transit cargo to Afghanistan via
Kazakhstan exceeded 1 million tons (Figure 2.7).
Table 2.10: Container Shipments from Riga, Latvia to Central Asia (time/distance)*
Destination Single Container (Days) Block Train (Days) Distance (km)
Astana (Kazakhstan) 13 6 3816
Almaty (Kazakhstan) 14 8 5018
Aktau (Kazakhstan) 13 6 3960
Bishkek (Kyrgyzstan) 13 7 4744
Tashkent (Uzbekistan) 13 7 4326
Dushanbe (Tajikistan) 17 9 5416
Ashgabat (Turkmenistan) 16 8 4672
Termez/Hairatan (Uzbekistan/Afghanistan)
20 15 5563
* The shipment time is from terminal to terminal / Source: ENRC Logistics Transport Group
Furthermore, Kazakhstan is a major transit route for Central Asian countries, especially
Uzbekistan. The latter exports its cotton via Kazakhstan to Russia, the Baltic Sea Port of Riga,
and the Port of Ilyichevsk in Ukraine. In 2010, transit goods coming from Uzbekistan via
Kazakhstan totaled 1.9 million tons while transit going to Uzbekistan exceeded 4.3 million
tons.141 In 2010, Uzbekistan’s cotton exports stood at around 700,000‐750,000 tons. The
STRATEGIC ASSESSMENT OF EURO‐ASIAN TRADE AND TRANSPORTATION
62 PART II
majority of this cotton (about 300,000 tons) was sold through the Iranian Port of Bandar Abbas
and around 200,000‐250,000 tons were sold directly to China. About 100,000 tons were
shipped via the Port of Ilyichevsk in Ukraine, 50,000‐70,000 tons via the Port of Riga, and
50,000‐70,000 tons exported to Russia.142 Although Baku acted as one of the major transit
routes for Uzbekistan’s cotton in the late 1990s, today only about 10,000‐15,000 tons of Uzbek
cotton goes through Azerbaijan. This sharp decline was the result of increased tariffs for cotton
transit, which discouraged Uzbek cotton exporters from using TRACECA. The Iranian
government, on the other hand, created very attractive conditions for Uzbekistan at the Port of
Bandar Abbas and has managed to increase the cotton traffic via Iran. In general, the demand
for Uzbek cotton has shifted from Europe to Asia, which is why Uzbekistan exports most of its
cotton to countries in Asia.
Another important non‐oil product is grain. Grain products are one of Kazakhstan’s strategic
exports. In 2009, Kazakhstan produced 20.8 million tons of grain, of which 17 million tons, or
82%, was wheat. During the 2009‐2010 grain season, the country exported 8.3 million tons of
grain and flour products.143 With the aim of diversifying its markets, the Kazakh government‐
built grain terminals in other Caspian littoral states, such as Azerbaijan and Iran. It has finished
a jointly owned grain terminal in Baku, with an annual processing capacity of 500,000 tons, and
another jointly owned terminal in the Port of Amirabad, which has an annual processing
capacity of 700,000 tons. Through the Baku terminal, Kazakhstan will be able to sell its grain to
the Caucasus and Turkey, while the Amirabad grain terminal will mainly serve Middle Eastern
and North African markets, including Iran’s domestic market.
In addition to rail transport, Kazakhstan is a key transit country for road transportation,
especially for the New Eurasian Land Transport Initiative (NELTI) led by the International Road
Transport Union (IRU). There are three NELTI corridors linking China, Central Asia and Europe
via three different routes (Appendix B). The NELTI Northern corridor is the most relevant
corridor for Kazakhstan, as it starts at the Kazakhstan‐China border and accesses the EU
through Kazakhstan, Russia and Belarus (another branch also crosses Uzbekistan). In 2005, IRU
organized the first commercial truck caravan from Beijing to Brussels, which started in Beijing
on September 27 and ended in Brussels on October 17. The aim of the Beijing‐Brussels Caravan
project was “to demonstrate that road transport could be an effective means of shipping cargo
by land between Europe and the countries of the Asia ‐ Pacific region.”144 The participants of
the caravan were IRU member associations: CRTA (China), KAZATO (Kazakhstan), ASMAP
(Russian Federation), LINAVA (Lithuania), Latvijas Auto (Latvia) and ZMPD (Poland). The route
was about 12,000 km long, and it went through Astana, Moscow, Riga, Vilnius, Warsaw and
Brussels.145
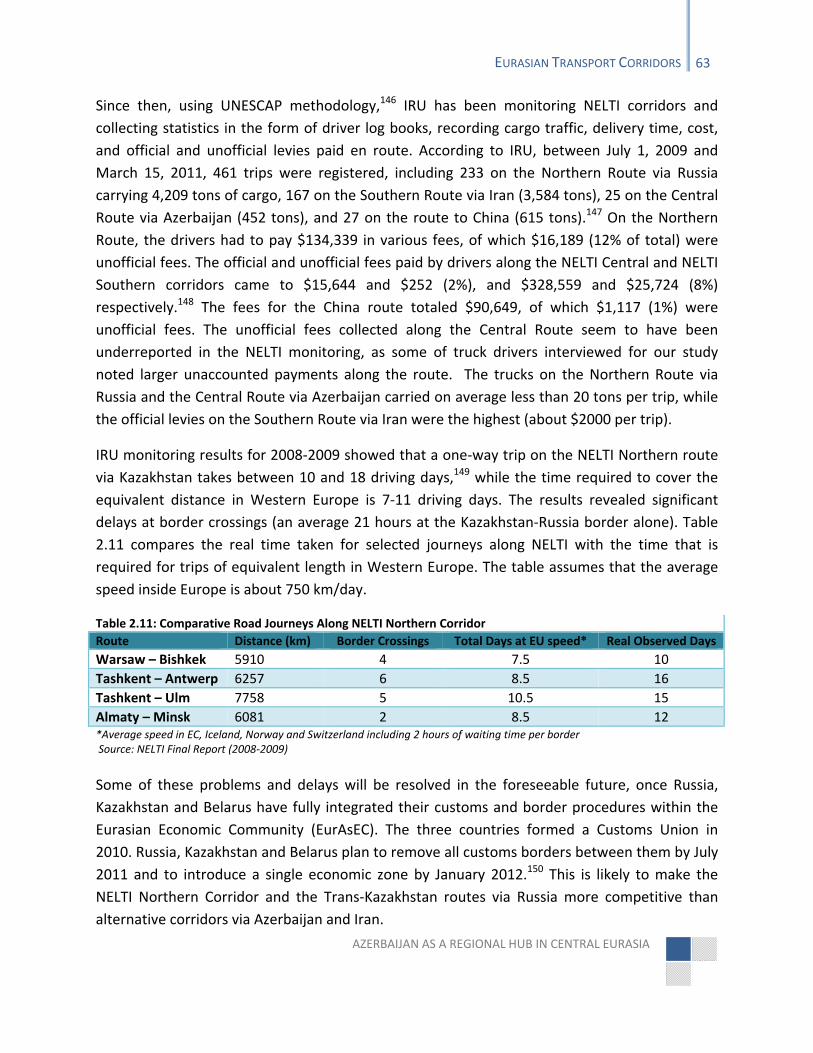
AZERBAIJAN AS A REGIONAL HUB IN CENTRAL EURASIA
EURASIAN TRANSPORT CORRIDORS 63
Since then, using UNESCAP methodology,146 IRU has been monitoring NELTI corridors and
collecting statistics in the form of driver log books, recording cargo traffic, delivery time, cost,
and official and unofficial levies paid en route. According to IRU, between July 1, 2009 and
March 15, 2011, 461 trips were registered, including 233 on the Northern Route via Russia
carrying 4,209 tons of cargo, 167 on the Southern Route via Iran (3,584 tons), 25 on the Central
Route via Azerbaijan (452 tons), and 27 on the route to China (615 tons).147 On the Northern
Route, the drivers had to pay $134,339 in various fees, of which $16,189 (12% of total) were
unofficial fees. The official and unofficial fees paid by drivers along the NELTI Central and NELTI
Southern corridors came to $15,644 and $252 (2%), and $328,559 and $25,724 (8%)
respectively.148 The fees for the China route totaled $90,649, of which $1,117 (1%) were
unofficial fees. The unofficial fees collected along the Central Route seem to have been
underreported in the NELTI monitoring, as some of truck drivers interviewed for our study
noted larger unaccounted payments along the route. The trucks on the Northern Route via
Russia and the Central Route via Azerbaijan carried on average less than 20 tons per trip, while
the official levies on the Southern Route via Iran were the highest (about $2000 per trip).
IRU monitoring results for 2008‐2009 showed that a one‐way trip on the NELTI Northern route
via Kazakhstan takes between 10 and 18 driving days,149 while the time required to cover the
equivalent distance in Western Europe is 7‐11 driving days. The results revealed significant
delays at border crossings (an average 21 hours at the Kazakhstan‐Russia border alone). Table
2.11 compares the real time taken for selected journeys along NELTI with the time that is
required for trips of equivalent length in Western Europe. The table assumes that the average
speed inside Europe is about 750 km/day.
Table 2.11: Comparative Road Journeys Along NELTI Northern Corridor
Route Distance (km) Border Crossings Total Days at EU speed* Real Observed Days
Warsaw – Bishkek 5910 4 7.5 10
Tashkent – Antwerp 6257 6 8.5 16
Tashkent – Ulm 7758 5 10.5 15
Almaty – Minsk 6081 2 8.5 12 *Average speed in EC, Iceland, Norway and Switzerland including 2 hours of waiting time per border Source: NELTI Final Report (2008‐2009)
Some of these problems and delays will be resolved in the foreseeable future, once Russia,
Kazakhstan and Belarus have fully integrated their customs and border procedures within the
Eurasian Economic Community (EurAsEC). The three countries formed a Customs Union in
2010. Russia, Kazakhstan and Belarus plan to remove all customs borders between them by July
2011 and to introduce a single economic zone by January 2012.150 This is likely to make the
NELTI Northern Corridor and the Trans‐Kazakhstan routes via Russia more competitive than
alternative corridors via Azerbaijan and Iran.
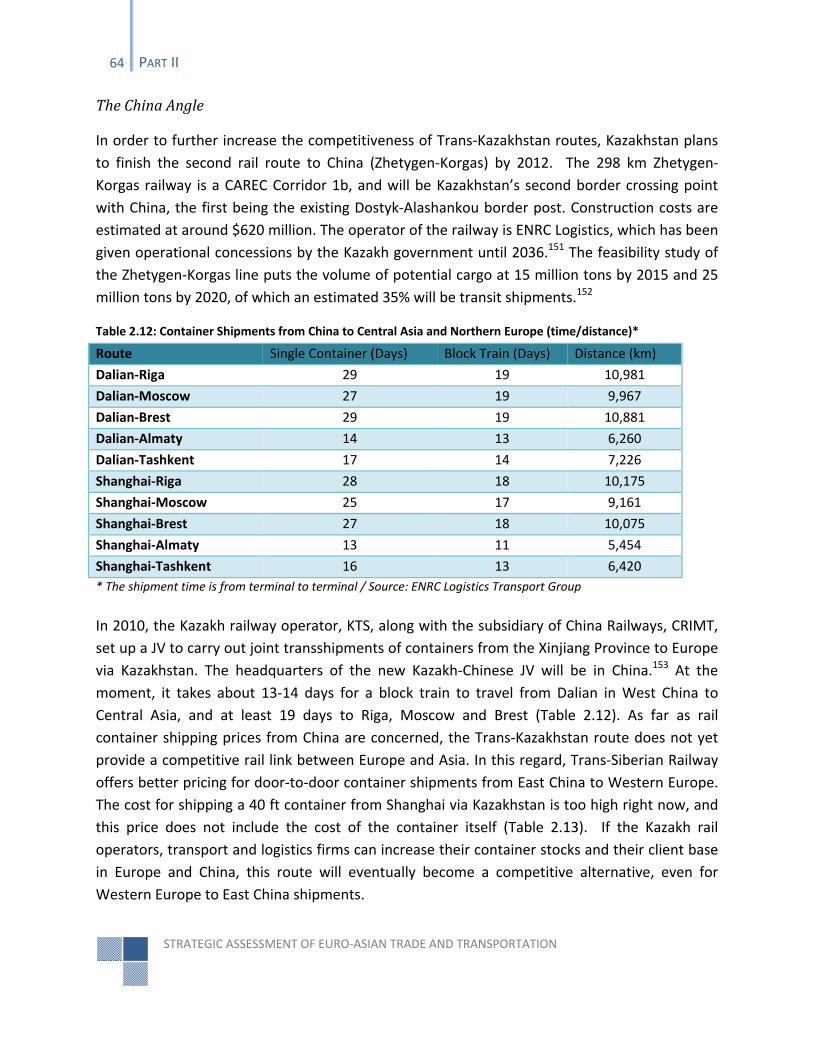
STRATEGIC ASSESSMENT OF EURO‐ASIAN TRADE AND TRANSPORTATION
64 PART II
The China Angle
In order to further increase the competitiveness of Trans‐Kazakhstan routes, Kazakhstan plans
to finish the second rail route to China (Zhetygen‐Korgas) by 2012. The 298 km Zhetygen‐
Korgas railway is a CAREC Corridor 1b, and will be Kazakhstan’s second border crossing point
with China, the first being the existing Dostyk‐Alashankou border post. Construction costs are
estimated at around $620 million. The operator of the railway is ENRC Logistics, which has been
given operational concessions by the Kazakh government until 2036.151 The feasibility study of
the Zhetygen‐Korgas line puts the volume of potential cargo at 15 million tons by 2015 and 25
million tons by 2020, of which an estimated 35% will be transit shipments.152
Table 2.12: Container Shipments from China to Central Asia and Northern Europe (time/distance)*
Route Single Container (Days) Block Train (Days) Distance (km)
Dalian‐Riga 29 19 10,981
Dalian‐Moscow 27 19 9,967
Dalian‐Brest 29 19 10,881
Dalian‐Almaty 14 13 6,260
Dalian‐Tashkent 17 14 7,226
Shanghai‐Riga 28 18 10,175
Shanghai‐Moscow 25 17 9,161
Shanghai‐Brest 27 18 10,075
Shanghai‐Almaty 13 11 5,454
Shanghai‐Tashkent 16 13 6,420
* The shipment time is from terminal to terminal / Source: ENRC Logistics Transport Group
In 2010, the Kazakh railway operator, KTS, along with the subsidiary of China Railways, CRIMT,
set up a JV to carry out joint transshipments of containers from the Xinjiang Province to Europe
via Kazakhstan. The headquarters of the new Kazakh‐Chinese JV will be in China.153 At the
moment, it takes about 13‐14 days for a block train to travel from Dalian in West China to
Central Asia, and at least 19 days to Riga, Moscow and Brest (Table 2.12). As far as rail
container shipping prices from China are concerned, the Trans‐Kazakhstan route does not yet
provide a competitive rail link between Europe and Asia. In this regard, Trans‐Siberian Railway
offers better pricing for door‐to‐door container shipments from East China to Western Europe.
The cost for shipping a 40 ft container from Shanghai via Kazakhstan is too high right now, and
this price does not include the cost of the container itself (Table 2.13). If the Kazakh rail
operators, transport and logistics firms can increase their container stocks and their client base
in Europe and China, this route will eventually become a competitive alternative, even for
Western Europe to East China shipments.
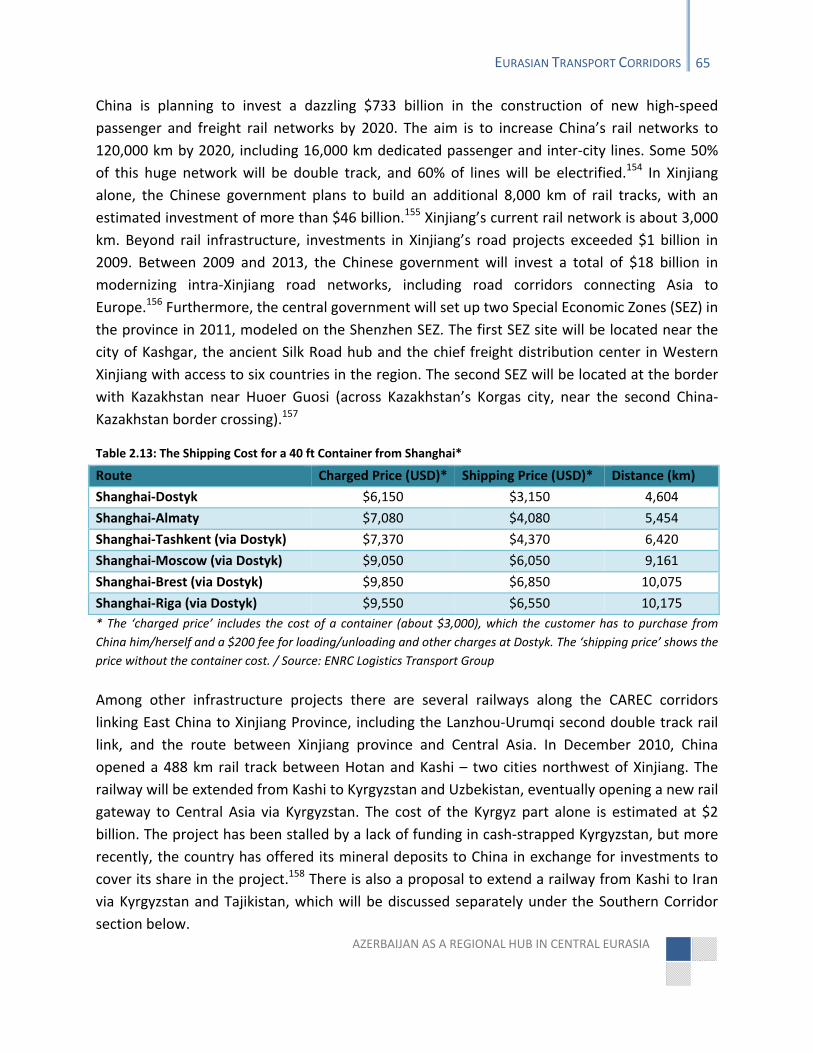
AZERBAIJAN AS A REGIONAL HUB IN CENTRAL EURASIA
EURASIAN TRANSPORT CORRIDORS 65
China is planning to invest a dazzling $733 billion in the construction of new high‐speed
passenger and freight rail networks by 2020. The aim is to increase China’s rail networks to
120,000 km by 2020, including 16,000 km dedicated passenger and inter‐city lines. Some 50%
of this huge network will be double track, and 60% of lines will be electrified.154 In Xinjiang
alone, the Chinese government plans to build an additional 8,000 km of rail tracks, with an
estimated investment of more than $46 billion.155 Xinjiang’s current rail network is about 3,000
km. Beyond rail infrastructure, investments in Xinjiang’s road projects exceeded $1 billion in
2009. Between 2009 and 2013, the Chinese government will invest a total of $18 billion in
modernizing intra‐Xinjiang road networks, including road corridors connecting Asia to
Europe.156 Furthermore, the central government will set up two Special Economic Zones (SEZ) in
the province in 2011, modeled on the Shenzhen SEZ. The first SEZ site will be located near the
city of Kashgar, the ancient Silk Road hub and the chief freight distribution center in Western
Xinjiang with access to six countries in the region. The second SEZ will be located at the border
with Kazakhstan near Huoer Guosi (across Kazakhstan’s Korgas city, near the second China‐
Kazakhstan border crossing).157
Table 2.13: The Shipping Cost for a 40 ft Container from Shanghai*
Route Charged Price (USD)* Shipping Price (USD)* Distance (km)
Shanghai‐Dostyk $6,150 $3,150 4,604
Shanghai‐Almaty $7,080 $4,080 5,454
Shanghai‐Tashkent (via Dostyk) $7,370 $4,370 6,420
Shanghai‐Moscow (via Dostyk) $9,050 $6,050 9,161
Shanghai‐Brest (via Dostyk) $9,850 $6,850 10,075
Shanghai‐Riga (via Dostyk) $9,550 $6,550 10,175
* The ‘charged price’ includes the cost of a container (about $3,000), which the customer has to purchase from
China him/herself and a $200 fee for loading/unloading and other charges at Dostyk. The ‘shipping price’ shows the
price without the container cost. / Source: ENRC Logistics Transport Group
Among other infrastructure projects there are several railways along the CAREC corridors
linking East China to Xinjiang Province, including the Lanzhou‐Urumqi second double track rail
link, and the route between Xinjiang province and Central Asia. In December 2010, China
opened a 488 km rail track between Hotan and Kashi – two cities northwest of Xinjiang. The
railway will be extended from Kashi to Kyrgyzstan and Uzbekistan, eventually opening a new rail
gateway to Central Asia via Kyrgyzstan. The cost of the Kyrgyz part alone is estimated at $2
billion. The project has been stalled by a lack of funding in cash‐strapped Kyrgyzstan, but more
recently, the country has offered its mineral deposits to China in exchange for investments to
cover its share in the project.158 There is also a proposal to extend a railway from Kashi to Iran
via Kyrgyzstan and Tajikistan, which will be discussed separately under the Southern Corridor
section below.
STRATEGIC ASSESSMENT OF EURO‐ASIAN TRADE AND TRANSPORTATION
66 PART II
If China decides to build a standard gauge railway all the way to Uzbekistan, this project could
be the first step in realizing the “Trans‐Kazakhstan Trunk Railway (TKTR)”, as proposed by
Kazakhstan Temir Zholy (KTZ) (i.e. Kazakhstan Railways). In the long run, a new standard‐gauge
railway from China could be extended to Aktau or Turkmenbashy and, if they were built, linked
to future standard‐gauge railways in Azerbaijan and Georgia.
In 2006, Kazakhstan adopted a long‐term transport strategy aiming to build new modern
highways and railways to facilitate Euro‐Asian continental trade and transit along the North‐
South and East‐West axes. It envisages investments of about $30 billion across 80 infrastructure
projects, including railways and motorways.159 In 2010, another “State Program for Augmented
Industrial and Innovative Development of the Republic of Kazakhstan for 2010‐2014” was
approved, covering 59 infrastructure projects. The ongoing construction of railway projects will
enable Kazakhstan to soon increase its rail cargo traffic to 100 million tons a year in the
directions of Turkmenistan, Iran, Turkey and the EU.160 In particular, rail cargo capacity at the
Dostyk‐Alashankou border crossing and the Dostyk‐Aktogay rail line will be increased to
accommodate up to 25 million tons of goods in 2011. 161 In addition, the rehabilitation of the
Beineu‐Aktau highway and the construction of the Beineu‐Shalkar railway (2016‐2020) will
facilitate access to the Port of Aktau, which acts as one of Azerbaijan’s gateways to Central Asia.
Kazakhstan’s increasing profile in the Eurasian transport network makes it imperative for
Azerbaijan to strengthen its links and collaborate with Kazakhstan and China on the
transportation of non‐oil cargo through the TRACECA corridor. This will require the further
integration of customs and border crossing procedures between Azerbaijan, Georgia and
Kazakhstan, similar to what Kazakhstan, Russia and Belarus have already done. In addition,
better coordination on the sea transport between the Ports of Aktau and Baku is essential. This
will be discussed in detail under the Maritime Transportation section.
The Southern Corridor
The third Eurasian corridor, the Southern Corridor, involves networks connecting Europe and
Asia via Azerbaijan’s neighbor to the south, the Islamic Republic of Iran. For centuries, the
territory of present day Iran acted as a transit bridge both for the East‐West and the North‐
South corridors, moving goods from South Asia to Russia and North Europe, and from China and
East Asia to present day Turkey, the Mediterranean region and South Europe. Today, Iran is
once again positioning itself to become a major transit hub for Euro‐Asian land‐ and maritime‐
based trade.
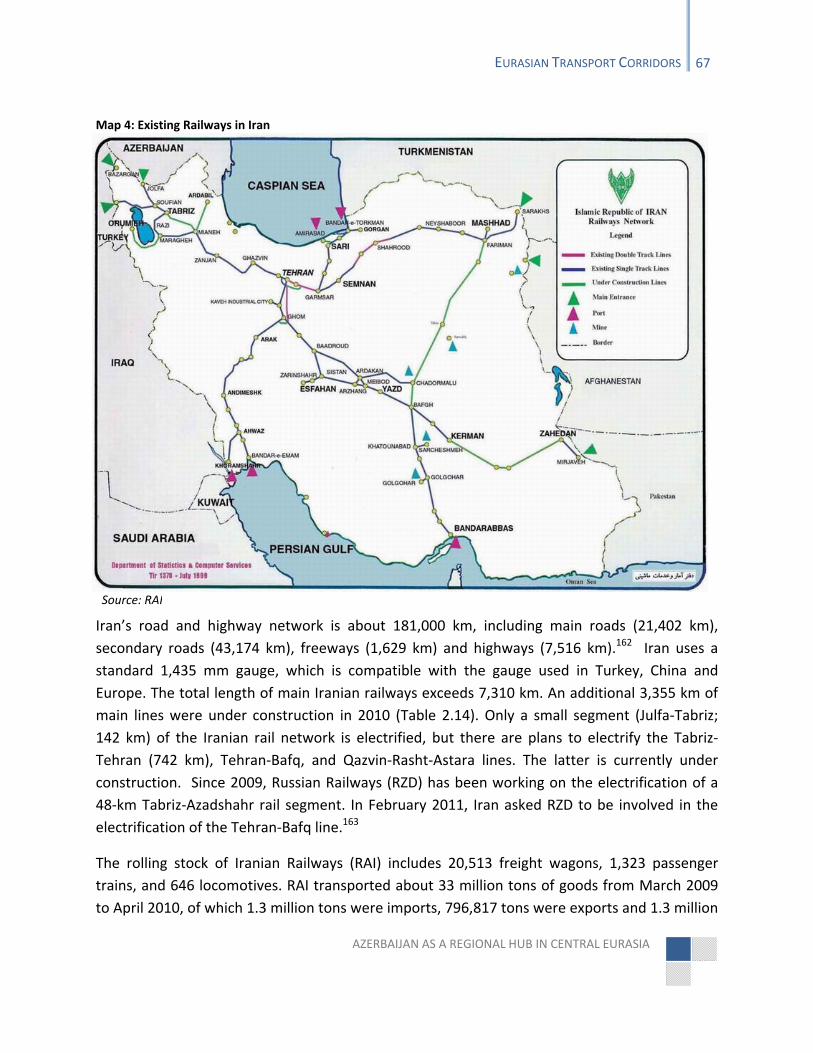
AZERBAIJAN AS A REGIONAL HUB IN CENTRAL EURASIA
EURASIAN TRANSPORT CORRIDORS 67
Iran’s road and highway network is about 181,000 km, including main roads (21,402 km),
secondary roads (43,174 km), freeways (1,629 km) and highways (7,516 km).162 Iran uses a
standard 1,435 mm gauge, which is compatible with the gauge used in Turkey, China and
Europe. The total length of main Iranian railways exceeds 7,310 km. An additional 3,355 km of
main lines were under construction in 2010 (Table 2.14). Only a small segment (Julfa‐Tabriz;
142 km) of the Iranian rail network is electrified, but there are plans to electrify the Tabriz‐
Tehran (742 km), Tehran‐Bafq, and Qazvin‐Rasht‐Astara lines. The latter is currently under
construction. Since 2009, Russian Railways (RZD) has been working on the electrification of a
48‐km Tabriz‐Azadshahr rail segment. In February 2011, Iran asked RZD to be involved in the
electrification of the Tehran‐Bafq line.163
The rolling stock of Iranian Railways (RAI) includes 20,513 freight wagons, 1,323 passenger
trains, and 646 locomotives. RAI transported about 33 million tons of goods from March 2009
to April 2010, of which 1.3 million tons were imports, 796,817 tons were exports and 1.3 million
Map 4: Existing Railways in Iran
Source: RAI
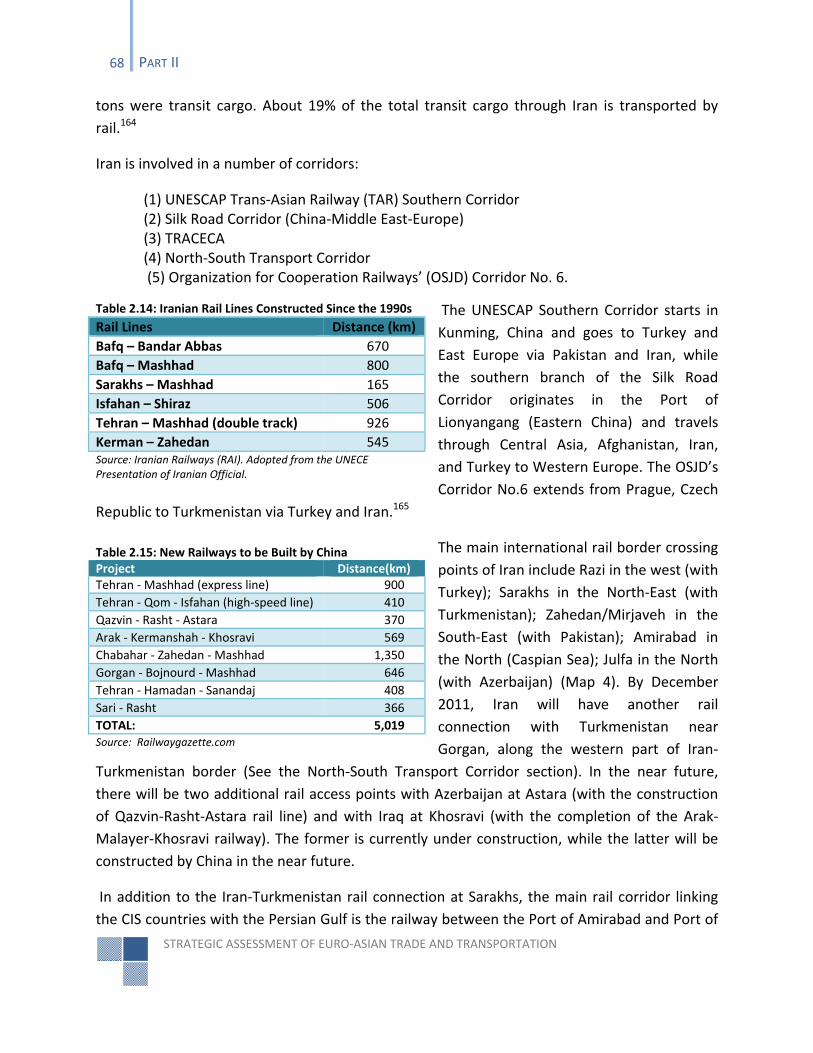
STRATEGIC ASSESSMENT OF EURO‐ASIAN TRADE AND TRANSPORTATION
68 PART II
tons were transit cargo. About 19% of the total transit cargo through Iran is transported by
rail.164
Iran is involved in a number of corridors:
(1) UNESCAP Trans‐Asian Railway (TAR) Southern Corridor (2) Silk Road Corridor (China‐Middle East‐Europe) (3) TRACECA (4) North‐South Transport Corridor (5) Organization for Cooperation Railways’ (OSJD) Corridor No. 6.
The UNESCAP Southern Corridor starts in
Kunming, China and goes to Turkey and
East Europe via Pakistan and Iran, while
the southern branch of the Silk Road
Corridor originates in the Port of
Lionyangang (Eastern China) and travels
through Central Asia, Afghanistan, Iran,
and Turkey to Western Europe. The OSJD’s
Corridor No.6 extends from Prague, Czech
Republic to Turkmenistan via Turkey and Iran.165
The main international rail border crossing
points of Iran include Razi in the west (with
Turkey); Sarakhs in the North‐East (with
Turkmenistan); Zahedan/Mirjaveh in the
South‐East (with Pakistan); Amirabad in
the North (Caspian Sea); Julfa in the North
(with Azerbaijan) (Map 4). By December
2011, Iran will have another rail
connection with Turkmenistan near
Gorgan, along the western part of Iran‐
Turkmenistan border (See the North‐South Transport Corridor section). In the near future,
there will be two additional rail access points with Azerbaijan at Astara (with the construction
of Qazvin‐Rasht‐Astara rail line) and with Iraq at Khosravi (with the completion of the Arak‐
Malayer‐Khosravi railway). The former is currently under construction, while the latter will be
constructed by China in the near future.
In addition to the Iran‐Turkmenistan rail connection at Sarakhs, the main rail corridor linking
the CIS countries with the Persian Gulf is the railway between the Port of Amirabad and Port of
Table 2.14: Iranian Rail Lines Constructed Since the 1990s
Rail Lines Distance (km)
Bafq – Bandar Abbas 670
Bafq – Mashhad 800
Sarakhs – Mashhad 165
Isfahan – Shiraz 506
Tehran – Mashhad (double track) 926
Kerman – Zahedan 545 Source: Iranian Railways (RAI). Adopted from the UNECE Presentation of Iranian Official.
Table 2.15: New Railways to be Built by ChinaProject Distance(km) Tehran ‐ Mashhad (express line) 900
Tehran ‐ Qom ‐ Isfahan (high‐speed line) 410
Qazvin ‐ Rasht ‐ Astara 370
Arak ‐ Kermanshah ‐ Khosravi 569
Chabahar ‐ Zahedan ‐ Mashhad 1,350
Gorgan ‐ Bojnourd ‐ Mashhad 646
Tehran ‐ Hamadan ‐ Sanandaj 408
Sari ‐ Rasht 366
TOTAL: 5,019Source: Railwaygazette.com
AZERBAIJAN AS A REGIONAL HUB IN CENTRAL EURASIA
EURASIAN TRANSPORT CORRIDORS 69
Bandar Abbas. In December 2010, the Iranian government approved a $9.6 billion budget for
the construction of 5 new railways and allocated $12.5 billion for the financing of additional
ongoing and proposed 9 railway projects.166 Two of these projects will eventually open a new
gateway to the Persian Gulf via rail access to the Port of Chabahar (Appendix C). The
construction of a 1,350‐km railway linking Mashhad and Zahedan to the Port of Chabahar –
Iran’s southernmost port in the Persian Gulf – was started last year, with work on an additional
railway segment connecting Mashhad to Gorgan to begin shortly. The Mashhad‐Zahedan‐
Chabahar project envisages a maximum speed of 160 km/h for passenger trains and 120 km/h
for freight trains.167 The project will shorten the distance between Central Asia/China and the
Persian Gulf.
In February 2011, Iran and China signed a $13 billion contract under which the latter will
construct 8 new rail lines in Iran exceeding 5,000 km in length168 (Table 2.15). Among these
projects is the construction of a 566‐km long Arak‐Malayer‐Khosravi rail line in western Iran,
which will eventually connect the railways of Iran, Iraq and Syria, thus opening a new route to
the Mediterranean Sea. The Arak‐Malayer‐Khosravi line will allow trains to travel at speeds of
up to 160 km/h. In addition, China will build a 300 km/h high‐speed electrified express line
between Tehran, Qom and Isfahan.169
Since the late 1990s, bilateral trade between Iran and China has increased more than eight‐fold,
reaching $30 billion in 2010, with an additional $7 billion indirect trade via UAE.170By 2015, the
two countries aim to boost bilateral trade to $50 billion.171 China is the second largest importer
of Iranian oil after Japan, and it has been involved in infrastructure projects inside Iran,
including the construction of the Tehran Metro. In addition to China’s soaring demand for Iran’s
natural resources, Iran plays an important part in Beijing’s future strategy of linking Europe and
Asia with high‐speed railways. In particular, the southern branch of the Silk Road Corridor from
China to the Middle East and onwards to Europe is among the proposed projects. In the long
term, the project involves the construction of a new railway stretching from Kashi in the
Xinjiang province to Kyrgyzstan, Tajikistan, through northern Afghanistan to Iran. In the
meantime, China will continue to build and develop new high‐speed train technology across
Central Asia, the Middle East and Turkey, which could potentially all be linked in the future. In
the medium term, China and Iran will use Turkmen railways for rail freight and transit cargo.
At the moment, Iran’s most promising East‐West railway line is the recently inaugurated
Islamabad‐Tehran‐Istanbul railway between Pakistan, Iran and Turkey, initiated by the
Economic Cooperation Organization (ECO). The rail networks of the three countries were finally
united after Iran completed the Kerman‐Zahedan rail segment in 2009 (Map 4). The total length
of the Islamabad‐Tehran‐Istanbul railway is 6,476 km, of which 1,900 km is in Pakistan, 2,570
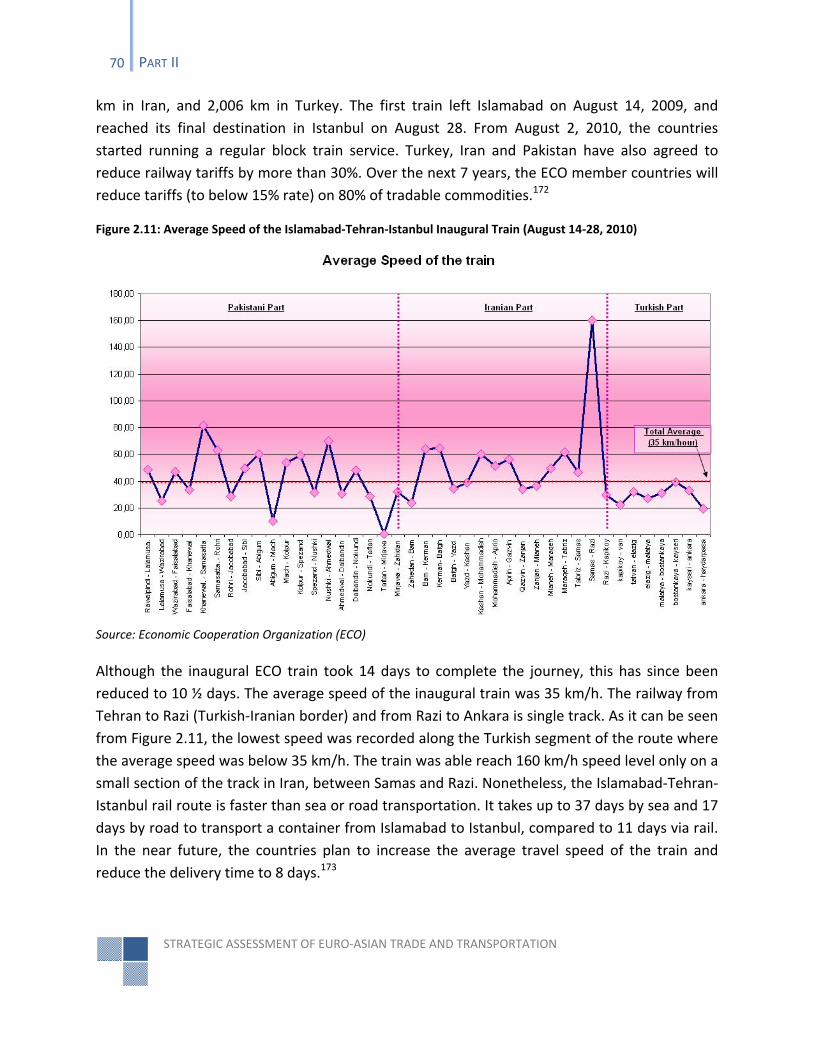
STRATEGIC ASSESSMENT OF EURO‐ASIAN TRADE AND TRANSPORTATION
70 PART II
km in Iran, and 2,006 km in Turkey. The first train left Islamabad on August 14, 2009, and
reached its final destination in Istanbul on August 28. From August 2, 2010, the countries
started running a regular block train service. Turkey, Iran and Pakistan have also agreed to
reduce railway tariffs by more than 30%. Over the next 7 years, the ECO member countries will
reduce tariffs (to below 15% rate) on 80% of tradable commodities.172
Figure 2.11: Average Speed of the Islamabad‐Tehran‐Istanbul Inaugural Train (August 14‐28, 2010)
Source: Economic Cooperation Organization (ECO)
Although the inaugural ECO train took 14 days to complete the journey, this has since been
reduced to 10 ½ days. The average speed of the inaugural train was 35 km/h. The railway from
Tehran to Razi (Turkish‐Iranian border) and from Razi to Ankara is single track. As it can be seen
from Figure 2.11, the lowest speed was recorded along the Turkish segment of the route where
the average speed was below 35 km/h. The train was able reach 160 km/h speed level only on a
small section of the track in Iran, between Samas and Razi. Nonetheless, the Islamabad‐Tehran‐
Istanbul rail route is faster than sea or road transportation. It takes up to 37 days by sea and 17
days by road to transport a container from Islamabad to Istanbul, compared to 11 days via rail.
In the near future, the countries plan to increase the average travel speed of the train and
reduce the delivery time to 8 days.173
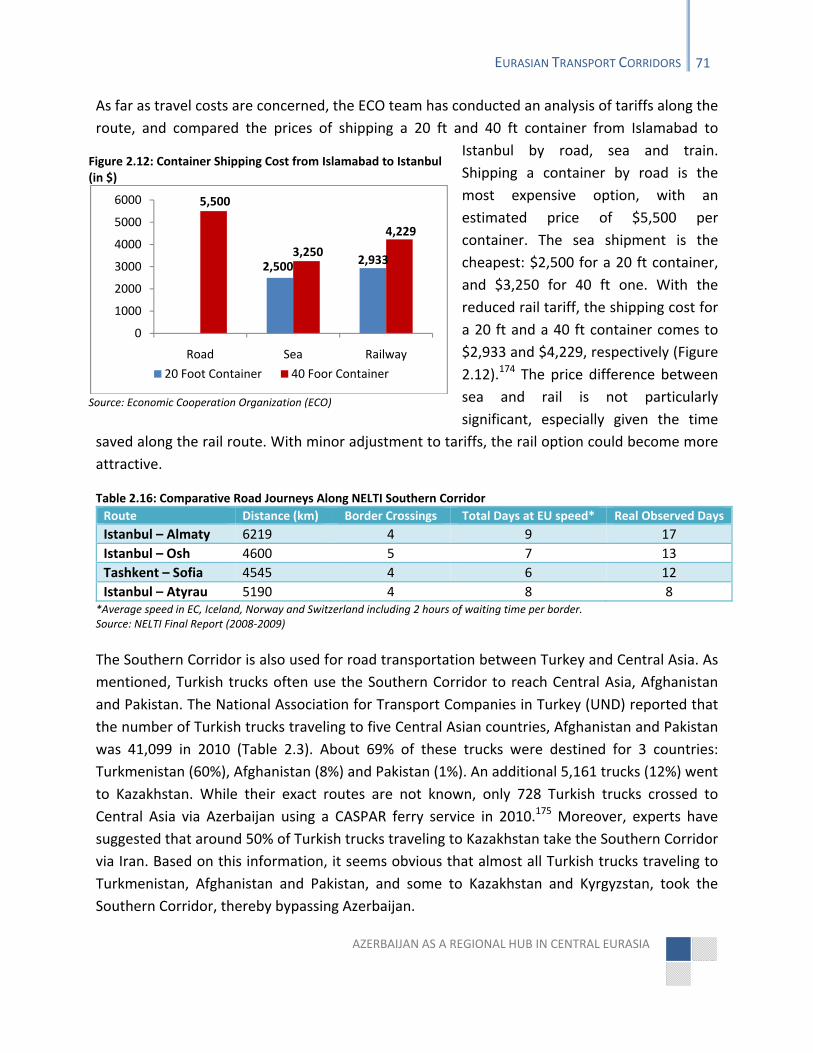
AZERBAIJAN AS A REGIONAL HUB IN CENTRAL EURASIA
EURASIAN TRANSPORT CORRIDORS 71
As far as travel costs are concerned, the ECO team has conducted an analysis of tariffs along the
route, and compared the prices of shipping a 20 ft and 40 ft container from Islamabad to
Istanbul by road, sea and train.
Shipping a container by road is the
most expensive option, with an
estimated price of $5,500 per
container. The sea shipment is the
cheapest: $2,500 for a 20 ft container,
and $3,250 for 40 ft one. With the
reduced rail tariff, the shipping cost for
a 20 ft and a 40 ft container comes to
$2,933 and $4,229, respectively (Figure
2.12).174 The price difference between
sea and rail is not particularly
significant, especially given the time
saved along the rail route. With minor adjustment to tariffs, the rail option could become more
attractive.
Route Distance (km) Border Crossings Total Days at EU speed* Real Observed Days
Istanbul – Almaty 6219 4 9 17
Istanbul – Osh 4600 5 7 13
Tashkent – Sofia 4545 4 6 12
Istanbul – Atyrau 5190 4 8 8
*Average speed in EC, Iceland, Norway and Switzerland including 2 hours of waiting time per border. Source: NELTI Final Report (2008‐2009)
The Southern Corridor is also used for road transportation between Turkey and Central Asia. As
mentioned, Turkish trucks often use the Southern Corridor to reach Central Asia, Afghanistan
and Pakistan. The National Association for Transport Companies in Turkey (UND) reported that
the number of Turkish trucks traveling to five Central Asian countries, Afghanistan and Pakistan
was 41,099 in 2010 (Table 2.3). About 69% of these trucks were destined for 3 countries:
Turkmenistan (60%), Afghanistan (8%) and Pakistan (1%). An additional 5,161 trucks (12%) went
to Kazakhstan. While their exact routes are not known, only 728 Turkish trucks crossed to
Central Asia via Azerbaijan using a CASPAR ferry service in 2010.175 Moreover, experts have
suggested that around 50% of Turkish trucks traveling to Kazakhstan take the Southern Corridor
via Iran. Based on this information, it seems obvious that almost all Turkish trucks traveling to
Turkmenistan, Afghanistan and Pakistan, and some to Kazakhstan and Kyrgyzstan, took the
Southern Corridor, thereby bypassing Azerbaijan.
Figure 2.12: Container Shipping Cost from Islamabad to Istanbul (in $)
Source: Economic Cooperation Organization (ECO)
Table 2.16: Comparative Road Journeys Along NELTI Southern Corridor
2,500 2,933
5,500
3,250
4,229
0
1000
2000
3000
4000
5000
6000
Road Sea Railway
20 Foot Container 40 Foor Container

STRATEGIC ASSESSMENT OF EURO‐ASIAN TRADE AND TRANSPORTATION
72 PART II
Despite its popularity, however, the Southern Corridor is not without its problems. The IRU
reports that en route from Istanbul to Osh, Kyrgyzstan, truck drivers lose on average one day at
each of the Turkish‐Iranian, Iranian‐Turkmen, and Turkmen‐Uzbek borders. It can sometimes
takes up to 18 days to cover 4,600 km, with an average of 255 km per day.176 In addition, the
official levies along this route are the highest compared to the Northern and Central corridors.
The Southern Corridor also seems to be the route of choice for Iranian trucks. According to
available data from 2004, Iran had more than 20,000 trucks operating globally, of which 12,000
were working mainly with Central Asian countries, Afghanistan and Pakistan, and about 8,000
were traveling to/from European destinations, including Turkey.177 In 2008, about 9.8 million
tons of cargo was transported by roads in Iran, of which 3.1 million tons were exports, 2 million
tons imports, and 4.7 million tons transit freight. Some 25% of exported and imported goods
were exchanged on the western border with Turkey, while 32% of export/import cargo was
exchanged in eastern Iran with five Central Asian states, Afghanistan and Pakistan (Figure
2.13).178
Figure 2.13: Cargo Exchange with Europe and Central Asia, Afghanistan and Pakistan (in tons)
Source: Iran’s Road Maintenance & Transportation Organization
In terms of exports, Iranian carriers transported most of Iran’s exported cargo between 2004
and 2008, about 70%, while the remaining 30% was carried by foreign trucks (Figure 2.14). The
import sector is more balanced, with 53% of imported cargo carried by foreign trucks and 47%
by Iranian trucks (Figure 2.15). In 2008, Iran’s exports to the west, to Turkey and to other
European states via Turkey totaled 364,152 tons, of which 288,050 tons (79%) were carried by
Iranian trucks and 76,102 tons (21%) were by foreign trucks. This accounted for 12% of total
Iranian exports taken by truck. Iran’s exports to five Central Asian countries to the east, as well
‐
1,000,000
2,000,000
3,000,000
4,000,000
5,000,000
6,000,000
2004 2005 2006 2007 2008
To/From Europe
To/From Central Asia, Afghanistan & Pakistan
TOTAL (IMPORT + EXPORT)
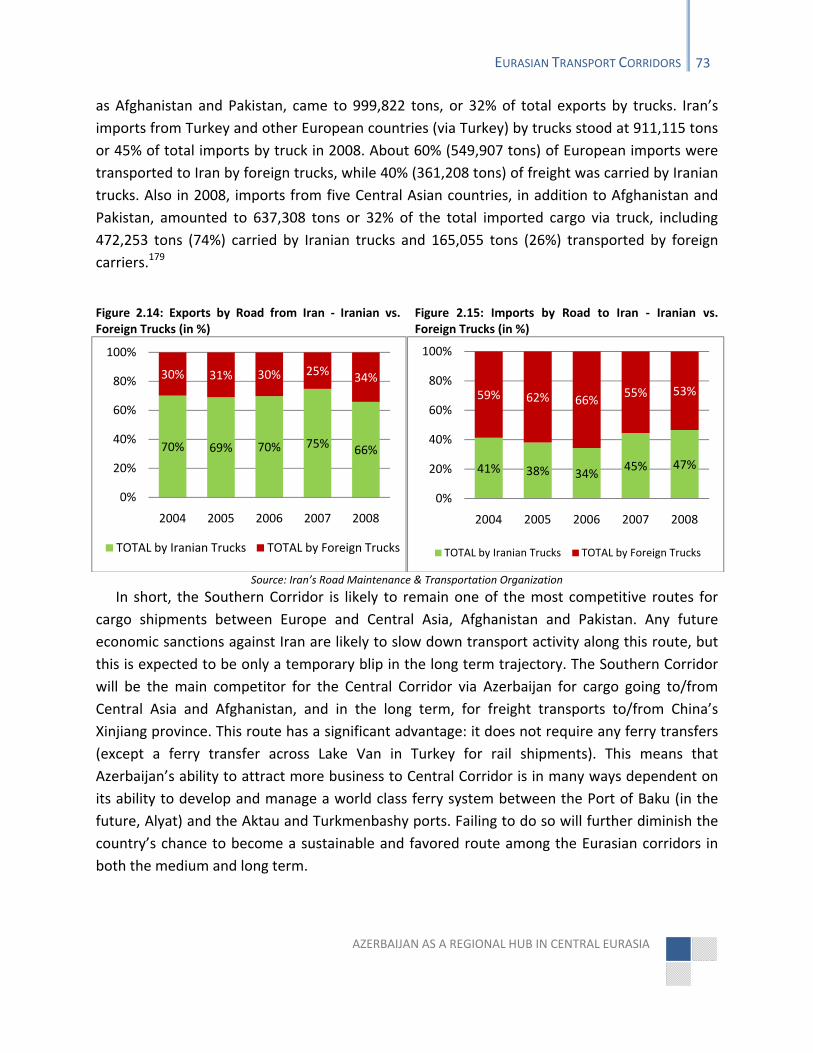
AZERBAIJAN AS A REGIONAL HUB IN CENTRAL EURASIA
EURASIAN TRANSPORT CORRIDORS 73
as Afghanistan and Pakistan, came to 999,822 tons, or 32% of total exports by trucks. Iran’s
imports from Turkey and other European countries (via Turkey) by trucks stood at 911,115 tons
or 45% of total imports by truck in 2008. About 60% (549,907 tons) of European imports were
transported to Iran by foreign trucks, while 40% (361,208 tons) of freight was carried by Iranian
trucks. Also in 2008, imports from five Central Asian countries, in addition to Afghanistan and
Pakistan, amounted to 637,308 tons or 32% of the total imported cargo via truck, including
472,253 tons (74%) carried by Iranian trucks and 165,055 tons (26%) transported by foreign
carriers.179
Figure 2.14: Exports by Road from Iran ‐ Iranian vs. Foreign Trucks (in %)
Figure 2.15: Imports by Road to Iran ‐ Iranian vs. Foreign Trucks (in %)
Source: Iran’s Road Maintenance & Transportation Organization
In short, the Southern Corridor is likely to remain one of the most competitive routes for
cargo shipments between Europe and Central Asia, Afghanistan and Pakistan. Any future
economic sanctions against Iran are likely to slow down transport activity along this route, but
this is expected to be only a temporary blip in the long term trajectory. The Southern Corridor
will be the main competitor for the Central Corridor via Azerbaijan for cargo going to/from
Central Asia and Afghanistan, and in the long term, for freight transports to/from China’s
Xinjiang province. This route has a significant advantage: it does not require any ferry transfers
(except a ferry transfer across Lake Van in Turkey for rail shipments). This means that
Azerbaijan’s ability to attract more business to Central Corridor is in many ways dependent on
its ability to develop and manage a world class ferry system between the Port of Baku (in the
future, Alyat) and the Aktau and Turkmenbashy ports. Failing to do so will further diminish the
country’s chance to become a sustainable and favored route among the Eurasian corridors in
both the medium and long term.
70% 69% 70% 75% 66%
30% 31% 30% 25% 34%
0%
20%
40%
60%
80%
100%
2004 2005 2006 2007 2008
TOTAL by Iranian Trucks TOTAL by Foreign Trucks
41% 38% 34%45% 47%
59% 62% 66%55% 53%
0%
20%
40%
60%
80%
100%
2004 2005 2006 2007 2008
TOTAL by Iranian Trucks TOTAL by Foreign Trucks
STRATEGIC ASSESSMENT OF EURO‐ASIAN TRADE AND TRANSPORTATION
74 PART II
The NorthSouth Transport Corridor (NSTC)
Azerbaijan is located at the crossroads of multiple corridors. The North‐South Transport
Corridor is also an ancient route that has connected the South Asia with North Europe for
centuries. This route was used by European, Russian, Indian, and other foreign traders.
Between the late seventeenth and early eighteenth centuries, Indian traders became dominant
players in the North‐South trade. Under the Safavid dynasty (1501‐1722), the number of Indian
traders scattered across the empire ranged from 10,000 to 20,000. The territory of present day
Azerbaijan hosted a number of caravanserais dedicated to Indian traders, especially along the
route from Ardabil (Iran) to Shemakha and Baku. In the late seventeenth century, up to 200
Indian merchants lived on the outskirts of Shemakha, which was at the time Azerbaijan’s main
trading hub, with 20 Indian caravanserais in the city as of 1703. Baku, too, hosted Indian
merchants who exported Azerbaijani silk.180 These traders played an important role in
managing the commerce between Russia and South East Asia through the territory of present
day Azerbaijan and Iran. Today, in the middle of Baku’s Old City, there stands a Mogul
caravanserai, a legacy of the once active North‐South trade with India.
The cities of historical Azerbaijan exported a diverse range of products along the North‐South
axis and also acted as a major ‘hub and spoke’ center for the region. Silk, oil, salt, fish, horses,
jewelry, and natural dyes were among Azerbaijan’s main export products to Europe, India, the
Middle East, and Central Asia. These goods were transported by land and by sea (the Caspian).
Records show that in 1639, a group of Indian merchants sailed from Astrakhan to Derbent
(Republic of Dagestan, Russia) and Shemakha carrying Russian goods such as animal fur, fur
coats, leather, cloth, copper, and caviar.181 From Shemakha, the goods were usually taken by
caravans overland to India via present‐day Afghanistan or to the port of Bandar Abbas in
Persian Gulf from where they were carried by ship to the Port of Surat in India.
The agreement to establish the modern‐day international North‐South Transport Corridor
(NSTC) was first signed between Russia, Iran, and India in Saint Petersburg in 2000.
Subsequently, Azerbaijan, Armenia, Kazakhstan, Kyrgyz Republic, Tajikistan, Turkey, Ukraine,
Belarus, Oman, Syria and Bulgaria (as an observer) joined the agreement. Azerbaijan officially
joined the project in September 2005. The NSTC’s original route was designed to utilize the
Russian and Iranian ports in the Caspian Sea while crossing from Russia to Iran, particularly the
ports of Astrakhan and Ola in the north and Anzali and Amirabad to the south. As new members
joined the agreement, two alternative land‐based routes were added. Currently, there are
three alternative transport routes in the NSTC.
The first and original route is the central NSTC route that starts in Helsinki, Finland and goes
through St. Petersburg to the Russian Caspian ports of Astrakhan and Ola, at which point it
AZERBAIJAN AS A REGIONAL HUB IN CENTRAL EURASIA
EURASIAN TRANSPORT CORRIDORS 75
crosses the Caspian Sea to the Iranian ports in the south Caspian (primarily Anzali and
Amirabad, but also Nowshahr). From Iran, the route continues to India through Iran’s Persian
Gulf ports of Bandar Abbas (Shahid Rajaee SEZ)§§ and Chabahar. There is also a possible land‐
based route from Iran to India across Pakistan, but this option is unlikely to be used in the short
term. The second or the western NSTC route traverses along the western shore of the Caspian
Sea crossing Azerbaijan and going to Iran and India. This is potentially the fastest and shortest
land‐based route linking St. Petersburg and Helsinki to Bandar Abbas by road and rail. However,
it has a missing rail link between Azerbaijan and Iran (the Qazvin‐Rasht‐Astara segment), which
will be discussed in detail later. The third, eastern, NSTC alternative goes across Russia,
Kazakhstan and Turkmenistan along the eastern shore of the Caspian Sea to Iran and India (with
possible extension to Afghanistan and Pakistan). This route also has a missing rail link between
Kazakhstan, Turkmenistan and Iran, which is currently under construction (due to be completed
in December 2011).
All three alternative routes are intermodal, which is to say they use more than one type of
transport mode for cargo shipments. For example, a container loaded in Mumbai, India arrives
at the port of Bandar Abbas on a ship, from where it is transported to the Iranian ports on the
Caspian by rail or by truck. Once it arrives, the container is taken by ship across the Caspian Sea
to the Russian ports of Astrakhan or Ola. There, the container is loaded back on rail or truck and
transported to its final destination. Since there is no rail connection between Azerbaijan and
Iran, container transfers via Azerbaijan are possible only by truck‐rail arrangement, whereby a
container is taken to Astara city (Azerbaijan) by truck and then transferred to rail track and sent
to Russia/Northern Europe. This is an expensive option, which is why it is not currently used. It
takes approximately 7 to 10 days (5‐7 days with 2 drivers) for a loaded truck to arrive in Baku
from the Port of Bandar Abbas and costs about $2,400.182
The current annual container trade between Europe and countries of the Middle East and
South Asia is estimated at 3.5 million TEU.183 The NSTC’s goal is to capture some of this market
and take cargo overland via Iran, the South Caucasus/Caspian Sea/Central Asia, and Russia. In
order to achieve this, the NSTC first needs to become a reliable, speedy, and cost‐effective
intermodal land and transport bridge between the markets of Russia/Northern Europe and
India/South Asia. This in turn is conditional on the willingness of the founding members, Russia,
Iran and India, to use this route in their freight operations and on the successful integration and
harmonization of transport networks in the countries along the route. Experts have long argued
that the NSTC will cut the delivery time of cargo from Mumbai to Northern Europe/Russia to
§§ The term “Port of Bandar Abbas” encompasses the Port of Shahid Rajaie, as it is now known in Iran. A few years ago the Iranian government gave the port of Bandar Abbas Special Economic Zone (SEZ) status, requiring shippers to indicate “Shahid Rajaee SEZ” next to the Bandar Abbas name.
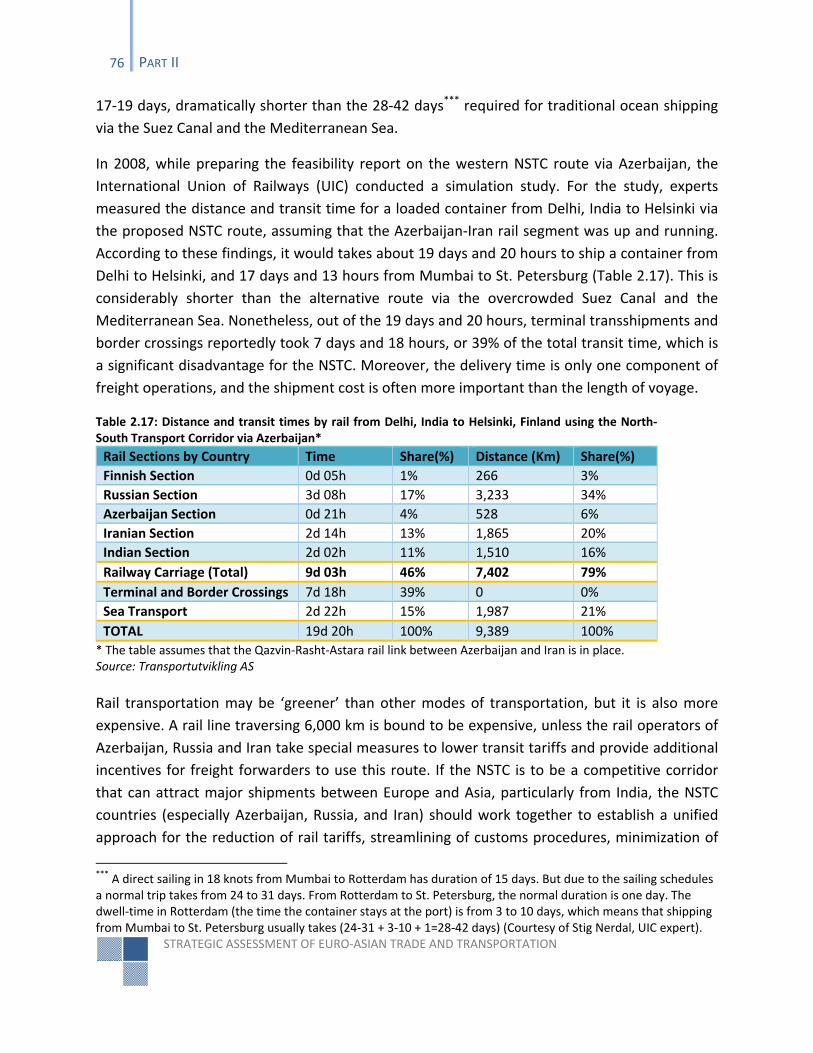
STRATEGIC ASSESSMENT OF EURO‐ASIAN TRADE AND TRANSPORTATION
76 PART II
17‐19 days, dramatically shorter than the 28‐42 days*** required for traditional ocean shipping
via the Suez Canal and the Mediterranean Sea.
In 2008, while preparing the feasibility report on the western NSTC route via Azerbaijan, the
International Union of Railways (UIC) conducted a simulation study. For the study, experts
measured the distance and transit time for a loaded container from Delhi, India to Helsinki via
the proposed NSTC route, assuming that the Azerbaijan‐Iran rail segment was up and running.
According to these findings, it would takes about 19 days and 20 hours to ship a container from
Delhi to Helsinki, and 17 days and 13 hours from Mumbai to St. Petersburg (Table 2.17). This is
considerably shorter than the alternative route via the overcrowded Suez Canal and the
Mediterranean Sea. Nonetheless, out of the 19 days and 20 hours, terminal transshipments and
border crossings reportedly took 7 days and 18 hours, or 39% of the total transit time, which is
a significant disadvantage for the NSTC. Moreover, the delivery time is only one component of
freight operations, and the shipment cost is often more important than the length of voyage.
Table 2.17: Distance and transit times by rail from Delhi, India to Helsinki, Finland using the North‐South Transport Corridor via Azerbaijan* Rail Sections by Country Time Share(%) Distance (Km) Share(%)
Finnish Section 0d 05h 1% 266 3%
Russian Section 3d 08h 17% 3,233 34%
Azerbaijan Section 0d 21h 4% 528 6%
Iranian Section 2d 14h 13% 1,865 20%
Indian Section 2d 02h 11% 1,510 16%
Railway Carriage (Total) 9d 03h 46% 7,402 79%
Terminal and Border Crossings 7d 18h 39% 0 0%
Sea Transport 2d 22h 15% 1,987 21%
TOTAL 19d 20h 100% 9,389 100%
* The table assumes that the Qazvin‐Rasht‐Astara rail link between Azerbaijan and Iran is in place. Source: Transportutvikling AS
Rail transportation may be ‘greener’ than other modes of transportation, but it is also more
expensive. A rail line traversing 6,000 km is bound to be expensive, unless the rail operators of
Azerbaijan, Russia and Iran take special measures to lower transit tariffs and provide additional
incentives for freight forwarders to use this route. If the NSTC is to be a competitive corridor
that can attract major shipments between Europe and Asia, particularly from India, the NSTC
countries (especially Azerbaijan, Russia, and Iran) should work together to establish a unified
approach for the reduction of rail tariffs, streamlining of customs procedures, minimization of
*** A direct sailing in 18 knots from Mumbai to Rotterdam has duration of 15 days. But due to the sailing schedules a normal trip takes from 24 to 31 days. From Rotterdam to St. Petersburg, the normal duration is one day. The dwell‐time in Rotterdam (the time the container stays at the port) is from 3 to 10 days, which means that shipping from Mumbai to St. Petersburg usually takes (24‐31 + 3‐10 + 1=28‐42 days) (Courtesy of Stig Nerdal, UIC expert).
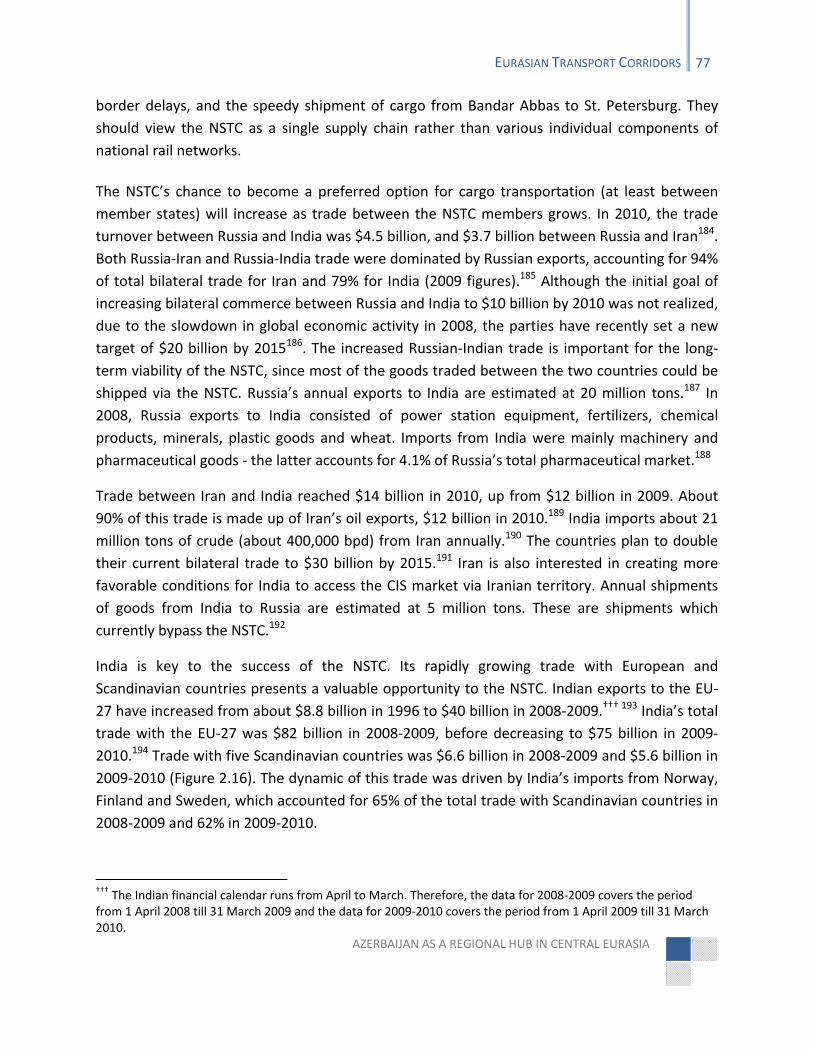
AZERBAIJAN AS A REGIONAL HUB IN CENTRAL EURASIA
EURASIAN TRANSPORT CORRIDORS 77
border delays, and the speedy shipment of cargo from Bandar Abbas to St. Petersburg. They
should view the NSTC as a single supply chain rather than various individual components of
national rail networks.
The NSTC’s chance to become a preferred option for cargo transportation (at least between
member states) will increase as trade between the NSTC members grows. In 2010, the trade
turnover between Russia and India was $4.5 billion, and $3.7 billion between Russia and Iran184.
Both Russia‐Iran and Russia‐India trade were dominated by Russian exports, accounting for 94%
of total bilateral trade for Iran and 79% for India (2009 figures).185 Although the initial goal of
increasing bilateral commerce between Russia and India to $10 billion by 2010 was not realized,
due to the slowdown in global economic activity in 2008, the parties have recently set a new
target of $20 billion by 2015186. The increased Russian‐Indian trade is important for the long‐
term viability of the NSTC, since most of the goods traded between the two countries could be
shipped via the NSTC. Russia’s annual exports to India are estimated at 20 million tons.187 In
2008, Russia exports to India consisted of power station equipment, fertilizers, chemical
products, minerals, plastic goods and wheat. Imports from India were mainly machinery and
pharmaceutical goods ‐ the latter accounts for 4.1% of Russia’s total pharmaceutical market.188
Trade between Iran and India reached $14 billion in 2010, up from $12 billion in 2009. About
90% of this trade is made up of Iran’s oil exports, $12 billion in 2010.189 India imports about 21
million tons of crude (about 400,000 bpd) from Iran annually.190 The countries plan to double
their current bilateral trade to $30 billion by 2015.191 Iran is also interested in creating more
favorable conditions for India to access the CIS market via Iranian territory. Annual shipments
of goods from India to Russia are estimated at 5 million tons. These are shipments which
currently bypass the NSTC.192
India is key to the success of the NSTC. Its rapidly growing trade with European and
Scandinavian countries presents a valuable opportunity to the NSTC. Indian exports to the EU‐
27 have increased from about $8.8 billion in 1996 to $40 billion in 2008‐2009.††† 193 India’s total
trade with the EU‐27 was $82 billion in 2008‐2009, before decreasing to $75 billion in 2009‐
2010.194 Trade with five Scandinavian countries was $6.6 billion in 2008‐2009 and $5.6 billion in
2009‐2010 (Figure 2.16). The dynamic of this trade was driven by India’s imports from Norway,
Finland and Sweden, which accounted for 65% of the total trade with Scandinavian countries in
2008‐2009 and 62% in 2009‐2010.
††† The Indian financial calendar runs from April to March. Therefore, the data for 2008‐2009 covers the period from 1 April 2008 till 31 March 2009 and the data for 2009‐2010 covers the period from 1 April 2009 till 31 March 2010.
STRATEGIC ASSESSMENT OF EURO‐ASIAN TRADE AND TRANSPORTATION
78 PART II
Indian trade with Central Asian countries was about $519 million in 2008‐2009, and $482 million in
2009‐2010. Trade with other CIS countries (excluding Azerbaijan) and the Baltic states of Estonia,
Lithuania and Latvia was $8.7 billion in 2008‐2009 and $7.4 billion in 2009‐2010. Of this, trade with
Russia and Ukraine alone made up 85% in 2008‐2009 (63% and 22% respectively) and 87% in 2009‐2010
(62% and 25% respectively).195
Indian experts predict that by 2015, India’s combined trade with the EU‐
27, CIS, Iran, Afghanistan and Pakistan could reach $600 billion.196
Goods from India destined for
Northern Europe and Russia could potentially enter from the Iranian ports of Bandar Abbas and
Chabahar, and travel to their final destinations along one of the three NSTC alternatives.
Figure 2.16: Indian Trade with Scandinavian Countries (2008‐2009/2009‐2010) (in mln $)
Source: Source: Ministry of Commerce and Industry, Government of India
Another longer term option would be to use existing and potential highways and railways
through Afghanistan to connect Central Asia with Pakistan and India. By road, the distance from
Almaty to the Bandar Abbas port of Iran is more than 4,000 km, while the distance from Almaty
to Islamabad is 1,790 km; 3,240 km to Port of Karachi; 2,590 km to New Delhi; and 3,940 km to
Calcutta.197
As far as Azerbaijan’s commercial relations within the NSTC are concerned, Azerbaijan‐Iran
bilateral trade is relatively low (about $500 million), but the two states envisage an increase to
a $10 billion in the near future.198 The trade turnover between Azerbaijan and Russia, on the
other hand, was $1.9 billion in 2010, of which $774 million were exports to Russia and $1.1
billion were imports to Azerbaijan.199 Russia has been rated among Azerbaijan’s top three
foreign trading partners over the last 6 years (2nd in 2010). Trade with India hit the $2.5 billion
mark in 2008,200 but this was largely due to India’s increased imports of Azeri oil that year,
which accounted for more than $2 billion of the total trade. In 2009, the trade was about $322
million, increasing to just over $330 million in 2010.201 Azerbaijan’s other important NSTC
ICELAND NORWAY DENMARK FINLAND SWEDEN
2008‐2009 16.23 1,514.40 1,061.11 1,484.53 2,519.19
2009‐2010 27.05 1,136.26 1,172.79 1,219.02 2,066.77
‐
500.00
1,000.00
1,500.00
2,000.00
2,500.00
3,000.00
in $ m
illion
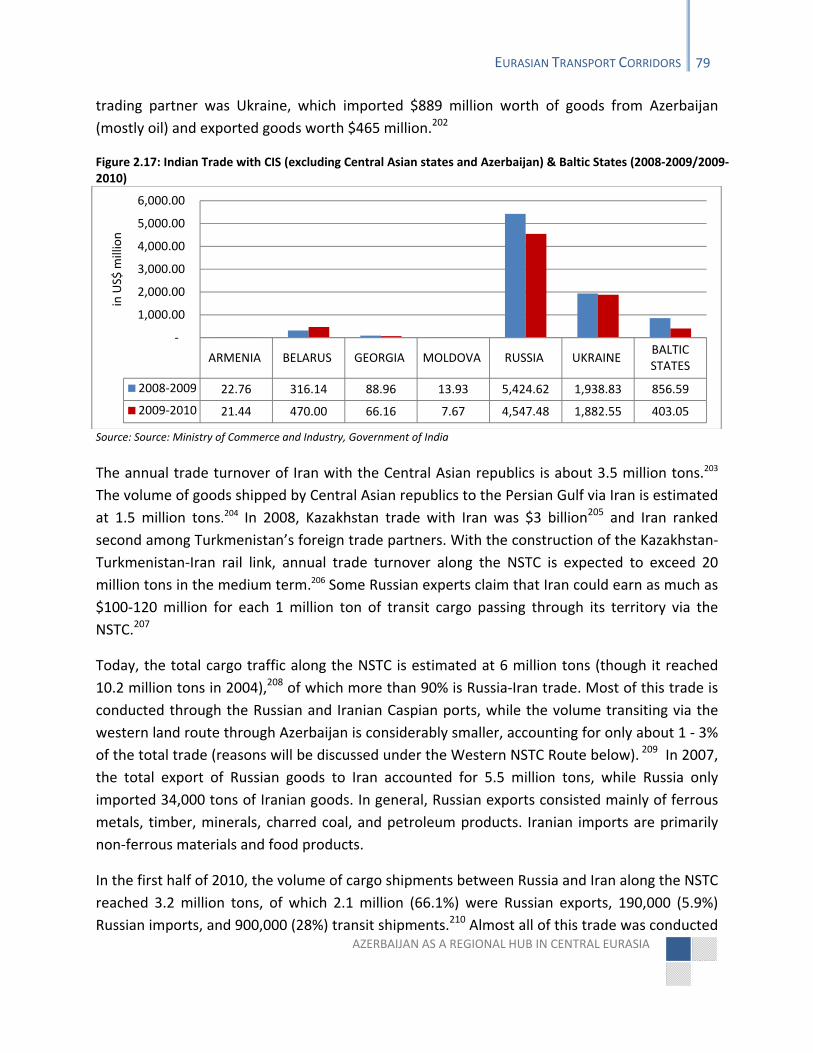
AZERBAIJAN AS A REGIONAL HUB IN CENTRAL EURASIA
EURASIAN TRANSPORT CORRIDORS 79
trading partner was Ukraine, which imported $889 million worth of goods from Azerbaijan
(mostly oil) and exported goods worth $465 million.202
Figure 2.17: Indian Trade with CIS (excluding Central Asian states and Azerbaijan) & Baltic States (2008‐2009/2009‐2010)
Source: Source: Ministry of Commerce and Industry, Government of India
The annual trade turnover of Iran with the Central Asian republics is about 3.5 million tons.203
The volume of goods shipped by Central Asian republics to the Persian Gulf via Iran is estimated
at 1.5 million tons.204 In 2008, Kazakhstan trade with Iran was $3 billion205 and Iran ranked
second among Turkmenistan’s foreign trade partners. With the construction of the Kazakhstan‐
Turkmenistan‐Iran rail link, annual trade turnover along the NSTC is expected to exceed 20
million tons in the medium term.206 Some Russian experts claim that Iran could earn as much as
$100‐120 million for each 1 million ton of transit cargo passing through its territory via the
NSTC.207
Today, the total cargo traffic along the NSTC is estimated at 6 million tons (though it reached
10.2 million tons in 2004),208 of which more than 90% is Russia‐Iran trade. Most of this trade is
conducted through the Russian and Iranian Caspian ports, while the volume transiting via the
western land route through Azerbaijan is considerably smaller, accounting for only about 1 ‐ 3%
of the total trade (reasons will be discussed under the Western NSTC Route below). 209 In 2007,
the total export of Russian goods to Iran accounted for 5.5 million tons, while Russia only
imported 34,000 tons of Iranian goods. In general, Russian exports consisted mainly of ferrous
metals, timber, minerals, charred coal, and petroleum products. Iranian imports are primarily
non‐ferrous materials and food products.
In the first half of 2010, the volume of cargo shipments between Russia and Iran along the NSTC
reached 3.2 million tons, of which 2.1 million (66.1%) were Russian exports, 190,000 (5.9%)
Russian imports, and 900,000 (28%) transit shipments.210 Almost all of this trade was conducted
ARMENIA BELARUS GEORGIA MOLDOVA RUSSIA UKRAINE BALTIC STATES
2008‐2009 22.76 316.14 88.96 13.93 5,424.62 1,938.83 856.59
2009‐2010 21.44 470.00 66.16 7.67 4,547.48 1,882.55 403.05
‐
1,000.00
2,000.00
3,000.00
4,000.00
5,000.00
6,000.00
in US$ million
STRATEGIC ASSESSMENT OF EURO‐ASIAN TRADE AND TRANSPORTATION
80 PART II
via maritime transportation in the Caspian Sea. The majority of exports are transported by ship
from Astrakhan and Ola to the Iranian ports of Anzali and Amirabad, thereby bypassing
Azerbaijan. Hence, while the potential of Azerbaijan as a transit country is great, the country is
not currently a significant transit location along the NSTC, at least for Russian goods destined
for Iranian or the Middle Eastern markets.
The Western NSTC Route
Azerbaijan acts as a key land bridge between Russia and Iran on the western NSTC route. This
route connects the rail and road networks of Russia, Azerbaijan and Iran along the western
shore of the Caspian Sea. It is the shortest and potentially the fastest land‐based corridor, in
comparison to the other 2 NSTC routes.211
The western NSTC route: Highways
In 2010, Azerbaijan opened a section of a modern highway linking the capital city of Baku to
Samur, at the Azerbaijan‐Russia border. The total length of the Baku‐Samur section (M1 road) is
208 km, and there is only a 56 km section that remains unfinished. This 4 lane asphalt‐concrete
surface highway will be completed in 2011. It will also have a new M1 extension to Yalama,
which will shorten the distance between Baku and the Azerbaijan‐Russia border by 10 km.
Additionally, in 2010, a Baku bypass road was completed, allowing transit cargo trucks and
freight to move in the North‐South direction without entering the city. Additional work is
currently being carried out in the ‘Southern Road Corridor’, a 243‐km section between Alyat
and Astara (M3). The Asian Development Bank (ADB) completed a number of studies on this
road in 2005 and 2006, including a feasibility and technical assessment. A 221‐km long segment
of the Alyat‐Astara highway will be modernized and the construction will be jointly financed by
the Azerbaijani government and international organizations. Once completed, the entire route
from the Azerbaijan‐Russia border to the Azerbaijan‐Iran border will meet international
standards, enabling fast and comfortable transit along Azerbaijan’s segment of the NSTC.
Azerbaijan has two main border crossing and customs check points along the western NSTC
route: Samur in the north (Azerbaijan‐Russia border) and Astara in the south (Azerbaijan‐Iran
border). At the moment, the Yalama border crossing point is mostly used for rail traffic, but it
will soon be linked to the main M1 highway to Baku (Map 5). The car and cargo traffic through
Astara and Samur border crossings has increased significantly over the past few years. Today,
the Astara border crossing point with Iran is the busiest and largest in the country, in terms of
volume of cargo transported by trucks. In 2010, this border processed a greater volume of truck
and motor vehicle transported cargo (in tons) than the Red Bridge border crossing with
Georgia, which is the main gateway for East‐West traffic. More than 66,500 trucks crossed the
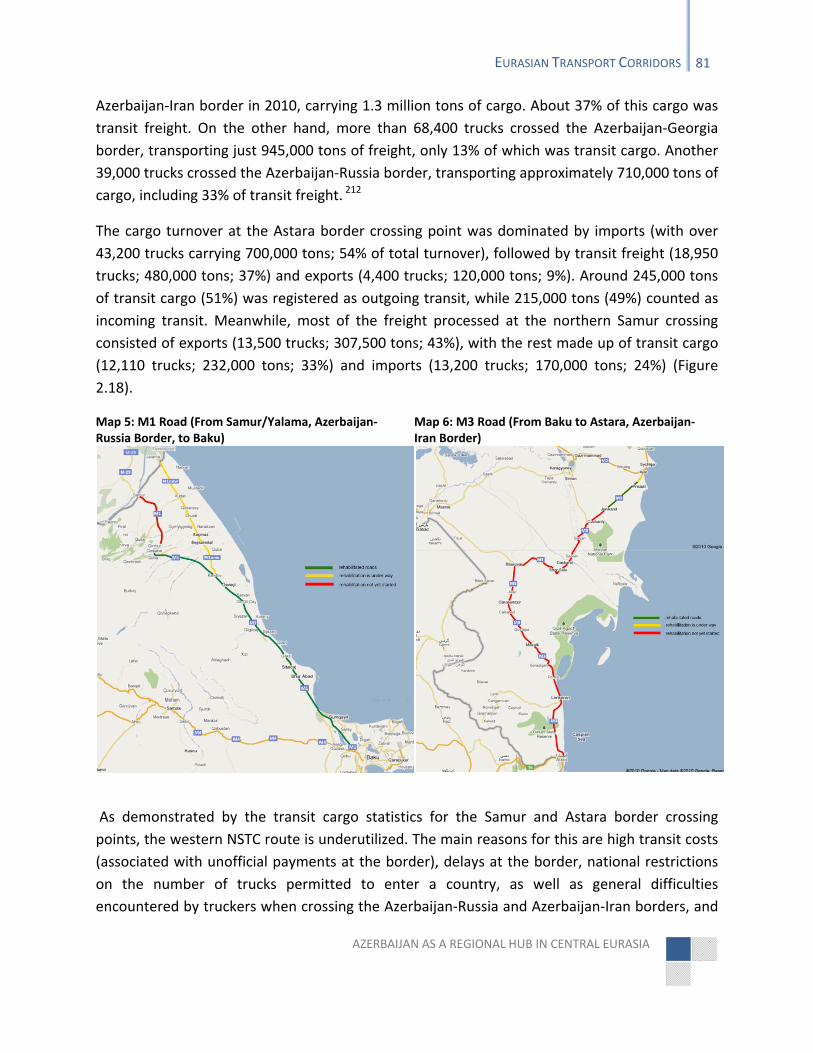
AZERBAIJAN AS A REGIONAL HUB IN CENTRAL EURASIA
EURASIAN TRANSPORT CORRIDORS 81
Azerbaijan‐Iran border in 2010, carrying 1.3 million tons of cargo. About 37% of this cargo was
transit freight. On the other hand, more than 68,400 trucks crossed the Azerbaijan‐Georgia
border, transporting just 945,000 tons of freight, only 13% of which was transit cargo. Another
39,000 trucks crossed the Azerbaijan‐Russia border, transporting approximately 710,000 tons of
cargo, including 33% of transit freight. 212
The cargo turnover at the Astara border crossing point was dominated by imports (with over
43,200 trucks carrying 700,000 tons; 54% of total turnover), followed by transit freight (18,950
trucks; 480,000 tons; 37%) and exports (4,400 trucks; 120,000 tons; 9%). Around 245,000 tons
of transit cargo (51%) was registered as outgoing transit, while 215,000 tons (49%) counted as
incoming transit. Meanwhile, most of the freight processed at the northern Samur crossing
consisted of exports (13,500 trucks; 307,500 tons; 43%), with the rest made up of transit cargo
(12,110 trucks; 232,000 tons; 33%) and imports (13,200 trucks; 170,000 tons; 24%) (Figure
2.18).
Map 5: M1 Road (From Samur/Yalama, Azerbaijan‐Russia Border, to Baku)
Map 6: M3 Road (From Baku to Astara, Azerbaijan‐Iran Border)
As demonstrated by the transit cargo statistics for the Samur and Astara border crossing
points, the western NSTC route is underutilized. The main reasons for this are high transit costs
(associated with unofficial payments at the border), delays at the border, national restrictions
on the number of trucks permitted to enter a country, as well as general difficulties
encountered by truckers when crossing the Azerbaijan‐Russia and Azerbaijan‐Iran borders, and
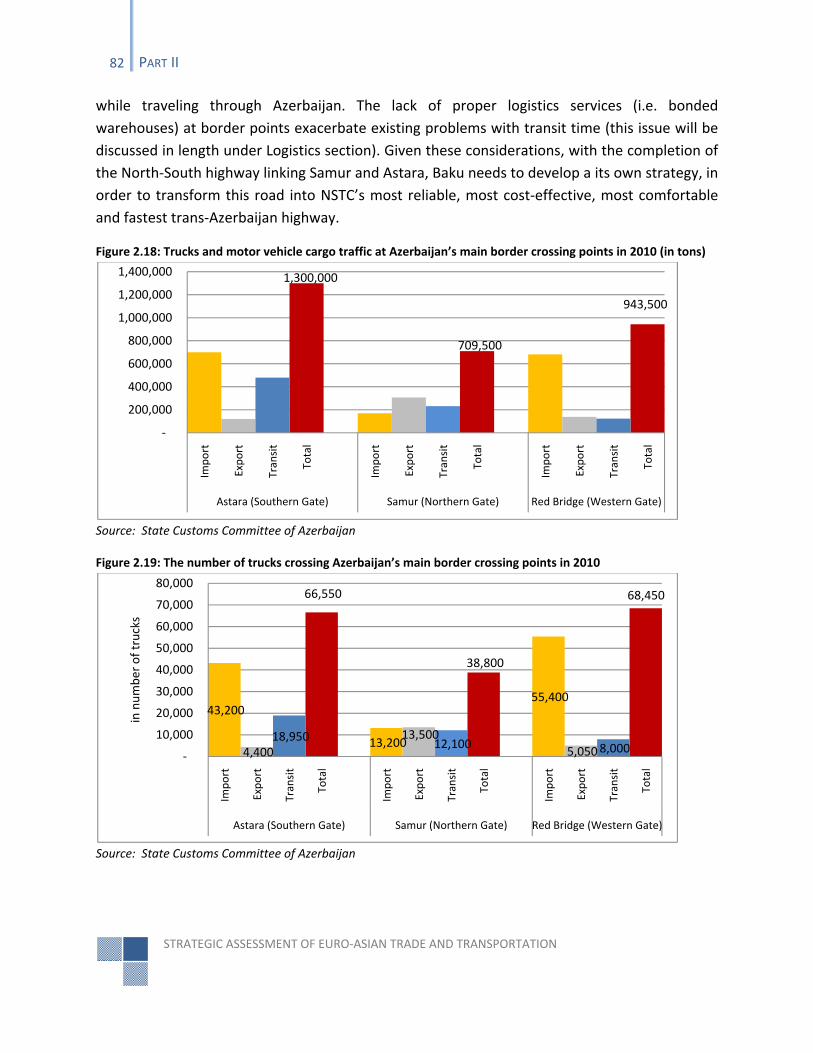
STRATEGIC ASSESSMENT OF EURO‐ASIAN TRADE AND TRANSPORTATION
82 PART II
while traveling through Azerbaijan. The lack of proper logistics services (i.e. bonded
warehouses) at border points exacerbate existing problems with transit time (this issue will be
discussed in length under Logistics section). Given these considerations, with the completion of
the North‐South highway linking Samur and Astara, Baku needs to develop a its own strategy, in
order to transform this road into NSTC’s most reliable, most cost‐effective, most comfortable
and fastest trans‐Azerbaijan highway.
Figure 2.18: Trucks and motor vehicle cargo traffic at Azerbaijan’s main border crossing points in 2010 (in tons)
Source: State Customs Committee of Azerbaijan
Figure 2.19: The number of trucks crossing Azerbaijan’s main border crossing points in 2010
Source: State Customs Committee of Azerbaijan
1,300,000
709,500
943,500
‐
200,000
400,000
600,000
800,000
1,000,000
1,200,000
1,400,000
Import
Export
Transit
Total
Import
Export
Transit
Total
Import
Export
Transit
Total
Astara (Southern Gate) Samur (Northern Gate) Red Bridge (Western Gate)
43,200
4,400 18,950
66,550
13,200 13,500
12,100
38,800
55,400
5,050 8,000
68,450
‐
10,000
20,000
30,000
40,000
50,000
60,000
70,000
80,000
Import
Export
Transit
Total
Import
Export
Transit
Total
Import
Export
Transit
Total
Astara (Southern Gate) Samur (Northern Gate) Red Bridge (Western Gate)
in number of trucks
AZERBAIJAN AS A REGIONAL HUB IN CENTRAL EURASIA
EURASIAN TRANSPORT CORRIDORS 83
The western NSTC route: Railways
Under the Soviet Union, more than 3 million tons of freight per year were transported by rail to
Iran and the Middle East via Azerbaijan. The city of Julfa, which is situated at the Azerbaijan‐
Iran border in Azerbaijan’s exclave autonomous republic of Nakhichevan (NAR), acted as a
major logistics center for the region, and was the biggest hub in the NSTC. About 150 trains
passed through Julfa to Iran every day, carrying about 270,000 tons of cargo.213 The Soviet
wagons and containers did not travel far into Iran, but were unloaded and reloaded just across
the Azerbaijan‐Iranian border, in the Iranian Julfa – a city with the same name as Azerbaijan’s
Julfa, just across the border. Distribution of goods within Iran and further transit was mainly
carried out by Iranian logistics companies.
To reach Julfa in the NAR, the Soviet railway had to travel across a small strip of Armenian
territory. During the war between Armenia and Azerbaijan in the 1990s, this rail link was
destroyed, and could no longer be used for the North‐South cargo transit. Furthermore,
Armenian occupation of parts of south‐west Azerbaijan meant that Azerbaijan lost 240 km of its
national railway network, including a 132 km rail segment that runs along the Azerbaijan‐Iran
border.214 Today, all the railways in the occupied territories have been looted, and the tunnels
blocked. While rebuilding the Baku‐Armenia‐Julfa section of the railway may be relatively easy
in practical terms, the fate of this railway, or what is left of it, is dependent on the resolution of
the Nagorno‐Karabakh conflict between Armenia and Azerbaijan.
Once it was cut off from the main rail networks along the NSTC, Julfa’s significance as a transit
hub diminished, and so did Azerbaijan’s importance as a rail transit country. Russia’s total
railway cargo exchange with Azerbaijan, Turkey and Iran was 32.3 million tons in 2007, 26.1
million tons in 2009,215 and 17.4 million tons for the first eight months of 2010.216 Azerbaijan’s
share in this cargo exchange with Russia has remained steady, at about 20%; Iran’s at 17%.
According to official statistics from ADY, Azerbaijan’s total rail cargo traffic along the NSTC was
about 5.7 million in 2010, which accounted for 25% of the total rail cargo carried by ADY in
2010.217 Of this, 4.8 million tons were incoming cargo (92% imports, 8% transit) and 859,600
tons (95% exports, 5% transit) were outgoing cargo. Transit cargo destined for or originated
from Iran was negligible. The majority of Russian rail cargo for Iran is transported via ships
across the Caspian Sea, rather than by rail via Azerbaijan, primarily due to the lack of a rail
connection between Azerbaijan and Iran.
Discussions on the construction of a rail link between Azerbaijan and Iran through Astara began
in the 1990s, but the political and geopolitical considerations of the 1990s meant that Russia
and Iran prioritized the development of the central NSTC route via the Caspian Sea, effectively
bypassing Azerbaijan. Only in the mid‐2000s did the parties realize that a rail link between
STRATEGIC ASSESSMENT OF EURO‐ASIAN TRADE AND TRANSPORTATION
84 PART II
Azerbaijan and Iran was crucial, given that it is the shortest and most viable alternative among
all the NSTC routes.
Experts consider the western NSTC rail route as the best option for Euro‐Asian railway
transportation in the long term, particularly between Northern Europe and South Asia.218 The
annual freight traffic of the planned NSTC railway via Azerbaijan is estimated at 9 million tons
by 2015, and 20 million by 2030.219 It is believed that with the construction of the Qazvin‐Rasht‐
Astara railway, delivery time will be reduced by 50%, and transportation costs by 30%, in
comparison with alternative routes.220
The western NSTC railway route from Helsinki to Azerbaijan ends 8 km short of the Azerbaijan‐
Iran border, and then re‐starts in Qazvin, Iran and continues all the way to Bandar Abbas port in
the Persian Gulf. Of the missing 375 km along the Qazvin‐Rasht‐Astara (Iranian)‐Astara
(Azerbaijani) section, 367 km is in Iran, including 195 km between Qazvin and Rasht and 172 km
between Rasht and Astara (Iranian). The remaining 8 km would be constructed in Azerbaijan,
between Astara (Azerbaijani) to the Azerbaijan‐Iran border.
The construction of the Qazvin‐Rasht segment of the railway, which will include a rail extension
to Iran’s Caspian Port of Anzali, began in 2003 under former Iranian president Mohammad
Khatami, but the work has intensified under the current president, Mahmoud Ahmadinejad.
The Iranian government is expected to open the Qazvin‐Rasht railway in 2011. The Anzali
extension is likely to be finished by 2012 or 2013. Although the Qazvin‐Rasht‐Astara railway is a
strategic project for the western NSTC, its short‐term effect will be to increase the importance
of the central NSTC route by providing rail access to Anzali.‡‡‡
As far as the Rasht‐Astara section is concerned, the construction schedule is uncertain. Russian
Railways’ 2008 feasibility study for the Rasht‐Astara segment estimated construction costs at
$408 million. The project proposed a JV between Russian, Iranian and Azerbaijan railways, to
invest in, build, and operate the Qazvin‐Rasht‐Astara railway. The project envisages a 172 km
segment of the Rasht‐Astara section in Iranian territory (from Rasht to Iranian Astara) and a 8.3
km segment from Azerbaijani Astara to the Azerbaijan‐Iran border.
On 8 February 2011, the heads of Azerbaijani, Russian, Iranian and railways signed a trilateral
agreement, establishing a JV to build and operate this rail link. The parties also agreed on the
electrification of the Qazvin‐Rasht‐Astara railway. Two additional MoUs were signed between
Iran and Azerbaijan and Iran and Russia.221 According to the agreement, the Rasht‐Astara
‡‡‡ Along the central NSTC route, currently only Port of Amirabad has a rail access (though another small Caspian port of Iran, Bandar Turkmen, near the Iran‐Turkmenistan border, also has a rail access, but this port is not viewed as a part of the NSTC).
AZERBAIJAN AS A REGIONAL HUB IN CENTRAL EURASIA
EURASIAN TRANSPORT CORRIDORS 85
railway will be constructed through the build‐operate‐transfer (BOT) scheme, which will be
valid for 15 years. The $408 million investment required for the project will be provided by the
national banks of the 3 countries, along with other regional banks, mostly Russian.222 A Russian‐
Iranian MoU calls for closer cooperation between the two countries on railway construction
and technical support and electrification of Tehran‐Bandar‐Abbas railway link by the Russian
side.223
Electrification is essential for the harmonization of the Russian, Iranian, and Azerbaijani rail
networks. In the long term, electrification is a more energy efficient and environmentally
friendly solution. While around 60% of Azerbaijan’s railways are electrified, the southern part of
the national NSTC rail route from Yeni Osmanli to Astara (183 km) is not. Only the 129km Baku‐
Yeni Osmanli segment is electrified. In addition, the Yeni Osmanli to Astara section is a single
track, while the northern segment from Yalama (Azerbaijan‐Russia border) to Baku is double
track and electrified with a 3 kV constant current. In the State Program on Development of
Railway Transportation Systems (2010‐2014), the Azerbaijani Ministry of Transport has included
the modernization and full electrification (with 25 kV alternate constant current) of the Baku‐
Boyuk Kesik (East‐West), the Yalama‐Baku, and the Baku‐Astara sections of Azerbaijan’s NSTC
rail networks. By 2013, all rail stations along the NSTC will also be connected with fiber optic
cables.224
Finally, while Russia and Azerbaijan use the same 1,520 mm (4 ft 11 5⁄6 in) wide rail gauge, India
uses a wider 1,676 mm (5 ft 6 in) gauge. Iran uses a standard 1,435 mm (4 ft 8 1⁄2 in) gauge, the most common gauge across the EU, Turkey, the Middle East, North Africa, and China. Because
of these technical incompatibilities, the western NSTC rail route will need a break‐of‐gauge
point at Astara, in addition to a gauge interchange station at the Azerbaijan‐Iran border, where
the trains will change platforms from one gauge type to another. Today, with available modern
gauge changing technologies, this operation is no longer a problem and can be performed fairly
quickly, without causing major delays.
The Eastern NSTC Routes
The eastern land segment of the NSTC lies along the eastern shore of the Caspian Sea, crossing
Kazakhstan, Turkmenistan and Iran. As with the western NSTC route, this land corridor also has
a Soviet railway connecting Kazakhstan to Iran via a longer route through Uzbekistan and
Turkmenistan. Due to frequent problems at the border crossing points in Central Asian
countries, moving cargo by rail from North to South has not been a preferred option. In 2007,
Kazakhstan, Turkmenistan and Iran proposed building a railway connection from Uzen
(Kazakhstan) to Kizylkaya‐Bereket‐Etrek (Turkmenistan) to Gorgan (Iran), to run along the
STRATEGIC ASSESSMENT OF EURO‐ASIAN TRADE AND TRANSPORTATION
86 PART II
eastern shore of the Caspian Sea. It will be 600‐700 km shorter than its Soviet counterpart. The
total length of the proposed rail link is 951 km (146 km in Kazakhstan, 723 km in Turkmenistan,
and 82 km in Iran).225 The railway is scheduled to open in December 2011.
In March 2010, an Iranian company, Pars Energy, started the construction of the 257km
segment of the Turkmen railway between Bereket and Etrek stations and the Turkmen‐Iranian
border. The construction of this segment is being funded by the Iranian side, thanks to a loan
from the Islamic Development Bank (IDB) and long‐term credit from Pars Energy. The total cost
of this segment will reach $696 million, including the cost of a planned locomotive depot near
the Etrek station. 226 The 466 km northern segment between Bereket and the Turkmen‐Kazakh
border is being built by the Ministry of Railway Transport of Turkmenistan. The cost of the
Kazakh and Iranian sections of the railways are $430 million and $185 million, respectively.227
From Gorgan, the railway links up with the main Iranian track going to the Port of Bandar
Abbas. The Iranian government has recently given the green light for a new rail project to
connect Gorgan with Mashhad (in the east), going from there directly to the Port of Chabahar.
A 1,350 km railway project to link Mashhad and Chabahar began last year. The financing for the
Mashhad‐Gorgan line was approved in December 2010, and construction is expected to start
soon.228
It is estimated that initially, the Uzen‐Bereket‐Gorgan railway will handle 3‐5 million tons of
cargo per year, gradually increasing to 10 million tons by 2016.229 Iran’s annual trade turnover
with Central Asian countries is estimated at 3.5 million tons, most of which is crude oil. In
addition, every year approximately 1.5 million tons of cargo is shipped from Central Asia to the
Persian Gulf via Iran.230 The Uzen‐Bereket‐Gorgan line will allow Iran to import goods and
mineral resources from Russia, Kazakhstan and Turkmenistan more cheaply. It will also enable
Russia, Kazakhstan, and Turkmenistan to access the Persian Gulf by rail more directly.
Kazakhstan in particular, is interested in using this railway to export its grain to Iran and other
Persian Gulf and North Africa buyers. Compared to transporting grain by road, which has been
the least efficient means of getting grain to the Persian Gulf,231 the railway will be quicker and
cheaper.
A comparison of the western and eastern NSTC rail routes suggests that the eastern NSTC route
from Kazakhstan to Iran via Turkmenistan is ahead of its counterpart, since it will be completed
by the end of 2011, while the construction schedule of the Qazvin‐Rasht‐Astara railway is not
yet confirmed. Currently, these two rail links are not in direct competition as they serve
different markets. On the other hand, the Uzen‐Bereket‐Gorgan railway may face competition
from other rail routes going from China to the Persian Gulf, and from the Caspian maritime
routes going from Russian ports to Iran via the central NSTC. Azerbaijan’s hub strategy depends
AZERBAIJAN AS A REGIONAL HUB IN CENTRAL EURASIA
EURASIAN TRANSPORT CORRIDORS 87
on the effective use of the NSTC as much as the East‐West corridors. Hence, Baku should
facilitate the construction of the railway linking Astara (Azerbaijan) and Rasht (Iran), as this
would lay the foundation of the future intermodal land‐based North‐South supply chain from
India to Europe.

AZERBAIJAN AS A REGIONAL HUB IN CENTRAL EURASIA
MARITIME TRANSPORTATION AND CASPIAN PORTS
Although Azerbaijan is a landlocked state, its access to the Caspian Sea makes it necessary to
develop intermodal transport infrastructure integrating the sea and land transport modes. The
Caspian Sea is the largest inland sea in the world. It is surrounded by five littoral states:
Azerbaijan, Iran, Kazakhstan, Russia, and Turkmenistan. These countries are the main maritime
traders in the Caspian region. In addition to bilateral trade, the great proportion of trans‐
Caspian trade consists of transit shipments of oil and petroleum products. More than 80% of
cargo processed at Azerbaijan’s Caspian ports and terminals is made up of transit goods.
According to official statistics, 11.7 million tons of cargo were shipped via ports and terminals of
Azerbaijan in 2010, of which 9.5 million tons were transit shipments.232
Since Azerbaijan does not have a land border with any of the Central Asian states, maritime
transportation via the Caspian is of key strategic importance. It acts as a sea bridge linking
Europe and Asia, and provides a crucial multimodal junction in the supply chain along the
TRACECA route. Maritime transportation via the Caspian Sea affects the entire Euro‐Asian
supply chain via Azerbaijan.
This section gives an overview of the ten major Caspian ports and their infrastructure, examines
their role in Euro‐Asia trade and transportation, and highlights some challenges to the effective
and efficient traffic of commercial freight shipments via the Caspian Sea. The Port of Baku will
be analyzed in this section, and the new Baku International Sea Port at Alyat will be examined
separately in Part III.
Overview
There are ten major ports in the Caspian Sea, not including the region’s smaller ports. Out of
these ten ports, four belong to Iran (Anzali, Amirabad, Neka, and Noshahr), three to Russia
(Astrakhan, Makhachkala, and Ola), and one each to Azerbaijan (Baku), Kazakhstan (Aktau) and
Turkmenistan (Turkmenbashy).
In 2010, the Caspian ports together handled a total of 56.4 million tons of cargo (Table 2.18), of
which 11.7 million tons (21%) was processed by Azerbaijan’s ports and terminals. Kazakhstan’s
port of Aktau processed the most Caspian cargo, 23% of total Caspian cargo traffic, followed by
Azerbaijan and Iran (21% each), Russia (19%) and Turkmenistan (16%) (Figure 2.20). Trade was
dominated by oil and petroleum products, which together exceeded 31 million tons, more than
55% (65% not including the Iranian ports) of the total Caspian cargo exchange. About 16 million
tons of non‐oil cargo (63% of total non‐oil cargo) was transported in the North‐South direction
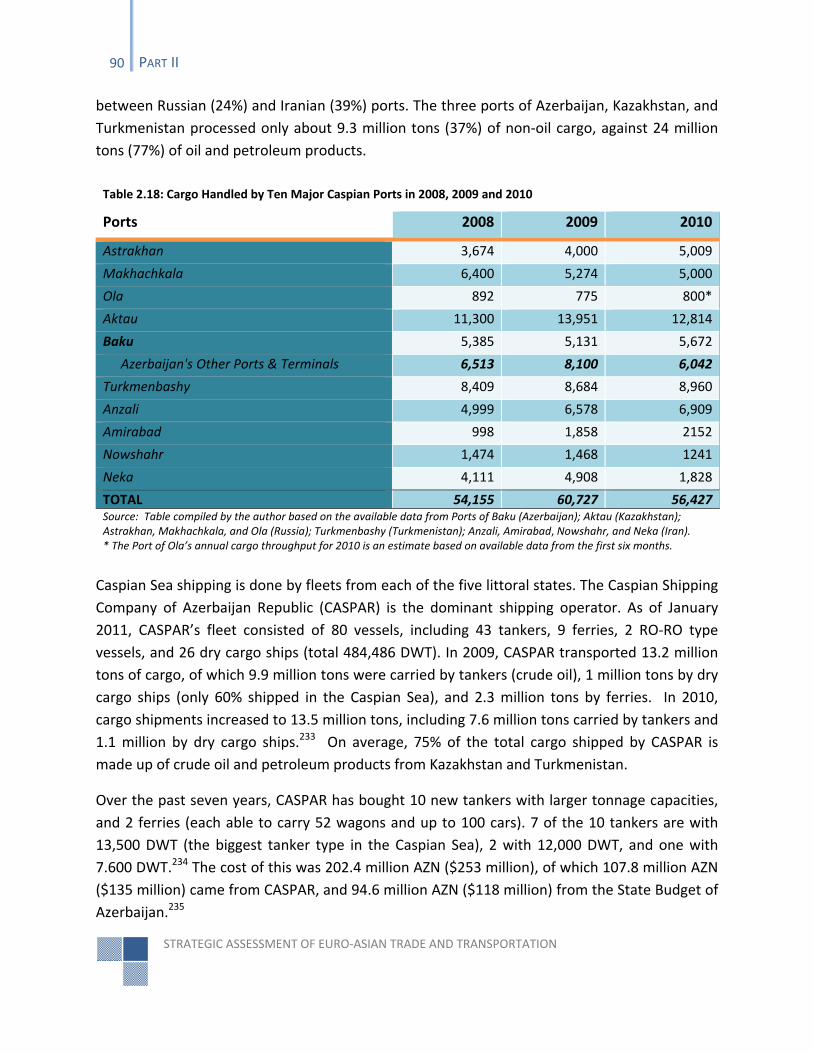
STRATEGIC ASSESSMENT OF EURO‐ASIAN TRADE AND TRANSPORTATION
90 PART II
between Russian (24%) and Iranian (39%) ports. The three ports of Azerbaijan, Kazakhstan, and
Turkmenistan processed only about 9.3 million tons (37%) of non‐oil cargo, against 24 million
tons (77%) of oil and petroleum products.
Caspian Sea shipping is done by fleets from each of the five littoral states. The Caspian Shipping
Company of Azerbaijan Republic (CASPAR) is the dominant shipping operator. As of January
2011, CASPAR’s fleet consisted of 80 vessels, including 43 tankers, 9 ferries, 2 RO‐RO type
vessels, and 26 dry cargo ships (total 484,486 DWT). In 2009, CASPAR transported 13.2 million
tons of cargo, of which 9.9 million tons were carried by tankers (crude oil), 1 million tons by dry
cargo ships (only 60% shipped in the Caspian Sea), and 2.3 million tons by ferries. In 2010,
cargo shipments increased to 13.5 million tons, including 7.6 million tons carried by tankers and
1.1 million by dry cargo ships.233 On average, 75% of the total cargo shipped by CASPAR is
made up of crude oil and petroleum products from Kazakhstan and Turkmenistan.
Over the past seven years, CASPAR has bought 10 new tankers with larger tonnage capacities,
and 2 ferries (each able to carry 52 wagons and up to 100 cars). 7 of the 10 tankers are with
13,500 DWT (the biggest tanker type in the Caspian Sea), 2 with 12,000 DWT, and one with
7.600 DWT.234 The cost of this was 202.4 million AZN ($253 million), of which 107.8 million AZN
($135 million) came from CASPAR, and 94.6 million AZN ($118 million) from the State Budget of
Azerbaijan.235
Table 2.18: Cargo Handled by Ten Major Caspian Ports in 2008, 2009 and 2010
Ports 2008 2009 2010
Astrakhan 3,674 4,000 5,009
Makhachkala 6,400 5,274 5,000
Ola 892 775 800*
Aktau 11,300 13,951 12,814
Baku 5,385 5,131 5,672
Azerbaijan's Other Ports & Terminals 6,513 8,100 6,042
Turkmenbashy 8,409 8,684 8,960
Anzali 4,999 6,578 6,909
Amirabad 998 1,858 2152
Nowshahr 1,474 1,468 1241
Neka 4,111 4,908 1,828
TOTAL 54,155 60,727 56,427Source: Table compiled by the author based on the available data from Ports of Baku (Azerbaijan); Aktau (Kazakhstan); Astrakhan, Makhachkala, and Ola (Russia); Turkmenbashy (Turkmenistan); Anzali, Amirabad, Nowshahr, and Neka (Iran). * The Port of Ola’s annual cargo throughput for 2010 is an estimate based on available data from the first six months.
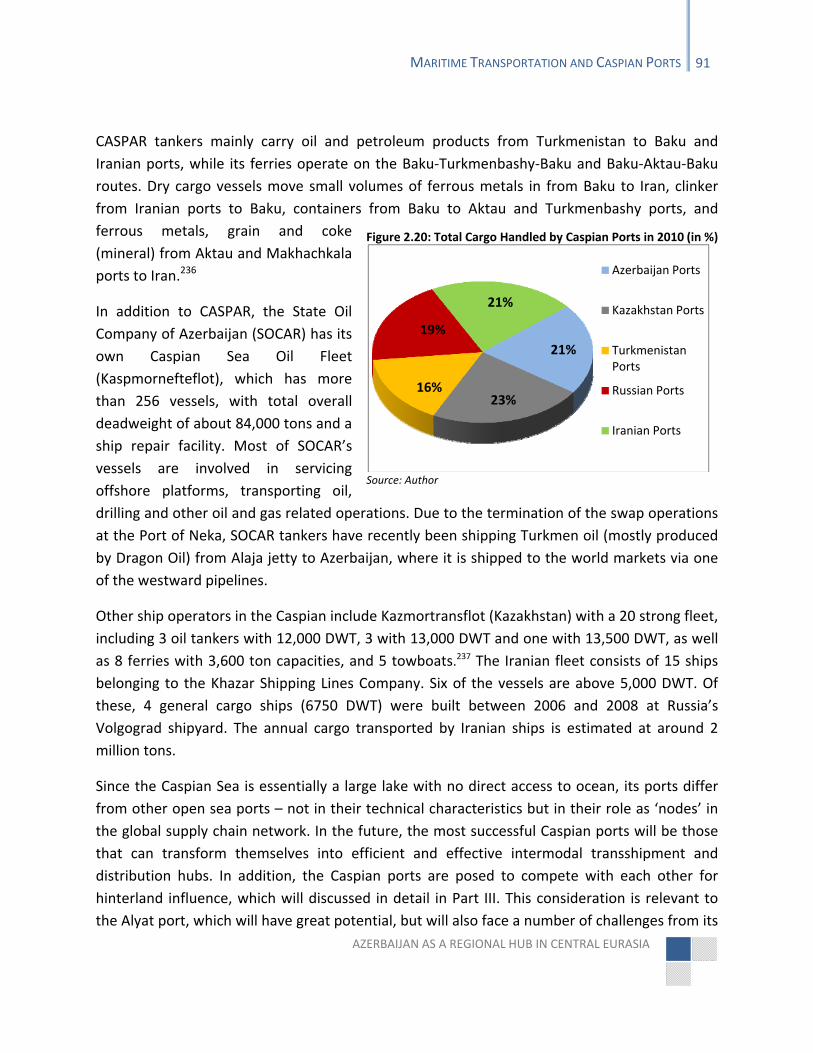
AZERBAIJAN AS A REGIONAL HUB IN CENTRAL EURASIA
MARITIME TRANSPORTATION AND CASPIAN PORTS 91
CASPAR tankers mainly carry oil and petroleum products from Turkmenistan to Baku and
Iranian ports, while its ferries operate on the Baku‐Turkmenbashy‐Baku and Baku‐Aktau‐Baku
routes. Dry cargo vessels move small volumes of ferrous metals in from Baku to Iran, clinker
from Iranian ports to Baku, containers from Baku to Aktau and Turkmenbashy ports, and
ferrous metals, grain and coke
(mineral) from Aktau and Makhachkala
ports to Iran.236
In addition to CASPAR, the State Oil
Company of Azerbaijan (SOCAR) has its
own Caspian Sea Oil Fleet
(Kaspmornefteflot), which has more
than 256 vessels, with total overall
deadweight of about 84,000 tons and a
ship repair facility. Most of SOCAR’s
vessels are involved in servicing
offshore platforms, transporting oil,
drilling and other oil and gas related operations. Due to the termination of the swap operations
at the Port of Neka, SOCAR tankers have recently been shipping Turkmen oil (mostly produced
by Dragon Oil) from Alaja jetty to Azerbaijan, where it is shipped to the world markets via one
of the westward pipelines.
Other ship operators in the Caspian include Kazmortransflot (Kazakhstan) with a 20 strong fleet,
including 3 oil tankers with 12,000 DWT, 3 with 13,000 DWT and one with 13,500 DWT, as well
as 8 ferries with 3,600 ton capacities, and 5 towboats.237 The Iranian fleet consists of 15 ships
belonging to the Khazar Shipping Lines Company. Six of the vessels are above 5,000 DWT. Of
these, 4 general cargo ships (6750 DWT) were built between 2006 and 2008 at Russia’s
Volgograd shipyard. The annual cargo transported by Iranian ships is estimated at around 2
million tons.
Since the Caspian Sea is essentially a large lake with no direct access to ocean, its ports differ
from other open sea ports – not in their technical characteristics but in their role as ‘nodes’ in
the global supply chain network. In the future, the most successful Caspian ports will be those
that can transform themselves into efficient and effective intermodal transshipment and
distribution hubs. In addition, the Caspian ports are posed to compete with each other for
hinterland influence, which will discussed in detail in Part III. This consideration is relevant to
the Alyat port, which will have great potential, but will also face a number of challenges from its
Figure 2.20: Total Cargo Handled by Caspian Ports in 2010 (in %)
Source: Author
21%
23%16%
19%
21%
Azerbaijan Ports
Kazakhstan Ports
Turkmenistan Ports
Russian Ports
Iranian Ports
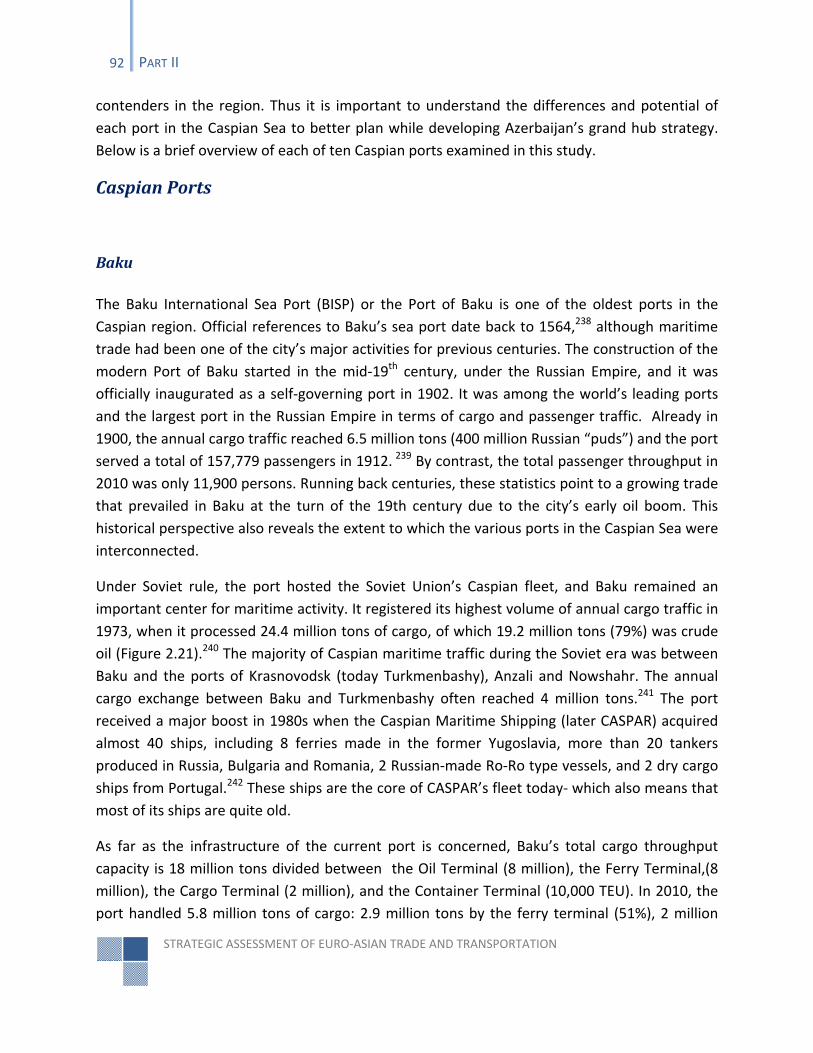
STRATEGIC ASSESSMENT OF EURO‐ASIAN TRADE AND TRANSPORTATION
92 PART II
contenders in the region. Thus it is important to understand the differences and potential of
each port in the Caspian Sea to better plan while developing Azerbaijan’s grand hub strategy.
Below is a brief overview of each of ten Caspian ports examined in this study.
Caspian Ports
Baku
The Baku International Sea Port (BISP) or the Port of Baku is one of the oldest ports in the
Caspian region. Official references to Baku’s sea port date back to 1564,238 although maritime
trade had been one of the city’s major activities for previous centuries. The construction of the
modern Port of Baku started in the mid‐19th century, under the Russian Empire, and it was
officially inaugurated as a self‐governing port in 1902. It was among the world’s leading ports
and the largest port in the Russian Empire in terms of cargo and passenger traffic. Already in
1900, the annual cargo traffic reached 6.5 million tons (400 million Russian “puds”) and the port
served a total of 157,779 passengers in 1912. 239 By contrast, the total passenger throughput in
2010 was only 11,900 persons. Running back centuries, these statistics point to a growing trade
that prevailed in Baku at the turn of the 19th century due to the city’s early oil boom. This
historical perspective also reveals the extent to which the various ports in the Caspian Sea were
interconnected.
Under Soviet rule, the port hosted the Soviet Union’s Caspian fleet, and Baku remained an
important center for maritime activity. It registered its highest volume of annual cargo traffic in
1973, when it processed 24.4 million tons of cargo, of which 19.2 million tons (79%) was crude
oil (Figure 2.21).240 The majority of Caspian maritime traffic during the Soviet era was between
Baku and the ports of Krasnovodsk (today Turkmenbashy), Anzali and Nowshahr. The annual
cargo exchange between Baku and Turkmenbashy often reached 4 million tons.241 The port
received a major boost in 1980s when the Caspian Maritime Shipping (later CASPAR) acquired
almost 40 ships, including 8 ferries made in the former Yugoslavia, more than 20 tankers
produced in Russia, Bulgaria and Romania, 2 Russian‐made Ro‐Ro type vessels, and 2 dry cargo
ships from Portugal.242 These ships are the core of CASPAR’s fleet today‐ which also means that
most of its ships are quite old.
As far as the infrastructure of the current port is concerned, Baku’s total cargo throughput
capacity is 18 million tons divided between the Oil Terminal (8 million), the Ferry Terminal,(8
million), the Cargo Terminal (2 million), and the Container Terminal (10,000 TEU). In 2010, the
port handled 5.8 million tons of cargo: 2.9 million tons by the ferry terminal (51%), 2 million
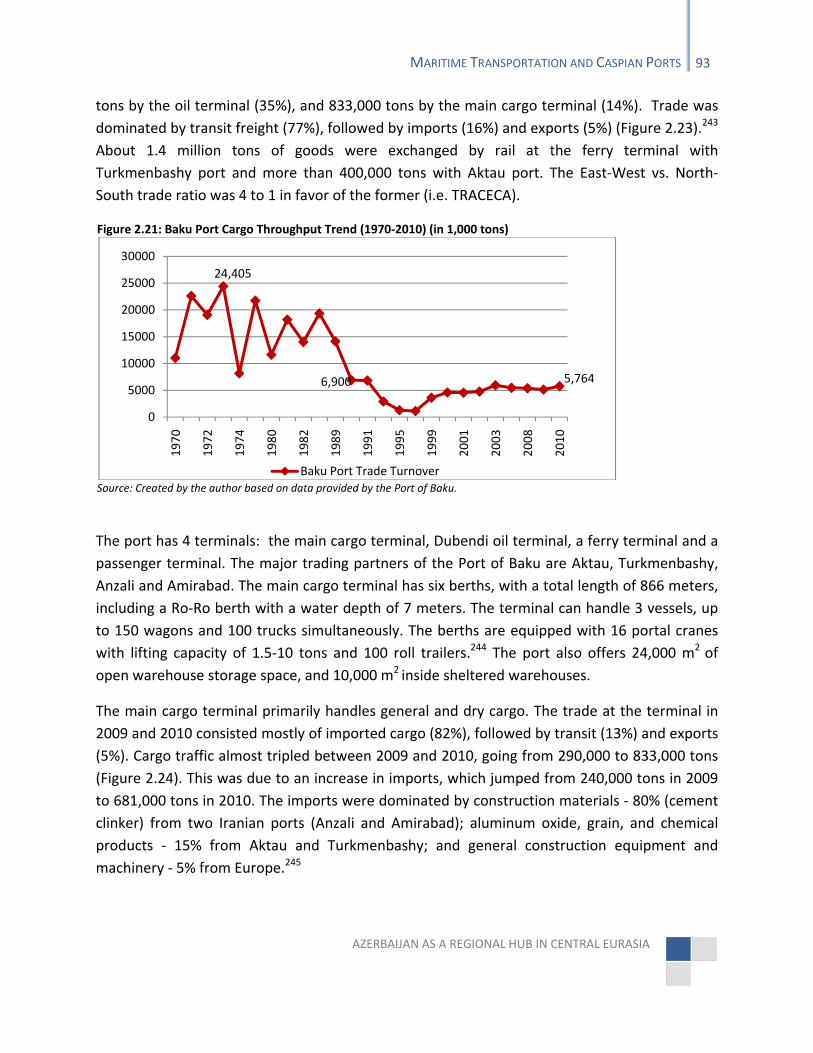
AZERBAIJAN AS A REGIONAL HUB IN CENTRAL EURASIA
MARITIME TRANSPORTATION AND CASPIAN PORTS 93
tons by the oil terminal (35%), and 833,000 tons by the main cargo terminal (14%). Trade was
dominated by transit freight (77%), followed by imports (16%) and exports (5%) (Figure 2.23).243
About 1.4 million tons of goods were exchanged by rail at the ferry terminal with
Turkmenbashy port and more than 400,000 tons with Aktau port. The East‐West vs. North‐
South trade ratio was 4 to 1 in favor of the former (i.e. TRACECA).
Figure 2.21: Baku Port Cargo Throughput Trend (1970‐2010) (in 1,000 tons)
Source: Created by the author based on data provided by the Port of Baku.
The port has 4 terminals: the main cargo terminal, Dubendi oil terminal, a ferry terminal and a
passenger terminal. The major trading partners of the Port of Baku are Aktau, Turkmenbashy,
Anzali and Amirabad. The main cargo terminal has six berths, with a total length of 866 meters,
including a Ro‐Ro berth with a water depth of 7 meters. The terminal can handle 3 vessels, up
to 150 wagons and 100 trucks simultaneously. The berths are equipped with 16 portal cranes
with lifting capacity of 1.5‐10 tons and 100 roll trailers.244 The port also offers 24,000 m2 of
open warehouse storage space, and 10,000 m2 inside sheltered warehouses.
The main cargo terminal primarily handles general and dry cargo. The trade at the terminal in
2009 and 2010 consisted mostly of imported cargo (82%), followed by transit (13%) and exports
(5%). Cargo traffic almost tripled between 2009 and 2010, going from 290,000 to 833,000 tons
(Figure 2.24). This was due to an increase in imports, which jumped from 240,000 tons in 2009
to 681,000 tons in 2010. The imports were dominated by construction materials ‐ 80% (cement
clinker) from two Iranian ports (Anzali and Amirabad); aluminum oxide, grain, and chemical
products ‐ 15% from Aktau and Turkmenbashy; and general construction equipment and
machinery ‐ 5% from Europe.245
24,405
6,900 5,764
0
5000
10000
15000
20000
25000
30000
1970
1972
1974
1980
1982
1989
1991
1995
1999
2001
2003
2008
2010
Baku Port Trade Turnover
STRATEGIC ASSESSMENT OF EURO‐ASIAN TRADE AND TRANSPORTATION
94 PART II
Figure 2.22: Cargo Traffic by Terminal (in 1,000 tons) Figure 2.23: Composition of Processed Cargo (in 1,000 tons)
Figure 2.24: Main Cargo Terminal Traffic (in 1,000 tons) Figure 2.25: Ferry Terminal Traffic (in 1,000 tons)
Figure 2.26: Oil Terminal Traffic (in 1,000 tons) Figure 2.27:Container Terminal Traffic (in Units)
Source: Created by the author based on the data provided by the Port of Baku
The ferry terminal at the Port of Baku is a key gateway in the Euro‐Asian transportation
network. Some 80% of its total trade is transit cargo, mainly from Kazakhstan and
290
2296 2545
17
833
2932
1999
98
0
500
1000
1500
2000
2500
3000
3500
Cargo Terminal
Ferry Terminal
Oil Terminal Container Terminal
2009
2010
250482
4568
85
5385
934313
4453
64
5762
0
1000
2000
3000
4000
5000
6000
7000
Import Export Transit Local TOTAL
2009
2010
240
24 23 3
290
681
41 1057
833
0
200
400
600
800
1000
Import Export Transit Local Total
2009
2010
134370
1792
2296
254 272
2406
2932
0
500
1000
1500
2000
2500
3000
3500
Import Export Transit Total
2009
2010
0 0
2496
49
2545
0 0
1942
57
1999
0
500
1000
1500
2000
2500
3000
Import Export Transit Local Total
2009
2010 3103
9626
0
2000
4000
6000
8000
10000
12000
2009 2010
2009
2010
AZERBAIJAN AS A REGIONAL HUB IN CENTRAL EURASIA
MARITIME TRANSPORTATION AND CASPIAN PORTS 95
Turkmenistan. Although the terminal’s annual cargo traffic is 8 million tons, the actual volume
of freight processed at the terminal is much smaller. In 2010, the terminal handled only 3
million tons of cargo, 82% of which were transit goods (Figure 2.25). Import and export volumes
were at similar levels, each contributing 9% to the total cargo exchange. Most of the exports
were destined for the Port of Turkmenbashy, with a smaller portion for the Port of Aktau. The
transit cargo at the ferry terminal consists of aluminum oxide, petroleum products, various
metals, cement, timber, construction materials and grain. The majority is being taken from East
to West, coming from Aktau and Turkmenbashy to Europe via Georgia’s Black Sea ports. The
cargo was transported by 9 CASPAR ferries, including 2 recently purchased (but still quite old)
Makhachkala type vessels, which can take up to 52 wagons and 100 cars.246
The Dubendi Oil Terminal handles about 35% of the trade at the Port of Baku. It is the largest oil
terminal on the Absheron Peninsula and can process up to 8 million tons of crude oil. The
terminal has 2 piers, allowing the simultaneous unloading of four 5,000‐13,000 DWT capacity
tankers. Almost all of the cargo traffic consists of transit crude oil from Kazakhstan and
Turkmenistan (97% in 2010). In 2010, the terminal processed 2 million tons of crude oil,
including 741,000 tons of Kazakh oil (37%) and 1.2 million tons of Turkmen oil (60%) (Figure
2.26).
Finally, the port’s container terminal recently saw a significant increase in traffic, thanks to the
NATO containers going to Afghanistan. Between 2009 and 2010 alone, the number of
containers processed at the Port of Baku has more than tripled, going from 3,103 units (3,172
TEU) to 9,626 (16,521 TEU) (Figure 2.27). About 99% of these containers are NATO
humanitarian containers for Afghanistan. Some of these containers arrive directly from Poti
port in Georgia, either by rail or by truck (about 11,000 TEU),247 and the remaining containers
arrive on trucks from various Mediterranean ports in Turkey. NATO containers are taken to
Aktau mostly on CASPAR dry cargo ships. The average price of shipping a 20 ft container from
Baku to Aktau and Turkmenbashy on a CASPAR ship is between $300 and $450. Once the Port
of Baku is relocated to its new site near Alyat (by 2015), its container throughput is likely to
increase.
Aktau
Aktau is Kazakhstan’s major Caspian Sea port. Along with the Port of Turkmenbashy, it is also
Azerbaijan’s gateway to the Central Asian and East Asian markets as a part of the TRACECA
route. The development of this port has important strategic implications for Azerbaijan’s future
transport links with Central and East Asia, particularly China.
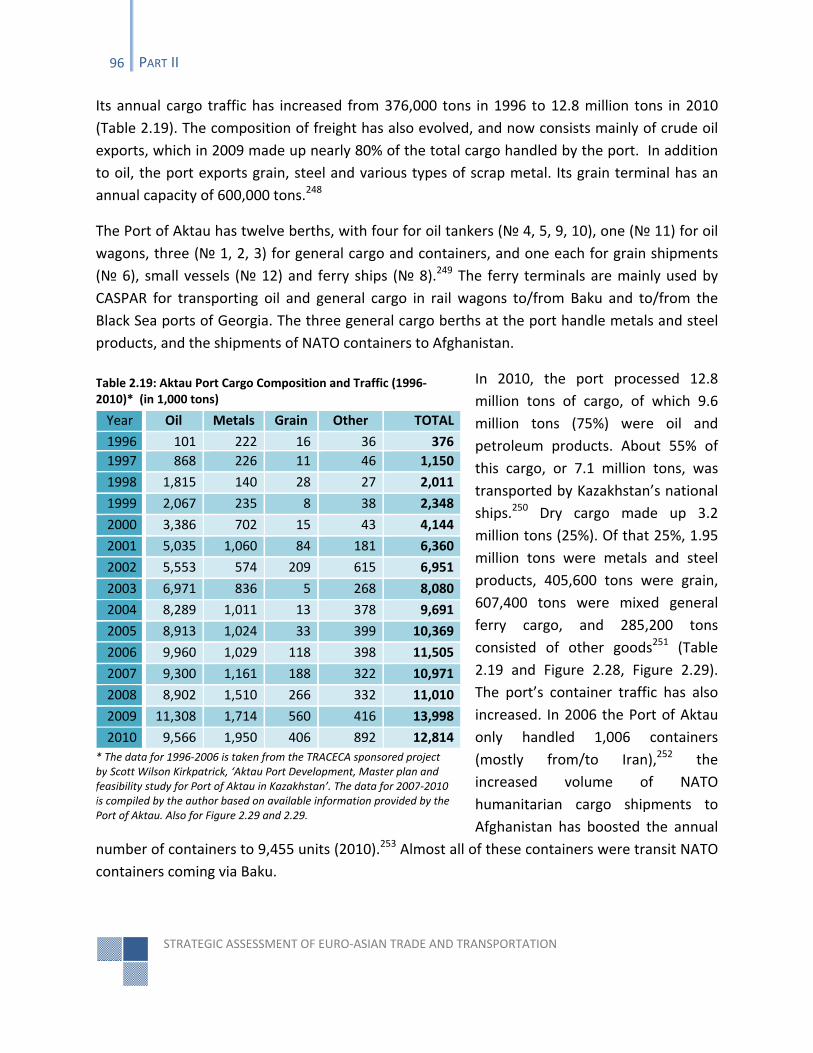
STRATEGIC ASSESSMENT OF EURO‐ASIAN TRADE AND TRANSPORTATION
96 PART II
Its annual cargo traffic has increased from 376,000 tons in 1996 to 12.8 million tons in 2010
(Table 2.19). The composition of freight has also evolved, and now consists mainly of crude oil
exports, which in 2009 made up nearly 80% of the total cargo handled by the port. In addition
to oil, the port exports grain, steel and various types of scrap metal. Its grain terminal has an
annual capacity of 600,000 tons.248
The Port of Aktau has twelve berths, with four for oil tankers (№ 4, 5, 9, 10), one (№ 11) for oil
wagons, three (№ 1, 2, 3) for general cargo and containers, and one each for grain shipments
(№ 6), small vessels (№ 12) and ferry ships (№ 8).249 The ferry terminals are mainly used by
CASPAR for transporting oil and general cargo in rail wagons to/from Baku and to/from the
Black Sea ports of Georgia. The three general cargo berths at the port handle metals and steel
products, and the shipments of NATO containers to Afghanistan.
In 2010, the port processed 12.8
million tons of cargo, of which 9.6
million tons (75%) were oil and
petroleum products. About 55% of
this cargo, or 7.1 million tons, was
transported by Kazakhstan’s national
ships.250 Dry cargo made up 3.2
million tons (25%). Of that 25%, 1.95
million tons were metals and steel
products, 405,600 tons were grain,
607,400 tons were mixed general
ferry cargo, and 285,200 tons
consisted of other goods251 (Table
2.19 and Figure 2.28, Figure 2.29).
The port’s container traffic has also
increased. In 2006 the Port of Aktau
only handled 1,006 containers
(mostly from/to Iran),252 the
increased volume of NATO
humanitarian cargo shipments to
Afghanistan has boosted the annual
number of containers to 9,455 units (2010).253 Almost all of these containers were transit NATO
containers coming via Baku.
Table 2.19: Aktau Port Cargo Composition and Traffic (1996‐2010)* (in 1,000 tons)
Year Oil Metals Grain Other TOTAL
1996 101 222 16 36 376
1997 868 226 11 46 1,150
1998 1,815 140 28 27 2,011
1999 2,067 235 8 38 2,348
2000 3,386 702 15 43 4,144
2001 5,035 1,060 84 181 6,360
2002 5,553 574 209 615 6,951
2003 6,971 836 5 268 8,080
2004 8,289 1,011 13 378 9,691
2005 8,913 1,024 33 399 10,369
2006 9,960 1,029 118 398 11,505
2007 9,300 1,161 188 322 10,971
2008 8,902 1,510 266 332 11,010
2009 11,308 1,714 560 416 13,998
2010 9,566 1,950 406 892 12,814
* The data for 1996‐2006 is taken from the TRACECA sponsored project by Scott Wilson Kirkpatrick, ‘Aktau Port Development, Master plan and feasibility study for Port of Aktau in Kazakhstan’. The data for 2007‐2010 is compiled by the author based on available information provided by the Port of Aktau. Also for Figure 2.29 and 2.29.
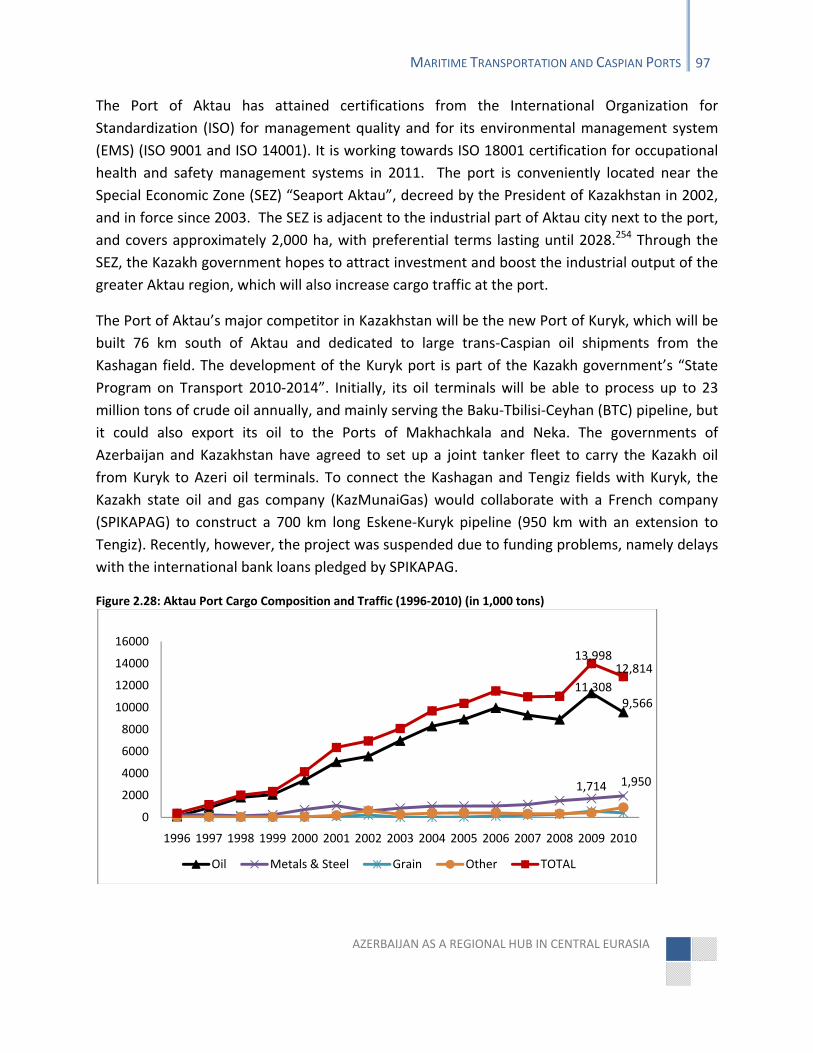
AZERBAIJAN AS A REGIONAL HUB IN CENTRAL EURASIA
MARITIME TRANSPORTATION AND CASPIAN PORTS 97
The Port of Aktau has attained certifications from the International Organization for
Standardization (ISO) for management quality and for its environmental management system
(EMS) (ISO 9001 and ISO 14001). It is working towards ISO 18001 certification for occupational
health and safety management systems in 2011. The port is conveniently located near the
Special Economic Zone (SEZ) “Seaport Aktau”, decreed by the President of Kazakhstan in 2002,
and in force since 2003. The SEZ is adjacent to the industrial part of Aktau city next to the port,
and covers approximately 2,000 ha, with preferential terms lasting until 2028.254 Through the
SEZ, the Kazakh government hopes to attract investment and boost the industrial output of the
greater Aktau region, which will also increase cargo traffic at the port.
The Port of Aktau’s major competitor in Kazakhstan will be the new Port of Kuryk, which will be
built 76 km south of Aktau and dedicated to large trans‐Caspian oil shipments from the
Kashagan field. The development of the Kuryk port is part of the Kazakh government’s “State
Program on Transport 2010‐2014”. Initially, its oil terminals will be able to process up to 23
million tons of crude oil annually, and mainly serving the Baku‐Tbilisi‐Ceyhan (BTC) pipeline, but
it could also export its oil to the Ports of Makhachkala and Neka. The governments of
Azerbaijan and Kazakhstan have agreed to set up a joint tanker fleet to carry the Kazakh oil
from Kuryk to Azeri oil terminals. To connect the Kashagan and Tengiz fields with Kuryk, the
Kazakh state oil and gas company (KazMunaiGas) would collaborate with a French company
(SPIKAPAG) to construct a 700 km long Eskene‐Kuryk pipeline (950 km with an extension to
Tengiz). Recently, however, the project was suspended due to funding problems, namely delays
with the international bank loans pledged by SPIKAPAG.
Figure 2.28: Aktau Port Cargo Composition and Traffic (1996‐2010) (in 1,000 tons)
11,3089,566
1,714 1,950
13,99812,814
0
2000
4000
6000
8000
10000
12000
14000
16000
1996 1997 1998 1999 2000 2001 2002 2003 2004 2005 2006 2007 2008 2009 2010
Oil Metals & Steel Grain Other TOTAL
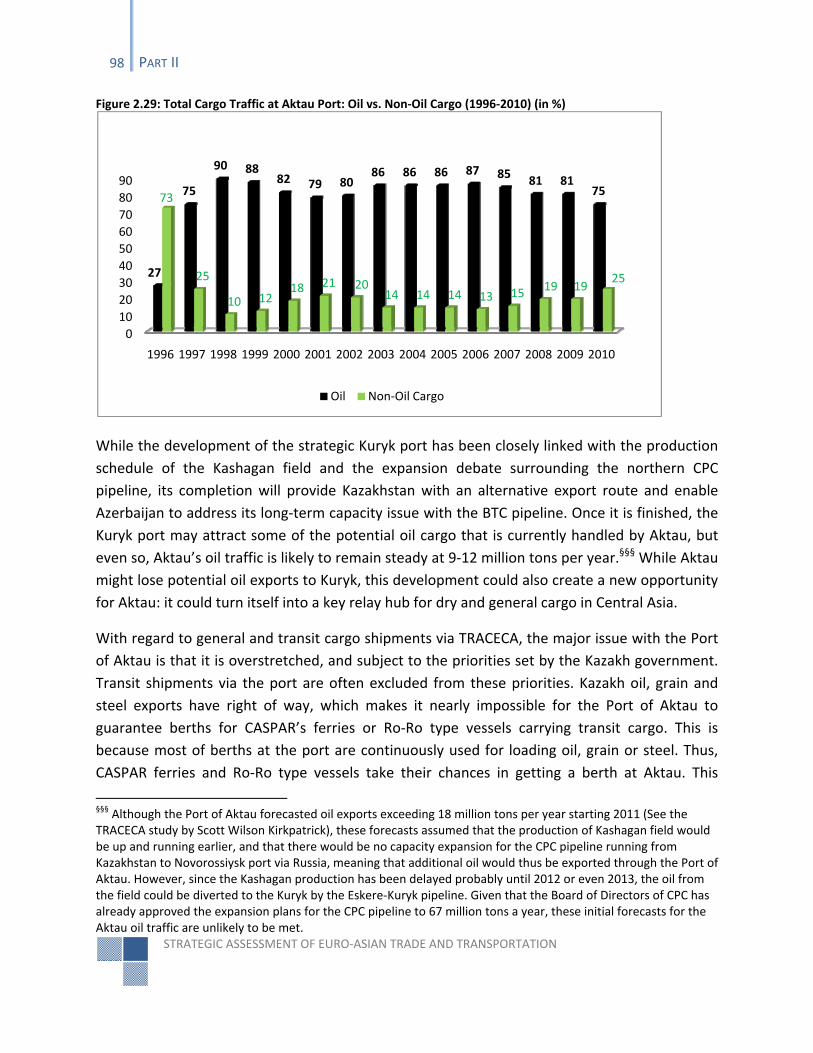
STRATEGIC ASSESSMENT OF EURO‐ASIAN TRADE AND TRANSPORTATION
98 PART II
Figure 2.29: Total Cargo Traffic at Aktau Port: Oil vs. Non‐Oil Cargo (1996‐2010) (in %)
While the development of the strategic Kuryk port has been closely linked with the production
schedule of the Kashagan field and the expansion debate surrounding the northern CPC
pipeline, its completion will provide Kazakhstan with an alternative export route and enable
Azerbaijan to address its long‐term capacity issue with the BTC pipeline. Once it is finished, the
Kuryk port may attract some of the potential oil cargo that is currently handled by Aktau, but
even so, Aktau’s oil traffic is likely to remain steady at 9‐12 million tons per year.§§§ While Aktau
might lose potential oil exports to Kuryk, this development could also create a new opportunity
for Aktau: it could turn itself into a key relay hub for dry and general cargo in Central Asia.
With regard to general and transit cargo shipments via TRACECA, the major issue with the Port
of Aktau is that it is overstretched, and subject to the priorities set by the Kazakh government.
Transit shipments via the port are often excluded from these priorities. Kazakh oil, grain and
steel exports have right of way, which makes it nearly impossible for the Port of Aktau to
guarantee berths for CASPAR’s ferries or Ro‐Ro type vessels carrying transit cargo. This is
because most of berths at the port are continuously used for loading oil, grain or steel. Thus,
CASPAR ferries and Ro‐Ro type vessels take their chances in getting a berth at Aktau. This
§§§ Although the Port of Aktau forecasted oil exports exceeding 18 million tons per year starting 2011 (See the TRACECA study by Scott Wilson Kirkpatrick), these forecasts assumed that the production of Kashagan field would be up and running earlier, and that there would be no capacity expansion for the CPC pipeline running from Kazakhstan to Novorossiysk port via Russia, meaning that additional oil would thus be exported through the Port of Aktau. However, since the Kashagan production has been delayed probably until 2012 or even 2013, the oil from the field could be diverted to the Kuryk by the Eskere‐Kuryk pipeline. Given that the Board of Directors of CPC has already approved the expansion plans for the CPC pipeline to 67 million tons a year, these initial forecasts for the Aktau oil traffic are unlikely to be met.
0
10
20
30
40
50
60
70
80
90
1996 1997 1998 1999 2000 2001 2002 2003 2004 2005 2006 2007 2008 2009 2010
27
75
90 8882 79 80
86 86 86 87 8581 81
7573
25
10 1218 21 20
14 14 14 13 1519 19
25
Oil Non‐Oil Cargo
AZERBAIJAN AS A REGIONAL HUB IN CENTRAL EURASIA
MARITIME TRANSPORTATION AND CASPIAN PORTS 99
creates backlogs not only in Aktau (both for unloading and loading of awaiting wagons and
trucks) but also in Baku, where trucks and wagons are sometimes forced to wait up to 4 days to
board an available vessel. Moreover, because Ro‐Ro type ships have an even smaller chance of
getting a berth at Aktau (the only berth capable receiving Ro‐Ro type ship is berth № 6, which is
dedicated to grain shipments), CASPAR ends up carrying trucks along with wagons, and as a
consequence, fewer trucks manage to cross the Caspian Sea on each trip. In addition, because
of the congestion at the Aktau Port railway station, the wagons awaiting discharge experience
significant delays ‐ at times, up to 4 days.255
The TRACECA sponsored masterplan and feasibility study conducted in 2007 by Scott Wilson
Kirkpatrick highlighted the current and potential shortfalls in the berth capacity at the Port of
Aktau. Given that the general cargo berths (№ 1, 2, 3) mostly serve metals and steel exports,
and berth № 6 is dedicated to grain exports, the study suggested upgrading berth № 12 and
reserving it for container shipments. This would enable the port to process up to 40,000 TEU
per year. The study proposed two additional solutions: to upgrade the capacity of existing
berths and to expand the port to the north.256 The new extension, the “North Port”, will have 7
berths (4 for oil and 3 for dry cargo) over an area of 35 ha, which will double Aktau’s capacity to
process oil and non‐oil freight, and transit cargo.257 The total cost of the project is estimated at
$300 million, of which $100 million is coming from “Kazakhstan Development Bank” JSC. The
phased construction work started in 2006 and the hydraulic engineering (mole) structure was
completed in 2009, with the breakwater to be finished in 2011. The government of Kazakhstan
decided to continue dredging operations, and to build additional 3 dry‐cargo terminals,
including a grain terminal. The total capacity of the proposed dry cargo terminals will be 2
million tons, which will raise the port’s annual dry cargo capacity to 4 million tons.258
The development of the SEZ in Aktau will have a positive impact on the port’s future cargo
traffic. Baku should consider investing in both the SEZ and the “North Port” terminals to help
harmonize traffic flow between Baku and Aktau. In addition, the Kazakh and Azerbaijani
authorities need to collaborate closely to create better conditions for international truck
transit. Currently, over 95% of international trucks going to Central Asia (mostly Turkish), an
estimated 30,000‐50,000 per year, do not use the TRACECA route; they go through Russia or
Iran.
Turkmenbashy
The Port of Turkmenbashy in Turkmenistan is Azerbaijan’s second strategic gateway in Central
Asia. The port stretches over 42 ha, along 1.5 km of coast. It has six berths for oil cargo, five for
general and dry cargo, and one ferry berth. In 1997, the European Bank for Reconstruction and
STRATEGIC ASSESSMENT OF EURO‐ASIAN TRADE AND TRANSPORTATION
100 PART II
Development (EBRD) approved a $30 million loan for upgrading the port’s infrastructure. As a
result, since 2000, the port has modernized its loading cranes, ferry terminals, storage areas,
and roads, in line with international standards.
The majority of cargo processed at Turkmenbashy and Alaja jetty is comprised of oil and
petroleum products. The annual oil exports of the four major international energy companies
operating in the Turkmen area of the Caspian Sea totaled 2.6 million tons in 2010.259 Since
there is no oil pipeline running out of Turkmenistan, apart from one used to carry crude oil
from Kazakhstan and Uzbekistan to the Seidi refinery in the north‐east, all oil output is either
marketed directly as a crude oil or sent to either of two refineries, one of which is located in
Turkmenbashy. Thus Turkmenbashy exports significant volume of both crude oil and refined
petroleum products.
In 2010, the port handled about 9 million tons of cargo, of which 5.6 million tons (63%) were oil
and petroleum products (Figure 2.30). The oil is exported from three locations: either the Port
of Turkmenbashy, or oil jetties at Alaja and Ekerem. In 2010, out of 5.6 million tons of oil and
petroleum products, Turkmenbashy port handled 3.1 million tons (56%), and the Alaja and the
Ekerem jetties exported 1.7 million tons (30%) and 776,600 tons respectively (Figure 2.31). The
oil output at Alaja jetty has increased from 1.4 million tons (24%) in 2008 to 1.7 million in 2010.
This was largely due to a steady growth in the output of Dragon Oil, a major international
energy company responsible for oil extraction in the Turkmen segment of the Caspian Sea. Out
of the 1.7 million tons of oil exported from the Alaja jetty, 1.5 million tons were produced by
Dragon Oil.260
Prior to July 2010, most of Turkmenistan’s oil exports went to the Iranian Port of Neka, which
had swap agreements with international oil companies operating in Turkmenistan. In the first
half of 2010, the volume of Turkmen oil exported to Neka port was about 900,000 tons;
however, the Iranian government has ended the swap agreements with international oil firms
in the Caspian. The flow of Turkmen crude oil has been redirected to Baku and Makhachkala.261
From there, Turkmen oil is either pumped to the Black Sea ports by pipeline, or carried by rail.
Some of the oil and petroleum products are exported to the European Union (i.e. Romania and
Bulgaria) and Turkey via the Volga‐Don canal and the Black Sea.262
In 2009, the Port of Baku handled 1.26 million tons of Turkmen oil (50% of the total oil traffic),
while in 2010 this number stood at 1.2 million tons (60% of the total oil traffic).263 Dragon Oil
reported production figures of 1.5 million tons of crude oil in 2010, of which about 60% was
delivered to world markets via Azerbaijan’s ports and terminals (the remainder was sold
through swap arrangement with Iran, which lasted until July 2010). 264 Compare this with the
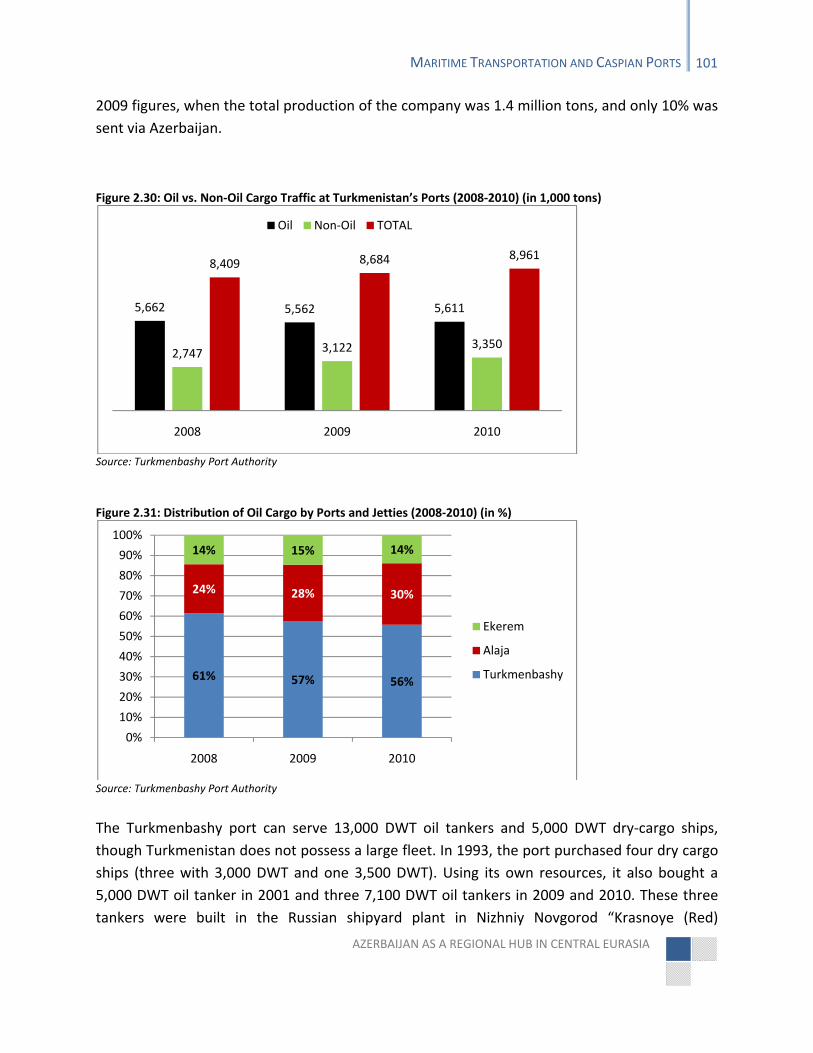
AZERBAIJAN AS A REGIONAL HUB IN CENTRAL EURASIA
MARITIME TRANSPORTATION AND CASPIAN PORTS 101
2009 figures, when the total production of the company was 1.4 million tons, and only 10% was
sent via Azerbaijan.
Figure 2.30: Oil vs. Non‐Oil Cargo Traffic at Turkmenistan’s Ports (2008‐2010) (in 1,000 tons)
Source: Turkmenbashy Port Authority
Figure 2.31: Distribution of Oil Cargo by Ports and Jetties (2008‐2010) (in %)
Source: Turkmenbashy Port Authority
The Turkmenbashy port can serve 13,000 DWT oil tankers and 5,000 DWT dry‐cargo ships,
though Turkmenistan does not possess a large fleet. In 1993, the port purchased four dry cargo
ships (three with 3,000 DWT and one 3,500 DWT). Using its own resources, it also bought a
5,000 DWT oil tanker in 2001 and three 7,100 DWT oil tankers in 2009 and 2010. These three
tankers were built in the Russian shipyard plant in Nizhniy Novgorod “Krasnoye (Red)
5,662 5,562 5,611
2,747 3,122 3,350
8,409 8,684 8,961
2008 2009 2010
Oil Non‐Oil TOTAL
61% 57% 56%
24% 28% 30%
14% 15% 14%
0%
10%
20%
30%
40%
50%
60%
70%
80%
90%
100%
2008 2009 2010
Ekerem
Alaja
Turkmenbashy
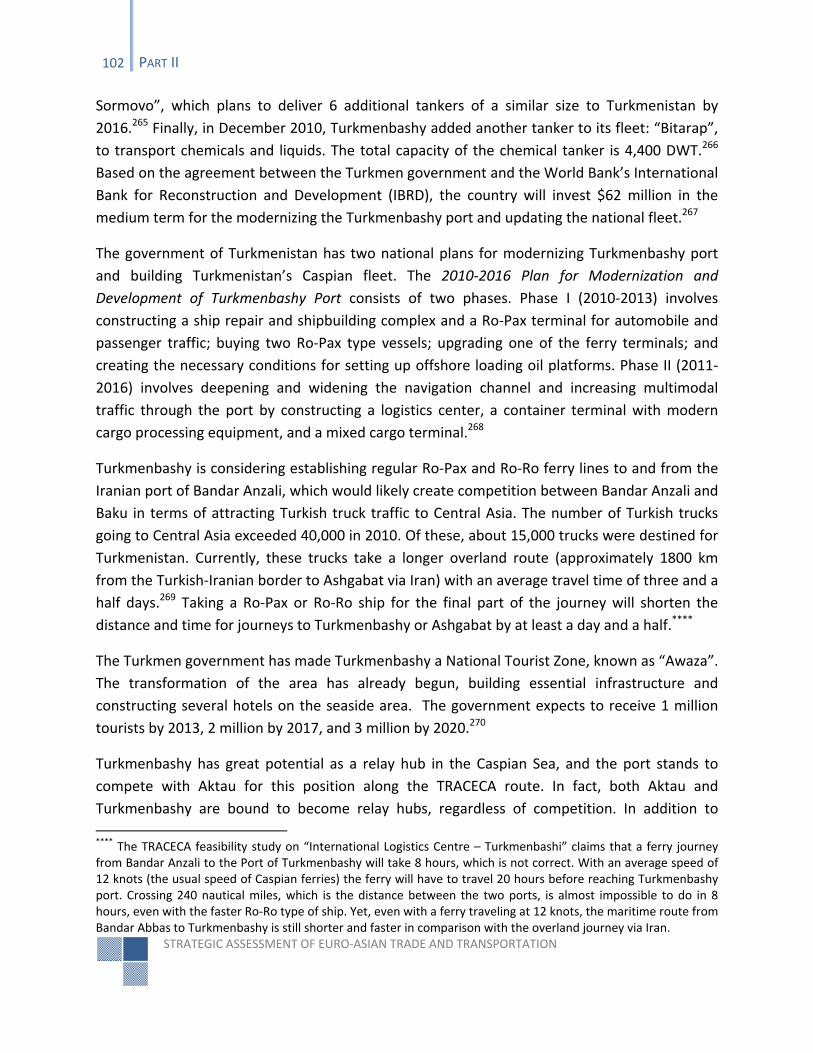
STRATEGIC ASSESSMENT OF EURO‐ASIAN TRADE AND TRANSPORTATION
102 PART II
Sormovo”, which plans to deliver 6 additional tankers of a similar size to Turkmenistan by
2016.265 Finally, in December 2010, Turkmenbashy added another tanker to its fleet: “Bitarap”,
to transport chemicals and liquids. The total capacity of the chemical tanker is 4,400 DWT.266
Based on the agreement between the Turkmen government and the World Bank’s International
Bank for Reconstruction and Development (IBRD), the country will invest $62 million in the
medium term for the modernizing the Turkmenbashy port and updating the national fleet.267
The government of Turkmenistan has two national plans for modernizing Turkmenbashy port
and building Turkmenistan’s Caspian fleet. The 2010‐2016 Plan for Modernization and
Development of Turkmenbashy Port consists of two phases. Phase I (2010‐2013) involves
constructing a ship repair and shipbuilding complex and a Ro‐Pax terminal for automobile and
passenger traffic; buying two Ro‐Pax type vessels; upgrading one of the ferry terminals; and
creating the necessary conditions for setting up offshore loading oil platforms. Phase II (2011‐
2016) involves deepening and widening the navigation channel and increasing multimodal
traffic through the port by constructing a logistics center, a container terminal with modern
cargo processing equipment, and a mixed cargo terminal.268
Turkmenbashy is considering establishing regular Ro‐Pax and Ro‐Ro ferry lines to and from the
Iranian port of Bandar Anzali, which would likely create competition between Bandar Anzali and
Baku in terms of attracting Turkish truck traffic to Central Asia. The number of Turkish trucks
going to Central Asia exceeded 40,000 in 2010. Of these, about 15,000 trucks were destined for
Turkmenistan. Currently, these trucks take a longer overland route (approximately 1800 km
from the Turkish‐Iranian border to Ashgabat via Iran) with an average travel time of three and a
half days.269 Taking a Ro‐Pax or Ro‐Ro ship for the final part of the journey will shorten the
distance and time for journeys to Turkmenbashy or Ashgabat by at least a day and a half.****
The Turkmen government has made Turkmenbashy a National Tourist Zone, known as “Awaza”.
The transformation of the area has already begun, building essential infrastructure and
constructing several hotels on the seaside area. The government expects to receive 1 million
tourists by 2013, 2 million by 2017, and 3 million by 2020.270
Turkmenbashy has great potential as a relay hub in the Caspian Sea, and the port stands to
compete with Aktau for this position along the TRACECA route. In fact, both Aktau and
Turkmenbashy are bound to become relay hubs, regardless of competition. In addition to
**** The TRACECA feasibility study on “International Logistics Centre – Turkmenbashi” claims that a ferry journey from Bandar Anzali to the Port of Turkmenbashy will take 8 hours, which is not correct. With an average speed of 12 knots (the usual speed of Caspian ferries) the ferry will have to travel 20 hours before reaching Turkmenbashy port. Crossing 240 nautical miles, which is the distance between the two ports, is almost impossible to do in 8 hours, even with the faster Ro‐Ro type of ship. Yet, even with a ferry traveling at 12 knots, the maritime route from Bandar Abbas to Turkmenbashy is still shorter and faster in comparison with the overland journey via Iran.
AZERBAIJAN AS A REGIONAL HUB IN CENTRAL EURASIA
MARITIME TRANSPORTATION AND CASPIAN PORTS 103
becoming a major player in crude oil and petroleum exports, Turkmenbashy is better
positioned to handle transit cargo by rail and truck to Afghanistan, Central Asia, and also China.
However, it is still necessary to improve the locomotive and railcar fleet of Turkmen railways, to
meet the growing demand for transit shipments by rail. The Turkmen government is in
negotiations with China for the purchase of 40 locomotives, which will help to boost the
country’s rail transit.
The Port of Baku is, and will remain, Turkmenistan’s major non‐oil trading partner. In time,
Baku will become Turkmenistan’s main gateway to Europe, while Turkmenbashy will serve as
Azerbaijan’s gateway to Asia. The two ports will inevitably become interlinked and increasingly
interdependent as transit cargo via TRACECA grows. Baku and Ashgabat should, therefore,
better coordinate their strategies and port expansion plans. Their success will determine the
success of the Euro‐Asian supply chain, of which both Baku and Turkmenbashy are crucial
components.
Astrakhan††††
Moscow is promoting two major Russian ports as a part of the North‐South Corridor: Astrakhan
and Ola. Both ports are situated close to Russia’s national rail and highway networks, thereby
enabling transfers of transit cargo via truck or rail from the Astrakhan region to Europe. It takes
less than a week for cargo to be transported between Astrakhan to Finland or Germany by
truck (Astrakhan‐Moscow: 2 days; Astrakhan‐Helsinki: 4 days; Astrakhan‐Berlin: 5 days.271
The Russian government has made a deliberate decision to move away from using foreign ports
to export Russian goods and products, instead shipping them via Russian ports. Thus, between
2005 and 2008, the share of Russian goods shipped via ports in Ukraine, Finland and the Baltic
Sea region has declined from 25% to 16%.272 In 2010, the total cargo traffic across all Russian
ports reached 526 million tons, of which about 180 million tons was handled by the South Basin
Russian ports, including the Black Sea and Caspian Sea ports. Out of this 180 million, liquids
constituted 64% (116 million tons) of the total cargo, and dry cargo made up the remaining 36%
(64 million tons). 273 The majority of the cargo was processed by Russia’s Black Sea ports. The
three Caspian ports of Astrakhan, Ola and Makhachkala together processed approximately 11
million tons of freight, or about 6% of the total cargo traffic handled by Russia’s South Basin
ports. The Ports of Astrakhan and Makhachkala processed 5 million tons of cargo each in 2010.
†††† The use of term “Port of Astrakhan” refers to all ports and terminals located in the city of Astrakhan and owned by the Russian government or joint‐stock companies, including the main Astrakhan Sea Port. It does not include the Port of Ola, though the latter is also located within the Astrakhan region.
STRATEGIC ASSESSMENT OF EURO‐ASIAN TRADE AND TRANSPORTATION
104 PART II
Iran is the primary foreign trading partner of the Astrakhan region and the Port of Astrakhan. In
the late 1980s, Astrakhan port’s annual cargo traffic stood at about 12 million tons, of which
only about 200,000 tons was international transit from Europe to Iran.274Iran’s share in the
Astrakhan port trade grew significantly. In 2008, the Port of Astrakhan handled more than 3
million tons of cargo, of which 70% (over 2 million tons) was destined for Iran275, giving a trade
turnover worth $180 million (up from $160 million in 2007).276 In the first five months of 2010,
this figure reached $120 million.277 In 2009, more than 4.6 million tons of goods (almost 90% of
total cargo traffic) were exported to Iran from the Ports of Astrakhan and Ola278, which makes
Iran a vital trading partner for both ports.
There are around 130 Iranian companies registered in Astrakhan, and Iran is a major foreign
trade partner in the Astrakhan region, accounting for 20% of the region’s total foreign trade.279
In 2008, Iran invested $1.5 billion in the Astrakhan region, of which $400 million came from
direct investments.280 In 2010, the Iranian company “Khazar Sea Shipping Lines” bought 40%
shares in “Solyanka” port, part of the Port of Astrakhan. In the same year, the Russian
government rejected a bid by “Khazar Sea Shipping Lines” to purchase another Astrakhan port,
“Alfa‐Port”. The Russian officials based their decision on the fact that the company was listed
under the “blacklisted” Iranian firms in the UN economic sanctions against Iran, and because
the company failed to disclose its ownership structure. The Russian government believes it is
owned by the Iranian government.281
The trade turnover at the Port of Astrakhan during the first half of 2010 totaled 2.65 million
tons, of which exports were 2.44 million tons (92%), imports were 75,400 tons (3%) and coastal
trade with other Russian ports (cabotage) accounted for 131,200 tons (5%). Exports were
comprised of ferrous metals (1.9 million tons or 78%), timber (179,800 tons or 8%), petroleum
products (139,600 tons or 6%), grain (127,500 tons or 5%) and other general cargo (75,700 tons
or 3%). The port handled 2,847 TEU, of which 1,194 TEU were for export and 1,653 TEU for
import.282
The northern parts of the Caspian Sea are often frozen between November and March, which
means that the Ports of Astrakhan and Ola face interruptions during the winter season. The
average duration of the freeze is 100 days, with a maximum of 148 days and minimum of 56
days. 283 In the areas by the Volga River delta, the thickness of ice can reach 120 cm, while the
average seasonal thickness is usually about 70 cm.284 During this time, ships can only navigate
the area with the help of icebreakers. The ice‐free period lasts longer at the Port of Ola, 326
days a year according to port officials.285 Even so, during the freezing season the cost of cargo
transportation from Astrakhan and Ola ports increases by at least $10 per ton, which is a
significant disadvantage for these ports.
AZERBAIJAN AS A REGIONAL HUB IN CENTRAL EURASIA
MARITIME TRANSPORTATION AND CASPIAN PORTS 105
Although the Port of Astrakhan continues to dominate in transportation of non‐liquid freight
between the three Russian ports on the Caspian, its future remains uncertain. Its importance
has declined over time, and the Russian government has chosen to focus on developing the
Port of Ola. The Port of Astrakhan has no room for further expansion, and Ola is in a better
position to act as a gateway for the North‐South and the East‐West routes in the long term,
though it has yet to take on this role.
Ola
Located in the Astrakhan region, the Port of Ola is a relatively new port (operations started in
1997). It processes the smallest volume of freight in comparison to the ports of Astrakhan and
Makhachkala. Nonetheless, in the long term, it is the most promising of all Russian ports in the
Caspian Sea. The port has been deemed one of the country’s important Federal facilities, and is
part of the Federal Program on “Modernization of Transport System of Russia (2002 – 2010).”
The Russian government aims to make the Port of Ola a multimodal “hub” port in the northern
Caspian, and to increase its annual cargo handling capacity to 4 million in the short term and 8
million in the medium term.286 Currently, the port can process up to 1 million tons of freight. It
has a container terminal with an annual capacity of 400,000 tons or 45,000 TEU and a new
500,000‐ton grain terminal. By 2014, a general cargo and Ro‐Ro terminal for large freight
shipments and a terminal for handling various vegetable oils (100,000 tons per year) will be
built. An oil terminal and a bulk terminal are also planned. Until 2015, some of the terminals of
the current Port of Astrakhan will be relocated to Ola, and if the port reaches an annual
turnover of 20 million tons, it could be awarded the status of Special Economic Zone (SEZ).287
The Port of Ola mainly processes ferrous metals, grain, gravel, timber and other dry cargo. In
the first half of 2010, it handled 451,600 tons. Exports constituted the major part of this trade
(404,300 tons), whereas imports were only 2,100 tons, and coastal trade with other Russian
ports (cabotage) stood at 45,200 tons. The export was dominated by ferrous metals (366,500
tons or 90%), followed by grain (23,900 tons or 6%), timber (5,500 tons or 1%), RO‐RO cargo
(2,600 tons or 0.6%) and other general cargo (5,800 tons or 2.4%). The container shipments
were modest, 143 TEU in total, of which 24 TEU were for export and 119 TEU for import.288 The
water depth at the Port of Ola is 5 – 5.5 meters, allowing it to receive 5,500 ton cargo ships and
oil tankers.
Ola acts as an important gateway for Iranian companies interested in exporting Russian grain to
third countries via Iranian territory. The Russian government plans to grow 140 million tons of
grain by 2015, of which 40‐45 million tons will be for export.289 An Iranian company, Kaveh
Marine and Services (KMS), has already expressed its interest in investing in Port Ola’s
STRATEGIC ASSESSMENT OF EURO‐ASIAN TRADE AND TRANSPORTATION
106 PART II
infrastructure in order to export Russian grain to African countries via Iran.290 The Port of
Amirabad in Iran has been expanding its grain terminal in order to accommodate the potential
increase in grain exports from Kazakhstan and Russia via Iran.
Makhachkala
The Port of Makhachkala is the only ice‐free Russian port in the Caspian Sea. It is located in the
Dagestan Republic, which borders Azerbaijan to the north. The port has five berths, capable
handling 12,000 DWT tankers, with a water depth of around 9 meters. At the moment, the port
can process up to 7.9 million tons of crude oil and liquids, 1.5 million tons of minerals and
construction materials, 400,000 tons of general cargo and forestry products. In 2010, the port
increased its oil traffic, when Turkmen crude oil exports were redirected from Iran to other
ports in the Caspian Sea. The transit oil is taken from Makhachkala port to the Russian pipeline
that goes to Novorossiysk in the Black Sea. In 2010, the port processed 5 million tons of
cargo.291 Between January and November 2010, the crude oil and other liquid goods already
made up 3.7 million tons.292In addition to oil and liquid products, the port processes
construction and forestry materials, such as gravel and timber. Through the Makhachkala rail
station, the port also has access to the regional and national railway networks of Russia.
However, the lack of infrastructure at the Port of Makhachkala limits its capacity to process
general and dry cargo, which makes up only 25% of the total freight it processes. The Russian
government plans to modernize this port in order to increase its liquid cargo capacity to 15
million tons by 2015 (up from the current maximum capacity of 7.9 million tons) and to develop
its rail‐to‐ferry links with other Caspian ports.293 Russia conceives the development of this port
in conjunction with the development of the Port of Ola. On the other hand, due to political
instability in the Dagestan Republic, the prospect of Makhachkala becoming a successful non‐
liquid ‘hub’ remains uncertain. Hence, Makhachkala is better positioned to serve as a relay port
for oil transfers from Kazakhstan and Turkmenistan to the Black Sea ports of Russia. There is
already a plan to upgrade the port’s terminals to accommodate the Panamax type oil tankers
(63,000 tons of deadweight (DWT))‐294 though the viability of using such types of oil tankers in
the volatile Caspian Sea is disputed.‡‡‡‡
‡‡‡‡ Skeptics often state that the use of the Panamax type oil tankers with such a large deadweight in the Caspian Sea is not feasible. Firstly, they argue that a 63,000‐ton tanker would need a loading buoy called a Single Point Mooring (SPM), which is anchored offshore to make it possible for a tanker to load or unload oil without approaching an oil terminal. There are currently no SPMs in the Caspian Sea. However, Kazakhstan is planning to have an offshore loading buoy at its new Kuryk Oil Port (on the Caspian) for the transportation of Kazakh oil from the Kashagan field. This will allow tankers with larger DWT to load and unload offshore. The second argument against the Panamax type of ships is that the Caspian Sea is very volatile and shallow in some parts, which makes it
AZERBAIJAN AS A REGIONAL HUB IN CENTRAL EURASIA
MARITIME TRANSPORTATION AND CASPIAN PORTS 107
Iranian Ports§§§§
Maritime transportation constitutes an important part of Iran’s economy. According to data
from Iran’s Ports and Maritime Organization (PMO), Iran processed 114 million tons of cargo in
2008, 131 million in 2009, and 138 million in 2010. The volume of non‐oil cargo handled by all
Iranian ports stood at 73 million tons (64%) in 2008, 86 million (66%) in 2009, and 96 million
(69%) in 2010. Of total non‐oil cargo, imports constituted 44 million tons (2008), 46 million tons
(2009) and 46 million tons (2010); and exports were 19 million tons (2008), 25 million tons
(2009) and 34 million tons (2010). The container turnover across all Iranian ports has increased
more than fivefold since 2000, and reached nearly 3 million TEU in 2010 (Figure 2.32).
Although Iran conducts most of its maritime trade in the Persian Gulf, its four Caspian Sea ports
– Anzali, Amirabad, Nowshahr, and Neka – account for 11% (2009 figure) of the country’s total
maritime trade. The contribution of the four ports has gradually increased from 10 million tons
of cargo processed in 2004 to nearly 15 million tons in 2009 (Figure 2.33). While this upward
trend is likely to continue in the near future, Azerbaijan has so far been unable to capture a
share of this growing maritime trade in the North‐South direction. About 80% of imports at the
Port of Baku are from Iran, and they are primarily construction materials.
Iran plans to open another private Caspian port in the Iranian city of Astara, which borders the
Azerbaijani city of the same name. In 2009, Iran’s Ports and Maritime Organization (PMO) and
Kaveh Marine and Services (KMS) signed an agreement, whereby the latter was given the right
to construct and operate the port under a 40‐year lease. The planned Astara port covers an
area of 55 hectares (ha) and, once completed, will have an annual capacity of 3.5 million tons,
with four berths, including three for dry cargo and one for oil and petroleum products.
Although the dredging work and installation of the breakwater have already been completed,
and the port may start its passenger service operations by the end of 2011, the phased
construction of the port is likely to go on until 2015.295
In 2009, Iran’s Caspian ports processed 14.8 million tons of cargo, including 9.2 million tons
(62%) of non‐oil cargo and 5.6 million tons (38%) oil cargo (Table 2.20, Figure 2.37). The non‐oil
cargo processed by the four Iranian ports was predominantly for imports. The Port of Anzali
more difficult to operate such tankers. But Caspian maritime experts do not see this as a major problem, though they agree that instead of a 63,000 DWT tanker, it is probably better to operate tankers with 30,000‐35,000 DWT. §§§§ Unless stated otherwise, all data referred in this section is from the Annual Reports (Persian version) of the Ports and Maritime Organization (PMO) of Islamic Republic of Iran. The author would like to note that there are some statistical discrepancies between the English and Persian versions of the PMO Annual Reports. This study took all statistics until 2009 and the first 10 months of 2010 from the Persian version of the PMO Annual and Monthly Reports. Only the 2010 full year statistics are from the PMO’s Annual Report in English.
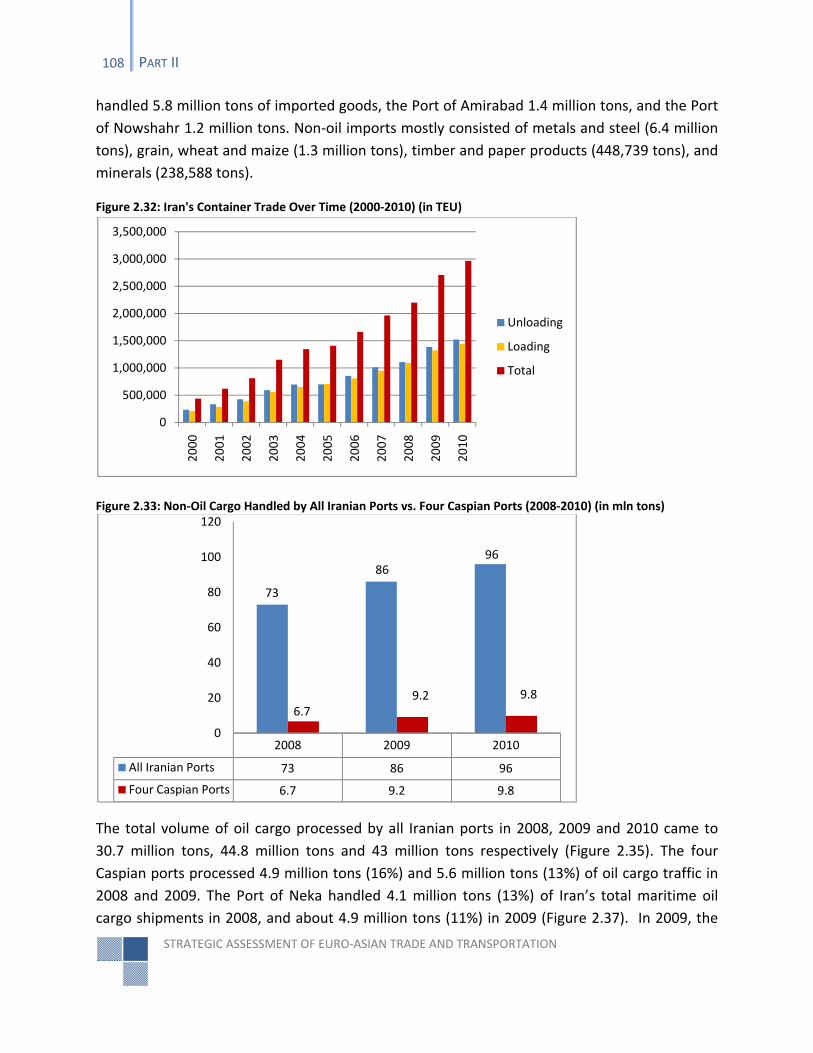
STRATEGIC ASSESSMENT OF EURO‐ASIAN TRADE AND TRANSPORTATION
108 PART II
handled 5.8 million tons of imported goods, the Port of Amirabad 1.4 million tons, and the Port
of Nowshahr 1.2 million tons. Non‐oil imports mostly consisted of metals and steel (6.4 million
tons), grain, wheat and maize (1.3 million tons), timber and paper products (448,739 tons), and
minerals (238,588 tons).
The total volume of oil cargo processed by all Iranian ports in 2008, 2009 and 2010 came to
30.7 million tons, 44.8 million tons and 43 million tons respectively (Figure 2.35). The four
Caspian ports processed 4.9 million tons (16%) and 5.6 million tons (13%) of oil cargo traffic in
2008 and 2009. The Port of Neka handled 4.1 million tons (13%) of Iran’s total maritime oil
cargo shipments in 2008, and about 4.9 million tons (11%) in 2009 (Figure 2.37). In 2009, the
0
500,000
1,000,000
1,500,000
2,000,000
2,500,000
3,000,000
3,500,000
2000
2001
2002
2003
2004
2005
2006
2007
2008
2009
2010
Unloading
Loading
Total
2008 2009 2010
All Iranian Ports 73 86 96
Four Caspian Ports 6.7 9.2 9.8
73
8696
6.79.2 9.8
0
20
40
60
80
100
120
Figure 2.32: Iran's Container Trade Over Time (2000‐2010) (in TEU)
Figure 2.33: Non‐Oil Cargo Handled by All Iranian Ports vs. Four Caspian Ports (2008‐2010) (in mln tons)
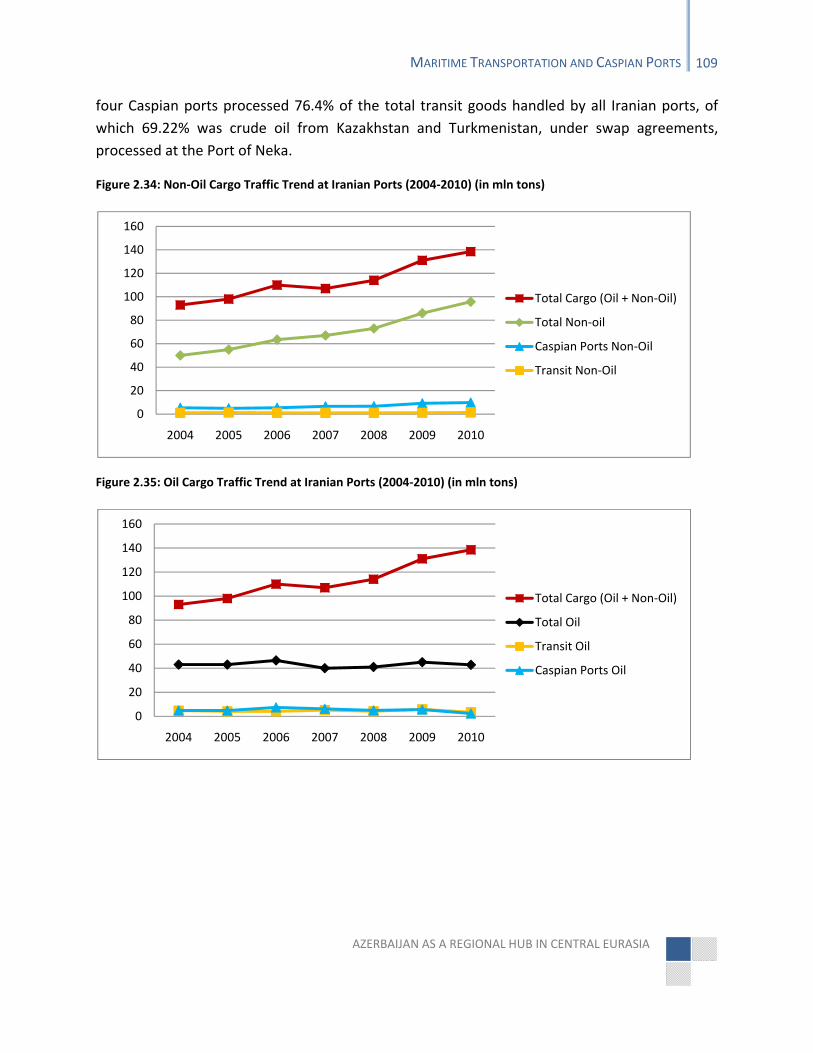
AZERBAIJAN AS A REGIONAL HUB IN CENTRAL EURASIA
MARITIME TRANSPORTATION AND CASPIAN PORTS 109
four Caspian ports processed 76.4% of the total transit goods handled by all Iranian ports, of
which 69.22% was crude oil from Kazakhstan and Turkmenistan, under swap agreements,
processed at the Port of Neka.
0
20
40
60
80
100
120
140
160
2004 2005 2006 2007 2008 2009 2010
Total Cargo (Oil + Non‐Oil)
Total Non‐oil
Caspian Ports Non‐Oil
Transit Non‐Oil
0
20
40
60
80
100
120
140
160
2004 2005 2006 2007 2008 2009 2010
Total Cargo (Oil + Non‐Oil)
Total Oil
Transit Oil
Caspian Ports Oil
Figure 2.34: Non‐Oil Cargo Traffic Trend at Iranian Ports (2004‐2010) (in mln tons)
Figure 2.35: Oil Cargo Traffic Trend at Iranian Ports (2004‐2010) (in mln tons)
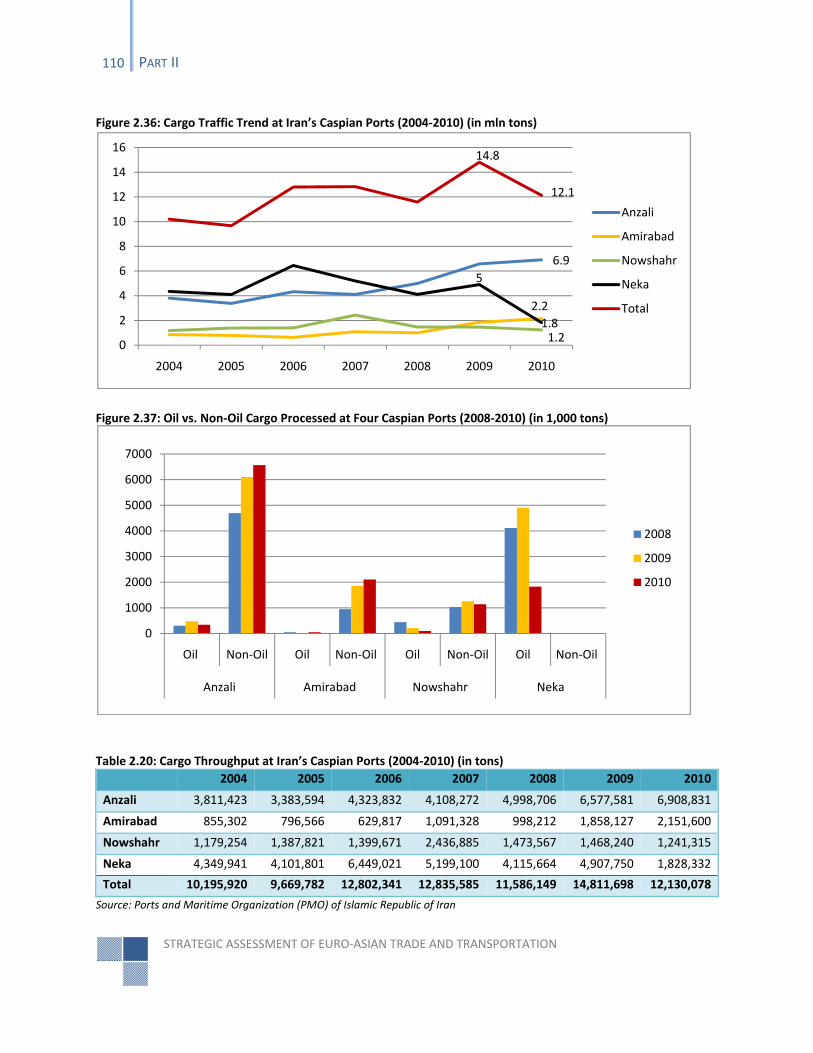
STRATEGIC ASSESSMENT OF EURO‐ASIAN TRADE AND TRANSPORTATION
110 PART II
2004 2005 2006 2007 2008 2009 2010
Anzali 3,811,423 3,383,594 4,323,832 4,108,272 4,998,706 6,577,581 6,908,831
Amirabad 855,302 796,566 629,817 1,091,328 998,212 1,858,127 2,151,600
Nowshahr 1,179,254 1,387,821 1,399,671 2,436,885 1,473,567 1,468,240 1,241,315
Neka 4,349,941 4,101,801 6,449,021 5,199,100 4,115,664 4,907,750 1,828,332
Total 10,195,920 9,669,782 12,802,341 12,835,585 11,586,149 14,811,698 12,130,078
Source: Ports and Maritime Organization (PMO) of Islamic Republic of Iran
6.9
2.2
1.2
5
1.8
14.8
12.1
0
2
4
6
8
10
12
14
16
2004 2005 2006 2007 2008 2009 2010
Anzali
Amirabad
Nowshahr
Neka
Total
Figure 2.36: Cargo Traffic Trend at Iran’s Caspian Ports (2004‐2010) (in mln tons)
Figure 2.37: Oil vs. Non‐Oil Cargo Processed at Four Caspian Ports (2008‐2010) (in 1,000 tons)
Table 2.20: Cargo Throughput at Iran’s Caspian Ports (2004‐2010) (in tons)
Oil Non‐Oil Oil Non‐Oil Oil Non‐Oil Oil Non‐Oil
Anzali Amirabad Nowshahr Neka
0
1000
2000
3000
4000
5000
6000
7000
2008
2009
2010
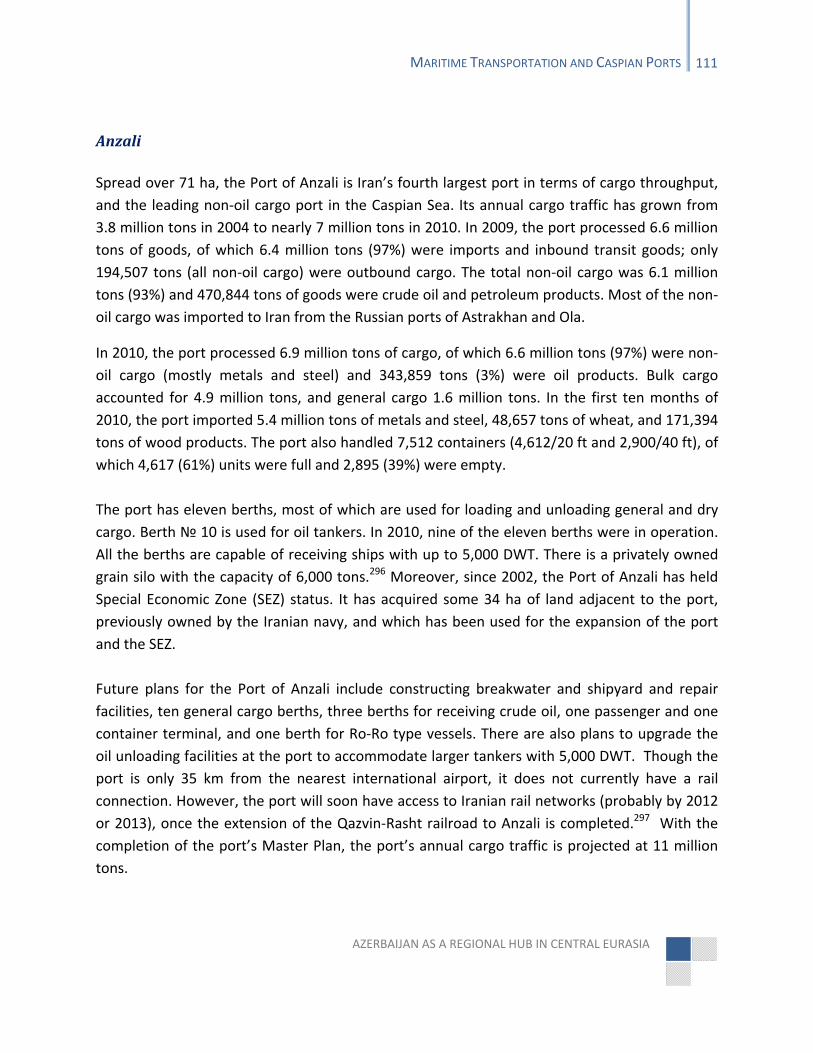
AZERBAIJAN AS A REGIONAL HUB IN CENTRAL EURASIA
MARITIME TRANSPORTATION AND CASPIAN PORTS 111
Anzali
Spread over 71 ha, the Port of Anzali is Iran’s fourth largest port in terms of cargo throughput,
and the leading non‐oil cargo port in the Caspian Sea. Its annual cargo traffic has grown from
3.8 million tons in 2004 to nearly 7 million tons in 2010. In 2009, the port processed 6.6 million
tons of goods, of which 6.4 million tons (97%) were imports and inbound transit goods; only
194,507 tons (all non‐oil cargo) were outbound cargo. The total non‐oil cargo was 6.1 million
tons (93%) and 470,844 tons of goods were crude oil and petroleum products. Most of the non‐
oil cargo was imported to Iran from the Russian ports of Astrakhan and Ola.
In 2010, the port processed 6.9 million tons of cargo, of which 6.6 million tons (97%) were non‐
oil cargo (mostly metals and steel) and 343,859 tons (3%) were oil products. Bulk cargo
accounted for 4.9 million tons, and general cargo 1.6 million tons. In the first ten months of
2010, the port imported 5.4 million tons of metals and steel, 48,657 tons of wheat, and 171,394
tons of wood products. The port also handled 7,512 containers (4,612/20 ft and 2,900/40 ft), of
which 4,617 (61%) units were full and 2,895 (39%) were empty.
The port has eleven berths, most of which are used for loading and unloading general and dry
cargo. Berth № 10 is used for oil tankers. In 2010, nine of the eleven berths were in operation.
All the berths are capable of receiving ships with up to 5,000 DWT. There is a privately owned
grain silo with the capacity of 6,000 tons.296 Moreover, since 2002, the Port of Anzali has held
Special Economic Zone (SEZ) status. It has acquired some 34 ha of land adjacent to the port,
previously owned by the Iranian navy, and which has been used for the expansion of the port
and the SEZ.
Future plans for the Port of Anzali include constructing breakwater and shipyard and repair
facilities, ten general cargo berths, three berths for receiving crude oil, one passenger and one
container terminal, and one berth for Ro‐Ro type vessels. There are also plans to upgrade the
oil unloading facilities at the port to accommodate larger tankers with 5,000 DWT. Though the
port is only 35 km from the nearest international airport, it does not currently have a rail
connection. However, the port will soon have access to Iranian rail networks (probably by 2012
or 2013), once the extension of the Qazvin‐Rasht railroad to Anzali is completed.297 With the
completion of the port’s Master Plan, the port’s annual cargo traffic is projected at 11 million
tons.
STRATEGIC ASSESSMENT OF EURO‐ASIAN TRADE AND TRANSPORTATION
112 PART II
Amirabad
Amirabad is another dry cargo port in the Caspian Sea, and Iran’s only Caspian port (out of the
four analyzed in this study) with rail access. It is located in the Mazandaran province, along with
two other ports, Nowshahr and Neka. The construction of Amirabad began in 1996, and today it
has nine multi‐purpose berths, each with a 6,000‐ton capacity. Berths № 1 is dedicated to grain
shipments, and № 2 to Ro‐Ro type vessels. Berth № 7 is used for unloading oil products as
needed. The port has several large closed warehouses with a total closed storage area of
46,000 m2 and an open storage area of 1 million m2. There is also a 9 million m2 area of land
adjacent to the port, which could be used for future expansion.298The Port has been classified
as a SEZ since 1997. The distance over land from the port to the Azerbaijan‐Iranian border is
about 600 km, and it takes about a day on a ferry to reach Amirabad from the Port of Baku.
In 2010, the port handled 2.2 million tons of cargo, or 18% of the total cargo throughput of
Iran’s Caspian ports, including 1.4 million tons of dry cargo, 713,088 tons of general cargo, and
46,228 tons of oil products. In the first ten months of 2010, it imported 773,343 tons of grain
products, 593,488 tons of minerals and steel; and exported 481,828 tons of minerals and
171,661 tons of construction material.
Iran’s Ports and Maritime Organization (PMO) has an ambitious plan to turn the Port of
Amirabad into a dry cargo hub in the southern Caspian. The development of the port is being
planned in three phases. In the first phase, the number of berths will be increased to fourteen.
The second and third phases will see the construction of an additional twenty berths, bringing
the port’s total number of berths to thirty‐four.299 .
The port also aims to become a transit hub for Russian and Kazakh grain exports. In July 2010,
Kazakhstan and Iran opened a new $20 million grain terminal in Amirabad with an annual
processing capacity of up to 700,000 tons and storage capacity of 53,000 tons. Every year, Iran
imports up to 1 million tons of Kazakh grain, of which about 80% is wheat.300 In 2009, the Port
of Amirabad imported 60% of the total grain and maize products received by all of Iran’s
Caspian ports. It imported 557,259 tons of wheat, 183,346 tons of grain and 32,738 tons of
maize. In the first ten months of 2010, the port’s imports of wheat, grain and maize stood at
259,903 tons, 87,104 tons and 44,482 tons respectively.301
The Port of Amirabad has several advantages over Iran’s other Caspian ports, including its
strategic location, the vast land area available for future expansion, and its rail access.
Nonetheless, the Port of Anzali remains Amirabad’s likely competitor in the medium term,
especially once Anzali has access to the Iranian railway network. Currently, the Anzali port is
AZERBAIJAN AS A REGIONAL HUB IN CENTRAL EURASIA
MARITIME TRANSPORTATION AND CASPIAN PORTS 113
better positioned to transfer cargo destined for Central Asia or the Mediterranean region. This
is not to say, however, that the Port of Amirabad does not stand a good chance of becoming a
relay hub in the North‐South corridor for the transfer of cargo from Russia, Kazakhstan and
other CIS countries to the Persian Gulf and North Africa. This means that Iran’s Caspian ports
will be direct contenders for transit cargo with regard to the western overland segment of the
North‐South corridor (through Azerbaijan) and the eastern segment (through Turkmenistan and
Kazakhstan).
Nowshahr
Like Amirabad, the Port of Nowshahr is located in the Mazandaran province. It was established
by two Benelux companies from the Netherlands and Belgium in the 1930s. It is the closest port
to Tehran (200 km), and it processes an average of 1.5 million tons per year (avg. for 2004‐
2010). Until 2008, the port was the third largest Iranian port on the Caspian after Anzali and
Neka, but recently it has lost out to the Port of Amirabad (Table 2.20). In 2010, Nowshahr
processed the smallest volume of cargo of the 4 Iranian ports (only 1.2 million tons).
Nowshahr’s cargo traffic is dominated by imports, including metals and steel (626,757 tons or
43% of total cargo exchange in 2009), grain products (312,298 tons or 21%), oil products
(212,050 or 14%), paper (159,393 or 11%) and wood products (96,401 or 7%). In the first ten
months of 2010, the Port of Nowshahr wheat, grain and maize imports stood at 216,537 tons,
28,861 tons and 10,774 tons, respectively.302 Exports remained negligible at 20,281 tons of
general cargo, including 383 TEU of loaded containers in 2010. Although Nowshahr’s annual oil
traffic capacity is about 1.5 million tons, and the port is connected by pipeline to a large oil
distribution and storage facility in Northern Iran its oil cargo turnover over the past 3 years has
fallen significantly, from 680,896 tons in 2007 to 100,609 tons in 2010.303
The port has six berths at a depth of 5.5 meters, which means they can take ships with a
maximum deadweight of 5,000 tons. There is a plan to construct six more berths and to
increase the water depth to 7.5 meters in the near future, so that larger vessels can load and
unload at Nowshahr. The port also aims to attain SEZ status and to raise the annual cargo traffic
to 5 million tons. 304 The construction of the Tehran‐North highway, linking Mazandaran
province to the capital, will reduce the distance between the port and Tehran to 120 km. The
port authorities hope that this will boost Nowshahr’s cargo traffic.
STRATEGIC ASSESSMENT OF EURO‐ASIAN TRADE AND TRANSPORTATION
114 PART II
Neka
The Port of Neka is Iran’s strategic oil gateway in the Caspian Sea. Since the 1990s, operations
at the Neka port have been led by the National Iranian Oil Company’s (NIOC) Caspian Republics’
Oil Swap (CROS) program.305 The port has three 5,000 DWT berths, but additional two berths
with 5,000 DWT capacity are in the offing. To ensure that the Tehran and Tabriz refineries can
process the Caspian oil, which varies in grades from country to country, the Neka port has been
equipped with all required blending facilities.306 The Iranian Government has also built pipelines
with a 50,000 bpd capacity between the port and its northern refineries by Tehran and
Tabriz.307
Kazakhstan signed a swap agreement with Iran in 1996 and 2002. Under the terms of this
agreement, it has transferred its crude oil to Iran and received equivalent volumes of the lighter
Iranian crude oil from the Persian Gulf. Most international oil companies operating in
Turkmenistan have also had similar swap arrangements with NIOC. These arrangements are
beneficial for all parties involved. Iran’s main oil producing fields are located in the south of the
country, and so it is more convenient to swap oil with the Caspian states via the Neka port,
which is closer to NIOC’s northern refineries. Similarly, it is more expedient for landlocked
resource‐rich Caspian states or oil companies to receive their swapped oil in open sea areas like
the Persian Gulf.
The actual swap operations through the Port of Neka began in 2000, but it was in 2004 that the
volumes being exchanged really started to rise, increasing steadily until 2009. In 2010, the oil
swaps were halted, which caused Neka’s poor performance last year. In 2010, oil cargo traffic
at Neka had declined nearly threefold, from 4.9 million tons in 2009 to 1.8 million tons in 2010
(Figure 2.37). About 30% (530,000 tons) of oil traffic in 2010 came from Dragon Oil, the leading
oil production company in Turkmenistan.308 The remainder came from other oil production
companies who had swap agreements with Iran. These agreements ended in July 2010.
Due to the considerable investment into the port infrastructure, Neka is likely to become a
serious competitor for Azerbaijan’s oil terminals and ports in transporting Caspian oil from
Kazakhstan and Turkmenistan. The Iranian government plans to increase the total number of
berths at the port to five in the short term, and it could potentially build an offshore Single
Point Mooring (SPM) system to receive larger oil tankers carrying oil from Kazakhstan’s Kuryk
port. Iran is also preparing to invest around €2 billion for the construction of a new refinery in
Mazandaran province with a 120,000 bpd capacity,309 which will likely be dedicated to
processing Caspian oil coming via the Neka port. The project will be implemented by a private
company, the Mazandaran Oil Refinery Company.
AZERBAIJAN AS A REGIONAL HUB IN CENTRAL EURASIA
MARITIME TRANSPORTATION AND CASPIAN PORTS 115
Although the Port of Neka will remain primarily an oil‐based port, other Iranian ports are likely
to capture some of the NSTC's anticipated transit cargo, thereby indirectly affecting the long
term hub strategy of Azerbaijan. However, if the Qazvin‐Rasht‐Astara railway is constructed,
the competition between the central NSTC route and the western NSTC route for cargo traffic
will be less relevant. The direct rail link between Russia, Azerbaijan and Iran will be faster and
more cost effective than the land‐sea‐land route involving the Iranian and Russian Caspian
ports. In addition, the railway will open a new access gate for Iran to European markets via
Azerbaijan and Georgia (the Port of Poti). This will enable Azerbaijan to act as a transit country
for Iran, Russia, and India and will contribute positively to the hub strategy of Azerbaijan.
STRATEGIC ASSESSMENT OF EURO‐ASIAN TRADE AND TRANSPORTATION
116 PART II
LOGISTICS & SUPPLY CHAIN
In the twenty‐first century, the independent development of different modes of transportation
in isolation from each other and without integrated logistics and supply chain management is
no longer an option, particularly for countries aspiring to become regional hubs. Today’s
customers buy white and red grapes in a single sealed package without wondering much about
how these grapes, one kind from South Africa and another from Chile, ended up together, or
how they have managed to stay so fresh and delicious. All this is possible thanks to an advanced
global supply chain and logistics network, which will be discussed in this section.
The ancient Silk Road caravans used to travel 35‐40 km per day, stopping en route at small
caravanserais to re‐supply. While the travelers rested, the camels were fed and the caravan was
made ready for the next morning. In today’s terms, these small caravanserais were the motels
of the ancient Silk Road, offering value added logistics services. It was every 120 km, a 3‐4 day
journey, that the caravan would reach a local trading town, which would have larger
caravanserais where merchants could trade and exchange goods.310 These local trading centers
were in turn connected to regional hubs and megacities, forming a vast trading network across
Eurasia. History recalls very few Chinese who traveled all the way from China to Venice, and
very few Europeans who ended up in China. It was in the regional hubs and megacities in
Central Eurasia and the Middle East where the real action took place, where goods and ideas
exchanged hands, and people and cultures met and mixed.
The Silk Road caravans used an apparently simple yet effective supply chain that was set up
along the entire route between China and India to the Middle East and Europe. The local
caravanserais and regional hubs constituted the backbone of this ancient supply chain,
providing essential services from board and lodging to marketing and security. Some of the
caravans were state sponsored, others belonged to private entrepreneurs. Similar to the
interstate block trains today, the ancient caravans had set schedules and dedicated routes. It
was a multifaceted operation that involved caravans stretching for several kilometers, and it
was this vast network that made it possible to travel safely through the enormous Eurasian
territory, across various states and principalities. In addition, a number of ancient routes were
multimodal corridors involving intermodal transportation, such as land‐sea‐land.
Throughout history, the territory of the present day Azerbaijan has hosted a number of
important caravanserais and big regional trading centers on. These included regional hub cities
like Mingachevir and Qabala (during the Caucasian Albania), Barda and Ganja (during the
Islamic Caliphate), Shaki, Shamakha, Nakhichevan and Baku (in the Middle Ages). The territory
of Azerbaijan was famous for the production of silk, natural dyes, animal (fish) glue, oil and salt,
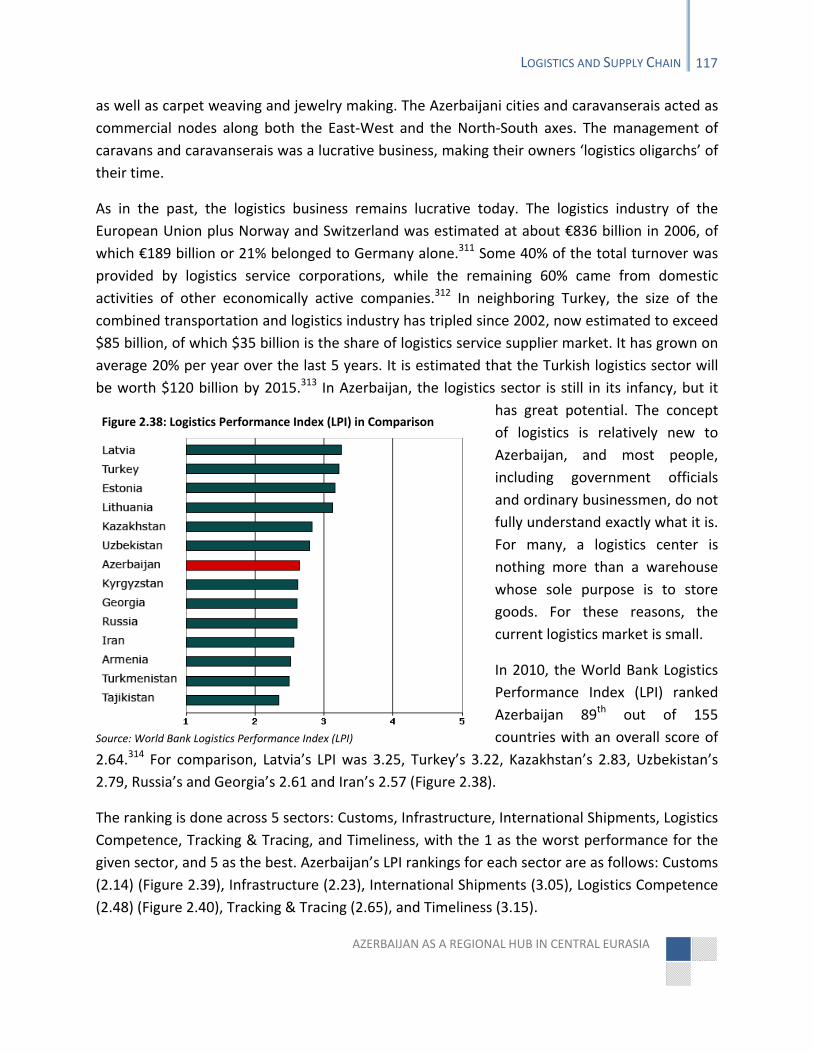
AZERBAIJAN AS A REGIONAL HUB IN CENTRAL EURASIA
LOGISTICS AND SUPPLY CHAIN 117
as well as carpet weaving and jewelry making. The Azerbaijani cities and caravanserais acted as
commercial nodes along both the East‐West and the North‐South axes. The management of
caravans and caravanserais was a lucrative business, making their owners ‘logistics oligarchs’ of
their time.
As in the past, the logistics business remains lucrative today. The logistics industry of the
European Union plus Norway and Switzerland was estimated at about €836 billion in 2006, of
which €189 billion or 21% belonged to Germany alone.311 Some 40% of the total turnover was
provided by logistics service corporations, while the remaining 60% came from domestic
activities of other economically active companies.312 In neighboring Turkey, the size of the
combined transportation and logistics industry has tripled since 2002, now estimated to exceed
$85 billion, of which $35 billion is the share of logistics service supplier market. It has grown on
average 20% per year over the last 5 years. It is estimated that the Turkish logistics sector will
be worth $120 billion by 2015.313 In Azerbaijan, the logistics sector is still in its infancy, but it
has great potential. The concept
of logistics is relatively new to
Azerbaijan, and most people,
including government officials
and ordinary businessmen, do not
fully understand exactly what it is.
For many, a logistics center is
nothing more than a warehouse
whose sole purpose is to store
goods. For these reasons, the
current logistics market is small.
In 2010, the World Bank Logistics
Performance Index (LPI) ranked
Azerbaijan 89th out of 155
countries with an overall score of
2.64.314 For comparison, Latvia’s LPI was 3.25, Turkey’s 3.22, Kazakhstan’s 2.83, Uzbekistan’s
2.79, Russia’s and Georgia’s 2.61 and Iran’s 2.57 (Figure 2.38).
The ranking is done across 5 sectors: Customs, Infrastructure, International Shipments, Logistics
Competence, Tracking & Tracing, and Timeliness, with the 1 as the worst performance for the
given sector, and 5 as the best. Azerbaijan’s LPI rankings for each sector are as follows: Customs
(2.14) (Figure 2.39), Infrastructure (2.23), International Shipments (3.05), Logistics Competence
(2.48) (Figure 2.40), Tracking & Tracing (2.65), and Timeliness (3.15).
Figure 2.38: Logistics Performance Index (LPI) in Comparison
Source: World Bank Logistics Performance Index (LPI)
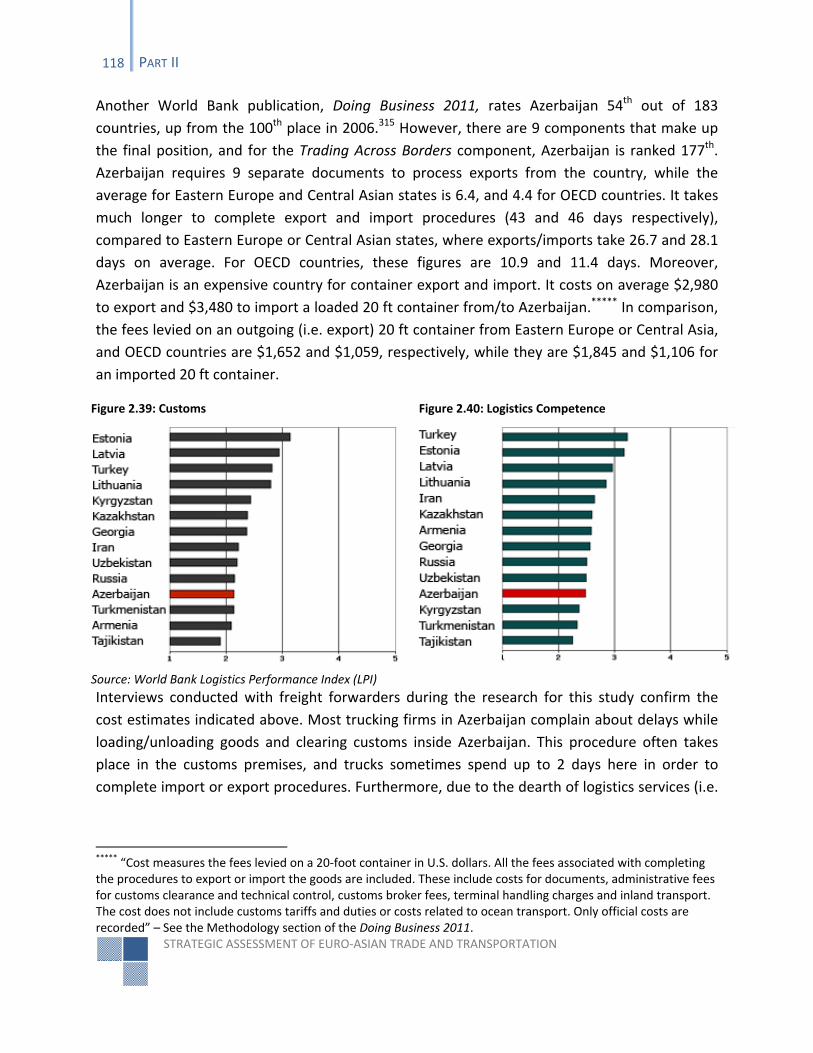
STRATEGIC ASSESSMENT OF EURO‐ASIAN TRADE AND TRANSPORTATION
118 PART II
Another World Bank publication, Doing Business 2011, rates Azerbaijan 54th out of 183
countries, up from the 100th place in 2006.315 However, there are 9 components that make up
the final position, and for the Trading Across Borders component, Azerbaijan is ranked 177th.
Azerbaijan requires 9 separate documents to process exports from the country, while the
average for Eastern Europe and Central Asian states is 6.4, and 4.4 for OECD countries. It takes
much longer to complete export and import procedures (43 and 46 days respectively),
compared to Eastern Europe or Central Asian states, where exports/imports take 26.7 and 28.1
days on average. For OECD countries, these figures are 10.9 and 11.4 days. Moreover,
Azerbaijan is an expensive country for container export and import. It costs on average $2,980
to export and $3,480 to import a loaded 20 ft container from/to Azerbaijan.***** In comparison,
the fees levied on an outgoing (i.e. export) 20 ft container from Eastern Europe or Central Asia,
and OECD countries are $1,652 and $1,059, respectively, while they are $1,845 and $1,106 for
an imported 20 ft container.
Figure 2.39: Customs Figure 2.40: Logistics Competence
Source: World Bank Logistics Performance Index (LPI)
Interviews conducted with freight forwarders during the research for this study confirm the
cost estimates indicated above. Most trucking firms in Azerbaijan complain about delays while
loading/unloading goods and clearing customs inside Azerbaijan. This procedure often takes
place in the customs premises, and trucks sometimes spend up to 2 days here in order to
complete import or export procedures. Furthermore, due to the dearth of logistics services (i.e.
***** “Cost measures the fees levied on a 20‐foot container in U.S. dollars. All the fees associated with completing the procedures to export or import the goods are included. These include costs for documents, administrative fees for customs clearance and technical control, customs broker fees, terminal handling charges and inland transport. The cost does not include customs tariffs and duties or costs related to ocean transport. Only official costs are recorded” – See the Methodology section of the Doing Business 2011.
AZERBAIJAN AS A REGIONAL HUB IN CENTRAL EURASIA
LOGISTICS AND SUPPLY CHAIN 119
bonded warehouses at the border), international trucks have to wait until all goods are cleared
and collected by the client(s).
This is a serious issue that is diminishing the competitive advantages of companies operating in
Azerbaijan, by adding extra stock costs. When running a business, companies try to reduce
costs by keeping low inventory, as overstocking entails extra expense. For example, in Western
Europe, where the supply chain system is well developed, a retail store would keep only the
minimum required level of stocks, secure in the knowledge that it can order more when
needed. In Azerbaijan, however, many firms have to overstock, because customs regulations
make it more expensive to order partial shipments by truck than to ship a full loaded truck.
Therefore, many firms end up shipping full truck loads of goods, where in fact they only need
half of that ‐ or less. Subsequently, the firm has to stock unused products in its own warehouse
or elsewhere. All of this means additional expense for the firm.
However, if there were bonded warehouses (a.k.a. customs warehouses)††††† at Azerbaijan’s
major border crossings, this problem would be resolved, at least partially – partially, in the
sense that having a bonded warehouse is a just one component in the supply chain, and there
needs to be an efficient and effective logistics network within the country, and logistics
companies that are linked to this network. These and other issues will be analyzed in greater
depth below.
Logistics Market: Domestic vs. International
Domestic cargo transportation constitutes a major share of the transport sector in Azerbaijan.
In 2010, in the transport sector of Azerbaijan, nearly 134 million tons of cargo was transported
by rail, road, sea and air combined. Out of 134 million tons, 99.9 million tons (75%) went by
road, 22.2 million tons (17%) by rail, 11.7 million tons (9%) by maritime transport and 40,000
tons (0.03%) by air.316 TRACECA’s share in the road haulage was 21.7 million tons, or 22% of the
transport sector’s total road cargo traffic. More than 20 million tons of cargo carried by road
along the TRACECA route was domestic freight. Similarly, out of the 22.2 million tons of cargo
that traveled by rail, more than 3.6 million tons were moved within Azerbaijan.317 There are no
detailed statistics available on the type of domestic cargo, but fuel, construction materials, and
agricultural products are some of the major freight types.
Azerbaijan is home to nine different climate zones, ranging from dry to subtropical, that create
favorable conditions for the production of a wide variety of fruits and vegetables throughout
††††† A bonded warehouse is a secured facility supervised by customs authorities, where dutiable landed imports are stored pending their re‐export, or released on assessment and payment of import duties, taxes, and other charges (Source: businessdictionary.com).
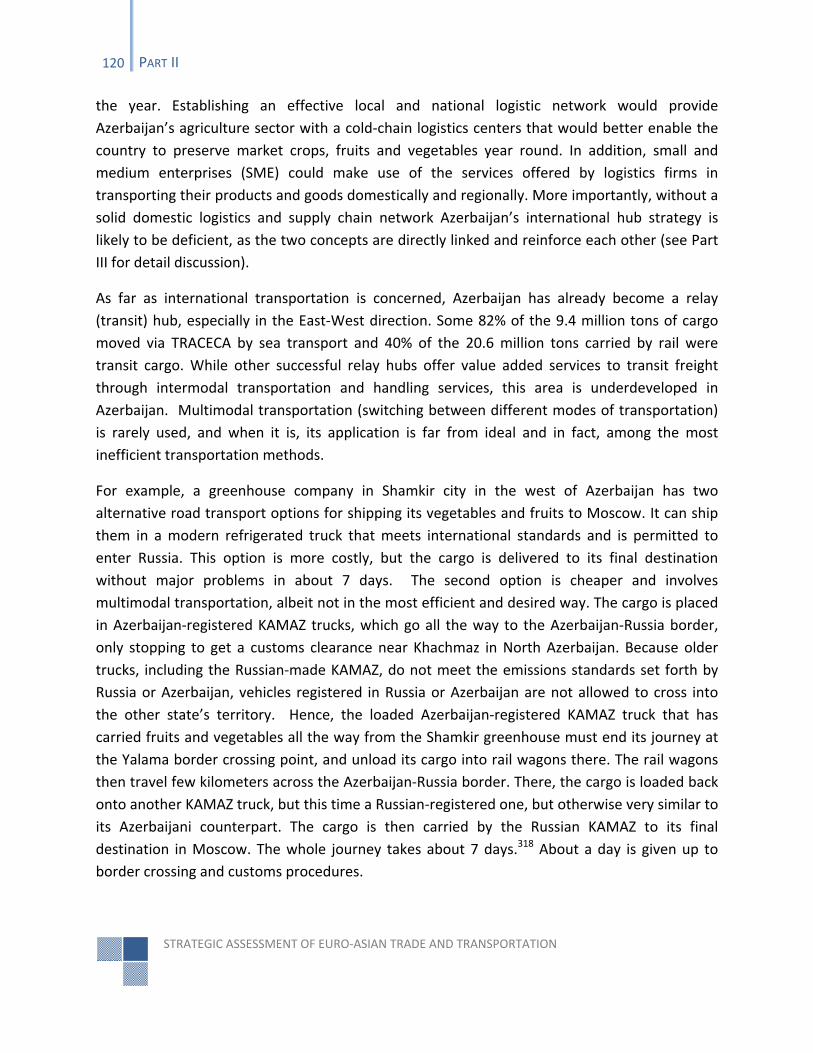
STRATEGIC ASSESSMENT OF EURO‐ASIAN TRADE AND TRANSPORTATION
120 PART II
the year. Establishing an effective local and national logistic network would provide
Azerbaijan’s agriculture sector with a cold‐chain logistics centers that would better enable the
country to preserve market crops, fruits and vegetables year round. In addition, small and
medium enterprises (SME) could make use of the services offered by logistics firms in
transporting their products and goods domestically and regionally. More importantly, without a
solid domestic logistics and supply chain network Azerbaijan’s international hub strategy is
likely to be deficient, as the two concepts are directly linked and reinforce each other (see Part
III for detail discussion).
As far as international transportation is concerned, Azerbaijan has already become a relay
(transit) hub, especially in the East‐West direction. Some 82% of the 9.4 million tons of cargo
moved via TRACECA by sea transport and 40% of the 20.6 million tons carried by rail were
transit cargo. While other successful relay hubs offer value added services to transit freight
through intermodal transportation and handling services, this area is underdeveloped in
Azerbaijan. Multimodal transportation (switching between different modes of transportation)
is rarely used, and when it is, its application is far from ideal and in fact, among the most
inefficient transportation methods.
For example, a greenhouse company in Shamkir city in the west of Azerbaijan has two
alternative road transport options for shipping its vegetables and fruits to Moscow. It can ship
them in a modern refrigerated truck that meets international standards and is permitted to
enter Russia. This option is more costly, but the cargo is delivered to its final destination
without major problems in about 7 days. The second option is cheaper and involves
multimodal transportation, albeit not in the most efficient and desired way. The cargo is placed
in Azerbaijan‐registered KAMAZ trucks, which go all the way to the Azerbaijan‐Russia border,
only stopping to get a customs clearance near Khachmaz in North Azerbaijan. Because older
trucks, including the Russian‐made KAMAZ, do not meet the emissions standards set forth by
Russia or Azerbaijan, vehicles registered in Russia or Azerbaijan are not allowed to cross into
the other state’s territory. Hence, the loaded Azerbaijan‐registered KAMAZ truck that has
carried fruits and vegetables all the way from the Shamkir greenhouse must end its journey at
the Yalama border crossing point, and unload its cargo into rail wagons there. The rail wagons
then travel few kilometers across the Azerbaijan‐Russia border. There, the cargo is loaded back
onto another KAMAZ truck, but this time a Russian‐registered one, but otherwise very similar to
its Azerbaijani counterpart. The cargo is then carried by the Russian KAMAZ to its final
destination in Moscow. The whole journey takes about 7 days.318 About a day is given up to
border crossing and customs procedures.
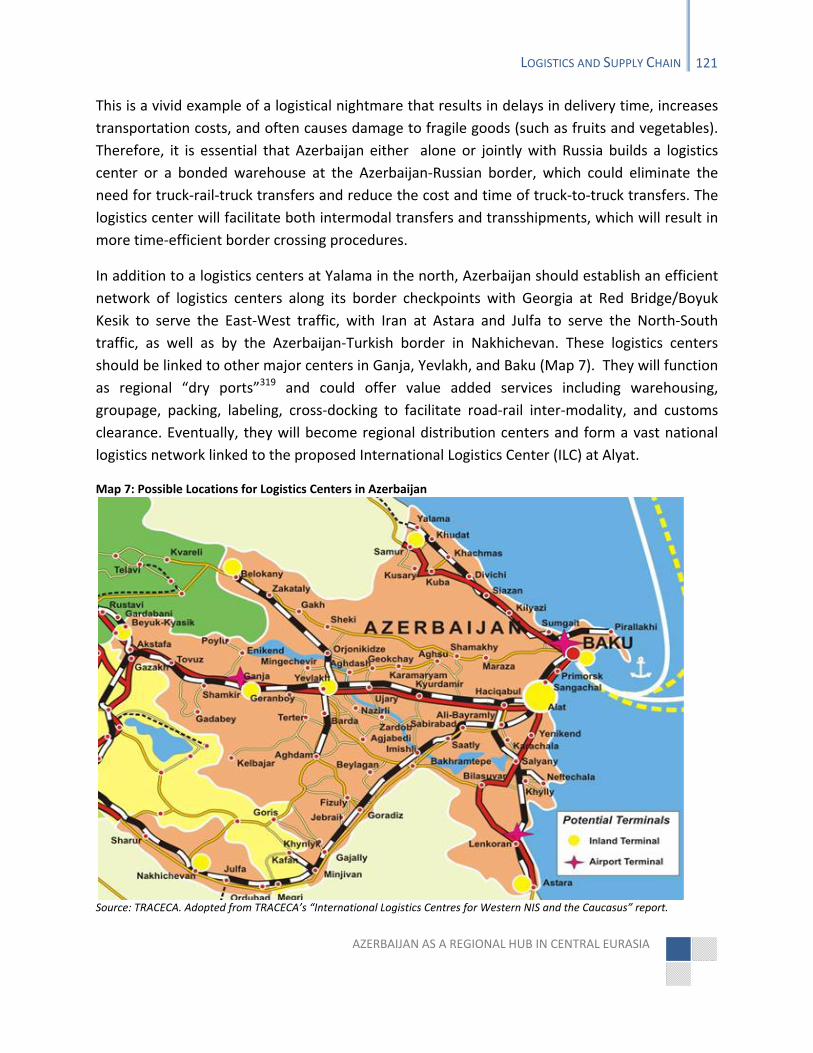
AZERBAIJAN AS A REGIONAL HUB IN CENTRAL EURASIA
LOGISTICS AND SUPPLY CHAIN 121
This is a vivid example of a logistical nightmare that results in delays in delivery time, increases
transportation costs, and often causes damage to fragile goods (such as fruits and vegetables).
Therefore, it is essential that Azerbaijan either alone or jointly with Russia builds a logistics
center or a bonded warehouse at the Azerbaijan‐Russian border, which could eliminate the
need for truck‐rail‐truck transfers and reduce the cost and time of truck‐to‐truck transfers. The
logistics center will facilitate both intermodal transfers and transshipments, which will result in
more time‐efficient border crossing procedures.
In addition to a logistics centers at Yalama in the north, Azerbaijan should establish an efficient
network of logistics centers along its border checkpoints with Georgia at Red Bridge/Boyuk
Kesik to serve the East‐West traffic, with Iran at Astara and Julfa to serve the North‐South
traffic, as well as by the Azerbaijan‐Turkish border in Nakhichevan. These logistics centers
should be linked to other major centers in Ganja, Yevlakh, and Baku (Map 7). They will function
as regional “dry ports”319 and could offer value added services including warehousing,
groupage, packing, labeling, cross‐docking to facilitate road‐rail inter‐modality, and customs
clearance. Eventually, they will become regional distribution centers and form a vast national
logistics network linked to the proposed International Logistics Center (ILC) at Alyat.
Map 7: Possible Locations for Logistics Centers in Azerbaijan
Source: TRACECA. Adopted from TRACECA’s “International Logistics Centres for Western NIS and the Caucasus” report.
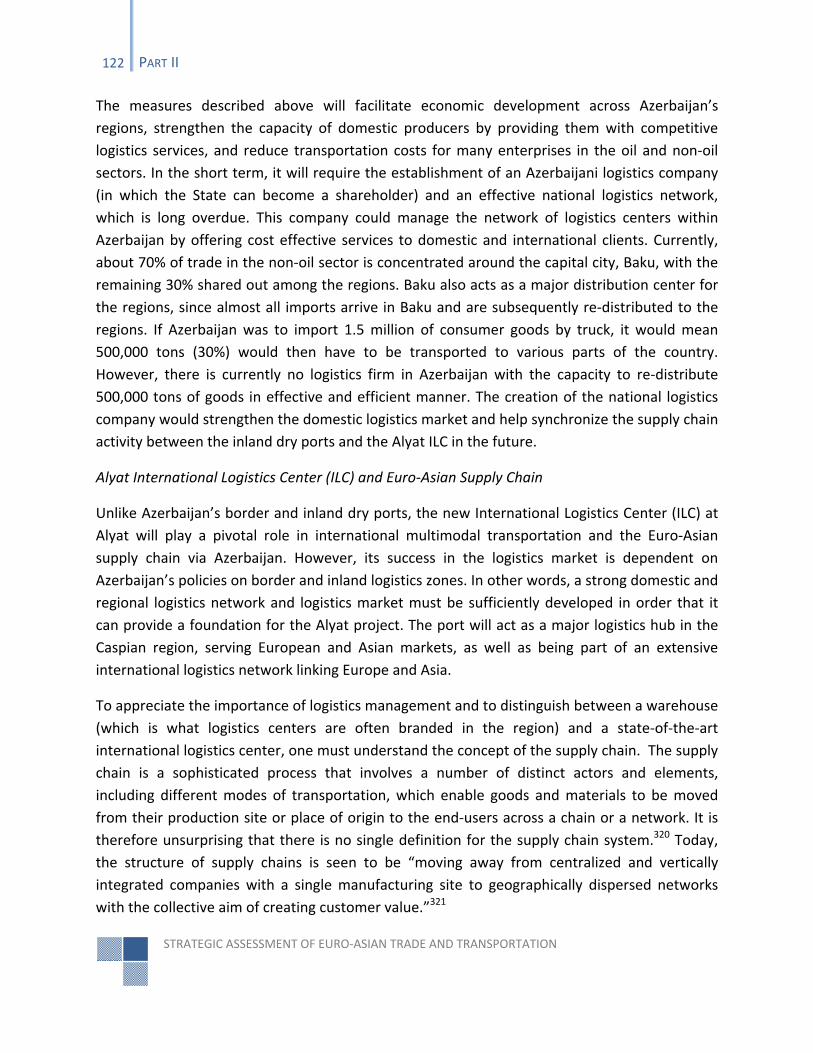
STRATEGIC ASSESSMENT OF EURO‐ASIAN TRADE AND TRANSPORTATION
122 PART II
The measures described above will facilitate economic development across Azerbaijan’s
regions, strengthen the capacity of domestic producers by providing them with competitive
logistics services, and reduce transportation costs for many enterprises in the oil and non‐oil
sectors. In the short term, it will require the establishment of an Azerbaijani logistics company
(in which the State can become a shareholder) and an effective national logistics network,
which is long overdue. This company could manage the network of logistics centers within
Azerbaijan by offering cost effective services to domestic and international clients. Currently,
about 70% of trade in the non‐oil sector is concentrated around the capital city, Baku, with the
remaining 30% shared out among the regions. Baku also acts as a major distribution center for
the regions, since almost all imports arrive in Baku and are subsequently re‐distributed to the
regions. If Azerbaijan was to import 1.5 million of consumer goods by truck, it would mean
500,000 tons (30%) would then have to be transported to various parts of the country.
However, there is currently no logistics firm in Azerbaijan with the capacity to re‐distribute
500,000 tons of goods in effective and efficient manner. The creation of the national logistics
company would strengthen the domestic logistics market and help synchronize the supply chain
activity between the inland dry ports and the Alyat ILC in the future.
Alyat International Logistics Center (ILC) and Euro‐Asian Supply Chain
Unlike Azerbaijan’s border and inland dry ports, the new International Logistics Center (ILC) at
Alyat will play a pivotal role in international multimodal transportation and the Euro‐Asian
supply chain via Azerbaijan. However, its success in the logistics market is dependent on
Azerbaijan’s policies on border and inland logistics zones. In other words, a strong domestic and
regional logistics network and logistics market must be sufficiently developed in order that it
can provide a foundation for the Alyat project. The port will act as a major logistics hub in the
Caspian region, serving European and Asian markets, as well as being part of an extensive
international logistics network linking Europe and Asia.
To appreciate the importance of logistics management and to distinguish between a warehouse
(which is what logistics centers are often branded in the region) and a state‐of‐the‐art
international logistics center, one must understand the concept of the supply chain. The supply
chain is a sophisticated process that involves a number of distinct actors and elements,
including different modes of transportation, which enable goods and materials to be moved
from their production site or place of origin to the end‐users across a chain or a network. It is
therefore unsurprising that there is no single definition for the supply chain system.320 Today,
the structure of supply chains is seen to be “moving away from centralized and vertically
integrated companies with a single manufacturing site to geographically dispersed networks
with the collective aim of creating customer value.”321
AZERBAIJAN AS A REGIONAL HUB IN CENTRAL EURASIA
LOGISTICS AND SUPPLY CHAIN 123
The goal of creating customer value guides the effective synchronization and harmonization of
all supply chain activities along the entire chain, from the production factory to the customer’s
home. In this process, logistics services play a critical role, and logistics centers in particular act
as fundamental connections between each node in a “node‐linked system”322 (Figure 2.41).
Hence, logistics services play a crucial role, facilitating the “door‐to‐door” transaction. Logistical
centers offer various value added services, from warehousing and consolidation to labeling,
packaging and distribution.
Source: UNESCAP
The technical study of the Alyat ILC sponsored by TRACECA was completed in 2010. It envisages
several components within the ILC site in the new port at Alyat, including: Truck Port with T.I.R.
parking; Customs Services and Bonded Warehousing Area; Container Terminal and Container
Service Centre; Warehousing Complex with general and temperature guided storage areas; and
Settlement Areas for Logistics Intensive Industries and Trade.323 TRACECA estimates that the
Alyat ILC could handle about 1.7 million tons of cargo per year, plus an additional 530,000 tons
of freight per year after the completion of the Kars‐Akhalkalaki railway.324 The ILC will be
located within the grounds of the new port, covering an area of 50 ha. Since the new port is
being built at the major railway juncture connecting the North‐South and the East‐West rail
lines in Azerbaijan, the ILC will also have a rail access.
It is important, however, to view Alyat ILC as more than just a regional logistics center offering
storage services. As this study will later demonstrate, the success of the new port at Alyat will
depend on the conceptual model that is chosen for the development of the new port and the
Free Economic Zone (FEZ). This study advocates an integrated and flexible model for the Alyat
ILC, which would not only serve as a multimodal transit logistics hub but become a major
Figure 2.41: A node‐link system
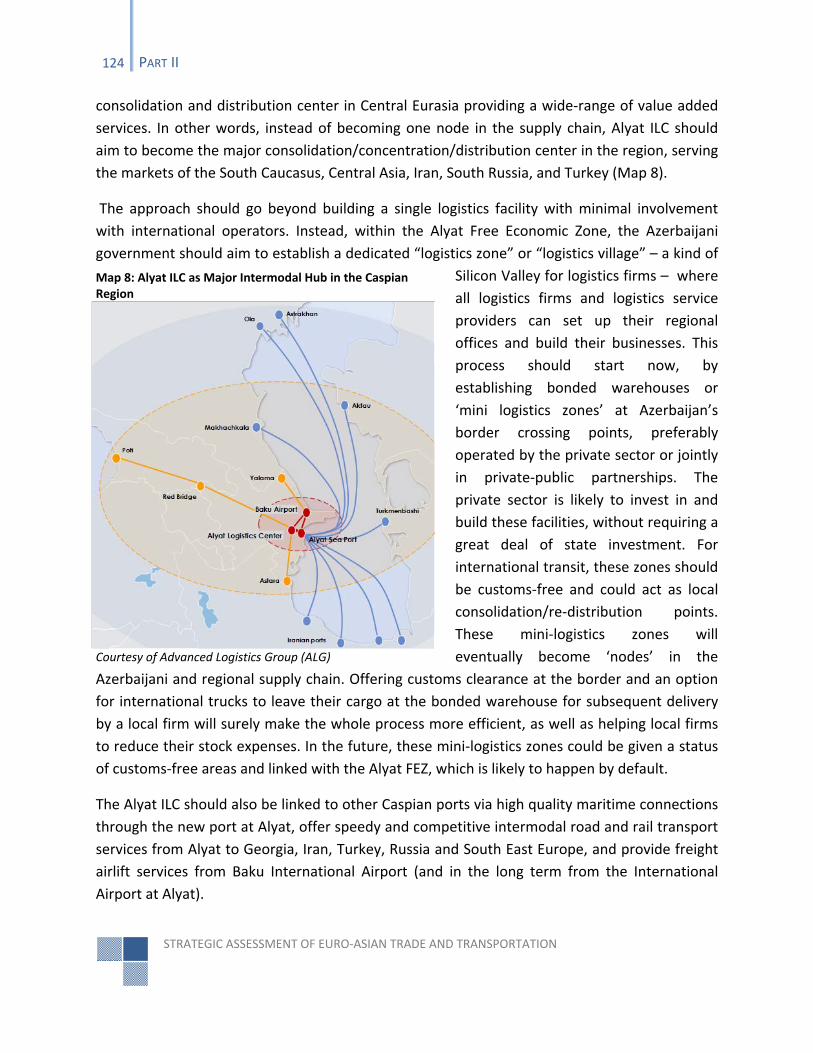
STRATEGIC ASSESSMENT OF EURO‐ASIAN TRADE AND TRANSPORTATION
124 PART II
consolidation and distribution center in Central Eurasia providing a wide‐range of value added
services. In other words, instead of becoming one node in the supply chain, Alyat ILC should
aim to become the major consolidation/concentration/distribution center in the region, serving
the markets of the South Caucasus, Central Asia, Iran, South Russia, and Turkey (Map 8).
The approach should go beyond building a single logistics facility with minimal involvement
with international operators. Instead, within the Alyat Free Economic Zone, the Azerbaijani
government should aim to establish a dedicated “logistics zone” or “logistics village” – a kind of
Silicon Valley for logistics firms – where
all logistics firms and logistics service
providers can set up their regional
offices and build their businesses. This
process should start now, by
establishing bonded warehouses or
‘mini logistics zones’ at Azerbaijan’s
border crossing points, preferably
operated by the private sector or jointly
in private‐public partnerships. The
private sector is likely to invest in and
build these facilities, without requiring a
great deal of state investment. For
international transit, these zones should
be customs‐free and could act as local
consolidation/re‐distribution points.
These mini‐logistics zones will
eventually become ‘nodes’ in the
Azerbaijani and regional supply chain. Offering customs clearance at the border and an option
for international trucks to leave their cargo at the bonded warehouse for subsequent delivery
by a local firm will surely make the whole process more efficient, as well as helping local firms
to reduce their stock expenses. In the future, these mini‐logistics zones could be given a status
of customs‐free areas and linked with the Alyat FEZ, which is likely to happen by default.
The Alyat ILC should also be linked to other Caspian ports via high quality maritime connections
through the new port at Alyat, offer speedy and competitive intermodal road and rail transport
services from Alyat to Georgia, Iran, Turkey, Russia and South East Europe, and provide freight
airlift services from Baku International Airport (and in the long term from the International
Airport at Alyat).
Map 8: Alyat ILC as Major Intermodal Hub in the Caspian Region
Courtesy of Advanced Logistics Group (ALG)
AZERBAIJAN AS A REGIONAL HUB IN CENTRAL EURASIA
LOGISTICS AND SUPPLY CHAIN 125
In the East‐West direction, the Port of Poti in the West and the Ports of Aktau and
Turkmenbashy in the East will be Alyat ILC’s major commercial and logistics partners. Since the
Port of Poti and the New Port of Baku at Alyat are connected by land, Azerbaijan and Georgia
should think of way to create a reliable and sustainable “Baku‐Poti Transit Freight Corridor”
(Map 9) between the 2 ports and FEZs. The 2 countries have already signed an MoU to start
running scheduled block trains between Poti and Baku. However, as mentioned above, this
issue requires a systemic and comprehensive approach that would not only deal with one
problem in the Poti‐Baku supply chain, but would address all issues, including the speed of
trains, the cost of shipments, the number of platforms and containers available en route, the
connections between the Black Sea ports and Poti as well as Baku and other Caspian ports, and
so on. More importantly, the “Transit Freight Corridor” between Baku and Poti should not be
exclusive, but should also aim to connect the 2 Free Economic Zones at Poti and Alyat, which
should include both the port and the ILC. The operation of this corridor could be managed by a
private logistics company.
Across the Caspian to the east, the Ports of Aktau and Turkmenbashy will be nodes in the
logistics chain linked to the Alyat port in Azerbaijan. The logistics centers at Aktau and
Turkmenbashy are scheduled to start operations in 2012 and 2015, respectively. The TRACECA
feasibility study estimates that by 2016, the traffic through the logistics center at Aktau will
reach 1.2 million tons while at Turkmenbashy it will be 1.9 million.325 Since crossing the Caspian
Sea involves maritime transport, a “Caspian Transit Corridor” will have to be set up to link the
Alyat ILC and the logistics centers at Aktau and Turkmenbashy. This would involve creating an
effective, reliable and competitive road/rail‐sea‐road/rail transit system via Azerbaijan, Georgia,
Kazakhstan, and Turkmenistan. Azerbaijan will have to address the maritime segment of this
international transit corridor, as CASPAR is the main operator of trans‐Caspian shipments, and
currently, its services are far from being adequate or competitive.
As far as the North‐South axis is concerned, the consolidation points of the logistics chain along
this corridor are located in Russia and Iran. Therefore, if the goods are shipped from Iran to
Russia or from Russia to Iran, they would most likely be stored and handled in one of Russia’s or
Iran’s Caspian ports without entering the Alyat ILC. But Azerbaijan should further develop
Samur and Yalama border crossing points in the north and Astara in the south to capture some
of the North‐South traffic. If the Port at Alyat becomes an integrated FEZ, within which the
Alyat ILC will be based, there is greater chance that the North‐South traffic will also use the
logistics services at Alyat. Until then, the Astara terminal near the Azerbaijan‐Iranian border will
be the major intermodal dry port in the south of Azerbaijan along the NSTC.
STRATEGIC ASSESSMENT OF EURO‐ASIAN TRADE AND TRANSPORTATION
126 PART II
AIR TRANSPORTATION
Air transportation is the fastest alternative, albeit the most expensive one, to the maritime bulk
transport between Europe and Asia. The maritime industry ships far more goods and freight
around the world, including liquids such as oil and LNG. It is the dry cargo component of the
maritime cargo, particularly container traffic, which is comparable to the air cargo. The
modernization and expansion of container ships (some ships now can carry more than 15,000
TEU on board) have enabled the maritime transport sector to become the most cost effective
and preferred mode of transportation over the past 50 years. However, the aviation industry
has also been evolving. Today, long‐haul freighter fleets around the world utilize efficient wide‐
body aircrafts such as Boeing 747‐400 and Airbus A380, and more efficient and superior new
generation aircrafts like the Boeing 747‐8F and Airbus A380F will enter the market in the near
future. Therefore, air transportation will retain its dominant position amongst other transport
modes, and will continue to offer new opportunities for countries interested in attracting more
passenger and freight traffic.
Airbus estimates that the world’s fleet of passenger and cargo airplanes will increase from
14,980 in 2006 to 33,000 by 2026, while air traffic will nearly triple. In addition, more than 90%
of the world’s existing aircraft fleet will be replaced by more eco‐friendly planes. Most of the
orders for new planes will come from the Asia‐Pacific region (31%), followed by North America
(27%), and Europe (24%).326 Airbus forecasts deliveries to the Commonwealth of Independent
States (CIS) at 656 aircrafts, or 3% of the total orders.327 Meanwhile, Boeing forecasts that the
world freighter fleet will grow both in number and in terms of the payload capacity of the
freight aircrafts. The number of cargo airplanes will nearly double from the 1,948 aircrafts in
2007 to 3,892 aircrafts in 2027, and international air traffic and air freight will grow at an
average annual rate of 5.8% and 5.9%, respectively.328
Azerbaijan’s landlocked status is probably the most irrelevant factor when it comes to air
transportation. The country is situated in an ideal location in terms of the international air
traffic network, and is in a particularly attractive position for air shipments between Europe and
Asia. It is within a 3 1/2 ‐ hour flight of about 45 countries. What distinguishes Azerbaijan from
most other landlocked and ‘ideally located’ hubs is the fact that it is also a major producer of oil
and jet fuel – a strategic commodity sought and valued by all air companies. Baku possesses all
the necessary and desired ingredients for becoming an air hub for refueling long‐haul European
and North American flights to Asia or vice versa. This section will examine the air transportation
sector of Azerbaijan (both passenger and cargo) and look at trends and opportunities in the air
freight market.
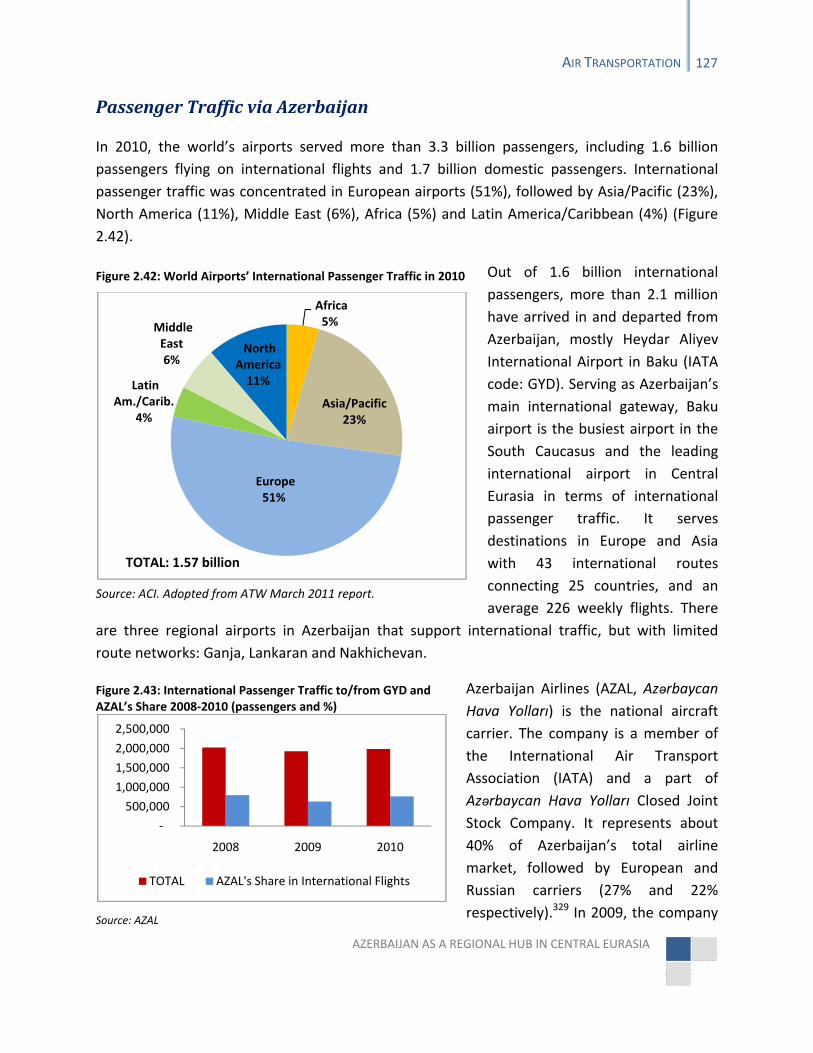
AZERBAIJAN AS A REGIONAL HUB IN CENTRAL EURASIA
AIR TRANSPORTATION 127
Passenger Traffic via Azerbaijan
In 2010, the world’s airports served more than 3.3 billion passengers, including 1.6 billion
passengers flying on international flights and 1.7 billion domestic passengers. International
passenger traffic was concentrated in European airports (51%), followed by Asia/Pacific (23%),
North America (11%), Middle East (6%), Africa (5%) and Latin America/Caribbean (4%) (Figure
2.42).
Out of 1.6 billion international
passengers, more than 2.1 million
have arrived in and departed from
Azerbaijan, mostly Heydar Aliyev
International Airport in Baku (IATA
code: GYD). Serving as Azerbaijan’s
main international gateway, Baku
airport is the busiest airport in the
South Caucasus and the leading
international airport in Central
Eurasia in terms of international
passenger traffic. It serves
destinations in Europe and Asia
with 43 international routes
connecting 25 countries, and an
average 226 weekly flights. There
are three regional airports in Azerbaijan that support international traffic, but with limited
route networks: Ganja, Lankaran and Nakhichevan.
Azerbaijan Airlines (AZAL, Azərbaycan
Hava Yolları) is the national aircraft
carrier. The company is a member of
the International Air Transport
Association (IATA) and a part of
Azərbaycan Hava Yolları Closed Joint
Stock Company. It represents about
40% of Azerbaijan’s total airline
market, followed by European and
Russian carriers (27% and 22%
respectively).329 In 2009, the company
Figure 2.42: World Airports’ International Passenger Traffic in 2010
Source: ACI. Adopted from ATW March 2011 report.
Figure 2.43: International Passenger Traffic to/from GYD and AZAL’s Share 2008‐2010 (passengers and %)
Source: AZAL
Africa 5%
Asia/Pacific 23%
Europe 51%
Latin Am./Carib.
4%
Middle East 6%
North America 11%
TOTAL: 1.57 billion
‐
500,000
1,000,000
1,500,000
2,000,000
2,500,000
2008 2009 2010
TOTAL AZAL's Share in International Flights
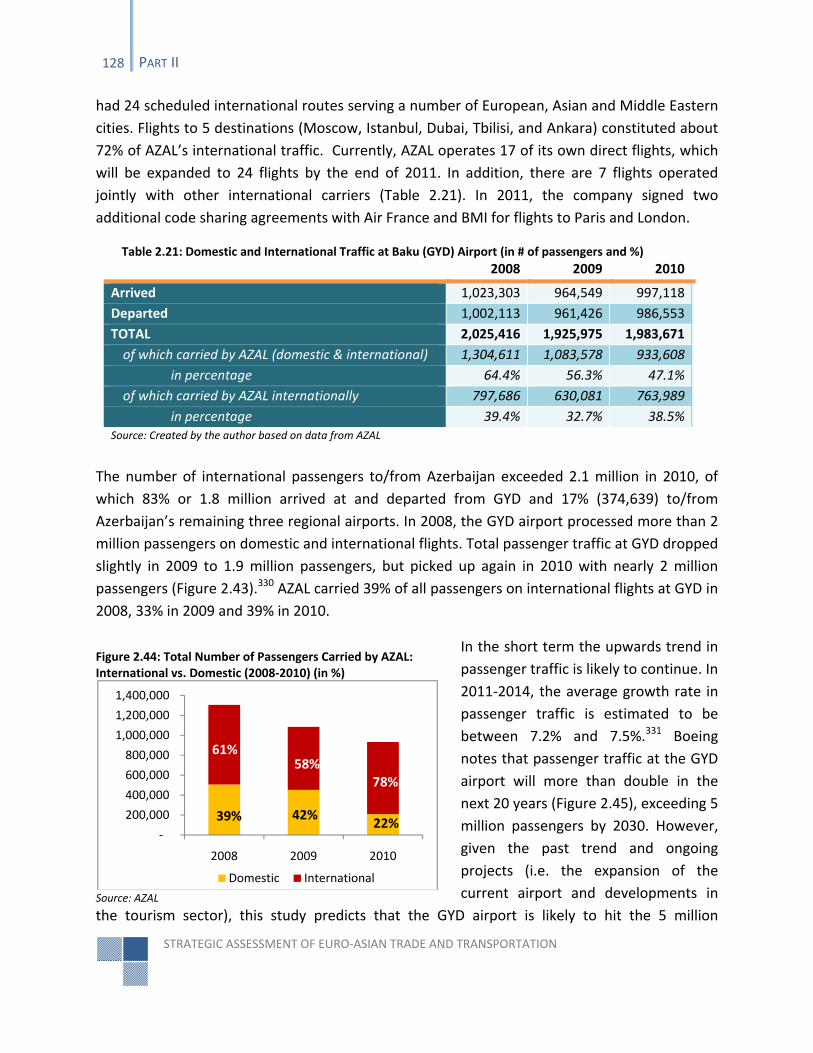
STRATEGIC ASSESSMENT OF EURO‐ASIAN TRADE AND TRANSPORTATION
128 PART II
had 24 scheduled international routes serving a number of European, Asian and Middle Eastern
cities. Flights to 5 destinations (Moscow, Istanbul, Dubai, Tbilisi, and Ankara) constituted about
72% of AZAL’s international traffic. Currently, AZAL operates 17 of its own direct flights, which
will be expanded to 24 flights by the end of 2011. In addition, there are 7 flights operated
jointly with other international carriers (Table 2.21). In 2011, the company signed two
additional code sharing agreements with Air France and BMI for flights to Paris and London.
Table 2.21: Domestic and International Traffic at Baku (GYD) Airport (in # of passengers and %)
2008 2009 2010
Arrived 1,023,303 964,549 997,118
Departed 1,002,113 961,426 986,553
TOTAL 2,025,416 1,925,975 1,983,671
of which carried by AZAL (domestic & international) 1,304,611 1,083,578 933,608
in percentage 64.4% 56.3% 47.1%
of which carried by AZAL internationally 797,686 630,081 763,989
in percentage 39.4% 32.7% 38.5%Source: Created by the author based on data from AZAL
The number of international passengers to/from Azerbaijan exceeded 2.1 million in 2010, of
which 83% or 1.8 million arrived at and departed from GYD and 17% (374,639) to/from
Azerbaijan’s remaining three regional airports. In 2008, the GYD airport processed more than 2
million passengers on domestic and international flights. Total passenger traffic at GYD dropped
slightly in 2009 to 1.9 million passengers, but picked up again in 2010 with nearly 2 million
passengers (Figure 2.43).330 AZAL carried 39% of all passengers on international flights at GYD in
2008, 33% in 2009 and 39% in 2010.
In the short term the upwards trend in
passenger traffic is likely to continue. In
2011‐2014, the average growth rate in
passenger traffic is estimated to be
between 7.2% and 7.5%.331 Boeing
notes that passenger traffic at the GYD
airport will more than double in the
next 20 years (Figure 2.45), exceeding 5
million passengers by 2030. However,
given the past trend and ongoing
projects (i.e. the expansion of the
current airport and developments in
the tourism sector), this study predicts that the GYD airport is likely to hit the 5 million
Figure 2.44: Total Number of Passengers Carried by AZAL: International vs. Domestic (2008‐2010) (in %)
Source: AZAL
‐
200,000
400,000
600,000
800,000
1,000,000
1,200,000
1,400,000
2008 2009 2010
Domestic International
61%58%
78%
39% 42%22%
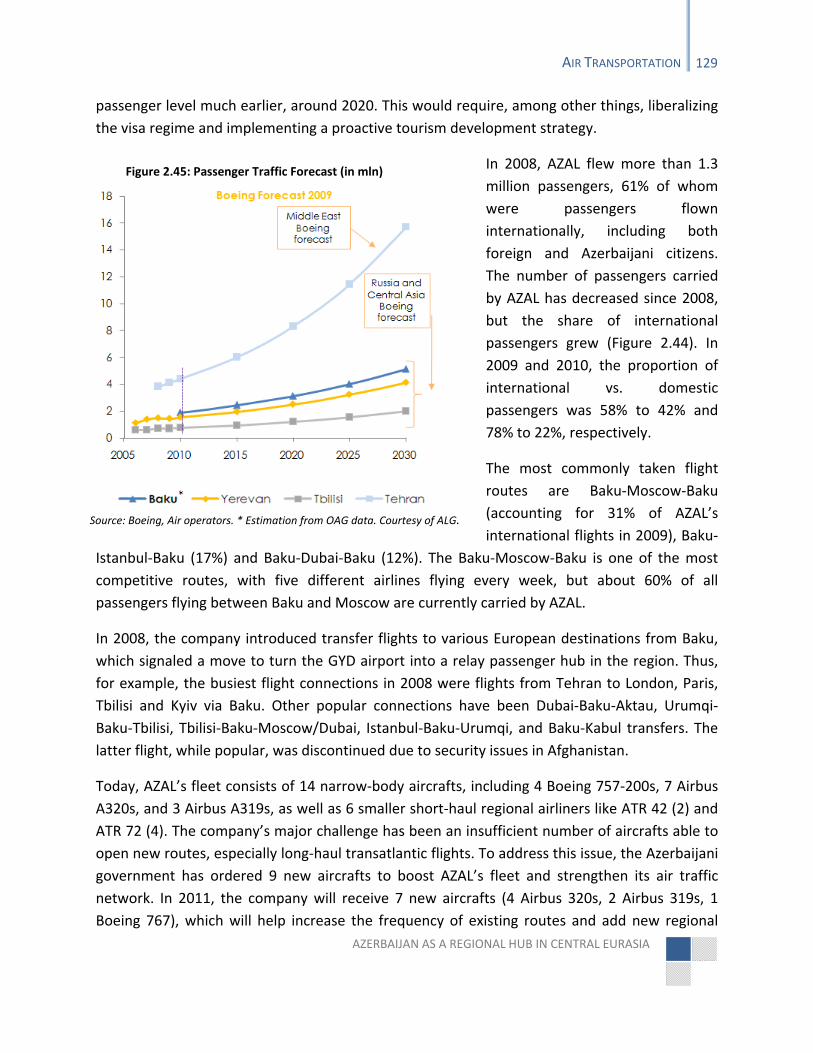
AZERBAIJAN AS A REGIONAL HUB IN CENTRAL EURASIA
AIR TRANSPORTATION 129
passenger level much earlier, around 2020. This would require, among other things, liberalizing
the visa regime and implementing a proactive tourism development strategy.
In 2008, AZAL flew more than 1.3
million passengers, 61% of whom
were passengers flown
internationally, including both
foreign and Azerbaijani citizens.
The number of passengers carried
by AZAL has decreased since 2008,
but the share of international
passengers grew (Figure 2.44). In
2009 and 2010, the proportion of
international vs. domestic
passengers was 58% to 42% and
78% to 22%, respectively.
The most commonly taken flight
routes are Baku‐Moscow‐Baku
(accounting for 31% of AZAL’s
international flights in 2009), Baku‐
Istanbul‐Baku (17%) and Baku‐Dubai‐Baku (12%). The Baku‐Moscow‐Baku is one of the most
competitive routes, with five different airlines flying every week, but about 60% of all
passengers flying between Baku and Moscow are currently carried by AZAL.
In 2008, the company introduced transfer flights to various European destinations from Baku,
which signaled a move to turn the GYD airport into a relay passenger hub in the region. Thus,
for example, the busiest flight connections in 2008 were flights from Tehran to London, Paris,
Tbilisi and Kyiv via Baku. Other popular connections have been Dubai‐Baku‐Aktau, Urumqi‐
Baku‐Tbilisi, Tbilisi‐Baku‐Moscow/Dubai, Istanbul‐Baku‐Urumqi, and Baku‐Kabul transfers. The
latter flight, while popular, was discontinued due to security issues in Afghanistan.
Today, AZAL’s fleet consists of 14 narrow‐body aircrafts, including 4 Boeing 757‐200s, 7 Airbus
А320s, and 3 Airbus А319s, as well as 6 smaller short‐haul regional airliners like ATR 42 (2) and
ATR 72 (4). The company’s major challenge has been an insufficient number of aircrafts able to
open new routes, especially long‐haul transatlantic flights. To address this issue, the Azerbaijani
government has ordered 9 new aircrafts to boost AZAL’s fleet and strengthen its air traffic
network. In 2011, the company will receive 7 new aircrafts (4 Airbus 320s, 2 Airbus 319s, 1
Boeing 767), which will help increase the frequency of existing routes and add new regional
Figure 2.45: Passenger Traffic Forecast (in mln)
Source: Boeing, Air operators. * Estimation from OAG data. Courtesy of ALG.
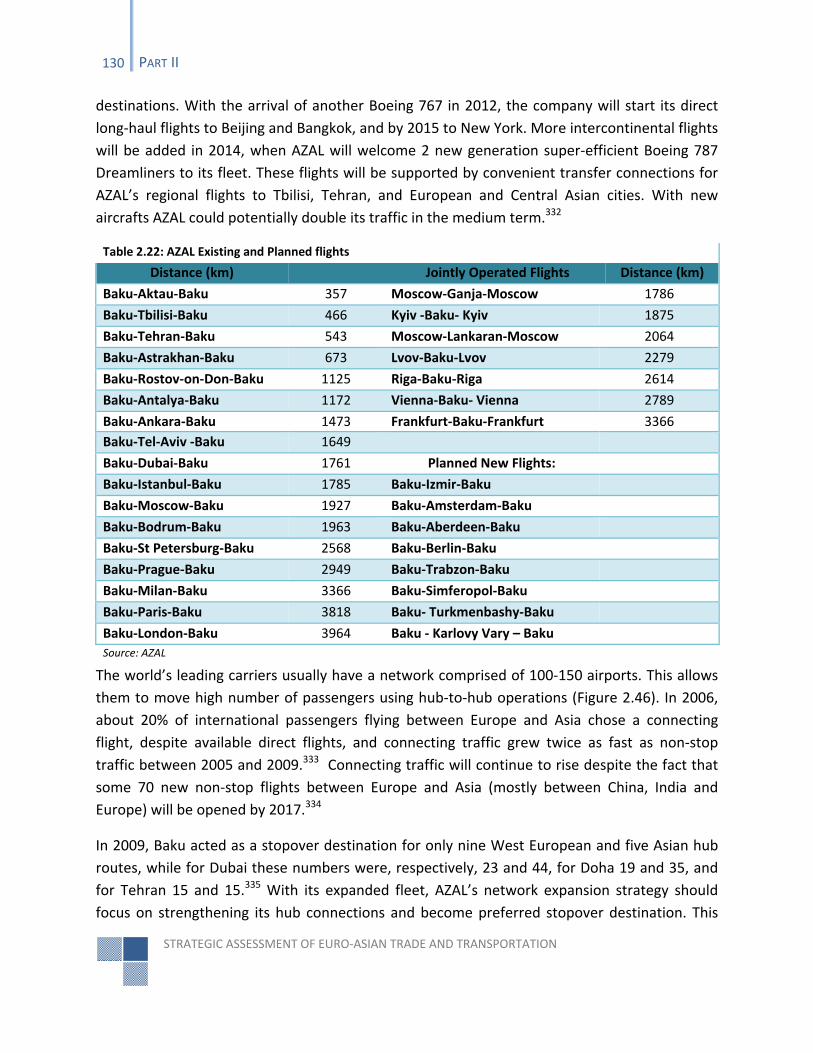
STRATEGIC ASSESSMENT OF EURO‐ASIAN TRADE AND TRANSPORTATION
130 PART II
destinations. With the arrival of another Boeing 767 in 2012, the company will start its direct
long‐haul flights to Beijing and Bangkok, and by 2015 to New York. More intercontinental flights
will be added in 2014, when AZAL will welcome 2 new generation super‐efficient Boeing 787
Dreamliners to its fleet. These flights will be supported by convenient transfer connections for
AZAL’s regional flights to Tbilisi, Tehran, and European and Central Asian cities. With new
aircrafts AZAL could potentially double its traffic in the medium term.332
Table 2.22: AZAL Existing and Planned flights
Distance (km) Jointly Operated Flights Distance (km)
Baku‐Aktau‐Baku 357 Moscow‐Ganja‐Moscow 1786
Baku‐Tbilisi‐Baku 466 Kyiv ‐Baku‐ Kyiv 1875
Baku‐Tehran‐Baku 543 Moscow‐Lankaran‐Moscow 2064
Baku‐Astrakhan‐Baku 673 Lvov‐Baku‐Lvov 2279
Baku‐Rostov‐on‐Don‐Baku 1125 Riga‐Baku‐Riga 2614
Baku‐Antalya‐Baku 1172 Vienna‐Baku‐ Vienna 2789
Baku‐Ankara‐Baku 1473 Frankfurt‐Baku‐Frankfurt 3366
Baku‐Tel‐Aviv ‐Baku 1649
Baku‐Dubai‐Baku 1761 Planned New Flights:
Baku‐Istanbul‐Baku 1785 Baku‐Izmir‐Baku
Baku‐Moscow‐Baku 1927 Baku‐Amsterdam‐Baku
Baku‐Bodrum‐Baku 1963 Baku‐Aberdeen‐Baku
Baku‐St Petersburg‐Baku 2568 Baku‐Berlin‐Baku
Baku‐Prague‐Baku 2949 Baku‐Trabzon‐Baku
Baku‐Milan‐Baku 3366 Baku‐Simferopol‐Baku
Baku‐Paris‐Baku 3818 Baku‐ Turkmenbashy‐Baku
Baku‐London‐Baku 3964 Baku ‐ Karlovy Vary – Baku
Source: AZAL
The world’s leading carriers usually have a network comprised of 100‐150 airports. This allows
them to move high number of passengers using hub‐to‐hub operations (Figure 2.46). In 2006,
about 20% of international passengers flying between Europe and Asia chose a connecting
flight, despite available direct flights, and connecting traffic grew twice as fast as non‐stop
traffic between 2005 and 2009.333 Connecting traffic will continue to rise despite the fact that
some 70 new non‐stop flights between Europe and Asia (mostly between China, India and
Europe) will be opened by 2017.334
In 2009, Baku acted as a stopover destination for only nine West European and five Asian hub
routes, while for Dubai these numbers were, respectively, 23 and 44, for Doha 19 and 35, and
for Tehran 15 and 15.335 With its expanded fleet, AZAL’s network expansion strategy should
focus on strengthening its hub connections and become preferred stopover destination. This
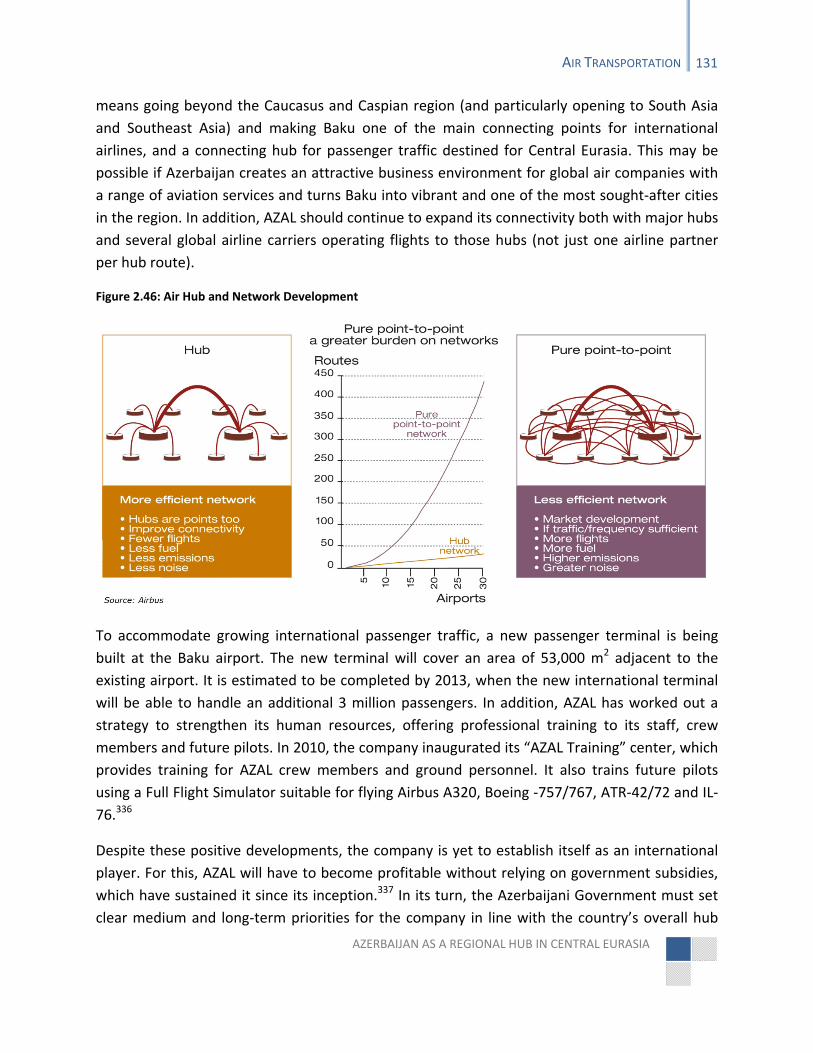
AZERBAIJAN AS A REGIONAL HUB IN CENTRAL EURASIA
AIR TRANSPORTATION 131
means going beyond the Caucasus and Caspian region (and particularly opening to South Asia
and Southeast Asia) and making Baku one of the main connecting points for international
airlines, and a connecting hub for passenger traffic destined for Central Eurasia. This may be
possible if Azerbaijan creates an attractive business environment for global air companies with
a range of aviation services and turns Baku into vibrant and one of the most sought‐after cities
in the region. In addition, AZAL should continue to expand its connectivity both with major hubs
and several global airline carriers operating flights to those hubs (not just one airline partner
per hub route).
To accommodate growing international passenger traffic, a new passenger terminal is being
built at the Baku airport. The new terminal will cover an area of 53,000 m2 adjacent to the
existing airport. It is estimated to be completed by 2013, when the new international terminal
will be able to handle an additional 3 million passengers. In addition, AZAL has worked out a
strategy to strengthen its human resources, offering professional training to its staff, crew
members and future pilots. In 2010, the company inaugurated its “AZAL Training” center, which
provides training for AZAL crew members and ground personnel. It also trains future pilots
using a Full Flight Simulator suitable for flying Airbus A320, Boeing ‐757/767, ATR‐42/72 and IL‐
76.336
Despite these positive developments, the company is yet to establish itself as an international
player. For this, AZAL will have to become profitable without relying on government subsidies,
which have sustained it since its inception.337 In its turn, the Azerbaijani Government must set
clear medium and long‐term priorities for the company in line with the country’s overall hub
Figure 2.46: Air Hub and Network Development
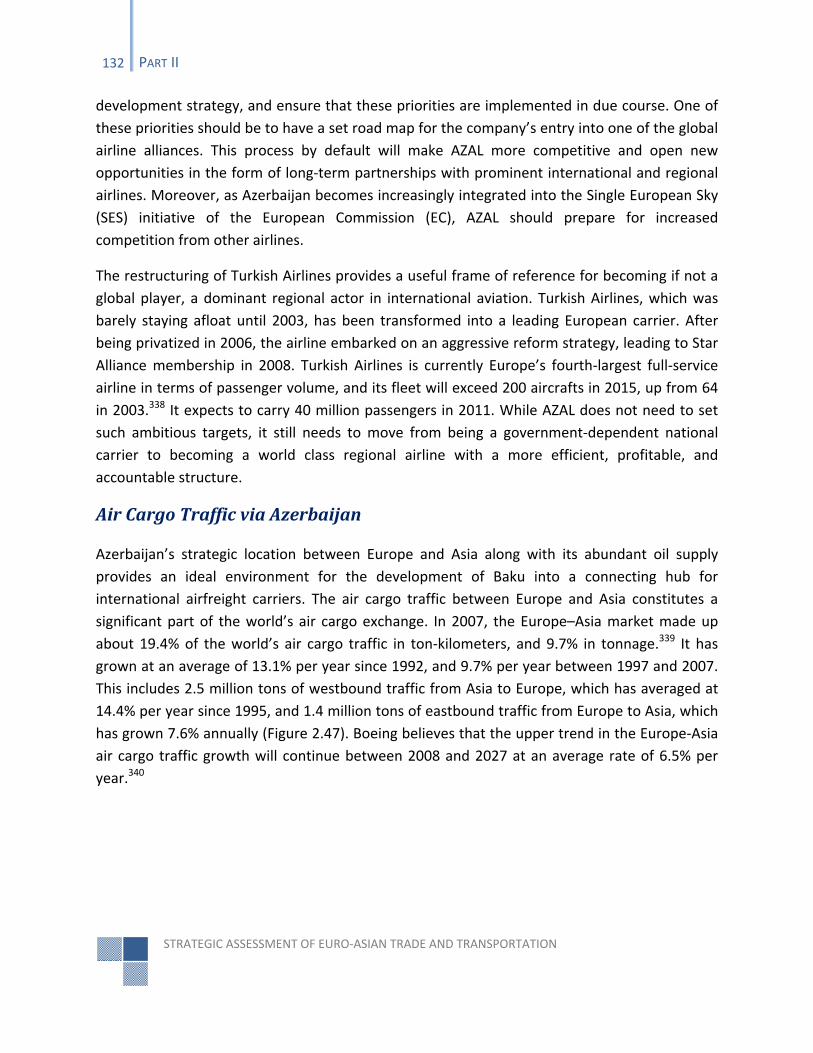
STRATEGIC ASSESSMENT OF EURO‐ASIAN TRADE AND TRANSPORTATION
132 PART II
development strategy, and ensure that these priorities are implemented in due course. One of
these priorities should be to have a set road map for the company’s entry into one of the global
airline alliances. This process by default will make AZAL more competitive and open new
opportunities in the form of long‐term partnerships with prominent international and regional
airlines. Moreover, as Azerbaijan becomes increasingly integrated into the Single European Sky
(SES) initiative of the European Commission (EC), AZAL should prepare for increased
competition from other airlines.
The restructuring of Turkish Airlines provides a useful frame of reference for becoming if not a
global player, a dominant regional actor in international aviation. Turkish Airlines, which was
barely staying afloat until 2003, has been transformed into a leading European carrier. After
being privatized in 2006, the airline embarked on an aggressive reform strategy, leading to Star
Alliance membership in 2008. Turkish Airlines is currently Europe’s fourth‐largest full‐service
airline in terms of passenger volume, and its fleet will exceed 200 aircrafts in 2015, up from 64
in 2003.338 It expects to carry 40 million passengers in 2011. While AZAL does not need to set
such ambitious targets, it still needs to move from being a government‐dependent national
carrier to becoming a world class regional airline with a more efficient, profitable, and
accountable structure.
Air Cargo Traffic via Azerbaijan
Azerbaijan’s strategic location between Europe and Asia along with its abundant oil supply
provides an ideal environment for the development of Baku into a connecting hub for
international airfreight carriers. The air cargo traffic between Europe and Asia constitutes a
significant part of the world’s air cargo exchange. In 2007, the Europe–Asia market made up
about 19.4% of the world’s air cargo traffic in ton‐kilometers, and 9.7% in tonnage.339 It has
grown at an average of 13.1% per year since 1992, and 9.7% per year between 1997 and 2007.
This includes 2.5 million tons of westbound traffic from Asia to Europe, which has averaged at
14.4% per year since 1995, and 1.4 million tons of eastbound traffic from Europe to Asia, which
has grown 7.6% annually (Figure 2.47). Boeing believes that the upper trend in the Europe‐Asia
air cargo traffic growth will continue between 2008 and 2027 at an average rate of 6.5% per
year.340
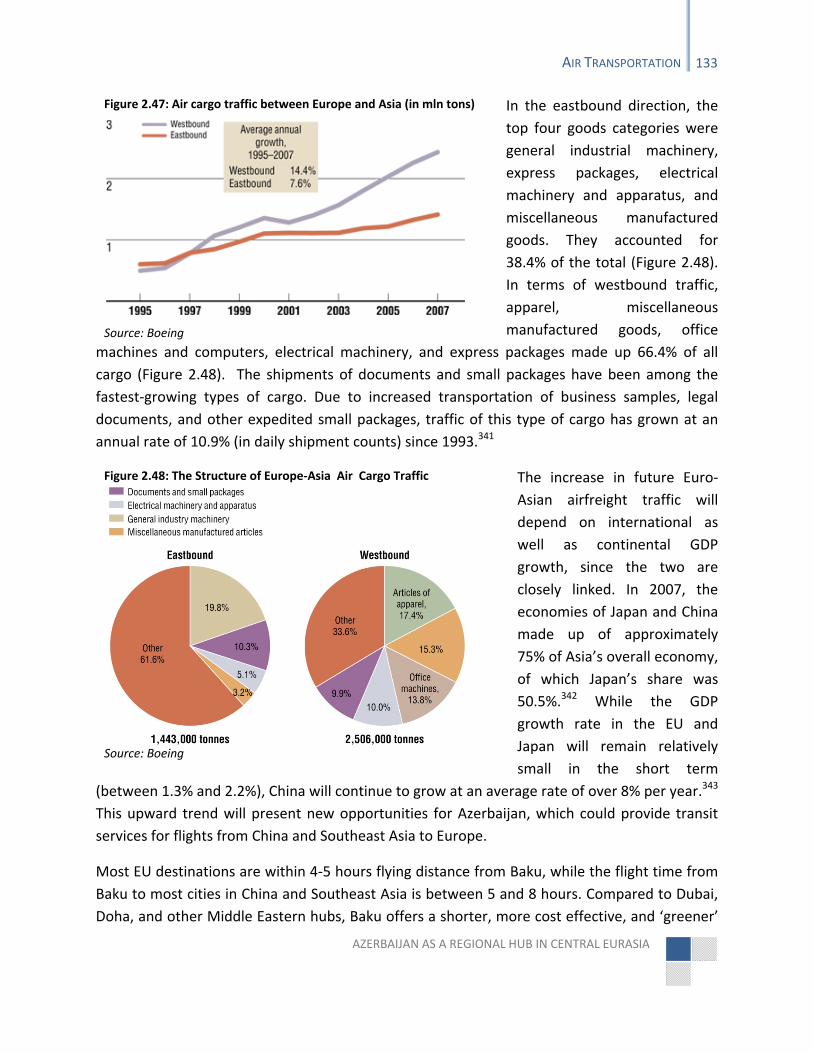
AZERBAIJAN AS A REGIONAL HUB IN CENTRAL EURASIA
AIR TRANSPORTATION 133
In the eastbound direction, the
top four goods categories were
general industrial machinery,
express packages, electrical
machinery and apparatus, and
miscellaneous manufactured
goods. They accounted for
38.4% of the total (Figure 2.48).
In terms of westbound traffic,
apparel, miscellaneous
manufactured goods, office
machines and computers, electrical machinery, and express packages made up 66.4% of all
cargo (Figure 2.48). The shipments of documents and small packages have been among the
fastest‐growing types of cargo. Due to increased transportation of business samples, legal
documents, and other expedited small packages, traffic of this type of cargo has grown at an
annual rate of 10.9% (in daily shipment counts) since 1993.341
The increase in future Euro‐
Asian airfreight traffic will
depend on international as
well as continental GDP
growth, since the two are
closely linked. In 2007, the
economies of Japan and China
made up of approximately
75% of Asia’s overall economy,
of which Japan’s share was
50.5%.342 While the GDP
growth rate in the EU and
Japan will remain relatively
small in the short term
(between 1.3% and 2.2%), China will continue to grow at an average rate of over 8% per year.343
This upward trend will present new opportunities for Azerbaijan, which could provide transit
services for flights from China and Southeast Asia to Europe.
Most EU destinations are within 4‐5 hours flying distance from Baku, while the flight time from
Baku to most cities in China and Southeast Asia is between 5 and 8 hours. Compared to Dubai,
Doha, and other Middle Eastern hubs, Baku offers a shorter, more cost effective, and ‘greener’
Figure 2.47: Air cargo traffic between Europe and Asia (in mln tons)
Source: Boeing
Figure 2.48: The Structure of Europe‐Asia Air Cargo Traffic
Source: Boeing
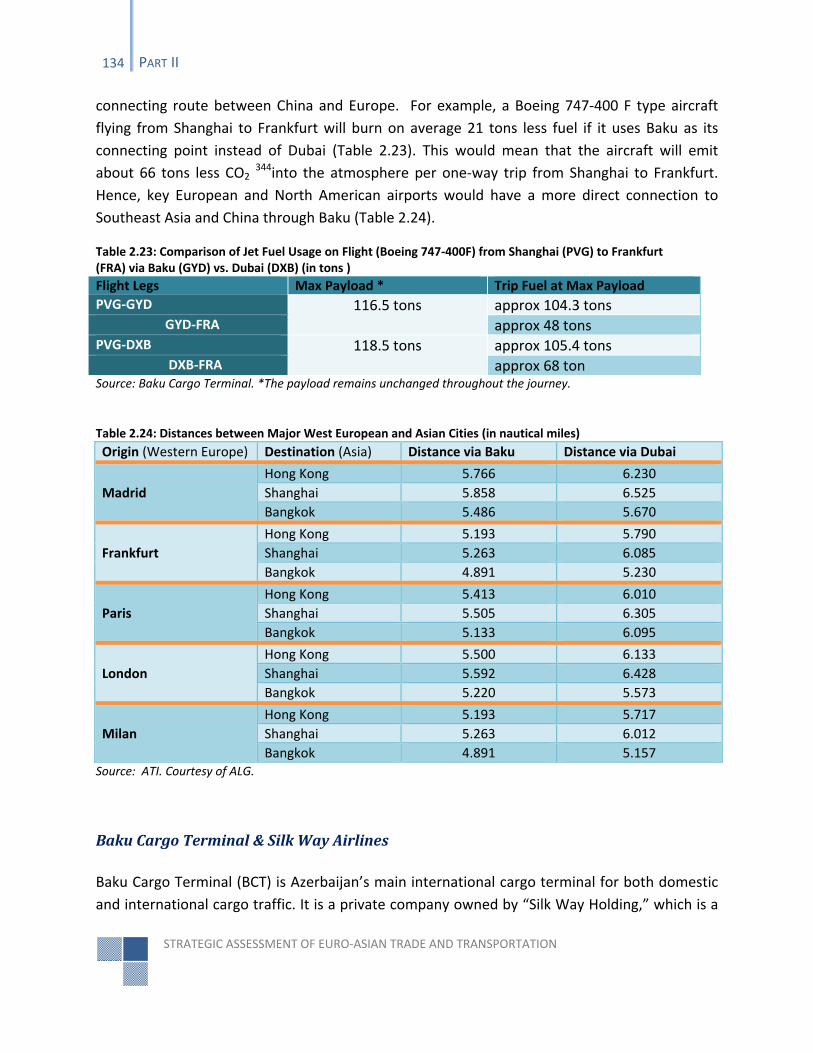
STRATEGIC ASSESSMENT OF EURO‐ASIAN TRADE AND TRANSPORTATION
134 PART II
connecting route between China and Europe. For example, a Boeing 747‐400 F type aircraft
flying from Shanghai to Frankfurt will burn on average 21 tons less fuel if it uses Baku as its
connecting point instead of Dubai (Table 2.23). This would mean that the aircraft will emit
about 66 tons less CO2 344into the atmosphere per one‐way trip from Shanghai to Frankfurt.
Hence, key European and North American airports would have a more direct connection to
Southeast Asia and China through Baku (Table 2.24).
Table 2.23: Comparison of Jet Fuel Usage on Flight (Boeing 747‐400F) from Shanghai (PVG) to Frankfurt (FRA) via Baku (GYD) vs. Dubai (DXB) (in tons )
Flight Legs Max Payload * Trip Fuel at Max Payload
PVG‐GYD 116.5 tons approx 104.3 tons GYD‐FRA approx 48 tons PVG‐DXB 118.5 tons approx 105.4 tons DXB‐FRA approx 68 ton Source: Baku Cargo Terminal. *The payload remains unchanged throughout the journey.
Origin (Western Europe) Destination (Asia) Distance via Baku Distance via Dubai
Madrid
Hong Kong 5.766 6.230
Shanghai 5.858 6.525
Bangkok 5.486 5.670
Frankfurt
Hong Kong 5.193 5.790
Shanghai 5.263 6.085
Bangkok 4.891 5.230
Paris
Hong Kong 5.413 6.010
Shanghai 5.505 6.305
Bangkok 5.133 6.095
London
Hong Kong 5.500 6.133
Shanghai 5.592 6.428
Bangkok 5.220 5.573
Milan
Hong Kong 5.193 5.717
Shanghai 5.263 6.012
Bangkok 4.891 5.157 Source: ATI. Courtesy of ALG.
Baku Cargo Terminal & Silk Way Airlines
Baku Cargo Terminal (BCT) is Azerbaijan’s main international cargo terminal for both domestic
and international cargo traffic. It is a private company owned by “Silk Way Holding,” which is a
Table 2.24: Distances between Major West European and Asian Cities (in nautical miles)
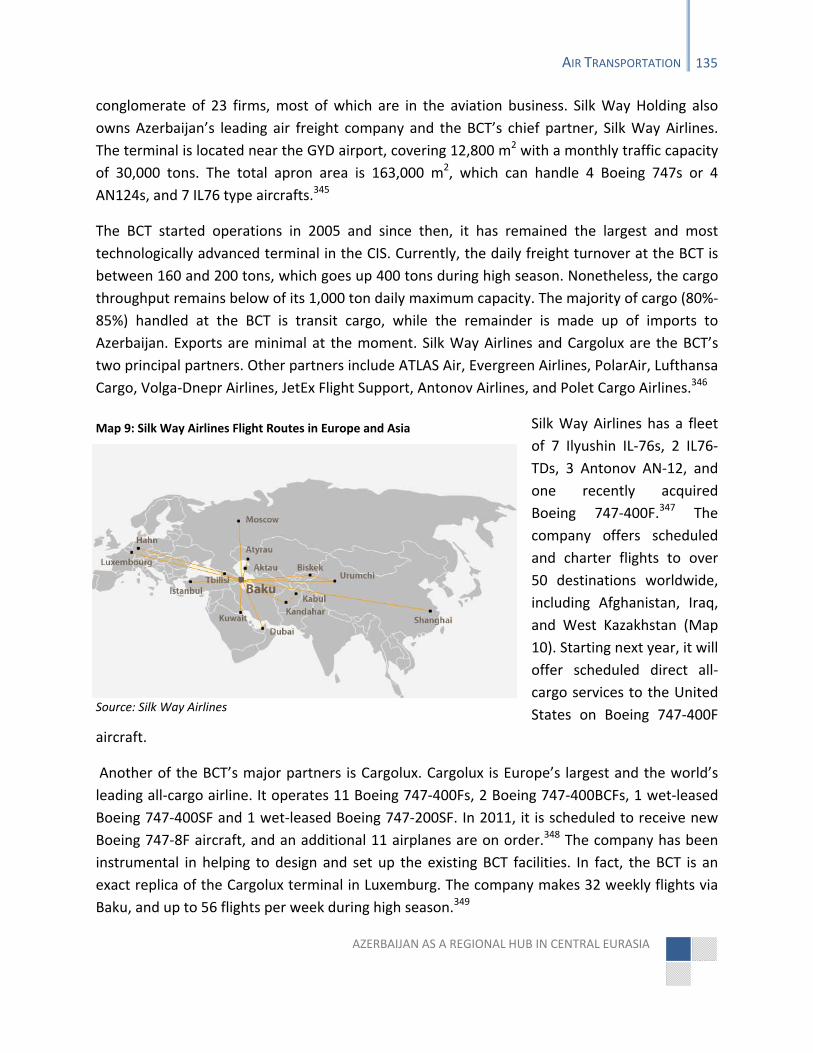
AZERBAIJAN AS A REGIONAL HUB IN CENTRAL EURASIA
AIR TRANSPORTATION 135
conglomerate of 23 firms, most of which are in the aviation business. Silk Way Holding also
owns Azerbaijan’s leading air freight company and the BCT’s chief partner, Silk Way Airlines.
The terminal is located near the GYD airport, covering 12,800 m2 with a monthly traffic capacity
of 30,000 tons. The total apron area is 163,000 m2, which can handle 4 Boeing 747s or 4
AN124s, and 7 IL76 type aircrafts.345
The BCT started operations in 2005 and since then, it has remained the largest and most
technologically advanced terminal in the CIS. Currently, the daily freight turnover at the BCT is
between 160 and 200 tons, which goes up 400 tons during high season. Nonetheless, the cargo
throughput remains below of its 1,000 ton daily maximum capacity. The majority of cargo (80%‐
85%) handled at the BCT is transit cargo, while the remainder is made up of imports to
Azerbaijan. Exports are minimal at the moment. Silk Way Airlines and Cargolux are the BCT’s
two principal partners. Other partners include ATLAS Air, Evergreen Airlines, PolarAir, Lufthansa
Cargo, Volga‐Dnepr Airlines, JetEx Flight Support, Antonov Airlines, and Polet Cargo Airlines.346
Silk Way Airlines has a fleet
of 7 Ilyushin IL‐76s, 2 IL76‐
TDs, 3 Antonov AN‐12, and
one recently acquired
Boeing 747‐400F.347 The
company offers scheduled
and charter flights to over
50 destinations worldwide,
including Afghanistan, Iraq,
and West Kazakhstan (Map
10). Starting next year, it will
offer scheduled direct all‐
cargo services to the United
States on Boeing 747‐400F
aircraft.
Another of the BCT’s major partners is Cargolux. Cargolux is Europe’s largest and the world’s
leading all‐cargo airline. It operates 11 Boeing 747‐400Fs, 2 Boeing 747‐400BCFs, 1 wet‐leased
Boeing 747‐400SF and 1 wet‐leased Boeing 747‐200SF. In 2011, it is scheduled to receive new
Boeing 747‐8F aircraft, and an additional 11 airplanes are on order.348 The company has been
instrumental in helping to design and set up the existing BCT facilities. In fact, the BCT is an
exact replica of the Cargolux terminal in Luxemburg. The company makes 32 weekly flights via
Baku, and up to 56 flights per week during high season.349
Map 9: Silk Way Airlines Flight Routes in Europe and Asia
Source: Silk Way Airlines
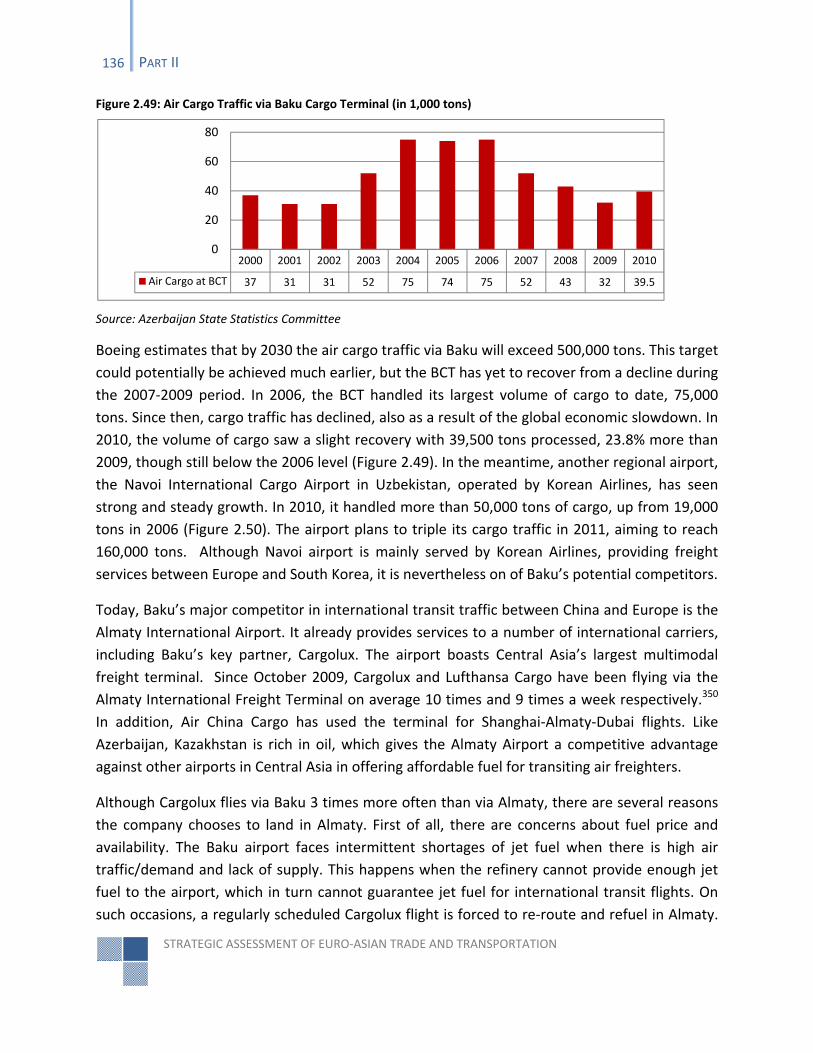
STRATEGIC ASSESSMENT OF EURO‐ASIAN TRADE AND TRANSPORTATION
136 PART II
Figure 2.49: Air Cargo Traffic via Baku Cargo Terminal (in 1,000 tons)
Source: Azerbaijan State Statistics Committee
Boeing estimates that by 2030 the air cargo traffic via Baku will exceed 500,000 tons. This target
could potentially be achieved much earlier, but the BCT has yet to recover from a decline during
the 2007‐2009 period. In 2006, the BCT handled its largest volume of cargo to date, 75,000
tons. Since then, cargo traffic has declined, also as a result of the global economic slowdown. In
2010, the volume of cargo saw a slight recovery with 39,500 tons processed, 23.8% more than
2009, though still below the 2006 level (Figure 2.49). In the meantime, another regional airport,
the Navoi International Cargo Airport in Uzbekistan, operated by Korean Airlines, has seen
strong and steady growth. In 2010, it handled more than 50,000 tons of cargo, up from 19,000
tons in 2006 (Figure 2.50). The airport plans to triple its cargo traffic in 2011, aiming to reach
160,000 tons. Although Navoi airport is mainly served by Korean Airlines, providing freight
services between Europe and South Korea, it is nevertheless on of Baku’s potential competitors.
Today, Baku’s major competitor in international transit traffic between China and Europe is the
Almaty International Airport. It already provides services to a number of international carriers,
including Baku’s key partner, Cargolux. The airport boasts Central Asia’s largest multimodal
freight terminal. Since October 2009, Cargolux and Lufthansa Cargo have been flying via the
Almaty International Freight Terminal on average 10 times and 9 times a week respectively.350
In addition, Air China Cargo has used the terminal for Shanghai‐Almaty‐Dubai flights. Like
Azerbaijan, Kazakhstan is rich in oil, which gives the Almaty Airport a competitive advantage
against other airports in Central Asia in offering affordable fuel for transiting air freighters.
Although Cargolux flies via Baku 3 times more often than via Almaty, there are several reasons
the company chooses to land in Almaty. First of all, there are concerns about fuel price and
availability. The Baku airport faces intermittent shortages of jet fuel when there is high air
traffic/demand and lack of supply. This happens when the refinery cannot provide enough jet
fuel to the airport, which in turn cannot guarantee jet fuel for international transit flights. On
such occasions, a regularly scheduled Cargolux flight is forced to re‐route and refuel in Almaty.
2000 2001 2002 2003 2004 2005 2006 2007 2008 2009 2010
Air Cargo at BCT 37 31 31 52 75 74 75 52 43 32 39.5
0
20
40
60
80
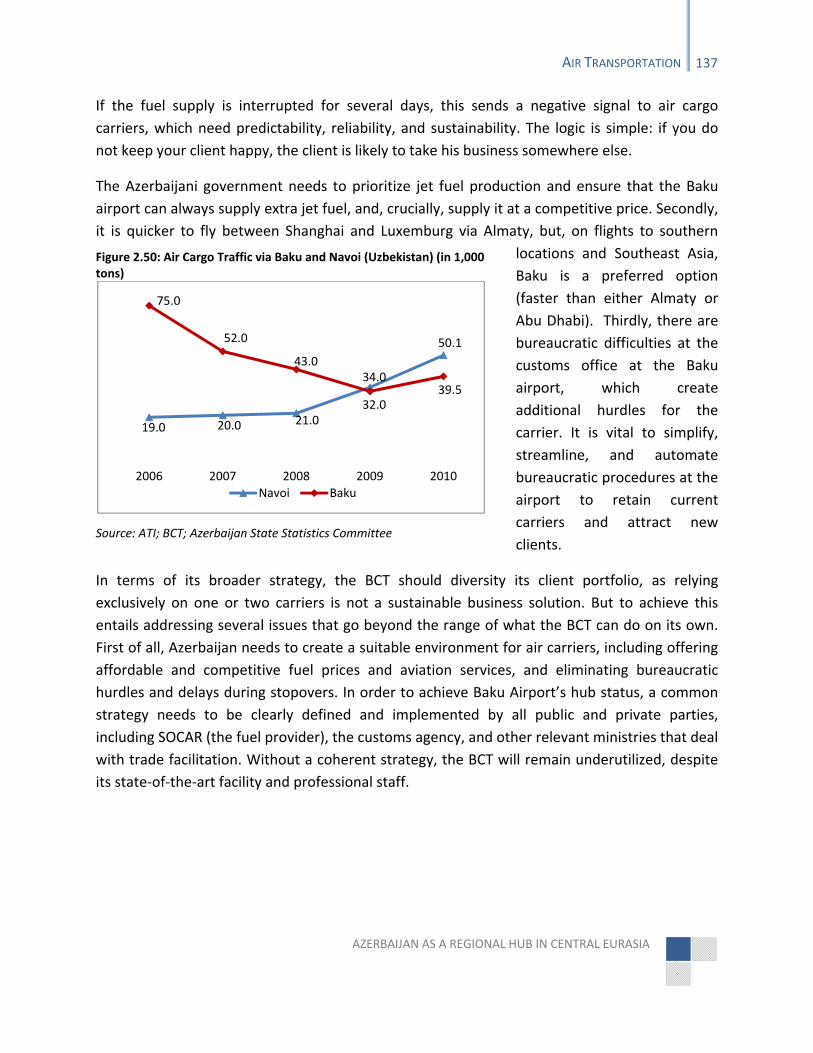
AZERBAIJAN AS A REGIONAL HUB IN CENTRAL EURASIA
AIR TRANSPORTATION 137
If the fuel supply is interrupted for several days, this sends a negative signal to air cargo
carriers, which need predictability, reliability, and sustainability. The logic is simple: if you do
not keep your client happy, the client is likely to take his business somewhere else.
The Azerbaijani government needs to prioritize jet fuel production and ensure that the Baku
airport can always supply extra jet fuel, and, crucially, supply it at a competitive price. Secondly,
it is quicker to fly between Shanghai and Luxemburg via Almaty, but, on flights to southern
locations and Southeast Asia,
Baku is a preferred option
(faster than either Almaty or
Abu Dhabi). Thirdly, there are
bureaucratic difficulties at the
customs office at the Baku
airport, which create
additional hurdles for the
carrier. It is vital to simplify,
streamline, and automate
bureaucratic procedures at the
airport to retain current
carriers and attract new
clients.
In terms of its broader strategy, the BCT should diversity its client portfolio, as relying
exclusively on one or two carriers is not a sustainable business solution. But to achieve this
entails addressing several issues that go beyond the range of what the BCT can do on its own.
First of all, Azerbaijan needs to create a suitable environment for air carriers, including offering
affordable and competitive fuel prices and aviation services, and eliminating bureaucratic
hurdles and delays during stopovers. In order to achieve Baku Airport’s hub status, a common
strategy needs to be clearly defined and implemented by all public and private parties,
including SOCAR (the fuel provider), the customs agency, and other relevant ministries that deal
with trade facilitation. Without a coherent strategy, the BCT will remain underutilized, despite
its state‐of‐the‐art facility and professional staff.
Figure 2.50: Air Cargo Traffic via Baku and Navoi (Uzbekistan) (in 1,000 tons)
Source: ATI; BCT; Azerbaijan State Statistics Committee
19.0 20.0 21.0
34.0
50.1
75.0
52.0
43.0
32.039.5
2006 2007 2008 2009 2010
Navoi Baku
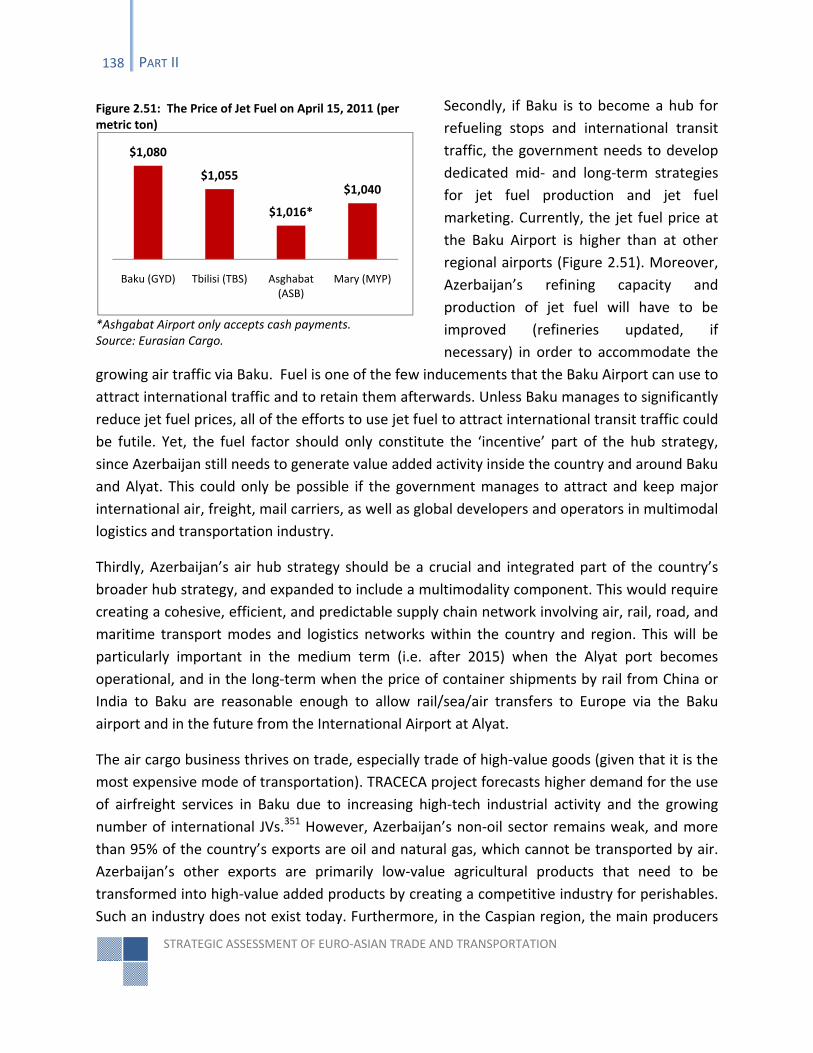
STRATEGIC ASSESSMENT OF EURO‐ASIAN TRADE AND TRANSPORTATION
138 PART II
Secondly, if Baku is to become a hub for
refueling stops and international transit
traffic, the government needs to develop
dedicated mid‐ and long‐term strategies
for jet fuel production and jet fuel
marketing. Currently, the jet fuel price at
the Baku Airport is higher than at other
regional airports (Figure 2.51). Moreover,
Azerbaijan’s refining capacity and
production of jet fuel will have to be
improved (refineries updated, if
necessary) in order to accommodate the
growing air traffic via Baku. Fuel is one of the few inducements that the Baku Airport can use to
attract international traffic and to retain them afterwards. Unless Baku manages to significantly
reduce jet fuel prices, all of the efforts to use jet fuel to attract international transit traffic could
be futile. Yet, the fuel factor should only constitute the ‘incentive’ part of the hub strategy,
since Azerbaijan still needs to generate value added activity inside the country and around Baku
and Alyat. This could only be possible if the government manages to attract and keep major
international air, freight, mail carriers, as well as global developers and operators in multimodal
logistics and transportation industry.
Thirdly, Azerbaijan’s air hub strategy should be a crucial and integrated part of the country’s
broader hub strategy, and expanded to include a multimodality component. This would require
creating a cohesive, efficient, and predictable supply chain network involving air, rail, road, and
maritime transport modes and logistics networks within the country and region. This will be
particularly important in the medium term (i.e. after 2015) when the Alyat port becomes
operational, and in the long‐term when the price of container shipments by rail from China or
India to Baku are reasonable enough to allow rail/sea/air transfers to Europe via the Baku
airport and in the future from the International Airport at Alyat.
The air cargo business thrives on trade, especially trade of high‐value goods (given that it is the
most expensive mode of transportation). TRACECA project forecasts higher demand for the use
of airfreight services in Baku due to increasing high‐tech industrial activity and the growing
number of international JVs.351 However, Azerbaijan’s non‐oil sector remains weak, and more
than 95% of the country’s exports are oil and natural gas, which cannot be transported by air.
Azerbaijan’s other exports are primarily low‐value agricultural products that need to be
transformed into high‐value added products by creating a competitive industry for perishables.
Such an industry does not exist today. Furthermore, in the Caspian region, the main producers
Figure 2.51: The Price of Jet Fuel on April 15, 2011 (per metric ton)
*Ashgabat Airport only accepts cash payments. Source: Eurasian Cargo.
$1,080
$1,055
$1,016*
$1,040
Baku (GYD) Tbilisi (TBS) Asghabat (ASB)
Mary (MYP)
AZERBAIJAN AS A REGIONAL HUB IN CENTRAL EURASIA
AIR TRANSPORTATION 139
and exporters of goods which might eventually be transported by air are concentrated in
Kazakhstan and Uzbekistan. Both of these countries have their own airports (Amlaty and Navoi)
and themselves aspire to becoming hubs. Therefore, for Azerbaijan, the success of air
transportation and the air hub strategy essentially depends on two interdependent schemes:
(1) attracting international cargo traffic to and via Baku, and gradually becoming a
regional air hub for international passenger and cargo airlines;
(2) generating trade by establishing a Free Zone at the Baku Airport. The next chapter
will examine in depth the concept of the Free Economic Zones and Port Development
introducing an integrated hub development approach.

AZERBAIJAN AS A REGIONAL HUB IN CENTRAL EURASIA
PART III
FREE ECONOMIC ZONES AND PORT DEVELOPMENT
IN THE 21ST CENTURY

AZERBAIJAN AS A REGIONAL HUB IN CENTRAL EURASIA
3. FREE ECONOMIC ZONE DEVELOPMENT
Most developing states around the world have used Free or Special Economic Zones as a way to
stimulate the growth of national economy, modernize infrastructure, generate new
employment opportunities, introduce economic reforms, and attract Foreign Direct Investment
(FDI) and “know‐how”. Although references to city‐specific free zones go back to the 18th
century, and can even be found in city records from Ancient Greece, ‘modern’ free zones did
not appear until the 20th century.352 The past sixty years, in particular, have seen a dramatic
increase in the number of modern zones. In 1979, there were 344 trade zones with tax‐free
regime, freeports, and other special economic zones in 72 countries around the world,
processing about $1.3 billion out of an estimated $100 billion of total world trade.353 In 2008, in
developing and transition countries alone, the number of economic zones exceeded 2,300,
including 443 zones in Central and Eastern Europe and Central Asia.354
As the number of different economic zones grew, so did the range of their activity. The World
Bank and UNESCAP provide a list of definitions for the various types of economic zones (Table
3.1 and Table 3.2). Recognizing this diversity, the current study uses the term “Free Economic
Zone” (FEZ) to refer to a specifically designated geographic area which is administered and
regulated by a special legal and regulatory regime. Here, therefore, the term “FEZ” is used as
an umbrella term to encompass most zone types, including special economic zones (SEZ), free
trade or specialized zones (FTZ), export processing zones (EPZ), freeports, but excluding
industrial cities and single factory schemes.
The FEZ is an essential economic tool available to resource‐rich countries, including Azerbaijan,
to develop their non‐oil economies. The economic development necessary to Azerbaijan’s
Central Eurasian hub vision is dependent on a comprehensive and integrated FEZ development
policy, which would include the new Alyat project and Baku International Airport. Thus, this
study will treat FEZ as a critical component of Azerbaijan’s hub strategy as well as an economic
device to generate revenue and diversify economy. The few successful FEZ cases around the
world were not significantly different in terms of policy foundation when compared to their
unsuccessful counterparts. What made a difference, among other things, was the FEZ legal and
regulatory structure and how this structure was implemented. The integrated approach
outlined here may require the Azerbaijani government to re‐examine Azerbaijan’s current FEZ
policy and legal framework, and adapt it to support the larger hub vision proposed by this
study.
This section focuses on FEZ and Port Development. The first part will examine the FEZ
development process in Azerbaijan, followed by an assessment of the different types of FEZ,
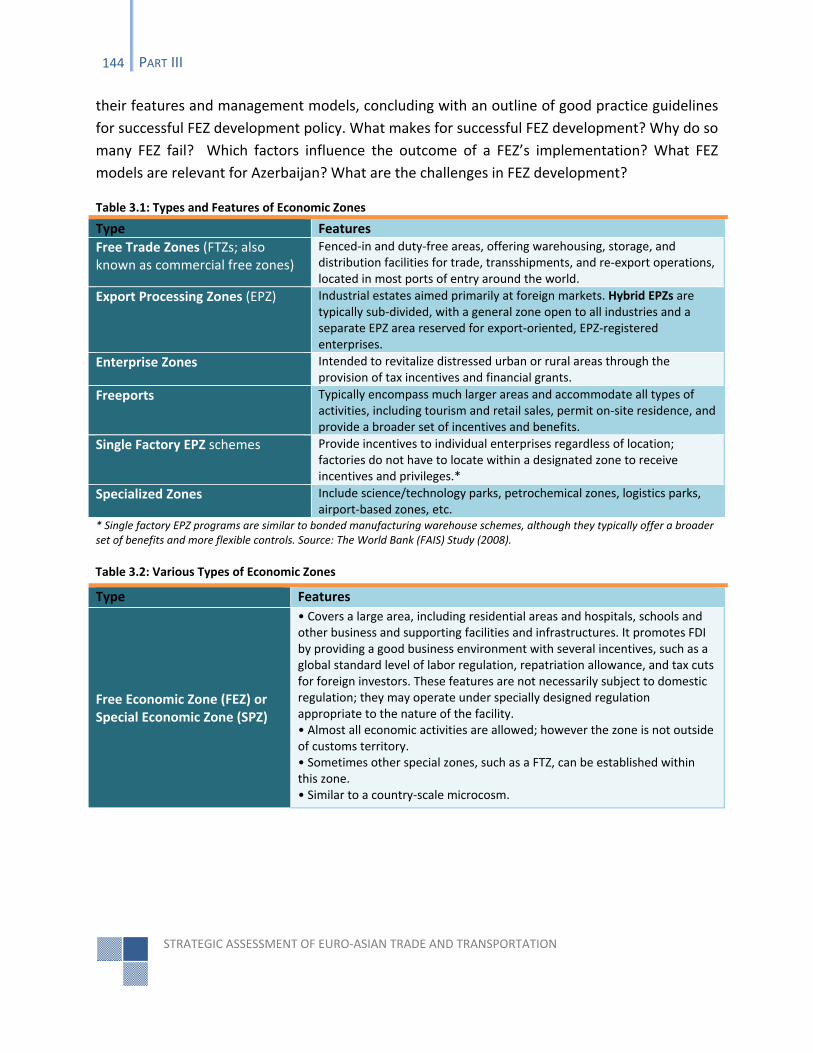
STRATEGIC ASSESSMENT OF EURO‐ASIAN TRADE AND TRANSPORTATION
144 PART III
their features and management models, concluding with an outline of good practice guidelines
for successful FEZ development policy. What makes for successful FEZ development? Why do so
many FEZ fail? Which factors influence the outcome of a FEZ’s implementation? What FEZ
models are relevant for Azerbaijan? What are the challenges in FEZ development?
Table 3.1: Types and Features of Economic Zones
Type Features
Free Trade Zones (FTZs; also known as commercial free zones)
Fenced‐in and duty‐free areas, offering warehousing, storage, and distribution facilities for trade, transshipments, and re‐export operations, located in most ports of entry around the world.
Export Processing Zones (EPZ) Industrial estates aimed primarily at foreign markets. Hybrid EPZs are typically sub‐divided, with a general zone open to all industries and a separate EPZ area reserved for export‐oriented, EPZ‐registered enterprises.
Enterprise Zones Intended to revitalize distressed urban or rural areas through the provision of tax incentives and financial grants.
Freeports Typically encompass much larger areas and accommodate all types of activities, including tourism and retail sales, permit on‐site residence, and provide a broader set of incentives and benefits.
Single Factory EPZ schemes Provide incentives to individual enterprises regardless of location; factories do not have to locate within a designated zone to receive incentives and privileges.*
Specialized Zones Include science/technology parks, petrochemical zones, logistics parks, airport‐based zones, etc.
* Single factory EPZ programs are similar to bonded manufacturing warehouse schemes, although they typically offer a broader set of benefits and more flexible controls. Source: The World Bank (FAIS) Study (2008).
Table 3.2: Various Types of Economic Zones
Type Features
Free Economic Zone (FEZ) or Special Economic Zone (SPZ)
• Covers a large area, including residential areas and hospitals, schools and other business and supporting facilities and infrastructures. It promotes FDI by providing a good business environment with several incentives, such as a global standard level of labor regulation, repatriation allowance, and tax cuts for foreign investors. These features are not necessarily subject to domestic regulation; they may operate under specially designed regulation appropriate to the nature of the facility. • Almost all economic activities are allowed; however the zone is not outside of customs territory. • Sometimes other special zones, such as a FTZ, can be established within this zone. • Similar to a country‐scale microcosm.
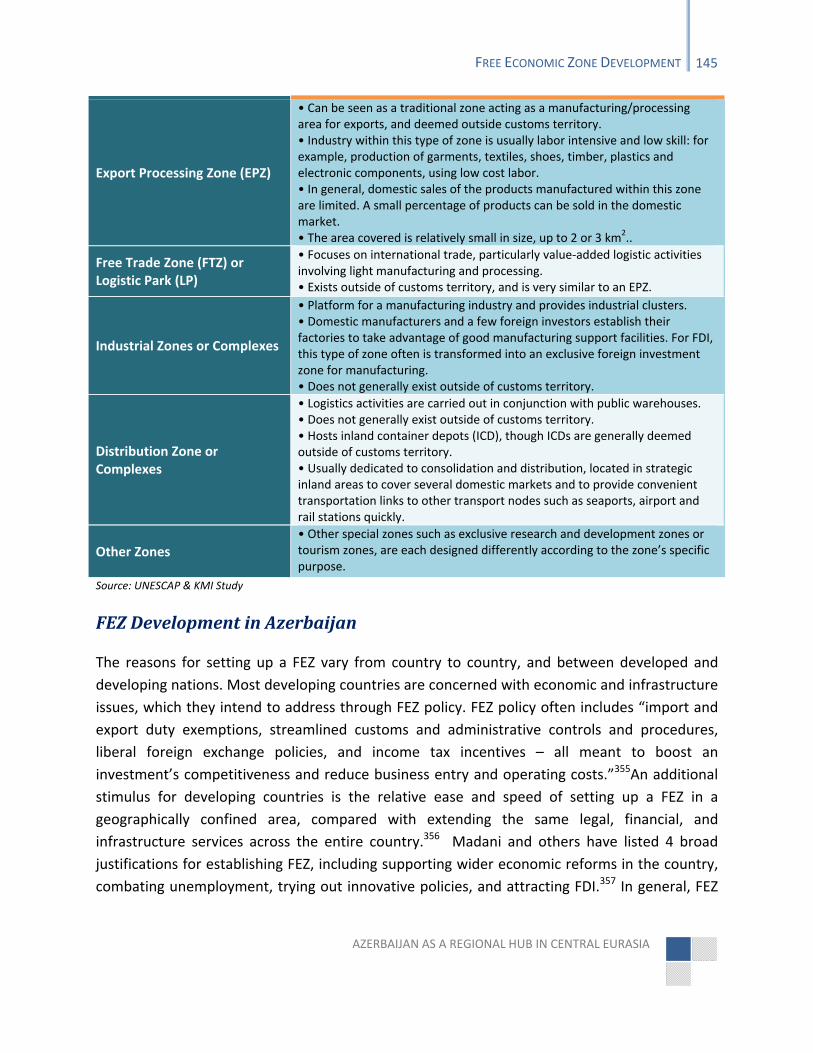
AZERBAIJAN AS A REGIONAL HUB IN CENTRAL EURASIA
FREE ECONOMIC ZONE DEVELOPMENT 145
Export Processing Zone (EPZ)
• Can be seen as a traditional zone acting as a manufacturing/processing area for exports, and deemed outside customs territory. • Industry within this type of zone is usually labor intensive and low skill: for example, production of garments, textiles, shoes, timber, plastics and electronic components, using low cost labor. • In general, domestic sales of the products manufactured within this zone are limited. A small percentage of products can be sold in the domestic market. • The area covered is relatively small in size, up to 2 or 3 km2..
Free Trade Zone (FTZ) or Logistic Park (LP)
• Focuses on international trade, particularly value‐added logistic activities involving light manufacturing and processing. • Exists outside of customs territory, and is very similar to an EPZ.
Industrial Zones or Complexes
• Platform for a manufacturing industry and provides industrial clusters.• Domestic manufacturers and a few foreign investors establish their factories to take advantage of good manufacturing support facilities. For FDI, this type of zone often is transformed into an exclusive foreign investment zone for manufacturing. • Does not generally exist outside of customs territory.
Distribution Zone or Complexes
• Logistics activities are carried out in conjunction with public warehouses.• Does not generally exist outside of customs territory. • Hosts inland container depots (ICD), though ICDs are generally deemed outside of customs territory. • Usually dedicated to consolidation and distribution, located in strategic inland areas to cover several domestic markets and to provide convenient transportation links to other transport nodes such as seaports, airport and rail stations quickly.
Other Zones
• Other special zones such as exclusive research and development zones or tourism zones, are each designed differently according to the zone’s specific purpose.
Source: UNESCAP & KMI Study
FEZ Development in Azerbaijan
The reasons for setting up a FEZ vary from country to country, and between developed and
developing nations. Most developing countries are concerned with economic and infrastructure
issues, which they intend to address through FEZ policy. FEZ policy often includes “import and
export duty exemptions, streamlined customs and administrative controls and procedures,
liberal foreign exchange policies, and income tax incentives – all meant to boost an
investment’s competitiveness and reduce business entry and operating costs.”355An additional
stimulus for developing countries is the relative ease and speed of setting up a FEZ in a
geographically confined area, compared with extending the same legal, financial, and
infrastructure services across the entire country.356 Madani and others have listed 4 broad
justifications for establishing FEZ, including supporting wider economic reforms in the country,
combating unemployment, trying out innovative policies, and attracting FDI.357 In general, FEZ
STRATEGIC ASSESSMENT OF EURO‐ASIAN TRADE AND TRANSPORTATION
146 PART III
is one of many means available to governments which want to introduce new economic
reforms on a more gradual basis.
Over time, the traditional notion of FEZ development as a way to stimulate the economy and
increase export‐oriented growth in an isolated area has evolved and expanded. Today, many
FEZs provide a platform for “two‐way trade”, facilitating the “liberalization and modernization
of the host economy… [and] integrating zones into the domestic economy.”358 This has been
accompanied by the introduction of a wide range of services and activities at FEZs, beyond their
traditional manufacturing and processing focus. These services include logistics services,
warehousing, transshipments, consolidation, labeling. Most notably, there has been a boom in
privately operated and developed FEZs, which in 2008 accounted for 62% of all zones in
developing and transition countries (Table 3.3).
Table 3.3: Private and Public Sector Zones in Developing and Transition Economies
Region Public Zones Private Zones Total
Americas 146 394 540
Asia and the Pacific 435 556 991
Sub‐Saharan Africa 49 65 114
Middle East and North Africa 173 40 213
Central and Eastern Europe and Central Asia 69 374 443
Total 872 1,429 2,301 Note: Excludes single factory programs. Sources: BearingPoint; ILO database; WEPZA (2007); FIAS research. Adapted from Source: The World Bank (FAIS) Study (2008).
In Azerbaijan, the topic of establishing a FEZ has been on and off the government agenda since
the mid‐1990s. The country’s strategic location at the crossroads of major trade links and the
need to develop the non‐oil sector were among the main reasons for encouraging the FEZ
development. The establishment of a FEZ would allow Azerbaijan to capitalize on its current
free trade agreements with Georgia, Ukraine, and Turkmenistan, and eight out of nine of the
official CIS member states (except Armenia). The country already benefits from the EU’s
Generalized System of Preferences plus (GSP+)‡‡‡‡‡ arrangement and GSP incentives offered by
countries like the US, Canada, Japan, South Korea, and Turkey.359 It is also a member of the
Economic Cooperation Organization (ECO) which plans to establish its own ECO Free Trade area
‡‡‡‡‡ “The EU's Generalized System of Preferences is a trade arrangement through which the EU provides preferential access to the EU market to 176 developing countries and territories, in the form of reduced tariffs for their goods when entering the EU market. There is no expectation or requirement that this access be reciprocated. It is implemented by a Council Regulation applicable for a period of three years at a time. For the period 2009‐2011, 16 beneficiary countries have qualified to receive the additional preferences offered under the GSP+ incentive arrangement.” (From the EU Commission)
AZERBAIJAN AS A REGIONAL HUB IN CENTRAL EURASIA
FREE ECONOMIC ZONE DEVELOPMENT 147
by 2015. Therefore, in terms of trade facilitation and non‐oil sector development, creating a FEZ
seems the logical next step for Azerbaijan.
The Ministry of Economic Development (MED) and its Azerbaijani Export & Investment
Promotion Foundation (AZPROMO) have been the leading advocates of FEZ establishment.
They have developed a number of proposals over the past 6 years, the first of which they
released back in 2005. Amongst the proposed locations for an industrial and export processing
zone were Sumgait (an industrial town near Baku), Siyezen (a town in the north of Azerbaijan),
the Absheron Peninsula, and the area surrounding the Sangachal Terminal, Azerbaijan’s major
oil and gas processing plant. More recently, with the new port construction at Alyat, the MED
was allocated by the government up to 100 ha of land for developing a FEZ within the Alyat
port territory (50 ha in the first phase, with additional 50 ha available for expansion).
The Ministry of Communications and Information Technologies (MCIT) has also been
investigating FEZ development, focusing on the information technology aspect. In 2007, the
Ministry commissioned Booz Allen Hamilton (BAH), a leading US consulting firm, to study the
possibility of setting up a Regional Innovation Zone (RIZ) in Azerbaijan, looking particularly at
the information and communications technology (ICT) strategy. In the summer of 2007, the
company completed their comprehensive report, which favorably assessed Azerbaijan’s
potential to establish a RIZ. A year later, Silk Way Holding in conjunction with a Dubai‐based
consulting firm developed a plan for a FEZ at the Baku International Airport. Both private and
state investors have demonstrated interest in developing the FEZ concept.
President Aliyev himself has shown personal interest in Free Zone development, reflected by
two separate visits to Dubai’s Jabal Ali Free Zone (2006 and 2010). Shortly after his 2006 visit,
he signed a Presidential decree (№ 538) on March 6, 2007 calling for the establishment of a FEZ
in Azerbaijan. The Cabinet of Ministers was given a month to prepare FEZ legislation and to
produce the necessary legal and regulatory documents. The Ministry of Economic Development
(MED) was asked to identify the priority areas for the proposed FEZ. Given that the draft FEZ
law needed to liaise with all relevant government ministries and state agencies, as well as the
private sector, the entire process was not completed until April 2009. The FEZ law underwent a
number of revisions before it was finally signed by President Aliyev on April 14, 2009. It went
into force in June 2009.
While the FEZ law adopted by Azerbaijan provides a ‘special legal regime’ that would govern
the activities of the national FEZ, it falls short of a Production Sharing Agreement (PSA), which is
a type of legal regime that Azerbaijan has successfully used to promote its oil and gas projects
such as the Azeri‐Chirag‐Gunashli (ACG) oil and the Shah‐Deniz natural gas fields. Current FEZ
law has been drafted within the framework of existing institutional arrangements, without
STRATEGIC ASSESSMENT OF EURO‐ASIAN TRADE AND TRANSPORTATION
148 PART III
providing for the same level of flexibility offered by a PSA regime. Since signing of the FEZ law in
2009, government agencies have taken measures to address technical issues, such as drafting
procedures for tax payments and paperwork for registering FEZ residents. The MED was
assigned to act as the regulatory body for the proposed FEZ and it has even drawn up detailed
guidelines and a tender announcement for the selection of an international operator for the
FEZ.
Although these developments are encouraging, and certainly constitute the first steps in the
right direction, they are not in themselves enough for the successful development of a FEZ. The
original goal of the FEZ law was to create a broad legal and regulatory regime that would be
sufficiently flexible to allow the government to establish a number of different types of FEZs
with different investment sharing options: free trade zones, export processing zones, industrial
towns, and any other type of zone that requires special terms and privileges. In addition, the
ideal legal framework would set out in detail the role and scope of private sector involvement
in the development of the site. Currently, private investment is restricted to the operational
phase. Furthermore, the current FEZ law and its subsequent provisions, including the guidelines
for selection an international operator, refer to a specific FEZ. However, the actual location of
this FEZ remains unclear. The government officials mention the area near the new Alyat Port,
but this is not made explicit. The further issue is the lack of a complete marketable plan, which
should include a master plan, market assessment, and financial analysis of the proposed FEZ.
Without these studies no serious international private operator would consider investing into
FEZ in Azerbaijan.
According to the text of the law, the proposed FEZ will be a combination of manufacturing‐
oriented export processing zone and a service‐oriented zone, which is rather a narrowly defined
specialization. A FEZ based on transshipment or hub operations – one of many areas that the
Alyat FEZ could focus on – will be a different enterprise, with different needs, investment levels,
labor requirements, from a FEZ that specializes on export‐promotion, manufacturing or
assembly. The government could easily facilitate export production by ensuring that existing
national laws are enforced. The point here is that, if the purpose of the planned FEZ is to
stimulate exports from Azerbaijan, this could be done without creating a dedicated fenced area
‐ by simply adopting Single Factory EPZ scheme (Table 3.1), which would not even require an
international operator. On the other hand, if the goal is to attract foreign
investors/manufacturers into the FEZ either for re‐exporting or manufacturing, then it is
necessary to consider the size of the potential regional market, the incentives being offered,
and why foreign investors would choose Azerbaijan over alternative regional FEZs, most of
which have more flexible FEZ regimes with better terms, privileges, and tax breaks.
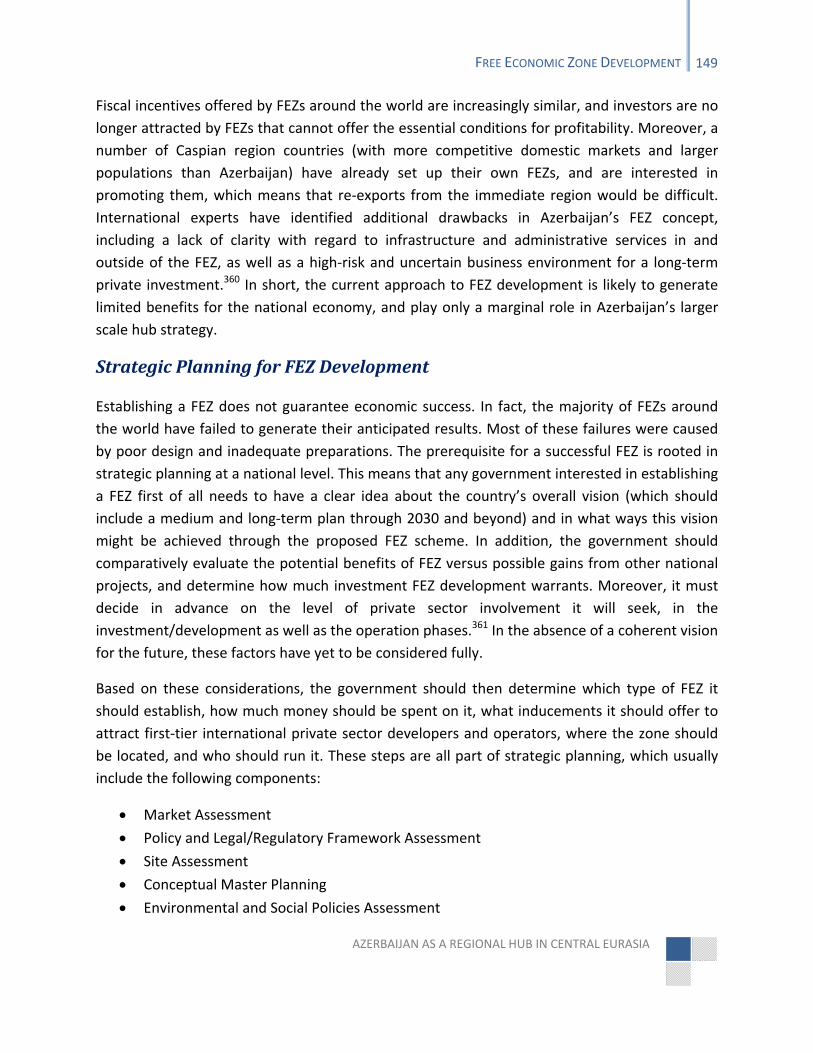
AZERBAIJAN AS A REGIONAL HUB IN CENTRAL EURASIA
FREE ECONOMIC ZONE DEVELOPMENT 149
Fiscal incentives offered by FEZs around the world are increasingly similar, and investors are no
longer attracted by FEZs that cannot offer the essential conditions for profitability. Moreover, a
number of Caspian region countries (with more competitive domestic markets and larger
populations than Azerbaijan) have already set up their own FEZs, and are interested in
promoting them, which means that re‐exports from the immediate region would be difficult.
International experts have identified additional drawbacks in Azerbaijan’s FEZ concept,
including a lack of clarity with regard to infrastructure and administrative services in and
outside of the FEZ, as well as a high‐risk and uncertain business environment for a long‐term
private investment.360 In short, the current approach to FEZ development is likely to generate
limited benefits for the national economy, and play only a marginal role in Azerbaijan’s larger
scale hub strategy.
Strategic Planning for FEZ Development
Establishing a FEZ does not guarantee economic success. In fact, the majority of FEZs around
the world have failed to generate their anticipated results. Most of these failures were caused
by poor design and inadequate preparations. The prerequisite for a successful FEZ is rooted in
strategic planning at a national level. This means that any government interested in establishing
a FEZ first of all needs to have a clear idea about the country’s overall vision (which should
include a medium and long‐term plan through 2030 and beyond) and in what ways this vision
might be achieved through the proposed FEZ scheme. In addition, the government should
comparatively evaluate the potential benefits of FEZ versus possible gains from other national
projects, and determine how much investment FEZ development warrants. Moreover, it must
decide in advance on the level of private sector involvement it will seek, in the
investment/development as well as the operation phases.361 In the absence of a coherent vision
for the future, these factors have yet to be considered fully.
Based on these considerations, the government should then determine which type of FEZ it
should establish, how much money should be spent on it, what inducements it should offer to
attract first‐tier international private sector developers and operators, where the zone should
be located, and who should run it. These steps are all part of strategic planning, which usually
include the following components:
Market Assessment
Policy and Legal/Regulatory Framework Assessment
Site Assessment
Conceptual Master Planning
Environmental and Social Policies Assessment
STRATEGIC ASSESSMENT OF EURO‐ASIAN TRADE AND TRANSPORTATION
150 PART III
Economic Analysis
Financial Analysis
Implementation Planning.362
The strategic planning should have a specific goal: to generate a solid, clearly thought out, and
marketable plan that achieves the following: 1) quantifies expected economic and financial
benefits; 2) defines anticipated level of private sector participation; 3) outlines FEZ
implementation phases and risk mitigation plans; and 4) sets institutional, legal, and regulatory
guidelines and guarantees for the zone’s development.363 This plan is a complete package that
includes location benchmarking (assessing the country’s competitiveness compared with other
countries and FEZ locations), industry analysis, market demand surveys and forecasting. This
information is used to market the FEZ internationally, and to attract FDI.
Though there exists a range of studies on FEZs or industrial towns in Azerbaijan, only three
studies are broadly in line with the strategic planning scheme described above, albeit only at a
sector‐specific level. These include a report prepared by the Turkish International Cooperation
& Development Agency (TIKA) for the Ministry of Economic Development in 2006, a study by
Booz Allen Hamilton (BAH) for the Ministry of Communications and Information Technologies in
2007, and the airport FEZ proposal developed by a Dubai‐based consulting firm for the Baku
International Airport in 2008. While the TIKA plan was focused on industrial zone concept and is
probably outdated, the latter two are still relevant. Of the three, the BAH study is the most
comprehensive. Although the BAH and the airport FEZ proposals are focused on particular
clusters of the national economy – air transportation and ICT – they could be easily adapted to
Azerbaijan’s grand hub strategy.
One key issue is that there has not yet been any strategic planning for the Alyat FEZ project,
neither under current plans today (i.e. for the 50‐100 ha land) or as it is proposed by this study
in Part IV (400 ha, to include the Alyat port and logistics center). The master plan prepared by
the Ministry of Transport of Azerbaijan and Royal Haskoning only covers the Alyat port, while
the TRACECA Alyat International Logistics Center (ILC) feasibility study focuses on the regional
trade, without taking into account the Alyat FEZ. Therefore, a larger strategic plan for the
development of Alyat FEZ, Alyat Port, Alyat ILC, and the Baku International Airport FEZ should
be synchronized, and viewed as components of an integrated hub development strategy. Non‐
integrated planning of FEZs, ports, airports, and logistics centers will impede the successful
realization of the country’s strategic vision, and create coordination problems in the future.
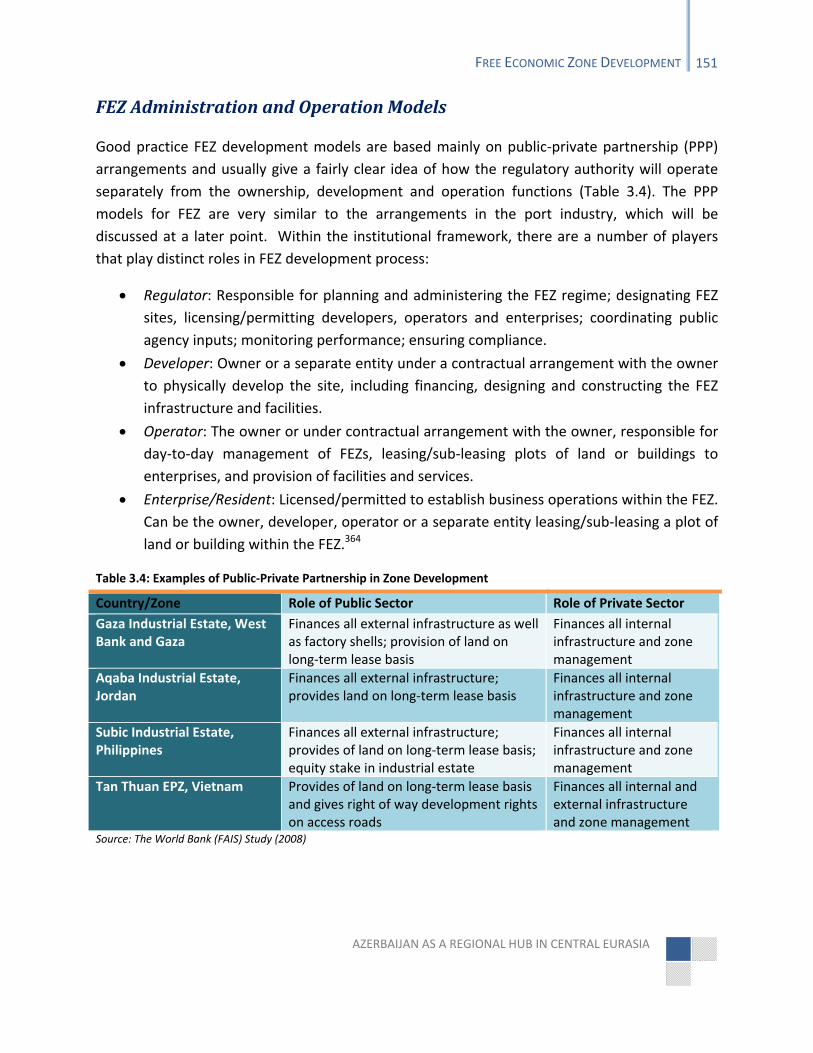
AZERBAIJAN AS A REGIONAL HUB IN CENTRAL EURASIA
FREE ECONOMIC ZONE DEVELOPMENT 151
FEZ Administration and Operation Models
Good practice FEZ development models are based mainly on public‐private partnership (PPP)
arrangements and usually give a fairly clear idea of how the regulatory authority will operate
separately from the ownership, development and operation functions (Table 3.4). The PPP
models for FEZ are very similar to the arrangements in the port industry, which will be
discussed at a later point. Within the institutional framework, there are a number of players
that play distinct roles in FEZ development process:
Regulator: Responsible for planning and administering the FEZ regime; designating FEZ
sites, licensing/permitting developers, operators and enterprises; coordinating public
agency inputs; monitoring performance; ensuring compliance.
Developer: Owner or a separate entity under a contractual arrangement with the owner
to physically develop the site, including financing, designing and constructing the FEZ
infrastructure and facilities.
Operator: The owner or under contractual arrangement with the owner, responsible for
day‐to‐day management of FEZs, leasing/sub‐leasing plots of land or buildings to
enterprises, and provision of facilities and services.
Enterprise/Resident: Licensed/permitted to establish business operations within the FEZ.
Can be the owner, developer, operator or a separate entity leasing/sub‐leasing a plot of
land or building within the FEZ.364
Table 3.4: Examples of Public‐Private Partnership in Zone Development
Country/Zone Role of Public Sector Role of Private Sector
Gaza Industrial Estate, West Bank and Gaza
Finances all external infrastructure as well as factory shells; provision of land on long‐term lease basis
Finances all internal infrastructure and zone management
Aqaba Industrial Estate, Jordan
Finances all external infrastructure; provides land on long‐term lease basis
Finances all internal infrastructure and zone management
Subic Industrial Estate, Philippines
Finances all external infrastructure; provides of land on long‐term lease basis; equity stake in industrial estate
Finances all internal infrastructure and zone management
Tan Thuan EPZ, Vietnam Provides of land on long‐term lease basis and gives right of way development rights on access roads
Finances all internal and external infrastructure and zone management
Source: The World Bank (FAIS) Study (2008)
STRATEGIC ASSESSMENT OF EURO‐ASIAN TRADE AND TRANSPORTATION
152 PART III
There is a direct relationship between the role and risks taken by the private sector in the FEZ
development and the duration of commitment to the project. Four general PPP models are
listed below, ranging from the lowest to highest levels of private sector involvement.
Management Contracts (5‐10 years): Public sector pays the private sector to manage
the FEZ under a specific agreement, usually with some revenue sharing arrangements.
Leases (10‐20 years): Private sector pays public sector to use FEZ facilities (e.g. land with
infrastructure connections) under an agreement which sets out specific terms of use.
Concessions (20‐30 years): Private sector owns and operates the FEZ under agreement
with public sector and transfers assets back to public sector at end of the agreed term
(i.e. Build‐Operate‐Transfer (BOT) arrangements).
Joint Ventures (open ended): Assets contributed by public sector and cash contributed
by private sector into a special purpose vehicle to develop FEZ.365
In the past, the state agency that was responsible for setting up a FEZ was also responsible for
its development, management, and administration. The increased level of private sector
participation in FEZ development over recent years has transformed the government’s
traditional role in the process. Today, many governments prefer to lease the FEZ land and/or
infrastructure to a private company that will act as a zone developer or operator, investing in
infrastructure and superstructure facilities within the FEZ premises. In these cases, the
government acts as a regulator or shareholder, providing essential infrastructure services
outside of the FEZ area (i.e. roads, railways, electricity, water, etc.), collecting rent, and
conducting its regulatory duties via a special state agency or cooperation, a ministry, zone‐
specific management board, or investment promotion enterprise. To become internationally
competitive, some of the most successful public bodies working on FEZ development have
transformed themselves into state‐backed corporations, which are run like private
companies.366 This is because privately run enterprises tend to be more competitive and
perform better globally, while public agencies are prone to be burdened by bureaucratic
requirements, and less efficient. The popularity of this innovation is likely to increase in the
future, as more and more governments establish development corporations.367
Challenges in FEZ Development
Although best‐practice FEZ models are available to governments, the success of the FEZ
initiative is never guaranteed. Set‐up and development is challenging, especially for developing
countries operating within complex political and economic institutional frameworks. There are
additional factors (i.e. internal and external) that are necessary to the effective development of
a FEZ:
AZERBAIJAN AS A REGIONAL HUB IN CENTRAL EURASIA
FREE ECONOMIC ZONE DEVELOPMENT 153
Vision: As highlighted throughout this study, the vision for the FEZ and the country as a
whole should be at heart of any integrated FEZ development process. Without a clear
vision about what the FEZ policy should achieve, how its design and implementation can
support the country’s grand strategy, and which political, legal, and economic measures
are required to sustain the project, the FEZ initiative is doomed to fail.
Location: Location is the key to a successful FEZ, particularly for integrated FEZ projects
that incorporate seaports and airports. The FEZ site, as well as the host country itself,
should be situated near major international and regional markets and transport
corridors to reduce transportation and operational costs. In terms of FEZ development,
Azerbaijan benefits from a favorable location, right at the crossroads of various major
Euro‐Asian transport links and networks.
Stability: The political and economic climate in the host country should be stable and
predictable, to allow a constant influx of FDI and trade. The stability requirement applies
also to the government’s FEZ policy and the FEZ legal regime, which should be
consistent and sustainable.368 Azerbaijan’s record with PSAs in the energy sector serves
as a good precedent here.
Infrastructure: Good infrastructure services inside and outside of the FEZ are vital for
companies investing in FEZ. This means not only the physical infrastructure within the
FEZ but also the services provided externally: gas, electricity, and water supplies; road,
rail and airport access, availability of multimodal transport; an adequate logistics
network, etc.
Market Size: The size of the national and regional markets and the distance from growth
economies influence foreign investors’ involvement in the FEZ, particularly if they are
from manufacturing or semi‐manufacturing industries.
Human Capital: FEZs specializing in low value added production tend to be labor
intensive, which means that manufacturers seek out cheap labor. This type of FEZ is
more competitive in high‐population countries (i.e. China or India) where labor wages
are considerably lower. High value added production, however, requires a more
specialized labor force. In small countries, including Azerbaijan, highly educated and
specialized personnel, staff, and management is in strong demand, and it will take time
to build up this human capital. The FEZ development should act as a catalyst for this
process.
Economic Factors: Macroeconomic stability and financial support from the government
are necessary conditions for the success of the FEZ, particularly for FEZ projects with
PPP arrangements. The infrastructure services outside of the FEZ are typically provided
by the government, and they require vast investment for construction and
STRATEGIC ASSESSMENT OF EURO‐ASIAN TRADE AND TRANSPORTATION
154 PART III
maintenance. A well‐designed FEZ policy will better equip the resource‐rich developing
states to do well in FEZ development and attract higher levels of FDI.
Political Support: The foremost important factor in the FEZ development is probably
political backing. This is particularly relevant in developing and transition countries,
including Azerbaijan, where institution building is still work‐in‐progress and where some
competence areas of state agencies overlap or conflict. A government that has managed
to lift this issue from the ‘ministerial level’ to the national level, steering clear of interest
group politics or internal government squabbles tends to outperform any government
that has succumbed to internal pressures or failed to give adequate support to the FEZ
project. Many FEZ projects have encountered internal resistance to the changes and
reforms required for their future success, and the only way to keep things going was to
obtain the backing of the country’s leader. A pertinent example here is the creation of
Jordan’s Aqaba SEZ in 2001, which would not have been possible without the personal
involvement and support of King Abdullah of Jordan. He navigated the bureaucratic
hurdles put in place by his own government, ensuring that the Aqaba SEZ followed the
best practice model, with liberalized and flexible regulations and a low tax and multi–
sector development scheme. By 2006, the zone had already attracted investments of $7
billion, exceeding the original goal of $6 billion by 2020.369
Azerbaijan and its neighboring states have a number of advantages when it comes to the
objective factors listed above. However, success will come only when there is an integrated
approach to FEZ development and sufficient attention is accorded to strategic and political
considerations. Without direct backing and support from the president of the country, FEZ
development in Azerbaijan would likely remain a “ministerial level” exercise and will not make
the necessary transition to national, regional and international levels. Moreover, as a country
aspiring to join the World Trade Organization (WTO), Azerbaijan needs to design its FEZ policy
in line with WTO rules and regulations.
The best practice model for an integrated FEZ policy in Azerbaijan would require a flexible and
sustainable PSA‐type legal regime under the political patronage of the president. This would
allow the government to set up any type of FEZ at any location across the country, regardless of
the zone’s size or specialty; to choose more than one developer and/or operator for each zone
depending on the zone’s feature and specialization area; to set up a state‐backed FEZ
corporation that could participate in FEZ regional development and international competition;
to apply different PPP investment models to each zone based on the specific needs and
priorities of the state; to share the cost of FEZ construction with the private sector; and to
create efficient and effective regulatory mechanisms and guarantees for FEZ administration and
non‐oil sector FDI inducements. These and other issues will be discussed in depth in Part IV.
AZERBAIJAN AS A REGIONAL HUB IN CENTRAL EURASIA
PORT DEVELOPMENT IN THE 21ST CENTURY 155
The Alyat Port and 21st Century Port Development
Azerbaijan’s grand hub vision should include an integrated FEZ development model that
encompasses all of its ports, airports, logistics centers and other strategic transport and non‐
transport projects. Many governments around the world have assigned their ports FEZ status in
an attempt to increase their competitiveness and to develop them into regional hubs. Among
the regional ports, the Port of Poti in Georgia, the Ports of Anzali and Amirabad in Iran and the
Port of Aktau in Kazakhstan have already obtained free/special economic zone status. The Port
of Turkmenbashy will likely received FEZ status in the near future, while the Port of Ola in
Russia will receive this status in the future. It is important to note that in many ports the FEZ
status covers a large area which often includes the port itself. One of the areas currently being
considered by the Azerbaijani government is a 100 ha area within the 400 ha territory of the
Alyat port. This is fairly small area in comparison with the SEZ area at Aktau, which covers
2,000 ha, or the FEZ area at Anzali that is 3,200 ha.
The idea of moving the Port of Baku from its current overcrowded spot in central Baku to a new
site near Alyat is not a new one. The official decision was finalized on October 18, 2007 with
Presidential decree № 2443. It assigned the relocation task to the Ministry of Transport, to be
assisted by other relevant agencies. The Ministry of Transport has managed the process well. It
has worked with a renowned international engineering and environmental consultancy firm,
Royal Haskoning, to come up with an excellent feasibility study for the port and its phased
development. The construction of the new port was marked with an inauguration ceremony
attended by President Aliyev in November 2010.
There is no doubt that the port at Alyat is on its way to becoming a forerunner amongst
Eurasian seaports. The purpose of this section is not to re‐evaluate the planning process of the
Alyat port development, but to focus on a conceptual framework for port development and
reform process in general and examine current port forms, functions, and management models.
The section will conclude with an assessment of the future role of Alyat port as part of
Azerbaijan’s hub strategy in conjunction with other economic projects such as FEZs. For a full
analysis of the vision for Alyat port, and its potential role within the country’s grand hub
strategy, there are a number of questions that need to be asked. Does Azerbaijan need a state‐
of‐art port in the Caspian Sea? What purpose will or should the new Alyat port serve in Central
Eurasia, and Azerbaijan in particular? How will the port be built and who should run it? What
other steps besides the construction of the new port should the government take to fix the
maritime transportation problems in the Caspian Sea? Where does the new Alyat port fit in the
bigger picture of Azerbaijan’s hub development strategy?
STRATEGIC ASSESSMENT OF EURO‐ASIAN TRADE AND TRANSPORTATION
156 PART III
The Global Port Industry and Port Reform Process
The World Bank study on port reforms has identified five main forces that will shape the market
context of ports and port service providers in the twenty‐first century. These include: increased
rivalry between existing competitors, potential challenges from new entrants, consumer ability
to move to alternative ports, increased bargaining power of port users and port service
providers.370 The study posits that success in the global port competition will be “largely
dependent on how port managers strategically position themselves in the evolving competitive
landscape.”371
Prior to the 1990s, there were only three ports in developing countries with private operators:
Kingston Port (Jamaica, 1967), Port Klang (Malaysia, 1986) and Manila Harbor (the Philippines,
1988).372 The issue of private investment and port management emerged primarily during the
1990s when many ports became overcrowded due to high traffic, and consequently failed to
provide adequate services. Ports became a source of bottlenecks that disrupted the building of
efficient supply chains. Between 1990 and 1998 alone, around 112 new port projects with
private sector involvement were launched in 28 states, together worth $9 billion.373 Today, the
largest private international port operator, Hutchison Port Holdings (HPH), alone manages
some 305 berths in 50 ports across 25 different countries worldwide, handling more than 64
million TEU (2009).374
Amongst the political and economic factors, there were three main reasons the number of
private operators increased so rapidly and why the public ports were unable to maintain the
level of service and adapt to the changing business environment. First of all, it was the role of
labor unions at the time, which opposed the ‘automatization’ of port services for fear that this
would eliminate the need for certain types of jobs. Subsequently, most unions agreed to
moderate reforms, and this issue was removed. Secondly, the governments in control of the
ports were either unwilling or unable to invest millions of dollars into port expansion. Thirdly,
the governments in charge of regulating and operating the ports had strict hierarchical
command structures that led to central planning,375 inefficient port operation, sub‐optimal
asset management, and inadequate responses to market demand. Many port managers were
largely concerned with meeting the fixed annual cargo targets rather than focusing on
increasing traffic, finding new clients, or providing better services.
Since then, the port industry has changed and evolved significantly. New private actors came
into play, altering port management and port service practices. Today, the best port
management strategies aim to attain the following three results: 1) provide better services to
infrastructure users; 2) increase efficiency of operations; and 3) improve the allocation of
limited public funds.376
AZERBAIJAN AS A REGIONAL HUB IN CENTRAL EURASIA
PORT DEVELOPMENT IN THE 21ST CENTURY 157
Twenty‐first century ports have become indispensable components of the global supply chain,
owing to the increased private sector involvement in port operations. At present, most
international ports are run by private operators or state‐backed international conglomerates
that function like private corporations. All these operators recognize the benefits of effective
port management, and work on expanding and diversifying their services. The private sector is
integral to the port development process and is likely to remain so in the foreseeable future.
For the governments that have yet to reform their port industry, including those in Central
Eurasia, the private sector will play a decisive role in realizing successful port development.
Main Actors in Port Development
There are several actors who interact at various levels during the port development process. In
a simple institutional framework, these are central governments, port authorities, and port
operators. At the top level there is a central government directly or indirectly involved in the
development of the port through infrastructure investments, planning, and, sometimes,
operations via a designated state agency. Occasionally this state agency is responsible for FEZ
activities, given that many ports also have FEZ status.
It is the government’s responsibility to set the rules of the game for all other players and
“pursue [macroeconomic] objectives through an active seaport policy.”377 The central
government may be represented by the Ministry of Transport, the State maritime
administration or State agency in charge of the port’s FEZ activity. At the middle level of the
hierarchy is the port authority – a managing body directly responsible for the port’s overall
development policy, financing, licensing, administration, safety, security and environmental
matters. In most cases, the Port Authority or another representative agency for the central
government will regulate the port’s economic activity and act as a middleman between the port
operators and other government or private entities. At the third level, there are port operators,
including operators of the entire port, as well as of individual terminals or other facilities within
the port such as logistics centers. Private operators include global shipping liners, global
stevedores,§§§§§ and international container terminal operators, all of which will be discussed in
greater detail below. The primary objectives of all port operators, public or private, are profit
maximization, market share increase, expansion of port services, and growth. These objectives
can be best achieved if port operators are able to act independently, to set prices for port
services based on commercially sound principles, without being limited by rigid government
regulations and policies.378
§§§§§ Stevedores are “companies whose primary business is port operations. The aim of such companies is to achieve greater levels of operational efficiency, commercial advantage and economies of scale by operating an international container terminal network.” (Source: Drewry Research)
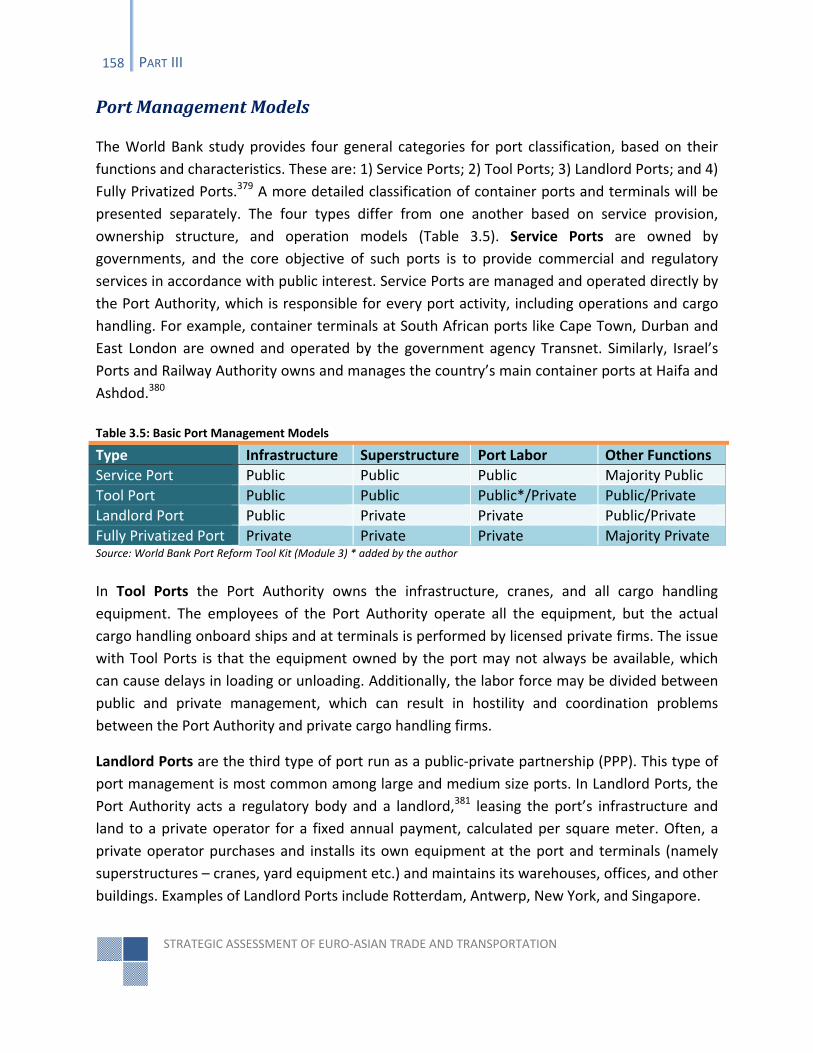
STRATEGIC ASSESSMENT OF EURO‐ASIAN TRADE AND TRANSPORTATION
158 PART III
Port Management Models
The World Bank study provides four general categories for port classification, based on their
functions and characteristics. These are: 1) Service Ports; 2) Tool Ports; 3) Landlord Ports; and 4)
Fully Privatized Ports.379 A more detailed classification of container ports and terminals will be
presented separately. The four types differ from one another based on service provision,
ownership structure, and operation models (Table 3.5). Service Ports are owned by
governments, and the core objective of such ports is to provide commercial and regulatory
services in accordance with public interest. Service Ports are managed and operated directly by
the Port Authority, which is responsible for every port activity, including operations and cargo
handling. For example, container terminals at South African ports like Cape Town, Durban and
East London are owned and operated by the government agency Transnet. Similarly, Israel’s
Ports and Railway Authority owns and manages the country’s main container ports at Haifa and
Ashdod.380
Source: World Bank Port Reform Tool Kit (Module 3) * added by the author
In Tool Ports the Port Authority owns the infrastructure, cranes, and all cargo handling
equipment. The employees of the Port Authority operate all the equipment, but the actual
cargo handling onboard ships and at terminals is performed by licensed private firms. The issue
with Tool Ports is that the equipment owned by the port may not always be available, which
can cause delays in loading or unloading. Additionally, the labor force may be divided between
public and private management, which can result in hostility and coordination problems
between the Port Authority and private cargo handling firms.
Landlord Ports are the third type of port run as a public‐private partnership (PPP). This type of
port management is most common among large and medium size ports. In Landlord Ports, the
Port Authority acts a regulatory body and a landlord,381 leasing the port’s infrastructure and
land to a private operator for a fixed annual payment, calculated per square meter. Often, a
private operator purchases and installs its own equipment at the port and terminals (namely
superstructures – cranes, yard equipment etc.) and maintains its warehouses, offices, and other
buildings. Examples of Landlord Ports include Rotterdam, Antwerp, New York, and Singapore.
Table 3.5: Basic Port Management Models
Type Infrastructure Superstructure Port Labor Other Functions
Service Port Public Public Public Majority Public
Tool Port Public Public Public*/Private Public/Private
Landlord Port Public Private Private Public/Private
Fully Privatized Port Private Private Private Majority Private
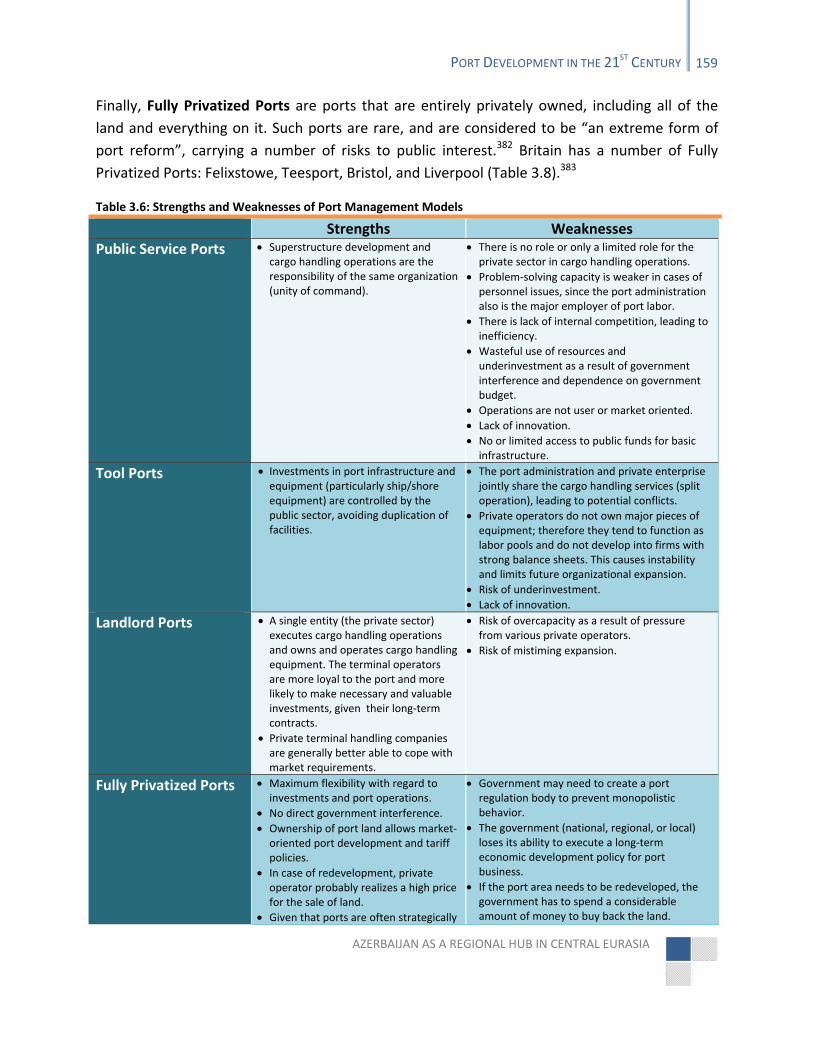
AZERBAIJAN AS A REGIONAL HUB IN CENTRAL EURASIA
PORT DEVELOPMENT IN THE 21ST CENTURY 159
Finally, Fully Privatized Ports are ports that are entirely privately owned, including all of the
land and everything on it. Such ports are rare, and are considered to be “an extreme form of
port reform”, carrying a number of risks to public interest.382 Britain has a number of Fully
Privatized Ports: Felixstowe, Teesport, Bristol, and Liverpool (Table 3.8).383
Table 3.6: Strengths and Weaknesses of Port Management Models
Strengths Weaknesses
Public Service Ports Superstructure development and cargo handling operations are the responsibility of the same organization (unity of command).
There is no role or only a limited role for the private sector in cargo handling operations.
Problem‐solving capacity is weaker in cases of personnel issues, since the port administration also is the major employer of port labor.
There is lack of internal competition, leading to inefficiency.
Wasteful use of resources and underinvestment as a result of government interference and dependence on government budget.
Operations are not user or market oriented.
Lack of innovation. No or limited access to public funds for basic infrastructure.
Tool Ports Investments in port infrastructure and equipment (particularly ship/shore equipment) are controlled by the public sector, avoiding duplication of facilities.
The port administration and private enterprise jointly share the cargo handling services (split operation), leading to potential conflicts.
Private operators do not own major pieces of equipment; therefore they tend to function as labor pools and do not develop into firms with strong balance sheets. This causes instability and limits future organizational expansion.
Risk of underinvestment.
Lack of innovation.
Landlord Ports A single entity (the private sector) executes cargo handling operations and owns and operates cargo handling equipment. The terminal operators are more loyal to the port and more likely to make necessary and valuable investments, given their long‐term contracts.
Private terminal handling companies are generally better able to cope with market requirements.
Risk of overcapacity as a result of pressure from various private operators.
Risk of mistiming expansion.
Fully Privatized Ports Maximum flexibility with regard to investments and port operations.
No direct government interference.
Ownership of port land allows market‐oriented port development and tariff policies.
In case of redevelopment, private operator probably realizes a high price for the sale of land.
Given that ports are often strategically
Government may need to create a port regulation body to prevent monopolistic behavior.
The government (national, regional, or local) loses its ability to execute a long‐term economic development policy for port business.
If the port area needs to be redeveloped, the government has to spend a considerable amount of money to buy back the land.
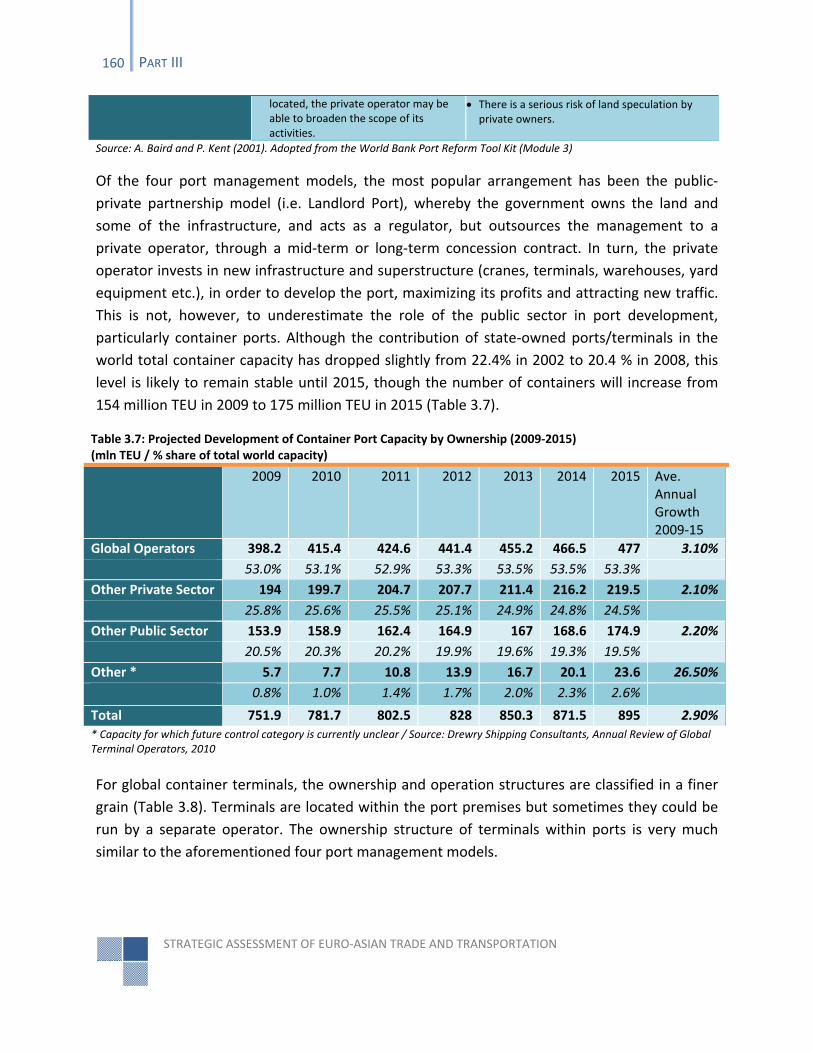
STRATEGIC ASSESSMENT OF EURO‐ASIAN TRADE AND TRANSPORTATION
160 PART III
located, the private operator may be able to broaden the scope of its activities.
There is a serious risk of land speculation by private owners.
Source: A. Baird and P. Kent (2001). Adopted from the World Bank Port Reform Tool Kit (Module 3)
Of the four port management models, the most popular arrangement has been the public‐
private partnership model (i.e. Landlord Port), whereby the government owns the land and
some of the infrastructure, and acts as a regulator, but outsources the management to a
private operator, through a mid‐term or long‐term concession contract. In turn, the private
operator invests in new infrastructure and superstructure (cranes, terminals, warehouses, yard
equipment etc.), in order to develop the port, maximizing its profits and attracting new traffic.
This is not, however, to underestimate the role of the public sector in port development,
particularly container ports. Although the contribution of state‐owned ports/terminals in the
world total container capacity has dropped slightly from 22.4% in 2002 to 20.4 % in 2008, this
level is likely to remain stable until 2015, though the number of containers will increase from
154 million TEU in 2009 to 175 million TEU in 2015 (Table 3.7).
Table 3.7: Projected Development of Container Port Capacity by Ownership (2009‐2015) (mln TEU / % share of total world capacity)
2009 2010 2011 2012 2013 2014 2015 Ave. Annual Growth 2009‐15
Global Operators 398.2 415.4 424.6 441.4 455.2 466.5 477 3.10%
53.0% 53.1% 52.9% 53.3% 53.5% 53.5% 53.3%
Other Private Sector 194 199.7 204.7 207.7 211.4 216.2 219.5 2.10%
25.8% 25.6% 25.5% 25.1% 24.9% 24.8% 24.5%
Other Public Sector 153.9 158.9 162.4 164.9 167 168.6 174.9 2.20%
20.5% 20.3% 20.2% 19.9% 19.6% 19.3% 19.5%
Other * 5.7 7.7 10.8 13.9 16.7 20.1 23.6 26.50%
0.8% 1.0% 1.4% 1.7% 2.0% 2.3% 2.6%
Total 751.9 781.7 802.5 828 850.3 871.5 895 2.90%* Capacity for which future control category is currently unclear / Source: Drewry Shipping Consultants, Annual Review of Global Terminal Operators, 2010
For global container terminals, the ownership and operation structures are classified in a finer
grain (Table 3.8). Terminals are located within the port premises but sometimes they could be
run by a separate operator. The ownership structure of terminals within ports is very much
similar to the aforementioned four port management models.
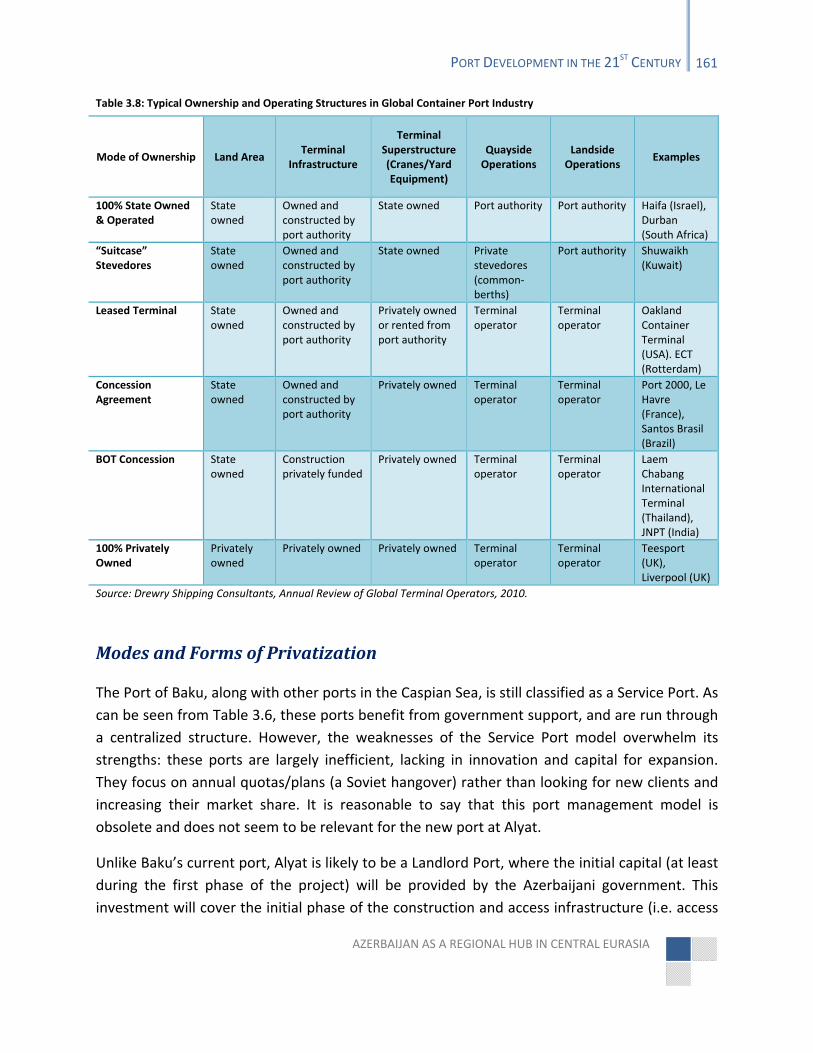
AZERBAIJAN AS A REGIONAL HUB IN CENTRAL EURASIA
PORT DEVELOPMENT IN THE 21ST CENTURY 161
Table 3.8: Typical Ownership and Operating Structures in Global Container Port Industry
Mode of Ownership Land Area Terminal
Infrastructure
Terminal Superstructure (Cranes/Yard Equipment)
Quayside Operations
Landside Operations
Examples
100% State Owned & Operated
State owned
Owned and constructed by port authority
State owned Port authority Port authority Haifa (Israel), Durban (South Africa)
“Suitcase” Stevedores
State owned
Owned and constructed by port authority
State owned Private stevedores (common‐berths)
Port authority Shuwaikh (Kuwait)
Leased Terminal State owned
Owned and constructed by port authority
Privately owned or rented from port authority
Terminal operator
Terminal operator
Oakland Container Terminal (USA). ECT (Rotterdam)
Concession Agreement
State owned
Owned and constructed by port authority
Privately owned Terminal operator
Terminal operator
Port 2000, Le Havre (France), Santos Brasil (Brazil)
BOT Concession State owned
Construction privately funded
Privately owned Terminal operator
Terminal operator
Laem Chabang International Terminal (Thailand), JNPT (India)
100% Privately Owned
Privately owned
Privately owned Privately owned Terminal operator
Terminal operator
Teesport (UK), Liverpool (UK)
Source: Drewry Shipping Consultants, Annual Review of Global Terminal Operators, 2010.
Modes and Forms of Privatization
The Port of Baku, along with other ports in the Caspian Sea, is still classified as a Service Port. As
can be seen from Table 3.6, these ports benefit from government support, and are run through
a centralized structure. However, the weaknesses of the Service Port model overwhelm its
strengths: these ports are largely inefficient, lacking in innovation and capital for expansion.
They focus on annual quotas/plans (a Soviet hangover) rather than looking for new clients and
increasing their market share. It is reasonable to say that this port management model is
obsolete and does not seem to be relevant for the new port at Alyat.
Unlike Baku’s current port, Alyat is likely to be a Landlord Port, where the initial capital (at least
during the first phase of the project) will be provided by the Azerbaijani government. This
investment will cover the initial phase of the construction and access infrastructure (i.e. access
STRATEGIC ASSESSMENT OF EURO‐ASIAN TRADE AND TRANSPORTATION
162 PART III
channel, roads and rail linked to national network). This practice is in line with the public
sector’s ‘catalyst’ or ‘facilitator’ role, whereby government investments are “primarily aimed at
inducing the private sector in providing resources to cover operational investments, including
infrastructure, once the public action has helped creating a [physically] enabling
environment.”384
The transition from the current port model to a new one at Alyat will be done as a part of an
overall port reform strategy. A number of international governments have used privatization as
a key tool in restructuring and modernizing existing ports. The 1998 UNCTAD Guidelines for Port
Authorities and Governments on the Privatization of Port Facilities publication defines
privatization as “the transfer of ownership of assets from the public to the private sector or the
application of private capital to fund investments in port facilities, equipment, and systems.”385
Governments have a number of objectives which can be served by the privatization of public
assets, including ports. Some of these objectives include:
Improving the management capability and efficiency of the port;
Sharing the financial burden of port maintenance and operation with a private sector
partner and finding new sources of revenue for the government;
Enhancing the service quality at the port in order that it can offer competitive services;
Attracting new businesses to the country as a whole as well as to the port sector;
Stimulating private investment in the new sector of the economy;
Transferring technology and knowledge via advanced equipment or state‐of‐the‐art
management systems.386
It is important to understand the distinctions between the different privatization models, and
what each entails. The UNCTAD guideline study lists three common modes and four forms of
port privatization process, which are similar to privatization schemes used for FEZ
development. The three modes or instruments are:
1. Licenses and concessions;
2. Leasehold contracts;
3. Build‐Operate‐Transfer (BOT), Build‐Own‐Operate (BOO) and Build‐Own‐Operate and
Transfer (BOOT) arrangements.387
There are also other privatization modes, such as the direct sale of port assets, joint ventures,
and stock market share sales.388 The component of privatization involves leasing or transferring
the ownership of the port or its assets to one or more private developer(s)/operator(s) via a
concession. A lease is commonly defined as “an agreement conveying the right to use an asset
(land or equipment, or both) for an agreed period of time in return for a payment or a series of
AZERBAIJAN AS A REGIONAL HUB IN CENTRAL EURASIA
PORT DEVELOPMENT IN THE 21ST CENTURY 163
payments by the lessee to the lessor.”389 Different leases offer different investment options to
the government and the private party. As a result, the length and terms of the contracts are
directly linked to the level of investment or service provision expected from the private
operator. Often, the government keeps the land and the private lessee is required to build
terminals and buy its own equipment (i.e. superstructures), in which case the private operator
may make significant demands from the Port Authority. Such contracts require long‐term
concessions, with a duration of 20‐40 years.
In other instances, the government has invested in infrastructure and equipment and is looking
for an international operator with an excellent port management track record. This port
management scheme requires minimal private investment and the lifespan of this type of
capital (asset) lease is usually shorter, about 10‐15 years. All lease contracts entail a special
government license that clearly sets out the rights and duties of the Port Authority and the
private operator. When the private operator is the short‐term manager or the long‐term owner
of the port, there is a risk it might resist expanding port or terminal services for various reasons.
Even with long term concessions, a private investor may fail to deliver the expected results, in
the short term, or ever.390This problem could be resolved if the Port Authority were to keep the
right to sub‐lease the unused port/terminal space and reviewed the port performance on
regular basis.391
Leasehold contracts are generally used by the Landlord Ports which get the major part of their
revenue from rent. This includes income from land, warehouses or other facilities that are
leased to private operators by the Port Authority. There are three main types of lease: flat rate,
‘mini‐max’, and shared revenue.392 Flat rate leases are paid by the private lessee in the form of
fixed payments, while ‘mini‐max’ leases vary depending on the level of activity recorded. The
shared revenue lease is similar to the ‘mini‐max’ arrangement, but it has a minimum required
fee, regardless of the level of activity, and no upper payment limit.393
The third mode of privatization, often referred as ‘concessions’, includes BOT, BOO, and BOOT
arrangements that are relatively similar, and all temporary in nature. The major difference
between the BOT and BOO/BOOT arrangements is that in a BOT concession the private party
(grantee) takes on the long‐term responsibility to build and operate a facility without ever
having the ownership rights. In other words, in BOT, the grantee builds and operates the port
for an agreed timeframe and then transfers it (without any compensation) back to the grantor
(i.e. the government), which can then lease it out or extend the concession under different
terms.394 With regard to the BOO and BOOT arrangements: the former involves an explicit
transfer ownership from grantor to grantee, without any time limit or need to return the
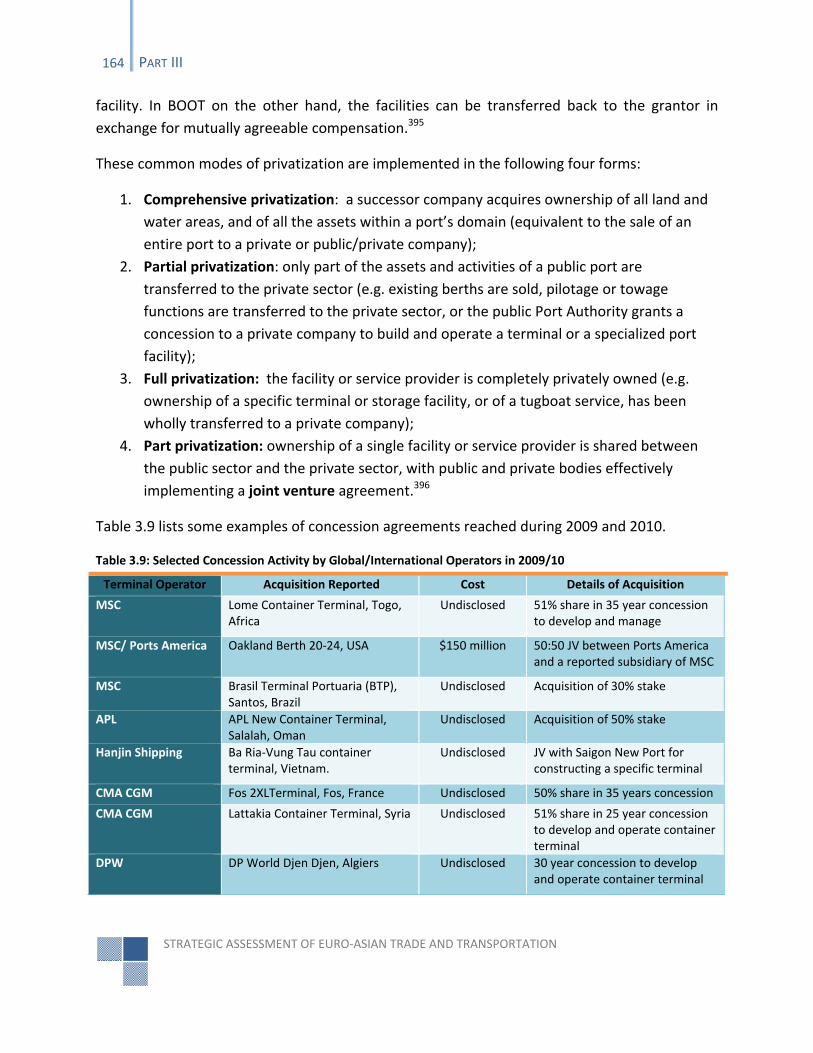
STRATEGIC ASSESSMENT OF EURO‐ASIAN TRADE AND TRANSPORTATION
164 PART III
facility. In BOOT on the other hand, the facilities can be transferred back to the grantor in
exchange for mutually agreeable compensation.395
These common modes of privatization are implemented in the following four forms:
1. Comprehensive privatization: a successor company acquires ownership of all land and
water areas, and of all the assets within a port’s domain (equivalent to the sale of an
entire port to a private or public/private company);
2. Partial privatization: only part of the assets and activities of a public port are
transferred to the private sector (e.g. existing berths are sold, pilotage or towage
functions are transferred to the private sector, or the public Port Authority grants a
concession to a private company to build and operate a terminal or a specialized port
facility);
3. Full privatization: the facility or service provider is completely privately owned (e.g.
ownership of a specific terminal or storage facility, or of a tugboat service, has been
wholly transferred to a private company);
4. Part privatization: ownership of a single facility or service provider is shared between
the public sector and the private sector, with public and private bodies effectively
implementing a joint venture agreement.396
Table 3.9 lists some examples of concession agreements reached during 2009 and 2010.
Table 3.9: Selected Concession Activity by Global/International Operators in 2009/10
Terminal Operator Acquisition Reported Cost Details of Acquisition
MSC Lome Container Terminal, Togo, Africa
Undisclosed 51% share in 35 year concession to develop and manage
MSC/ Ports America Oakland Berth 20‐24, USA $150 million 50:50 JV between Ports America and a reported subsidiary of MSC
MSC Brasil Terminal Portuaria (BTP), Santos, Brazil
Undisclosed Acquisition of 30% stake
APL APL New Container Terminal, Salalah, Oman
Undisclosed Acquisition of 50% stake
Hanjin Shipping Ba Ria‐Vung Tau container terminal, Vietnam.
Undisclosed JV with Saigon New Port for constructing a specific terminal
CMA CGM Fos 2XLTerminal, Fos, France Undisclosed 50% share in 35 years concession
CMA CGM Lattakia Container Terminal, Syria Undisclosed 51% share in 25 year concession to develop and operate container terminal
DPW DP World Djen Djen, Algiers Undisclosed 30 year concession to develop and operate container terminal
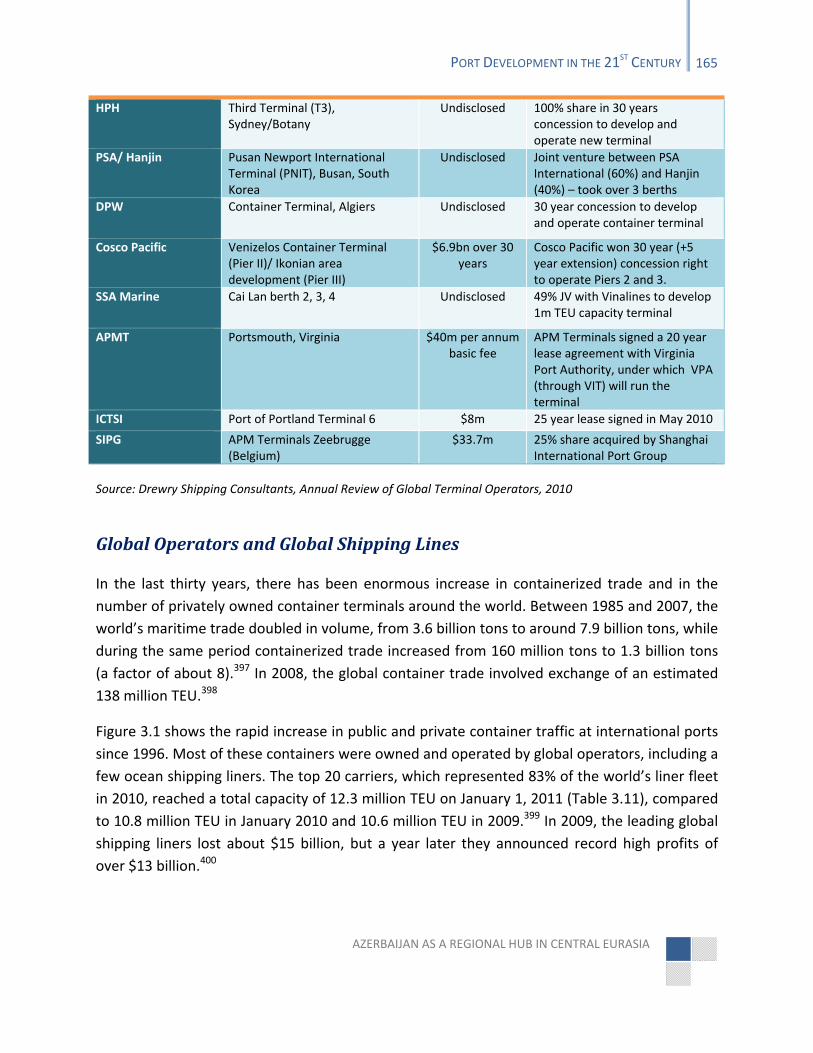
AZERBAIJAN AS A REGIONAL HUB IN CENTRAL EURASIA
PORT DEVELOPMENT IN THE 21ST CENTURY 165
HPH Third Terminal (T3), Sydney/Botany
Undisclosed 100% share in 30 years concession to develop and operate new terminal
PSA/ Hanjin Pusan Newport International Terminal (PNIT), Busan, South Korea
Undisclosed Joint venture between PSA International (60%) and Hanjin (40%) – took over 3 berths
DPW Container Terminal, Algiers Undisclosed 30 year concession to develop and operate container terminal
Cosco Pacific Venizelos Container Terminal (Pier II)/ Ikonian area development (Pier III)
$6.9bn over 30 years
Cosco Pacific won 30 year (+5 year extension) concession right to operate Piers 2 and 3.
SSA Marine Cai Lan berth 2, 3, 4 Undisclosed 49% JV with Vinalines to develop 1m TEU capacity terminal
APMT Portsmouth, Virginia $40m per annum basic fee
APM Terminals signed a 20 year lease agreement with Virginia Port Authority, under which VPA (through VIT) will run the terminal
ICTSI Port of Portland Terminal 6 $8m 25 year lease signed in May 2010
SIPG APM Terminals Zeebrugge (Belgium)
$33.7m 25% share acquired by Shanghai International Port Group
Source: Drewry Shipping Consultants, Annual Review of Global Terminal Operators, 2010
Global Operators and Global Shipping Lines
In the last thirty years, there has been enormous increase in containerized trade and in the
number of privately owned container terminals around the world. Between 1985 and 2007, the
world’s maritime trade doubled in volume, from 3.6 billion tons to around 7.9 billion tons, while
during the same period containerized trade increased from 160 million tons to 1.3 billion tons
(a factor of about 8).397 In 2008, the global container trade involved exchange of an estimated
138 million TEU.398
Figure 3.1 shows the rapid increase in public and private container traffic at international ports
since 1996. Most of these containers were owned and operated by global operators, including a
few ocean shipping liners. The top 20 carriers, which represented 83% of the world’s liner fleet
in 2010, reached a total capacity of 12.3 million TEU on January 1, 2011 (Table 3.11), compared
to 10.8 million TEU in January 2010 and 10.6 million TEU in 2009.399 In 2009, the leading global
shipping liners lost about $15 billion, but a year later they announced record high profits of
over $13 billion.400
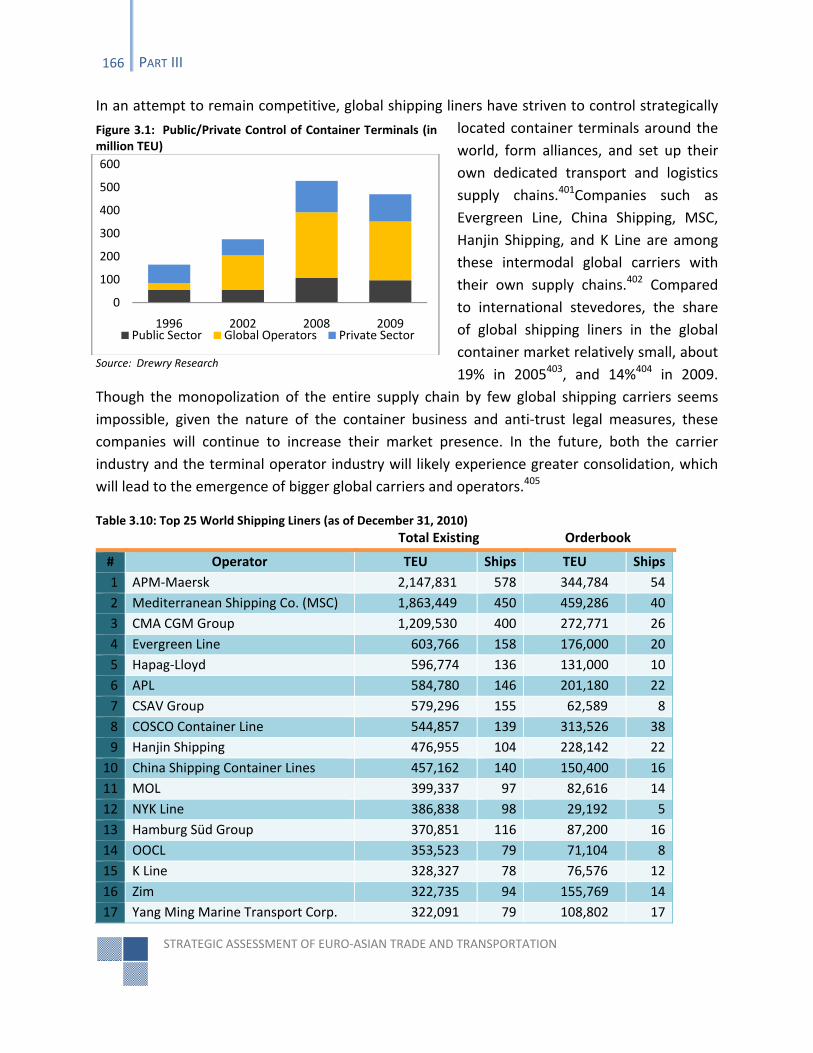
STRATEGIC ASSESSMENT OF EURO‐ASIAN TRADE AND TRANSPORTATION
166 PART III
In an attempt to remain competitive, global shipping liners have striven to control strategically
located container terminals around the
world, form alliances, and set up their
own dedicated transport and logistics
supply chains.401Companies such as
Evergreen Line, China Shipping, MSC,
Hanjin Shipping, and K Line are among
these intermodal global carriers with
their own supply chains.402 Compared
to international stevedores, the share
of global shipping liners in the global
container market relatively small, about
19% in 2005403, and 14%404 in 2009.
Though the monopolization of the entire supply chain by few global shipping carriers seems
impossible, given the nature of the container business and anti‐trust legal measures, these
companies will continue to increase their market presence. In the future, both the carrier
industry and the terminal operator industry will likely experience greater consolidation, which
will lead to the emergence of bigger global carriers and operators.405
Total Existing Orderbook
# Operator TEU Ships TEU Ships
1 APM‐Maersk 2,147,831 578 344,784 54
2 Mediterranean Shipping Co. (MSC) 1,863,449 450 459,286 40
3 CMA CGM Group 1,209,530 400 272,771 26
4 Evergreen Line 603,766 158 176,000 20
5 Hapag‐Lloyd 596,774 136 131,000 10
6 APL 584,780 146 201,180 22
7 CSAV Group 579,296 155 62,589 8
8 COSCO Container Line 544,857 139 313,526 38
9 Hanjin Shipping 476,955 104 228,142 22
10 China Shipping Container Lines 457,162 140 150,400 16
11 MOL 399,337 97 82,616 14
12 NYK Line 386,838 98 29,192 5
13 Hamburg Süd Group 370,851 116 87,200 16
14 OOCL 353,523 79 71,104 8
15 K Line 328,327 78 76,576 12
16 Zim 322,735 94 155,769 14
17 Yang Ming Marine Transport Corp. 322,091 79 108,802 17
Figure 3.1: Public/Private Control of Container Terminals (in million TEU)
Source: Drewry Research
Table 3.10: Top 25 World Shipping Liners (as of December 31, 2010)
0
100
200
300
400
500
600
1996 2002 2008 2009Public Sector Global Operators Private Sector
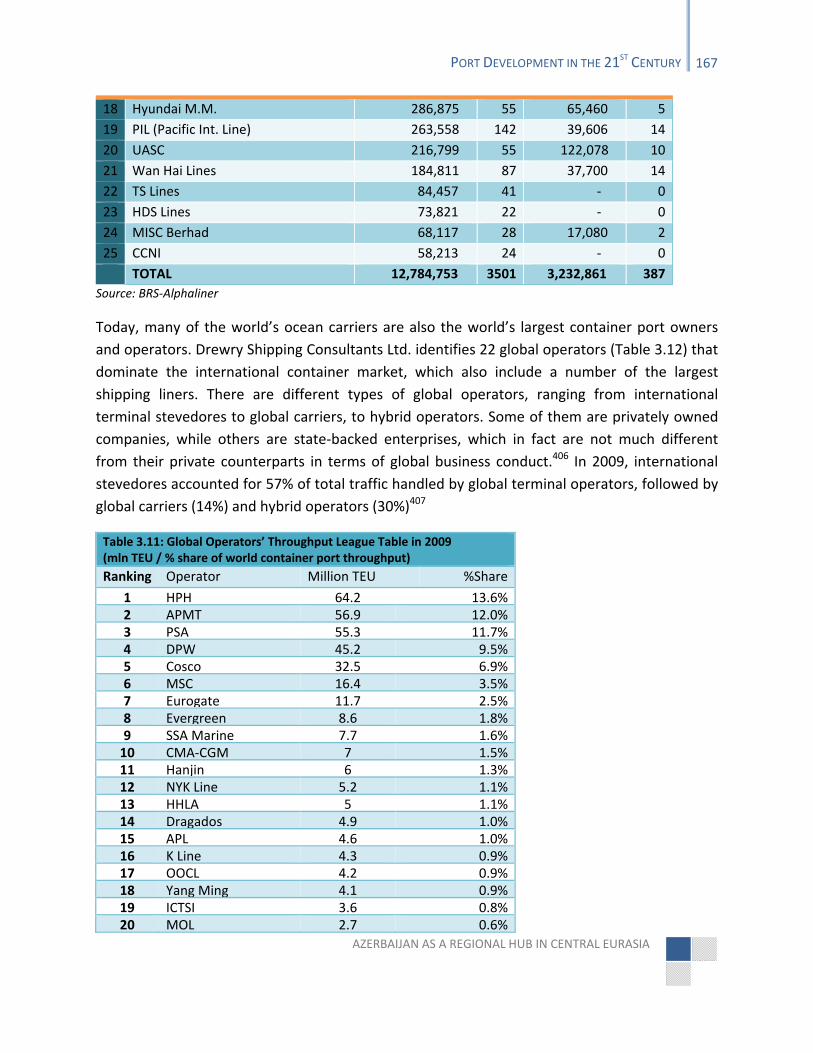
AZERBAIJAN AS A REGIONAL HUB IN CENTRAL EURASIA
PORT DEVELOPMENT IN THE 21ST CENTURY 167
18 Hyundai M.M. 286,875 55 65,460 5
19 PIL (Pacific Int. Line) 263,558 142 39,606 14
20 UASC 216,799 55 122,078 10
21 Wan Hai Lines 184,811 87 37,700 14
22 TS Lines 84,457 41 ‐ 0
23 HDS Lines 73,821 22 ‐ 0
24 MISC Berhad 68,117 28 17,080 2
25 CCNI 58,213 24 ‐ 0
TOTAL 12,784,753 3501 3,232,861 387
Source: BRS‐Alphaliner
Today, many of the world’s ocean carriers are also the world’s largest container port owners
and operators. Drewry Shipping Consultants Ltd. identifies 22 global operators (Table 3.12) that
dominate the international container market, which also include a number of the largest
shipping liners. There are different types of global operators, ranging from international
terminal stevedores to global carriers, to hybrid operators. Some of them are privately owned
companies, while others are state‐backed enterprises, which in fact are not much different
from their private counterparts in terms of global business conduct.406 In 2009, international
stevedores accounted for 57% of total traffic handled by global terminal operators, followed by
global carriers (14%) and hybrid operators (30%)407
Table 3.11: Global Operators’ Throughput League Table in 2009 (mln TEU / % share of world container port throughput)
Ranking Operator Million TEU %Share
1 HPH 64.2 13.6%2 APMT 56.9 12.0%3 PSA 55.3 11.7%4 DPW 45.2 9.5%5 Cosco 32.5 6.9%6 MSC 16.4 3.5%7 Eurogate 11.7 2.5%8 Evergreen 8.6 1.8%9 SSA Marine 7.7 1.6%10 CMA‐CGM 7 1.5%11 Hanjin 6 1.3%12 NYK Line 5.2 1.1%13 HHLA 5 1.1%14 Dragados 4.9 1.0%15 APL 4.6 1.0%16 K Line 4.3 0.9%17 OOCL 4.2 0.9%18 Yang Ming 4.1 0.9%19 ICTSI 3.6 0.8%20 MOL 2.7 0.6%
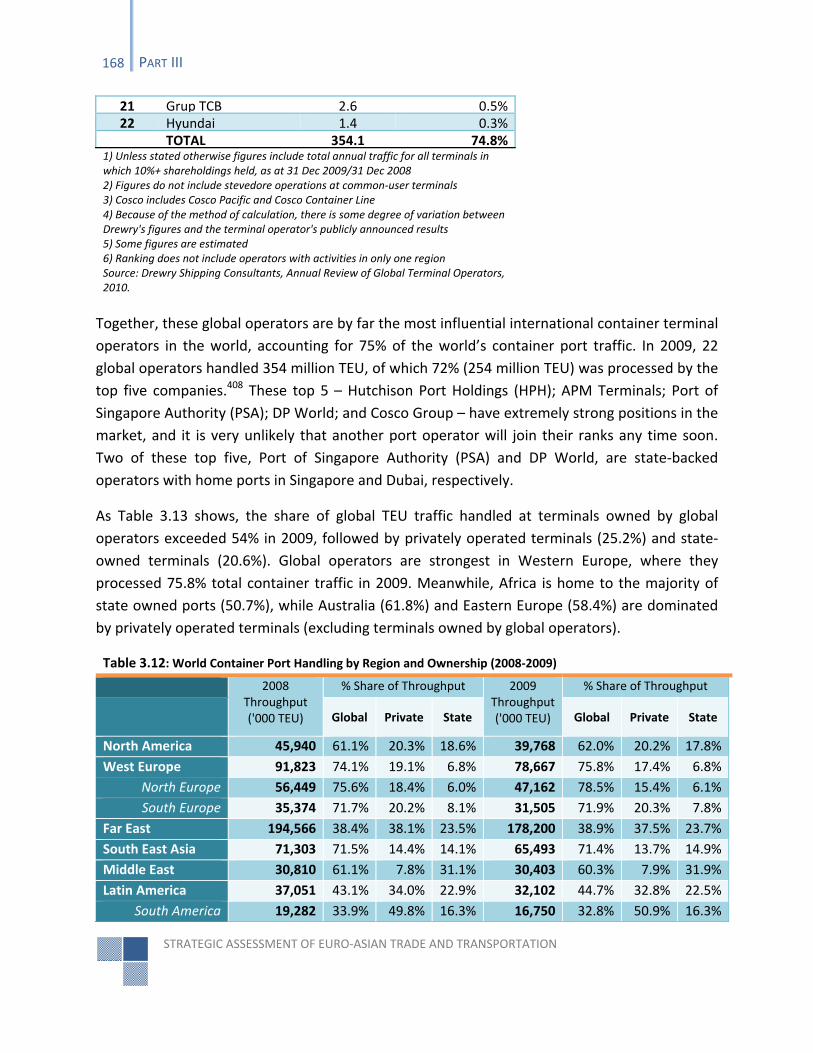
STRATEGIC ASSESSMENT OF EURO‐ASIAN TRADE AND TRANSPORTATION
168 PART III
21 Grup TCB 2.6 0.5%22 Hyundai 1.4 0.3%
TOTAL 354.1 74.8%1) Unless stated otherwise figures include total annual traffic for all terminals in which 10%+ shareholdings held, as at 31 Dec 2009/31 Dec 2008 2) Figures do not include stevedore operations at common‐user terminals 3) Cosco includes Cosco Pacific and Cosco Container Line 4) Because of the method of calculation, there is some degree of variation between Drewry's figures and the terminal operator's publicly announced results 5) Some figures are estimated 6) Ranking does not include operators with activities in only one region Source: Drewry Shipping Consultants, Annual Review of Global Terminal Operators, 2010.
Together, these global operators are by far the most influential international container terminal
operators in the world, accounting for 75% of the world’s container port traffic. In 2009, 22
global operators handled 354 million TEU, of which 72% (254 million TEU) was processed by the
top five companies.408 These top 5 – Hutchison Port Holdings (HPH); APM Terminals; Port of
Singapore Authority (PSA); DP World; and Cosco Group – have extremely strong positions in the
market, and it is very unlikely that another port operator will join their ranks any time soon.
Two of these top five, Port of Singapore Authority (PSA) and DP World, are state‐backed
operators with home ports in Singapore and Dubai, respectively.
As Table 3.13 shows, the share of global TEU traffic handled at terminals owned by global
operators exceeded 54% in 2009, followed by privately operated terminals (25.2%) and state‐
owned terminals (20.6%). Global operators are strongest in Western Europe, where they
processed 75.8% total container traffic in 2009. Meanwhile, Africa is home to the majority of
state owned ports (50.7%), while Australia (61.8%) and Eastern Europe (58.4%) are dominated
by privately operated terminals (excluding terminals owned by global operators).
Table 3.12: World Container Port Handling by Region and Ownership (2008‐2009)
2008 Throughput ('000 TEU)
% Share of Throughput 2009 Throughput ('000 TEU)
% Share of Throughput
Global Private State Global Private State
North America 45,940 61.1% 20.3% 18.6% 39,768 62.0% 20.2% 17.8%
West Europe 91,823 74.1% 19.1% 6.8% 78,667 75.8% 17.4% 6.8%
North Europe 56,449 75.6% 18.4% 6.0% 47,162 78.5% 15.4% 6.1%
South Europe 35,374 71.7% 20.2% 8.1% 31,505 71.9% 20.3% 7.8%
Far East 194,566 38.4% 38.1% 23.5% 178,200 38.9% 37.5% 23.7%
South East Asia 71,303 71.5% 14.4% 14.1% 65,493 71.4% 13.7% 14.9%
Middle East 30,810 61.1% 7.8% 31.1% 30,403 60.3% 7.9% 31.9%
Latin America 37,051 43.1% 34.0% 22.9% 32,102 44.7% 32.8% 22.5%
South America 19,282 33.9% 49.8% 16.3% 16,750 32.8% 50.9% 16.3%
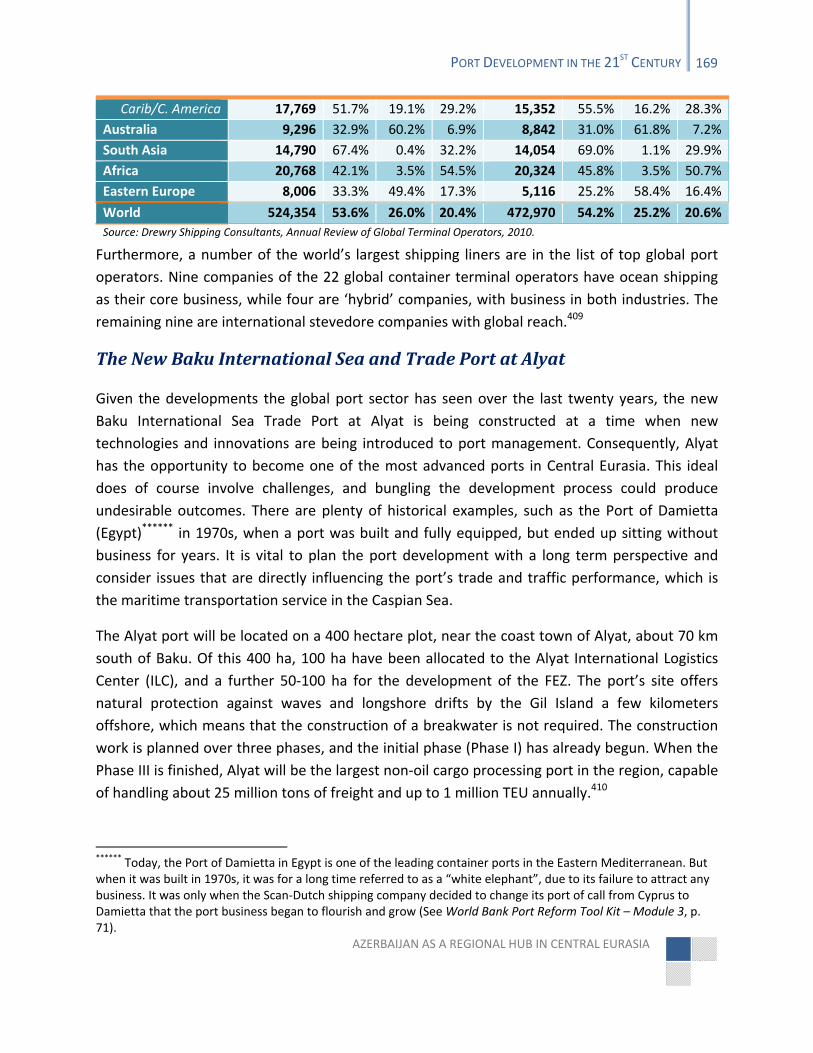
AZERBAIJAN AS A REGIONAL HUB IN CENTRAL EURASIA
PORT DEVELOPMENT IN THE 21ST CENTURY 169
Carib/C. America 17,769 51.7% 19.1% 29.2% 15,352 55.5% 16.2% 28.3%
Australia 9,296 32.9% 60.2% 6.9% 8,842 31.0% 61.8% 7.2%
South Asia 14,790 67.4% 0.4% 32.2% 14,054 69.0% 1.1% 29.9%
Africa 20,768 42.1% 3.5% 54.5% 20,324 45.8% 3.5% 50.7%
Eastern Europe 8,006 33.3% 49.4% 17.3% 5,116 25.2% 58.4% 16.4%
World 524,354 53.6% 26.0% 20.4% 472,970 54.2% 25.2% 20.6%
Source: Drewry Shipping Consultants, Annual Review of Global Terminal Operators, 2010.
Furthermore, a number of the world’s largest shipping liners are in the list of top global port
operators. Nine companies of the 22 global container terminal operators have ocean shipping
as their core business, while four are ‘hybrid’ companies, with business in both industries. The
remaining nine are international stevedore companies with global reach.409
The New Baku International Sea and Trade Port at Alyat
Given the developments the global port sector has seen over the last twenty years, the new
Baku International Sea Trade Port at Alyat is being constructed at a time when new
technologies and innovations are being introduced to port management. Consequently, Alyat
has the opportunity to become one of the most advanced ports in Central Eurasia. This ideal
does of course involve challenges, and bungling the development process could produce
undesirable outcomes. There are plenty of historical examples, such as the Port of Damietta
(Egypt)****** in 1970s, when a port was built and fully equipped, but ended up sitting without
business for years. It is vital to plan the port development with a long term perspective and
consider issues that are directly influencing the port’s trade and traffic performance, which is
the maritime transportation service in the Caspian Sea.
The Alyat port will be located on a 400 hectare plot, near the coast town of Alyat, about 70 km
south of Baku. Of this 400 ha, 100 ha have been allocated to the Alyat International Logistics
Center (ILC), and a further 50‐100 ha for the development of the FEZ. The port’s site offers
natural protection against waves and longshore drifts by the Gil Island a few kilometers
offshore, which means that the construction of a breakwater is not required. The construction
work is planned over three phases, and the initial phase (Phase I) has already begun. When the
Phase III is finished, Alyat will be the largest non‐oil cargo processing port in the region, capable
of handling about 25 million tons of freight and up to 1 million TEU annually.410
****** Today, the Port of Damietta in Egypt is one of the leading container ports in the Eastern Mediterranean. But when it was built in 1970s, it was for a long time referred to as a “white elephant”, due to its failure to attract any business. It was only when the Scan‐Dutch shipping company decided to change its port of call from Cyprus to Damietta that the port business began to flourish and grow (See World Bank Port Reform Tool Kit – Module 3, p. 71).
STRATEGIC ASSESSMENT OF EURO‐ASIAN TRADE AND TRANSPORTATION
170 PART III
Phase I of the construction is estimated to be completed by 2015, allowing for a gradual
transfer of facilities from the existing Port of Baku to its new site at Alyat, without causing
major disruption to maritime operations. Some of the equipment will also be modernized.
During this phase, dredging work will be carried out to create a 7.5 km long, 160m wide and
7.6m deep two‐way navigation channel, allowing any type of vessel in the Caspian Sea to call at
the Alyat port (Map 11).411 Other aspects of Phase I will include building rail and road access to
national transport networks; a number of terminal facilities, including a multi‐berth Ferry
Terminal and Cargo Terminal; an inset harbor basin for cargo/multi‐purpose berths, a Ro‐Ro
berth and small craft berthing facilities; quayside and landside rail facilities; a container
terminal and freight station, warehouses, and administrative buildings.412 Upon the completion
of Phase I, the port will be able to handle 10 million tons of general and dry cargo and about
40,000 TEU; in Phase II, this will increase to 17 million tons of cargo and 150,000 TEU.
The port’s strategic location along the East‐West and North‐South corridors will allow for the
transit of containers and general cargo to and from West Europe, Central Asia, China, the
Middle East and South Asia. The Azerbaijani government is investing in Phase I on its own. The
estimated cost is $760 million, though this is likely to rise. However, it will seek private partners
for the construction and operation of the international logistics center (through a JV or BOT
arrangement) and the development of subsequent phases of the port. As mentioned
previously, the new port at Alyat is expected to be a Landlord Port, with an international
operator. The process of selecting the potential operator has not begun.
The regional ports of the twenty‐first century provide services that transcend “the interests of
local users, and [benefit] business and communities located beyond regional and national
borders.”413Although the new port at Alyat is a part of the national transport strategy, its
development resembles the development of a stand‐alone project. In other words, to the
world, this port appears to be just another regional port, despite the new and exciting promise
it holds. In fact, the Alyat port should be viewed in a broader international context taking into
account other national or regional infrastructure and logistics projects, and also, crucially, as a
part of global supply chain and the FEZ development. This global view will be presented in Part
IV.
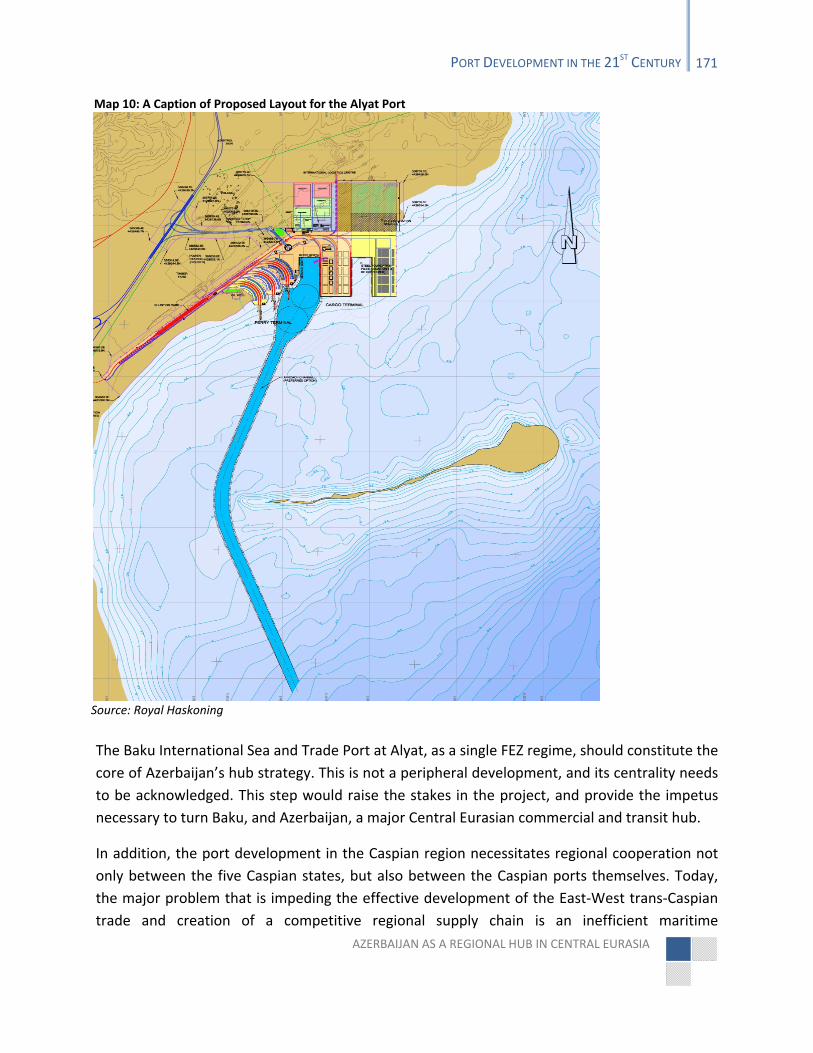
AZERBAIJAN AS A REGIONAL HUB IN CENTRAL EURASIA
PORT DEVELOPMENT IN THE 21ST CENTURY 171
Map 10: A Caption of Proposed Layout for the Alyat Port
Source: Royal Haskoning
The Baku International Sea and Trade Port at Alyat, as a single FEZ regime, should constitute the
core of Azerbaijan’s hub strategy. This is not a peripheral development, and its centrality needs
to be acknowledged. This step would raise the stakes in the project, and provide the impetus
necessary to turn Baku, and Azerbaijan, a major Central Eurasian commercial and transit hub.
In addition, the port development in the Caspian region necessitates regional cooperation not
only between the five Caspian states, but also between the Caspian ports themselves. Today,
the major problem that is impeding the effective development of the East‐West trans‐Caspian
trade and creation of a competitive regional supply chain is an inefficient maritime
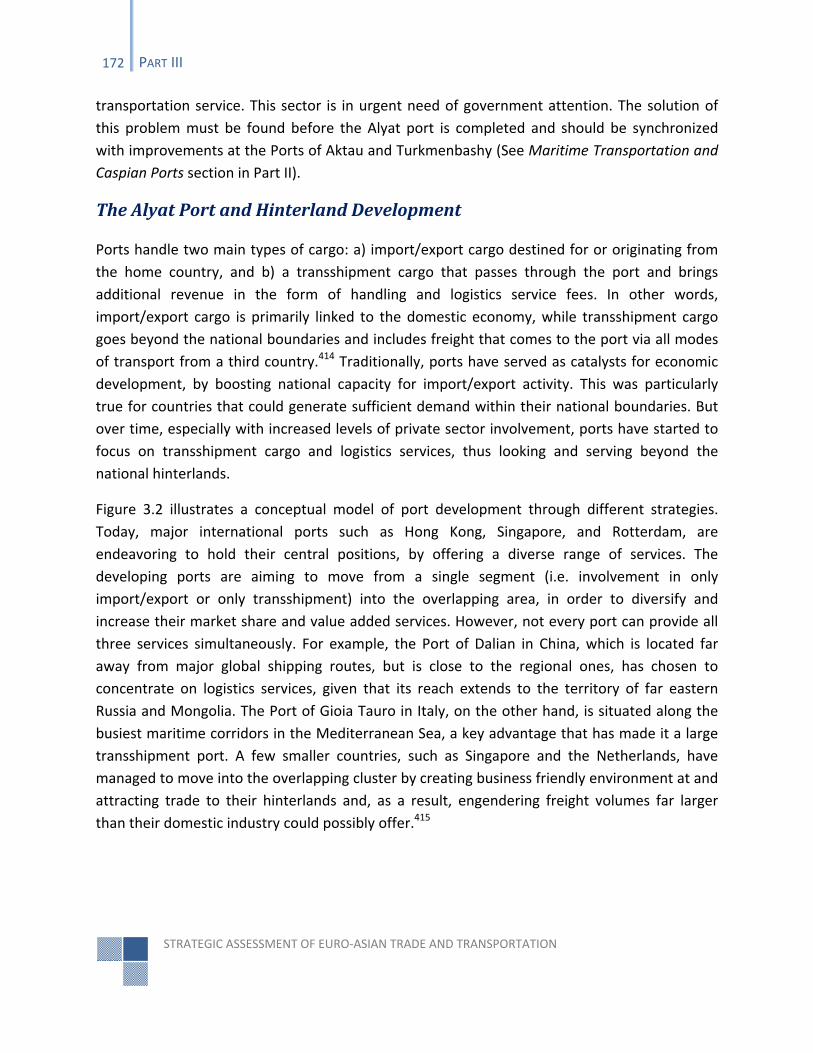
STRATEGIC ASSESSMENT OF EURO‐ASIAN TRADE AND TRANSPORTATION
172 PART III
transportation service. This sector is in urgent need of government attention. The solution of
this problem must be found before the Alyat port is completed and should be synchronized
with improvements at the Ports of Aktau and Turkmenbashy (See Maritime Transportation and
Caspian Ports section in Part II).
The Alyat Port and Hinterland Development
Ports handle two main types of cargo: a) import/export cargo destined for or originating from
the home country, and b) a transshipment cargo that passes through the port and brings
additional revenue in the form of handling and logistics service fees. In other words,
import/export cargo is primarily linked to the domestic economy, while transshipment cargo
goes beyond the national boundaries and includes freight that comes to the port via all modes
of transport from a third country.414 Traditionally, ports have served as catalysts for economic
development, by boosting national capacity for import/export activity. This was particularly
true for countries that could generate sufficient demand within their national boundaries. But
over time, especially with increased levels of private sector involvement, ports have started to
focus on transshipment cargo and logistics services, thus looking and serving beyond the
national hinterlands.
Figure 3.2 illustrates a conceptual model of port development through different strategies.
Today, major international ports such as Hong Kong, Singapore, and Rotterdam, are
endeavoring to hold their central positions, by offering a diverse range of services. The
developing ports are aiming to move from a single segment (i.e. involvement in only
import/export or only transshipment) into the overlapping area, in order to diversify and
increase their market share and value added services. However, not every port can provide all
three services simultaneously. For example, the Port of Dalian in China, which is located far
away from major global shipping routes, but is close to the regional ones, has chosen to
concentrate on logistics services, given that its reach extends to the territory of far eastern
Russia and Mongolia. The Port of Gioia Tauro in Italy, on the other hand, is situated along the
busiest maritime corridors in the Mediterranean Sea, a key advantage that has made it a large
transshipment port. A few smaller countries, such as Singapore and the Netherlands, have
managed to move into the overlapping cluster by creating business friendly environment at and
attracting trade to their hinterlands and, as a result, engendering freight volumes far larger
than their domestic industry could possibly offer.415
AZERBAIJAN AS A REGIONAL HUB IN CENTRAL EURASIA
PORT DEVELOPMENT IN THE 21ST CENTURY 173
The current Port of Baku may
be considered a transshipment
port, since both the oil and
non‐oil trade is dominated by
transit freight. It has some of
the characteristics of a dry
port,††††††416 located in the
middle of the landlocked
countries but with access to the
Caspian Sea, which is essentially
an enclosed body of water. This
feature is likely to impact the
Alyat port, and in the start‐up
years, the major part of its
operations will probably be
transshipments. While there is
nothing wrong with becoming a
relay hub ‐ which is in fact the
first step in Alyat port’s hub
strategy ‐ in the medium term the port needs to act as regional intermodal hub and spoke
center and long term diversify its services if it wants to move into the middle of the diagram on
Figure 3.2. This would entail expanding its activity in the region, strengthening the logistics
services at the port and beyond, and generating trade within the Alyat FEZ by attracting FDI and
local and regional companies. It would also mean increasing land‐based trade via Eurasian
corridors, particularly TRACECA and the NSTC, and inviting major global operators and shipping
carriers to the region. The Alyat FEZ strategy outlined in Part IV could play a decisive role in the
process.
Table 3.13: Basic Functions of a Port Hinterland
Functions Definitions
CFS (Container Freight Stuffing)
A warehouse where cargo is stuffed into and unstuffed from containers. The location is used for container packing and unpacking activities to make FCL [full container load] with LCL [less than container load] cargo.
†††††† A dry port is an inland intermodal terminal directly connected to seaport(s) with high capacity transport mean(s), where customers can leave/pick up their standardized units as if directly to a seaport (from Violeta Roso’s “The Dry Port Concept”).
Figure 3.2: A Conceptual Model of Port Development
Source: Valentine & Gray, 2000. Adapted from UNESCAP study.
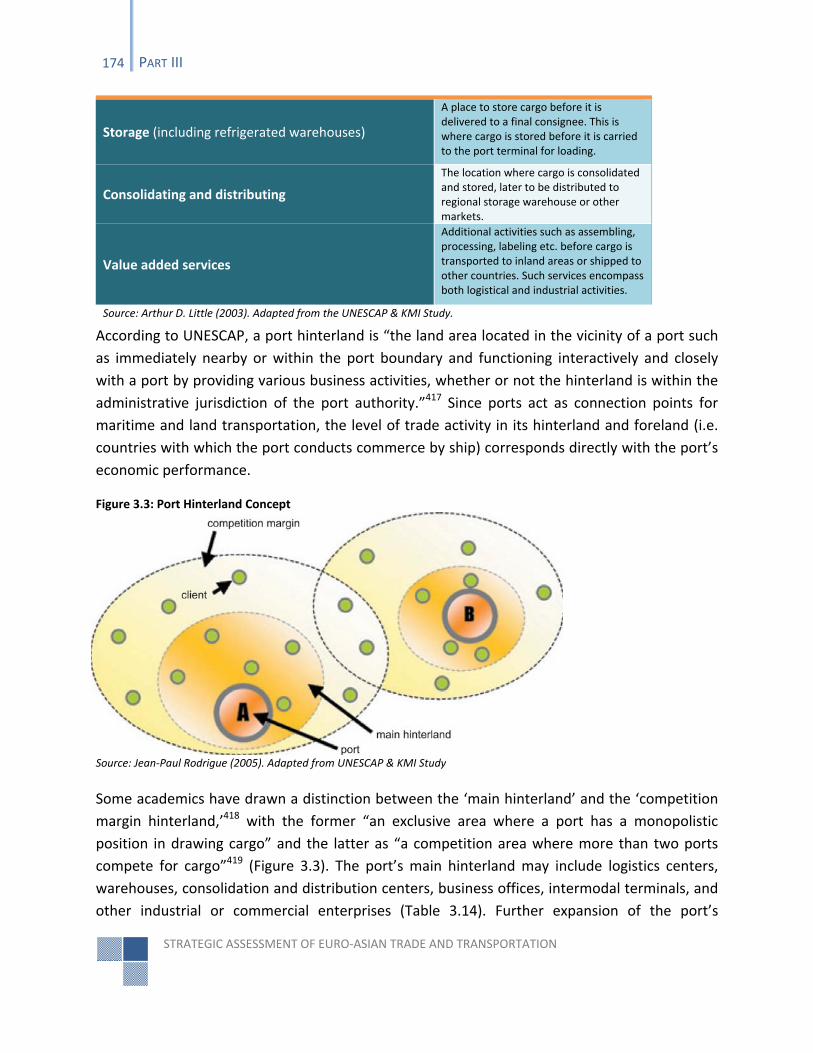
STRATEGIC ASSESSMENT OF EURO‐ASIAN TRADE AND TRANSPORTATION
174 PART III
Storage (including refrigerated warehouses)
A place to store cargo before it is delivered to a final consignee. This is where cargo is stored before it is carried to the port terminal for loading.
Consolidating and distributing
The location where cargo is consolidated and stored, later to be distributed to regional storage warehouse or other markets.
Value added services
Additional activities such as assembling, processing, labeling etc. before cargo is transported to inland areas or shipped to other countries. Such services encompass both logistical and industrial activities.
Source: Arthur D. Little (2003). Adapted from the UNESCAP & KMI Study.
According to UNESCAP, a port hinterland is “the land area located in the vicinity of a port such
as immediately nearby or within the port boundary and functioning interactively and closely
with a port by providing various business activities, whether or not the hinterland is within the
administrative jurisdiction of the port authority.”417 Since ports act as connection points for
maritime and land transportation, the level of trade activity in its hinterland and foreland (i.e.
countries with which the port conducts commerce by ship) corresponds directly with the port’s
economic performance.
Figure 3.3: Port Hinterland Concept
Source: Jean‐Paul Rodrigue (2005). Adapted from UNESCAP & KMI Study
Some academics have drawn a distinction between the ‘main hinterland’ and the ‘competition
margin hinterland,’418 with the former “an exclusive area where a port has a monopolistic
position in drawing cargo” and the latter as “a competition area where more than two ports
compete for cargo”419 (Figure 3.3). The port’s main hinterland may include logistics centers,
warehouses, consolidation and distribution centers, business offices, intermodal terminals, and
other industrial or commercial enterprises (Table 3.14). Further expansion of the port’s
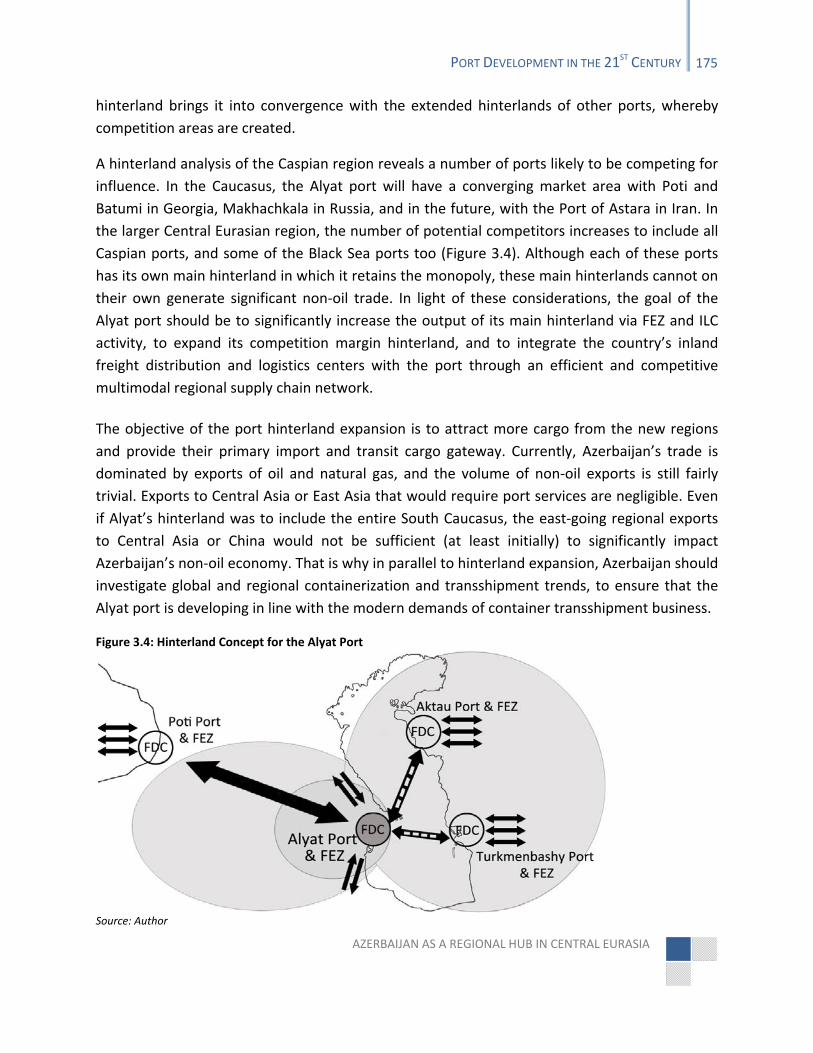
AZERBAIJAN AS A REGIONAL HUB IN CENTRAL EURASIA
PORT DEVELOPMENT IN THE 21ST CENTURY 175
hinterland brings it into convergence with the extended hinterlands of other ports, whereby
competition areas are created.
A hinterland analysis of the Caspian region reveals a number of ports likely to be competing for
influence. In the Caucasus, the Alyat port will have a converging market area with Poti and
Batumi in Georgia, Makhachkala in Russia, and in the future, with the Port of Astara in Iran. In
the larger Central Eurasian region, the number of potential competitors increases to include all
Caspian ports, and some of the Black Sea ports too (Figure 3.4). Although each of these ports
has its own main hinterland in which it retains the monopoly, these main hinterlands cannot on
their own generate significant non‐oil trade. In light of these considerations, the goal of the
Alyat port should be to significantly increase the output of its main hinterland via FEZ and ILC
activity, to expand its competition margin hinterland, and to integrate the country’s inland
freight distribution and logistics centers with the port through an efficient and competitive
multimodal regional supply chain network.
The objective of the port hinterland expansion is to attract more cargo from the new regions
and provide their primary import and transit cargo gateway. Currently, Azerbaijan’s trade is
dominated by exports of oil and natural gas, and the volume of non‐oil exports is still fairly
trivial. Exports to Central Asia or East Asia that would require port services are negligible. Even
if Alyat’s hinterland was to include the entire South Caucasus, the east‐going regional exports
to Central Asia or China would not be sufficient (at least initially) to significantly impact
Azerbaijan’s non‐oil economy. That is why in parallel to hinterland expansion, Azerbaijan should
investigate global and regional containerization and transshipment trends, to ensure that the
Alyat port is developing in line with the modern demands of container transshipment business.
Figure 3.4: Hinterland Concept for the Alyat Port
Source: Author
STRATEGIC ASSESSMENT OF EURO‐ASIAN TRADE AND TRANSPORTATION
176 PART III
Moreover, the Alyat port needs to become the largest ‘logistics zone’ in the Caspian region,
offering comprehensive logistics services to Alyat FEZ residents and international clients,
serving as major regional intermodal distribution hub. It is important to note that many
manufacturers now prefer to put the final touches on their products at the distribution
centers420 or in FEZs near consumer markets, which makes an even more compelling argument
for the provision of value added logistics services at the Alyat FEZ. This would not only generate
significant non‐oil trade for the Alyat Port and Azerbaijan, but would establish it as a regional
logistics leader with all three services (import/export, transshipment, and logistics). This long
term strategy would place the Alyat port in the middle of the diagram on Figure 3.2.

AZERBAIJAN AS A REGIONAL HUB IN CENTRAL EURASIA
PART IV
A PATH TO SUCCESS

AZERBAIJAN AS A REGIONAL HUB IN CENTRAL EURASIA
4. VISION FOR AZERBAIJAN: A BIRD’S EYE VIEW
Planning in the twenty‐first century involves building strategies to address the challenges of the
next 20, 30 and even 50 years. Domestic issues can no longer be tackled without looking
beyond national borders – without considering the increasingly interdependent nature of the
global marketplace and all its various influences. In today’s globalized world with its complex
interactions, it is inevitable that the countries of Central Eurasia will find new synergies through
which they can develop and secure their positions in the international economic and political
arena of the future.
Azerbaijan has and will continue to play a key role in the region in making this transformation
happen. Its vast natural resources will stimulate the development of its non‐oil economy and
revive non‐oil trade in the region, thus restoring its historical position as a commercial hub
along the ancient Silk Road. By 2030, the country could become a prosperous regional hub in
Central Eurasia, but for this to occur, Azerbaijan needs to set out a comprehensive strategy for
sustainable development.
This study provides a strategic assessment of the Euro‐Asian trade and transportation networks
through Central Eurasia, identifying key lessons for Azerbaijan and other aspiring hub countries,
in order that they may take advantage of the increasing levels of commerce between these two
major economic blocs: Europe and Asia. The potential economic reward for transport
development in Central Eurasia is enormous, and the realization of its potential will benefit the
region as a whole.
As demonstrated by this study, successful hub development requires an integrated approach
that by taking a ‘bird’s eye’ view will respond to the Azerbaijan’s main national, regional and
global priorities. Building highways, ports, and airports is a necessary part of this strategy, but
that alone is not enough. Numerous countries have invested in infrastructure projects only to
find them sitting idle for decades. This section will examine some of the issues surrounding the
Free Economic Zone (FEZ) concept, and the development of the Port of Alyat and the Baku
International Airport, in an attempt to contribute to Azerbaijan’s hub vision.
Overview
Automobile engineers understand that to produce a state‐of‐the‐art vehicle they must go
through a meticulous process that begins long before they reach the factory production stage.
Everything starts in an office surrounded by initial concept sketches. During this process, many
STRATEGIC ASSESSMENT OF EURO‐ASIAN TRADE AND TRANSPORTATION
180 PART IV
sketches and models are eliminated, modified, or updated. Engineers design additional two‐
dimensional and three‐dimensional models and do ergonomics analyses and much more before
the first prototype is built. They have to consider every tiny detail to ensure that all 4,000 or
more parts in the automobile work flawlessly, and enable it to function as a coherent unit.
There can be no car without the concept sketch or an initial idea.
The Azerbaijan of 2030 or 2050 will be the product of today’s concept sketches. Central Eurasia
will produce the “Dubais” and “Singapores” of the twenty‐first century, and Azerbaijan has the
potential to be the region’s focal point, the “hub of hubs”. The necessary trajectory for
Azerbaijan requires a coordinated effort at the national level, certainly, but also at the regional
level. Nationally, the government needs to align all its major development projects under a
single objective. This means that the two key projects – the Port of Alyat and Baku International
Airport – should be incorporated into the FEZ concept, which in turn must be constructed on a
flexible and effective legal framework. This approach will produce two marketable projects that
could result in a “Contract of the Twenty‐First Century” in Azerbaijan’s non‐oil sector, similar to
the “Contract of the Century” signed in the energy sector in September 1994.421 At a regional
level, Azerbaijan needs to harmonize its transport strategy with that of neighboring states,
particularly Georgia, Turkey and the Central Asian countries along the East‐West axis, and
Russia and Iran in the North‐South direction.
Azerbaijan’s current GDP per capita is about $3,000, of which only $150 is derived from the
non‐oil sector.422 Nearly 95% of the country’s exports and more than 55% of GDP is revenue
from oil and natural gas sales – a trend that is unlikely to change dramatically in the immediate
future. Azerbaijan plans to attain a “higher income country” status by 2025 or 2030 with a GDP
per capita of $12,000‐15,000.423 The question is: What share of this figure will be generated by
non‐oil sector revenue in 2030? Ideally, it should be more than 60%. Yet to attain this level of
revenue diversification, the country first needs to develop and sustain a solid non‐oil economy.
In 2010, Azerbaijan hosted the First High Level Forum on long‐term sustainable development
strategy in close association with the World Bank. There were a number of eminent foreign
government and private sector representatives who together with the top economic policy
makers from Azerbaijan discussed possible ways to achieve the above objective. The forum
highlighted the fact that the country has two potential development strategies: either foreign
or domestic demand‐led growth. A country with a population of only 9 million in 2011 and an
estimated 10.7 million by the mid‐2050s424 cannot possibly generate large enough domestic
demand to achieve the targeted level of GDP diversification by 2030. Therefore, Azerbaijan
should pursue the foreign demand‐led non‐oil GDP growth strategy, which essentially equates
to FDI driven growth.
AZERBAIJAN AS A REGIONAL HUB IN CENTRAL EURASIA
VISION FOR AZERBAIJAN: A BIRD’S EYE VIEW 181
The forum set out three pre‐conditions for attracting FDI:
(i) a stable macroeconomic and fiscal environment with low inflation rate in the short
term, and a fiscally sustainable economy without significant levels of debt in the long
term;
(ii) an attractive and competitive business culture that would bring non‐oil investors
and developers to Azerbaijan instead of taking their investments elsewhere;
(iii) a highly skilled and competitive human capital. 425
In addition, the Forum stressed the importance in revisiting the traditional role of the
government, which should not only act as a regulating body, but also as a facilitator in
attracting FDI, and then sustaining and expanding investments. In fact, Azerbaijan started
working towards these targets back in the 1990s to develop its oil and gas sector when it signed
the “Contract of the Century” with the world’s leading energy companies. This experiment was
extremely successful, generating more than $35 billion in FDI, not to mention the transfer of
know‐how and modern oil extraction technology and substantial revenue for the State budget.
The Azeri‐Chirag‐Gunashli field alone received more than $20 billion in FDI since 1994.426
Azerbaijan’s economic achievement in the oil sector is the legacy of the agreements signed in
1990s. So what were the factors behind this success?
First of all, the Caspian oil has been an attractive product, promising potentially high returns on
investment. Secondly, the oil sector has been governed by a dedicated and flexible legal
regime, via the Production Sharing Agreements (PSA). The PSAs in Azerbaijan have force of law
and prevail over any other effective or future conflicting or inconsistent national laws.427 In
general, a PSA is a legal contract used mostly in the mineral or oil and gas industries, when the
government and the PSA partner(s) (e.g. a multinational energy company) agree to jointly
develop a resource field and share the costs and profits. Often, the energy company takes on
the role of investor/developer, while the government acts as a regulator and collects royalty
fees. The way the profits are divided varies from PSA to PSA, but it is mostly determined by the
company’s share in the project and the amount of investment it has provided.428 Under PSAs,
Azerbaijan secured the investment it needed to develop its energy sector, while the foreign
companies received legal guarantees for their long term investments.
Thirdly, the negotiation process ran under the direct supervision of the head of the state at the
time, President Heydar Aliyev. This demonstrated the government’s commitment to the
agreements in question, and increased investors’ confidence. The country also achieved relative
macroeconomic and political stability after the ceasefire agreement in 1994, which brought an
end to the active phase of conflict between Azerbaijan and Armenia. This was essential to
STRATEGIC ASSESSMENT OF EURO‐ASIAN TRADE AND TRANSPORTATION
182 PART IV
bringing in FDI. Finally, the oil sector was a small and isolated segment of the national economy,
and this made it possible for the government to better regulate the implementation and
enforcement of the PSAs.
These factors could be grouped into four basic components which together constitute the
framework for the development of Azerbaijan’s energy sector:
i. a valuable product or project (i.e. oil field); ii. an attractive and competitive business climate culture that would bring non‐oil
investors and developers to Azerbaijan; iii. political and economic stability and high level of political support for the project
on the level of President; and iv. technical and regulatory capacity of the Government.
Based on these factors, this study will suggest an analogy through which to analyze Azerbaijan’s
FEZ concept that should constitute the backbone of its grand hub vision.
AZERBAIJAN AS A REGIONAL HUB IN CENTRAL EURASIA
FREE ECONOMIC ZONE CONCEPT FOR AZERBAIJAN
The core of a successful hub strategy for Azerbaijan must include FEZ development, on the basis
that FEZs are prerequisites for generating trade and attracting FDI. Part III emphasized that
current FEZ law in Azerbaijan falls short of the PSA legal framework, effectively utilized by
Azerbaijan to promote its oil and gas projects. The FEZ policy being pursued at the moment is
unlikely to attract multi‐billion level FDI to Azerbaijan. The proposed FEZ zone lacks proper
financial and market assessments (i.e. strategic planning) and does not offer competitive
incentives. In the absence of a PSA‐type legal framework, Azerbaijan’s FEZ activity will be
limited to domestic production, and have a limited impact on the non‐oil economy. Hence,
Azerbaijan’s FEZ concept needs to be re‐evaluated and updated.
PSAtype Legal Regime and FEZ Development
A PSA‐type legal regime is key to successful FEZ development in Azerbaijan. Although the non‐
oil sector may not be as attractive or compelling as the oil sector, given the right strategy and
incentives, it could still bring in high levels of FDI ‐ and not only investments of several million
dollars, but multi‐billion dollar ventures across various sectors of the non‐oil economy. A
serious first‐tier investor or a developer would not consider investing such amounts in
Azerbaijan without solid guarantees and without a deserving project, just as the energy firms in
the 1990s would not have invested in Azerbaijan’s oil sector without a PSA and without proof of
oil reserves in the contracted fields. Therefore, a PSA‐type legal guarantee is fundamental in
this process.
In addition, past experience shows that unless the project is promoted at the highest political
level (i.e. presidential level), it is likely to fail or underperform. This is primarily due to the
competing or conflicting interests of ministries and state agencies, or other interest groups
within the country. For example, the reason why a FEZ has never been established in
Azerbaijan, despite a number of viable proposals, is that the proposed projects were promoted
by particular state agencies or ministries, which gave rise to intra‐governmental competition. A
FEZ project cannot succeed if it is not pursued at a national level and overseen directly by the
president (at least until it is fully established and functioning), which will help avoid the politics
of interest groups and/or intra‐governmental scrapping. The PSAs in the energy sector have
been relatively successful in overcoming these challenges. As such, a PSA with presidential
backing is an effective political and economic tool.
Unlike Azerbaijan’s current FEZ law, a broader and more flexible PSA‐type FEZ law would not
require changing national legislation every time there is a call to offer tax breaks or investment
STRATEGIC ASSESSMENT OF EURO‐ASIAN TRADE AND TRANSPORTATION
184 PART IV
incentives. For instance, under the current FEZ law, the government cannot offer tax holidays,
because it would require an amendment to tax law. Although the ideal solution would be to
amend Azerbaijan’s tax law to allow for the application of certain tax exemption regimes and
incentives for FEZs, this may be a politically challenging exercise at the moment. Hence,
changing the legal structure of the FEZ law from its current version to a PSA‐type law would
enable the government, at least in the short term, to draft tailored contracts for specific
projects, and better plan for the gradual expansion of the FEZ regime to other parts of the
country without requiring changes to national law. Expanding the FEZ regime to different parts
of the country is desirable in the long term, but taking into account the realities on the ground,
this study recommends a gradual approach, allowing the government to first experiment with
two projects (i.e. the Alyat project and the Baku International Airport FEZ), developing them
and then gradually applying the FEZ regime to other projects and areas of the country.
PSAs are narrowly defined contracts between two or more parties, and they apply to a specific
project for a specific time period. The government could prefer to sign a PSA for each individual
FEZ project. The ideal FEZ structure, however, would be an umbrella law encompassing all FEZ
activities. In this way, the government could choose to draft a single PSA‐type FEZ law, covering
all FEZ activities and to be used as a reference framework. Contracts for individual FEZ projects
would operate under this law, with specific articles relating to the particular project activities.
Either of these options would work within the terms of the strategy this study proposes, though
given the challenges and potential risks of introducing the FEZ concept in Azerbaijan, the
former option may be more suitable in the short term.
A Marketable Product/Project
With the adoption of a PSA‐type FEZ law, Azerbaijan would need to identify projects to attract
non‐oil FDI. This study recommends focusing on two projects that could generate significant FDI
in the non‐oil sector and raise the stakes in Azerbaijan’s FEZ development. These two initiatives
are the Alyat project and the Baku International Airport FEZ project. The two projects are
directly linked to Azerbaijan’s grand hub strategy, and constitute its two essential components.
The Jewel of the Caspian: The Alyat Project
The Alyat project currently includes three separate initiatives: the Alyat port, the Alyat
International Logistics Center (ILC), and the Alyat FEZ, each requiring up to 100 ha of the total
400 ha available for the whole project (the area could be expanded if necessary). To increase
the value of the Alyat project, these three stand‐alone projects need to be consolidated into a
single project. Thus, instead of having a separate FEZ near the port and logistics center, the
entire area should be assigned FEZ status and governed by the PSA‐type FEZ legal regime
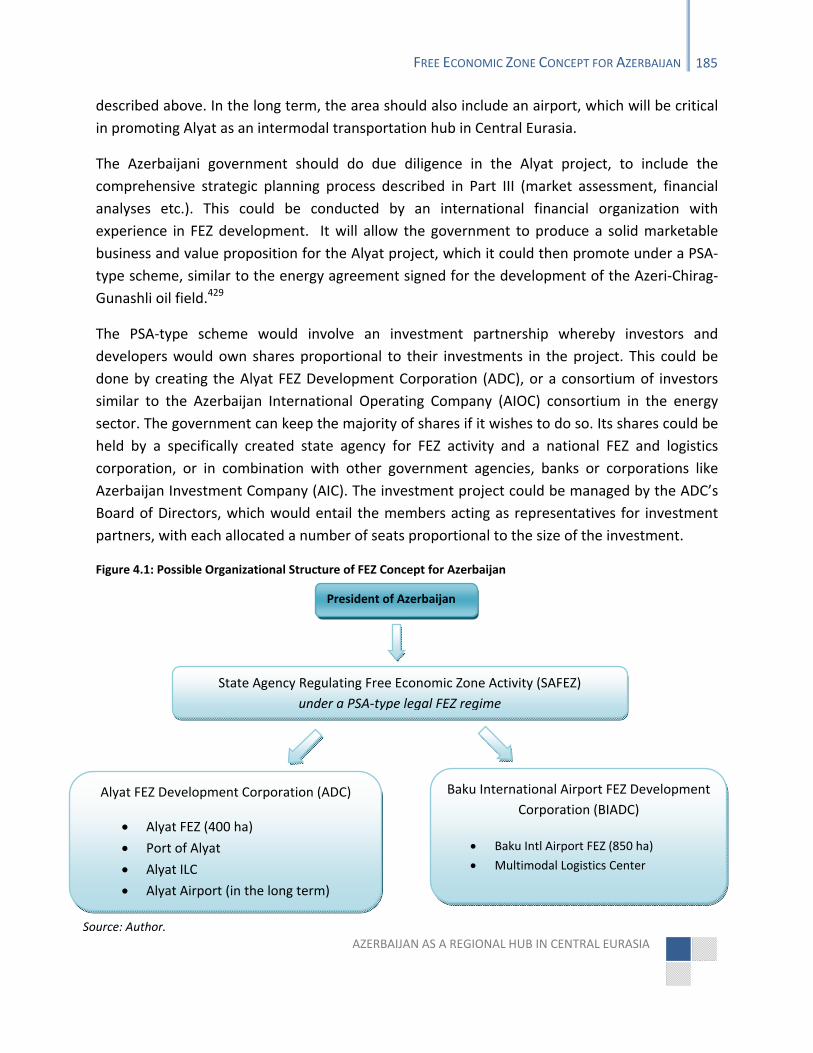
AZERBAIJAN AS A REGIONAL HUB IN CENTRAL EURASIA
FREE ECONOMIC ZONE CONCEPT FOR AZERBAIJAN 185
described above. In the long term, the area should also include an airport, which will be critical
in promoting Alyat as an intermodal transportation hub in Central Eurasia.
The Azerbaijani government should do due diligence in the Alyat project, to include the
comprehensive strategic planning process described in Part III (market assessment, financial
analyses etc.). This could be conducted by an international financial organization with
experience in FEZ development. It will allow the government to produce a solid marketable
business and value proposition for the Alyat project, which it could then promote under a PSA‐
type scheme, similar to the energy agreement signed for the development of the Azeri‐Chirag‐
Gunashli oil field.429
The PSA‐type scheme would involve an investment partnership whereby investors and
developers would own shares proportional to their investments in the project. This could be
done by creating the Alyat FEZ Development Corporation (ADC), or a consortium of investors
similar to the Azerbaijan International Operating Company (AIOC) consortium in the energy
sector. The government can keep the majority of shares if it wishes to do so. Its shares could be
held by a specifically created state agency for FEZ activity and a national FEZ and logistics
corporation, or in combination with other government agencies, banks or corporations like
Azerbaijan Investment Company (AIC). The investment project could be managed by the ADC’s
Board of Directors, which would entail the members acting as representatives for investment
partners, with each allocated a number of seats proportional to the size of the investment.
Figure 4.1: Possible Organizational Structure of FEZ Concept for Azerbaijan
Source: Author.
President of Azerbaijan
State Agency Regulating Free Economic Zone Activity (SAFEZ)
under a PSA‐type legal FEZ regime
Alyat FEZ Development Corporation (ADC)
Alyat FEZ (400 ha)
Port of Alyat
Alyat ILC
Alyat Airport (in the long term)
Baku International Airport FEZ Development
Corporation (BIADC)
Baku Intl Airport FEZ (850 ha)
Multimodal Logistics Center
STRATEGIC ASSESSMENT OF EURO‐ASIAN TRADE AND TRANSPORTATION
186 PART IV
The Board of Directors of Alyat FEZ could be the management body of the project, while a state
agency for FEZ development under the President could act as a regulatory and administrative
body (Figure 4.1). The Board would be able to make decisions on the project’s development
strategies and on choosing the operators for the FEZ, Alyat IFC, and the Alyat port. Investment
in the port should be encouraged, and potentially, additional dedicated terminals should be
built and operated by global shipping companies or international stevedores. The concessions
and development strategies to be adopted for a particular segment of the Alyat project could
be determined by the Board.
Eurasian Aviation & Logistics Hub: Baku International Airport FEZ
The second FEZ project could be the Baku International Airport (BIA) FEZ project. The Air
Transportation section in Part II demonstrates Baku’s capacity to become Central Eurasia’s
major air hub. This potential could be realized if additional incentives and value propositions
were created at the BIA. The best way to create such incentives would be to establish a BIA FEZ
over a large area (about 850 ha) adjacent to the current airport.
The previous feasibility study conducted by a Dubai‐based company in 2008 identified the
potential for increased traffic and trade at the proposed FEZ. It also evaluated the investment
options and revealed the project’s high‐level profitability, with an estimated payback period of
11 years. The BIA has a competitive advantage in terms of its location, and it could be
transformed into an intermodal logistics and air transshipment hub for many European and
Asian airlines. The BIA FEZ, meanwhile, could attract significant FDI and businesses involved in
transit shipments and trading, particularly in the export and re‐export of perishable agricultural
commodities.
The Alyat FEZ and the BIA FEZ projects could be managed under a single PSA‐type legal
framework, or two specifically designed PSAs. The organizational structure of the BIA FEZ could
be similar to the Alyat project with a public‐private partnership model. The investing partners
could set up the BIA FEZ Development Corporation (BIADC), which would manage and develop
the zone (Figure 4.1). The two zones would complement one another, since the Alyat FEZ
would not have its own airport during the initial years, while the BIA FEZ would benefit greatly
from intermodal trade generated in or transiting through the Alyat FEZ. This means that the
development of these two projects would have to be closely coordinated, so that they
complement one another and support Azerbaijan’s grand hub strategy.
AZERBAIJAN AS A REGIONAL HUB IN CENTRAL EURASIA
FREE ECONOMIC ZONE CONCEPT FOR AZERBAIJAN 187
Stability and Political Support
In addition to the PSA‐type legal regime and a marketable product/project, a first‐class FEZ
project would require a third component, which is actually the most critical of all three:
political and economic stability and political support for the project on the level of President. As
Part III demonstrates, introducing new initiatives and reforms in developing and transition
countries is not always universally welcomed. The process of establishing the Aqaba FEZ in
Jordan is a clear example how difficult this process can be. It is also a useful example of a
project that could not have succeeded without the personal involvement and support of the
ruler of Jordan, King Abdulla.
Governments that have failed to sustain economic and political stability have failed in their FEZ
initiatives. There are countless examples of such failures in Africa (e.g. Democratic Republic of
the Congo). It is therefore vital that countries aspiring to host FEZs have stable economic and
political climates and friendly business environments. These are preconditions for FDI and
sustainable FEZ development.
The success of a FEZ project depends on the level of political will. A FEZ project without proper
political backing ends up being an incidental economic exercise with limited impact or, at worst,
a complete failure. Such initiatives cost the state hundreds of millions of dollars and produce
scant results. In most transitional economies, including Azerbaijan, this political will often rests
with the president. If the FEZ project is not prioritized by the president and given unconditional
support, its development will likely be undermined by other internal actors. In conclusion, an
integrated FEZ concept that includes a flexible and sustainable PSA‐type legal framework, the
two FEZ projects mentioned above, and presidential backing is more likely to succeed than
several stand‐alone and unsynchronized projects. All of the projects in the transportation and
logistics sector should be brought in line to form a united hub strategy for Azerbaijan 2030.
A FINAL WORD
The ideas outlined in this study will hopefully contribute to the development of Azerbaijan’s
vision for the future. The FEZ concept presented in this section should provide the central
aspect of this vision, which in turn should be reinforced by an integrated approach to all
projects in the non‐oil economy, including those in the transportation and logistics sector. This
type of comprehensive vision would produce an overarching hub strategy, which if pursued
seriously, would turn Azerbaijan into transportation, logistics and commercial hub of Central
Eurasia by 2030.

STRATEGIC ASSESSMENT OF EURO‐ASIAN TRADE AND TRANSPORTATION
188 PART IV
AZERBAIJAN AS A REGIONAL HUB IN CENTRAL EURASIA
ABOUT THE AUTHOR
Taleh Ziyadov is a research fellow at the Azerbaijan Diplomatic Academy and a PhD candidate
in the Department of Politics and International Studies at the University of Cambridge (UK). He
holds a Master’s degree from the School of Foreign Service at Georgetown University. He
specializes in transportation and energy issues in the Caspian region. His analytical articles have
appeared in various journals and newsletters, including Analysis of Current Events, International
Negotiation Journal, Central Asia‐Caucasus Institute Analyst, Eurasia Daily Monitor, Turkish
Policy Quarterly, and the Moscow Times. His book chapter on Azerbaijan’s role in the East‐West
and North‐South Transport Corridors was published in The New Silk Roads: Transport and Trade
in Greater Central Asia by Johns Hopkins University in 2007. He is also co‐editor of the
forthcoming book Beyond Resource Curse (University of Pennsylvania Press, 2011), which
examines the policy challenges encountered by major oil and natural gas exporting states.

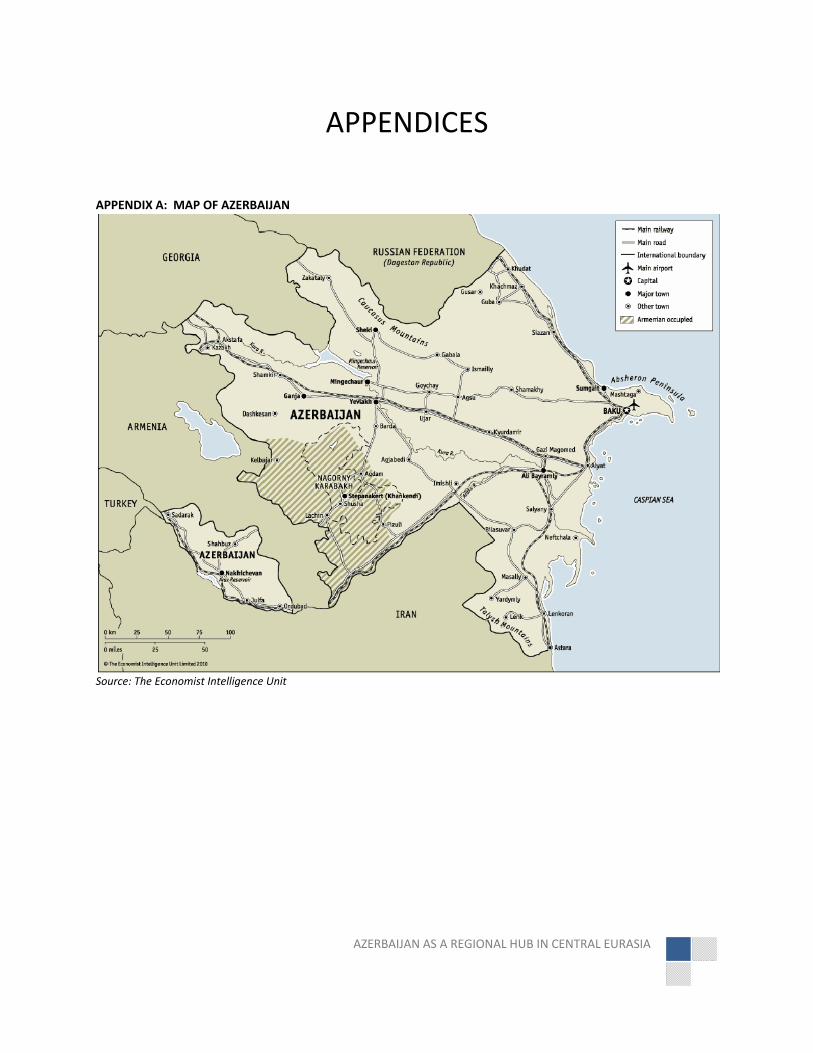
AZERBAIJAN AS A REGIONAL HUB IN CENTRAL EURASIA
APPENDICES
APPENDIX A: MAP OF AZERBAIJAN
Source: The Economist Intelligence Unit
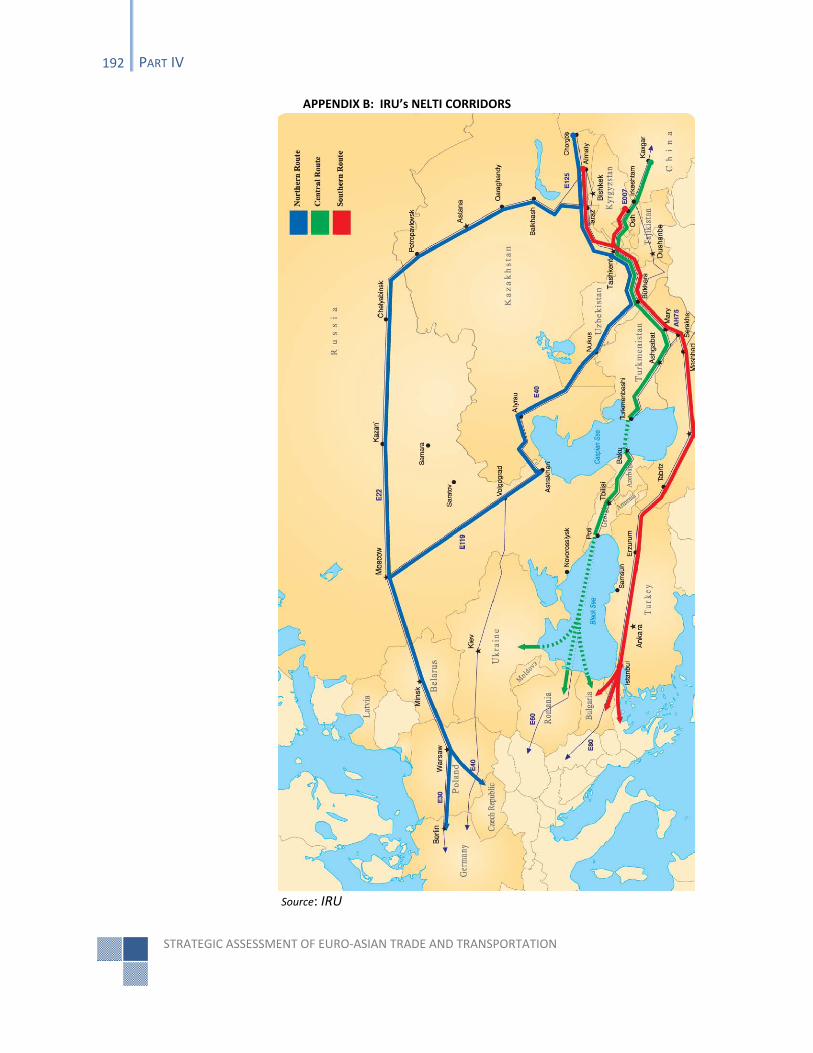
STRATEGIC ASSESSMENT OF EURO‐ASIAN TRADE AND TRANSPORTATION
192 PART IV
APPENDIX B: IRU’s NELTI CORRIDORS
Source: IRU
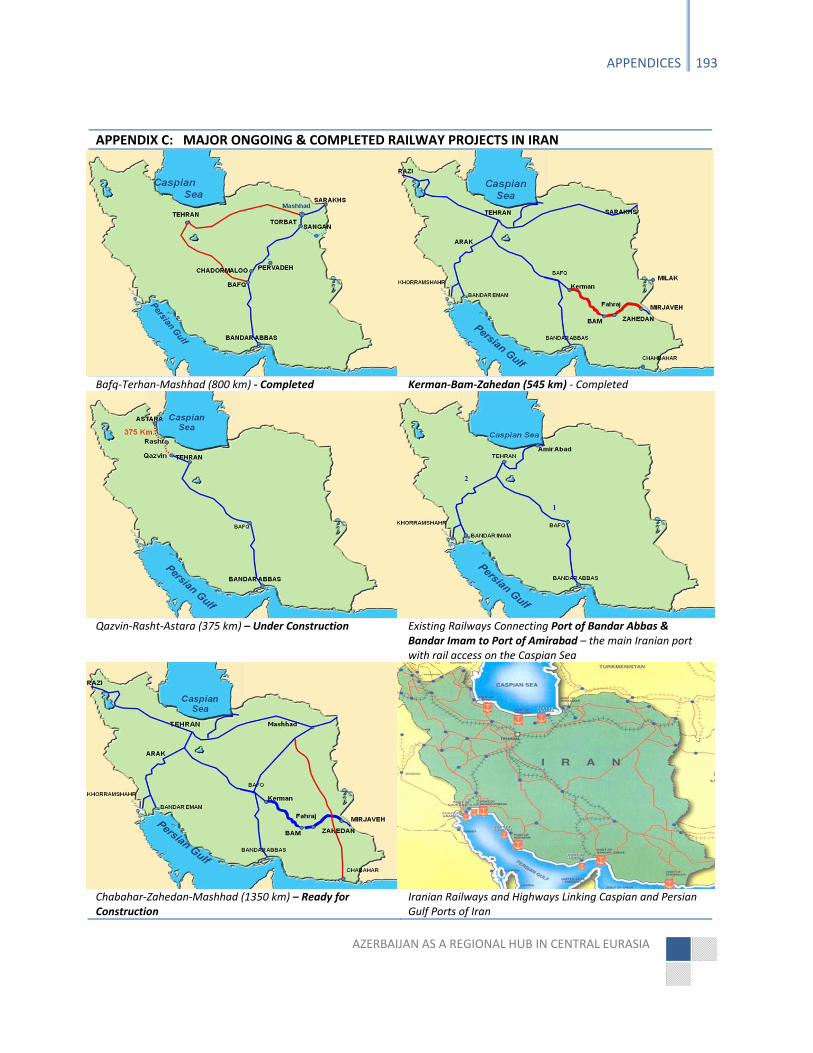
AZERBAIJAN AS A REGIONAL HUB IN CENTRAL EURASIA
APPENDICES 193
APPENDIX C: MAJOR ONGOING & COMPLETED RAILWAY PROJECTS IN IRAN
Bafq‐Terhan‐Mashhad (800 km) ‐ Completed Kerman‐Bam‐Zahedan (545 km) ‐ Completed
Qazvin‐Rasht‐Astara (375 km) – Under Construction Existing Railways Connecting Port of Bandar Abbas & Bandar Imam to Port of Amirabad – the main Iranian port with rail access on the Caspian Sea
Chabahar‐Zahedan‐Mashhad (1350 km) – Ready for Construction
Iranian Railways and Highways Linking Caspian and Persian Gulf Ports of Iran

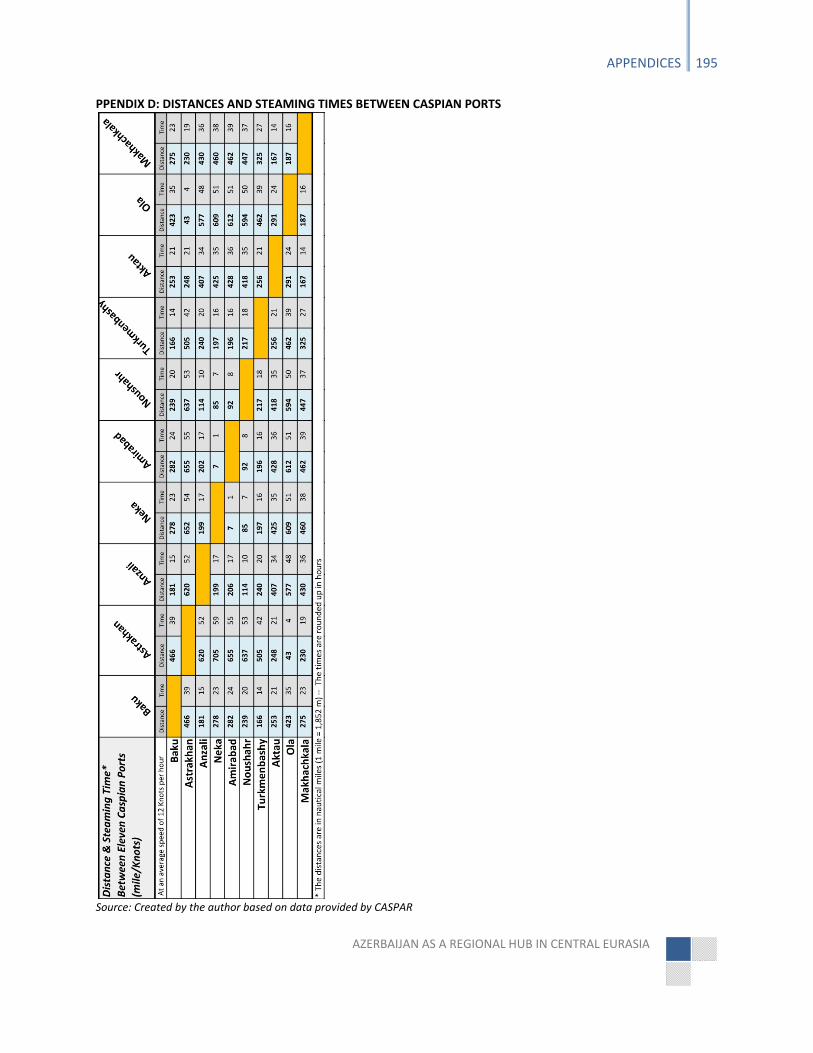
AZERBAIJAN AS A REGIONAL HUB IN CENTRAL EURASIA
APPENDICES 195
PPENDIX D: DISTANCES AND STEAMING TIMES BETWEEN CASPIAN PORTS
Source: Created by the author based on data provided by CASPAR

AZERBAIJAN AS A REGIONAL HUB IN CENTRAL EURASIA
NOTES
1 Christopher M. Davidson, Dubai: The Vulnerability of Success (New York: Columbia University Press, 2008), pp. 92–93.
2 T. J. S. George, Lee Kuan Yew’s Singapore (London: Andre Deutsch, 1973), p. 95.
3 World Bank, World Development Indicators. Retrieved from http://data.worldbank.org/data‐catalog/world‐development‐indicators.
4 Ibid. 5 WTO Press Release, “Trade growth to ease in 2011 but despite 2010 record surge, crisis hangover persists,” April 7, 2011, available online at http://www.wto.org/english/news_e/pres11_e/pr628_e.htm
6 Ibid.
7 See ASEM Fact Sheet, “The ASEM 8 Agenda,” Asia‐Europe Meeting, July 2 2010. Available online at http://www.aseminfoboard.org/content/documents/ASEM8_‐_Fact_Sheet.pdf
8 See the official website of the Trade section of the European Commission, available online at http://ec.europa.eu/trade/
9 World Bank, World Development Indicators (2009).
10 IHS Global Insight, “Valuation of the Liner Shipping Industry: Economic Contribution and Liner Industry Operations,” December 2009. Available online at http://www.worldshipping.org/pdf/Liner_Industry_Valuation_Study.pdf
11 See Meifeng Luo, Lixian Fan, and Liming Liu, “A dynamic‐economic model for container freight market,” Department of Logistics and Maritime Studies at the Hong Kong Polytechnic University, Hong Kong, presented at the International Association of Maritime Economists (IAME) Conference on June 24‐ 26 2009 in Copenhagen, Denmark. Available online at http://www.icms.polyu.edu.hk/Papers/IFSPA09‐Papers/6_M040.pdf
12 See World Shipping Council, “Container Supply Review”, May 2011, available online at http://www.worldshipping.org/
13 Ibid.
14 Eurostat Press Release, “Maritime port activity in the EU27: Total weight of goods handled down by 12% in 2009,” December 20 2010.
15 From the Annual Report of the Ministry of Transport of Azerbaijan (2009) and the author’s interviews with Ministry of Transport officials.
16 From the data provided by the State Statistics Committee of Azerbaijan.
17 See the State Program on Modernization and Development of Automobile Road Networks of Azerbaijan (2006‐2015) (in Azerbaijani). Available online at http://mot.gov.az/download/yollarin%20inkisafi1.pdf
18 Ibid.
19 By 2008, 5,375 km of local roads and more than 225 km of national roads were constructed and partly and fully rehabilitated. See the Annual Report of the Ministry of Transport of Azerbaijan (2008).
20 From the interview with the Senior Advisor at the Ministry of Transport of Azerbaijan, Azer Aliyev. See Trend.az, “2012‐ci ilin sonunadək Azərbaycan magistral yolların tikintisini və yenidən qurulmasını başa çatdıracaq (in
STRATEGIC ASSESSMENT OF EURO‐ASIAN TRADE AND TRANSPORTATION
198 NOTES
Azerbaijani) – (By the end of 2012, Azerbaijan will complete the construction and rehabilitation work on its highways,” March 3, 2011.
21 This information is from the 2009 Annual Report of the ADY titled “ADY JSC in Numbers” (in Azerbaijani and Russian) and also available online at http://railway.gov.az/
22 Ibid.
23 This is based on the official data provided by the Azerbaijan Railway JSC (ADY).
24 The 2009 Annual Report of the ADY titled “ADY JSC in Numbers” (in Azerbaijani and Russian).
25 According to official data, the Azerbaijani government invested $4.5 billion into road rehabilitation projects between 2005 and 2009. In 2008, $1.7 billion were spent on the construction, rehabilitation and repair of roads and highways in Azerbaijan. In 2009, this figure was $1.6 billion. Investments into railways have been minimal until recently. Over the next 5 years, however, the government plans to invest about $13 billion into infrastructure projects, of which more than $1 billion will go to the railway sector. The cited data on road and highway investment is from the 2008 and 2009 Annual Reports of the Cabinet of Ministers of Azerbaijan (in Azerbaijani).
26 From the State Program on Improvement of Railway Systems in 2010‐2014 (in Azerbaijani) signed by President Aliyev on July 6 2010. See also the World Bank Rail Trade and Transport Facilitation Project (2008‐2013), available online at http://web.worldbank.org/
27 For more information about the TRACECA project visit http://www.traceca‐programme.eu/en/traceca/
28 Ibid.
29 From the interview with Mr. Zhantoro Satybaldyev (Kazakhstan), Secretary General of the Permanent Secretariat of the Intergovernmental Commission TRACECA in World Finance Review, “International Transport Corridor TRACECA: Natural Transit Bridge Between Europe and Asia”, January 2010. Available online at http://worldfinancereview.com/january2010/advertisers/traceca.pdf
30 From the interview with Mr. Zhantoro Satybaldyev (Kazakhstan), Secretary General of the Permanent Secretariat of the Intergovernmental Commission TRACECA in World Finance Review, “International Transport Corridor TRACECA: Natural Transit Bridge Between Europe and Asia”, January 2010. Available online at http://worldfinancereview.com/january2010/advertisers/traceca.pdf
31 The State Statistics Committee of Azerbaijan.
32 From the official data provided by ADY.
33 The State Statistics Committee of Azerbaijan does not have detailed data on what proportions of the total cargo shipped along the TRACECA route are international or domestic. The data provided by the State Customs Committee of Azerbaijan suggests that the total cargo turnover transported by trucks at the Azerbaijan‐Georgia border was 1.3 million tons, carried by more than 66,500 trucks.
34 The State Statistics Committee of Azerbaijan.
35 From the interview with Mr. Zhantoro Satybaldyev (Kazakhstan), Secretary General of the Permanent Secretariat of the Intergovernmental Commission TRACECA in World Finance Review, “International Transport Corridor TRACECA: Natural Transit Bridge Between Europe and Asia”, January 2010. Available online at http://worldfinancereview.com/january2010/advertisers/traceca.pdf
36 The information was provided by the Port of Poti authorities.
37 See the official website of the Port of Aktau at http://www.portaktau.kz/
38 This is from the most recent draft of “CAREC Corridors Performance Measurement and Monitoring (CPMM): Annual Report (January 1 to December 2010),” which was still in drafting stage when this study was concluded.
AZERBAIJAN AS A REGIONAL HUB IN CENTRAL EURASIA
NOTES 199
39 See “CAREC Corridors Performance Measurement and Monitoring (CPMM): Annual Report (April 2009 to March 2010)” presented at the 9th Ministerial Conference on Central Asia Regional Economic Cooperation on 31 October–2 November, 2010, in Cebu, Philippines. Available online at http://www.carecinstitute.org/
40 A 1‐3 km/h average speed is shown in the CAREC CPMM (April 2009 to March 2010) report, while 9 km/h is mentioned in the latest CAREC CPMM (January‐December 2010) report.
41 This information was obtained by the author through a number of interviews with trucking companies in Azerbaijan, particularly the interview with Mr. Anar Rzayev, Director of Van der Wal – Azerbaijan.
42 From an interview with Turkish truckers at the Baku port on January 19, 2010.
43 This is from the official statistics of the national association for transport companies in Turkey (UND); courtesy of Mr. Marc Abeille, an EU expert, and the “Motorways of the Seas – Black Sea and Caspian Sea I” project.
44 Information provided by the Port of Poti.
45 From an interview with Turkish truckers at the Baku port on January 19, 2010.
46 See IRU study, “Road Haulage from Europe and China to Afghanistan,” (Moscow, 2009), p. 11.
47 From the interview with the director of “Van der Wal – Azerbaijan” trucking company, Mr. Anar Rzayev.
48 Ibid.
49 In 2009, Azerbaijan International Road Carriers Association (ABADA) reported that in Azerbaijan 630 trucks had received international T.I.R. certificated. See IRU study, “Road Haulage from Europe and China to Afghanistan,” (Moscow, 2009), p. 18.
50 Ibid.
51 Today.az, “Azerbaijan to implement Euro‐3 standard next year,” January 20, 2011.
52 These are rough estimations provided by of Van der Wal – Azerbaijan.
53 Ibid.
54 For detailed discussion of these routes and see their lengths see Taleh Ziyadov, “Azerbaijan” in Frederick S. Starr, ed., The New Silk Roads: Transport and Trade in Greater Central Asia, (Washington: Johns Hopkins University – Central Asia‐Caucasus Institute, 2007).
55 The official data from Azerbaijan Railway JSC (ADY). There may be some inconsistency in rail cargo statistics, which stems from two different sources: the State Statistics Committee and the Azerbaijan Railways JSC (ADY). Some of discrepancy is due to the use of ‘transport’ and ‘non‐transport’ sector data by the State Statistics Committee. The official ADY data only covers the ‘transport’ sector.
56 From the presentation of the Kazakhstan representative at the First TRACECA Investment Forum in Brussels on 12 October 2010.
57 See draft UNECE study prepared by Constantinos Alexopoulos, “Euro Asian Transport Links Inland vs. Maritime Transport: Comparison Study,” (Draft Version), October 29, 2010.
58 Data is provided by the Georgian Railways.
59 The first train between St. Petersburg and Moscow started its journey on November 1, 1851. It had an average speed of 29.6 km/h and its journey time was 21 hours and 45 minutes. See the history section of the official website of Russian Railways (RZD) at http://history.rzd.ru/
60 Data is provided by the Georgian Railways.
STRATEGIC ASSESSMENT OF EURO‐ASIAN TRADE AND TRANSPORTATION
200 NOTES
61 The average speed of regular trains in the Western US states is about 40 km/h, which is similar to the average speed recorded in Canada. Information on average commercial speeds is provided by Harral Winner Thompson Sharp Klein, Inc (Maryland, US). Courtesy of Jan Tomczyk.
62 Information provided by the Georgian Railways.
63 For more information visit Georgian Railways LLC. website at http://www.railway.ge/
64 The data was provided via an email survey by DFDS. Calculations are based on the DFDS data provided. The train leaves Italy at 20:23 and arrives in the UK the following day at 04:45, which gives a journey time of 32 hours and 22 minutes, with an average non‐stop speed of about 44 km/h. However, the train stops at the border crossings and 3 times for an engine change, once near London and twice en route in France or Switzerland. If the stoppage time, presumably more than 4.5 hours in total, was deducted this would give us about 28 hours of actual travel time with an average speed of more than 50 km/h.
65 For 28 platforms in each direction, a round trip price is approximately €52,000. If we divide €52,000 by 28 and then by 2, we will get a rough price for a 20 ft container each way, which is €928.
66 See “Dispelling commonly held myths and setting the agenda for rail freight” booklet by FreightonRail.com. Available online at http://www.freightonrail.org.uk/PDF/MythsBooklet.pdf
67 Troche, Gerhard, “High‐speed rail freight: Sub‐report in Efficient train systems for freight transport”, KTH Railway Group, Report 0512 (Stockholm, 2005), p. 26. Available online at http://www4.banverket.se/raildokuffe/pdf/MP0102.pdf
68 Data courtesy of Pablo Ruiz del Real, Consultant at Advanced Logistics Group (ALG).
69 RailEurope, “The new high speed line between Madrid and Barcelona opens tomorrow, the 20th of February”, February 19, 2008.
70 Quotes are available online. Visit the official website of RENFE at http://www.renfe.com/
71 Information is a courtesy of Pablo Ruiz del Real, Consultant at Advanced Logistics Group (ALG).
72 RailwayInsider.eu, “RENFE initiates freight division restructuring process”, March 3, 2011.
73 A double‐stack rail car is a special rail platform that carries two containers, one over the other. If a regular rail car carries one 40 ft or 53 ft container, the special double‐stack rail car can carries 2 of them, thereby halving transportation costs. This is a commonly used method of transporting 53 ft containers from the West Coast of the United States to the Chicago area. For further information please visit the website of the leading double‐stack car manufacturer in the United States, TTX, at http://www.ttx.com/ For more about American freight transportation, see The Economist, “America’s system of rail freight is the world’s best. High‐speed passenger trains could ruin it,” 22 July, 2010.
74 India’s Western Dedicated Freight Corridor will stretch over 1,483 km, linking Mumbai Port and Delhi. The construction work is expected to start this year and finish by 2017, enabling to carry containers in double‐stack formation and reach 100 km/h travel speed. See “Railway Network in DMIC States” at http://www.delhimumbaiindustrialcorridor.com
75 From the presentation of and discussion with Mr. Erik Evtimov, Senior Legal Advisor & Project Coordinator at International Rail Transport Committee, during the 5th Session of Group of Experts on Euro‐Asian Transport Links in Tashkent, Uzbekistan on November 1‐2, 2010.
76 See the official website of TEL at http://www.trans‐eurasia‐logistics.com/
77 Kurt Bauer, “Is There a Market for a Container Train China – Western Europe?” Railway Market – CEE Review, No: 1.
AZERBAIJAN AS A REGIONAL HUB IN CENTRAL EURASIA
NOTES 201
78 DB Schenker Press Release, “Beijing‐Hamburg Container Express Manages 10,000 Kilometers in Only 15 Days,” January 24, 2008. Available online at http://www.schenker‐seino.co.jp/content/view/254/141/
79 See the Deustche Bahn 2008 Annual Report, available online at http://www.deutschebahn.com/
80 See the speech of President of RZD, Vladimir Yakunin, at 19th Plenary meeting of the Coordinating Council on Transsiberian Transportation in Bratislava, Slovakia on September 29, 2010. Available online (in Russian) at http://press.rzd.ru/
81 Official TEL Website at http://www.trans‐eurasia‐logistics.com/
82 See the official Press Release of DB Schenker (in Russian), available online at http://www.trans‐eurasia‐logistics.com/PDFs/TEL_corporates_with_InterRail_ru.pdf
83 DBSchenker.rs, “DB Schenker and TransContainer to operate Joint Container Hub in Riga,” September 28, 2009.
84 From the presentation of Gennady Bessanov, General Secretary of the Coordinating Council on Trans‐Siberian Transportation (CCTT), “Trans‐Siberian Route: an Effective Transport Link between Europe and Asia,” presented at the International Delegate Conference, “Making the Intermodal Connection: The Role of Terminals”, Ft. Lauderdale, Florida, November 12‐13, 2010.
85 See the official website of RZD (in Russian) at http://www.rzd.ru
86 From the statements made at the 14th meeting of the Russian‐Chinese Sub‐Commission on Cooperation in the field of Transportation between the Governments of Russia and China. The Russian delegation was headed by Deputy Transport Minister Andrew Nedosekov, and Chinese delegation was represented by Director of International Cooperation at the Ministry of Railways of China, Chen Juemin. Available online (in Russian) at http://www.mintrans.ru/news/detail.php?ELEMENT_ID=11168
87 See the speech of President of RZD, Vladimir Yakunin, at the Plenary Session of the 5th Russia‐China Economic Forum on November 24, 2010. Available online at http://www.rus‐china.com/files/Yakunin.pdf
88 Ibid.
89 See the study by Hisako Tsuji, Senior Fellow at ERINA, “International Container Transport on the Trans‐Siberian Railway in 2005 – 2006: The End of Finland Transit and Expectations Regarding Japanese Use,” Economic Research Institute for Northeast Asia (ERINA) Discussion Paper No. 0701e, Niigata, Japan (March, 2007).
90 London Stock Exchange (RNS) News, “OJSC Transcontainer TRCN ‐ Results For 9 Months 2010,” December 21 2010.
91 See the official website of “Transcontainer” at http://www.trcont.ru/
92 See the official website of “Russian Troika CJSC” at http://www.rus‐troyka.com/
93 Hisako Tsuji, “International Container Transport on the Trans‐Siberian Railway in 2005 – 2006: The End of Finland Transit and Expectations Regarding Japanese Use,” Economic Research Institute for Northeast Asia (ERINA) Discussion Paper No. 0701e, Niigata, Japan (March, 2007).
94 Regions.ru, “The Cost of Transit Cargo through Trans‐Siberia Has Doubled” (in Russian) – “Стоимость транзита грузов по Транссибу удвоилась,” January 20 2006.
95 TransportRussia.ru, “Technologies’ of the Future (in Russian) – “Технологии будущего”, December 23 2010.
96 This is according to a recent study conducted by several analysts at A.T. Kearney, a leading management consulting firm in the UK, titled “Russian Rail, Containers, and Growth: The rail container shipping market in Russia is set to soar,” available for download at http://www.atkearney.com/index.php/Publications/russian‐rail‐containers‐and‐growth.html
97 TransportRussia.ru, “Technologies’ of Future” (in Russian) ‐ Технологии будущего,” December 23, 2010.
STRATEGIC ASSESSMENT OF EURO‐ASIAN TRADE AND TRANSPORTATION
202 NOTES
98 See Sergey Baranov, “Orient Express,” Auto Business Review, Issue 10, December 2008.
99 Portnews.ru, “RZD may cut transit tariff on container shipments via Trans‐Siberia by a third” (in Russian) –“ РЖД может на треть снизить тариф на перевозку контейнеров по Транссибу”, April 7, 2010.
100 See Aleksey Strizhonov, “Transit via Russia” (in Russian) – “Транзитом по России”, ChinaPro Magazine, November 23 2009. Available online at http://www.chinapro.ru/rubrics/2/3068/
101 From the presentation of President of RZD, Vladimir Yakunin, at the 18th Plenary Meeting of the CCTT
September 28‐29 2009, in Munich, Germany.
102 Aleksey Strizhonov, “Transit via Russia (in Russian) ‐ Транзитом по России”, ChinaPro Magazine, 23 November, 2009. Available online at http://www.chinapro.ru/rubrics/2/3068/
103 These prices were given by the President of FESCO Transportation Group, Russia’s largest private intermodal transportation group. See Aleksey Strizhonov, “Transit via Russia” (in Russian) –“ Транзитом по России”, ChinaPro Magazine, November 23 2009. Available online at http://www.chinapro.ru/rubrics/2/3068/
104 This price was quoted by a Korean researcher Yung In Kwon in Gudok.ru, “Asian Crossroads” (in Russian) – “Азиатский перекресток,” July 28 2009.
105 See “President of Russian Railways V. Yakunin on Growth Perspectives of Container Shipments from China to Europe” (in Russian) – “Президент ОАО «РЖД» В.Якунин о перспективах роста контейнерных перевозок из Китая в Европу,” Find‐Container.ru, February 4 2010.
106 RZD.ru, “Slovakia‐Austria Broad‐Gauge Rail Extension Feasible”, December 16 2010.
107 From the presentation of Gennady Bessanov, General Secretary of the Coordinating Council on Trans‐Siberian Transportation (CCTT), “Trans‐Siberian Route: an Effective Transport Link between Europe and Asia,” presented at the International Delegate Conference, “Making the Intermodal Connection: The Role of Terminals”, Ft. Lauderdale, Florida, November 12‐13, 2010.
108 Aleksey Strizhonov, “Transit via Russia” (in Russian) – “Транзитом по России”, ChinaPro Magazine, November 23 2009. Available online at http://www.chinapro.ru/rubrics/2/3068/
109 Gudok.ru, “Why Asian goods do not come to Trans‐Siberia” (in Russian) – “Почему азиатские грузы не идут на Транссиб,” November 16 2010.
110 Considering the past and present trends of container and transit shipments via TSR, it will be seriously problematic for Russian Railways to achieve their goal of 560,000TEUby 2015 while simulataneously remaining financially viable and sustaining the infrastructure costs. See for example Aleksey Strizhonov, “Transit via Russia” (in Russian) – “Транзитом по России”, ChinaPro Magazine, November 23 2009. Available online at http://www.chinapro.ru/rubrics/2/3068/
111 KM.ru, “Russian Railways Agree to Set up a Joint Venture with China and Germany” (in Russian) – “РЖД договорилось о создании СП с Китаем и Германией”, November 24 2010.
112 Rzd‐partner.ru,“Trans‐Siberian Transit in the Zone of Fierce Competition” (in Russian) –“Транссибирский транзит в зоне жесткой конкуренции,” October 1 2009. See also ShippingOnline.cn, “TransContainer, CRCT set up China‐Russia/Europe rail JV,” October 30 2009.
113 Railwaygazette.com, “TransContainer targets Eurasian transit market,” March 21 2011.
114 From the interview with Gennady Bessanov, General Secretary of the Coordinating Council on Trans‐Siberian Transportation (CCTT) in Irina Fursova, “Loading Trans‐Siberia” (in Russian) –“ Загрузить Транссиб”, "Российская Бизнес‐газета," №778 (45), November 30 2010.
AZERBAIJAN AS A REGIONAL HUB IN CENTRAL EURASIA
NOTES 203
115 Transday.ru, “The Japanese Government Sends Pilot Train via Trans‐Siberia to Assess Viability of the Route” (in Russian) – “Правительство Японии отправило по Транссибу контрольный поезд для изучения выгодности этой трассы,” February 28 2011.
116 Michail Zalenski, “Challenges and Prospects in Developing Russia’s Transport‐Transit Industry” (in Russian) – “Проблемы и перспективы развития транспортно‐транзитного комплекса России ,” Transport‐Centre.ru, August 4 2010.
117 Rzd‐partner.ru, “Contrailers: Let’s Start from Finland” (in Russian) – “Контрейлеры: начнем с Финляндии”, February 8 2011.
118 See “Analytical Overview” (in Russian) – “Аналитический обзор”, ATFBank Research, December 2010. Available online at http://www.atfbank.kz/upload/userfiles/file/geleznaj_doroga.pdf
119 This and other data in graphs referred as “ATFBank Research” is from “Analytical Overview” (in Russian) – “Аналитический обзор”, ATFBank Research, December 2010. Available online at http://www.atfbank.kz/upload/userfiles/file/geleznaj_doroga.pdf
120 According to the Ministry of Transport and Communications of the Republic of Kazakhstan.
121 Data from the Committee on Transport and Railways of the Ministry of Transport and Communications of the Republic of Kazakhstan. http://www.ktps.gov.kz
122 From the presentation by Kazakhstan’s representative of the Kazakh Ministry of Transport and Communications at the OSCE‐UNECE Inter‐Regional Workshop on Developing Euro‐Asian Transport Links in partnership with the Government of Turkmenistan, Turkmenbashy, December 7‐8 2010.
123 Data from the Committee on Transport and Railways of the Ministry of Transport and Communications of the Republic of Kazakhstan. http://www.ktps.gov.kz
124 Ibid.
125 See “Analytical Overview (in Russian)” – “Аналитический обзор”, ATFBank Research, December 2010. Available online at http://www.atfbank.kz/upload/userfiles/file/geleznaj_doroga.pdf
126 According to data from the Customs Control Committee under the Ministry of Finance of Kazakhstan. Courtesy of Mr. Murat Bekmagambetov (TRACECA‐Kazakhstan).
127 See “Analytical Overview” (in Russian) – “Аналитический обзор”, ATFBank Research, December, 2010. Available online at http://www.atfbank.kz/upload/userfiles/file/geleznaj_doroga.pdf
128 Data from the Committee on Transport and Railways of the Ministry of Transport and Communications of the Republic of Kazakhstan. http://www.ktps.gov.kz
129 From the interview (in Russian) with the Minister of Transport and Communication of Kazakhstan, Abelgazi Kusainov in Vestnikrf.ru, “Republic of Kazakhstan: Relevant Answers to Challenges of Our Time” (in Russian) – “Республика Казахстан: актуальные ответы на вызовы времени”, January 26 2011.
130 Ibid.
131 Michael Emerson and Evgeny Vinokurov, “Optimisation of Central Asian and Eurasian Trans‐Continental Land Transport Corridors,” EUCAM ‐ Working Paper 07, December 2009, p. 5.
132 This is based on statistics provided by Kaztransservice (KTS), the official operator of the Kazakhstan Railway fleet, adopted from the presentation of Kaztransservice representative at the 15th Session of the UNECE SPECA Project Working Group on Transport and Border Crossing held in Almaty, Kazakhstan, on April 7‐8 2010. Available online at
http://www.unece.org/trans/main/speca/docs/15th_Pres_KZ_presetation2_r.pdf
STRATEGIC ASSESSMENT OF EURO‐ASIAN TRADE AND TRANSPORTATION
204 NOTES
133 This is based on statistics from Kaztransservice (KTS), the official operator of the Kazakhstan Railway fleet, adopted from the presentation by Kaztransservice representative at the 15th Session of the UNECE SPECA Project Working Group on Transport and Border Crossing held in Almaty, Kazakhstan, on April 7‐8 2010. Available online at
http://www.unece.org/trans/main/speca/docs/15th_Pres_KZ_presetation2_r.pdf
134 Ibid.
135 Michael Emerson and Evgeny Vinokurov, “Optimisation of Central Asian and Eurasian Trans‐Continental Land Transport Corridors,” EUCAM ‐ Working Paper 07, December 2009, p. 5.
136 Ibid.
137 From an interview with the Executive Director of KTS, Talgat T. Lessov by Michel Gueriot and Jan Tomczyk on August 13 2010. Courtesy of Michel Gueriot and Jan Tomczyk.
138 Ibid.
139 See the UN Special Program for the Economies of Central Asia (SPECA) document, “Review of transport projects, activities and initiatives in line with the Almaty Programme of Action and the Busan Declaration on Transport Development in Asia and the Pacific” at the 15th Session of Project Working Group on Transport and Border Crossing on 7‐8 April 2010, Almaty, Kazakhstan. Available online at http://www.unece.org/trans/main/speca/docs/15th_Review.E.pdf
140 See the official website of Kaztransservice (KTS) at www.kts.kz
141 Data from the Committee on Transport and Railways of the Ministry of Transport and Communications of the Republic of Kazakhstan. http://www.ktps.gov.kz
142 Ministry for Foreign Economic Relations, Investments and Trade of the Republic of Uzbekistan.
143 Kazakh‐Zerno.kz,” In 2009‐2010 marketing year Kazakhstan delivered 8.3 million tons of grain and flour to the world markets” (in Russian) – “В 2009‐2010 маркетинговом году Казахстан поставил на мировые рынки 8,3 миллиона тонн зерна и муки”, July 8 2010.
144 See the official website dedicated to the Beijing‐Berlin‐Brussels Caravan at http://www.iru‐nelti
.org/index/en_bbb_index
145 Ibid.
146 UNESCAP has a specific Time/Cost methodology used to estimate transport process from origin to destination. For more information, please visit UNESCAP website at http://www.unescap.org/ttdw/index.asp?MenuName=RouteStudiesWelcome
147 See the Monitoring section at the IRU‐NELTI official website, available at http://www.iru‐nelti.org/index/en_monitoring . Data is courtesy of Vadim Fedoseev, IT Consultant at IRU Permanent Delegation to Eurasia in Moscow, Russia.
148 Ibid.
149 See “NELTI Final Report: Analysis of monitoring data collected on NELTI Project Routes in 2008 – 2009,” Undertaken by NEA Transport Research Institute (Netherlands) in cooperation with the International Road Transport Union (IRU). Available online at http://www.iru‐nelti.org/index/cms‐filesystem‐action?file=nelti/final_report_en.pdf
150 RIA Novosti, “Customs Union of Russia, Belarus, Kazakhstan to become fully operational,” July 6, 2010.
AZERBAIJAN AS A REGIONAL HUB IN CENTRAL EURASIA
NOTES 205
151 From the presentation by the representative of Kazakhstan Ministry of Transport and Communications, “Country Progress Report: Kazakhstan” at the CAREC 8th TSCC Meeting in Ulaanbaatar, Mongolia (June 24‐25, 2009). Available online at http://www.adb.org/Documents/Events/2009/8th‐meeting‐CAREC‐TSCC/
152 Ibid.
153 KTS.kz, “Setting Up a JV with Chinese Company ‘CRIMT’” (in Russian) – “Касательно создания совместного предприятия с Китайской компанией «CRIMT»”, October 15 2010.
154 From the presentation of Ms. Wu Jia, CAREC Coordinator, “People’s Republic of China: Country Progress Report on the Implementation Action Plan for the Transport and Trade Facilitation Strategy” at the CAREC 8th TSCC Meeting in Ulaanbaatar, Mongolia (June 24‐25 2009). Available online at http://www.adb.org/Documents/Events/2009/8th‐meeting‐CAREC‐TSCC/
155 China Daily, “Railway linking major Silk Road towns opens,” December 30 2010.
156 From the presentation of Ms. Wu Jia, CAREC Coordinator, “People’s Republic of China: Country Progress Report on the Implementation Action Plan for the Transport and Trade Facilitation Strategy” at the CAREC 8th TSCC Meeting in Ulaanbaatar, Mongolia (June 24‐25 2009). Available online at http://www.adb.org/Documents/Events/2009/8th‐meeting‐CAREC‐TSCC/
157 China Business News, “Xinjiang to set up two special economic zones in 2011,” February 14 2011.
158 Centralasianewswire.com, “Kyrgyzstan offers China mineral deposits in exchange for railway funds,” January 11 2011.
159 From the presentation by the representative of Kazakhstan Ministry of Transport and Communications, “Country Progress Report: Kazakhstan” at the CAREC 8th TSCC Meeting in Ulaanbaatar, Mongolia (June 24‐25 2009). Available online at http://www.adb.org/Documents/Events/2009/8th‐meeting‐CAREC‐TSCC/
160 See “Analytical Overview” (in Russian) – “Аналитический обзор”, ATFBank Research, December, 2010. Available online at http://www.atfbank.kz/upload/userfiles/file/geleznaj_doroga.pdf
161 This is according to the Minister of Transport and Communication of Kazakhstan, Abelgazi Kusainov. See interview (in Russian) in Vestnikrf.ru, “Republic of Kazakhstan: Relevant Answers to Challenges of Our Time” (in Russian) – “Республика Казахстан: актуальные ответы на вызовы времени”, January 26 2011.
162 From “The length of Iran Roadways Statistics 2009” document published by Iran’s Road Maintenance & Transportation Organization. Available online at http://www.rmto.ir/
163 RIA Novosti, “Iran Offered RZD to Take Part in Electrification of Tehran‐Bafq Rail Line” (in Russian) –
“Иран предложил РЖД поучаствовать в электрификации ж/д линии Тегеран – Бафк”, February 8 2011.
164 From the presentation of RAI representative at the 5th OSCE‐UNECE Euro‐Asian Transport Links Expert Group Meeting in Tashkent (Uzbekistan) on November 1‐3 2010.
165 Visit the official website of the Iranian Railways (RAI), Department of International Affairs, at http://international.rai.ir/eng/
166 Tehran Times, “Iran allocates $9.6b for 5 railway projects,” December 23 2010.
167 PressTV.com, “Iran breaks ground for new railway plan,” December 6 2010.
168 RailwayGazette.com, “China to build eight lines in Iran,” February 28 2011.
169 Official press release of Iranian Railways (RAI), “Meeting of the Roads and Transport Minister of Iran,” available online at http://international.rai.ir/eng/
STRATEGIC ASSESSMENT OF EURO‐ASIAN TRADE AND TRANSPORTATION
206 NOTES
170 According to the President of the Iran‐China Joint Chamber of Commerce, Asadollah Asgaroladi. Reuters, “China in $13bn Iran railway network deal,” February 9 2011. See also Tehran Times, “Iran‐China trade to hit $50b: official,” June 12 2010.
171 Tehran Times, “Iran‐China trade to hit $50b: official,” June 12 2010.
172 All information about the Islamabad‐Tehran‐Istanbul railway is from the presentation of Mohammad Mirzaei Kahagh, Director Transport and Communications, ECO Secretariat (Tehran) at the 4th Session of the UNECE Working Group of Experts on the Euro‐Asian Transport Links (Geneva, September 6 2010).
173 Ibid.
174 Ibid.
175 This is based on UND data, courtesy of Mr. Marc Abeille. The number of these trucks which went to Central Asia via Kazakhstan or Turkmenistan is not known.
176 See “NELTI Final Report: Analysis of monitoring data collected on NELTI Project Routes in 2008 – 2009,” Undertaken by NEA Transport Research Institute (Netherlands) in cooperation with the International Road Transport Union (IRU), p. 16. Available online at http://www.iru‐nelti.org/index/cms‐filesystem‐action?file=nelti/final_report_en.pdf
177 This data is from an interview with a managing director of Transit and Frontier Terminals in Iran published by Iran’s Road Maintenance & Transportation Organization website at http://www.rmto.ir/
178 These statistics are calculated by the author from the available data at Iran’s Road Maintenance & Transportation Organization website (http://www.rmto.ir/)
179 These statistics are calculated by the author from the available data at Iran’s Road Maintenance & Transportation Organization website (http://www.rmto.ir/)
180 For historical accounts about Indian traders in Azerbaijan see Sara Ashurbeyli, “Economic Ties of Azerbaijan with India” in Salakhaddin Khalilov, ed. Great Silk Road and Azerbaijan: Yesterday, Today, Tomorrow (in Russian), (Baku: University of Azerbaijan, 1998), pp. 40‐41.
181 Ibid. pp. 42‐43.
182 From interview with Azerbaijani freight forwarders.
183 Speaking at the Business Forum “Strategic Partnership 1520: Caucasus Region” in October 2010 in Baku, VP of Russian Railways, Vadim Morozov, stated that the number of container turnover between Europe and countries of the Middle East and South Asia is increasing and the railway link in the North‐South axis is underutilized. See Gudok.ru, “Steel Throw to the South” (in Russian) ‐ (Стальной бросок на Юг), October 25 2010.
184 RIA Novosti, “Russian‐Iranian trade turnover hits $3.7 bln”, February 20 2010.
185 Based on data from the IMF Direction of Trade Statistics database (reported by the Governments of India and Islamic Republic of Iran). The reports of the Russian Federation put the annual trade with India at $6.3 billion and with Iran at $3 billion in 2009.
186 TheHinduBusinessline.in,”Russia, India aim for $20b trade by 2015,” December 20 2010.
187 This is according to Head of International Department of Iranian Railways, Abbas Nazari. See Trend.az, “Azerbaijan, Russia and Iran sign agreement to establish JV on North‐South project,” February 8 2011.
188 RIA Novosti, “Russia‐India trade to reach $10 bln by 2010 ‐ deputy PM,” December 3 2008.
189 Reuters, “India‐Iran oil row: How markets could react,” December 30 2010.
190 The Tehran Times, “Iran to continue crude supply to India,” January 18 2011.
AZERBAIJAN AS A REGIONAL HUB IN CENTRAL EURASIA
NOTES 207
191 According to the statement made by Iran’s Minister of Economic Affairs and Finance, Dr. Seyed Shamsodin Hosseini, at a seminar held in New Delhi in July 2010. See Indiaserver.com, “Iran Proposes Investment Protection Treaty With India, Plans For Increasing Bilateral Trade,” July 8 2010.
192 Fars New Agency, “Iran, India Consult on North‐South Corridor,” 25 October 2009.
193 From the paper of Dr. Gulshan Sachdeva, “EU‐South Asia Economic Linkages” presented at the International Seminar on European Union in Changing International Order: Issues and Concerns, Mangalore University, October 20‐21 2010.
194 Ibid.
195 These calculations are done based on the data from the Ministry of Commerce and Industry, Government of India, courtesy of Dr. Gulshan Sachdeva.
196 This is based on Dr. Gulshan Sachdeva’s estimations. See Sachdeva, Gulshan, “Regional Economic Linkages” in Nirmala Joshi (ed.), Reconnecting India and Central Asia Emerging Security and Economic Dimensions, (Washington, DC: JHU Central Asia‐Caucasus Institute & Silk Road Studies Program, 2010), p. 136.
197 The United Nations Economic and Social Commission for Asia and the Pacific (UNESCAP) study on “Land Transport Linkages From Central Asia To Sea Ports In The South And The East”, New York (1995).
198 News.az, “Azerbaijan, Iran seek to increase annual trade to $10bn,” September 21 2010.
199 This is official data from the State Statistics Committee of Azerbaijan. Also see News.az, “Azerbaijan‐Russia trade grows $103m in 2010”, January 18 2011.
200 According to IMF Direction of Trade Statistics database (as reported by the Government of Azerbaijan).
201 The State Statistics Committee of Azerbaijan.
202 Ibid.
203 Gudok 1520, “Iran Marches through the Corridor” (in Russian) – “Иран идёт по коридору”, April 21 2010.
204 Ibid.
205 According to Iranian Ambassador to Kazakhstan, Ramin Mekhmanparast, the trade turnover between the 2 countries has seen a four‐fold increase, reaching $3 billion in 2008. He said that the countries aim to increase this trade to $10 billion in the near future. See the online version of “Nash Mir” newspaper, “Trade Turnover between Iran and Kazakhstan has increased by four times” (In Russian) – “Торговля между Ираном и Казахстаном выросла в четыре раза”, February 10 2010.
206 Ibid. According to Director of Iranian Railways, Abbas Nazari, with the completion of the railway link from Uzen (Kazakhstan) to Qizilqaya, Bereket, Ertek (Turkmenistan) to Gorgan (Iran), the annual cargo flow will exceed 20 million tons.
207 For example, see Sergei Mikheev, “Corridor ‘North‐South’ – Guarantee of Strengthening Russia’s Position in the Caspian” (in Russian) – (Коридор «Север‐Юг» ‐ Залог Укрепления Российских Позиций На Каспии), Politcom.ru, May 28 2010.
208 See the United Nations “Report Of The Expert Group Meeting On The Development Of The North‐South Corridor Linking Northern Europe To The Persian Gulf” produced following a meeting of experts in Moscow on September 26 2005. Available online at http://www.unescap.org/ttdw/common/TIS/TAR/text/TAR‐NS‐Corridor‐Main‐Oct05‐web.pdf
209 See also Alexander Polishuk’s commentary, “Cooperation of Russian Federation and Iran in the area of transportation” (in Russian) – “Сотрудничество между РФ и ИРИ в области транспорта” available online at http://www.vkimo.com/node/850
STRATEGIC ASSESSMENT OF EURO‐ASIAN TRADE AND TRANSPORTATION
208 NOTES
210 Gudok.ru, “Steel Throw to the South” (in Russian) – “Стальной бросок на Юг”, 25 October 2010.
211 The UIC feasibility study (2008) concludes that the NSTC route through Azerbaijan is not only shortest, but also the quickest and economically competitive option in Euro‐Asian transportation if managed and further developed. See the feasibility study by the International Union of Railways (UIC) titled “The New Caucasus Route”, October 3 2008.
212 These are official figures given to the author by the State Customs Committee of Azerbaijan.
213 From the author’s interviews with the former Azerbaijani railway employees during the Soviet Union who were familiar with the Julfa border crossing point.
214 See Taleh Ziyadov, “Azerbaijan” in Frederick S. Starr, ed., The New Silk Roads: Transport and Trade in Greater Central Asia, (Washington: Johns Hopkins University – Central Asia‐Caucasus Institute, 2007), p. 323.
215This is according to VP of Russian Railways, Vadim Morozov, who spoke at the Business Forum “Strategic Partnership 1520: Caucasus Region” in October 2010 in Baku. See Echo‐Az.Info, “Investments into new railway from Iran to Azerbaijan are estimated at $408 million” (in Russian) – “Инвестиции в строительство новой ж/д линии из Ирана в Азербайджан оцениваются в $408 млн”, October 12 2010.
216 Ibid.
217 This is based on the author’s calculations from the data provided by the State Statistics Committee of Azerbaijan and Azerbaijan Railway JSC (ADY). These numbers reflect the total cargo that is carried by ADY, excluding domestic shipments and cargo carried in the East‐West direction along the TRACECA route.
218 For example‐ see the feasibility study by the International Union of Railways (UIC) titled “The New Caucasus Route”, 3 October 2008, courtesy of Stig Nerdal, Project Manager for international corridors, UIC.
219 See discussion by Director of Azerbaijan Railways, Arif Askerov, in Gudok.ru, “Steel Throw to the South” (in Russian) – “Стальной бросок на Юг”, October 25 2010.
220 According to the Head of International Department of Iranian Railways, Abbas Nazari. Trend.az, “Azerbaijan, Russia and Iran sign agreement to establish JV on North‐South project,” February 8 2011.
221 The Tehran Times, “Tehran, Baku, Moscow sign railway, transport MOUs,”February 9 2011.
222 Trend.az, “Azerbaijan, Russia and Iran sign agreement to establish JV on North‐South project,” February 8 2011
223 The Tehran Times, “Tehran, Baku, Moscow sign railway, transport MOUs,” February 9 2011.
224 See State Program on Development of Railway Transportation Systems in the Republic of Azerbaijan (2010‐2014) (in Azerbaijani) signed by the President Ilham Aliyev on July 6 2010.
225 Gudok.ru, “Iran Marches through the Corridor” (in Russian) – (Иран идёт по коридору), March 5 2010.
226 Turkmenistan Today, “Construction, Transport and Communications” (in Russian) – “Строительство, транспорт и связь”, January 11 2011. Available online at http://tdh.gov.tm/?id=2417
227 Gudok.ru, “Road to Gulf” (in Russian) ‐ (Дорога к заливу), July 27 2010.
228 Tehran Times, “Iran allocates $9.6b for 5 railway projects,” December 23 2010.
229 Trans‐Port.com, Update On Construction of the Rail Link Uzen‐Kizilkaya‐Bereket‐Etrek‐Gorgan (in Russian) – “О ходе строительства ж/д линии Узень‐Кызылкая‐Берекет‐Этрек‐Горган”, November 26 2010
230 According to Head of International Department of Iranian Railways, Abbas Nazari. See Gudok.ru, “Iran Marches through the Corridor” (in Russian) – “Иран идёт по коридору“, March 5 2010.
AZERBAIJAN AS A REGIONAL HUB IN CENTRAL EURASIA
NOTES 209
231 Grain shipments by road from Kazakhstan to Iran via Turkmenistan have been the most inefficient mode of transport, because these shipments are expensive and may get delayed en route (at border crossing points) for 40‐45 days. See for example Gudok.ru, “Grain for Iran” (in Russian) ‐ “Зерно для Ирана“, December 28 2009
232 The data is from the State Statistics Committee of Azerbaijan.
233 From an interview with CASPAR’s Head of Department on External Economic and Commercial Relations, Mr. Ilham Mamedov. See also Interfax.ru, Caspian Shipping Company Expects Growth in Cargo Transportation by 2% in 2010 (in Russian) – “Каспийское морское пароходство в 2010 г. ожидает роста грузоперевозок на 2%”, March 5 2010.
234 Interview with CASPAR’s Head of Department on External Economic and Commercial Relations, Mr. Ilham Mamedov (January 18 2011).
235 Interfax.ru, “CASPAR” Plans to Open New Dry Cargo Terminal By April (in Russian) – ("Каспар" планирует к апрелю ввести в строй сухогрузный терминал), March 5 2010.
236 Interview with CASPAR’s Head of Department on External Economic and Commercial Relations, Mr. Ilham Mamedov.
237 See the Decision of the Government of Kazakhstan (No: 60) on Strategic Plan of Ministry of Transport and Communications of the Republic of Kazakhstan (2010‐2014) on February 2 2010 (in Russian) – “Постановление Правительства Республики Казахстан от 2 февраля 2010 года № 60 ‘О Стратегическом плане Министерства транспорта и коммуникаций Республики Казахстан на 2010–2014 годы’”). Also visit the website of Port of Aktau at http://www.portaktau.kz
238 In 1564, the then Safavid ruler of Iran Shah Tahmasp
239 Transport‐centre.ru, “TRACECA is a knife that separates Russia from both Central Asia and South Caucasus” (in Russian) ‐ (ТРАСЕКА ‐ это тот самый нож, который отсекает Россию и от Средней Азии, и от Закавказья) August 6 2009. Available online at http://www.transport‐centre.ru/111‐4.php
240 Based on statistical data provided by the Port of Baku authority.
241 Ibid.
242 Transport‐centre.ru, “TRACECA is a knife that separates Russia from both Central Asia and South Caucasus” (in Russian) – “ТРАСЕКА ‐ это тот самый нож, который отсекает Россию и от Средней Азии, и от Закавказья” August 6 2009. Available online at http://www.transport‐centre.ru/111‐4.php
243 From the official data provided by the Port of Baku.
244 See the official website of the Port of Baku at http://www.bakuseaport.az/
245 From the interview with the authorities of the Port of Baku (12 January 2010).
246 Ibid.
247 This number is provided by the Port of Poti.
248 See the official website of the Port of Aktau at http://www.portaktau.kz/
249 See the official website of the Port of Aktau at http://www.portaktau.kz/
250 This is according to the Annual Report 2010 of the Committee on Transport and Railways of the Ministry of Transport and Communications of the Republic of Kazakhstan, available online at http://www.ktps.gov.kz
251 See the official website of the Port of Aktau at http://www.portaktau.kz/
252 The data for 1996‐2006 is taken from the TRACECA sponsored project, ‘Aktau Port Development, Master plan and feasibility study for Port of Aktau in Kazakhstan’, by Scott Wilson Kirkpatrick
STRATEGIC ASSESSMENT OF EURO‐ASIAN TRADE AND TRANSPORTATION
210 NOTES
253 See the official website of the Port of Aktau at http://www.portaktau.kz/
254 For more information about SEZ “Morport Aktau” visit http://www.sez.kz
255 See the TRACECA sponsored study by Scott Wilson Kirkpatrick titled ‘Aktau Port Development, Master plan and feasibility study for Port of Aktau in Kazakhstan’.
256 See the TRACECA sponsored study by Scott Wilson Kirkpatrick titled ‘Aktau Port Development, Master plan and feasibility study for Port of Aktau in Kazakhstan’.
257 Ibid.
258 See the official website of the Port of Aktau at http://www.portaktau.kz/
259 These 4 international energy companies are Dragon Oil (with annual exports of 1.5 million tons of crude oil), Burren Resources(600,000 tons), Petronas (400,000 tons) and Mitro (90,000). Courtesy of the marketing department of Dragon Holding.
260 See the 2010 Press Release of Dragon Oil, which is the main oil producing company in Turkmenistan’s offshore Caspian Sea fields, available online at http://www.dragonoil.com/
261 Portnews.ru, Turkmenbashy Looks up to Russia (in Russian) – “Туркменбаши смотрит на Россию”, December 17 2010.
262 Ibid.
263 According to official data provided by the Port of Baku.
264 See Press Releases of the Dragon Oil, which is the main oil producing company in Turkmenistan’s offshore Caspian Sea fields, available online at http://www.dragonoil.com/
265 GTZ.ru, “On the order of Turkmenistan, a third oil tanker was built in Russia” (In Russian) – “По заказу Туркмении в России построили третий нефтеналивной танкер”, September 2 2010.
266 Turkmeninform.com, “A New Tanker Has Arrived in Turkmenistan” (in Russian) – “В Туркменистан прибыл новый танкер”, December 18 2010. Available online at http://www.turkmeninform.com/ru/news/20101218/03653.html
267 Turkmenistan Today, “National Fleet of Turkmenistan Added (in Russian) – “Морской флот Туркменистана
пополнил танкер «Битарап»”, December 17 2010. Available online at http://tdh.gov.tm/?id=2336
268 From the presentation by Mr. Tachmuhammet Gurbanov, Head of Technical Department of the Port of Turkmenbashy, at the OSCE‐UNECE Inter‐regional Workshop on Developing Euro‐Asian Transport Links, on December 7 2010 in Turkmenbashy.
269 See See TRACECA feasibility study report on “International Logistics Centre – Turkmenbashi”, p. 24.
270 See TRACECA feasibility study report on “International Logistics Centre – Turkmenbashi”, a part of a larger study “International Logistics Centres/Nodes Network Central Asia at the Republic of Kazakhstan, Kyrgyz Republic, Republic of Tajikistan, Republic of Uzbekistan and the Republic of Turkmenistan”, October 2010.
271 Balaev, S.Y.
272 See the Annual Report of the Port Ola for 2008 (in Russian) – “ГОДОВОЙ ОТЧЕТ: Открытого акционерного общества «Первая Стивидорная Компания» за 2008 год”. Available online at http://mtpo.ru/content/otchet2008/ (Last accessed on January 15 2011).
273 Association of Maritime Ports of the Russian Federation, “Cargo Turnover of Russian Maritime Ports in 2010 (in Russian) ‐ Грузооборот Морских Портов России За 2010 Год.” Available at http://www.morport.com/rus/publications/document1142.shtml
AZERBAIJAN AS A REGIONAL HUB IN CENTRAL EURASIA
NOTES 211
274 See Balaev, Sergei Y., “Overview of Port Infrastructure in the Caspian Sea and Port of Olya” (in Russian) – “Обзор портовой инфраструктуры Каспийского моря”, 2006. Available online at http://www.marketologi.ru/lib/balaev/kaspiy.doc (Last accessed on January 15 2011)
275 Vneshmarket.ru, Astrakhanians Continue to Increase Cooperation with Iran (in Russian) – “Астраханцы продолжают наращивать сотрудничество с Ираном”, May 28 2010
276 Sergei Mikheev, “Corridor ‘North‐South’ – Guarantee of Strengthening Russia’s Position in the Caspian” (in Russian) – “Коридор «Север‐Юг» ‐ Залог Укрепления Российских Позиций На Каспии”, Politcom.ru, May 28 2010.
277 From the speech by Head of Astrakhan Customs, Pogosov R.B, at a meeting with representatives of Iranian business and regional customs brokers in May 2010. Available online at http://www.caspianpartnership.ru/doc/2010061611500267.doc (Last accessed on January 15 2011).
278 According to the information provided by the Astrakhan Regional Administration Portal; visit http://www.astrobl.ru/Default.aspx?id=2&item=18116
279 Caspianpartnership.ru, “Visit of I.R. Iran Ambassador to Astrakhan – results”, August 12 2010.
280 Vneshmarket.ru, Astrakhanians Continue to Increase Cooperation with Iran (in Russian) – “Астраханцы продолжают наращивать сотрудничество с Ираном”, May 28 2010.
281 For statements by the Head of Federal Antimonopoly Service of the Russian Federation (FAS), Igor Artemyev, about the decision see ASIP.ru, “Russian Federation Rejects Iranian Company’s Bid to Purchase Port in Astrakhan” (in Russian) – “РФ отказала иранской компании в покупке порта в Астрахани‘,December 29 2010. Available online at http://asip.ru/page.php?id=7830
282 Official data of the Port of Astrakhan.
283 Balaev, Sergei Y., “Overview of Port Infrastructure in the Caspian Sea and Port of Olya” (in Russian) – “Обзор портовой инфраструктуры Каспийского моря”, 2006.
284 Ibid.
285 See the Annual Report of the Port Ola for 2008 (in Russian) – “ГОДОВОЙ ОТЧЕТ: Открытого акционерного общества «Первая Стивидорная Компания» за 2008 год”. Available online at http://mtpo.ru/content/otchet2008/ (Last accessed on January 15 2011).
286 From the report by the representative of the Institute of Economics under the Russian Academy of Sciences, A.A. Golovanova, presented at the international conference “Transbaltica 2010”, July 3‐4 2010 in Riga, Latvia (in Russian) – “Современный уровень интеграции морского торгового порта Оля в транспортно‐логистическую систему Каспийского региона”. Available online at http://www.ecfor.ru/pdf.php?id=pub/golovan01 (Last accessed on January 15 2011).
287 Ibid.
288 Official data of the Port of Ola.
289 Morvesti.ru, “Transport Corridors: South Axis” (in Russian) – “Tранспортные коридоры: южный вектор”, December 9 2010.
290 Vneshmarket.ru, The Results of Visit of Delegation from the Astrakhan Region to Provinces of Iran (in Russian) ‐ “Итоги визита делегации Астраханской области в провинции Республики Иран”, December 30 2010.
291 RiaDegestan.ru, “Federal Agency on Tariffs Approved Tariffs for Makhachkala Port’s Service Fees (in Russian)‐ “ФСТ утвердила предельные ставки портовых сборов за услуги Махачкалинского МТП”, March 9 2011.
STRATEGIC ASSESSMENT OF EURO‐ASIAN TRADE AND TRANSPORTATION
212 NOTES
292 Portnews.ru, Turkmenbashy Looks up to Russia (in Russian) – ”Туркменбаши смотрит на Россию“, December 17 2010.
293 See the statement of the former Minister of Transport of the Russian Federation, Igor Levitin, from July 11 2007. Full text available on Portnews.ru, Development of Azov‐Black Sea [Ports] (in Russian) – “Азово‐Черноморская ревизия”, July 12 2007.
294 RIA ‘Degestan’, Port Makhachkala will Adapt for Big Tankers (In Russian) – “Порт Махачкала приспособят для крупных танкеров”, July 27 2010.
295 Trend.az, “Iran to commission new Caspian Sea port”, August 31 2010. For more information about the Port of Astara and KMS visit http://kavehlogistics.com/
296 Visit the official website of the Port of Anzali at http://www.anzaliport.ir
297 Ibid.
298 Visit the official website of the Port of Amirabad at http://amirabadport.pmo.ir/
299 Ibid.
300 Newskaz.ru, Kazakhstan opens its grain terminal in Iranian port of Amirabad (in Russian) – “Казахстан запустил зерновой терминал в иранском порту Амирабад”, July 22 2010.
301 See the monthly PMO report for 10 months activity at Iranian ports in 2010, available in Persian at http://it.pmo.ir/
302 See the monthly PMO report for 10 months activity at Iranian ports in 2010, available in Persian at http://it.pmo.ir/
303 See the annual 2010 PMO report (in English) and the monthly PMO report for 10 months activity at Iranian ports in 2010, available in Persian at http://it.pmo.ir/
304 Visit the official website of the Port of Nowshahr at http://noshahrport.pmo.ir/
305 See the section for Neka Terminal on the official website of National Iranian Oil Company at http://www.nioc‐otc.com/
306 See the section for Neka Terminal on the official website of National Iranian Oil Company at http://www.nioc‐otc.com/
307 Lelyveld, Michael, “Iran: Caspian Oil Exports Ground To A Halt”, RFE/RL, March 27 2002.
308 The exact numbers were provided by a marketing department of the Dragon Holding in UAE. For further information see the official annual reports of Dragon Oil, which contain detailed information about the company’s annual oil output and marketing. Visit the Official Website of Dragon Oil at http://www.dragonoil.com.
309 The proposed site for the new refinery is located near the Port of Neka. See Trend.az, “Iran to build new oil refinery in Mazandaran province,” November 29 2010.
310 From an interview with an Azerbaijani historian, Dr. Goshqar Goshqarli, a member of the Academy of Sciences of the Republic of Azerbaijan.
311 See Freight Transport and Logistics Masterplan by Die Bundesregierung (The Federal Government of Germany) (September 2008).
312 See Dieter W. Rebitzer, “The European Logistics Market,” in Europe Real Estate Yearbook 2007, March 2007. Available online at http://www.europe‐re.com/files/00034000/112‐121_Edit_Logistics.pdf
313 This information is estimations made by Prof. Dr. Mehmet Tanyaş, the founder and head of Turkish Logistics Association (LODER), based on Deloitte’s “Transportation & Logistics Industry Report 2010” report.
AZERBAIJAN AS A REGIONAL HUB IN CENTRAL EURASIA
NOTES 213
314 See the World Bank International Logistics Performance Index (LPI) rankings at http://info.worldbank.org/etools/tradesurvey/mode1b.asp
315 Visit the official website of Doing Business at http://www.doingbusiness.org/
316 Official data from the State Statistics Committee of Azerbaijan.
317 Data provided by Azerbaijan Railway JSC (ADY).
318 From an interview with a manager of the Shamkir Greenhouse facility.
319 “A dry port is an inland terminal directly connected to seaport(s) with high capacity transport mean(s), where customers can leave/pick up their standardized units as if directly to a seaport” see Roso, V. and Lévêque, P. Dry Port concept for seaport inland access with intermodal solutions, Masters Thesis, Chalmers University of Technology, Gothenburg (2002), p. 50. Cited in the UNESCAP study Logistics Sector Developments: Planning Models for Enterprises and Logistics Clusters, by Korean Maritime Institute (New York, 2007), p. 38.
320 For detailed discussion of supply chain management and other related concepts see UNESCAP study Logistics Sector Developments: Planning Models for Enterprises and Logistics Clusters, by Korean Maritime Institute (New York, 2007), pp. 5‐11.
321 This definition is by Stock, G.N., Greis, N.P. and Kasarda, J.D, “Enterprise logistics and supply chain structure: the role of fit,” Journal of Operations Management, Vol. 18, 2000, pp. 531‐547, cited in UNESCAP study Logistics Sector Developments: Planning Models for Enterprises and Logistics Clusters, by Korean Maritime Institute (New York, 2007), p. 8.
322 UNESCAP study Logistics Sector Developments: Planning Models for Enterprises and Logistics Clusters, by Korean Maritime Institute (New York, 2007), p. 14.
323 From the presentation by Mr. Akif Mustafayev, TRACECA’s Azerbaijan's National Secretary, at the First TRACECA Investment Forum in Brussels on 12 October 2010.
324 See Progress Report III – Annex 5 Feasibility studies for the selected projects (Azerbaijan: ILC at the New Baku International Sea Trade Port at Alyat) as a part of TRACECA’s “International Logistics Centres for Western NIS and the Caucasus in Armenia, Azerbaijan, Georgia, Moldova, Ukraine” program, July 2010, pp. 73‐74.
325 This information is from the summary of the TRACECA feasibility study for the proposed logistics centers at the Port of Aktau and the Port of Turkmenbashy, which has been completed within the TRACECA program “International Logistics Centres/ Nodes Network in Central Asia.”
326 See Airbus’s “Global Market Forecast 2007‐2026” Report
327 See Airbus’s “Global Market Forecast 2007‐2026” Report.
328 See Boeing’s “World Air Cargo Forecast 2008‐2009” Report.
329 From an interview with Mr. Jamil Manizade, Deputy Executive Director of Azerbaijan Airlines. Also visit the official website of the Azerbaijan Airlines at http://www.azal.az
330 Statistics on passenger traffic provided by Azerbaijan Airlines.
331 Based on IATA Airline Industry Forecast 2010‐2014.
332 From interview with Mr. Jamil Manizade, Deputy Executive Director at Azerbaijan Airlines.
333 For connecting flight data between Europe and Asia see Airbus’s “Global Market Forecast 2007‐2026” Report, p.22. For comparative growth of connecting vs. non‐stop traffic see presentation Airbus’s “Global Market Forecast 2010‐2029” by John Leahy, CEO of Airbus.
334 Ibid.
STRATEGIC ASSESSMENT OF EURO‐ASIAN TRADE AND TRANSPORTATION
214 NOTES
335 These are estimations by ALG based on information from ATI and OAG databases. Courtesy of ALG.
336 See AZAL Training Center section of AZAL website, available at http://www.azal.az/en/company‐view/16/
337 For example, in 2010, Azerbaijan’s Cabinet of Ministers wrote off AZN 99 million ($124 million) debt generated by AZAL. Since the company is a state‐owned carrier all aircrafts are also purchased and given to AZAL by the Azerbaijani government. There is not much AZAL can contribute to purchases of new aircrafts, unlike for example CASPAR, which shared some costs when ordering new oil tankers for the company. AZAL can become profitable if it is run and operated like a private company, even if the majority if its shares are owned by the State.
338 See “ATW's 2011 Airline Market Leadership ‐ Turkish Airlines,” ATW Online, February 1 2011.
339 Ibid., p. 77.
340 Ibid., p.8.
341 Ibid., p. 78.
342 Ibid., p. 79.
343 According to the World Bank’s “The Global Outlook in Summary (2008‐2012)” report, available online at http://web.worldbank.org/
344 The calculation is based on Boing 737‐400 model where the combustion of 1kg jet fuel yields 3.15 kg of CO2, see Jardine, C.N, A Methodology for Offsetting Aviation Emissions, Oxford: Environmental Change Institute, 2006).
345 See the official website of Baku Cargo Terminal at http://www.bct.az
346 From the interview with the BCT Director, Mr. Ilqar Alakbarov on December 1 2010. Also visit the BCT site.
347 See official website of Silk Way Airlines at http://www.silkway‐airlines.com/
348 See official website of Cargolux at http://www.cargolux.com/
349 This information is from an interview with Cargolux representative in Baku, Mr. Bulent Ilhan. Courtesy of ALG.
350 See official website of the Almaty Airport at http://en.alaport.com/
351 TRACECA “International Logistics Centres for Western NIS and the Caucasus” report.
352 There are divergent accounts on the first modern free/special economic zone. Some scholars point to freeports that were established in the US in 1930s, while recognizing that these zones were only allowed to offer storage and warehousing services, not manufacturing (see Kenneth O’Brien, “Setting up and Operating Freeports” in Freeports, eds. Eamonn Butler and Madesn Pirie, (London: The Adam Smith Institute, 1983)). Others suggest that the first free zone was established in Puerto Rico in 1951 (see Chungjin Kim, “A Study On The Development Plan Of Incheon Free Economic Zone, Korea: Based On A Comparison To A Free Economic Zone In Pudong, China”, Master Thesis, University of Oregon, May 2007), while the World Bank study points to the SEZ established in Ireland in 1959 (See Special Economic Zones: Performance, Lessons Learned, and Implications for Zone Development, (Washington, DC: World Bank, April 2008), pp.2‐3). Yet, the “Colón Free Zone” in Panama was established three years prior to the duty‐free zone in Puerto Rico in 1948, which means it could be considered the first modern free economic zone.
353 For detailed discussion on different types of FEZs and their economic impact see Herbert G. Grubel, “Toward a Theory of Free Economic Zones,” Review of World Economics, Volume 118, Number 1, pp. 39‐61.
354 The World Bank, Special Economic Zones: Performance, Lessons Learned, and Implications for Zone Development, (Washington, DC: World Bank, April 2008), p.2.
355 The World Bank, Special Economic Zones: Performance, Lessons Learned, and Implications for Zone Development, (Washington, DC: World Bank, April 2008), p.12.
AZERBAIJAN AS A REGIONAL HUB IN CENTRAL EURASIA
NOTES 215
356 See UNESCAP and Korean Maritime Institute study on “Free Trade Zone and Port Hinterland Development” (New York, 2005), p. 45.
357 See Madani, D., “A Review of the Role and Impact of Export Processing Zones,” World Bank Development
Research Group Policy Research Working Paper 2238, (Washington, DC: November, 1999) and Cling, J.P. and G. Letilly, “Export Processing Zones: A Threatened Instrument for Global Economy Insertion?” DIAL/Unite de Recherche CIPRE Document de Travail DT/2001/17 (November, 2001). Cited in the World Bank, Special Economic Zones: Performance, Lessons Learned, and Implications for Zone Development, (Washington, DC: World Bank, April 2008), p.12.
358 The World Bank, Special Economic Zones: Performance, Lessons Learned, and Implications for Zone Development, (Washington, DC: World Bank, April 2008), p.14.
359 From the draft paper of the World Bank expert, Fahrettin Yagci, “Setting Up an Effective Export Incentive System in Azerbaijan” (April 21 2010).
360 Ibid.
361 From an interview with Gokhan Akinci, Global SEZ Product Leader at International Finance Corporation (IFC) in Washington, DC (October 15 2010) and his “Strategic Planning (National Level)” presentation delivered in Cairo, Egypt; May 24, 2010.
362 From the presentation by Gokhan Akinci, Global SEZ Product Leader at International Finance Corporation (IFC) in Washington, DC , “Strategic Planning (National Level),” Cairo, Egypt; May 24 2010.
363 Ibid.
364 Ibid.
365 Ibid.
366 The World Bank, Special Economic Zones: Performance, Lessons Learned, and Implications for Zone Development, (Washington, DC: World Bank, April 2008), pp.18‐21.
367 Many successful global operators are either privately owned or state‐backed cooperations.
368 For example, the instability in FEZ regime of Russia’s Kaliningrad exclave had a negative effect on investment in the region throughout the 1990s. Only after Russia’s 1998 economic crisis and the introduction of several SEZ laws did the situation stabilize. Consequently, by 2006, the Kaliningrad SEZ accounted for the output of 80% of TV sets, 84% of vacuum cleaners, 12% of foreign brand cars, 5.7% of furniture, 19.3% canned meat and 33% of canned fish across the whole Russia. See Vladimir Kuzin, “The role of the special economic zones in attracting foreign investment to the Kaliningrad region,” Baltic Rim Economies, Issue 2, April 30, 2008.
369 See the 2006 Annual Report of the Aqaba Special Economic Zone (ASEZ), available online at http://www.aqabazone.com (Accessed May 9 2011).
370 See the World Bank Port Reform Tool Kit (2nd Edition), Module 2 –The Evolution of Ports in A Competitive World, (Washington, DC: World Bank, 2007), p. 21.
371 Ibid., p. 23.
372 From the presentation by Marc H. Juhel, Senior Port Specialist at the World Bank, “Globalisation and Partnerships in Ports: Trends For The 21st Century” at the SingaPort 2000 Conference, Singapore; March 29‐30 2000. Available online at http://siteresources.worldbank.org/INTPRAL/Resources/338897‐1117630063267/singaprt.pdf
373 The original source is Sommer, D, Private participation in port facilities – Recent trends. World Bank ‐ Private Sector Note No. 193, (Washington DC, 1999), see UNESCAP and Korean Maritime Institute study on “Free Trade
STRATEGIC ASSESSMENT OF EURO‐ASIAN TRADE AND TRANSPORTATION
216 NOTES
Zone and Port Hinterland Development,” (New York, 2005). About 104 projects were in developing countries. See Marc Juhel for further details.
374 The data includes both terminals owned exclusively by HPH or in which HPH has interests. See Global Container Terminal Operators 2010: Annual Review and Forecast report published by Drewry Shipping Consultants Ltd, (London: Drewry Publishing, August 2010), p. 30.
375 See the World Bank Port Reform Tool Kit (2nd Edition), Model 3 – Alternative Port Management Structures and Ownership Models, (Washington, DC: World Bank, 2007), p. 71.
376 Ibid., p. 72.
377 Ibid., p. 78.
378 Ibid.
379 These classifications and subsequent descriptions are from the World Bank Port Reform Tool Kit (2nd Edition), Model 3 – Alternative Port Management Structures and Ownership Models, (Washington, DC: World Bank, 2007), p. 81‐82.
380 See Global Container Terminal Operators 2010: Annual Review and Forecast report published by Drewry Shipping Consultants Ltd, (London: Drewry Publishing, August 2010), p. 4.
381 For discussion of the role of Port Authority see Peter W. De Langen, “Ensuring Hinterland Access: The Role of Port Authorities,“ Discussion Paper No. 2008‐11, OECD‐ITF Joint Transport Research Center, March 2008.
382 Such ports could be found in the UK and New Zealand. Because the land is owned by a private firm there is always a risk that the land could be sold to non‐profit organizations for some other use, or sold for profit maximization purposes. There is not much the government can do in such cases, and the use of port is fully dependent on the company’s decision. For a more extended discussion on each port see the World Bank Port Reform Tool Kit (2nd Edition), Model 3 – Alternative Port Management Structures and Ownership Models, (Washington, DC: World Bank, 2007), p. 81‐82.
383 See Global Container Terminal Operators 2010: Annual Review and Forecast report published by Drewry Shipping Consultants Ltd, (London: Drewry Publishing, August 2010), p. 4.
384 From the presentation by Marc H. Juhel, Senior Port Specialist at the World Bank, titled “Globalisation And Partnerships In Ports: Trends For The 21st Century” at the SingaPort 2000 Conference, Singapore; March 29‐30, 2000. Available online at http://siteresources.worldbank.org/INTPRAL/Resources/338897‐1117630063267/singaprt.pdf
385 UNCTAD, “Guidelines for Port Authorities and Governments on the privatization of port facilities,” by the UNCTAD secretariat, September 23 1998, p. 1.
386 Ibid., p. 3. For benefits of concessions also see the World Bank Port Reform Tool Kit (2nd Edition), Model 3 – Alternative Port Management Structures and Ownership Models, (Washington, DC: World Bank, 2007), p. 56.
387 UNCTAD, “Guidelines for Port Authorities and Governments on the privatization of port facilities,” by the UNCTAD secretariat, September 23 1998, p. 2.
388 Ibid., p. 12.
389 Ibid., p. 8.
390 For example, the Port of Poti in Georgia was awarded on a 49 year concession to the Ras Al Khaimah Investment Authority (RAKIA), the Gulf emirate's sovereign wealth fund. The Georgian government has already voiced its disappointment with the performance of RAKIA, and the latter has announced that it does not plan to make any additional investments in Georgia, indicating that it will sell its shares in the Port FEZ project. Recent news suggests that APM Terminals, one of the global operators has purchased 80% of Port of Poti’s shares from RAKIA. See
AZERBAIJAN AS A REGIONAL HUB IN CENTRAL EURASIA
NOTES 217
“Gilauri makes public complaint about RAKIA's performance”, Georgian International Media Centre, March 22 2011 and “RAK Georgia Sells Poti Port,” Georgian Weekly Journal, April 1 2011
391 UNCTAD Port Privatization study, p. 9.
392 See the World Bank Port Reform Tool Kit (2nd Edition), Model 3 – Alternative Port Management Structures and Ownership Models, (Washington, DC: World Bank, 2007), pp. 52‐53.
393 Ibid., p. 54.
394 UNCTAD, “Guidelines for Port Authorities and Governments on the privatization of port facilities,” by the UNCTAD secretariat, September 23 1998, p. 11.
395 Ibid.
396 Ibid., p. 2. Quoted as is with slight modification to the text.
397 See Meifeng Luo, Lixian Fan, and Liming Liu, “A dynamic‐economic model for container freight market,” Department of Logistics and Maritime Studies at the Hong Kong Polytechnic University, Hong Kong, presented at the International Association of Maritime Economists (IAME) Conference on June 24‐ 26 2009 in Copenhagen, Denmark. Available online at http://www.icms.polyu.edu.hk/Papers/IFSPA09‐Papers/6_M040.pdf
398 See the presentation of Mr. Medhat Saad Eldin, General Manager of the Egyptian Center for Studies of Export and Import, titled “Global Container Industry 2008/2009: Analysis Report of the Markets’ Crises” (November 2009). Available online at http://www.ecsei‐eg.com/The%20Report%202009.pdf
399 See BRS annual review of “WORLD SHIPPING and SHIPBUILDING MARKETS in 2011,” p.86. Available online at http://www.brs‐paris.com/annual/annual_histo/annual_review_2011‐a.pdf
400 Ibid., p.3.
401 See the World Bank Port Reform Tool Kit (2nd Edition), Model 3 – Alternative Port Management Structures and Ownership Models, (Washington, DC: World Bank, 2007), p. 85.
402 Global Container Terminal Operators 2010: Annual Review and Forecast report published by Drewry Shipping Consultants Ltd, (London: Drewry Publishing, August 2010), p. 7.
403 According to 2005 data, the share of major shipping liners in the world container market was 18‐19%. See the World Bank Port Reform Tool Kit (2nd Edition), Model 3 – Alternative Port Management Structures and Ownership Models, (Washington, DC: World Bank, 2007), p. 85.
404 Global Container Terminal Operators 2010: Annual Review and Forecast report published by Drewry Shipping Consultants Ltd, (London: Drewry Publishing, August 2010), p. 8
405 See the World Bank Port Reform Tool Kit (2nd Edition), Model 3 – Alternative Port Management Structures and Ownership Models, (Washington, DC: World Bank, 2007), p. 85.
406 For more detailed discussion on different types of international terminal operators see Global Container Terminal Operators 2010: Annual Review and Forecast report published by Drewry Shipping Consultants Ltd, (London: Drewry Publishing, August 2010).
407 Global Container Terminal Operators 2010: Annual Review and Forecast report published by Drewry Shipping Consultants Ltd, (London: Drewry Publishing, August 2010), p. 8
408 Global Container Terminal Operators 2010: Annual Review and Forecast report published by Drewry Shipping Consultants Ltd, (London: Drewry Publishing, August 2010), p. 11.
409 Global Container Terminal Operators 2010: Annual Review and Forecast report published by Drewry Shipping Consultants Ltd, (London: Drewry Publishing, August 2010), p. 13.
STRATEGIC ASSESSMENT OF EURO‐ASIAN TRADE AND TRANSPORTATION
218 NOTES
410 This and subsequent data is provided by the Ministry of Transport of Azerbaijan and Royal Haskoning firm.
411 This includes 4.7m deep draught Ferries; 5.2m deep draught General Cargo Ships; and 5.6m deep draught Ro‐Ro vessels. From the “Port Master Plan: New Baku International Sea Trade Port” report prepared by Royal Haskoning (March 2010).
412 Ibid.
413 World Bank Port Reform Tool Kit (2nd Edition), Model 3 – Alternative Port Management Structures and Ownership Models, (Washington, DC: World Bank, 2007), p. 72.
414 UNESCAP & KMI study, p. 17.
415 UNESCAP & KMI study, p. 18.
416 The definition of the dry port was cited in Leveque, P., Roso, V.,Dry Port concept for seaport inland access with intermodal solutions, Master thesis, Department of Logistics and Transportation, Chalmers University of Technology (Göteborg, Sweden, 2002). For more detailed discussion see Violeta Roso, The Dry Port Concept, Doctor of Philosophy Thesis, Department of Logistics and Transportation, Chalmers University of Technology, (Göteborg, Sweden, 2009).
417 See UNESCAP and Korean Maritime Institute study on “Free Trade Zone and Port Hinterland Development” (New York, 2005), p. 16.
418 According to Dr. Jean‐Paul Rodrigue, see UNESCAP & KMI study.
419 UNESCAP & KMI study, p. 14.
420 Jean‐Paul Rodrigue and Theo Notteboom (2006), “Challenges in the Maritime‐Land Interface: Port Hinterlands
and Regionalization”. Report prepared for the Korean Government, Ministry of Maritime Affairs & Fisheries, The Master Development Plan for Port Logistics Parks in Korea.
421 On September 20 1994, the Azerbaijani government and a consortium of 11 international energy companies signed a 30 year Production Sharing Agreement (PSA) to develop Azerbaijan’s three major oil fields named “Azeri”, “Chirag”, and “Gunashli.” This agreement came to be known as “Contract of the Century” signifying its importance and future impact. Since the signing of the agreement more than $20 billion have been invested for exploration, development and production at the three fields. The “Contract of the Century” was the first PSA signed by the Azerbaijani government and foreign energy firms.
422 From the interview with Emin Huseynov, Director of Center for Research and Development at the Central Bank of Azerbaijan (January 11 2011).
423 Calculated by the World Bank’s Atlas method.
424 The estimation for 2050 is from the Population Reference Bureau (PRB)’s 2010 World Population Data Sheet, available online at http://www.prb.org/Publications/Datasheets/2010/2010wpds.aspx
425 From the interview with Emin Huseynov, Director of Center for Research and Development at the Central Bank of Azerbaijan (January 11 2011).
426 See ‘Oil Strategy’ section at the official website of SOCAR Trading, available at http://www.socartrading.ch/en/oil‐strategy‐97.html
427 For example, Article 23.1 of Production Sharing Agreement on The Exploration, Development and Production Sharing for the Shah Deniz Prospective Area in the Azerbaijan Sector of the Caspian Sea states: “Upon approval by the Parliament of the Azerbaijan Republic of this Agreement, this Agreement shall constitute a law of the Azerbaijan Republic and shall take precedence over any other current or future law, decree or administrative order (or part thereof) of the Azerbaijan Republic which is inconsistent with or conflicts with this Agreement except as specifically otherwise provided in this Agreement.”
AZERBAIJAN AS A REGIONAL HUB IN CENTRAL EURASIA
NOTES 219
428 For detailed discussion see Kirsten Bindemann, “Production‐Sharing Agreements: An Economic Analysis,” Oxford Institute for Energy Studies, October 1999
429 This is the major oil field in Azerbaijan, which combines three nearby fields into one, that has been developed by a consortium of foreign energy companies and SOCAR under a PSA. See Note 4.


