Abstract—Using principles of process management within SMEs has its limitations caused mainly by size of the enterprise and the related focus on operational management. Other specificities are function accumulation, informal leadership, preference for oral communication before written, etc. Nevertheless, implementation of strategic management can increase competitiveness, reduce costs, improve decision- making, facilitate implementation of the employee motivation system, shorten delivery times, higher quality of customer satisfaction, etc. The aim of this article is to find how much SME includes principals of the strategic management. In the research project was used secondary data (financial statements of SMEs who took part in the research) and primary data which were obtained primarily through quantitative methods questionnaire supplemented by qualitative method of in-depth interviews. Majority of examined small and medium enterprises had formulated strategy. They are aimed mainly at stability, further at quality, development and profit. Keywords—management, enterprise, SME, strategy, stability, development 1. Introduction MEs are indispensable in all economies, can be described as a driving force of business, growth, innovation, competitiveness, and are also very important employer. In the Czech Republic performed on 31 th December 2011 some business activity 1,066,787 legal and natural persons who are placed in the category of small and medium-sized enterprises. The total number of active small and medium-sized enterprises participated in 2011 is 99.84%. The share of employees in small and medium-sized enterprises amounted to 60.85% in relation to the employees of the Czech economy. According to [8] the small and medium-sized businesses will create and offer new and quality jobs. According to [10] management of small and medium- sized enterprise has many specifics. In small companies due to the small number of employees and managers many functions are accumulated within the competence of only a few workers predominates, informal leadership is more common, oral communication is preferred than written, etc. The risk of the company measured by the volatility of returns is also related with the size of the company [5]. According to [12] however, a high degree of flexibility to adapt rapidly to changing SME factors, it determines the face and reduce the growing globalization tendencies associated with the onset of multinational corporations and chains. But the principle of important role of strategic management comes here in the force too [8]. Strategic management, based on long- Strategic management of small and medium-sized enterprises. DARJA HOLÁTOVÁ MONIKA BŘEZINOVÁ LIBĚNA KANTNEROVÁ Economic Faculty University of South Bohemia Studentská 13 THE CZECH REPUBLIC [email protected]; [email protected]; [email protected]S WSEAS TRANSACTIONS on BUSINESS and ECONOMICS Darja Holátová, Monika Brezinová, Libena Kantnerová E-ISSN: 2224-2899 65 Volume 12, 2015
Transcript
Abstract—Using principles of process management within SMEs has its limitations caused mainly by size of the enterprise and the related focus on operational management. Other specificities are function accumulation, informal leadership, preference for oral communication before written, etc. Nevertheless, implementation of strategic management can increase competitiveness, reduce costs, improve decision-making, facilitate implementation of the employee motivation system, shorten delivery times, higher quality of customer satisfaction, etc. The aim of this article is to find how much SME includes principals of the strategic management. In the research project was used secondary data (financial statements of SMEs who took part in the research) and primary data which were obtained primarily through quantitative methods questionnaire supplemented by qualitative method of in-depth interviews. Majority of examined small and medium enterprises had formulated strategy. They are aimed mainly at stability, further at quality, development and profit.
Keywords—management, enterprise, SME, strategy, stability, development
1. Introduction
MEs are indispensable in all economies, can be described as a driving force of business, growth,
innovation, competitiveness, and are also very important employer. In the Czech Republic performed on 31th
December 2011 some business activity 1,066,787 legal and natural persons who are placed in the category of small and medium-sized enterprises. The total number of active small and medium-sized enterprises participated in 2011 is 99.84%. The share of employees in small and medium-sized enterprises amounted to 60.85% in relation to the employees of the Czech economy.
According to [8] the small and medium-sized businesses will create and offer new and quality jobs. According to [10] management of small and medium- sized enterprise has many specifics. In small companies due to the small number of employees and managers many functions are accumulated within the competence of only a few workers predominates, informal leadership is more common, oral communication is preferred than written, etc. The risk of the company measured by the volatility of returns is also related with the size of the company [5]. According to [12] however, a high degree of flexibility to adapt rapidly to changing SME factors, it determines the face and reduce the growing globalization tendencies associated with the onset of multinational corporations and chains. But the principle of important role of strategic management comes here in the force too [8]. Strategic management, based on long-
Strategic management of small and medium-sized enterprises. DARJA HOLÁTOVÁ
term forecasts, helps the company to anticipate future challenges and opportunities [3]. According [10] strategic management gives clear goals and directions for the future of the company and its workers a sense of security. Strategic management helps to increase the quality of management, leads managers to improve their deciding. Reference [3] further states that strategic management helps improve communication in the company, project coordination, staff motivation and improve resource allocation. The strategy is the basic tool to reach advantages in the market [12]. By [7] the strategic management should be flexible to changed conditions in the market. By [2] the management should have the strategic plan and strategy.
Companies around the world are trying to improve their performance and optimize resource utilization, pay attention to cost control and efficiency of economic and business processes. Performance measurement systems are tools commonly used in the management and decisionmaking processes to assess the level of achievement of corporate goals, including different types of indicators. Thus accurate, consistent, complete and relevant data are required to support financial and strategic corporate decisions regardless of company size [15].
The management of enterprises of different size and specialization are today under the press of advantages, challenges and problems connected with the function of worldwide markets. The different meaning of the term of management can be related as follows: people who wish to have a career as a manager must study the discipline of management as a means toward practicing the process of management. The process consists of certain basic management functions [14]. Global competition carries with it an ever increasing set of demands by the customers. Better quality, more features, better delivery, performance and reduced costs – all become part of the expectation for our customers [14]. Strategic management is that set of managerial decisions and actions that determines the long run performance of a corporation [16]. Strategy can be viewed as building defenses against the competitive forces or as finding a position in an industry where the forces are weaker. Changes in the strength of the forces signal changes in the competitive landscape critical to ongoing strategy formulation. In exploring the implications of the five forces framework [7].
Reference [1] gives two definitions of strategy, traditional and modern. Traditional definition approaches to understand the strategy of the company as a document in which there are long-term objectives of
the company, determined the process of operations and allocation the resources needed to meet these goals. The modern concept sees strategy as the company prepared for the future. The strategy includes the long-term objectives of the company, the process of strategic operations and deployment of enterprise resources needed to meet these goals so the strategies would be based on business needs, take into account the changes in its resources and capabilities, and at the same time adequately respond to changes in the environment of the company. The central concept of strategic management is a strategy that is closely linked to the objectives it tracks. According to [4] strategies express the basic idea of which way the company goals will be achieved. There is no one best way to manage say [16].
The storied British banker and financier Nathan Rothschild noted that great fortunes are made when cannonballs fall in the harbor, not when violins play in the ballroom. Rothschild understood that the more unpredictable the environment, the greater the opportunity if you have the leadership skills to capitalize on it say.
The article deals with the mapping of the fundamental characteristics of SMEs in terms of their strategic management.
2. Methods This article is provided as one of the outputs of the
research project "Process management and the possibility of its implementation in small and medium-sized enterprises" of Grant Agency of the University of South Bohemia GAJU 068/2010/S and serves as one of the sources for grant GAJU 039/2013/S.
In the research project were used secondary data (financial statements of SMEs who took part in the research) and primary data which were obtained primarily through quantitative methods questionnaire supplemented by qualitative method of in-depth interviews.
For the classification of small and medium-sized enterprises has been used a new definition of the European Union (European Commission: A new definition of SMEs 2006) in accordance with the Law No. 47/2002 Coll. as amended. This system has been adapted for the needs of the research, according to the following table number 1, where the group of small businesses was divided into two groups according to the
WSEAS TRANSACTIONS on BUSINESS and ECONOMICS Darja Holátová, Monika Brezinová, Libena Kantnerová
E-ISSN: 2224-2899 66 Volume 12, 2015
number of employees in order to achieve detailed breakdown.
Table. 1 Classification of SMEs
Enterprise size Number of employees
Number of employees (Annual Work Unit)
Annual turnover Annual balance sheet
Medium enterprise 50 – 249 < 50 mil. € < 50 mil. € Small enterprise 25 – 49 < 10 mil. € < 10 mil. €
In the South Bohemian region was registered in 2011 68,826 economic entities from the selected category. Enterprises with up to 9 employees (micro-enterprises) represent 18% of the total number. Small enterprises represent less than 4% of all the small and medium-sized enterprises in the region. There are registered 78% of medium-sized enterprises within the region (Statistical bulletin- South Bohemian region, 2011). According to the legal form of business in the basic aggregate there dominate private entrepreneurs (77%), after that companies (9%), associations (5%), corporations of proprietors and cooperatives (3%), foreign persons (2.5%) and others (European Commission). Key figures on European business with a special feature on SMEs 2011.The prevailing business activities according to the classification of economic activities CZ-NACE in the examined aggregate constitutes wholesale and retail (22%). Building industry and industry are represented within the research identically with 13%, within the region there are about 21,000 or 19,000 as the case may be and so they occupy the second and third position from the point of view of CZ-NACE. Business activities according to CZ-NACE such as section A - agriculture, forestry and fishing, section B - mining and extraction and section I – accommodation, catering and restaurants, were eliminated from the research because of their different perception and management of company processes – these are completely specific groups. There was chosen a research sample from the base aggregate with the method of improbability of random choice by reason of difficult conditions of data collection.
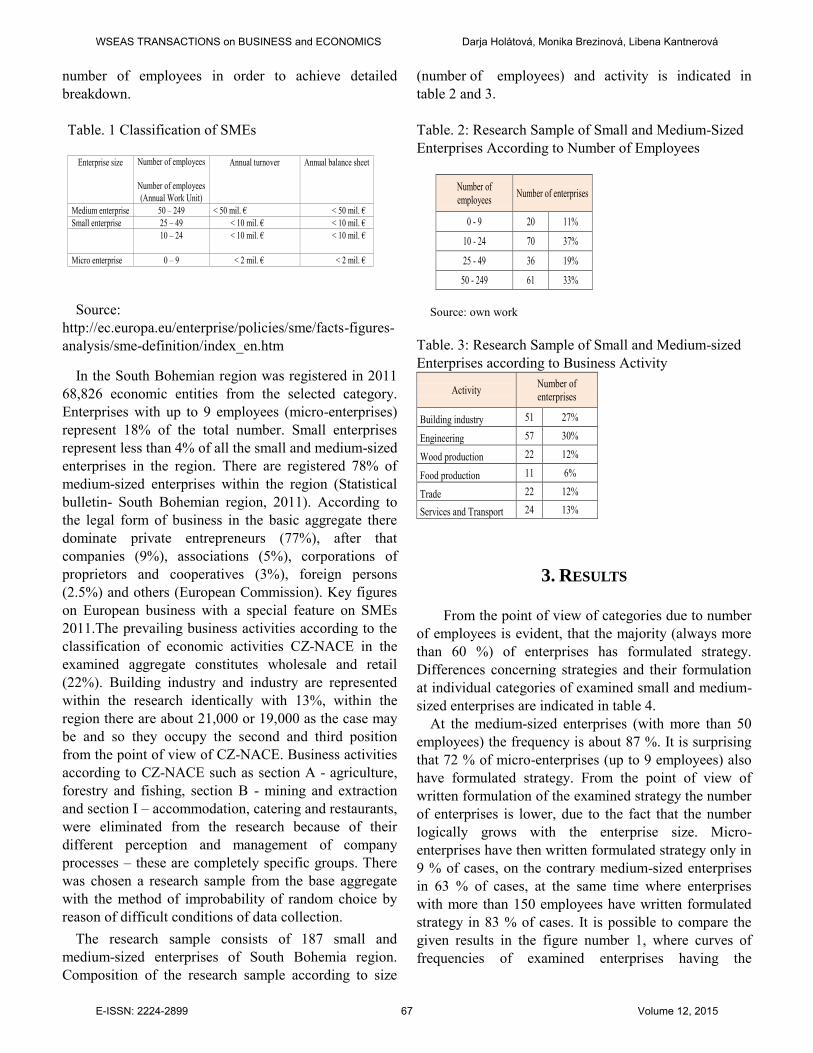
The research sample consists of 187 small and medium-sized enterprises of South Bohemia region. Composition of the research sample according to size
(number of employees) and activity is indicated in table 2 and 3.
Table. 2: Research Sample of Small and Medium-Sized Enterprises According to Number of Employees
Number of employees Number of enterprises
0 - 9 20 11%
10 - 24 70 37%
25 - 49 36 19%
50 - 249 61 33%
Source: own work
Table. 3: Research Sample of Small and Medium-sized Enterprises according to Business Activity
Activity Number of enterprises
Building industry 51 27%
Engineering 57 30%
Wood production 22 12%
Food production 11 6%
Trade 22 12%
Services and Transport 24 13%
3. RESULTS
From the point of view of categories due to number
of employees is evident, that the majority (always more than 60 %) of enterprises has formulated strategy. Differences concerning strategies and their formulation at individual categories of examined small and medium-sized enterprises are indicated in table 4.
At the medium-sized enterprises (with more than 50 employees) the frequency is about 87 %. It is surprising that 72 % of micro-enterprises (up to 9 employees) also have formulated strategy. From the point of view of written formulation of the examined strategy the number of enterprises is lower, due to the fact that the number logically grows with the enterprise size. Micro-enterprises have then written formulated strategy only in 9 % of cases, on the contrary medium-sized enterprises in 63 % of cases, at the same time where enterprises with more than 150 employees have written formulated strategy in 83 % of cases. It is possible to compare the given results in the figure number 1, where curves of frequencies of examined enterprises having the
WSEAS TRANSACTIONS on BUSINESS and ECONOMICS Darja Holátová, Monika Brezinová, Libena Kantnerová
E-ISSN: 2224-2899 67 Volume 12, 2015
formulated strategy, and of enterprises having the strategy formulated in the written form, are obvious.
Table 4: Frequencies of Formulated Strategies of Examined Small and Medium-sized Enterprises according to the Number of Employee
Number of employees Number of enterprises
Formulated strategy Written formulated strategy yes no yes no
Fig. 1: Curves of Frequencies of Examined Small and Medium-sized Enterprises Having Formulated Strategy According to the Number of Employees, source: own work
The formulation of strategy from the point of view
of categories due to business activity is shown in the table 5. It is similarly for all enterprises, that always minimally 60 % of them have formulated strategy. Most of the enterprises with formulated strategy are in the service sector (81 %), and also with the written strategy (59 %). The enterprises in the sphere of commerce show a little bit lesser frequency, when 76 % of them have formulated strategy and 44 % strategy in written form. Generally enterprises in the field of production show the frequency about 74 % in relation to the formulated strategy and 40 % in relation to the written formulated strategy.
Strategies are most often created by enterprises which are concentrated on engineering production (81%,
49% written strategies). On the other side only 57% of enterprises which are focused on wooden production create strategies and only 14% of them have got a written version. Also the construction enterprises focus on strategies less - only 63% of same line just with different values.
Table.5: Frequency of Examined SMEs with a Strategy according to Business Area
Business area Number of companies
Prepared strategy Written version yes no yes no
Construction 51 63% 37% 39% 61% Engineering production 57 81% 19% 49% 51% Wooden production 22 57% 43% 14% 86% Food production 11 75% 25% 37% 63% Trade 22 76% 24% 44% 56% Services and Transport 24 81% 19% 59% 41%
Source: own work
Fig. 2: Curves of Frequency of Examined SMEs with a Strategy according to Business Area, source: own work
Out of 187 examined enterprises 31% of them didn't
indicate their strategy type. The rest of the examined SMEs are focused on strategy of survival. Four categories were determined:
1) "Quality" (41% of examined enterprises) - enterprises focus on quality in all aspects of business, on business ethics, they aim to have a good name, they are oriented on customers and make all the effort to satisfy them, these enterprises are working towards higher flexibility and reliability in everyday praxis and also try to make their employees satisfied
WSEAS TRANSACTIONS on BUSINESS and ECONOMICS Darja Holátová, Monika Brezinová, Libena Kantnerová
E-ISSN: 2224-2899 68 Volume 12, 2015
2) "Stability" (16% of examined enterprises) - enterprises focus on stability within the market but also stabilization of its internal environment, for example keeping the same number of employees
3) "Development" (8% of examined enterprises) - enterprises focus on development of the enterprise in many areas - extension of production or provided services, market share and innovations
4) "Profit" (4% of examined enterprises) - enterprises focus on a long-standing growth of profit, this includes the growth of revenues and also decrease of costs.
Table 6 and figure 3 shows the differences between strategies of SMEs from different categories. It can be seen that the strategies structure of examined enterprises is similar, similarity can also be seen in terms of order of relative frequencies. Categories differ in terms of followed strategies. Dominant strategy is "Quality" followed by 30% of small enterprises (less than 50 employees), on the other side more than half (58%) of enterprises with more than 50 employees follow this strategy. Second most common strategy is "Stability" - around 20% of enterprises choose this strategy to reach their goals. "Development" strategy is followed by 10% of enterprises, but enterprises with more than 150 employees don't implement this strategy at all. Last strategy "Profit" is followed by 5% of enterprises.
Table 6: Frequency of Followed Strategies in examined SMEs according to the Number of Employees
Number
of
employees
Number
of
companies
Not
specified Quality Stabilization Development Profit
Fig. 3: Frequency of followed Strategies in examined SMEs according to the Number of Employees, source: own work
Table 7 and figure 4 highlight a similar analysis of SMEs presenting the results according to a business activity. The structure of implemented strategies is similar as above where the categories were created according to the number of employees, but some differences can be seen in order of relative frequencies. Enterprises working in construction usually follow "Quality" and "Stability" strategies, 9% of enterprises follow "Profit" strategy and only 7% follow "Development". “Quality“ was the most followed strategy by manufacturing enterprises, even more dominantly as it was chosen by 40% businesses as the device to reach their goals. 17% manufacturing enterprises in total follow “Stabilization“ strategy, roughly half less of them follow strategy focused on “development“, and just 2% of companies follow strategy of “Profit“.
Engineering production companies follow dominantly strategy of “Quality“, wood and food production companies follow strategy of “Stabilization similarly”. Most trading companies (Trade, 52%) follow strategy of “Quality“, 20% of companies are focused on strategy of “Stabilization“, just 4% strive for fulfillment of “Development“. No trading company set profit strategy as its goal. Service companies follow mostly quality strategy (57%), the second most frequent strategy was “Development”. Just few service companies follow “Profit“(5%) or “Stabilization“(3%) strategy.
Table.7: Frequency of SME observed Strategies according to the Business Activity
WSEAS TRANSACTIONS on BUSINESS and ECONOMICS Darja Holátová, Monika Brezinová, Libena Kantnerová
E-ISSN: 2224-2899 69 Volume 12, 2015
Business
activity Frequency
Not
specified Quality Stabilization Development Profit
Construction 51 38% 24% 23% 7% 8%
Engineering 57 36% 41% 10% 11% 2% Wood
production 22 19% 38% 33% 5% 5%
Food
production 11 37% 38% 25% 0% 0%
Trade 22 24% 52% 20% 4% 0%
Source: own work
Fig. 4: Frequency of SME observed Strategies according to the Business Activity, source: own work
Causal effects of strategy choice among observed small and medium enterprises according to the number of employee’s category and the type of business activity were tested using statistical method of Kruskal-Wallis test. First, relation between strategy choice and number of employees was tested. Based on analyzed data we were able to confirm with 95% probability the null hypothesis that says there is no relation between tested variables (H = 6,675946; df = 4; p-value = 0,1540).
Further, relation between strategy choice and category of business activity was tested. Based on analyzed data we were able to reject with 95% probability the null hypothesis in favor of the alternative hypothesis that says there is relation between examined variables (H = 7,849167; df = 3; p-value = 0,0492). This relation was tested using correlation coefficient r. Interdependence of strategy choice and particular business activity is evident in table 8 and graphically in figure 5. The strongest correlation (80%) was detected by strategy choice of product engineering and trading companies. Strong correlation (74%) was also found by determining strategy of building companies and wood
processing companies. 68% correlation is visible by strategy choice of wood processing and service (transport included) companies. Last significant correlation, higher than 50%, were discovered by wood processing and trading companies; building and service companies (transport included). On the other hand no correlation was detected by determining strategy of production engineering and trading companies, food industry and trading companies.
Table 8: Correlation Coefficient of MSE Strategy according to the Business Activity
Building Industry
Production Engineering
Wood Processing Industry
Food Industry Commerce Service and Transport
Building Industry 0,438736 0,741967 -0,102815 0,808746 0,518120 Production Engineering 0,438736 0,294688 0,022168 0,000000 0,319173 Wood Processing Industry 0,741967 0,294688 -0,146748 0,543214 0,683588
Service and Transport 0,518120 0,319173 0,683588 0,345930 0,147087
Source: own work
Fig. 5: Correlation Coefficient of MSE Strategy according to the Business Activity, source: own work
Dedouchová [1] presented that majority of the small
and medium sized companies has formally /as written document/ or not formally determined strategy. Presented research brought short term goals and brought also the similar results. Strategy has the goal to push forward the company towards to achieve short term goals and finally to achieve its basic purpose. The goals of the small and medium sized companies are often based on personal goals and preferences of the owners. Determined goals in such a way are logically very subjective, they are often not chosen correctly in comparison with the milieu where the companies create
WSEAS TRANSACTIONS on BUSINESS and ECONOMICS Darja Holátová, Monika Brezinová, Libena Kantnerová
E-ISSN: 2224-2899 70 Volume 12, 2015
activities. The goal of the company should always correspond with the chosen mission and should put into respect strong and weak aspects of undertaking, opportunities and distress, which the company can use or must face them. In general the goal of the company should answer the basic questions of undertaking and present requested result. According to Minárová and Malá [13] target of any company consists from different aims, which management wants to reach and which should be guaranteed by performance of different activities. These targets should be ambitious, easy to accomplish, quantifiable.
In the research sample of the small and medium sized companies in the frame of research there were identified 6 categories of the company goals. The category “Quality” was dominant. The companies presented for their goal both satisfaction of the customers (also employees) increasing the quality, good name of the company and flexibility. Following most often presented goal was “Development”, the development of the whole company and separate development of the partial parts too. Innovation was also presented as the main goal in this category. Category “Stability” has also very strong representation, the companies presented the whole stability at the market and also stability of prices. In this category the companies also mentioned keeping the number of employees. Another goal is connected with this matter and it is covering the market and Survival, which was followed in minimum cases. Concerning studying small and medium sized companies the goal Profit was, of course, dominant one.
In the table 9 and figure 6 numerousness of searching of the goals of some small and medium sized companies according to the number of employees is presented. Following characteristics can be seen from these results. Concerning micro companies the goals are concentrated on “Quality” (64 percent), further “Development” (50), and “Stability” (41) on the contrary no company follows the goal “Survival”. The small companies to 24 employees follow the goal Stability in 57 percent cases. In the small companies with more than 25 employees the main goals were “Quality”, “Development” and “Stability” (55 percent). These companies (the same as micro companies) do not follow the goal “Survival”, in comparison with the small companies to 24 employees, that follow this goal, but only in 4 percent. The medium sized companies follow in a dominant way the goal “Profit” (55 percent), the second most often followed category is “Development” (46). 43 percent medium sized companies follow the
goal “Stability” and 34 percent the goal “Quality”. Minimum medium sized companies follow the goal “Survival” and “Covering” the market.
Table 9: Numerousness of the studying Goals of searched MSP according to the Number of Employees
Fig. 6: Numerousness of the studying Goals searching MSP according to the Number Employees, source: own work
Table 10 and graph 7 show numerousness concerning diversity according to the activity of the studying small and medium sized companies.6 categories of goals were analysed here. Category Quality is dominant in the business companies (72 percent).Also less than 50 percent companies follow this goal in engineering production, on the contrary, food companies follow this goal minimum /18/,this group follows mainly category Stability in 73 percent cases. Companies in construction and wood working ones follow the goal very strongly .Business companies follow this goal very rarely Following the goal in the category of Covering the market was minimum in all studying activities of research of small and medium sized companies. Companies working in services
WSEAS TRANSACTIONS on BUSINESS and ECONOMICS Darja Holátová, Monika Brezinová, Libena Kantnerová
E-ISSN: 2224-2899 71 Volume 12, 2015
including transport follow this goal in 15 percent and companies in engineering production follow this goal least of all in 4 percent. The goal Survival is minimum followed, food companies and business companies do not follow this goal at all. The rest of the companies shows only in 5 -7 percent. In total 60 percent small and medium sized companies in engineering production follow the goal Development, 48 percent in services including transport and 38 percent wood working companies. Construction companies follow this goal minimum (27).The goal Profit is strongly dominant for no category of the companies. This goal is followed by 55 percent construction companies, 43 percent woodworking companies, 42 percent companies in services. Food companies follow this goal only in 18 percent.
Table 10: Numerousness of the Goals examined MPS according to the activities.
Activity Number of companies
Goals
Quality Covering of market Survival Development Stability Profit
Construction 50 40% 7% 7% 27% 62% 55%
Engineering 57 49% 4% 7% 60% 38% 36%
Woodworking 22 29% 5% 5% 38% 71% 43%
Food 11 18% 9% 0% 36% 73% 18%
Trade 21 72% 12% 0% 36% 28% 36% Service and Transport 23 36% 15% 3% 48% 42% 42%
Source: own work
Fig. 7: Numerousness of studying Goals examined MPS according to the activities, source: own work As it was mentioned above, the goal of the company
should set off the basic mission of the company with the respect to the weak and strong side. These matters were also analyzed in the examined small and medium sized companies and are presented in the figures 8 and 9. It
can be seen that the companies consider very strong sides resp. Competitive advantage “Range” (38 percent), and “Quality of work” (36). 22 percent companies consider very strong page “Flexibility” and 16 percent numerousness “Know-how”. The remained strong pages that were presented by the small and medium sized companies were not more than 10 percent. There was, for example, personal approach, good name of the company, quality of employees, reliability etc.
Fig. 8: Numerousness of strong Sides (competitive Advantages) examined MSP, source: own work Most often presented weak side resp. threat was
insolvency of the customer-40 per cent examined small and medium sized companies. In total 25 percent companies presented decline of sale, less than policy of the state, growth of costs, and 18 percent companies presented competition. About 10 percent companies presented decline of demand, lack of qualified workers, economic crisis, but also low innovation or poor knowledge of languages of employees.
Fig. 9: Numerousness of weak Side (threats) of
examined MSP, source: own work
4. CONCLUSION
WSEAS TRANSACTIONS on BUSINESS and ECONOMICS Darja Holátová, Monika Brezinová, Libena Kantnerová
E-ISSN: 2224-2899 72 Volume 12, 2015
Majority of examined small and medium enterprises had formulated strategy, however, mostly just enterprises with more than 25 employees has also a written version. From business activity point of view is distinctly lower frequency of formulated strategy by wood processing companies, strategy is formulated and put down in words most often by trading and service (transport included) enterprises. Based on tested data the most frequent followed strategy is quality and stabilization, regardless of employees number category or business activity.
In the case, the company has determined goal, it is aimed mainly at stability, further at quality, development and profit. Small companies follow more quality and development, but medium sized companies follow mainly development and profit. Examined small and medium sized companies consider their strong pages mainly range and quality of work and on the contrary as threat insolvency.
REFERENCES
[1] Dedouchová, M. (2001). Strategie podniku. Praha: C.H. Beck.
[2] Charvát, J. (2006). Firemní strategie v praxi. Praha : C. H. Beck.
[3] Keřkovský, M. ,Vykypěl O. (2006). Strategické
řízení: teorie pro praxi. Praha: H. Beck. [4] Kotler, P., Keller K.L. (2012). Marketing
management. New Jersey: Prentice Hall. [5] Krechovská, M., Taušl Procházková P. (2014).
Sustainability and its integration into Corporate
Governance Focusing on Corporate Performance
Management and Reporting. In Procedia Engineering. Amsterdam\. Elsevier.
[6] Mallya, T.: Základy strategického řízení a
rozhodování. Praha: Grada. [7] Porter M. E. (2008). The Five Competitive Forces
That Shape Strategy. Harward Business Revue. [8] Řehoř, P. (2007). Analysis of the labour market due
to the achieved level of entrepreneurial activities in
the regions of the Czech Republic. Conference: 5th Scientific International Conference on Hradec Economical Days 2007, Location: Hradec Kralove, the Czech Republic. Date: FEB 06-07.
[9] Savov, R., Lančarič, D., Paška, D. (2008). Strategický manadžment kvality v podmienkach
agropodnikatelských subjektov na Slovensku, Nitra: SPU.
[10] Sedláčková, H., Buchta, K. (2006). Strategická
analýza. Praha: C. H. Beck.
[11] Srpová, J., Řehoř, P. (2010). Základy podnikání :
teoretické poznatky, příklady a zkušenosti českých
podnikatelů. Praha: Grada. [12] Kolektív autorov (2012). Manadžment malých a
stredných podnikov. Nitra: Gramond. [13] Minárová, M., Malá, D. (2011). Strategický
manadžment. Banská Bystrica : Univerzita Mateja Bela, Ekonomická fakulta v Banskej Bystrici.
[14] Ivancevich J.M., Donelly J. H., Gibon J.L. (1989). Management – Priniciples and Function. Library of Congres Cataloging Publication Data.
[15] Tóth, M., Lančarič, D., Piterková, A., Savov, R., Rábek, T. (2014). Measuring systematic risk of
unquoted agricultural farms. In Review of agricultural and applied economics. Nitra. 2014. Vol. 17, no. 1, p. 31-34., doi: 10.15414/raae.2014.17.01.31-34
[16] Vollmann, T.E., Berry W.L., Whybark D.C. (1988). Manufactoring Planning and Control
Systems Illinois: Irwin. [17] Wheelen T.L., Hunger J.D. (2008). Strategic
Management and Business Policy. New Jersey: Upper Saddle River.
[18] Fisher III, William W., Oberholzer-Gee, Felix (2013). Strategic management of intellectual
property. Available at: http://web.ebscohost.com/ehost/pdfviewer/pdfviewer?vid=3&sid=089eb7c9-fcea-4f4c-8dc9-2f3ac8b9e8e7%40sessionmgr114&hid=120. Accessed 25 October 2014.
[19] Paul J. H., Krupp, S., Howland, S.: Strategic
Leadership: Essential Skills. Available at: http://web.ebscohost.com/ehost/pdfviewer/pdfviewer?vid=5&sid=089eb7c9-fcea-4f4c-8dc9-2f3ac8b9e8e7%40sessionmgr114&hid=120. Accessed 25 October 2014.
WSEAS TRANSACTIONS on BUSINESS and ECONOMICS Darja Holátová, Monika Brezinová, Libena Kantnerová