1 STRATEGIC PERSPECTIVES FOR EUROPEAN SOLAR PV MANUFACTURING — 2021 EUROPEAN SOLAR MANUFACTURING - EUROPEAN PV RENAISSANCE The European Solar Manufacturing Council (ESMC) is the organisation representing the interests of the European PV manufacturing industry. The Council relies on key industrial companies, organisations and research centers active in the PV sector rooted in Europe. ESMC aims at promoting and supporting the PV manufacturing industry and its value chain at the European level, speaking with one voice. Contact: Dr. Johan Lindahl ESMC’s Secretary General ad Interim [email protected]www.esmc.solar Address: Energy Hub – 146 Rue Royale – 1000 Brussels, Belgium
Transcript
1
ST RAT EGIC PERSPECT I VES FOR EUROPEAN SOL AR PV MANUFACTUR ING — 2021
EUROPEAN SOLAR MANUFACTURING - EUROPEAN PV RENAISSANCE
The European Solar Manufacturing Council (ESMC) is the organisation representing the interests of the European PV manufacturing industry. The Council relies on key industrial companies, organisations and research centers active in the PV sector rooted in Europe. ESMC aims at promoting and supporting the PV manufacturing industry and its value chain at the European level, speaking with one voice.
Contact: Dr. Johan Lindahl
ESMC’s Secretary General ad Interim
[email protected] www.esmc.solar Address: Energy Hub – 146 Rue Royale – 1000 Brussels, Belgium
TABLE OF CONTENTS ............................................................................................................................................................. 1
conventional technologies or by guaranteeing ethic working conditions for all involved workers, while
staying cost-competitive at system level, supplying the local market, but also others.
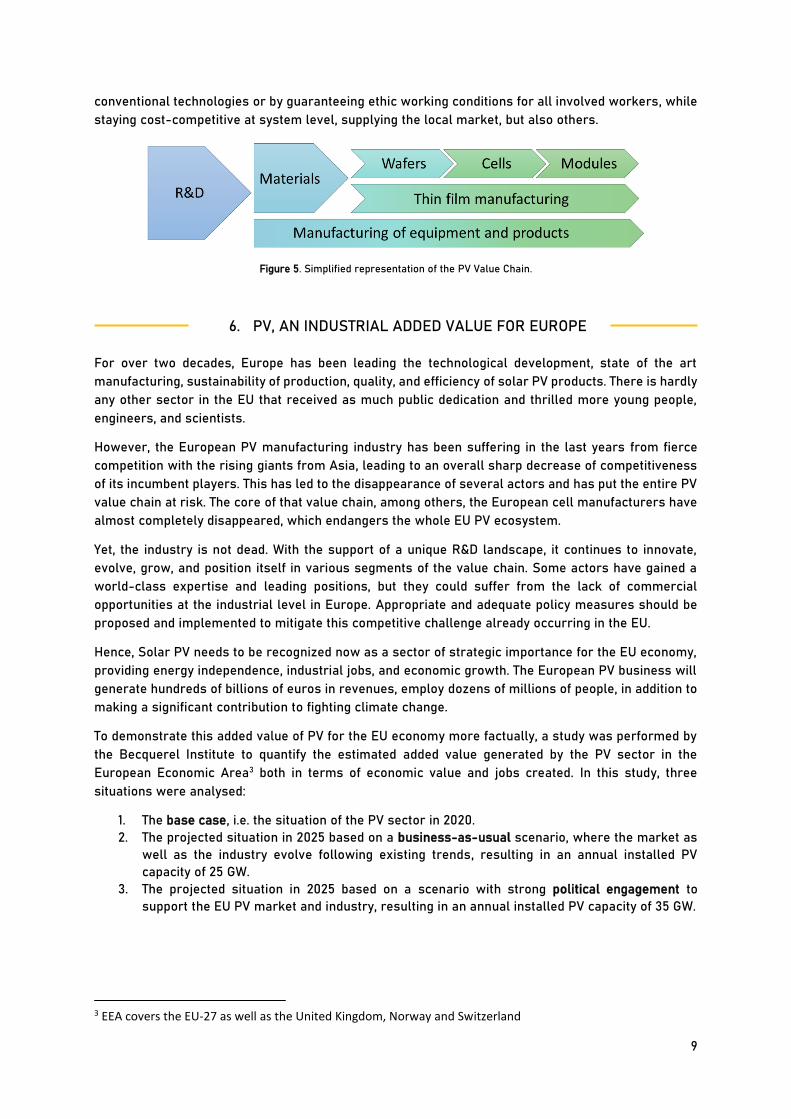
Figure 5. Simplified representation of the PV Value Chain.
6. PV, AN INDUSTRIAL ADDED VALUE FOR EUROPE
For over two decades, Europe has been leading the technological development, state of the art
manufacturing, sustainability of production, quality, and efficiency of solar PV products. There is hardly
any other sector in the EU that received as much public dedication and thrilled more young people,
engineers, and scientists.
However, the European PV manufacturing industry has been suffering in the last years from fierce
competition with the rising giants from Asia, leading to an overall sharp decrease of competitiveness
of its incumbent players. This has led to the disappearance of several actors and has put the entire PV
value chain at risk. The core of that value chain, among others, the European cell manufacturers have
almost completely disappeared, which endangers the whole EU PV ecosystem.
Yet, the industry is not dead. With the support of a unique R&D landscape, it continues to innovate,
evolve, grow, and position itself in various segments of the value chain. Some actors have gained a
world-class expertise and leading positions, but they could suffer from the lack of commercial
opportunities at the industrial level in Europe. Appropriate and adequate policy measures should be
proposed and implemented to mitigate this competitive challenge already occurring in the EU.
Hence, Solar PV needs to be recognized now as a sector of strategic importance for the EU economy,
providing energy independence, industrial jobs, and economic growth. The European PV business will
generate hundreds of billions of euros in revenues, employ dozens of millions of people, in addition to
making a significant contribution to fighting climate change.
To demonstrate this added value of PV for the EU economy more factually, a study was performed by
the Becquerel Institute to quantify the estimated added value generated by the PV sector in the
European Economic Area3 both in terms of economic value and jobs created. In this study, three
situations were analysed:
1. The base case, i.e. the situation of the PV sector in 2020.
2. The projected situation in 2025 based on a business-as-usual scenario, where the market as
well as the industry evolve following existing trends, resulting in an annual installed PV
capacity of 25 GW.
3. The projected situation in 2025 based on a scenario with strong political engagement to
support the EU PV market and industry, resulting in an annual installed PV capacity of 35 GW.
3 EEA covers the EU-27 as well as the United Kingdom, Norway and Switzerland
10
The annual PV market in the base case and projected situations are shown in Fel! Hittar inte
referenskälla..
ECONOMIC VALUE CREATED AND CAPTURED IN EUROPE
Based on the annual European PV market (base case and projected), the economic value created by
PV installations was calculated for 2020 and 2025 considering average costs per watt-peak (Wp)
(current and projected) of all items of the cost structure of PV systems (such as the cost of
components, labour costs, planning and development costs, etc.). This allowed to evaluate both the
value created through the downstream activities (i.e. the installation as well as the operation and
maintenance of the system) and the value created through the upstream activities (the manufacturing
of the components of the system).
Moreover, this analysis was conducted considering the relative shares of the different segments and
sub-segments of the total PV market (centralised vs distributed; residential, commercial, industrial;
ground-mounted, floating, etc.). This is an important step, as these different types of installation are
associated with different level of costs.
Additionally, the share of the economic value created by the installed PV capacity in Europe that is
captured locally was estimated for all cost items. It was assumed that 100% of downstream value items
are captured locally, i.e. within the EU, while the share of upstream value items (i.e. materials and
components of the system) captured locally was quantified using as a proxy the estimated capacity
produced in the EU.
Assumptions were made for all 3 situations (2020, 2025 “BAU”, 2025 “Political Engagement”). For the
2025 “Political Engagement” scenario, an average 75% share of the PV capacity installed in the EU was
considered to be based on modules produced in the EU (16% in the “Business as Usual” scenario),
supposedly achieved thanks to the political support provided to the PV industry. Regarding the rest of
the components, it is assumed in the 2025 “Political Engagement” scenario that 66% of the balance of
system is manufactured in the EU, while this percentage only stands at 50% in the 2025 “Business-as-
usual” scenario.
Thus, the results in Figure 7 show the total economic value created thanks to the PV capacity installed
in Europe. This total value is split between the value captured locally in the EU and the “missed” value,
that is the economic value generated outside of the EU by the PV installations performed in the EU.
19
25
35
2020 2025Business as Usual
2025Political Engagement
Annual Market [GW]
Figure 6. Base case and projected annual market in the European Economic Area.
11
The graph shows the increase of the total economic value created annually between 2020 and 2025,
and a higher increase of this value in the “Political Engagement” scenario compared to “Business-as-
usual”. This higher increase is linked to the augmented annual PV market favoured by appropriate
policies. In addition, the graph also highlights the missed value that can be regained from relocating
upstream industrial activities in the EU. In total, around 10 billion euros are additionally captured in the
EU in a single year through the “Political Engagement” scenario in 2025, compared to the “Business-
as-usual” scenario, i.e. a 75% increase of the captured value. At the same time, the missed economic
value is almost divided by a factor of two.
JOBS CREATED AND CAPTURED IN EUROPE
As for the created economic value, the number of jobs associated to the PV sector are estimated based
on two factors: the annual installed capacity and the share of this capacity produced locally. Specific
labour intensities are considered for the different parts of the value chain and regions. Again, for the
2025 “Political Engagement” scenario, an average 75% of the capacity installed in the EU is assumed to
be produced locally, supposedly achieved thanks to the political measures supporting the PV industry.
The results in Figure 8 show, on the left part of the figure, the number of total full-time jobs (i.e. direct
and indirect, downstream as well as upstream) that can be associated in Europe to PV installations on
an annual basis. It permits to quantify the impact of favouring a local production, through the
comparison of the 2025 “Political Engagement” scenario to the “Business-as-usual” scenario. Around
178 000 additional jobs would be created in Europe in case policies backing up the local PV value chain
would be enacted. Even more markedly, the right part of the figure specifically focuses on the upstream
sector, i.e. manufacturing and R&D, and shows an impressive 900% increase of the number of upstream
jobs in the 2025 “Political Engagement” scenario compared to the “Business as usual” scenario.
Figure 7. Yearly economic value of PV installations in the European Economic Area
11.5 13.0
22.7
6.86.1
3.7
2020 2025Business as Usual
2025Political Engagement
Annual Created Value [billion €]
Locally created and captured value
Locally created and missed value
12
Finally, it must be emphasized that the above results are estimated for quite conservative projections
of the PV annual installed capacity in 2025. The impact on the EU economy of relocating PV industry
within the Union will be tremendous when the PV market increased by the necessary 10-fold factor to
reach our climate goals. Furthermore, besides the numbers themselves, the qualitative aspects of the
created jobs need to be considered, as highly qualified industrial jobs will be created. One last element
to be noted is that this study only considers the EU PV market. Exportation of EU manufactured PV
products could increase the economic value generated in the EU thanks to solar PV even more.
Figure 8. Yearly occupied total (left) and upstream (right) jobs in the PV sector in the European Economic Area.
216 548 229 209
406 894
2020 2025Business as
Usual
2025Political
Engagement
Local total jobs [FTE]
8 240 9 938
99 914
2020 2025Business as
Usual
2025Political
Engagement
Local upstream jobs [FTE]
13
7. ESMC’S STRATEGY
Considering the presented context and elements, the European Solar Manufacturing Council (ESMC)
has defined a strategy and course of action to achieve the renaissance of the European PV sector.
This strategy focuses on making PV a central element of the energy transformation process in Europe,
through a sustainable yet ambitious development of PV installations, in combination with a dynamic
and competitive manufacturing industry covering the entire PV value chain on European soil.
To achieve these goals, the ESMC envisions a set of policies and regulations aiming at developing the
PV market and the massive redevelopment of all segments of the PV value chain in Europe. This
industry will feed the expected massive development of PV installations in Europe and globally.
GENERAL STRUCTURE OF ESMC ACTIVITIES
SUPPORT PV MANUFACTURING IN EUROPE THROUGH APPROPRIATE POLICIES
The central point of ESMC’s activities aims at supporting PV manufacturing in Europe along the whole
value chain. This could be achieved by using smart instruments depending on the market and policy
evolutions. A general set of industrial policies will be required: ESMC favours a systemic approach to
EU-based production for the current and future energy system. It aims at creating a level playing field
with foreign (especially Asian and American) competitors. To reach this objective, a set of policy
instruments will be required:
1. PV in the post-Covid-19 environment: PV is a key enabling technology within the European
Green Deal and Recovery Packages, and a key pillar of the future European energy system
that will be based on renewable energy. Transfers from already existing R&D&I or
development framework is essential. PV must be advertised as a clear and powerful solution
to fight the economic downturn and mitigate climate change effects. In that respect, the
existing and new stimulus packages must comprise dedicated lines for PV development,
including manufacturing. As several countries have shown, the support for the energy
transformation depends on the public acceptance of the measures and developments. PV does
not escape this reality and well-paid jobs are part of the winning solution to public acceptance
of the energy transformation. This comprises installations, but also industrial- and R&D&I jobs.
2. Protect and expand strategically important value-chains locally: the COVID-19 crisis illustrates
the difficulties in several European countries to produce ad hoc equipment at a reasonable
price, when traditional global trade options are under heavy pressure. Medical systems are
only one of many value chains that must be preserved and reinforced in Europe in the coming
years. Energy, food, and military security are examples of fields of activity where such a
regional and local focus is crucial, while maintaining an open economy. One cannot
systematically rely on imports for key parts of the PV technology, as has been stated for a long
time by the European PV industry. As PV’s share of the electricity mix is increasing and PV is
becoming one of the most economic energy sources, it is of strategic importance to have the
EU regional and local PV value chain. One key element would consist of a fair tax system,
which would not disadvantage local actors.
3. Support technological evolution by setting up dedicated schemes to ease the depreciation, re-
usability and reconditioning of fast-changing equipment technologies.
14
4. Sustainability policies such as eco-design, green public procurement, ecolabel and energy
label, or “environmental (CO2 content including transportation, scarce and hazardous
materials etc.) and social footprint”: simple but honest and traceable regulation schemes must
be developed and applied to promote high environmental standards including carbon footprint.
In addition to sustainability, social and quality standards are core elements of manufacturing
in Europe. In this respect, the current work of the European Commission is an essential pillar
to be supported and incentivized.
5. Financing tools: Public (Local, regional, national, European) and private financing tools will
have to be fine-tuned to support local manufacturing. A special focus on the European
Investment Bank (EIB) activities and rules of engagement are needed, combined with a novel,
off-takers based approach, to de-risk the establishment of PV manufacturing. Credit
guarantees give access to low-interest bank credits with no cost for taxpayers for successful
enterprises. New investment schemes such as crowdfunding, crowdlending, Venture Capital,
business angels or pension funds could be favoured, depending on the business segment and
the technology novelty.
6. Export facilities: the EU PV market will be favoured by European manufacturers but should not
stop at the European borders. European PV systems will be attractive on the world market. In
addition to tuning existing export policies and networks, an internal expert network – by
invitation only or for members with special affiliation, should be formed. In addition, a database
of experts and structures (e.g. GIZ, SE4ALL) should contribute to support the industry with the
right tools.
SUPPORT PV MANUFACTURING IN EUROPE THROUGH APPROPRIATE MARKET
DEVELOPMENT
Market and industry developments can hardly be separated. A market development disconnected from
industrial development would result in a continuous insufficient acceptance from the public and
policymakers. As a result, market development should be developed in parallel and in symbiosis with
manufacturing options, to maximize European based added-value and the creation of high employment
possibilities.
Based on the following concepts, develop an appropriate solar PV market, as this technology is the
key electricity generation source of the 21st century:
1. Wide-spread distributed PV: self-consumption and energy communities, including novel
decentralized and collective self-consumption concepts and peer-to-peer trading should
expand further.
2. Competitive PV is there, shifting policies to accompany industrial PV development in Europe,
including tenders for utility-scale PV plants.
3. Integrated PV: A double concept: "PV everywhere" and “Dual Use-Territory (DUT)” including
integrated PV concepts such as:
a. BIPV: promoting BIPV in Europe and globally, including smart simplified BIPV regulations
and products will create a new market for PV development.
15
b. VIPV: PV in the automotive sector, accelerating the energy revolution though PV integrated
in EVs with local PV-loading facilities. The use of PV embedded in EVs or to charge EVs
with green electricity will contribute decarbonizing the automotive sector faster.
c. All other integrated PV concepts and dual-use ones such as FPV, APV, PV noise barriers,
PV above roads, PV above parking lots, etc.
4. Connecting Information technology to Smart Grids, digitalizing the energy systems including
potential use of innovative technology to allow a seamless integration of high renewable
energy shares in energy networks.
5. Solar Fuels: Green Hydrogen and similar clean synthetic fuels from solar PV will allow fully
decarbonizing the energy sector, and the industry, at the lowest cost. Low-cost and reliable
PV electricity is key to produce competitive green hydrogen!
ALLIANCE BUILDING
PV must be seriously considered and requires massive support from all industries and sectors that it
will significantly reshape in the coming years. ESMC proposes to build powerful alliances, which will
increase the added value of these sectors and drive the acceleration of their adaptation to the energy
transformation.
1. The energy sector at large: energy companies should realize the opportunities that PV offers,
both in the power and general energy sectors.
2. Building sector: In addition to retrofitting solar panels on rooftops, the building code should
require PV on all suitable roofs of new buildings. Renovations are another part of the markets
to explore for PV to massively develop in Europe, offering new opportunities and joining forces
with the heating and cooling sectors, smart buildings, and energy communities. BIPV is only
one of the multiple aspects of the inclusion of PV in the building sector.
3. Transport sector: VIPV can revolutionize transport, from automotive and motorbikes to
aviation and the maritime transport sector. But it offers other possibilities to include PV as a
part of its energy perspectives, e.g. via the integration of PV into the transport infrastructure
such as roads, rail stations, sound barriers, EV charging stations and compensation areas.
4. Heavy industries: PV has a key role to play in decarbonizing heavy energy industries such as
steel and concrete, through replacing carbon by green hydrogen, and by direct use of clean
electricity. PV in sun-rich parts of Southern Europe will provide the lowest-cost Green
Hydrogen that will be needed in huge volumes.
5. Energy vectors and storage: this comprises the production and distribution of green hydrogen
and joined business models for PV, but not exclusively. There are both numerous and
promising connections with the transport and building sectors and an increasing use of
batteries and other storage systems in innovative business models will favour the PV
development. FPV on artificial lakes providing hydropower can double the power output of the
generators, by using PV power during daytime and hydropower in the night.
16
6. Telecommunications and ICT: while smart grid concepts emerge to allow integrating a higher
share of distributed variable renewables within the grids, the need for ad hoc communication
increases. This is also the case for tools to involve the existing ICT actors and to merge the
worlds of energy and communication. In addition, the rapidly growing power demand of
computing centers can be covered sustainably by local PV combined with battery storage.
SUPPORT R&D FOR PV WITHIN THE ENERGY TRANSFORMATION
There is no industrial success without R&D&I properly funded and linked to the manufacturing industry.
ESMC supports a massive plan for funding R&D towards new and innovative technologies and their
path to market development. This can include specific policies to favour pilot projects in the industry.
The key factors are as follows:
1. R&D activities focusing on cost reduction of PV, efficiency increase, reduced use of
unsustainable materials and scarce resources, eco-design of the products, re-usability, and
recycling of products.
2. A balanced focus on existing technologies and promising new ones.
3. The smart use of the new Horizon Europe program and other support scheme facilitation
4. Two-ways smart international cooperation
5. R&D Interaction with other new technologies such as green hydrogen generation,
ICT/digitalization, etc.
All the package of policies proposed, appropriate market developments supported, alliance building measures and R&D support instruments should combine one integrated, clearly structured and PV manufacturing industry renaissance oriented strategic vision and tactical actions to ensure the appropriate priorities, timely implementation and result-oriented targets for the PV development, deployment and PV manufacturing in the EU.