16
STRATEGIC PLAN: 20132016 Assessing ~ Convening ~ Funding Pamela M. Brown, Ph.D. Yevola Peters Executive Director Chair The Local Management Board for Anne Arundel County
STRATEGIC PLAN: 20132016
Assessing ~ Convening ~ Funding
Pamela M. Brown, Ph.D. Yevola Peters Executive Director Chair
The Local Management Board for Anne Arundel County

TABLE OF CONTENTS
Mission Statement, Vision Statement and Values ___________________________________1 Focus: 2013-2016 ______________________________________________________________2 Community Needs as Outlined in the 2012 Needs Assessment _________________________3 Results Based Accountability ____________________________________________________3 State of Maryland Child Well-Being Results _______________________________________3 Healthy Children ______________________________________________________________4
Indicators _________________________________________________________________4 The Story Behind The Trend __________________________________________________6 Partners ___________________________________________________________________6 What Works to “Turn the Curve” ______________________________________________6 Funding Sources ____________________________________________________________7
School Readiness ______________________________________________________________7 Indicator __________________________________________________________________7 The Story Behind The Trend __________________________________________________7 Partners ___________________________________________________________________8 What Works to “Turn the Curve” ______________________________________________8 Funding Source ____________________________________________________________8
School Success ________________________________________________________________9 Indicators _________________________________________________________________9 The Story Behind The Trend _________________________________________________10 Partners __________________________________________________________________10 What Works to “Turn the Curve” _____________________________________________11 Funding Source ___________________________________________________________11
Safety ______________________________________________________________________11 Indicators ________________________________________________________________11 The Story Behind The Trend _________________________________________________12 Partners __________________________________________________________________12 What Works to “Turn the Curve” _____________________________________________12 Funding Sources ___________________________________________________________13
Stability ____________________________________________________________________13 Indicator _________________________________________________________________13 The Story Behind The Trend _________________________________________________13 Partners __________________________________________________________________13 What Works to “Turn the Curve” _____________________________________________14 Funding Sources ___________________________________________________________14

1
Mission Statement The Mission of the Partnership is to provide leadership that creates opportunities for all children and their families in Anne Arundel County to achieve their full potential. Vision Statement The Partnership provides leadership to improve the quality of life for all children and their families in Anne Arundel County. Values Community-Based A full array of services and supports is provided in the home community in which the child lives. Family Partnerships Family members of children and youth who need services work together with service providers to develop, manage, deliver, and evaluate policies and programs. Families and youth have a voice in the decision making of the coordination of services, as well as the policies and procedures governing care for all children in their community. Interagency Collaboration Child- and family-serving agencies establish formal linkages to ensure that the system of care is adequately coordinated and integrated. Cultural & Linguistic Competence All services and supports are delivered in a way that is responsive to the family’s race, culture, language and/or ethnicity. Individualized Strength-Based Every child and family receives an individualized service plan tailored to their unique needs. Accountability Outcomes measures are developed and tracked for individual children, youth and families

2
Focus: 2013 -2016 The Partnership is focused on prevention programming that helps divert children and families from formal government systems. As the neutral convener among child serving agencies and county residents the Partnership: Assesses
• Poverty Amidst Plenty bi-annual community needs assessment • Alcohol and substance abuse surveys • Disproportionate Minority Contact initiative
Convenes
• Coalition for Safe Communities • Disproportionate Minority Contact Initiative • Youth Suicide Awareness Action Team • Community Resource Initiative/Care Team (CRICT) • Sustainable Communities Team • Phoenix Academy Community Stakeholders Group • Mental Health Round Table • Medically Homeless Team • Pathways to Opportunity Conference Programming Committee • Teens In Partnership group (TIP)
Funds Systems of Care: A no wrong door, one stop shop for information and referral, family navigation and multi-agency action planning including kinship care. 1-800 line, infoAnneArundel, EarnBenefits Youth diversion from Juvenile Services: Community Conferencing, CINS/FINS, afterschool programming Mental health/Substance abuse programming: Youth Service Bureaus, compliance checks, media, Teen Summit, Health Rocks

3
Community Needs as outlined by the 2012 Community Needs Assessment
Needs Community Mapping Policy Areas Afterschool programming Mentors Early childhood children’s Mental Health Substance abuse and alcohol prevention Basic needs (the economy) Diversion from juvenile services Better access to health services
North County: Glen Burnie Pasadena Brooklyn Park and Severn City of Annapolis is close second on 16 different indicators of need
Affordable Housing Quality childcare Transportation
Results Based Accountability As one of the 24 Local Management Boards in Maryland, the Partnership follows the Results Based Accountability model to plan programming and measure results. Results-Based Accountability (RBA) was developed by Mark Friedman of the Fiscal Policies Studies Institute in 1997. RBA is a simple, plain language approach to measurement that puts the focus on the ends and works backward to the means. RBA enables policymakers, funders, and program administrators to identify how well they are doing in achieving a particular quality of life result and where they might need to make changes. “If you keep doing what you are doing, you will keep getting what you are getting.” If the projected performance is not acceptable, the RBA methodology helps stakeholders identify what changes will be needed to “turn the curve,” that is, move the trend line in a positive direction. RBA asks “What are you doing? How well are you doing it? Is anyone better off” for each measurable program area. State of Maryland Child Well-Being Results The eight quality of life results that Local Management Boards and all child serving agencies are held accountable for were developed by the Children’s Cabinet and are referred to as the State of Maryland Child well- being results. They are all listed below. The five results prioritized by the Partnership are in bold and underlined: Babies Born Healthy Healthy Children School Readiness School Success School Completion School Transition Safety Stability

4
Healthy Children
Primary Indicators: Indicator 1: The number of childhood fatalities of children one (1) year of age or older.
2008 2009 2010 2011 2012
# of Childhood Fatalities 21 13 7 13 9 Sources: Maryland Child Death Report 2011and A.A. Co. Dept. of Health CFRT
Indicator 2: The percentage of public school students who report using alcohol, tobacco, or other drugs.
2008 2009 2010 2011 2012 2013
Cigarettes 3.0 0 15.0 6.0 No data 3.0 Alcohol 15.0 10.0 15.0 12.0 No data 6.0
Marijuana 1.0 2.0 19.0 6.0 No data 4.0 Source: Teen Summit Adolescent Drug and Alcohol Survey
NOTE: Beginning in 2011, this data is only collected every other year.
0
5
10
15
20
25
2008 2009 2010 2011 2012 2013 2014 2015
Number of Childhood Fatalities in A.A. Co. for Children ages 1‐17
Number of Childhood Fatalities Trend
0.0
5.0
10.0
15.0
20.0
2008 2009 2010 2011 2012 2013 2014 2015 2016
Percentage of 8th Grade Students Reporting Use in the Last 30 Days
Cigarettes Alcohol

5
2008 2009 2010 2011 2012 2013
Cigarettes 13.0 13.0 18.0 10.0 No data 9.0 Alcohol 43.0 23.0 30.0 30.0 No data 22.0
Marijuana 21.0 26.0 21.0 19.0 No data 14.0 Source: Teen Summit Adolescent Drug and Alcohol Survey
NOTE: Beginning in 2011, this data is only collected every other year.
2008 2009 2010 2011 2012 2013
Cigarettes 8.0 67.0 29.0 29.0 No data 14.0 Alcohol 25.0 50.0 43.0 14.0 No data 31.0
Marijuana 8.0 33.0 29.0 29.0 No data 20.0 Source: Teen Summit Adolescent Drug and Alcohol Survey
NOTE: Beginning in 2011, this data is only collected every other year.
0.0
10.0
20.0
30.0
40.0
50.0
2008 2009 2010 2011 2012 2013 2014 2015 2016
Percentage of 10th Grade Students Reporting Use in the Last 30 Days
Cigarettes Alcohol MarijuanaTrend (Cigarettes) Trend (Alcohol) Linear (Marijuana)
0.0
10.0
20.0
30.0
40.0
50.0
60.0
70.0
2008 2009 2010 2011 2012 2013 2014 2015 2016
Percentage of 12th Grade Students Reporting Use in the Last 30 Days
Cigarettes Alcohol MarijuanaTrend (Cigarettes) Trend (Alcohol) Trend (Marijuana)

6
The Story Behind the Trend The data indicates that, since 2000, there has been an overall decline in the use of alcohol, tobacco and/or other drugs. Yet, according to the 2012 Anne Arundel County Department of Public Health needs assessment, substance abuse was the fourth most frequently selected health issue with 63.6% of the informants ranking it among the top 5 key health issues. 18.2% of those informants ranked Substance Abuse/Alcohol Abuse as the most significant issue facing Anne Arundel County. Several informants emphasized that alcohol and drugs often lead to other health issues and co-occurring disorders. According to the Partnership’s 2102 needs assessment Alcohol continues to be the most frequently used substance at each grade level and there is a community ‘norm’ related to underage drinking. It is likely that the implementation of the Keep a Clear Mind drug education program in the Anne Arundel County schools has contributed to some of the decline in alcohol and substance abuse reported by the data. The collaborative efforts of the Communities Mobilizing for Change on Alcohol in working in conjunction with the Substance Abuse and Delinquency Prevention Coalition (funded by the LMB through a SAMHSA grant) have also influenced the decline in drug use, as well as the funding supplied to the West and North County substance abuse coalitions by the health department. Partners
• Anne Arundel County Public Health Department – behavioral health offers a variety of services
• Anne Arundel County Public schools – education components within the curriculum • Coalition for Safe Communities – drug abuse outreach and education • Centro D’Ayuda – Spanish Speaking Strengthening Families
What Works to “Turn the Curve” The Partnership has prioritized the following Evidence Based strategies.
Strengthening Families Keep a Clear Mind Communities Mobilizing for Change on Alcohol
Each strategy is focused specifically on alcohol and drug abuse among youth with excellent, tested outcomes. The strategies are well-known and accepted in the local public schools and communities. Strengthening Families has been implemented in public housing and at local church centers for several years. It is popular with participants. It is implemented through the Anne Arundel County Public Health Department. Their staff has operated the program for several years. The cost for each cycle of 14 weeks is $14,500. The strategy may be sustainable in the future through GOCCP and DHMH funding. Keep a Clear Mind and Communities Mobilizing for Change on Alcohol use are supported and implemented by the school system and are entwined with the strategic plan of the Coalition for Safe Communities which is funded by SAMHSA.
7
Funding Sources: SAMHSA Drug Free Communities Children’s Cabinet Interagency Fund (CCIF)
School Readiness
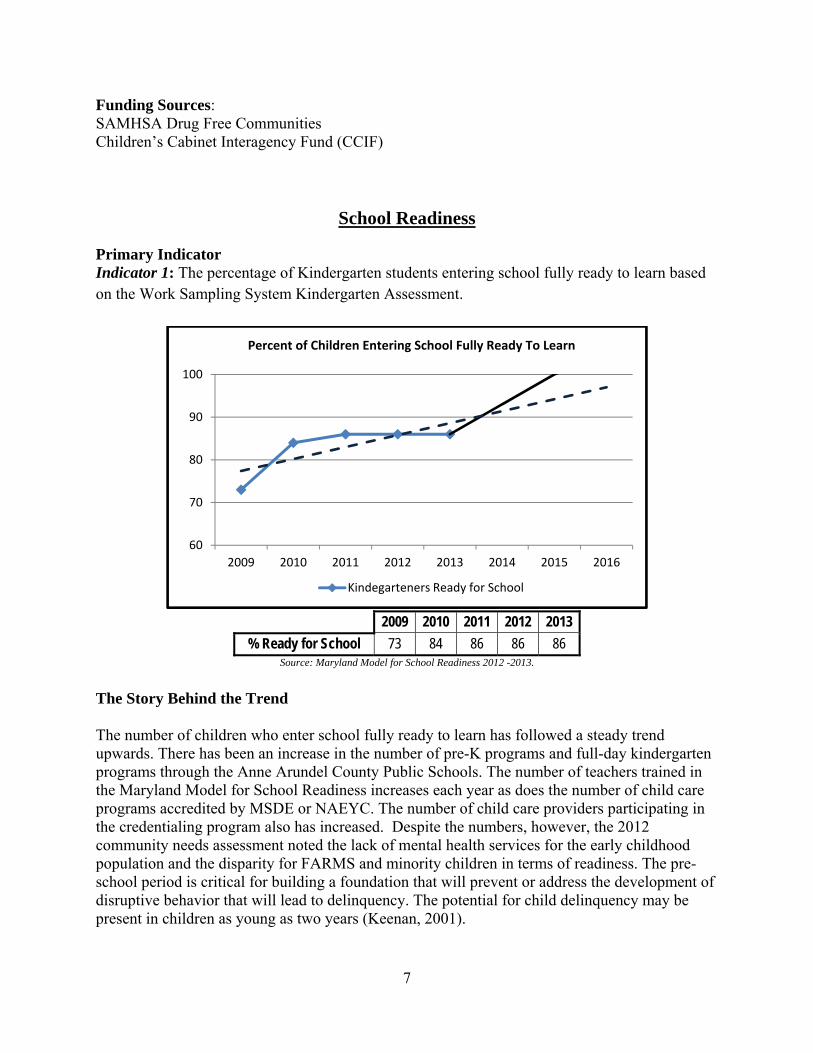
Primary Indicator Indicator 1: The percentage of Kindergarten students entering school fully ready to learn based on the Work Sampling System Kindergarten Assessment.
2009 2010 2011 2012 2013 % Ready for School 73 84 86 86 86
Source: Maryland Model for School Readiness 2012 -2013.
The Story Behind the Trend The number of children who enter school fully ready to learn has followed a steady trend upwards. There has been an increase in the number of pre-K programs and full-day kindergarten programs through the Anne Arundel County Public Schools. The number of teachers trained in the Maryland Model for School Readiness increases each year as does the number of child care programs accredited by MSDE or NAEYC. The number of child care providers participating in the credentialing program also has increased. Despite the numbers, however, the 2012 community needs assessment noted the lack of mental health services for the early childhood population and the disparity for FARMS and minority children in terms of readiness. The pre-school period is critical for building a foundation that will prevent or address the development of disruptive behavior that will lead to delinquency. The potential for child delinquency may be present in children as young as two years (Keenan, 2001).
60
70
80
90
100
2009 2010 2011 2012 2013 2014 2015 2016
Percent of Children Entering School Fully Ready To Learn
Kindegarteners Ready for School

8
Partners
• The Anne Arundel County Public School System (AACPS) operates pre-k and an exceptional Infants and Toddlers program.
• The Early Childhood Coalition has reformed and is focused on school readiness. The Partnership is an active member of the coalition
What Works to “Turn the Curve” The Behavioral and Emotional Supports and Training program (BEST), funded by Anne Arundel LMB since 2000 has also contributed to this increase, both in direct service, and in collaboration with the Infants and Toddlers program. Dr. Deborah Perry and M. Clare Dunne released the findings of a study of the BEST program indicating that the BEST program has demonstrated that the children served by the program are clearly benefiting from mental health consultation services. For the sub-group of children for whom complete data was available, nearly all of the children showed significant improvements in their behavior. The behavioral interventions not only reduced rates of problem behaviors but also increased young children’s social skills. The BEST program is considered by many to be a national model for working with young children with emotional and behavioral problems and autism. BEST is coordinated by the TEACH Institute of the Anne Arundel County Community College. Behavior Specialists and one Family Behavior Specialist provide behavioral and emotional support and training to parents and child care providers for children exhibiting challenging behaviors. Children’s mental health and behavioral issues, especially for infants and toddlers, are a continuing need in the county and are linked to later risk behaviors that increase the chances of delinquency. Funding Source: CCIF

9
School Success Primary Indicators Indicator 1: Percent of public school students in grades 3 through 8 performing at proficient or advanced levels in reading and mathematics.
2009 2010 2011 2012 2013
3rd Grade 89.5% No data 92.1% 93.1% 90.9% 5th Grade 87.4% No data 88.6% 91.4% 88.8% 8th Grade 74.5% No data 71.2% 74.4% 66.3%
Source: Maryland Report Card
2009 2010 2011 2012 2013
3rd Grade 89.4% No data 89.9% 90.4% 88.8% 5th Grade 93.6% No data 94.2% 93.9% 93.1% 8th Grade 83.3% No data 87.1% 84.5% 85.4%
Source: Maryland Report Card
60.0
65.0
70.0
75.0
80.0
85.0
90.0
95.0
100.0
2009 2010 2011 2012 2013 2014 2015 2016
Percent of Students Performing at Proficient or Advanced Levels in Math MSA
3rd Grade 5th Grade 8th Grade
70.0
80.0
90.0
100.0
2009 2010 2011 2012 2013 2014 2015 2016
Percent of Students Performing at Proficient or Advanced Levels in Reading MSA
3rd Grade 5th Grade
8th Grade Linear (3rd Grade)
Linear (5th Grade) Linear (8th Grade)

10
Indicator 2: Percent of all students in all grades missing more than 20 days of school.
2008 2009 2010 2011 2012
Elementary School % < 5% < 5% < 5% < 5% < 5% Middle School % 9.7% 9.7% 9.2% 9.0% 7.7% High School % 14.8% 14.6% 14.0% 14.3% 17.1%
Source: Maryland Report Card
NOTE: Elementary School rates reflect the data provided by MDreportcard.org. The footnote to these rates indicate that “…the percentage for the category is either ≤5 or ≥95 and the corresponding counts have been suppressed.” The Story Behind the Trend ‘Truancy, or unexcused absence from school, has been linked to serious delinquent activity in youth and to significant negative behavior and characteristics in adults’ (Baker, Sigmon and Nugent, 2001, p1.) High levels of school absence are often associated with a higher risk of school failure, dropping out of school, delinquent behavior, substance abuse, and other high-risk behavior. Students who attend school regularly are more likely to pass their classes, get promoted to the next grade level, develop better social skills, demonstrate improved behavior, and go on to postsecondary education. Attendance monitoring, continued parent and community involvement and a focus on the achievement gap have helped to create positive trends in attendance and achievement. Between 1990 and 2012 there has been a 385% growth in the Latino population in the county. This data points to the need for more targeted cultural interventions focused on literacy in Hispanic elementary students and their parents. Language barriers and cultural issues were both cited as gaps in service in the 2012 community needs assessment. Partners and Their Input
• AACPS initiated an Elimination of the Achievement Gap (ETAG) initiative in 2011 which has helped to create positive trends in achievement and attendance data. Local
0.0
5.0
10.0
15.0
20.0
2008 2009 2010 2011 2012 2013 2014 2015
Percent of Students Absent More Than 20 Days
Elementary School % Middle School % High School %
11
schools are also active users of the evidence based Positive Behavioral Supports Initiative.
• Centro D’Ayuda (Center of Help) has signed an MOU with the Partnership for Spanish speaking case management
What Works to “Turn the Curve” Afterschool programs were highlighted as needed supports in the 2012 community needs assessment. The Partnership will focus on those with evidence based curricula such as Second Step and Girls Circles. The 2012 population data also points to the need for more targeted cultural interventions and after-school programming targeting literacy in Spanish speaking elementary students and their parents. Funding Source: CCIF
Safety
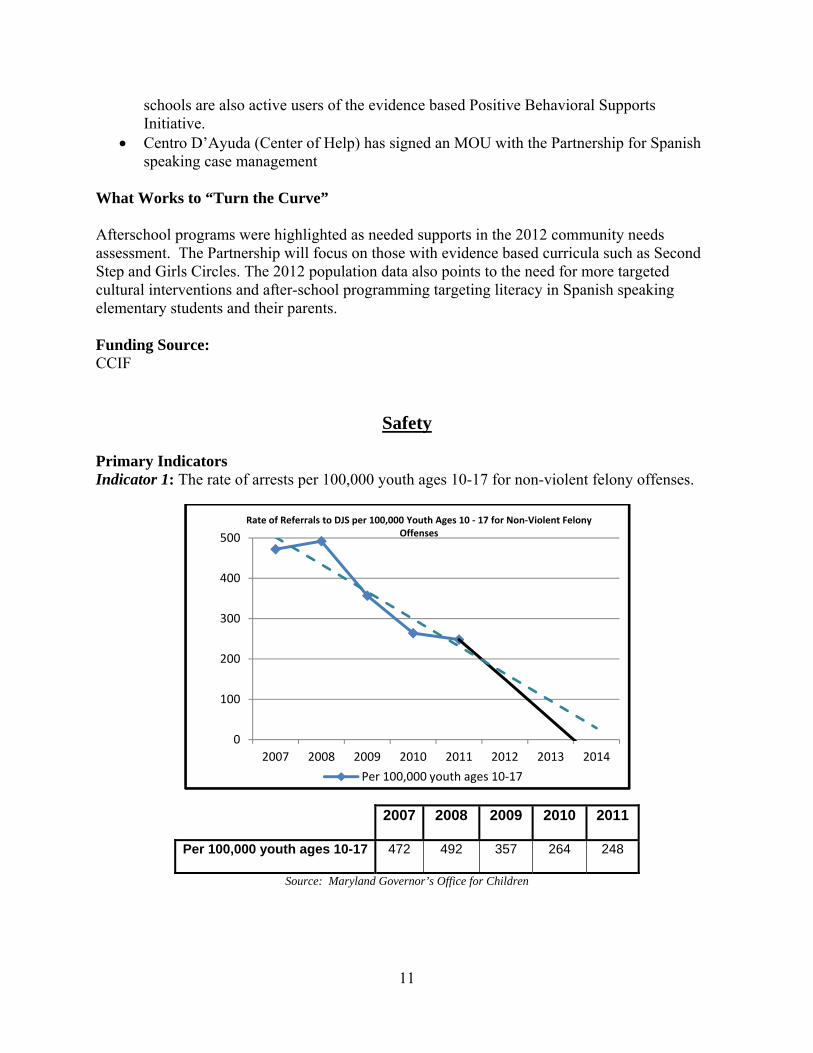
Primary Indicators Indicator 1: The rate of arrests per 100,000 youth ages 10-17 for non-violent felony offenses.
2007 2008 2009 2010 2011
Per 100,000 youth ages 10-17 472 492 357 264 248
Source: Maryland Governor’s Office for Children
0
100
200
300
400
500
2007 2008 2009 2010 2011 2012 2013 2014
Rate of Referrals to DJS per 100,000 Youth Ages 10 ‐ 17 for Non‐Violent Felony Offenses
Per 100,000 youth ages 10‐17

12
Indicator 2: The rate of arrests per 100,000 youth ages 10-17 for violent felony offenses.
2007 2008 2009 2010 2011 Per 100,000 youth ages 10-17 388 333 296 286 240
Source: Maryland Governor’s Office for Children
The Story Behind the Trend
In Anne Arundel County, between 2009 and 2012, the number of arrests of youth 0 to 17 has risen from 2,866 to 3,485, an increase of 21.6%. In fact, according to the 2011 Kids Count Census Data, Anne Arundel County ranked 3rd in the total number of juvenile arrests for youth ages 10-17 (after Baltimore County and Baltimore City) accounting for 11.4% of the state’s total 35,510 arrests in 2011. Evidence based before and after school programs, mentoring for school age children and diversion programs are the strategies identified for this result area. Partners
• AACPS has expanded the School Resource Officer initiative in Anne Arundel County. • The City of Annapolis Police Department has instituted the JOINS program • The County Police Department is supporting Teen Court • Youth Services Bureaus are offering Cognitive Behavioral Therapy and Trauma- Based
Therapy to address the same population What Works to “Turn the Curve” The Partnership is focused on diversion strategies prior to or at the point of arrest to help decrease the rates for non-violent and violent crime. Promising practices such as Community Conferencing, funded by the Governor’s office for Crime Control Prevention, are decreasing the numbers of juveniles who enter the system. After school programs that include research based prevention curricula focus on those vulnerable youths identified by the juvenile services or public school system.
0
100
200
300
400
2007 2008 2009 2010 2011 2012 2013 2014
Rate of Referrals to DJS Per 100,000 Youth Ages 10 ‐17 for Violent Felony Offenses
Per 100,000 youth ages 10‐17 Trend Line

13
Funding Sources: CCIF GOCCP
Stability Primary Indicator: Indicator 1: The rate of children entering out of home placements per 1,000.
2009 2010 2011 2012
# of Children Entering Placement 5.5 5.5 4.8 6.1 Sources: Maryland Governor’s Office for Children and A.A. Co. DSS
The Story Behind the Trend The rate of out of home care for the county has been decreasing. However, the economic downturn has contributed to the numbers of families living below the poverty level. Children need safe and stable homes in order to thrive. Family instability may pose substantial risks to children and may contribute to the need for children to be placed in alternative care. Out-of-home placements are used when less restrictive interventions have failed. According to the 2012 community needs assessment, the state of the economy has negatively impacted families in Anne Arundel County. Families are struggling with basic needs such as food, clothing and shelter and the percentage of families below the poverty level is increasing. Partners
• AACPS - An increase in diversion programs available, increased participation in these programs, and an expansion of the School Resource Officer initiative in Anne Arundel County have had a positive impact on rates of abuse and neglect cases.
0
1
2
3
4
5
6
7
2009 2010 2011 2012 2013 2014 2015
Rate Per 1,000 Children of Entry Into Out of Home Placements
Per 1,000 youth < age 18 Trend Line

14
• The Department of Social Services (DSS) increased focus on family centered practice and the impact of trauma
• DSS contracts with the Partnership for Kinship Care • All County Child serving agencies have representation on the CRICT Team (Care Team) • Community Foundation of Anne Arundel County supplies flex dollars • SEEDCO – navigators trained in EarnBenefits • University of Maryland supplies a systems navigator • United Way of Central Maryland – supplies a family navigator
What Works to “Turn the Curve” The Partnership established a partnership with the public school system in 2010 to create a single point of entry/no wrong door for families with basic needs. The system offers intervention and support by providing access to services through the information and referral ‘warm’ line, infoAnneArundel community services website, EarnBenefits eligibility website, family navigation and the Community Resource Initiative/Care Team (CRICT). By providing this assistance, children can be cared for in their families and will not need out-of-home placements to meet their needs. Families with less intensive needs can access information through a web based component and/or the information and referral line. Systems of Care will receive continuing focus in the new planning cycle with plans to create a formal relationship with Centro de Ayuda who will become the Spanish speaking outreach arm of the Partnership. Funding Sources: CCIF United Way of Central Maryland AACPS GOCCP Community Foundation of Anne Arundel County SEEDCO


