54
HSBC Holdings plc Strategic Report 2013 Co nnec ti ng custom ers to op po r tu n ities
| Date post: | 08-Jan-2016 |
| Category: |
Documents |
| Upload: | hoangbatau |
| View: | 13 times |
| Download: | 0 times |

7/17/2019 Strategic Report 2013
http://slidepdf.com/reader/full/strategic-report-2013 1/54
HSBC Holdings plcStrategic Report 2013
Connecting customersto opportunities

7/17/2019 Strategic Report 2013
http://slidepdf.com/reader/full/strategic-report-2013 2/54
H S B C H O L D I N G S P L C
Strategic Report 2013Contents / Who we are / Our purpose
This Strategic Report 2013 forms a part of HSBC Holdings
lc Annual Report and Accounts 2013 and is not the
Group’s statutory accounts. It does not contain the
Directors’ Report and it does not contain sufficientinformation to allow as full an understanding of the results
and state of affairs of the Group and of its policies and
arrangements concerning Directors’ remuneration aswould be provided by the full Annual Report and Accounts2013.
Additional information, including commentary
on 2012 compared with 2011, may be found in the
Form 20-F filed with the US Securities and Exchange
Commission and available on www.hsbc.com and
www.sec.gov.
Certain defined terms
Unless the context requires otherwise, ‘HSBC Holdings’
means HSBC Holdings plc and ‘HSBC’, the ‘Group’, ‘we’,‘us’ and ‘our’ refers to HSBC Holdings together with its
subsidiaries. Within this document the Hong Kong Specialdministrative Region of the People’s Republic of China is
referred to as ‘Hong Kong’. When used in the terms‘shareholders’ equity’ and ‘total shareholders’ equity’,
‘shareholders’ means holders of HSBC Holdings ordinary
shares and those preference shares classified as equity.The abbreviations ‘US$m’ and ‘US$bn’ represent millions
and billions (thousands of millions) of US dollars,
respectively.
We use the US dollar as our presentation currencybecause the US dollar and currencies linked to it form
the major currency bloc in which we transact and fund
our business. Unless otherwise stated, the information
resented in this document has been prepared in
accordance with IFRSs.
Contents
Who we are ............................................................................ 1
Our purpose ........................................................................... 1 Highlights of 2013 ................................................................. 2
Group Chairman’s Statement ................................................ 3
Group Chief Executive’s Review .......................................... 6
Value creation and long-term sustainability ......................... 9
Strategic priorities:
1 Grow the business and dividends ................................... 13
2 Implement Global Standards ......................................... 23
3 Streamline processes and procedures ........................... 30
Risk overview ........................................................................ 36
Rewarding performance ........................................................ 42
Directors ................................................................................ 47
Supplementary information ................................................... 49
Status of the Strategic Report 2013 .................................. 49
Copies of the Annual Report and Accounts 2013 ............. 49
Shareholder enquires and communications ...................... 49
Report of the auditor ......................................................... 50
Cover images internationalisation of the renminbi
The growth of China’s currency, the renminbi (‘RMB’), is set to be a defining theme of the 21st century. China is the
world’s second largest economic power and the world’s number one trading nation. As China’s economic powercontinues to grow, the importance of the RMB for trade settlement, investment and funding will increase.
In 2013, the RMB overtook the euro to become the world’s second most-used currency for trade finance and the
Chinese government set out further reforms that will speed up the RMB’s internationalisation. HSBC estimates that
one-third of China’s trade flows will be settled in RMB by 2015.
The cover images show the views from HSBC’s head offices in Shanghai, Hong Kong and London – the three cities
that are key to the RMB’s development. As mainland China’s financial centre and home to a newly established freetrade zone, Shanghai is both the onshore trading hub and the testing ground for a fully convertible RMB. Hong Kong
is the centre of global RMB trade settlement, responsible for around 80 per cent of mainland China’s external trade inRMB. London is now the leading RMB hub in the West, accounting for over 60 per cent of RMB trading outside
mainland China and Hong Kong.
HSBC has a proud heritage in all three cities and, with RMB capabilities in over 50 countries and territories worldwide,our customers can count on an expert service wherever they do business in the currency.

7/17/2019 Strategic Report 2013
http://slidepdf.com/reader/full/strategic-report-2013 3/54
1
Who we are
HSBC is one of the largest banking and
financial services organisations in the world.
Customers:
54 million
Served by:
254,000 employees
Through four global businesses:
Retail Banking and Wealth Management
Commercial Banking
Global Banking and Markets
Global Private Banking
Located in:
75 countries and territories
Across six geographical regions:
Europe
Hong Kong
Rest of Asia-Pacific
Middle East and North Africa
North America
Latin America
Offices:Over 6,300
Global headquarters:
London
Market capitalisation:
US$207 billion
Listed on stock exchanges in:
London
Hong Kong
New York
Paris
Bermuda
Shareholders:
216,000 in 131 countries and territories
Our purpose
Our purpose is to be where the growth is,
connecting customers to opportunities,
enabling businesses to thrive and economies
to prosper, and ultimately helping people to
fulfil their hopes and realise their ambitions.
Our strategic priorities
We aim to be the world’s leading and most
respected international bank. We will
achieve this by focusing on the needs of our
customers and the societies we serve,
thereby delivering long-term sustainable
value to all our stakeholders.
For 2011 to 2013, we defined strategic actions acrossthree areas: capital deployment, organisation and
cost efficiency, and growth. In May 2013, we
announced a set of three interconnected and equally
weighted priorities for 2014 to 2016 to help us
deliver our strategy:
• grow the business and dividends;
• implement Global Standards; and
• streamline processes and procedures.
These priorities form the basis for this Strategic
Report . Each priority is interrelated, complementary
and underpinned by initiatives within our day-to-day business. Together they create value for our
customers and shareholders, and contribute to the
long-term sustainability of HSBC.
A diagrammatic representation of the priorities and their
related themes is provided on page 12.
How we measure performance
We track our progress in implementing our strategy
with a range of financial and non-financial measures
or key performance indicators. Specific targets have
been set for the period 2014 to 2016 at both a Group
level and for each of our global businesses andregions.
Rewarding performance
The remuneration of all staff within the Group,
including executive Directors, is based on the
achievement of financial and non-financial
objectives. These objectives, which are aligned with
the Group’s strategy, are detailed in individuals’
annual scorecards. To be considered for a variable
pay award, an individual must have fully complied
with HSBC Values.
For further information on HSBC Values, see page 25.
7/17/2019 Strategic Report 2013
http://slidepdf.com/reader/full/strategic-report-2013 4/54
H S B C H O L D I N G S P L C
Strategic Report (continued) Highlights of 2013 / Group Chairman’s Statement
2
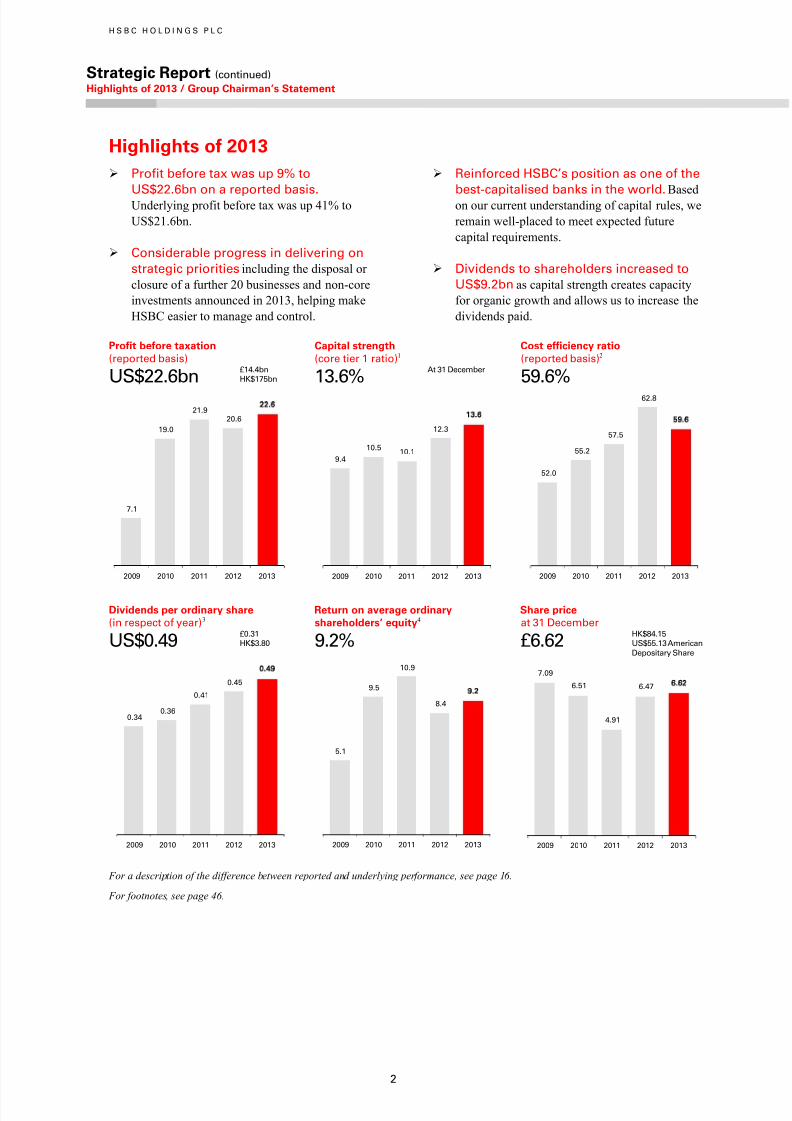
Highlights of 2013
Profit before tax was up 9% to
US$22.6bn on a reported basis.
Underlying profit before tax was up 41% to
US$21.6bn.
Considerable progress in delivering on
strategic priorities including the disposal or
closure of a further 20 businesses and non-core
investments announced in 2013, helping make
HSBC easier to manage and control.
Reinforced HSBC’s position as one of the
best-capitalised banks in the world.Basedon our current understanding of capital rules, we
remain well-placed to meet expected future
capital requirements.
Dividends to shareholders increased to
US$9.2bn as capital strength creates capacity
for organic growth and allows us to increase the
dividends paid.
Profit before taxation Capital strength Cost efficiency ratio
(reported basis) (core tier 1 ratio)1 (reported basis)2
US$22.6bn£14.4bnHK$175bn 13.6%
At 31 December 59.6%
Dividends per ordinary share Return on average ordinary Share price
(in respect of year)3 shareholders’ equity4 at 31 December
US$0.49£0.31HK$3.80 9.2% £6.62
HK$84.15US$55.13 AmericanDepositary Share
For a description of the difference between reported and underlying performance, see page 16.
For footnotes, see page 46.
7.1
19.0
21.920.6
22.6
2009 2010 2011 2012 2013
9.4
10.510.1
12.3
13.6
2009 2010 2011 2012 2013
52.0
55.2
57.5
62.8
59.6
2009 2010 2011 2012 2013
0.340.36
0.41
0.45
0.49
2009 2010 2011 2012 2013
5.1
9.5
10.9
8.4
9.2
2009 2010 2011 2012 2013
7.09
6.51
4.91
6.47 6.62
2009 2010 2011 2012 2013
7/17/2019 Strategic Report 2013
http://slidepdf.com/reader/full/strategic-report-2013 5/54
3
Group Chairman’s Statement
Against the welcome backdrop of generally
improving economic conditions, we significantly
progressed the reshaping of HSBC during 2013. The
focus of these efforts was two-fold; alongside
concentrating on capturing the high quality
opportunities from and within our increasingly
distinctive international network and diversified
business model we strove to improve risk
management and control through eliminating or
restructuring businesses with higher inherent risk
characteristics. The combination of our commitment
to implementing Global Standards, addressing
regulatory changes and managing increased capital
discipline has driven a fundamental review of all
aspects of our business. I have no doubt that a stronger
HSBC is emerging from this process. The Group
Chief Executive’s Review gives greater detail of the
progress made on this journey and draws out the key
elements of HSBC’s performance in 2013.
If there is one thing to highlight from all the work
being done, it is the recognition of the benefits to our
customers of the connectivity we can deliver across
geographies and through our universal banking model.
As we reshape HSBC we shall not lose sight of the
importance of these network benefits or of the fact
that this network has taken close to 150 years to build.
Nowhere is this more evident than in our
businesses facilitating cross-border investment and
trade activities. Our geographic presence, which
straddles both the key developed Western economies
and the most important markets in Asia, Latin
America and the Middle East, adds both comparative
advantage and resilience to our competitive positioning.
China finished the year with record trade figures,
thereby becoming the largest trading nation in the
world, and it is fitting that the cover of this year’s
Annual Report features the three cities where HSBC’strade credentials were established in 1865 and which
are now playing key roles in the internationalisation
of the renminbi, namely Shanghai, Hong Kong and
London.
Performance in 2013
HSBC’s performance in 2013 was reassuringly sound
across our main business areas with good underlying
momentum in areas of targeted investment.
Pre-tax profit on a reported basis was US$22.6
billion, 9% or US$1.9 billion higher than that reported
in 2012. On an underlying basis, profit before tax was
41% (US$6.3 billion) ahead of last year, driven
primarily by welcome reductions in loan impairment
charges as well as in fines and penalties and customer
redress costs.
These improvements flow in large part from the
re-positioning of the Group and from enhanced risk
controls given effect over the last three years.
Earnings per share of US$0.84 compared with
US$0.74 in 2012. Shareholders’ equity stood at
US$181.9 billion, some US$6.6 billion higher than at
the start of the year. The Group’s market capitalisationrose over the year by US$13 billion and at
US$207 billion exceeded shareholders’ equity by
US$25 billion or 14%.
Continuing strong capital generation from
operating results, together with the favourable effect
of the ongoing run-off of exit portfolios and non-core
disposals, lifted our core tier 1 ratio to 13.6%
compared with 12.3% at the start of the year.
Taking account of our strong capital position and
earnings performance, the Board has approved
a fourth interim dividend in respect of 2013 of
US$0.19 per share, as against US$0.18 per share in
2012. The Board intends to maintain the first three
quarterly interim dividends in respect of 2014 at
US$0.10 per share. Total dividends in respect of 2013
of US$0.49 per share were 9% or US$0.04 higher
than in 2012, amounting to US$9.2 billion in
aggregate, an increase in pay-out of US$0.9 billion.
Once again in 2013, the British Government
increased the rate of the bank levy imposed on the
consolidated balance sheets of UK domiciled banks
and expanded the scope of the levy. This increased the
cost to HSBC in 2013 by US$321 million, taking thelevy for the year to US$904 million, of which US$484
million related to non-UK banking activity. The
impact of the levy represented US$0.05 per share

7/17/2019 Strategic Report 2013
http://slidepdf.com/reader/full/strategic-report-2013 6/54
H S B C H O L D I N G S P L C
Strategic Report (continued) Group Chairman’s Statement
4
which would otherwise have been available for
distribution to shareholders or retained to strengthen
the capital base or support incremental growth.
Global Standards and regulatory change
In the current public policy debates about how best to
restore and expand economic growth, two themes
critical to our industry stand out. First, how to prevent
another financial crisis and what tools are needed to
minimise the cost to society should one occur.
Second, how to achieve a better balance between
economic activity and a more equitable distribution of
the economic growth that is generated in the future.
We are clear that through building the further
resilience mandated by global regulatory changes and
by implementing and adhering to global standards in
all aspects of compliance, we can address both sets of
objectives and build a more sustainable future for
HSBC. Much has been done but there is much still to
do.
The Group Chief Executive’s Review highlights
the priority we give to this agenda. It remains the key
focus of the Board’s governance of executive
performance. In executing these responsibilities, the
Board is also acutely aware of its commitments under
the Deferred Prosecution Agreement and associated
regulatory undertakings entered into in December
2012. As reported at our interim results, Michael
Cherkasky, the Monitor appointed to evaluate and
report upon the effectiveness of the Group’s AML and
sanctions compliance function and HSBC’s progress
in meeting its remedial obligations, commenced his
work in July last year. The Board, both directly and
through its Financial System Vulnerabilities
Committee, has established a good working
relationship with the Monitor in order to support him
and his team in the execution of their assignment.
Responding to heightened standards
Sustainable success in banking is founded upon
meeting the expectations of society. Fundamentally,
this means delivering transparent and fair outcomes to
our customers. It also means avoiding any perception
of self-interest by ensuring there is a proper division
of value between providers and consumers of
financial products and services. While regulatory
changes seek to address the framework supporting
these outcomes, responsibility and accountability rest
with the industry itself, and ultimately with the
management and boards of individual institutions. We
understand this and strive to be seen as proactively
responsive to rising expectations. We made good progress in 2013 in this regard. In particular, we
redesigned the compensation frameworks in Retail
Banking and Wealth Management around the
customer, so that from the start of 2014 we have
removed the link between financial reward
opportunity and product sales for substantially all ofour staff in our retail and wealth businesses. We have
also stepped up the Board’s governance oversight
over conduct and behavioural issues, and I deal with
this later.
Board changes
It is critical to all we do that we have the breadth and
depth of experience on the Board necessary to provide
effective governance and challenge. As we refresh the
Board to take account of planned retirements, we seek
to add skills and experience complementary to those
already on the Board in order to strengthen the rangeof oversight competences within the Board. Through
the Nomination Committee we look up to two years
ahead to identify a pipeline of suitable candidates and
I am hugely encouraged by the quality of individuals
we are able to identify and attract.
We shall be saying goodbye to two long-serving
Directors later this year. Both John Coombe and
James Hughes-Hallett have given outstanding service
and commitment over their nine years on the Board
and its Committees. They will not seek re-election at
the AGM in May.
In his time on the Board, in addition to his
measured contributions to Board discussions, John has
brought a wealth of business and financial experience
and expertise to the Group Audit Committee, which
latterly he chaired, and to the Group Risk and
Remuneration Committees. In these roles he has
taken on a considerable workload and critical
responsibilities throughout periods of significant
economic and market uncertainty and major
regulatory change. Upon his retirement it is proposed
that John will be succeeded in his role as Chair of the
Group Audit Committee by Renato Fassbind.
With his deep experience of managing a broad
range of international businesses, notably in the Far
East, James has brought a businessman’s perspective
to the Board as well as detailed knowledge of both
Hong Kong and mainland China. James has served
with distinction on the Group Audit, Risk, Corporate
Sustainability and Nomination Committees.
On behalf of the Board and shareholders, I
want to take this opportunity to acknowledge their
contribution to HSBC and record our appreciation and
gratitude for their long and distinguished periods of
service.On 21 February we announced the appointment
of a new Director to the Board.

7/17/2019 Strategic Report 2013
http://slidepdf.com/reader/full/strategic-report-2013 7/54
5
Kathleen Casey, a former Commissioner of the
US Securities and Exchange Commission (‘SEC’),
will join the Board as an independent non-executive
Director with effect from 1 March 2014. She will become a member of the Group Audit Committee and
the Financial System Vulnerabilities Committee.
Kathleen served as an SEC Commissioner from
2006 to 2011, acting as the regulator’s principal
representative in multilateral and bilateral regulatory
dialogues including with the G-20 Financial Stability
Board and the International Organisation of Securities
Commissions. Before being appointed Commissioner,
Kathleen spent 13 years on Capitol Hill, holding
various positions including Staff Director and Counsel
of the United States Senate Committee on Banking,
Housing and Urban Affairs (2003-2006).
Kathleen brings to the Board a wealth of
experience of financial services regulation gained
though public service at a key time in the regulatory
evolution of the sector. Her skills will complement
well the diverse background and experience of the
Board.
Governance changes
Recognising the benefits to be had from reinforcing
the links between our major subsidiary boards and
HSBC Holdings, the Board invited Rona Fairhead to
extend her term of service on the Board and take on
the Chairmanship of HSBC North America Holdings
Inc. The Board was delighted when she accepted this
invitation, taking on her new role with effect from the
start of this year.
Finally, the Board considered in depth the
conclusions and recommendations of the
Parliamentary Commission on Banking Standards
on conduct and behaviour in banks and concluded that
the Board should expand and enhance its oversight of
these areas. Accordingly, the Board has established a
new Committee, the Conduct and Values Committee,
into which will be folded much of what was done
historically in the Group Corporate Sustainability
Committee. I am delighted to report that Rachel
Lomax has agreed to chair this new committee.
Further details of its terms of reference and
membership are set out on page 362 of the Annual
Report and Accounts 2013.
Looking forward
As well as addressing the regulatory and governance
challenges we face, it is essential to keep a sense of
perspective and be able to focus on the significantopportunities arising from successful execution of our
strategy. Let me outline four by way of illustration.
First, trade. HSBC was founded on financing
trade and investment flows. By 2050 trade and capital
flows between Asia, the Middle East and Latin
America, in which we are well represented, couldincrease tenfold. The internationalisation of the
renminbi, where HSBC is already the leading
international bank, will amplify these opportunities.
Second, the world’s population is ageing,
necessitating considerably greater privately funded
retirement saving. HSBC’s research shows that
globally some 48% of people have never saved for
retirement and that 56% admit they are not preparing
adequately.
Third, as the world’s population expands there is
an urgent need to fund the technology and
infrastructure investment that will deliver the energy,
water and food needed to support the extra two billion
people predicted to be living by 2050.
Fourth, we need to invest to bring to our
customers the benefits available through smarter
digital technology and richer data.
The above represent only some of the foreseeable
changes to which banking needs to respond in order to
enable our customers better to meet their financial
needs and aspirations.
The opportunities are clear; HSBC’s commitment
to be a trusted partner in the delivery of these
opportunities lies at the heart of our strategy. Our
ability to succeed lies in the strength and range of our
networks and our universal banking model. The rest
of this Strategic Report covers the detail of that
strategy.
Finally, what we have achieved in 2013 and what
we plan to do rests upon the dedication and
commitment of our employees, the continuing support
of our customers, counterparties and shareholders, the
trust of our regulators and public confidence more
generally. On behalf of the Board, I want to take this
opportunity to thank our staff for all their efforts and
their continuing loyalty to HSBC, and to commit to
those we serve and those who regulate us that we are
focused on continuing to earn their trust and deserve
their confidence in HSBC.
D J Flint, Group Chairman
24 February 2014

7/17/2019 Strategic Report 2013
http://slidepdf.com/reader/full/strategic-report-2013 8/54
H S B C H O L D I N G S P L C
Strategic Report (continued) Group Chief Executive’s Review
6
Group Chief Executive’s
Review
2013 marked the end of the first stage of
implementation of our strategy for HSBC.
Throughout this three-year period we have worked
constantly to reshape HSBC and improve returns.
The Group today is leaner and simpler than in 2011
with strong potential for growth.
In 2011, I outlined a strategy to realise our
purpose as a business and to establish HSBC as
the world’s leading international bank. It aims to
capitalise on two major trends: the continuing
growth of international trade and capital flows; and
wealth creation, particularly in Asia, the Middle East
and Latin America. Over the last three years we have
put this into action, pursuing more effective capital
deployment, greater organisational efficiency and
improved growth.
We have simplified HSBC considerably since
2011, initiating the disposal or closure of 63 non-
strategic businesses or non-core investments,including 20 in 2013. This represents a potential
reduction in risk-weighted assets of around
US$95bn, equivalent to about 9% of 2010 year-end
risk-weighted assets. To date, about US$90bn in
risk-weighted assets have been released with,
potentially, some US$5bn still to come.
We have transformed the way that we run the
business, exerting pressure on costs and making it
easier to manage and control. We have installed
consistent business models, reshaped global
businesses and global functions, and removed layers
of management to give staff greater responsibility,improve decision making and remove bureaucracy.
The number of full-time equivalent employees has
been reduced from 295,000 at the start of 2011 to
254,000 at the end of 2013, primarily through
disposals and our cost-reduction programmes. We
achieved an additional US$1.5bn of sustainable cost
savings bringing our total annualised sustainable costsavings to US$4.9bn since 2011. This comfortably
exceeded our target of US$2.5-3.5bn and provides
good momentum into 2014. On a constant currency
basis and excluding UK customer redress and
restructuring costs, operating expenses in 2013 were
broadly flat compared to 2010. This demonstrates
the impact of our sustainable cost savings and
business disposals in broadly offsetting cost
increases, which came primarily from inflationary
pressures, the UK bank levy and investment in risk
and compliance, as well as business initiatives.
We have positioned HSBC to captureinternational trade and capital flows, 90% of which
go through markets covered by our international
network. We have also sought to capitalise on the
advantages that our unique network provides.
We have focused on our product capabilities to
broaden client coverage, grown revenue through
greater collaboration between global businesses and
strengthened them through investment and senior
hires in strategic markets such as Hong Kong,
mainland China and Germany. We have also
combined our market-leading position in Asia
and our global reach to cement our position as thenumber one international bank for renminbi (‘RMB’)
business in the world, as recognised by the 2013
Asiamoney Offshore RMB Services Survey. Our
leadership in the Greater Chinese market continues
to be reflected in our first place rankings in the dim
sum bond issuance and Hong Kong M&A league
tables for 2013, and the announcement that we are
the first custodian bank to service London-based
renminbi qualified foreign institutional investors.
Our presence in markets across all of the major
global trade routes has enabled us to support clients
with international growth ambitions. In 2013 alone,we launched funds in Canada, Egypt, France,
Mexico, Turkey, the UAE, the UK and the US
offering financing to help our internationally focused
SME clients. We have continued to build our
international network through investments in city
clusters, notably in the US, mainland China and
Germany. Our clients are also benefiting from the
global network of China desks that we established to
assist companies trading with and from mainland
China.
We also helped many of our customers achieve
their personal ambitions. For instance, in the UK welent £3.8bn (US$6.0bn) to help more than 30,000
first-time buyers purchase their own home in 2013.
7/17/2019 Strategic Report 2013
http://slidepdf.com/reader/full/strategic-report-2013 9/54
7
We also provided greater convenience for our
retail customers by rolling out new mobile
applications across 25 key markets, with 2.5 million
downloads in 2013.Through actions like these we have already
replaced approximately a third of the reduction in
total revenue from disposals by growing our
business since the start of 2011.
Although much progress has been made since
2011, we did not meet all of our targets by the end
of 2013. Our reported cost efficiency ratio of 59.6%
and return on equity of 9.2% in 2013 were both
outside our target ranges, in part affected by
continuing UK customer redress. In addition, there
is further work required to grow our incremental
wealth revenues to achieve our target of US$3bn in
the medium term.
Performance
Our performance in 2013 was influenced by the
strategic measures that we have taken since the start
of 2011.
Reported profit before tax was US$22.6bn,
US$1.9bn higher than 2012, and underlying profit
before tax was US$21.6bn, US$6.3bn higher than
last year. Underlying revenue grew 9% faster than
costs in 2013.
Underlying profit before tax was higher in
three out of our four global businesses and all of
our regions, with the exception of Latin America
where underlying profit before tax fell. Whilst
our performance in Latin America was affected by
slower economic growth and inflationary pressures,
we made significant progress in repositioning our
portfolios with a focus on our priority markets of
Brazil, Mexico and Argentina.
In Commercial Banking, underlying profit
before tax increased by 5%, driven by higher
revenues and lower costs. Higher revenue reflected
average balance sheet growth, partly offset by spread
compression, together with higher lending fees and
improved collaboration with our other global
businesses. These factors were partially offset by
higher loan impairment charges, notably in Latin
America.
In Global Banking and Markets, underlying
profit before tax increased by 15%. This was driven
by higher revenue and significantly lower loan
impairment charges and other credit risk provisions.
The increase in revenue was, in part, underpinned by a resilient performance in the majority of our
customer-facing businesses.
In Retail Banking & Wealth Management
underlying profit before tax increased by US$2.4bn
as we made further progress in running-off the
Consumer Mortgage and Lending (‘CML’) portfolioin North America, with the improvement in loan
impairment charges more than offsetting the decline
in revenue. Our Retail Banking & Wealth
Management business excluding the US run-off
portfolio benefited from lower UK customer redress
charges and further sustainable cost savings, together
with revenue growth, mainly in Hong Kong and
Europe excluding the loss on sale of the HFC Bank
secured lending portfolio.
We continued to address legacy issues and
reposition our business model and client base in
Global Private Banking, which in part resulted in areduction in underlying profit before tax of
US$0.7bn.
Our capital position strengthened over the year.
Our core tier 1 ratio increased to 13.6% and our
estimated CRD IV end point basis common equity
tier 1 ratio increased to 10.9%. We remain well
placed to meet expected future capital requirements,
and will continue to review the evolution of the
regulatory environment.
We continued to demonstrate our ability to
generate capital to grow our business and to support
our progressive dividend policy, cementing our
status as one of the highest dividend payers in the
FTSE.
Strategy – next phase
2014 marks the beginning of the next phase of
strategy implementation. This will be a continuation
of the work that we began in 2011, albeit with new
goals informed by our experience of the past three
years.
At our investor update in May we reaffirmed
our return on equity target at 12-15% and modifiedour cost-efficiency target for 2014-16 to mid-50s.
We also announced three strategic priorities for
2014-16, each of equal importance.
First, our strategy is designed to further grow
the business and dividends. We will continue to
recycle risk-weighted assets from lower return to
higher return parts of the Group. Our capital strategy
aims to increase dividends progressively. If we are
unable to deploy the remaining capital ourselves in
such a way that it provides incremental value for our
shareholders, we may seek to neutralise the effect of
scrip dividends through share buy-backs, subject toregulatory capital requirements and shareholder
approval. We shall also continue to wind down and

7/17/2019 Strategic Report 2013
http://slidepdf.com/reader/full/strategic-report-2013 10/54
H S B C H O L D I N G S P L C
Strategic Report (continued) Group Chief Executive’s Review / Value creation and long-term sustainability > How we create value
8
thus reduce the impact of our portfolio of legacy
businesses.
Second, we will continue to implement our
Global Standards programme which we believe willincrease the quality of the Group’s earnings. Global
Standards governs all of our activity and will drive
consistently high standards through HSBC globally.
We have made substantial investment in risk and
compliance capabilities across all businesses and
regions to strengthen our response to the ongoing
threat of financial crime, and will continue to do so.
This is the right thing to do, in line with our values,
and we believe that it will also become a source of
competitive advantage.
Third, we aim to deliver a further US$2-3bn of
sustainable savings by streamlining our processes
and procedures without in any way compromising
our commitment to compliance and Global
Standards. There remains considerable scope within
the business to globalise and simplify many of our
operations and practices.
These priorities are essential to realising our
vision of establishing HSBC as the world’s leading
international bank.
Outlook
We remain of the view that the GDP of mainland
China will grow by 7.4% this year, the UK by 2.6%,
the USA by 2.5% and Western Europe by 1.2%.
Although there has been a sharp sell-off in some
emerging markets, both when tapering was first
talked of last June and more recently in January
of this year, we see this as a reflection of specific
circumstances rather than a generalised threat. The
countries most affected have two common themes,
large current account deficits and the uncertain
outcomes arising from elections within a year. Other
emerging markets such as Mexico have, by contrast,
been upgraded by the rating agencies in the same
period. Overall, we remain optimistic about the
longer-term prospects of emerging markets and
especially the opportunities for HSBC, which will
arise from the anticipated material expansion in
South-South trade and capital flows. In the short
term, we stress the importance of differentiating
within and between individual countries within the
generic category of emerging markets. Nevertheless,
we anticipate greater volatility in 2014 and choppy
markets as adjustments are made to changing
economic circumstances and sentiment.
S T Gulliver, Group Chief Executive
24 February 2014
7/17/2019 Strategic Report 2013
http://slidepdf.com/reader/full/strategic-report-2013 11/54
9
Value creation and long-term sustainability
• How we create value ................................................. 9
•
Long-term sustainability......................................... 10
• Our strategy .................................................................. 11
• Our strategic priorities ........................................... 12
Through our principal activities – making
payments, holding savings, providing financeand managing risks – we play a central role insociety and in the economic system. Our targetis to build and maintain a business which issustainable in the long term.
In May 2013, we reinforced our vision for the long-term direction of HSBC first outlined in 2011, together with a
clear strategy that will help us achieve it. It guides where and how we seek to compete. We constantly assess our
rogress against this strategy and provide regular updates to stakeholders.
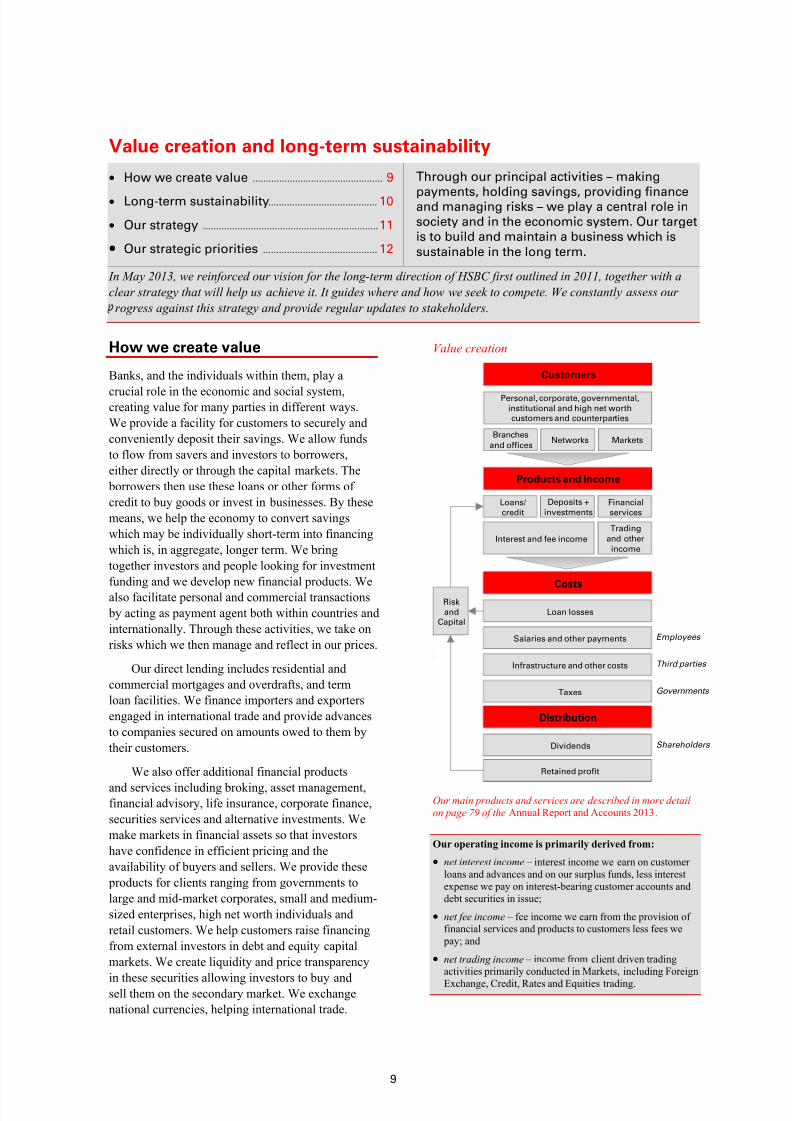
How we create value
Banks, and the individuals within them, play a
crucial role in the economic and social system,creating value for many parties in different ways.
We provide a facility for customers to securely and
conveniently deposit their savings. We allow funds
to flow from savers and investors to borrowers,
either directly or through the capital markets. The
borrowers then use these loans or other forms of
credit to buy goods or invest in businesses. By these
means, we help the economy to convert savings
which may be individually short-term into financing
which is, in aggregate, longer term. We bring
together investors and people looking for investment
funding and we develop new financial products. We
also facilitate personal and commercial transactions
by acting as payment agent both within countries and
internationally. Through these activities, we take on
risks which we then manage and reflect in our prices.
Our direct lending includes residential and
commercial mortgages and overdrafts, and term
loan facilities. We finance importers and exporters
engaged in international trade and provide advances
to companies secured on amounts owed to them by
their customers.
We also offer additional financial products
and services including broking, asset management,financial advisory, life insurance, corporate finance,
securities services and alternative investments. We
make markets in financial assets so that investors
have confidence in efficient pricing and the
availability of buyers and sellers. We provide these
products for clients ranging from governments to
large and mid-market corporates, small and medium-
sized enterprises, high net worth individuals and
retail customers. We help customers raise financing
from external investors in debt and equity capital
markets. We create liquidity and price transparency
in these securities allowing investors to buy andsell them on the secondary market. We exchange
national currencies, helping international trade.
Value creation
Our main products and services are described in more detail
on page 79 of the Annual Report and Accounts 2013.
Our operating income is primarily derived from:
• net interest income – interest income we earn on customerloans and advances and on our surplus funds, less interestexpense we pay on interest-bearing customer accounts anddebt securities in issue;
• net fee income – fee income we earn from the provision offinancial services and products to customers less fees we pay; and
• net trading income – income from client driven trading
activities primarily conducted in Markets, including Foreign
Exchange, Credit, Rates and Equities trading.
Customers
Branches
and officesNetworks Markets
Personal, corporate, governmental,
institutional and high net worthcustomers and counterparties
Products and Income
Loans/
credit
Deposits +
investmentsFinancial
services
Interest and fee income
Trading
and other
income
Costs
Loan losses
Salaries and other payments
Infrastructure and other costs
Taxes
Dividends
Retained profit
Risk
andCapital
Employees
Third parties
Governments
Shareholders
Distribution

7/17/2019 Strategic Report 2013
http://slidepdf.com/reader/full/strategic-report-2013 12/54
H S B C H O L D I N G S P L C
Strategic Report (continued) Value creation and long-term sustainability / Our strategy
10
We offer products that help a wide range of
customers to manage their risks and exposures
through, for example, life insurance and pension
products for retail customers and receivables financeor documentary trade instruments for companies.
Corporate customers also ask us to help with
managing the financial risks arising in their
businesses by employing our expertise and market
access.
An important way of managing risks arising
from changes in asset and liability values and
movements in rates is provided by derivative
products such as forwards, futures, swaps and
options. In this connection, we are an active market-
maker and derivative counterparty. Customers use
derivatives to manage their risks, for example, by:
• using forward foreign currency contracts to
hedge their income from export sales or costs
of imported materials;
• using an inflation swap to hedge future
inflation-linked liabilities, for example, for
pension payments;
• transforming variable payments of debt interest
into fixed rate payments, or vice versa; or
• providing investors with hedges against
movements in markets or particular stocks.
We charge customers a margin, representing the
difference between the price charged to the customer
and the theoretical cost of executing an offsetting
hedge in the market. We retain that margin, which
represents a profit to the Group, at maturity of the
transaction if the risk management of the position
has been effective.
We then use derivatives along with other
financial instruments to constrain the risks arising
from customer business within risk limits. Normally,
we will have customers both buying and selling
relevant instruments so our focus is then onmanaging any residual risks through transactions
with other dealers or professional counterparties.
Where we do not fully hedge the residual risks we
may gain or lose money as market movements affect
the net value of the portfolio.
Stress tests and other risk management
techniques are also used to ensure that potential
losses remain within our risk appetite under a wide
range of potential market scenarios.
In addition, we manage risks within HSBC,
including those which arise from the business we
do with customers.
For further information on our risk measures, see page 38,and on how we manage our own risks, see page 39.
Long-term sustainability
At HSBC, we understand that the success of our
business is closely connected to the economic,
environmental and social landscape in which we
operate. For us, long-term corporate sustainability
means achieving a sustainable return on equity and
profit growth so that we can continue to reward
shareholders and employees, build long-lasting
relationships with customers and suppliers, pay taxes
and duties in the countries in which we operate, and
invest in communities for future growth. The way
we do business is as important as what we do: our
responsibilities to our customers, employees and
shareholders as well as to the countries and
communities in which we operate go far beyond
simply being profitable.
Continuing financial success depends, in part,
on our ability to identify and address environmental,
social and ethical developments which present risks
or opportunities for the business. It also depends
on the consistent implementation of the highest
standards everywhere we operate to detect, deter and
protect against financial crime. Our response to these
factors shapes our reputation, drives employee
engagement and affects the riskiness of the business,
and can help reduce costs and secure new revenue
streams.
Our international spread and the long-
established position of many of our businesses in
HSBC’s home and priority growth markets, when
combined with our wide-ranging portfolio of
products and services, differentiate HSBC from our
competitors and give our business and operating
models an inherent resilience. This has enabled the
Group to remain profitable and grow through the
most turbulent of times for our industry, and we are
confident that the models will continue to stand us
in good stead in the future and will underpin the
achievement of our strategic priorities.
Our business and operating models are described in moredetail on page 13. For further information on our response to
environmental and community issues, see page 34.

7/17/2019 Strategic Report 2013
http://slidepdf.com/reader/full/strategic-report-2013 13/54
11
Our strategy
Long-term trends
Our strategy is aligned to two long-term trends:
• The world economy is becoming ever more
connected, with growth in world trade and
cross-border capital flows continuing to outstrip
growth in average gross domestic product. Over
the next decade we expect 35 markets to
generate 90% of world trade growth with a
similar degree of concentration in cross-border
capital flows.
• Of the world’s top 30 economies, we expect
those of Asia-Pacific, Latin America, the
Middle East and Africa to have increased by
around four-fold in size by 2050, benefiting
from demographics and urbanisation. By this
time they will be larger than those of Europe
and North America combined. By 2050, we
expect 18 of the 30 largest economies will be
from Asia-Pacific, Latin America or the Middle
East and Africa.
Competitive advantages
What matters in this environment are:
• having an international network and global
product capabilities to capture internationaltrade and movements in capital; and
• being able to take advantage of organic
investment opportunities in the most attractive
growth markets and maintaining the capacity
to invest.
HSBC’s competitive advantages come from:
• our meaningful presence in and long-term
commitment to our key strategic markets;
• our strong ability to add to our capital base
while also providing competitive rewards to our
staff and good returns to our shareholders;
•
our stable funding base, with aboutUS$1.5 trillion of customer accounts of which
73% has been advanced to customers;
• our business network, which covers over 90%
of global trade and capital flows; and
• our local balance sheet strength and trading
capabilities in the most relevant financial hubs.
A two-part strategy
Based on these long-term trends and our competitive
advantages, we have developed a two-part strategy:
• A network of businesses connecting the world.
HSBC is well positioned to capture growing
international trade and capital flows. Our global
reach and range of services place us in a strong
position to serve clients as they grow from small
enterprises into large multi-nationals through
our Commercial Banking and Global Banking
& Markets businesses.
• Wealth management and retail with local scale.
We will capture opportunities arising from
social mobility and wealth creation in our
priority growth markets across Asia-Pacific,Latin America and the Middle East, through our
Premier proposition and Global Private Banking
business. We will invest in full scale retail
businesses only in markets where we can
achieve profitable scale, namely in our home
markets of the United Kingdom and Hong
Kong.
7/17/2019 Strategic Report 2013
http://slidepdf.com/reader/full/strategic-report-2013 14/54
H S B C H O L D I N G S P L C
Strategic Report (continued) Value creation and long-term sustainability / Strategic priority 1 – Grow the business and dividends > Business model
12
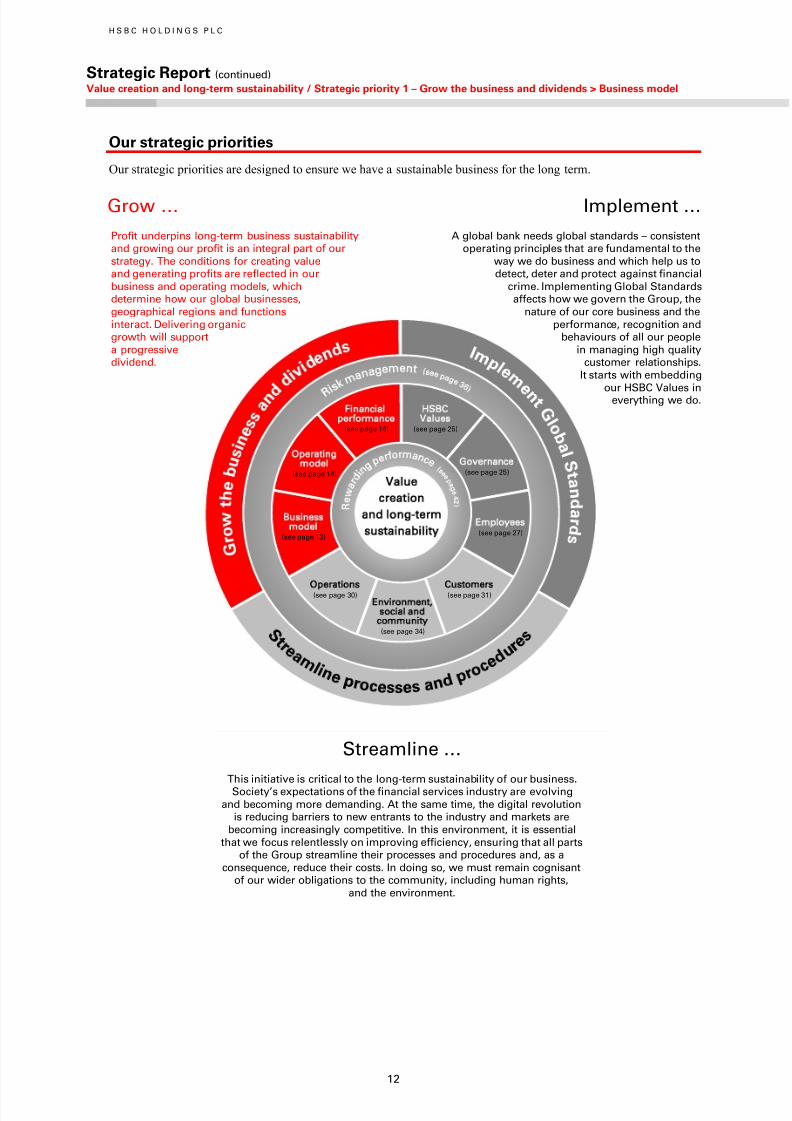
Our strategic priorities
Our strategic priorities are designed to ensure we have a sustainable business for the long term.
Business
model
(see page 13)
Financial
performance
(see page 16)
HSBC
Values
(see page 25)
Governance
(see page 25)
Environment
social and
community
(see page 34)
Customers(see page 31)Operations(see page 30)
Operating
model
(see page 14)
Employees
(see page 27)
Value
creation
and long-term
sustainability
Grow …
Profit underpins long-term business sustainabilityand growing our profit is an integral part of ourstrategy. The conditions for creating valueand generating profits are reflected in ourbusiness and operating models, whichdetermine how our global businesses,geographical regions and functionsinteract. Delivering organicgrowth will supporta progressivedividend.
Implement …
A global bank needs global standards – consistentoperating principles that are fundamental to the
way we do business and which help us todetect, deter and protect against financial
crime. Implementing Global Standardsaffects how we govern the Group, the
nature of our core business and theperformance, recognition and
behaviours of all our peoplein managing high quality
customer relationships.It starts with embedding
our HSBC Values ineverything we do.
Streamline …
This initiative is critical to the long-term sustainability of our business.Society’s expectations of the financial services industry are evolving
and becoming more demanding. At the same time, the digital revolutionis reducing barriers to new entrants to the industry and markets are
becoming increasingly competitive. In this environment, it is essentialthat we focus relentlessly on improving efficiency, ensuring that all parts
of the Group streamline their processes and procedures and, as aconsequence, reduce their costs. In doing so, we must remain cognisant
of our wider obligations to the community, including human rights,and the environment.
7/17/2019 Strategic Report 2013
http://slidepdf.com/reader/full/strategic-report-2013 15/54
13
Strategic priority 1
Grow the business and dividends
•
Business model .......................................................... 13
• Operating model ........................................................ 14
• Financial performance ............................................ 16
Our targets are to:
1. grow risk-weighted assets (‘RWA’s) in line
with our organic investment criteria;
2. progressively grow dividends and introduce
share buy-backs as appropriate; and
3. reduce the effect of legacy and non-strategic
activities on our profit before tax and RWAs.
Our success in meeting our targets is described on
page 20.
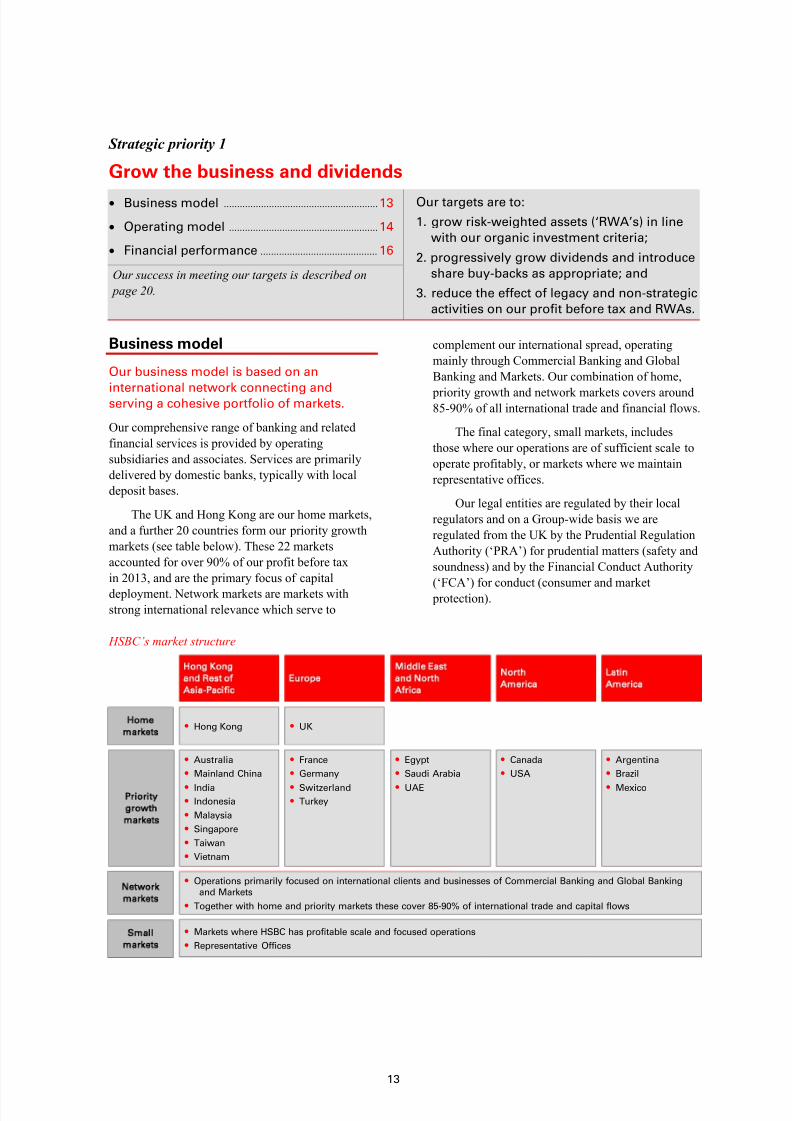
Business model
Our business model is based on an
international network connecting andserving a cohesive portfolio of markets.
Our comprehensive range of banking and related
financial services is provided by operating
subsidiaries and associates. Services are primarily
delivered by domestic banks, typically with local
deposit bases.
The UK and Hong Kong are our home markets,
and a further 20 countries form our priority growth
markets (see table below). These 22 markets
accounted for over 90% of our profit before tax
in 2013, and are the primary focus of capital
deployment. Network markets are markets with
strong international relevance which serve to
complement our international spread, operating
mainly through Commercial Banking and Global
Banking and Markets. Our combination of home,
priority growth and network markets covers around85-90% of all international trade and financial flows.
The final category, small markets, includes
those where our operations are of sufficient scale to
operate profitably, or markets where we maintain
representative offices.
Our legal entities are regulated by their local
regulators and on a Group-wide basis we are
regulated from the UK by the Prudential Regulation
Authority (‘PRA’) for prudential matters (safety and
soundness) and by the Financial Conduct Authority
(‘FCA’) for conduct (consumer and market protection).
HSBC’s market structure
Home
markets
Hong Kong
and Rest of
Asia-Pacific
• Hong Kong
Europe
Middle East
and North
Africa
North
America
Latin
America
Priority
growth
markets
Network
markets
Small
markets
• UK
• Australia
• Mainland China
• India
• Indonesia
• Malaysia
• Singapore
• Taiwan
• Vietnam
• Operations primarily focused on international clients and businesses of Commercial Banking and Global Banking
and Markets
• Together with home and priority markets these cover 85-90% of international trade and capital flows
• Markets where HSBC has profitable scale and focused operations
• Representative Offices
• France
• Germany
• Switzerland
• Turkey
• Egypt
• Saudi Arabia
• UAE
• Canada
• USA
• Argentina
• Brazil
• Mexico

7/17/2019 Strategic Report 2013
http://slidepdf.com/reader/full/strategic-report-2013 16/54
H S B C H O L D I N G S P L C
Strategic Report (continued) Strategic priority 1 – Grow the business and dividends > Operating model
14
Operating model
Our operating model is based on a matrix
management structure comprising global
businesses, geographical regions and global
functions.
The matrix is overlaid on a legal entity structure
headed by HSBC Holdings plc.
Holding company
HSBC Holdings, the holding company of the
Group, is the primary source of equity capital for
its subsidiaries and provides non-equity capital to
them when necessary.
Under authority delegated by the Board of
HSBC Holdings, the Group Management Board
(‘GMB’) is responsible for the management and day-
to-day running of the Group, within the risk appetite
set by the Board. GMB works to ensure that there
are sufficient cash resources to pay dividends to
shareholders, interest to bondholders, expenses and
taxes.HSBC Holdings does not provide core funding
to any banking subsidiary, nor is a lender of last
resort and does not carry out any banking business
in its own right. Subsidiaries operate as separately
capitalised entities implementing the Group strategy.
Matrix management structure
The following table lists our four global businesses,
six geographical regions and 11 global functions,
and summarises their responsibilities under HSBC’s
matrix structure.
For details of our principal subsidiaries see Note 24 on the
Financial Statements and for a simplified Group structure
chart see page 570 of the Annual Report and Accounts 2013.
Matrix management structure
• Retail Banking andWealth Management
• Commercial Banking
• Global Banking and Markets
• Global Private Banking
Global
businesses
Global
functions
• Communications • Company Secretaries
• Corporate Sustainability
• Finance
• HSBC Technology and Services
• Human Resources
• Internal Audit
• Legal
• Marketing
• Risk (including Compliance)
• Strategy and Planning
Establish and manage all policies,
processes and delivery platforms relevant
to their activities, are fully accountable for
their costs globally and are responsible formanaging their headcount.
Responsible for setting globally consistent
business strategies and operating models,
issuing planning guidance regarding their
businesses, and are accountable for theirprofit and loss performance and for
managing their headcount.
Legal entities
Operate under their own boards of directors as separately capitalised entities, implementing Group strategy and delivering Group products and services.
They are required to consider risk and maintain a capital buffer consistent with the Group’s risk appetite for their relevant country or region. They manage
their own funding and liquidity within parameters set centrally.
HSBC Holdings plc
Geographical
regions
• Europe
• Hong Kong
• Rest of Asia-Pacific
• Middle East and North Africa
• North America
• Latin America
Share responsibility for executing business
strategies set by the global businesses.
They represent the Group to customers,
regulators, employee groups and otherstakeholders; allocate capital; manage
risk appetite, liquidity and funding by legal
entity; and are accountable for profit and
loss performance in line with global
business plans.

7/17/2019 Strategic Report 2013
http://slidepdf.com/reader/full/strategic-report-2013 17/54
15
Global businesses
Our four global businesses are Retail Banking and
Wealth Management (‘RBWM’), Commercial
Banking (‘CMB’), Global Banking and Markets(‘GB&M’) and Global Private Banking (‘GPB’).
They are responsible for developing, implementing
and managing their business propositions
consistently across the Group, focusing on
profitability and efficiency. They set their strategies
within the parameters of the Group strategy in
liaison with the geographical regions, are responsible
for issuing planning guidance regarding their
businesses, are accountable for their profit andloss performance, and manage their headcount.
The main business activities of our global business are
summarised below, and their products and services on page 79of the Annual Report and Accounts 2013.
Main business activities by global business and reported revenue5 in 2013
For footnotes, see page 46.
Investment criteria
Our investment criteria are governed by six filters.
The first two filters – international connectivity and
economic development – determine whether the
business is strategically relevant. The next three
filters – profitability, efficiency and liquidity –
determine whether the financial position of the
business is attractive. The sixth filter – the risk
of financial crime – governs our activities in highrisk jurisdictions, and is applied to protect us by
restricting the scope of our business where
appropriate.
Decisions over where to invest additional
resources have three components:
• Strategic – we will only invest in businesses
aligned to our strategy, mostly in our 22 home
and priority growth markets and in target
businesses and clients;
• Financial – the investment must be value
accretive for the Group, and must meet
minimum returns, revenue and cost hurdles; and
• Risk – the investment must be consistent with
our risk appetite.
Using the six filters in decision-making
RBWM CMB GB M GPB
• Deposits • Account services
• Deposits • Payments and cash
management
• Deposits • Payments and cash
management
• Balance sheetmanagement
• Deposits • Account services
Global
businesses
Liability
driven
• Credit and lending • Credit and lending
• International trade andreceivables finance
• Credit and lending
• Asset and trade finance
• Credit and lendingAsset
driven
• Asset management
• Wealth solutions andfinancial planning
• Broking6
• Life insurance
manufacturing
• Commercial insuranceand investments
• Corporate finance7
• Markets8
• Securities services
• Asset management9
• Financial advisory10
• Broking6
• Corporate finance(via GB&M)7
• Alternative investments11
Fee driven
and other
What is the
strategic
relevance?
Are the current
returns
attractive?
Do we adhere to
global risk standards?
1. Connectivity
2. Economic
development
3. Profitability
4. Efficiency
5. Liquidity
Yes Invest
Turnaround/
improve
Continue
as is
No
Yes
No
High
Medium/low
Discontinue/dispose
Low High
6. Financial crime risk
Risk
mitigation
Risk
mitigation
Risk
mitigation
7/17/2019 Strategic Report 2013
http://slidepdf.com/reader/full/strategic-report-2013 18/54
H S B C H O L D I N G S P L C
Strategic Report (continued) Strategic priority 1 – Grow the business and dividends > Financial performance
16
Financial performance
Performance reflected underlying momentum
in areas of targeted investment
Reported results
2013 2012 2011
US$m US$m US$m
Net interest income .......... 35,539 37,672 40,662
Net fee income ................. 16,434 16,430 17,160
Other income ................... 12,672 14,228 14,458
Net operating income5 .... 64,645 68,330 72,280
LICs12 ............................... (5,849) (8,311) (12,127)
Net operating income .... 58,796 60,019 60,153
Total operating expenses .. (38,556) (42,927) (41,545)
Operating profit ............. 20,240 17,092 18,608
Income from associates13 .. 2,325 3,557 3,264
Profit before tax ............. 22,565 20,649 21,872
For footnotes, see page 46.
Reported profit before tax of US$22.6bn in 2013
was US$1.9bn or 9% higher than in 2012. This was
primarily due to lower adverse fair value movements
of US$4.0bn on own debt designated at fair value
resulting from changes in credit spreads and
decreases in both loan impairment charges and other
credit risk provisions (‘LIC’s) of US$2.5bn andoperating expenses of US$4.4bn. These factors were
partially offset by lower gains (net of losses) from
disposals and reclassifications of US$2.2bn,
compared with US$7.8bn in 2012. Gains on
disposals in 2013 included the gain of US$1.1bn
on sale of our operations in Panama and US$1.1bn
from the reclassification of Industrial Bank Co.
Limited (‘Industrial Bank’) as a financial investment
following its issue of share capital to third parties.
The Board approved a 6% increase in the final
dividend in respect of 2013 to US$0.19 per share,
US$0.01 higher than the final dividend in respect
of 2012. Total dividends in respect of 2013 wereUS$9.2bn (US$0.49 per share), US$0.9bn higher
than in 2012. The core tier 1 capital ratio
strengthened from 12.3% to 13.6%, and the
estimated CRD IV end point basis common equity
tier 1 ratio also improved from 9.5% to 10.9%. This
was driven by a combination of capital generation
and a reduction in risk-weighted assets from
management actions. Uncertainty remains, however,
around the precise amount of capital that banks
will be required to hold under CRD IV as
key technical standards and consultations from
regulatory authorities are pending. These include
the levels, timing and interaction of CRD IV capital
buffers and a review of the Pillar 2 framework.
Underlying performance
For further information on non-GAAP financial measures, see
page 47 of the Annual Report and Accounts 2013.
From reported results to underlying performance
To arrive at underlying performance,
• we adjust for the year-on-year effects of foreign currencytranslation;
• we eliminate the fair value movements on our long-termdebt attributable to credit spread (own credit spread) where
the net result of such movements will be zero upon maturityof the debt; and
• we adjust for acquisitions, disposals and changes ofownership levels of subsidiaries, associates and businesses, by eliminating the gain or loss on disposal in the yearincurred and removing the operating profit or loss of theacquired and disposed of businesses from all years presented.
Reconciliations of our reported results to an underlying basisare provided in the Form 20-F filed with the Securities andExchange Commission which is available on www.hsbc.com.
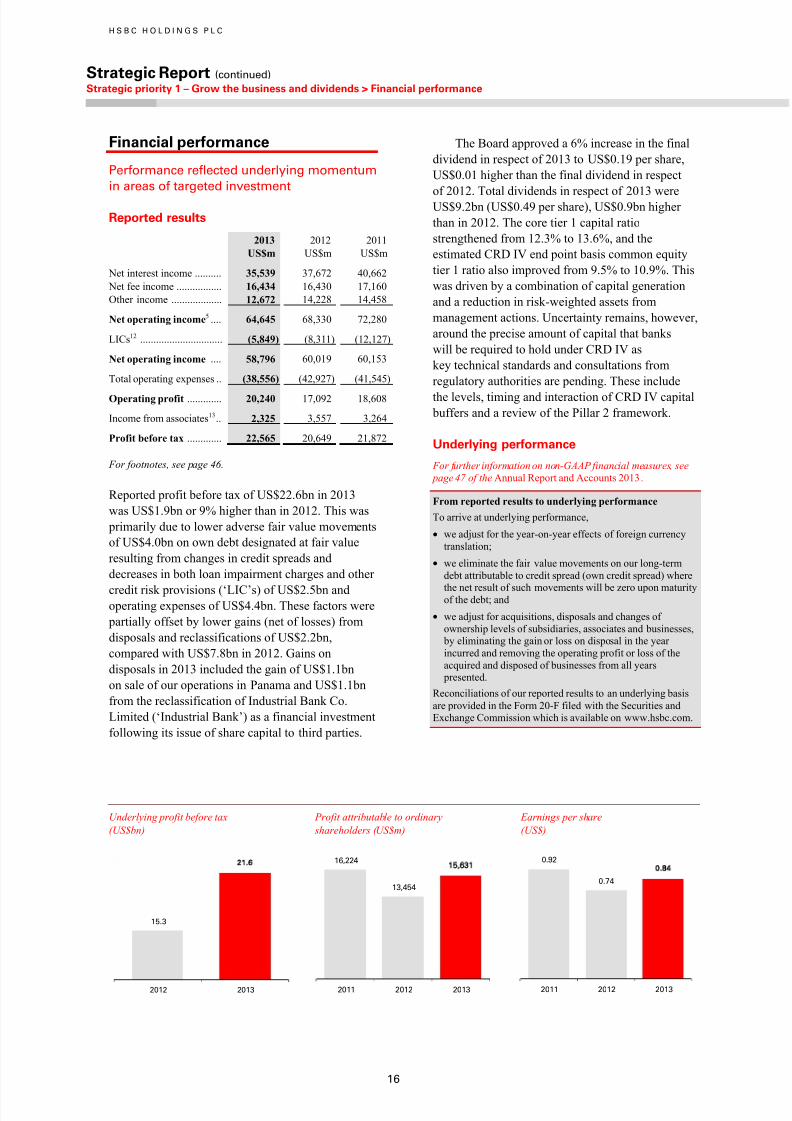
Underlying profit before tax
(US$bn)
Profit attributable to ordinary
shareholders (US$m)
Earnings per share
(US$)
15.3
21.6
2012 2013
16,224
13,454
15,631
2011 2012 2013
0.92
0.74
0 84
2011 2012 2013

7/17/2019 Strategic Report 2013
http://slidepdf.com/reader/full/strategic-report-2013 19/54
17
On an underlying basis, profit before tax rose by 41%
to US$21.6bn, primarily from higher net operating
income before loan impairment charges and other
credit risk provisions (‘revenue’), lower LICs, notablyin North America, Europe and Middle East and North
Africa, and lower operating expenses, mainly from
the non-recurrence of a charge in 2012 arising from
US investigations and reduced charges relating to
UK customer redress.
Underlying profit before tax in our global
businesses rose with the exception of GPB which
decreased by US$0.7bn to US$0.2bn as we continued
to address legacy issues and reposition the customer
base.
The following commentary is on an underlying
basis.
Revenue across the Group was stable,
underpinned by a resilient performance
in GB&M and growth in CMB
Underlying revenue rose by US$1.7bn or 3% to
US$63.3bn. This reflected a number of factors
including net favourable fair value movements on
non-qualifying hedges of US$0.8bn, a net gain
recognised on completion of the disposal of our
investment in Ping An of US$0.6bn offsetting the
adverse fair value movements on the contingent
forward sale contract recorded in 2012, and foreign
exchange gains on sterling debt issued by HSBC
Holdings of US$0.4bn.
Revenue increased in CMB following average
balance sheet growth partly offset by spread
compression together with higher lending fees and
improved collaboration with other global businesses.
In GB&M, revenue was higher, in part reflecting a
resilient performance in a majority of our customer-
facing businesses. These factors were partially offset
by lower revenue in RBWM, primarily from the run-
off of our US CML portfolio and, in GPB, from the
loss on write-off of goodwill relating to our Monaco
business and the repositioning of our client base.
LICs fell in the majority of our regions,
notably in North America, Europe and
in the Middle East and North Africa
Underlying LICs were US$1.9bn or 25% lower
than in 2012, primarily in North America where
the decline was, in part, due to improvements in
housing market conditions, reduced lending balances from continued portfolio run-off and loan sales, and
lower levels of new impaired loans and delinquencyin the CML portfolio. LICs were also lower in
Europe, mainly in GB&M and CMB, and in the
Middle East and North Africa, which benefited
from an overall improvement in the loan portfolio.
By contrast, LICs were higher in Latin America,
particularly in Mexico from specific impairmentsin CMB relating to homebuilders due to a change
in the public housing policy and higher collective
impairments in RBWM. In Brazil, although credit
quality improved following the modification of
credit strategies in previous periods to mitigate
rising delinquency rates, LICs increased, reflecting
impairment model changes and assumption revisions
for restructured loan account portfolios in RBWM
and CMB, and higher specific impairments in CMB.
Operating expenses were lower, primarily
driven by the non-recurrence of certain
notable items in 2012 and furthersustainable cost savings
Underlying operating expenses were US$2.6bn
or 6% less than in 2012, primarily due to the
non-recurrence of a 2012 charge following US
anti-money laundering (‘AML’), Bank Secrecy
Act (‘BSA’) and Office of Foreign Asset Control
(‘OFAC’) investigations, lower UK customer redress
charges and reduced restructuring and related costs.
Excluding these items, operating expenses were
higher, mainly due to a rise in the UK bank levy,
increased litigation-related expenses, notably a provision in respect of regulatory investigations
in GPB, a Madoff-related charge in GB&M and
investment in strategic initiatives, risk management
and compliance. Higher operational costs also
contributed, in part driven by general inflationary
pressures and rental costs. These factors
were partially offset by sustainable cost savings
in the year and an accounting gain relating to
changes in delivering ill-health benefits to certain
employees in the UK.
The additional US$1.5bn of sustainable cost
savings across all regions, took our total annualisedcost savings to US$4.9bn since 2011 as we continued
with our organisational effectiveness programmes
during 2013. Together with business disposals, these
led to a fall in the number of full-time equivalent staff
(‘FTE’s) of more than 6,500 to 254,000.
Income from associates rose, mainly driven
by strong results in mainland China
Underlying income from associates increased,
primarily from Bank of Communications Co.,
Limited (‘BoCom’), where balance sheet growth
and increased fee income were partially offset byhigher operating expenses and a rise in LICs.

7/17/2019 Strategic Report 2013
http://slidepdf.com/reader/full/strategic-report-2013 20/54
H S B C H O L D I N G S P L C
Strategic Report (continued) Strategic priority 1 – Grow the business and dividends > Financial performance
18
The effective tax rate was 21.1% compared
with 25.7% in 2012
The effective tax rate was lower than in 2012,
reflecting non-taxable gains on profits associatedwith the reclassification of Industrial Bank as a
financial investment and the disposal of our
operations in Panama and our investment in Ping An
Insurance (Group) Company of China, Ltd (‘Ping
An’). In addition, the 2012 tax expense included the
non-tax deductible effect of fines and penalties paid
as part of the settlement of the US AML, BSA and
OFAC investigations.
For more details of the Group’s financial performance, see
page 51 of the Annual Report and Accounts 2013.
Balance sheet strengthTotal reported assets were US$2.7 trillion, 1% lower
than at 31 December 2012 on both a reported and a
constant currency basis. Our balance sheet remained
strong with a ratio of customer advances to customer
accounts of 72.9%. This is a consequence of our
business model and of our conservative risk appetite,
which is predominantly to fund the growth in
commercial assets with growth in customer
accounts.
Loans and advances grew by US$87.0bn and
customer accounts increased by US$148.6bn on a
constant currency basis. These included a
US$52.8bn increase in reverse repo agreements anda rise of US$92.3bn in repo agreements, reflecting
the change in the way GB&M manages these
activities (see page 68 of the Annual Report and
Accounts 2013). Excluding these, loans and
advances to customers grew by more than
US$34.0bn in 2013, notably in term and trade-
related lending to corporate and commercial
customers in Hong Kong and Rest of Asia-Pacific
as demand for financing continued and, to a lesser
extent, commercial real estate and other property-
related lending grew. Mortgage lending rose in Rest
of Asia-Pacific, Hong Kong and also in the UK. This
was broadly offset by the strategic reduction in the
US run-off portfolio. Customer accounts increased
by over US$56.0bn in 2013, driven by growth
mainly in Europe, Hong Kong and Rest of Asia-
Pacific reflecting customer sentiment.
For further information on the Balance Sheet, see page 65,
and on the Group’s liquidity and funding, see page 213 of theAnnual Report and Accounts 2013.
Total assets
(US$bn)
Post-tax return on average total assets
(%)
Loans and advances to
customers14 (US$bn)
Customer accounts14
(US$bn)
Ratio of customer advances to customer
deposits (%)
For footnote, see page 46.
2,556
2,6932 671
2011 2012 2013
0.6 0.6
0.7
2011 2012 2013
940
998
1,080
2011 2012 2013
1,254
1,340
1,483
2011 2012 2013
75.074.4
72.9
2011 2012 2013
7/17/2019 Strategic Report 2013
http://slidepdf.com/reader/full/strategic-report-2013 21/54
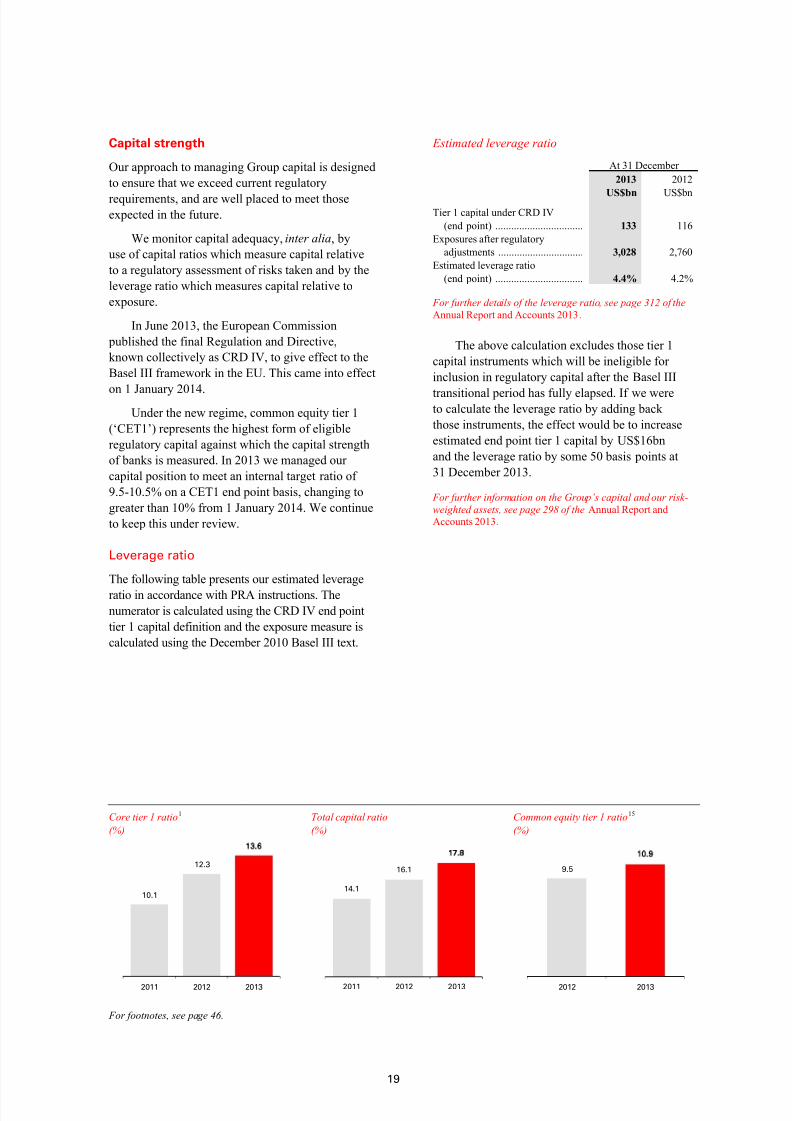
19
Capital strength
Our approach to managing Group capital is designed
to ensure that we exceed current regulatory
requirements, and are well placed to meet thoseexpected in the future.
We monitor capital adequacy, inter alia, by
use of capital ratios which measure capital relative
to a regulatory assessment of risks taken and by the
leverage ratio which measures capital relative to
exposure.
In June 2013, the European Commission
published the final Regulation and Directive,
known collectively as CRD IV, to give effect to the
Basel III framework in the EU. This came into effect
on 1 January 2014.
Under the new regime, common equity tier 1
(‘CET1’) represents the highest form of eligible
regulatory capital against which the capital strength
of banks is measured. In 2013 we managed our
capital position to meet an internal target ratio of
9.5-10.5% on a CET1 end point basis, changing to
greater than 10% from 1 January 2014. We continue
to keep this under review.
Leverage ratio
The following table presents our estimated leverage
ratio in accordance with PRA instructions. The
numerator is calculated using the CRD IV end point
tier 1 capital definition and the exposure measure is
calculated using the December 2010 Basel III text.
Estimated leverage ratio
At 31 December
2013 2012
US$bn US$bnTier 1 capital under CRD IV
(end point) ................................. 133 116
Exposures after regulatory
adjustments ................................ 3,028 2,760
Estimated leverage ratio
(end point) ................................. 4.4% 4.2%
For further details of the leverage ratio, see page 312 of the
Annual Report and Accounts 2013.
The above calculation excludes those tier 1
capital instruments which will be ineligible for
inclusion in regulatory capital after the Basel III
transitional period has fully elapsed. If we wereto calculate the leverage ratio by adding back
those instruments, the effect would be to increase
estimated end point tier 1 capital by US$16bn
and the leverage ratio by some 50 basis points at
31 December 2013.
For further information on the Group’s capital and our risk-
weighted assets, see page 298 of the Annual Report andAccounts 2013.
Core tier 1 ratio1
(%)
Total capital ratio
(%)
Common equity tier 1 ratio15
(%)
For footnotes, see page 46.
10.1
12.3
13.6
2011 2012 2013
14.1
16.1
17.8
2011 2012 2013
9.5
10.9
2012 2013

7/17/2019 Strategic Report 2013
http://slidepdf.com/reader/full/strategic-report-2013 22/54
H S B C H O L D I N G S P L C
Strategic Report (continued) Strategic priority 1 – Grow the business and dividends > Financial performance
20
Meeting our targets
Grow risk-weighted assets in line with our
organic investment criteria
In 2013, the reduction in RWAs was mainly a result
of the reclassification of Industrial Bank from an
associate to a financial investment and the run-off of
the US CML portfolio. We will continue to recycle
RWAs from low to high performing opportunities
within the Group’s risk appetite in line with our
organic investment criteria. Organic investment
decisions are made by GMB under authority
delegated by the Board.
On the basis of current assumptions regarding
the regulatory and the business operating
environment, discretionary RWA growth remainstargeted towards Rest of Asia-Pacific, Hong Kong,
Latin America and Middle East and North Africa.
Discretionary RWA growth excludes the effect of
legacy and run-off portfolios, transactions, associates
and major regulatory changes.
Return on risk-weighted assets (‘RoRWA’), as
measured by pre-tax return on average risk-weighted
assets, is one of the main operational measures by
which we assess business performance and organic
investment opportunities. RoRWA targets are set to
ensure that business decisions remain aligned with
our medium-to-longer term financial performanceobjectives.
Progressively grow dividends and introduce
share buy-backs as appropriate
We remain one of the best-capitalised banks in the
world, providing capacity for both organic growth
and dividend return to shareholders. Over the past
two years we have increased our dividend per
ordinary share by 20%.
Although significant regulatory uncertainty
remains, we continue to demonstrate our ability to
generate capital and support a progressive dividend
policy based on our three key strategic priorities of
growing the business and dividends, implementing
Global Standards and streamlining processes and
procedures.Our policy on share buy-backs will be strongly
influenced by the emerging requirements for capital
by regulators. In order to give ourselves the full
range of options, we will seek to table a resolution at
our 2014 Annual General Meeting for shareholders
to enable share buybacks at a future date.
Uncertainty remains around the amount of
capital that banks will be required to hold as
key technical standards and consultations from
regulatory authorities are pending. These include
the levels, timing and interaction of CRD IV capital
buffers and a review of the Pillar 2 framework.
As more information becomes available, this will
inform our capital target, planning and dividend
policy.
Reduce the effect of legacy and non-strategic
activities on our profit before tax and RWAs
We continue to make good progress reshaping our
business, announcing 20 transactions disposing of or
closing non-strategic businesses in 2013, bringing
the total number since the start of 2011 to 63. These
transactions have released around US$90bn in risk
weighted-assets to date, with a further potential
release of around US$5bn to come.
In 2013, in addition to the reclassification of
Industrial Bank, we completed the sale of our
Panama operations and, in the US CML portfolio,
the sale of the non-real estate loan portfolio together
with several tranches of real estate loans. We expect
the ongoing recovery of the US housing market and
increased investor appetite may provide further
opportunities to accelerate the run-off of our CML
portfolio in 2014, following significant RWA
reductions in 2013.
Risk-weighted assets (US$bn) Return on risk-weighted assets (%) Dividend payout ratio (%)
1,210
1,124
1,093
2011 2012 2013
1.91.8
2.0
2011 2012 2013
42.4
55.4 57.1
2011 2012 2013

7/17/2019 Strategic Report 2013
http://slidepdf.com/reader/full/strategic-report-2013 23/54
21
We continue to actively manage down legacy
RWA positions in GB&M. In 2013, increased
disposals and amortisations contributed to the
reduction in legacy RWA positions in GB&M.
Run-off portfolios’ contribution to RWAs (US$bn)
Run-off portfolios consist of legacy credit in
GB&M and the US CML and other portfolios.
Brand value
Maintenance of the HSBC brand and our overall
reputation remains a priority for the Group.
We continue to use the Brand Finance valuation
method as reported in The Banker magazine as
our core metric. This is our third year of using
this benchmark. The Brand Finance methodology
provides a comprehensive measure of the strengthof the brand and its impact across all business lines
and customer segments. It is wholly independent and
is publicly reported. Our target is a top three position
in the banking peer group and we have achieved this
target with an overall value of US$26.9bn (up 18%
from 2013), placing us second. We are the only
company to be given an AAA rating for our brand
in this year’s report.
Brand value (US$bn)
In addition to the Brand Finance measure, we
have reviewed our performance in two other rating
agency evaluations that receive substantial public
coverage. In the Brand Z Most Valuable Global
Brand tables published in the Financial Times
in May 2013, we achieved first place in the
International Banks peer grouping with a valuationof US$24bn (up 24% from 2012). The Interbrand
Annual Best Global Brands report, published in
September 2013, showed HSBC as the top ranked
banking brand with a valuation of US$12bn (up 7%
from 2012) and in second place when all financial
services brands are considered.
We believe this performance is driven by
an underlying strong brand equity established in
recent years and a consistent and active programme
of activities in support of the brand throughout 2013.
Economic contributionBy running a sustainable business, HSBC is able
to make a valuable contribution to the economy by
paying dividends to our shareholders; salaries to our
employees; payments to suppliers; and tax revenues
to governments in the countries and territories where
we operate. We also finance companies so that they,
in turn, can create employment.
HSBC has adopted the UK Code of Practice for
the Taxation of Banks and seeks to apply the spirit
as well as the letter of the law in all the territories
in which we operate. In January 2013, the Global
Standards Steering Meeting of the GMB agreed
terms of a new Global Standard on ‘tax transparency’
to ensure that HSBC’s banking services are not
associated with any arrangements that are known
or suspected to be designed to facilitate tax evasion
by a customer.
This supplements anti-money laundering and
‘know your customer’ (‘KYC’) checks and is
supported by an educational programme to train
employees on how to identify possible tax evasion
by customers and the procedures for reporting and
escalating such situations.
HSBC’s net tax paid
2013 2012
US$bn US$bn
Tax on profits .............................. 4.7 5.6
Employer taxes ............................ 1.6 1.6
UK bank levy16 ............................ 0.7 0.5
Irrecoverable value-added tax ..... 0.8 0.8
Other duties and levies ................ 0.8 0.8
8.6 9.3
For footnote, see page 46.
182
146
105
2011 2012 2013
27.6
22.9
26.9
Feb 2012 Feb 2013 Feb 2014
1stplace
3rdplace
2nd
place
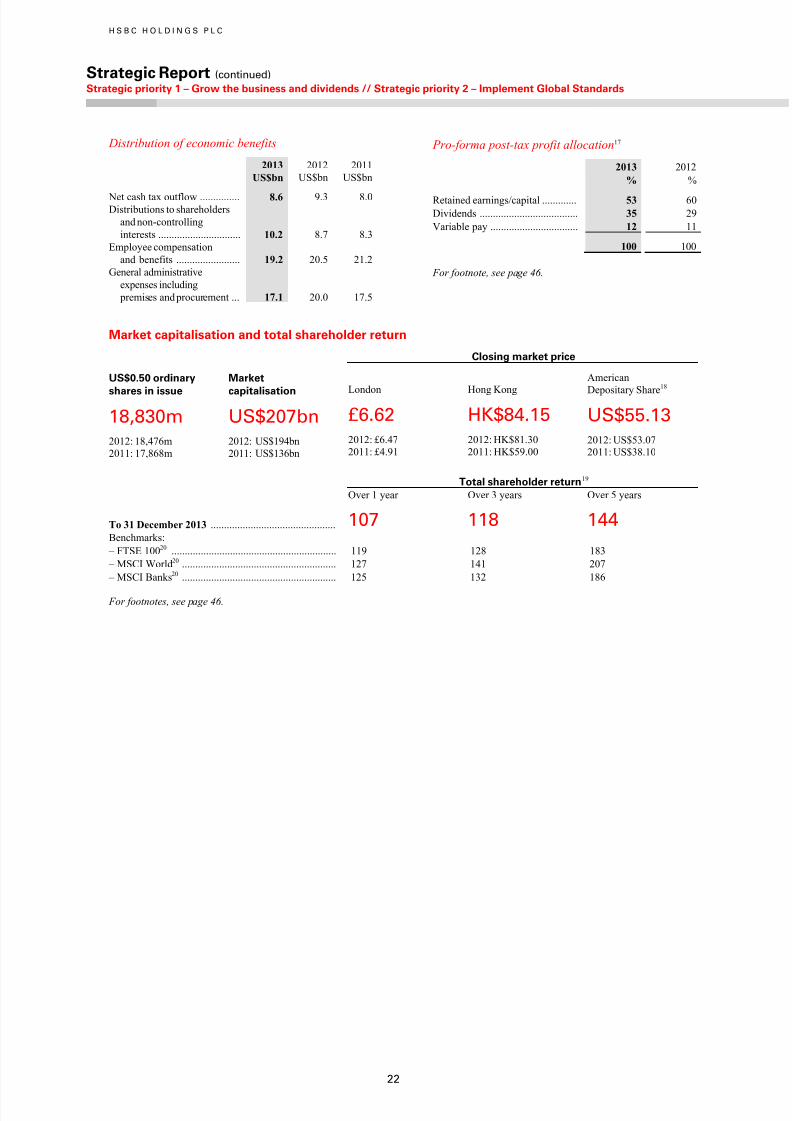
7/17/2019 Strategic Report 2013
http://slidepdf.com/reader/full/strategic-report-2013 24/54
H S B C H O L D I N G S P L C
Strategic Report (continued) Strategic priority 1 – Grow the business and dividends // Strategic priority 2 – Implement Global Standards
22
Distribution of economic benefits
2013 2012 2011 US$bn US$bn US$bn
Net cash tax outflow ............... 8.6 9.3 8.0Distributions to shareholders
and non-controlling
interests ............................... 10.2 8.7 8.3
Employee compensation
and benefits ........................ 19.2 20.5 21.2
General administrative
expenses including
premises and procurement ... 17.1 20.0 17.5
Pro-forma post-tax profit allocation17
2013 2012
% %
Retained earnings/capital ............. 53 60
Dividends ..................................... 35 29
Variable pay ................................. 12 11
100 100
For footnote, see page 46.
Market capitalisation and total shareholder return
Closing market price
US$0.50 ordinary
shares in issue
18,830m
2012: 18,476m2011: 17,868m
Market
capitalisation
US$207bn
2012: US$194bn2011: US$136bn
London
£6.62
2012: £6.472011: £4.91
Hong Kong
HK$84.15
2012: HK$81.302011: HK$59.00
American
Depositary Share18
US$55.13
2012: US$53.072011: US$38.10
Total shareholder return19
Over 1 year Over 3 years Over 5 years
To 31 December 2013 ............................................... 107 118 144Benchmarks:
– FTSE 10020 .............................................................. 119 128 183
– MSCI World20 .......................................................... 127 141 207
– MSCI Banks20 .......................................................... 125 132 186
For footnotes, see page 46.
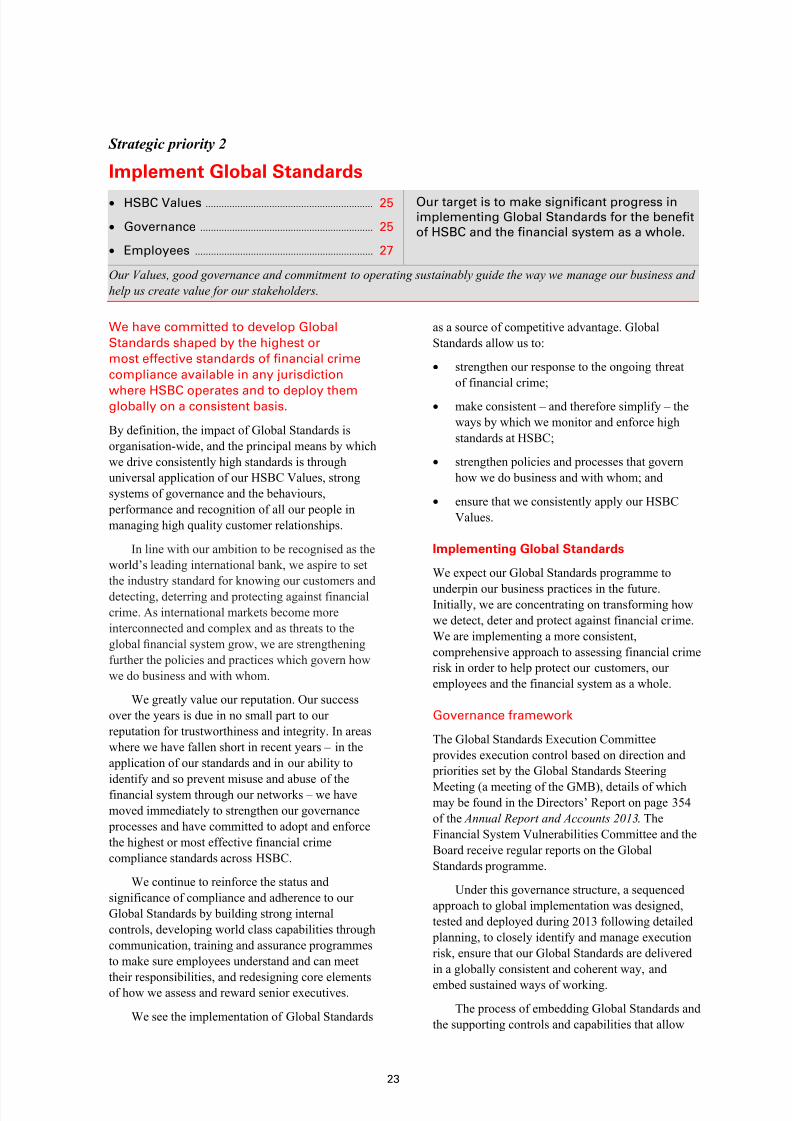
7/17/2019 Strategic Report 2013
http://slidepdf.com/reader/full/strategic-report-2013 25/54
23
Strategic priority 2
Implement Global Standards
•
HSBC Values ............................................................... 25
• Governance ................................................................. 25
• Employees ................................................................... 27
Our target is to make significant progress inimplementing Global Standards for the benefit
of HSBC and the financial system as a whole.
Our Values, good governance and commitment to operating sustainably guide the way we manage our business and
help us create value for our stakeholders.
We have committed to develop Global
Standards shaped by the highest or
most effective standards of financial crime
compliance available in any jurisdiction
where HSBC operates and to deploy themglobally on a consistent basis.
By definition, the impact of Global Standards is
organisation-wide, and the principal means by which
we drive consistently high standards is through
universal application of our HSBC Values, strong
systems of governance and the behaviours,
performance and recognition of all our people in
managing high quality customer relationships.
In line with our ambition to be recognised as the
world’s leading international bank, we aspire to set
the industry standard for knowing our customers and
detecting, deterring and protecting against financial
crime. As international markets become more
interconnected and complex and as threats to the
global financial system grow, we are strengthening
further the policies and practices which govern how
we do business and with whom.
We greatly value our reputation. Our success
over the years is due in no small part to our
reputation for trustworthiness and integrity. In areas
where we have fallen short in recent years – in the
application of our standards and in our ability to
identify and so prevent misuse and abuse of thefinancial system through our networks – we have
moved immediately to strengthen our governance
processes and have committed to adopt and enforce
the highest or most effective financial crime
compliance standards across HSBC.
We continue to reinforce the status and
significance of compliance and adherence to our
Global Standards by building strong internal
controls, developing world class capabilities through
communication, training and assurance programmes
to make sure employees understand and can meet
their responsibilities, and redesigning core elementsof how we assess and reward senior executives.
We see the implementation of Global Standards
as a source of competitive advantage. Global
Standards allow us to:
• strengthen our response to the ongoing threat
of financial crime;
• make consistent – and therefore simplify – the
ways by which we monitor and enforce high
standards at HSBC;
• strengthen policies and processes that govern
how we do business and with whom; and
• ensure that we consistently apply our HSBC
Values.
Implementing Global Standards
We expect our Global Standards programme to
underpin our business practices in the future.Initially, we are concentrating on transforming how
we detect, deter and protect against financial crime.
We are implementing a more consistent,
comprehensive approach to assessing financial crime
risk in order to help protect our customers, our
employees and the financial system as a whole.
Governance framework
The Global Standards Execution Committee
provides execution control based on direction and
priorities set by the Global Standards Steering
Meeting (a meeting of the GMB), details of whichmay be found in the Directors’ Report on page 354
of the Annual Report and Accounts 2013. The
Financial System Vulnerabilities Committee and the
Board receive regular reports on the Global
Standards programme.
Under this governance structure, a sequenced
approach to global implementation was designed,
tested and deployed during 2013 following detailed
planning, to closely identify and manage execution
risk, ensure that our Global Standards are delivered
in a globally consistent and coherent way, and
embed sustained ways of working.
The process of embedding Global Standards and
the supporting controls and capabilities that allow

7/17/2019 Strategic Report 2013
http://slidepdf.com/reader/full/strategic-report-2013 26/54
H S B C H O L D I N G S P L C
Strategic Report (continued) Strategic priority 2 – Implement Global Standards > HSBC Values / Governance
24
the business to identify and mitigate financial crime
risk is underway and will continue in 2014 and
beyond. The implementation programme is focused
on the following four areas:• data readiness: creating a complete, cleansed
data set to improve our understanding of the
customer base and facilitate our financial crime
risk assessment. This will provide the basis
for transaction monitoring and assist capacity
planning to improve the quality and efficiency
of our KYC activities.
• customer due diligence: strengthening the rigour
with which we research and evaluate our
customers and affiliates to better understand
them and their activities; improving KYC
profiling through enhanced due diligence,
customer identification, screening and financial
crime risk scoring; tightening our controls
around tax transparency and bearer shares and
putting a global customer selection and exit
policy in place.
• financial crime compliance: building HSBC’s
Financial Crime Compliance organisation with
the right people and capabilities to support the
business; developing global policies for anti-
money laundering (‘AML’), sanctions and
anti-bribery and corruption and enhancing the
monitoring, screening and testing that will
allow us to manage financial crime risk more
effectively; and designing a new, annual HSBC-
wide risk assessment to better understand the
financial crime risk we carry in the business and
determine the best approach to managing it.
• financial intelligence: establishing a new global
network of Financial Intelligence Units that
use cutting edge technology to identify and
investigate significant cases, trends and strategic
issues related to financial crime risks.
Changes in day-to-day activities
Risk appetite
Our global Financial Crime Risk Appetite statement
was approved by the Board in October 2013 on the
recommendation of the Risk Management Meeting
of the GMB, the Group Risk Committee and the
Financial System Vulnerabilities Committee. It was
incorporated into the Risk Management Meeting’s
process monitoring from November 2013. The
statement sets the Global Standard for financial
crime compliance across HSBC, and is expected to
evolve and be refined over time.
Enterprise-wide risk assessment
We completed enterprise-wide assessments of our
risks relating to sanctions and AML compliance. The
outcome of these assessments is the basis for riskmanagement planning, prioritisation and resource
allocation for 2014. In the future, we shall conduct
such assessments annually.
Incentives
We adapted our remuneration strategy to balance
short-term and sustainable performance. It rewards
commercial success and compliance with our risk
management framework.
Organisation
We continued to significantly reinforce our second
line of defence (described on page 39) through an
increase in Regulatory and Financial Crime
Compliance headcount of more than 1,750 in 2013
(up by more than 50% since December 2012).
We are raising awareness and capabilities
among our employees through a comprehensive
global campaign to ‘Ask the Right Questions’.
The Monitor
Under the agreements entered into with the US
Department of Justice (‘DoJ’), the UK Financial
Conduct Authority (‘the FCA’, formerly the FSA)
and the US Federal Reserve Board (‘FRB’) in 2012,
including the five-year Deferred Prosecution
Agreement (‘US DPA’), it was agreed that an
independent compliance monitor (‘the Monitor’)
would be appointed to evaluate our progress in fully
implementing our obligations and produce regular
assessments of the effectiveness of our Compliance
function.
Michael Cherkasky began his work as the
Monitor on 22 July 2013, charged with evaluating
and reporting upon the effectiveness of the Group’s
internal controls, policies and procedures as they
relate to ongoing compliance with applicable AML,
sanctions, terrorist financing and proliferation
financing obligations, over a five-year period. The
Monitor’s work is proceeding as anticipated,
consistent with the timelines and requirements set
forth in the relevant agreements.
HSBC is taking concerted action to remediate
AML and sanctions compliance deficiencies and to
implement Global Standards. We recognise we are
only at the start of a long journey, beingone year into our US DPA. We look forward to
maintaining a strong, collaborative relationship
with the Monitor and his team.
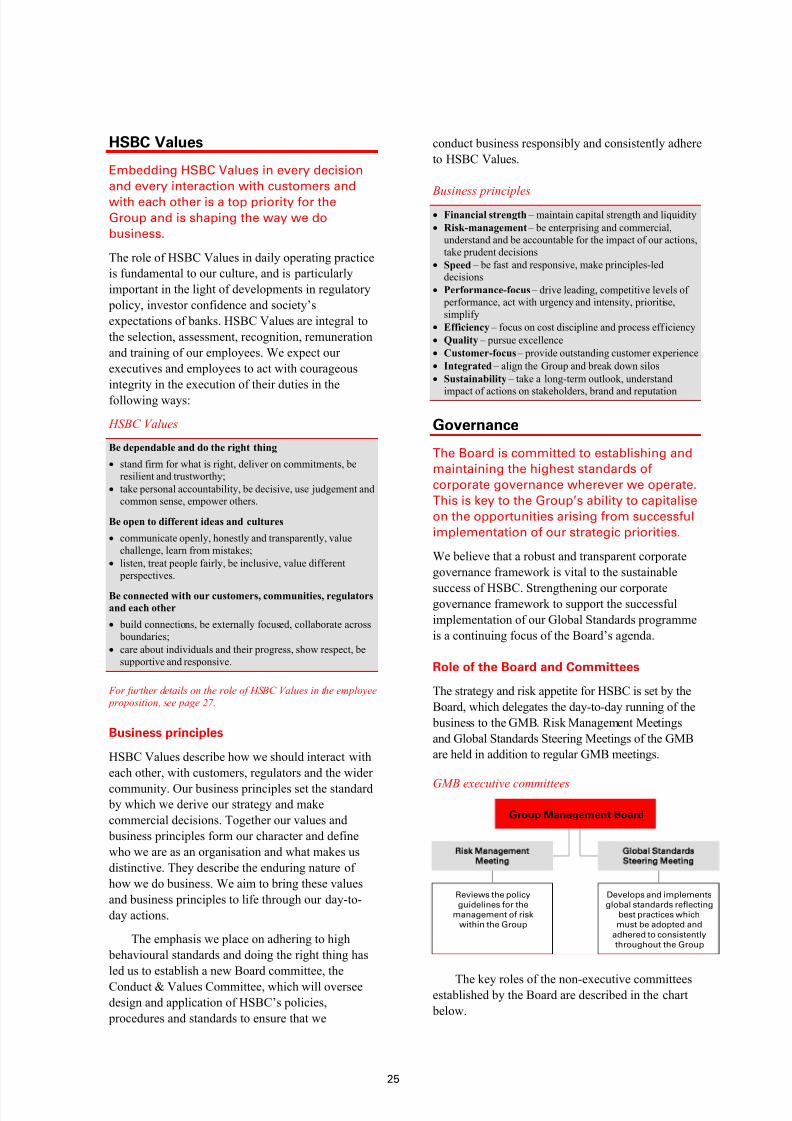
7/17/2019 Strategic Report 2013
http://slidepdf.com/reader/full/strategic-report-2013 27/54
25
HSBC Values
Embedding HSBC Values in every decision
and every interaction with customers and
with each other is a top priority for the
Group and is shaping the way we do
business.
The role of HSBC Values in daily operating practice
is fundamental to our culture, and is particularly
important in the light of developments in regulatory
policy, investor confidence and society’s
expectations of banks. HSBC Values are integral to
the selection, assessment, recognition, remuneration
and training of our employees. We expect our
executives and employees to act with courageous
integrity in the execution of their duties in the
following ways:
HSBC Values
Be dependable and do the right thing
• stand firm for what is right, deliver on commitments, beresilient and trustworthy;
• take personal accountability, be decisive, use judgement andcommon sense, empower others.
Be open to different ideas and cultures
• communicate openly, honestly and transparently, valuechallenge, learn from mistakes;
• listen, treat people fairly, be inclusive, value different perspectives.
Be connected with our customers, communities, regulators
and each other
• build connections, be externally focused, collaborate across boundaries;
• care about individuals and their progress, show respect, besupportive and responsive.
For further details on the role of HSBC Values in the employee
proposition, see page 27.
Business principles
HSBC Values describe how we should interact with
each other, with customers, regulators and the wider
community. Our business principles set the standard by which we derive our strategy and make
commercial decisions. Together our values and
business principles form our character and define
who we are as an organisation and what makes us
distinctive. They describe the enduring nature of
how we do business. We aim to bring these values
and business principles to life through our day-to-
day actions.
The emphasis we place on adhering to high
behavioural standards and doing the right thing has
led us to establish a new Board committee, the
Conduct & Values Committee, which will oversee
design and application of HSBC’s policies,
procedures and standards to ensure that we
conduct business responsibly and consistently adhere
to HSBC Values.
Business principles• Financial strength – maintain capital strength and liquidity
• Risk-management – be enterprising and commercial,understand and be accountable for the impact of our actions,take prudent decisions
• Speed – be fast and responsive, make principles-leddecisions
• Performance-focus – drive leading, competitive levels of performance, act with urgency and intensity, prioritise,simplify
• Efficiency – focus on cost discipline and process efficiency
• Quality – pursue excellence
• Customer-focus – provide outstanding customer experience
• Integrated – align the Group and break down silos
• Sustainability – take a long-term outlook, understand
impact of actions on stakeholders, brand and reputation
Governance
The Board is committed to establishing and
maintaining the highest standards of
corporate governance wherever we operate.
This is key to the Group’s ability to capitalise
on the opportunities arising from successful
implementation of our strategic priorities.
We believe that a robust and transparent corporate
governance framework is vital to the sustainable
success of HSBC. Strengthening our corporategovernance framework to support the successful
implementation of our Global Standards programme
is a continuing focus of the Board’s agenda.
Role of the Board and Committees
The strategy and risk appetite for HSBC is set by the
Board, which delegates the day-to-day running of the
business to the GMB. Risk Management Meetings
and Global Standards Steering Meetings of the GMB
are held in addition to regular GMB meetings.
GMB executive committees1
The key roles of the non-executive committeesestablished by the Board are described in the chart
below.
Reviews the policyguidelines for the
management of riskwithin the Group
Develops and implementsglobal standards reflecting
best practices whichmust be adopted and
adhered to consistentlythroughout the Group
Group Management Board
Risk Management
Meeting
Global Standards
Steering Meeting
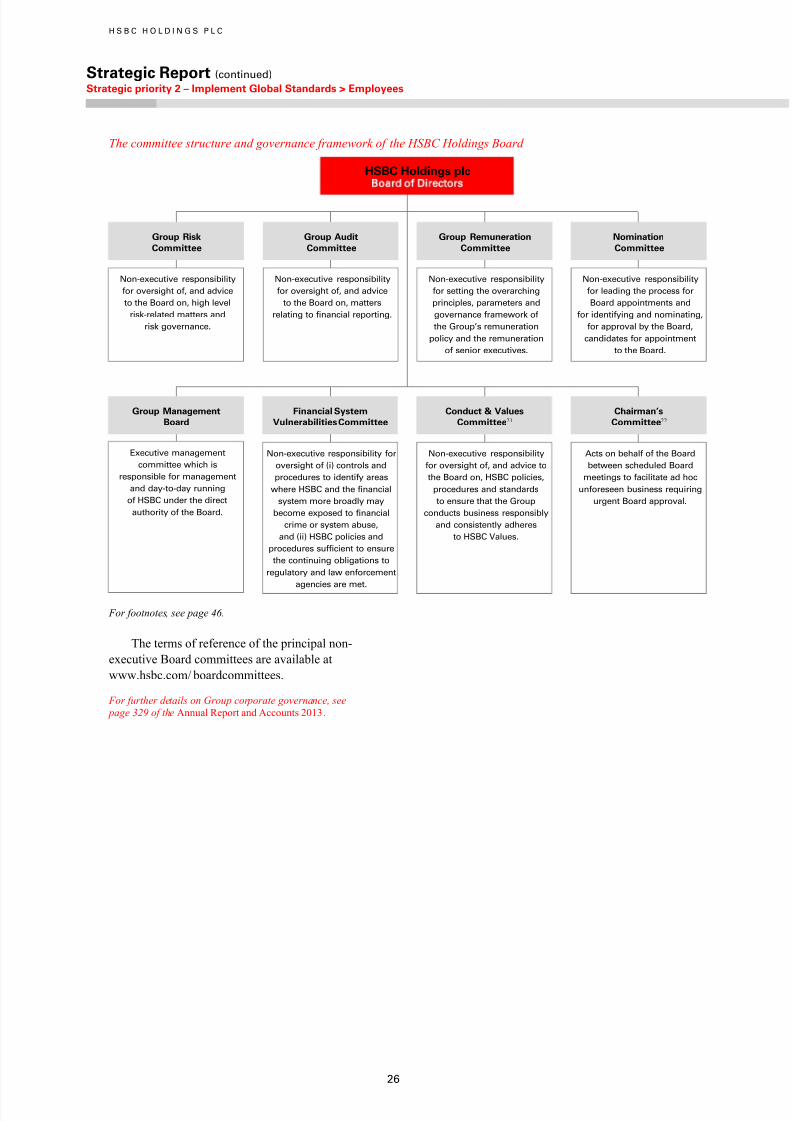
7/17/2019 Strategic Report 2013
http://slidepdf.com/reader/full/strategic-report-2013 28/54
H S B C H O L D I N G S P L C
Strategic Report (continued) Strategic priority 2 – Implement Global Standards > Employees
26
The committee structure and governance framework of the HSBC Holdings Board
For footnotes, see page 46.
The terms of reference of the principal non-
executive Board committees are available at
www.hsbc.com/ boardcommittees.
For further details on Group corporate governance, see
page 329 of the Annual Report and Accounts 2013.
Executive management
committee which is
responsible for management
and day-to-day running
of HSBC under the direct
authority of the Board.
Group Management
Board
Financial System
Vulnerabilities Committee
Chairman’s
Committee22Conduct & Values
Committee21
Non-executive responsibility for
oversight of (i) controls and
procedures to identify areas
where HSBC and the financial
system more broadly may
become exposed to financial
crime or system abuse,
and (ii) HSBC policies and
procedures sufficient to ensure
the continuing obligations to
regulatory and law enforcement
agencies are met.
Acts on behalf of the Board
between scheduled Board
meetings to facilitate ad hoc
unforeseen business requiring
urgent Board approval.
Non-executive responsibility
for oversight of, and advice to
the Board on, HSBC policies,
procedures and standards
to ensure that the Group
conducts business responsibly
and consistently adheres
to HSBC Values.
HSBC Holdings plcBoard of Directors
Group Audit
Committee
Group Remuneration
Committee
Group Risk
Committee
Nomination
Committee
Non-executive responsibility
for leading the process for
Board appointments and
for identifying and nominating,
for approval by the Board,
candidates for appointment
to the Board.
Non-executive responsibility
for oversight of, and advice
to the Board on, matters
relating to financial reporting.
Non-executive responsibility
for oversight of, and advice
to the Board on, high level
risk-related matters and
risk governance.
Non-executive responsibility
for setting the overarching
principles, parameters and
governance framework of
the Group’s remuneration
policy and the remuneration
of senior executives.
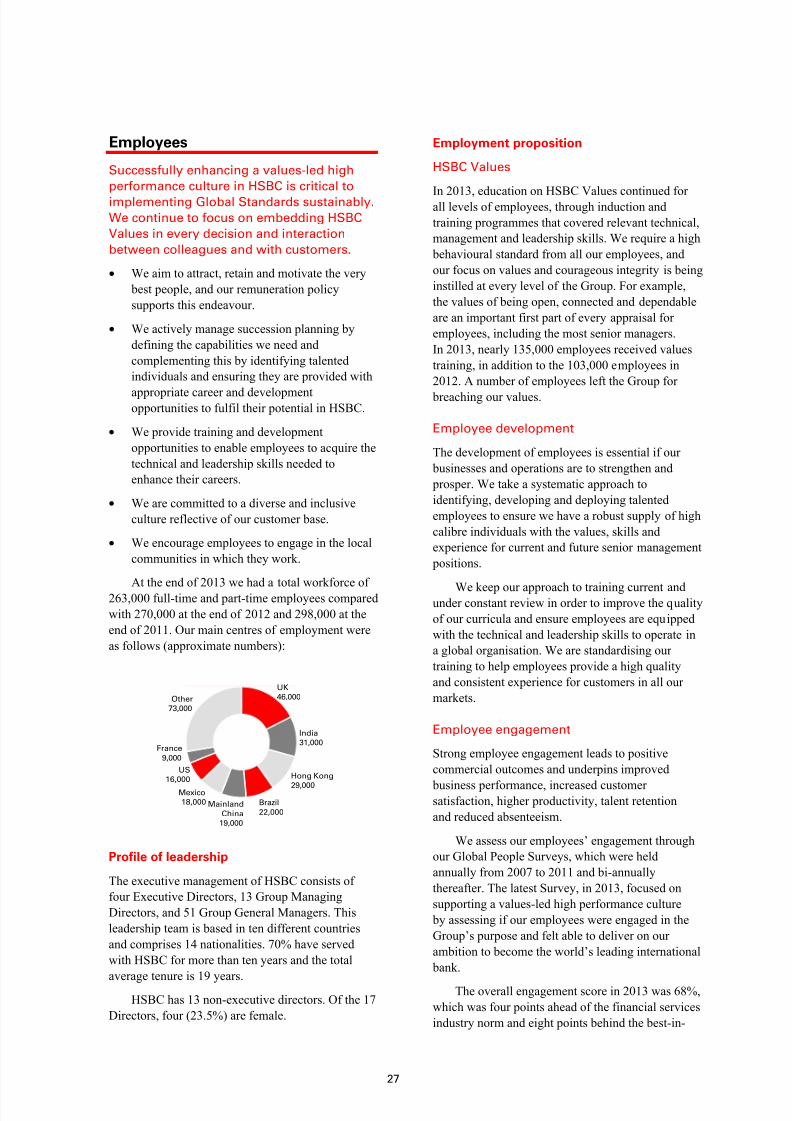
7/17/2019 Strategic Report 2013
http://slidepdf.com/reader/full/strategic-report-2013 29/54
27
Employees
Successfully enhancing a values-led high
performance culture in HSBC is critical to
implementing Global Standards sustainably.
We continue to focus on embedding HSBC
Values in every decision and interaction
between colleagues and with customers.
• We aim to attract, retain and motivate the very
best people, and our remuneration policy
supports this endeavour.
• We actively manage succession planning by
defining the capabilities we need and
complementing this by identifying talented
individuals and ensuring they are provided with
appropriate career and developmentopportunities to fulfil their potential in HSBC.
• We provide training and development
opportunities to enable employees to acquire the
technical and leadership skills needed to
enhance their careers.
• We are committed to a diverse and inclusive
culture reflective of our customer base.
• We encourage employees to engage in the local
communities in which they work.
At the end of 2013 we had a total workforce of263,000 full-time and part-time employees compared
with 270,000 at the end of 2012 and 298,000 at the
end of 2011. Our main centres of employment were
as follows (approximate numbers):
Profile of leadership
The executive management of HSBC consists of
four Executive Directors, 13 Group Managing
Directors, and 51 Group General Managers. This
leadership team is based in ten different countries
and comprises 14 nationalities. 70% have served
with HSBC for more than ten years and the total
average tenure is 19 years.HSBC has 13 non-executive directors. Of the 17
Directors, four (23.5%) are female.
Employment proposition
HSBC Values
In 2013, education on HSBC Values continued forall levels of employees, through induction and
training programmes that covered relevant technical,
management and leadership skills. We require a high
behavioural standard from all our employees, and
our focus on values and courageous integrity is being
instilled at every level of the Group. For example,
the values of being open, connected and dependable
are an important first part of every appraisal for
employees, including the most senior managers.
In 2013, nearly 135,000 employees received values
training, in addition to the 103,000 employees in
2012. A number of employees left the Group for
breaching our values.
Employee development
The development of employees is essential if our
businesses and operations are to strengthen and
prosper. We take a systematic approach to
identifying, developing and deploying talented
employees to ensure we have a robust supply of high
calibre individuals with the values, skills and
experience for current and future senior management
positions.
We keep our approach to training current andunder constant review in order to improve the quality
of our curricula and ensure employees are equipped
with the technical and leadership skills to operate in
a global organisation. We are standardising our
training to help employees provide a high quality
and consistent experience for customers in all our
markets.
Employee engagement
Strong employee engagement leads to positive
commercial outcomes and underpins improved
business performance, increased customersatisfaction, higher productivity, talent retention
and reduced absenteeism.
We assess our employees’ engagement through
our Global People Surveys, which were held
annually from 2007 to 2011 and bi-annually
thereafter. The latest Survey, in 2013, focused on
supporting a values-led high performance culture
by assessing if our employees were engaged in the
Group’s purpose and felt able to deliver on our
ambition to become the world’s leading international
bank.
The overall engagement score in 2013 was 68%,
which was four points ahead of the financial services
industry norm and eight points behind the best-in-
UK46,000
India31,000
Hong Kong
29,000
Brazil
22,000Mainland
China19,000
Mexico18,000
US16,000
France
9,000
Other73,000
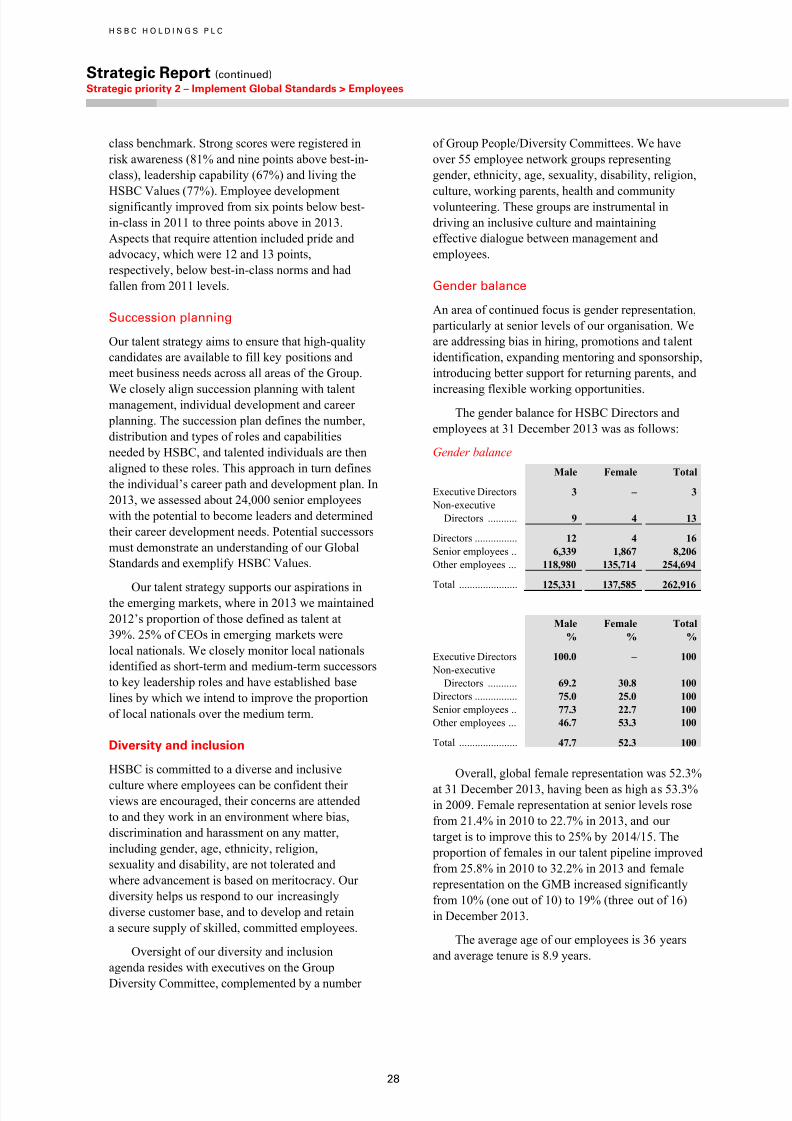
7/17/2019 Strategic Report 2013
http://slidepdf.com/reader/full/strategic-report-2013 30/54
H S B C H O L D I N G S P L C
Strategic Report (continued) Strategic priority 2 – Implement Global Standards > Employees
28
class benchmark. Strong scores were registered in
risk awareness (81% and nine points above best-in-
class), leadership capability (67%) and living the
HSBC Values (77%). Employee developmentsignificantly improved from six points below best-
in-class in 2011 to three points above in 2013.
Aspects that require attention included pride and
advocacy, which were 12 and 13 points,
respectively, below best-in-class norms and had
fallen from 2011 levels.
Succession planning
Our talent strategy aims to ensure that high-quality
candidates are available to fill key positions and
meet business needs across all areas of the Group.
We closely align succession planning with talentmanagement, individual development and career
planning. The succession plan defines the number,
distribution and types of roles and capabilities
needed by HSBC, and talented individuals are then
aligned to these roles. This approach in turn defines
the individual’s career path and development plan. In
2013, we assessed about 24,000 senior employees
with the potential to become leaders and determined
their career development needs. Potential successors
must demonstrate an understanding of our Global
Standards and exemplify HSBC Values.
Our talent strategy supports our aspirations inthe emerging markets, where in 2013 we maintained
2012’s proportion of those defined as talent at
39%. 25% of CEOs in emerging markets were
local nationals. We closely monitor local nationals
identified as short-term and medium-term successors
to key leadership roles and have established base
lines by which we intend to improve the proportion
of local nationals over the medium term.
Diversity and inclusion
HSBC is committed to a diverse and inclusive
culture where employees can be confident theirviews are encouraged, their concerns are attended
to and they work in an environment where bias,
discrimination and harassment on any matter,
including gender, age, ethnicity, religion,
sexuality and disability, are not tolerated and
where advancement is based on meritocracy. Our
diversity helps us respond to our increasingly
diverse customer base, and to develop and retain
a secure supply of skilled, committed employees.
Oversight of our diversity and inclusion
agenda resides with executives on the Group
Diversity Committee, complemented by a number
of Group People/Diversity Committees. We have
over 55 employee network groups representing
gender, ethnicity, age, sexuality, disability, religion,
culture, working parents, health and communityvolunteering. These groups are instrumental in
driving an inclusive culture and maintaining
effective dialogue between management and
employees.
Gender balance
An area of continued focus is gender representation,
particularly at senior levels of our organisation. We
are addressing bias in hiring, promotions and talent
identification, expanding mentoring and sponsorship,
introducing better support for returning parents, and
increasing flexible working opportunities.
The gender balance for HSBC Directors and
employees at 31 December 2013 was as follows:
Gender balance
Male Female Total
Executive Directors 3 – 3
Non-executive
Directors ........... 9 4 13
Directors ................ 12 4 16
Senior employees .. 6,339 1,867 8,206
Other employees ... 118,980 135,714 254,694
Total ...................... 125,331 137,585 262,916
Male Female Total
% % %
Executive Directors 100.0 – 100
Non-executive
Directors ........... 69.2 30.8 100
Directors ................ 75.0 25.0 100
Senior employees .. 77.3 22.7 100
Other employees ... 46.7 53.3 100
Total ...................... 47.7 52.3 100
Overall, global female representation was 52.3%
at 31 December 2013, having been as high as 53.3%
in 2009. Female representation at senior levels rose
from 21.4% in 2010 to 22.7% in 2013, and our
target is to improve this to 25% by 2014/15. The
proportion of females in our talent pipeline improved
from 25.8% in 2010 to 32.2% in 2013 and female
representation on the GMB increased significantly
from 10% (one out of 10) to 19% (three out of 16)
in December 2013.
The average age of our employees is 36 years
and average tenure is 8.9 years.

7/17/2019 Strategic Report 2013
http://slidepdf.com/reader/full/strategic-report-2013 31/54
29
Unconscious bias
It is recognised that social behaviour may be driven
by stereotypes that operate automatically and
therefore unconsciously. These stereotypes can leadto a less inclusive environment. We are addressing
this through ‘unconscious bias’ training which was
delivered through e-learning to 8,300 managers and
nearly 50,000 employees in 2013 (21,000 managers
and 8,000 employees in 2012).
In 2014, our diversity and inclusion priorities
will include continuing to address unconscious bias
through targeted education, encouraging the career
development of diverse talent with an emphasis on
gender and local nationals, enhancing a bias-free
approach to performance management and
improving internal and external candidate lists,
connecting and leveraging our Employee Resource
Network Groups, and maintaining a consistent
framework for governance and sponsorship.
Health, welfare and safety
We regard the physical and psychological health,
welfare and safety of our people as being of the
utmost importance. We recently introduced a global
occupational health framework which requires the
proactive management of employee welfare and
encourages the sharing of best practice across the
Group. Between August 2012 and the end of 2013,
94% of assigned HSBC employees carried out our
bi-annual online health and safety training.
We run a number of employee assistance
programmes tailored to local requirements. Skilled
professional counsellors are available on free phone
lines 24 hours a day and seven days a week to
help employees manage personal or work-related
problems that create stress and affect their work.
Free face-to-face counselling is also provided, as is
support for partners and dependents. Programmes
are offered in the UK, Hong Kong, North America
and India.
Whistleblowing
The HSBC Group operates a global Compliance
Disclosure Line (telephone and email) which is
available to allow employees to make disclosureswhen the normal channels for airing grievances or
concerns are unavailable or inappropriate.
The Compliance Disclosure Line is available to
capture employee concerns on a number of matters,
including breaches of law or regulation, allegations
of bribery and corruption, failure to comply with
Group policies, suspicions of money laundering,
breaches of internal controls and fraud or deliberate
error in the financial records of any Group company.
Global Regulatory Compliance is responsible for the
operation of the Compliance Disclosure Line and the
handling of disclosure cases. Each case is reviewed
and referred for appropriate investigation. The
disclosure is acknowledged (when contact details
are provided) and the employee is advised when the
investigation has been concluded. Global Regulatory
Compliance may also be made aware of
whistleblowing cases made directly to senior
executives, line managers, Human Resources and
Security and Fraud, and will investigate accordingly.
Additional local whistleblowing lines are in
place in several countries, operated by Security
and Fraud, Human Resources and Regulatory
Compliance. When such lines are established,
processes are put in place to escalate relevant
disclosures made on the local whistleblowing lines
to Global Regulatory Compliance or Financial Crime
Compliance. Global Regulatory Compliance also
monitors an external email address for complaints
regarding accounting and internal financial controls
or auditing matters (accountingdisclosures@
hsbc.com highlighted under Investor Relations and
Governance on www.hsbc.com). Cases received are
escalated to the Group Chief Accounting Officer,
Group Finance Director and Group Chief Executive
as appropriate.

7/17/2019 Strategic Report 2013
http://slidepdf.com/reader/full/strategic-report-2013 32/54
H S B C H O L D I N G S P L C
Strategic Report (continued) Strategic priority 3 – Streamline processes and procedures > Operational performance / Customers
30
Strategic priority 3
Streamline processes and procedures
•
Operational performance ................................... 30
• Customers .................................................................... 31
• Environmental, social and community
obligations ................................................................... 34
Our aim is to achieve a cost efficiency ratio inthe mid 50’s.
We are redesigning key processes and procedures in order to manage risk, improve customer service, enhance
quality and reduce expenses. Sustainable savings will release funds to invest in growing our business, Global
Standards and increasing dividends.
Operational performance
We continue to refine our operational
processes, develop our global functions,
implement consistent business models and
streamline IT.
Sustainable savings are the financial outputs from
our organisational effectiveness and streamlining
programmes. They arise from the reduction or
elimination of complexity, inefficiencies or
unnecessary activities, and release capital that
can be reinvested in growing our business as well as
increasing returns to shareholders.
We are transitioning from organisational
effectiveness to streamlining, which is the next phase of our transformation. While organisational
effectiveness was about how HSBC is managed,
streamlining is about how we operate.
We committed to deliver US$2.5-3.5bn of
sustainable savings at the outset of the organisational
effectiveness programme. We have achieved
US$4.5bn for the period from 2011 to the end of
2013, equivalent to US$4.9bn on an annualised
(run rate) basis, as follows:
Sustainable savings 2011 to 2013
US$bn
Re-engineering operational processes ......... 1.6
Re-engineering global functions ................. 1.4
Implementing consistent business models .. 0.7
Streamlining IT ............................................ 0.8
4.5
In implementing our operational effectiveness
programme, we concentrated on a number of key
elements:
• people and structure – we implemented an 8x8
reporting structure, moved to a global operatingmodel, and defined and introduced target
business models across all global businesses
and functions;
• software development – we improved software
development productivity and shifted the mix of
employees towards lower-cost locations;
• process optimisation – we improved the
efficiency of our operational activities such as
contact centres (including offshoring), trade and
payments services; and
• corporate real estate – we rationalised our
property portfolio by leasing and launching
facilities management initiatives.
In phase 2, from 2014 to 2016, we will
concentrate on streamlining operations, focusing on
reducing or eliminating complexity, inefficiencies,
risks or unnecessary activities across the wholeGroup. This exercise will be applied to:
• propositions, and sales channels;
• processes and servicing channels, including
production management, multi-channel
servicing, operational processes and the
locations of activities; and
• infrastructure, including real estate, technology,
supplier management and global functions.
Streamlining will be achieved through a
combination of simplifying and globalising our
processes, products, systems and operations.
‘Simplifying’ involves identifying inefficiencies
or excessive complexity and redesigning or
rationalising processes to make them easier
to understand and manage and more efficient.
‘Globalising’ involves developing standard global
processes and implementing them around the Group
with minimal local variations.
Cost efficiency ratio
Our cost efficiency ratio for 2013 was 59.6%, down
from 62.8% in 2012.

7/17/2019 Strategic Report 2013
http://slidepdf.com/reader/full/strategic-report-2013 33/54
31
Customers
Our purpose is to connect customers to
opportunities, enabling businesses to thrive
and economies to prosper, helping people to
fulfil their hopes and realise their ambitions.
Our dealings with customers are conditioned by
our understanding of their needs, the quality of the
service we provide and the standards which govern
how we operate. With over 54 million personal and
business customers around the world, we know that
only by putting customers at the centre of what we
do can we achieve our purpose.
Customer service and satisfaction
Throughout 2013 we concentrated on enhancingthe customer service we provide through our global
businesses.
In RBWM, we measure customer satisfaction
through an independent market research survey of
retail banking customers in selected countries and
calculate a Customer Recommendation Index
(‘CRI’) to score performance. This CRI score is
benchmarked against average scores of a peer group
of banks in each market and we set targets for our
business relative to our competitive set of banks. The
Group target is for 75% of all the markets (based on
their weighted revenue) to meet their CRI targets.This year, RBWM met its target of 75% with a score
of 85% through strong performances in our home
markets of Hong Kong and the UK and significant
improvements in other major markets such as Brazil
and Turkey. Historically, our strongest performance
markets have been in Asia and this continued in
2013 with excellent results recorded in Taiwan,
Malaysia and mainland China.
In CMB, we continued to measure our client
engagement through a survey of key customers, the
Client Engagement Programme (‘CEP’). This survey
is conducted by an independent third party. We havegained valuable insights from this work which help
us tailor solutions and service offerings to meet our
customers’ individual needs.
The survey was conducted in the following
markets: UK, Germany, France, Turkey, US,
Canada, UAE, mainland China, Hong Kong, India,
Australia, Singapore, Mexico, Argentina and Brazil,
and provides aggregate scores for each of our
Business Banking and Corporate Banking
businesses.
We have conducted over 2,500 interviews withour Corporate Banking customers and over 6,000
interviews in our Business Banking customers.
These interviews allow us to build an overall score
from a possible 100 by our customers rating us on
seven key relationship criteria. We have seen
consistent positive performance, and in 2012 our
score for the Corporate Banking segment was84, rising slightly to 85 in 2013 with strong
performances in mainland China, the US, Brazil and
Germany. In our Business Banking segment our
score was 81 in 2012 and 82 in 2013, with strong
performances in a number of priority markets
notably our home markets of Hong Kong and UK.
Given the complex and competitive environment we
have seen in many of the markets surveyed, we
believe this to be a very good, consistent,
performance and shows a positive relationship for
HSBC with these valuable customers.
Retail Banking and Wealth Management
Standardising our propositions to make it
easier for customers to do business
We continue to make significant progress in
executing our customer strategy in RBWM.
In HSBC Premier, we are focusing on meeting
the wealth management needs of our customers
in five respects: protection, education, retirement,
managing and growing wealth, and legacy planning.
We have improved the platforms used by both
customers and relationship managers, helping us to
enhance customer experience and raise the standardsof our financial planning.
We intend to refresh HSBC Advance in all our
priority markets in 2014, putting digital functionality
at the heart of the updated proposition. We are
focusing on the day-to-day banking needs of our
customers and improving their access to personal
lending.
In 2013, we deployed service enhancements for
customers in all segments (Premier, Advance and
personal banking) using mobile phones and saw
2.5m downloads of our global mobile banking ‘app’in 25 countries, with over 1.1m downloads in the
fourth quarter of 2013 alone. We also selectively
piloted Twitter and Facebook-based services for
customers and were voted the top social media bank
in the UK in 2013 by IMGroup, the digital
management consultancy.
We have undertaken a full review of all our
products in RBWM, and are standardising our
offering across all categories. Products are assessed
on grounds of fairness and transparency before being
approved. For example, in the UK, we made money
management easier by simplifying automated tellermachine (‘ATM’) withdrawals, we improved our
branch infrastructure to enable customers to reset
their telephone security at the branches and we
7/17/2019 Strategic Report 2013
http://slidepdf.com/reader/full/strategic-report-2013 34/54
H S B C H O L D I N G S P L C
Strategic Report (continued) Strategic priority 3 – Streamline processes and procedures > Customers
32
updated our on-line avatar, ‘Ask Olivia’, so that
customers can easily get online answers to questions
about error codes on their secure key. In Vietnam,
an SMS Alert message will now be sent to acustomer’s registered mobile phone number as soon
as they complete a credit card transaction, preventing
fraud and helping to protect our credit cardholders.
We are also continuing to develop new
products. We have extended our range of renminbi
offerings and improved our foreign exchange
services, particularly online. Through our Asset
Management Group, we have now launched
Managed Solutions in eight of our priority markets.
Interacting with customers
In 2013, we took a major step to align our staff’s
remuneration with customer interests by introducing
a new incentive programme for our Wealth
Management relationship managers. The programme
removed all formulaic links to sales volumes and
focused on assessing how well we are meeting our
customers’ needs. We developed a similar incentive
programme covering the rest of the RBWM front
line staff and all our retail products. This was
partially implemented in the UK and France in 2013
and will be effective in most markets from the
beginning of 2014.
We continue to invest in all the channels that
customers use to enhance ease of use and improve
the overall customer experience. Upgrades to our
physical estate included increasing physical access
for disabled customers to branches in the UK and
Hong Kong. In Canada, the upgraded ATMs now
feature paperless bill payments and voice guidance
in English, French, Cantonese and Mandarin. On
digital channels, we launched new mobile
applications and increased the functionality of
our internet banking platforms. In Brazil, we were
recognised as best internet bank in the market for
the second year running, and launched bill payment by digital picture on mobiles. We are working on
improving our international account opening
processes while also raising the standards we
employ for combating financial crime risk.
Supporting home ownership
Mortgages are a key product for our customers in
enabling home ownership, and we continue to
improve our products and processes.
In the UK, we granted over 30,000 first time
buyer loans, and started selectively offering 95%loan-to-value mortgages as part of the government’s
‘Help to Buy’ scheme. We won the Moneyfacts
award for Best Bank Mortgage Provider for the fifth
year running.
In mainland China, where we have achieved
double digit growth in balances in each of the lastthree years, we re-engineered our processes to
accommodate increased volumes and to speed up
the granting of loans. We have reduced overall
turnaround times from 12 days to six days. Through
our ‘Decision in Principle’ service we can now give
customers the results of their initial screening within
one hour.
In the UAE, we launched a tracker rate
mortgage linked to a public benchmark, along with
other initiatives including assisting customers with
the registry process. Customer feedback was very
positive and RBWM continued to grow strongly
even as the overall market fell slightly.
In the US, we continued to work with the
Federal Home Loan Bank of New York in offering
‘First Home Club’, a savings and education
programme that assists low income families generate
the down payment required to buy their first home.
Supporting customers in financial difficulty
We recognise that some of our customers are facing
challenging financial situations, and we have looked
to support them during difficult times.
Across Europe, frontline specialists were
trained to offer an income and expenditure review
for customers who are likely to face difficulty in
making repayments to HSBC in the near future. We
also eliminated certain current account charges in
the UK (unpaid transaction fees). We updated our
restructure and payment programme suites in the
Middle East and Mexico while collaborating with
charities, associations and government loan relief
programmes in the US, Canada and France. In the
Philippines, we offer a ‘General Restructuring’
Facility as a restructuring programme for both non-delinquent and delinquent customers, and responded
to Typhoon Haiyan with targeted payment holidays
to credit card customers affected by the catastrophe.
In Australia, we offered hardship relief on mortgage
repayments to customers affected by bushfires in
New South Wales.
Commercial Banking
Supporting small and medium-sized entities
To help our customers find the right financial
solutions to succeed in the global economy, welaunched a series of funds to support SME’s that
trade or aspire to trade internationally. We launched
SME funds in the UK, France and Mexico in the first

7/17/2019 Strategic Report 2013
http://slidepdf.com/reader/full/strategic-report-2013 35/54
33
half of 2013 and in the US and Canada in the second
half of the year. The latter two were of US$1bn each.
We also launched our fourth SME fund in the UAE
of AED1bn (US$272m) for international tradecustomers.
Our International Exchange programme
continued to be a cornerstone of our client retention
activity. In 2013, we hosted four events, in
Singapore, Guangzhou, Mexico City and Istanbul,
and provided leadership content and networking
opportunities for over 300 corporate clients from
around the world. We work closely with local
government, trade bodies and central banks to
provide the best possible insights and information
for these customers. The client feedback confirmed
that customers derive huge value from connectingwith like-minded businesses, and there are multiple
examples of new business relationships formed as a
result of these conferences.
Interacting with customers
• In 2013, our CEP undertook over 10,000
customer interviews in 15 of CMB’s priority
markets. The programme gives customers the
opportunity to share their views, and
demonstrates that HSBC is listening and
actively working to improve our ability to
support customers with global operations.
• We are enhancing our customers’ account
opening experience, enabling it to take place
anytime anywhere, provided we can fulfil
regulatory and Group KYC requirements. At
the end of 2013, we launched a multi-channel
business account opening tool in the UK for
customers who wish to open accounts using
online channels or call centres without visiting a
branch.
• In Hong Kong, in the fourth quarter of 2013,
we made iPads available in Business Banking
centres to enable customers to register for
internet banking at the time of account opening.
• We are expanding the servicing and transaction
options available on our international online
platform, HSBCnet, to better cater for the
requirements of businesses of different sizes
and needs. In addition to our payments and
cash management HSBCnet package, which is
available in all markets, we launched domestic
and international HSBCnet packages in our top
12 markets during 2013.
•
Relationship managers now update and validatecustomer information through regular routine
discussions.
• Significant training is being provided for staff,
including around the use of tools to help them
support customers in completing required
customer due diligence information.
New renminbi products and services
The growing use of China’s currency worldwide is
creating new opportunities for our customers
engaging in trade, capital transactions and financing
business in or with mainland China. We continued to
strengthen our ability to meet these customers’ needs
by playing a major part in a number of innovative
transactions for the currency, including being the
first international bank to:
• offer an automated foreign currency cross-
border sweeping structure in mainland China to
help multinationals optimise the use of internal
funding by consolidating their liquidity
positions onshore and offshore;
• pilot foreign currency cross-border netting in
mainland China, enabling multinationals to
offset foreign currency payables and receivables
between Chinese subsidiaries and netting
centres overseas. The product allows companies
to reduce inter-company transactions while
lowering processing costs and currency risk
exposure; and
• implement a tailor-made renminbi cross-border
centralised payments and collections settlement
product in mainland China. This eliminates
foreign exchange exposure and optimises
working capital management for companies.
For further information on the products and services we offer,
see page 79 of the Annual Report and Accounts 2013.
Client selection
Client selection is core to our growth strategy as
we seek to generate long-term relationships and
sustainable revenue streams within acceptable risk
parameters. In 2013, we initiated a comprehensive
programme to reposition our portfolios and better
manage our business. This involves reviewing our
customer base and establishing robust client
selection filters designed to ensure that our controls
and information flows are such that we can be
confident that we only do business with customers
who meet our criteria.
We are also undertaking a review of business
policies and controls as part of our implementation
of Global Standards to further guard against moneylaundering and sanctions risks.
Our risk profile is described on page 134 of the Annual Reportand Accounts 2013.
7/17/2019 Strategic Report 2013
http://slidepdf.com/reader/full/strategic-report-2013 36/54
H S B C H O L D I N G S P L C
Strategic Report (continued) Strategic priority 3 – Streamline processes and procedures > Environmental, social and community obligations
34
Environmental, social andcommunity obligations
We will create a robust, resilient and
sustainable business in which our clients
can have confidence, our employees can
take pride and our communities can trust.
Our continuing success depends, in part, on our
ability to identify and address environmental, social
and ethical factors which present risks to our
business or offer opportunities to support customers
in a more sustainable way. These can affect
our reputation, drive employee engagement, help
manage the risks of lending, leverage savings
through eco-efficiency and secure new revenue
streams.
Human rights
We apply human rights considerations directly as
they affect our employees and indirectly through
our suppliers and customers, in the latter case in
particular through our project finance lending.
Human rights issues most directly relevant for
HSBC are those relating to the right to just and
favourable conditions of work and remuneration,
the right to equal pay for equal work, the right to
form and join trade unions, the right to rest and
leisure and the prohibition of slavery and childlabour. Alongside our own commitments, such as
our HSBC Code of Conduct for Suppliers (in place
since 2005), the HSBC Global Standards Manual,
HSBC Values and our Business Principles, we have
signed up to global commitments and standards,
including the UN Global Compact, the Universal
Declaration of Human Rights and the Global
Sullivan Principles.
Our sustainability risk framework
We recognise that businesses can have an impact
on the environment and communities aroundthem. For over 10 years we have been developing,
implementing and refining our approach to working
with our business customers to understand and
manage these issues. We assess and support
customers in six sensitive sectors using our own
policies and, in financing projects, using the Equator
Principles as a starting point. By extending their
application to all relevant corporate loans
and providing independent assurance on their
implementation, we go beyond the minimum
requirements of the Equator Principles framework.
Our sustainability risk framework is based on robust
policies, formal processes and well-trained,
empowered people.
We welcome constructive feedback from non-
governmental organisations (‘NGO’s) and campaign
groups and regularly engage with a number of them
on matters of shared interest. In 2013, HSBC wasapproached by NGOs raising concerns regarding the
implementation of our forest land and forest
products sector policy. If our clients do not comply
fully with our policies, or cannot show that they are
on a credible path to do so, we will exit our
relationship with them.
Our approach to managing sustainability risk is described on
page 297 of the Annual Report and Accounts 2013.
Climate business
We define ‘climate business’ as seeking long-term
commercial business opportunities to supporttransition to a low-carbon economy. Our climate
business includes clients in the solar, wind, biomass,
energy efficiency, low carbon transport and water
sectors, and revenues are growing year on year.
HSBC’s Climate Change Centre of Excellence, part
of our global research team focusing on business
risks and opportunities created by climate change,
was established in 2007 and its research estimates
that the climate business sector could exceed
US$2.2 trillion by 2020.
Our sustainable operations strategyHSBC’s carbon dioxide emissions are calculated on
the basis of the energy used in our buildings and
employee business travel from over 30 countries
(covering about 93% of our operations by FTE). The
data gathered on energy consumption and distance
travelled are converted to carbon dioxide emissions
using conversion factors from the following sources,
if available, in order of preference:
1. factors provided by the data/service providers;
2. factors provided by the local public
environmental authorities. For electricity, ifspecific factors cannot be obtained from the
above two sources, we use the latest available
carbon emission factors for national grid
electricity from the International Energy Agency
as recommended for use by the Greenhouse Gas
Protocol; and
3. for other types of energy and travel, if no
specific factors can be obtained from the first
two sources, we use the latest available factors
provided by the UK Department for Environment,
Food and Rural Affairs and/or the Department
of Energy and Climate Change in the UK.
To incorporate all of the operations over which
we have financial (management) control, the

7/17/2019 Strategic Report 2013
http://slidepdf.com/reader/full/strategic-report-2013 37/54
35
calculated carbon dioxide emissions are scaled up on
the basis of the FTE coverage rate to account for any
missing data (typically less than 10% of FTEs). In
addition, emission uplift rates are applied to allowfor uncertainty on the quality and coverage of
emission measurement and estimation. The rates are
4% for electricity, 10% for other energy and 6% for
business travel, based on the Intergovernmental
Panel on Climate Change Good Practice Guidance
and Uncertainty Management in National
Greenhouse Gas Inventories, and HSBC’s internal
analysis of data coverage and quality.
Carbon dioxide emissions in tonnes
2013 2012
Total ............................... 889,000 963,000
From energy ................... 755,000 825,000
From travel .................... 134,000 138,000
Carbon dioxide emissions in tonnes per FTE
2013 2012
Total ............................... 3.43 3.61
From energy ................... 2.91 3.09
From travel .................... 0.52 0.52
Our greenhouse gas reporting year runs from
October to September. For the year from 1 October
2012 to 30 September 2013, carbon dioxide
emissions from our global operations were 889,000tonnes.
HSBC Technology and Services employs
around a third of our workforce and runs our
operations, including real estate, IT infrastructure
and supply chain. One of its goals, known as
‘REDUCE’, is to cut annual carbon dioxide
emissions per employee by a tonne between 2012
and 2020 to 2.5 tonnes. Our baseline year is 2011, in
which emissions were 3.44 tonnes (rounded up to
3.5).
To tackle this challenge, we set a 10-point
sustainable operations strategy at the start of 2012,
listed below. This strategy covers issues from
sustainability leadership and engagement to supply-
chain collaboration, and includes ambitious targets
to reduce our use of energy and reduce our waste.
We made progress in 2013, but recognise that
stretching goals like these will take time to achieve.
We have capitalised on ‘quick wins’ where possible,
but have also spent time to analyse thoroughly and
prepare for achieving these targets.
Our 10-point sustainable operations strategy
1. We are engaging all employees in delivering improved efficiency by 2020 with training and sustainability leadership programmes.
2. We will increase energy consumption from renewables from 24% to 40% and increase self-generated electricity capacity from zero to 5%.3. We will collaborate with our supply chain to achieve sustainable savings through efficiency and innovation.4. We will improve the energy efficiency of our Group data centres.5. An annual US$5m investment in an HSBC Eco-efficiency Fund has been committed to trial sustainable innovation.6. Our target is to increase the recycling of HSBC’s waste from 60% to 100% of our office waste and electronic-waste.7. Work on all new and redesigned buildings costing over US$10m in our portfolio of 7,500 buildings will be done to Leadership in
Energy and Environmental Design (‘LEED’) certification standards.8. We aim to reduce annual energy consumption per employee by 1MWh.9. We will reduce paper usage, ensure it comes from sustainable sources, and encourage paperless banking for all retail and commercial
customers.10. We continue to promote alternatives to travel, reducing travel carbon emissions per employee.
Further details on our progress with achieving our sustainability operations programme will be published in our Sustainability Report2013 on 23 May 2014.
Community investment
In 2013, we donated a total of US$117m to
community investment projects (2012: US$120m).
Youth education
Education is key to prosperity. We seek to help
young people fulfil their potential through global and
local investment in education programmes. Our
programmes span various levels of need, including
financial literacy training, scholarships, cultural
awareness programmes and teaching life skills.
In 2013, we launched the three-year £30m
(US$47m) Opportunity Partnership, to help transform
the lives of 25,000 disadvantaged young people in
the UK through education, training and work.
Staff volunteering
Thousands of HSBC employees globally are
involved every year through volunteering for our
Community Investment programmes. We report in
detail on this in the HSBC Sustainability Report 2013.
HSBC Water Programme
2013 was the second year of our flagship
environmental project, the HSBC Water Programme.
This is a five-year, US$100m programme in
partnership with Earthwatch, WaterAid and WWF
to deliver water provision, protection, information
and education across the world. In 2013, wedeveloped the programme by connecting specific
parts of our business with HSBC Water Programme
activities.

7/17/2019 Strategic Report 2013
http://slidepdf.com/reader/full/strategic-report-2013 38/54
H S B C H O L D I N G S P L C
Strategic Report (continued) Risk overview > Risk and our strategic priorities / Risk in 2013 / Top and emerging risks
36
Risk overview
• Risk and our strategic priorities ...................... 36
•
Risk in 2013 ................................................................. 36
•
Top and emerging risks ....................................... 37
• How we manage risk ............................................. 39
• How risk affects our performance ................. 41
Our risk profile is underpinned by our corephilosophy of maintaining a strong balance
sheet and liquidity position, and capitalstrength.
ll our activities involve, to varying degrees, the measurement, evaluation, acceptance and management of risk or
combinations of risks. Our risk management framework, employed at all levels of the organisation, ensures that our
risk profile remains conservative and aligned to our risk appetite and strategy.
Risk and our strategic priorities
The Group’s three strategic priorities are reflected in
our management of risk.
Grow both business and dividends – we ensure
risk is maintained at appropriate levels while HSBC
is positioned for growth and capital is deployed
accordingly to maximise revenue opportunities.
Implement Global Standards – our management
of financial crime risk is strengthened by the
implementation of Global Standards, which are
enhancing the procedures, policies, capabilities and
controls that govern how we do business and with
whom.
Streamline processes and procedures – during
2013, we initiated a comprehensive programme
to reposition our portfolios in line with our updated
risk appetite, and we made progress with programmes
to make HSBC easier to manage and control. We also
continued to simplify the Group structure through our
disposal programme and to de-risk legacy portfolios.
The steps we have taken to reshape HSBC have
released around US$90bn in risk-weighted assets to
date.
Our business and operating models are described on page 13.
For further information on Global Standards, see page 23.
Risk in 2013
Financial markets were volatile during 2013,
reflecting concerns over the US fiscal cliff and debt
ceiling, the potential tapering of quantitative easing,
the continuing political instability in the Middle East
and its possible effect on global energy prices, and
the widely held view that the global economic
recovery remains fragile. We maintained a
conservative risk profile by reducing exposure to
the most likely areas of stress:
•
we managed selectively our exposure to
sovereign debt and bank counterparties to
ensure that the overall quality of the portfolio
remained strong;
•
we regularly assessed higher risk countries andadjusted our risk appetite and exposures
accordingly;
• we repositioned certain portfolios through our six
filters process (see page 15) and our focus on
certain products or customer segments;
• we made our client selection filters more robust
in managing the risk of financial crime; and
• we mitigated risks, for example reputational
and operational, when they were forecast to
exceed our risk appetite.
The diversification of our lending portfolio
across global businesses and regions, together withour broad range of products, ensured that we were
not overly dependent on a limited number of
countries or markets to generate income and growth.
We monitored a range of key risk metrics in
2013, including the following:
2013 2012
US$bn US$bn
Maximum exposure tocredit risk .......................... 3,112 3,140
of which:
– loans and advances
held at amortised cost14
.. 1,292 1,150
Risk-weighted assets ............ 1,093 1,124of which:
– credit risk RWAs ............ 864 898 – market risk RWAs .......... 63 55 – operational risk RWAs ... 119 122
Proportion of RWAs onstandardised approach .... 30% 34%
Trading value at risk
(US$m) ............................ 52 79
Advances to deposits ratio14 73% 74%
Advances to core funding
(year end)14:
HSBC UK 23
....................... 100% 106%HBAP24 ............................. 72% 73%HSBC USA25 ..................... 85% 78%
For footnotes, see page 46.

7/17/2019 Strategic Report 2013
http://slidepdf.com/reader/full/strategic-report-2013 39/54
37
Risks incurred in our business activities
Our principal banking risks are credit risk, liquidity
and funding risks, market risk, operational risk,
compliance risk, fiduciary risk, reputational risk pension risk and sustainability risk. We also
incur insurance risk. The chart below provides a
high level guide to how our business activities are
reflected in our risk measures and in the Group’s
balance sheet. The third-party assets and liabilities
indicate the contribution each business makes to the balance sheet, while RWAs illustrate the relative size
of the risks incurred in respect of each business.
For a description of our principal risks, see page 136 of theAnnual Report and Accounts 2013.
Exposure to risks arising from the business activities of global businesses
Page references in the above table are to the Annual Report and Accounts 2013. For footnote, see page 46.
For further information on credit risk, see page 150;
capital and risk-weighted assets, see page 298; market risk,including value at risk, see page 230; and operational risk see
page 244 of the Annual Report and Accounts 2013.
Top and emerging risks
Identifying and monitoring top and emerging risks
are integral to our approach to risk management. We
define a ‘top risk’ as being a current, emerged risk
which has arisen across any of our risk categories,
regions or global businesses and has the potential to
have a material impact on our financial results or our
reputation and the sustainability of our long-term
business model, and which may form and crystallise
within a year. We consider an ‘emerging risk’ to
be one with potentially significant but uncertain
outcomes which may form and crystallise beyond aone-year time horizon, in the event of which it could
have a material effect on our ability to achieve our
long-term strategy.
The ongoing assessment of our top and
emerging risks is informed by a comprehensive suite
of risk factors (see page 135 of the Annual Report
and Accounts 2013) which may result in our riskappetite being revised. During 2013, senior
management paid particular attention to a number
of top and emerging risks. These risks, as at
31 December 2013, are tabulated below.
We made a number of changes to our top and
emerging risks to reflect revised assessment of their
effect on HSBC during 2013. Threats to the global
economy from a disorderly exit from quantitative
easing, which emerged as a risk during the first half of
2013 following announcements that monetary stimuli
may be scaled back, receded during the second half of
the year. This followed announcements by central banks on the likely pace and scale of tapering together
with an acceleration of economic growth in the US
and UK.
RBWM CMB GB M GPB
HSBC
• HSBC holdingcompany andcentral operations
• Deposits
• Accounts services
• Credit and lending
• Asset management
• Wealth solutions andfinancial planning
• Broking
• Life insurancemanufacturing
• Deposits
• Payments and cashmanagement
• Credit and lending
• International tradeand receivablesfinance
• Commercialinsurance andinvestments
• Deposits
• Payments and cashmanagement
• Balance sheetmanagement
• Credit and lending
• Asset and tradefinance
• Corporate finance
• Markets
• Securities services
• Deposits
• Account services
• Credit and lending
• Asset management
• Financial advisory
• Broking
• Corporate finance(via GB&M)
• Alternativeinvestments
Global
business
Business
activities
Risk
profile
Balance
sheet
26
US$bn
• Assets 517
• Customeraccounts 580
US$bn
• Assets 361
• Customeraccounts 354
US$bn
• Assets 1,976
• Customeraccounts 450
US$bn
• Assets 98
• Customeraccounts 97
US$bn
• Assets 172
• Customeraccounts 1
Liquidity and funding risk (page 213), Pension risk (page 260), Fiduciary risk (page 248), Reputational risk (page 260),
Compliance risk (page 247), Sustainability risk (page 263) and Insurance risk (page 249). The latter is predominantly in RBWM and CMB.
US$bn • Credit risk 195
• Operational risk 39
US$bn • Credit risk 359
• Operational risk 33
US$bn • Credit risk 270
• Counterpartycredit risk 46
• Operational risk 43
• Market risk 63
US$bn • Credit risk 17
• Operational risk 4
US$bn • Credit risk 23
• Operational risk –
Other
(including holdingcompany)
RWAs
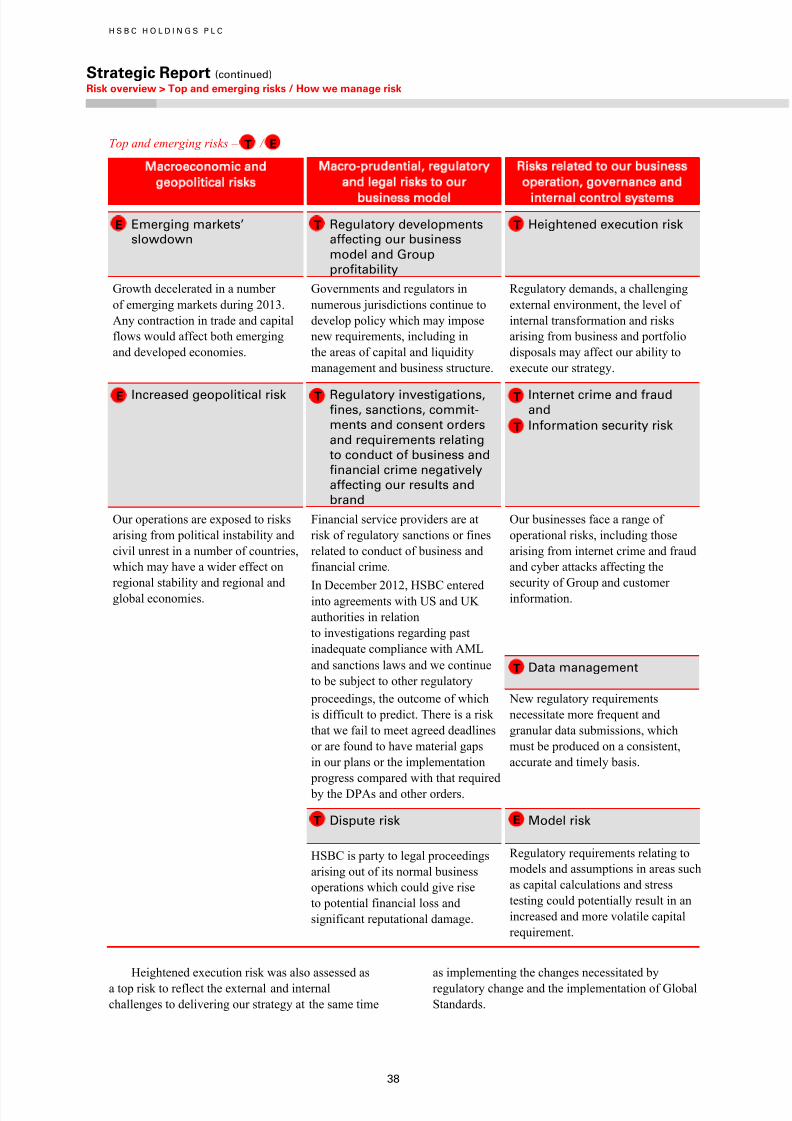
7/17/2019 Strategic Report 2013
http://slidepdf.com/reader/full/strategic-report-2013 40/54
H S B C H O L D I N G S P L C
Strategic Report (continued) Risk overview > Top and emerging risks / How we manage risk
38
Top and emerging risks – /
Macroeconomic and
geopolitical risks
Macro-prudential regulatory
and legal risks to our
business model
Risks related to our business
operation governance and
internal control systems
• Emerging markets’slowdown
• Regulatory developmentsaffecting our business
model and Groupprofitability
• Heightened execution risk
Growth decelerated in a number
of emerging markets during 2013.
Any contraction in trade and capital
flows would affect both emerging
and developed economies.
Governments and regulators in
numerous jurisdictions continue to
develop policy which may impose
new requirements, including in
the areas of capital and liquidity
management and business structure.
Regulatory demands, a challenging
external environment, the level of
internal transformation and risks
arising from business and portfolio
disposals may affect our ability to
execute our strategy.
•
Increased geopolitical risk •
Regulatory investigations,fines, sanctions, commit-ments and consent orders
and requirements relatingto conduct of business andfinancial crime negativelyaffecting our results andbrand
•
Internet crime and fraudand
•
Information security risk
Our operations are exposed to risks
arising from political instability and
civil unrest in a number of countries,
which may have a wider effect on
regional stability and regional andglobal economies.
Financial service providers are at
risk of regulatory sanctions or fines
related to conduct of business and
financial crime.
In December 2012, HSBC enteredinto agreements with US and UK
authorities in relation
to investigations regarding past
inadequate compliance with AML
Our businesses face a range of
operational risks, including those
arising from internet crime and fraud
and cyber attacks affecting the
security of Group and customerinformation.
and sanctions laws and we continue
to be subject to other regulatory• Data management
proceedings, the outcome of which
is difficult to predict. There is a risk
that we fail to meet agreed deadlines
or are found to have material gaps
in our plans or the implementation
progress compared with that required
by the DPAs and other orders.
New regulatory requirements
necessitate more frequent and
granular data submissions, which
must be produced on a consistent,
accurate and timely basis.
• Dispute risk • Model risk
HSBC is party to legal proceedings
arising out of its normal business
operations which could give rise
to potential financial loss and
significant reputational damage.
Regulatory requirements relating to
models and assumptions in areas such
as capital calculations and stress
testing could potentially result in an
increased and more volatile capital
requirement.
Heightened execution risk was also assessed as
a top risk to reflect the external and internal
challenges to delivering our strategy at the same time
as implementing the changes necessitated by
regulatory change and the implementation of Global
Standards.
TTE
T E
T E
T
T
T
TE

7/17/2019 Strategic Report 2013
http://slidepdf.com/reader/full/strategic-report-2013 41/54
39
When the top and emerging risks listed above
resulted in our risk appetite potentially being
exceeded, we took steps to mitigate them, including
reducing our exposure to areas of stress. Given theimpact on the Group of breaching the US DPA,
significant senior management attention was given
to tracking and monitoring our compliance with its
requirements and improving policies, processes and
controls to minimise the risk of a breach.
For a detailed account of these risks and for a summary of our
risk factors, see pages 141 and 135, respectively, of theAnnual Report and Accounts 2013.
How we manage risk
Our risk culture is fundamental to the delivery of
our strategic objectives. It may be characterisedas conservative, control-based and collegiate. It is
reinforced by our HSBC Values and our Global
Standards, and forms the basis on which our risk
appetite and risk management framework are
established. These are instrumental in aligning the
behaviour of individuals with the Group’s attitude
to assuming and managing risk.
We manage risk actively, with five main
elements underpinning our risk culture.
Running risk like a business
Running risk like a business means ensuring that the
Global Risk function is dynamic and responsive to
the needs of its stakeholders. We continue to focus
on:
• making systems compatible (for example, in
Global Risk and Global Finance) so a complete
picture of our risks is obtained;
• streamlining data production and re-engineering
processes to create time to spend on risk
management; and
• understanding the detail behind our risks and
costs.
Organisation and structure
Robust risk governance and accountability are
embedded throughout the Group, fostering a
continuous monitoring of the risk environment
and an integrated evaluation of risks and their
interactions. Adherence to consistent standards and
risk management policies is required across HSBC
by our Global Standards and our Global Risk
Operating Model.
Our risk governance framework, of which our
risk appetite framework is a significant element,
ensures the appropriate oversight of and
accountability for the effective management of risk,
including financial crime risk, at Group, regional and
global business levels. Similar arrangements are
in place in our major operating subsidiaries.
The Group Risk Committee is responsible foradvising the Board on high-level risk related
matters and risk governance. The risk governance
framework was augmented by the establishment in
January 2013 of the Financial System Vulnerabilities
Committee, which reports to the Board on matters
relating to financial crime and financial system
abuse and provides a forward-looking perspective
on financial crime risk.
A Conduct & Values Committee was established
in January 2014, to oversee the design and application
of HSBC’s policies, procedures and standards, to
ensure that we conduct business responsibly and
consistently adhere to HSBC Values and to advise the
Board accordingly.
For a description of the governance structure for managingrisk at the Group level, see the report of the Group Risk
Committee on page 352 of the Annual Report and Accounts2013. The Report of the Financial System VulnerabilitiesCommittee is on page 358.
Three lines of defence
The Group has adopted a risk management and
internal control structure referred to as the ‘three
lines of defence’ to ensure we achieve ourcommercial aims while meeting regulatory and legal
requirements. It is a key part of our operational risk
management framework.
• First line – every employee is responsible for
the risks that are part of their day to day jobs.
The first line of defence ensures that all key
risks within their operations are identified,
mitigated and monitored by appropriate internal
controls within an overall control environment.
• Second line – global functions, such as Global
Risk, Global Finance and Global Human
Resources form the second line of defence.
They have similar responsibilities to the first
line of defence for the processes and activities
they own. In addition, they are responsible
for setting policy and for providing oversight
and challenge of the activities conducted by
the first line.
• Third line – Internal Audit forms the third line
of defence, providing independent assurance
to senior management and the Board over
the design and operation of HSBC’s risk
management, governance and internal control
processes.
For details of our operational risk management framework,
see page 244 of the Annual Report and Accounts 2013.

7/17/2019 Strategic Report 2013
http://slidepdf.com/reader/full/strategic-report-2013 42/54
H S B C H O L D I N G S P L C
Strategic Report (continued) Risk review > How we manage risk / How risk affects our performance
40
People
All employees are required to identify, assess and
manage risk within the scope of their assigned
responsibilities and, as such, they are critical to theeffectiveness of the three lines of defence. Personal
accountability for Global Standards is reinforced by
HSBC Values.
Clear and consistent employee communication
on risk conveys strategic messages and sets the tone
from senior leadership. A suite of mandatory training
on critical risk and compliance topics is deployed to
embed skills and understanding and strengthen the
risk culture within HSBC. It reinforces the attitude to
risk in the behaviour expected of employees, as
described in our risk policies. The training is updated
regularly, describing technical aspects of the various
risks assumed by the Group and how they should
be managed effectively. Staff are supported in their
roles by a disclosure line which enables them to raise
concerns confidentially (see page 29).
Our risk culture is reinforced by our approach
to remuneration. Individual awards are based on
compliance with HSBC Values and the achievement
of financial and non-financial objectives which are
aligned to our risk appetite and global strategy.
For further information on risk and remuneration, see the
Report of the Group Remuneration Committee on page 360 ofthe Annual Report and Accounts 2013.
Risk management processes and procedures
Risk management within HSBC is driven by the
following four processes:
• risk identification;
• risk appetite;
• mapping our risk profile; and
• stress testing and scenario analysis.
Risk identification
We identify and monitor risks continuously. This
process, which is informed by analysis of our
risk factors and the results of our stress testing
programme, gives rise to the classification of certain
key risks as top or emerging. Changes in our
assessment of top and emerging risks may result in
adjustments to our business strategy and, potentially,
our risk appetite.
Risk appetite
The Group’s Risk Appetite Statement describes
the types and levels of risk that we are prepared toaccept in executing our strategy. The Risk Appetite
Statement is approved by the Board on the advice of
the Group Risk Committee. It is a key component of
our risk management framework, informs our annual
operating plan and plays an important role in our
six filters process.
Global businesses, geographical regions andglobal functions are required to align their risk
appetite statements with the Group’s.
Quantitative and qualitative metrics are assigned
to nine key categories: earnings, capital, liquidity
and funding, securitisations, cost of risk, intra-group
lending, strategic investments, risk categories and
risk diversification and concentration. Measurement
against the metrics:
• guides underlying business activity, ensuring
it is aligned to risk appetite statements;
•
informs risk-adjusted remuneration;• enables the key underlying assumptions to
be monitored and, where necessary, adjusted
through subsequent business planning cycles;
and
• promptly identifies business decisions needed
to mitigate risk.
Some of the core metrics that are measured and
presented to the Board monthly are tabulated below:
Key risk appetite metrics
2013
Target27 Actual
Core tier 1 ratio ........... 9.5% to 10.5% 13.6%
Common equity
tier 1 ratio ............... 9.5% to 10.5% 10.9%
Return on equity ......... 12% to 15% 9.2%
Return on RWAs ......... 2.1% to 2.7% 2.0%
Cost efficiency ratio .... 48% to 52% 59.6%
Advances to customer
accounts ratio14 ....... Below 90% 72.9%
Cost of risk (loan
impairment charges)
Below 15% of
operating income 7.7%
For footnotes, see page 46.
In 2013, we changed the targets for two of theserisk appetite metrics. Our return on risk-weighted
assets target was raised from 1.8-2.6% to the current
target of 2.1-2.7%, reflecting changes in our risk
profile as we reshaped our portfolio of businesses in
line with our strategy and our six filters framework.
As our portfolios became less risky, we reduced the
acceptable cost of risk from below 20% to below
15% of operating income.
Our core tier 1 ratio exceeded the target,
although remained within our risk tolerance to
ensure we were well placed to meet requirements on
a Basel III basis (page 309 of the Annual Report and Accounts 2013).
Our six filters are described on page 15.
7/17/2019 Strategic Report 2013
http://slidepdf.com/reader/full/strategic-report-2013 43/54
41
Mapping our risk profile
Risks are assumed by our global businesses in
accordance with their risk appetite and are managed
at Group, global business and regional levels. Allrisks are recorded and monitored through our risk
mapping process, which describes our risk profile
by category in the different regions and global
businesses.
In addition to our banking and insurance risks,
the risk mapping process identifies and monitors
risks such as model, financial management, capital,
Islamic finance and strategic risks. These risks
are regularly assessed through our risk appetite
framework, stress tested and considered for
classification as top and emerging risks.
For a summary of our banking and insurance risks, see page 136 of the Annual Report and Accounts 2013.
Stress testing and scenario analysis
We conduct stress-testing scenarios across the Group
on both enterprise-wide and regional bases, reflecting
our business strategy and resultant risk exposures.
These scenarios include, but are not limited to,
adverse macroeconomic events, failures at country,
sector and counterparty levels and a variety of
projected major operational risk events. The results of
the stress tests are used to assess potential unplanneddemand for regulatory capital under the various
scenarios. We also participate in scenario analyses
requested by regulatory bodies including the Bank of
England concurrent stress test exercise and the US
Federal Reserve Comprehensive Capital Analysis and
Review (‘CCAR’) and Dodd-Frank Stress Testing
programmes.
We tested several scenarios in the course of
2013. The results of these stress tests demonstrated
that HSBC would remain satisfactorily capitalised
after taking account of assumed management actions
to mitigate the effect of the scenarios in question.
For further information on our stress-testing and scenario
analyses, see page 139 of the Annual Report and Accounts2013.
How risk affects our performance
The management of risk is an integral part of all
our activities. Risk measures our exposure to
uncertainty and the consequent variability of return.
The execution of our strategy, including the exit
from non-strategic markets, the sale of businesses
and non-core investments, the repositioning of our portfolios and implementation of revised client
selection filters, together with an improvement in
market conditions, led to a modest improvement in
credit metrics in our retail portfolios during 2013,
while our wholesale portfolios remained stable.
LICs fell in North America, Europe and theMiddle East and North Africa following a general
improvement in credit conditions but rose in Latin
America for reasons outlined on page 17.
Operational losses declined significantly
compared with 2012, although remained above
historical trend. The decrease reflected the non-
recurrence of fines and penalties paid in 2012 as part
of the settlement of investigations into past inadequate
compliance with AML and sanctions laws. Provisions
related to UK customer redress, principally payment
protection insurance and interest rate protection
products, also declined. There are many factors
which could affect these estimated liabilities and
there remains a high degree of uncertainty as to
the eventual cost of redress for these matters.
HSBC is party to legal proceedings,
investigations and regulatory matters in a number
of jurisdictions arising out of its normal business
operations. We recognise a provision for a liability
in relation to these matters when it is probable that
an outflow of economic benefits will be required to
settle an obligation which has arisen as a result of
past events, and for which a reliable estimate can
be made of the amount of the obligation. Our
provisions for legal proceedings and regulatory
matters and for customer remediation at
31 December 2013 totalled US$4.2bn. While the
outcome of these matters is inherently uncertain,
management believes that, based on the information
available to it, appropriate provisions have been
made.
The reported results of HSBC are sensitive to
the accounting policies, assumptions and estimates
that underlie the preparation of our consolidated
financial statements and reflect our assessment ofthe financial impact of risks affecting the Group.
For a description of material legal proceedings and regulatorymatters, see Note 43 on the Financial Statements on page 554
of the Annual Report and Accounts 2013.
Provisions for legal proceedings and regulatory matters and
for customer remediation are disclosed in Note 31 on the Financial Statements on page 526 of the Annual Report andAccounts 2013.
For details of operational losses, see page 246 of the AnnualReport and Accounts 2013.
For details of our critical accounting policies, see page 72 of
the Annual Report and Accounts 2013.

7/17/2019 Strategic Report 2013
http://slidepdf.com/reader/full/strategic-report-2013 44/54
H S B C H O L D I N G S P L C
Strategic Report (continued) Rewarding performance > Employee remuneration / Directors’ remuneration
42
Rewarding performance
• Employee remuneration ..................................... 42
•
Directors’ remuneration ...................................... 43
•
Remuneration policy going forward ............ 44
• External reporting ................................................... 45
Our remuneration strategy rewards commercialsuccess and compliance with our risk
management framework.
The quality of our people and their long-term commitment to the Group are fundamental to our success. We
therefore aim to attract, retain and motivate the very best people who are committed to maintaining a long-term
career with HSBC, and who will perform their role in the long-term interests of shareholders.
Employee remuneration
HSBC’s reward package comprises four key
elements of remuneration:
• fixed pay;
• benefits;
• annual incentive; and
• the Group Performance Share Plan (‘GPSP’).
These elements support the achievement of our
objectives through balancing reward for both short-
term and long-term sustainable performance. Our
strategy is designed to reward only success, and
aligns employees’ remuneration with our risk
framework and risk outcomes. For our most senior
employees the greater part of their reward is deferred
and thereby subject to malus, that is, it can be
cancelled if warranted by events.
In order to ensure alignment between what we
pay our people and our business strategy, we assess
individual performance against annual and long-term
financial and non-financial objectives which are
summarised in performance scorecards. This
assessment also takes into account adherence to
the HSBC Values of being ‘open, connected and
dependable’ and acting with ‘courageous integrity’.
Altogether, performance is therefore judged not only
on what is achieved over the short and long-term but
also importantly on how it is achieved, as we believe
the latter is essential to the long-term sustainability
of the business.
Industry changes and key challenges
The main drivers of change in remuneration policy
and practice within the financial services industry
are the new regulations under CRD IV which apply
globally to all employees of EU headquartered
banks. The key change is the application of a cap on
variable pay that can be paid to any ‘material risk
taker’ (being employees who have been identifiedas having a material impact on the institution’s risk
profile). This presents significant challenges for
HSBC given the fact that as a worldwide business, a
significant number of our material risk takers are
based outside the EU.
This situation has necessitated a review of our
remuneration policy, especially the balance betweenfixed and variable pay, to ensure we can remain
competitive on a total compensation basis and retain
our key talent. Bearing in mind the interests of our
shareholders, the Board believes it is necessary to
increase the variable pay cap to the 200% of fixed
pay for material risk takers that is permitted under
CRD IV with shareholder approval. This will enable
us to hold back a larger proportion of variable pay,
subject to malus, than would be the case if we were
not to take advantage of this provision. It will require
shareholder approval at the AGM on 23 May 2014.
Overall, a representative number of our majorinstitutional shareholders have been supportive of
the proposed changes to our remuneration policy and
recognise the importance of ensuring we can retain
our key talent.
Variable pay pool determination
Determining the quantum of variable pay requires
consideration of affordability, the equitable
distribution between shareholders and employees
and market-based judgements around peer
comparisons and retention risk. The Group
Remuneration Committee considers many factorsin determining HSBC’s variable pay pool funding.
The total variable pay pool for 2013 was US$3.9bn,
increased from US$3.7bn in 2012, as shown in the
table below:
Variable pay pool
Group
2013 2012 US$m US$m
Variable pay pool
– total ......................................... 3,920 3,689
– as a percentage of
underlying profit ..................... 15% 17% – percentage of pool deferred28 . 18% 17%
For footnote, see page 46.

7/17/2019 Strategic Report 2013
http://slidepdf.com/reader/full/strategic-report-2013 45/54
43
Funding
The variable pay pool takes into account the
performance of the Group which is considered
within the context of our Risk Appetite Statement.This ensures that the variable pay pool is shaped by
risk considerations, and is shaped by an integrated
approach to business, risk and capital management
which supports achievement of our strategic
objectives.
Funding is calibrated with reference to Group
profitability, capital strength, and shareholder
returns. This approach ensures that performance-
related awards for any global business, global
function, geographical region or level of staff are
considered in a holistic fashion.
The methodology also considers the relationship
between capital, dividends and variable pay to
ensure that the distribution of post-tax profits
between these three elements is considered
appropriate.
For the Directors’ Remuneration Report for the 2012, 2013and target split, see page 394 of the Annual Report andAccounts 2013.
Relative importance of spend on pay
The following chart provides a breakdown of
total staff pay relative to the amount paid out in
dividends.
For footnote, see page 46.
Directors’ remuneration
The single total figure for Directors’ remuneration
required by Schedule 8 of the Large and Medium-
Sized Companies (Accounts and Reports)
Regulations 2008 is as follows:
Executive Directors
Douglas Flint Stuart Gulliver Iain Mackay
2013 2012 2013 2012 2013 2012
£000 £000 £000 £000 £000 £000
Fixed pay
Base salary .............................................. 1,500 1,500 1,250 1,250 700 700
Pension .................................................... 750 750 625 625 350 350
2,250 2,250 1,875 1,875 1,050 1,050
Benefits ....................................................... 48 64 591 642 33 36
Variable pay
Annual incentive ..................................... – – 1,833 780 1,074 539
GPSP ....................................................... – – 3,667 3,000 2,148 1,400
– – 5,500 3,780 3,222 1,939
Notional return on deferred cash ................ 27 12 – – 7 3
Non-taxable benefits ................................... 102 98 67 65 53 50Total single figure of remuneration ............. 2,427 2,424 8,033 6,362 4,365 3,078
ddendum
Annual incentive with performance
conditions30 ............................................. – – – 1,170 – 809
Total single figure of remuneration and
annual incentive with performance
conditions ................................................ 2,427 2,424 8,033 7,533 4,365 3,887
For footnote, see page 46.
8,300
20,491
9,200
19,196
Ordinarydividends
Employee compensationand benefits
2012 2013
-6%
US$m
+11%
29

7/17/2019 Strategic Report 2013
http://slidepdf.com/reader/full/strategic-report-2013 46/54
H S B C H O L D I N G S P L C
Strategic Report (continued) Rewarding performance / Directors’ remuneration / Remuneration policy going forward / External reporting
44
Douglas Flint, as Group Chairman, is not
eligible for an annual incentive and did not receive a
GPSP award in 2013.
Marc Moses was appointed an executiveDirector with effect from 1 January 2014, reflecting
the criticality of the Risk function to HSBC and his
leadership of the function, and recognises his
personal contribution to the Group.
A full summary of the variable pay performance
outcomes for the two eligible executive Directorsreceiving such awards in 2013 is tabulated below.
For full details of Directors’ remuneration, see page 389 of
the Annual Report and Accounts 2013.
Variable pay performance for 2013
Stuart Gulliver Iain Mackay
Maximum
multiple
Pre-
discretion
per-
formance
outcome
Multiple
awarded
Pre-
discretion
value
Com-
mittee
discretion31
Post-
discretion
value
Maximum
multiple
Post-
discretion
per-
formance
outcome
Multiple
awarded Value
£000 £000 £000 £000
Salary
........... 1.00 100% 1.00 1,250 n/a 1,250 1.00 100% 1.00 700Annual
incentive ... 3.00 60% 1.80 2,250 (417) 1,833 3.00 51% 1.53 1,074
GPSP ............. 6.00 60% 3.60 4,500 (833) 3,667 5.10 60% 3.07 2,148
Total .............. 8,000 (1,250) 6,750 3,922
For footnote, see page 46.
Remuneration policy going forward
In order to deal with the challenges of CRD IV we
have introduced changes to our remuneration
structure for executive Directors in 2014 as
summarised in the table below, subject to
shareholders’ approval at the 2014 AGM. If
approved, the policy is intended to apply for three
years to the conclusion of the AGM in 2017.
For full details of the remuneration policy for executive
Directors, see page 381 of the Annual Report and Accounts
2013.
Changes in remuneration policy for 2014
Purpose and link
to strategy Operation Maximum opportunity
Performance
metrics
Salary No change No change No change (none)
Fixed pay allowance32 Introduction of
share allowance
Maximum fixed pay allowance for each executive Director will be
the difference between (i) 50% of the target remuneration of the
executive Director under this policy and (ii) the aggregate of the base
salary and cash allowance in lieu of pension for that executive
Director
None
Benefits No change No change No change (none)
Total variable pay No change Maximum at 900% of salary reduced to 200% of fixed pay No change
Annual incentive32 No change Maximum incentive reduced from 300% of base salary to 67% of
fixed pay
See page 382 of the
nnual Report and
ccounts 2013
GPSP32 No change Maximum incentive reduced from 600% of base salary to 133% of
fixed pay
See page 383 of the
nnual Report and
ccounts 2013
Pension No change No change No change (none)
For footnote, see page 46.
The mix of fixed and variable pay granted to
an employee is commensurate with the individual’s
role, experience and responsibility and the local
market.
Fixed pay allowances will only be granted to
certain material risk takers based on their role,
function, experience and technical expertise. The
Group Chairman will not be eligible for a fixed pay
allowance.
Executive Directors, Group Managing Directors
and Group General Managers will receive shares that
vest immediately. The shares (net of shares sold to
cover any income tax and social security) will be
subject to a retention period. 20% of these shares

7/17/2019 Strategic Report 2013
http://slidepdf.com/reader/full/strategic-report-2013 47/54
45
will be released in March immediately following the
end of the financial year in which the shares are
granted. The remaining 80% will be subject to a
retention period of at least five years.All other employees will receive the fixed pay
allowance in cash when it is below a specified
threshold. Where the fixed pay allowance is above
the specified threshold, all of it will be received in
shares that vest immediately. Any shares delivered
(net of shares sold to cover any income tax and
social security) as part of the fixed pay allowance
would be subject to a retention period. 40% of the
shares will be released in March following the end of
the relevant financial year in which the shares were
granted. The remaining 60% will be released in three
equal annual tranches on each anniversary of theinitial release.
Group Managing Directors participate in both
the annual incentive and the GPSP. Group General
Managers participate in the annual incentive and
may receive other long-term awards. Other
employees across the Group are eligible to
participate in annual incentive arrangements.
External reporting
The required remuneration disclosures for Directors
and highest paid employees in the Group are madein the Directors Remuneration Report on page 378
of the Annual Report and Accounts 2013.
Remuneration disclosures for Code Staff can be
found in the Pillar 3 Disclosures 2013.
On behalf of the Board 24 February 2014
D J Flint, Group Chairman
HSBC Holdings plc
Registered number 617987
7/17/2019 Strategic Report 2013
http://slidepdf.com/reader/full/strategic-report-2013 48/54
H S B C H O L D I N G S P L C
Strategic Report (continued) Footnotes // Directors
46
Footnotes to Strategic Report
1 A Basel II measure, of core tier 1 capital expressed as percentage of total risk-weighted assets.
2 The cost efficiency ratio is defined as total operating expenses divided by net operating income before loan impairment charges and
other credit risk provisions.3 Dividends recorded in the financial statements are dividends per ordinary share declared in a year and are not dividends in respect of,
or for, that year. The third interim dividend for 2012 of US$0.09 was paid on 12 December 2012. The fourth interim dividend for 2012of US$0.18 was paid on 8 May 2013. First, second and third interim dividends for 2013, each of US$0.10 per ordinary share, were
paid on 11 July 2013, 9 October 2013 and 11 December 2013, respectively. Note 10 on the Financial Statements provides more
information on the dividends declared in 2013. On 24 February 2014 the Directors declared a fourth interim dividend for 2013 ofUS$0.19 per ordinary share in lieu of a final dividend, which will be payable to ordinary shareholders on 30 April 2014 in cash in US
dollars, or in pounds sterling or Hong Kong dollars at exchange rates to be determined on 22 April 2014, with a scrip dividend
alternative. The reserves available for distribution at 31 December 2013 were US$49,339m.Quarterly dividends of US$15.5 per 6.2% non-cumulative Series A US dollar preference share, equivalent to a dividend of US$0.3875
per Series A American Depositary Share, each of which represents one-fortieth of a Series A US dollar preference share, were paid on
15 March 2013, 17 June 2013, 16 September 2013 and 16 December 2013.
Quarterly coupons of US$0.508 per security were paid with respect to 8.125% capital securities on 15 January 2013, 15 April 2013,
15 July 2013 and 15 October 2013.Quarterly coupons of US$0.5 per security were paid with respect to 8% capital securities on 15 March 2013, 17 June 2013,
16 September 2013 and 16 December 2013.4 The return on average ordinary shareholders’ equity is defined as profit attributable to ordinary shareholders of the parent company
divided by average ordinary shareholders’ equity.5 Net operating income before loan impairment charges and other credit risk provisions, also referred to as ‘revenue’.6 Intermediation of securities, funds and insurance products, including Securities Services in GB&M.7 Merger and acquisition, event and project financing, and co-investments in GPB.8 Including Foreign Exchange, Rates, Credit and Equities.9 Including portfolio management.
10 Including private trust and estate planning (for financial and non-financial assets).11 Including hedge funds, real estate and private equity.12 Loan impairment charges and other credit risk provisions.13 Share of profit in associates and joint ventures.14 In 2013, GB&M changed the way it manages repo and reverse repo activities in the Credit and Rates businesses as set out on page 68
of the Annual Report and Accounts 2013. This led to an increase in the amount of reverse repo and repo agreements classified as
‘Loans and advances to customers’ at amortised cost and 'Customer accounts' at amortised cost in the balance sheet, respectively.15 A Basel III measure, of common equity tier 1 capital expressed as percentage of total risk exposure amount. 16 UK bank levy paid reflects the payments made to the tax authorities during the calendar year and may differ from the recognition of
liabilities charged to the income statement.
17 Excludes movements in the fair value of own debt and before variable pay distributions (page 378 of the Annual Report and Accounts 2013 ). 18 Each American Depositary Share represents five ordinary shares.19 Total shareholder return is defined as the growth in share value and declared dividend income during the relevant period.20 The Financial Times Stock Exchange 100 Index, The Morgan Stanley Capital International World Index and The Morgan Stanley
Capital International World Bank Index.21 Established on 17 January 2014.22 Established on 22 November 2013.23 The HSBC UK entity shown comprises five legal entities; HSBC Bank plc (including all overseas branches), and SPEs consolidated by
HSBC Bank plc for Financial Statement purposes, Marks and Spencer Financial Services Limited, HSBC Private Bank (UK) Ltd, HFC
Bank Ltd and HSBC Trust Company (UK) Limited, managed as a single operating entity, in line with the application of UK liquidityregulation as agreed with the UK PRA.
24 The Hongkong and Shanghai Banking Corporation represents the bank in Hong Kong including all overseas branches. Each branch is
monitored and controlled for liquidity and funding risk purposes as a standalone operating entity.25 The HSBC USA principal entity shown represents the HSBC USA Inc consolidated group; predominantly HSBC USA Inc and HSBC
Bank USA, NA. The HSBC USA Inc consolidated group is managed as a single operating entity.26 The sum of balances presented does not agree to consolidated amounts because inter-company eliminations are not presented here.
27 Targets for 2014 to 2016 were announced at our Investor Update on 15 May 2013.28 The percentage of variable pay deferred for the Code Staff population was 64%.
29 Dividends per ordinary share in respect of that year. For 2013, this includes the first, second and third interim dividends paid in 2013
of US$5.6bn (gross of scrip) and a fourth interim dividend of US$3.6bn.30 60% of the 2012 annual incentive for Stuart Gulliver and Iain Mackay disclosed in the 2012 Directors’ Remuneration Report was
deferred for five years. The vesting of these awards is subject to a service condition and satisfactory completion of the DPA. The DPA
condition ends on the fifth anniversary of the award date unless the DPA is extended or otherwise continues beyond that date, in whichcase the awards will vest on the date on which the DPA expires and otherwise ceases to operate.
31 In its meeting of 15 January 2014, the Group Remuneration Committee used its discretion to reduce overall variable pay by £1.25m
(equivalent to 18.5% of the total annual incentive and GPSP). This adjustment was considered appropriate in the context of overall
Group-wide year-over-year profitability and incentive pool funding, Group-wide risk and compliance, market remuneration
benchmarks and the remuneration recommendations for the Group CEO’s direct reports.32 Maximum award potentials for fixed pay allowances and variable pay awards are based on obtaining shareholder approval to increase
the maximum variable pay award as a percentage of fixed pay under CRD IV from 100% to 200% at the Annual General Meeting on
23 May 2014. If shareholder approval is not obtained the maximum fixed pay allowance payable for each executive Director under the policy will be the difference between (i) 50% of maximum total remuneration of the executive Director under this policy as shown in the
Remuneration scenarios chart on page 389 of the Annual Report and Accounts 2013 and (ii) the aggregate of the base salary and cashallowance in lieu of pension for that executive Director. Maximum variable pay award levels will be revised to 100% of fixed pay andthe maximum annual incentive and GPSP awards will accordingly be reduced to 1/3 and 2/3 of this amount (i.e. 33% and 67% of f ixed
pay, respectively). The requested increase in the cap to 200% would enable us to minimise the increase in fixed remuneration costs and
so help to maintain greater flexibility on total pay.

7/17/2019 Strategic Report 2013
http://slidepdf.com/reader/full/strategic-report-2013 49/54
47
Directors
Douglas Flint, CBE
Group Chairman
Stuart Gulliver
Group Chief Executive
Kathleen Casey1 on-executive Director
Safra Catz
on-executive Director
Laura Cha, GBS
on-executive Director
Marvin Cheung, GBS, OBE
on-executive Director
John Coombe2
on-executive Director
Sir Jonathan Evanson-executive Director
Joachim Faber
on-executive Director
Rona Fairhead, CBE
on-executive Director
Renato Fassbind
on-executive Director
James Hughes-Hallett, CMG, SBS2
on-executive Director

7/17/2019 Strategic Report 2013
http://slidepdf.com/reader/full/strategic-report-2013 50/54
H S B C H O L D I N G S P L C
Strategic Report (continued) Directors / Supplementary information
48
Directors (continued)
Sam Laidlaw
on-executive Director
John Lipsky
on-executive Director
Rachel Lomax
on-executive Director
Iain Mackay
Group Finance Director
Marc Moses1
Group Chief Risk Officer
Sir Simon Robertson
Deputy Chairman and senior independent non-
executive Director
Ben Mathews
Group Company Secretary
1 Marc Moses was appointed as a Director on 1 January 2014 and Kathleen Casey will be appointed on 1 March 2014.2 James Hughes-Hallett and John Coombe are due to retire at the conclusion of the 2014 Annual General Meeting.
For full biographies of the Directors, see page 330 of the Annual Report and Accounts 2013 and online at
www.hsbc.com.

7/17/2019 Strategic Report 2013
http://slidepdf.com/reader/full/strategic-report-2013 51/54
H S B C H O L D I N G S P L C
Strategic Report (continued) Supplementary information
49
Supplementary information • Status of the Strategic Report 2013
• Copies of the Annual Report and
Accounts 2013
• Shareholder enquiries and
communications
• Report of the auditor
Status of the Strategic Report 2013
This Strategic Report 2013 is a part of HSBC Holdings plc Annual Report and Accounts 2013 and is not the Group’s
statutory accounts. It does not contain the full text of the Directors’ Report and it does not contain sufficient
information to allow as full an understanding of the results and state of affairs of the Group and of its policies
and arrangements concerning Directors’ remuneration as would be provided by the full Annual Report and
Accounts 2013.
Copies of the Annual Report and Accounts 2013
Further copies of the Strategic Report 2013 and the Annual Report and Accounts 2013 may be obtained from Global
Communications, HSBC Holdings plc, 8 Canada Square, London E14 5HQ, United Kingdom; from Communications
(Asia), The Hongkong and Shanghai Banking Corporation Limited, 1 Queen’s Road Central, Hong Kong; or from
Global Publishing Services, HSBC – North America, 26525 North Riverwoods Boulevard, Mettawa, Illinois 60045,
USA. The Strategic Report 2013 and the Annual Report and Accounts 2013 may also be downloaded from the HSBC
website, www.hsbc.com.
Shareholder enquiries and communications
Enquiries
Any enquiries relating to your shareholdings on the share register, for example transfers of shares, change of name or
address, lost share certificates or dividend cheques, should be sent to the Registrars at the address given below. The
Registrars offer an online facility, Investor Centre, which enables shareholders to manage their shareholding
electronically.
Principal Register Hong Kong Overseas Branch Register ermuda Overseas Branch Register
Computershare Investor Services PLC
The Pavilions
Bridgwater Road
Bristol BS99 6ZZ
United Kingdom
Telephone: +44 (0) 870 702 0137
Email via website:
www.investorcentre.co.uk/contactus
Investor Centre:
www.investorcentre.co.uk
Computershare Hong Kong Investor
Services Limited
Rooms 1712-1716, 17th Floor
Hopewell Centre
183 Queen’s Road East
Hong Kong
Telephone: +852 2862 8555
Email:
Investor Centre:
www.investorcentre.com/hk
Investor Relations Team
HSBC Bank Bermuda Limited
6 Front Street
Hamilton HM 11
Bermuda
Telephone: +1 441 299 6737
Email:
Investor Centre:
www.investorcentre.co.uk/bm
Holders of ADSs Holders of shares through Euroclear France
The Bank of New York Mellon
Depositary Receipts
PO Box 43006
Providence, RI 02940-3006
USA
HSBC France
103 avenue des Champs Elysées
75419 Paris Cedex 08
France
Telephone (US): +1 877 283 5786
Telephone (international): +1 201 680 6825
Email: [email protected]
Website: www.bnymellon.com/shareowner
Telephone: +33 1 40 70 22 56
Email: ost-agence-des-titres-hsbc-reims.hbfr-
Website: www.hsbc.fr
7/17/2019 Strategic Report 2013
http://slidepdf.com/reader/full/strategic-report-2013 52/54
H S B C H O L D I N G S P L C
Strategic Report (continued) Supplementary information
50
Persons whose shares are held on their behalf by another person may have been nominated to receive
communications from HSBC pursuant to section 146 of the UK Companies Act 2006 (‘nominated person’). The
main point of contact for a nominated person remains the registered shareholder (for example your stockbroker,
investment manager, custodian or other person who manages the investment on your behalf). Any changes or queriesrelating to a nominated person’s personal details and holding (including any administration thereof) must continue
to be directed to the registered shareholder and not HSBC’s Registrars. The only exception is where HSBC, in
exercising one of its powers under the UK Companies Act 2006, writes to nominated persons directly for a response.
Electronic communications
Shareholders may at any time choose to receive corporate communications in printed form or to receive notifications
of their availability on HSBC’s website. To receive future notifications of the availability of a corporate
communication on HSBC’s website by email, or revoke or amend an instruction to receive such notifications by
email, go to www.hsbc.com/ecomms. If you provide an email address to receive electronic communications from
HSBC, we will also send notifications of your dividend entitlements by email. If you received a notification of the
availability of this document on HSBC’s website and would like to receive a printed copy or, if you would like to
receive future corporate communications in printed form, please write or send an email (quoting your shareholderreference number) to the appropriate Registrars at the address given below. Printed copies will be provided without
charge.
A Chinese translation of this and future documents may be obtained on request from the Registrars. Please also
contact the Registrars if you have received a Chinese translation of this document and do not wish to receive such
translations in future.
Persons whose shares are held on their behalf by another person may have been nominated to receive
communications from HSBC pursuant to section 146 of the UK Companies Act 2006 (‘nominated person’). The
main point of contact for a nominated person remains the registered shareholder (for example your stockbroker,
investment manager, custodian or other person who manages the investment on your behalf). Any changes or queries
relating to a nominated person’s personal details and holding (including any administration thereof) must continue
to be directed to the registered shareholder and not HSBC’s Registrars. The only exception is where HSBC, in
exercising one of its powers under the UK Companies Act 2006, writes to nominated persons directly for a response.
Report of the auditor
The auditor’s report on the full accounts for the year ended 31 December 2013 was unqualified, and their statement
under section 496 (whether the Strategic Report and the Directors’ Report are consistent with the accounts) of the
Companies Act 2006 was unqualified.

7/17/2019 Strategic Report 2013
http://slidepdf.com/reader/full/strategic-report-2013 53/54
© Copyright HSBC Holdings plc 2014
All rights reserved
No part of this publication may be reproduced, stored in
a retrieval system, or transmitted, in any form or by any
means, electronic, mechanical, photocopying, recording,
or otherwise, without the prior written permission of
HSBC Holdings plc.
Published by Group Finance, HSBC Holdings plc,
London
Cover designed by Black Sun Plc, London; text pagesdesigned by Group Finance, HSBC Holdings plc,
London, and by Communications (Asia), The Hongkong
and Shanghai Banking Corporation Limited, Hong Kong
Printed by Park Communications Limited, London,
on Revive 50 White Silk (cover) and Revive 100 White
Offset (text pages) using vegetable oil-based inks. Made
in Italy, the cover board comprises 50% virgin fibre, 25%
de-inked post-consumer waste and 25% pre-consumer
waste. Made in Austria, the text paper comprises 100%
de-inked post-consumer waste. Pulps used are totally
chlorine-free.
The FSC® logo identifies products which contain wood
from well-managed forests certified in accordance with
the rules of the Forest Stewardship Council®.
Photography
Cover by Matthew Mawson
Group Chairman and Group Chief Executive by George Brooks
Board of Directors by George Brooks except Safra Catz and
Joachim Faber by Patrick Leung
Stock number 99325-5

7/17/2019 Strategic Report 2013
http://slidepdf.com/reader/full/strategic-report-2013 54/54


