Paper No. ICETECH12-132-RF P. S. Reddy Gudimetla Page number: 1 Strength and Pressure Profiles from Conical Ice Crushing Experiments P. S. Reddy Gudimetla Memorial University, St. John`s, NL, Canada. [email protected]Bruce Colbourne, Claude Daley, Stephen E. Bruneau, Robert Gagnon Memorial University, St. John`s, NL, Canada. National Research Council Canada St. John`s, NL, Canada ABSTRACT Experimental procedures for obtaining the crushing strength and pressure profiles of cone shaped ice samples are presented. These experiments were conducted as the part of the STePS 2 (Sustainable Technology for Polar Ships and Structures) research project at Memorial University, St. John`s, Canada. An objective of this project is to study the response of a full size structural grillage for both quasi-static and dynamic ice loading. To prepare for the structural tests, both 1/4 m dia. and 1m dia. conical ice samples are being crushed against a rigid high-resolution pressure panel in quasi-static conditions. Data from the tests on the pressure panel will help to set the conditions for the later quasi-static and dynamic experiments on the steel grillage. Contact pressure profiles are obtained at each time step during the experiments. The pressure profiles obtained reveal the shape and variability of the high pressure zones that develop during ice-structure contact. The paper describes the experimental procedure including; making the ice samples, shaping the samples, crushing tests and data analysis. Preliminary experimental data from both small cones (i.e., 25 cm diameter) and large cones (i.e., 1 m diameter) tests are provided in this paper. KEY WORDS: ice loads; pressure-area relationships; experimental apparatus. Introduction Ice under load may respond as a brittle solid or as a visco-elastic ductile material, depending on loading conditions, ice morphology and composition, and the ambient physical state under which the loading occurs. The mechanical properties of pure ice are fairly well known at laboratory scale. The ductile range of responses has been sufficiently examined to enable reasonable engineering analysis for most practical circumstances. The case of brittle failure is less clear and analysis, even for general engineering applications, requires careful consideration, and conservative approaches. Further, the confidence with which engineers analyze structural responses to sea ice - as an extension of pure ice behavior - is further reduced because of the influence of natural salts on the physical properties of water and ice and the wide range of sea ice encountered. The result of this situation is that a combination of theoretical and empirical analysis approaches is often employed when investigating design questions involving the fracture of ice. Experiments are often conducted to simulate ice loading scenarios in a natural environment. These may be carried out more practically at reduced scale, with alternate forms of ice and with boundary conditions that are not an exact analog of the full scale real-time events of interest. Many such experiments can be found in literature [1-8]. Yet significant information may be gleaned from them and in many circumstances scaling and correction factors may be applied to furnish satisfactory full-scale predictions. STePS 2 experiments are being done on few scales, the smallest of which provides a low cost flexible platform with which to investigate a range of parameters both qualitatively and quantitatively. The large scale, though more complex, time consuming and costly, provides a laboratory analogue of ice-structural interactions under near full-scale conditions. This paper focuses on procedures involved in a first stage ice-structure interaction experiment undertaken at STePS 2 . The two main outcomes intended from this experiment are: Investigate the peak achievable strengths of various sizes and shapes of ice samples. Obtain pressure-area characteristic profiles for various sizes and shapes of ice sample. The experiment is a combination of the following four procedures: 1. Preparing an Ice Sample. 2. Shaping the Ice Sample. 3. Conducting the Crushing Test and 4. Data Analysis. These steps are different in case of small and large cones, each of these steps are discussed in the following sections.
Transcript
Paper No. ICETECH12-132-RF P. S. Reddy Gudimetla Page number: 1
Strength and Pressure Profiles from Conical Ice Crushing Experiments
Bruce Colbourne, Claude Daley, Stephen E. Bruneau, Robert Gagnon Memorial University,
St. John`s, NL, Canada. National Research Council Canada
St. John`s, NL, Canada
ABSTRACT Experimental procedures for obtaining the crushing strength and pressure profiles of cone shaped ice samples are presented. These experiments were conducted as the part of the STePS2 (Sustainable Technology for Polar Ships and Structures) research project at Memorial University, St. John`s, Canada. An objective of this project is to study the response of a full size structural grillage for both quasi-static and dynamic ice loading. To prepare for the structural tests, both 1/4 m dia. and 1m dia. conical ice samples are being crushed against a rigid high-resolution pressure panel in quasi-static conditions. Data from the tests on the pressure panel will help to set the conditions for the later quasi-static and dynamic experiments on the steel grillage. Contact pressure profiles are obtained at each time step during the experiments. The pressure profiles obtained reveal the shape and variability of the high pressure zones that develop during ice-structure contact. The paper describes the experimental procedure including; making the ice samples, shaping the samples, crushing tests and data analysis. Preliminary experimental data from both small cones (i.e., 25 cm diameter) and large cones (i.e., 1 m diameter) tests are provided in this paper.
Introduction Ice under load may respond as a brittle solid or as a visco-elastic ductile material, depending on loading conditions, ice morphology and composition, and the ambient physical state under which the loading occurs. The mechanical properties of pure ice are fairly well known at laboratory scale. The ductile range of responses has been sufficiently examined to enable reasonable engineering analysis for most practical circumstances. The case of brittle failure is less clear and analysis, even for general engineering applications, requires careful consideration, and conservative approaches. Further, the confidence with which engineers analyze structural responses to sea ice - as an extension of pure ice
behavior - is further reduced because of the influence of natural salts on the physical properties of water and ice and the wide range of sea ice encountered. The result of this situation is that a combination of theoretical and empirical analysis approaches is often employed when investigating design questions involving the fracture of ice. Experiments are often conducted to simulate ice loading scenarios in a natural environment. These may be carried out more practically at reduced scale, with alternate forms of ice and with boundary conditions that are not an exact analog of the full scale real-time events of interest. Many such experiments can be found in literature [1-8]. Yet significant information may be gleaned from them and in many circumstances scaling and correction factors may be applied to furnish satisfactory full-scale predictions. STePS2 experiments are being done on few scales, the smallest of which provides a low cost flexible platform with which to investigate a range of parameters both qualitatively and quantitatively. The large scale, though more complex, time consuming and costly, provides a laboratory analogue of ice-structural interactions under near full-scale conditions. This paper focuses on procedures involved in a first stage ice-structure interaction experiment undertaken at STePS2. The two main outcomes intended from this experiment are:
Investigate the peak achievable strengths of various sizes and shapes of ice samples.
Obtain pressure-area characteristic profiles for various sizes and shapes of ice sample.
The experiment is a combination of the following four procedures: 1. Preparing an Ice Sample. 2. Shaping the Ice Sample. 3. Conducting the Crushing Test and 4. Data Analysis.
These steps are different in case of small and large cones, each of these steps are discussed in the following sections.
Paper No. ICETECH12-132-RF P. S. Reddy Gudimetla Page number: 2
Experimental Procedures The preparation of small ice cone and large cone samples are slightly different. Small samples are commonly cut out of purchased blocks of clear ice and larger samples are frozen from a mixture of crushed ice and applied water. The basic procedures for each of these processes are given below. Crushed ice preparation Bulk ice cubes made of filtered water are crushed using a commercial ice crusher, into uniform pebbles from 1/8" to 3/8" in diameter [9]. These crushed ice pebbles are then collected into trays and stored temporarily in a cold room at -10oC. Preparation of Small Samples Blocks of commercially available ice are used for the small cone preparation. Thirty centimetre cubes are cut out of a block using a power saw. Each of these cubes is then converted into a cylinder of 25 cm diameter using a band saw. Once the cylinders are prepared, they are frozen into aluminium rings which are used in mounting the cylinder into shaping or testing machines. The cylinders are frozen into the rings by pouring some water around them and then allowing them to freeze in the cold room for 2 to 4 hours. Preparation of Large Samples The large ice sample holder is fitted with an extension mold and an insulation cone. This assembly yields a partially shaped rough cone which considerably reduces the total amount of crushed ice consumed and the time taken in shaping it to the final shape. This assembly is left in the cold room for half-an-hour to pre-cool the system. Once the ice holder assembly is cooled, the ice holder assembly is leveled and marked buckets are used to add the required quantities of crushed ice and tap water into the large ice holder. Crushed ice and water are used in a 2:1 ratio. During every step of the flooding process, water is added evenly to the crushed ice. This is to ensure that wells do not form because of flooding in a particular location. The mixture is stirred to break up any layers of ice that begin to form early in the flooding process. Stirring also helps to remove the air from the mixture, according to Cole [10]. Once the mold is filled with the ice-water mixture, an insulation blanket is placed over the top of the ice holder and three electrical fans are provided on both sides and at the bottom of the ice holder to provide air circulation to enhance bottom up cooling. Large ice samples take 3 to 4 days to freeze completely. After freezing is complete, the insulating blanket, mold and cylindrical extensions are removed. The large ice sample is now ready for shaping. Figure 1 shows the sequence of steps. Shaping the Ice Sample Once an ice sample is ready, the same basic procedures are followed for shaping small and large samples except that different sized machines are used in the shaping process. In both cases the ice is shaped by a custom built potters-wheel type device. The smaller machine accepts a sample up to 30 cm diameter and the larger machine accepts a sample up to 1.5m diameter. Figures 2 and 3 show the shaping operations at both sizes. A planer blade is used for shaving each sample into a cone. This blade is affixed to an arm; the top of the arm is bolted to the frame of the device and the bottom of the arm is bolted to a jack. Each end of the arm is free to rotate. Turing a crank clockwise lowers the blade, and turning the crank counter-clockwise raises the blade. Lowering the blade to pre-determined location shapes the sample to the desired angle.
Figure 1 Preparation of Large Ice Cone Sample
Paper No. ICETECH12-132-RF P. S. Reddy Gudimetla Page number: 3
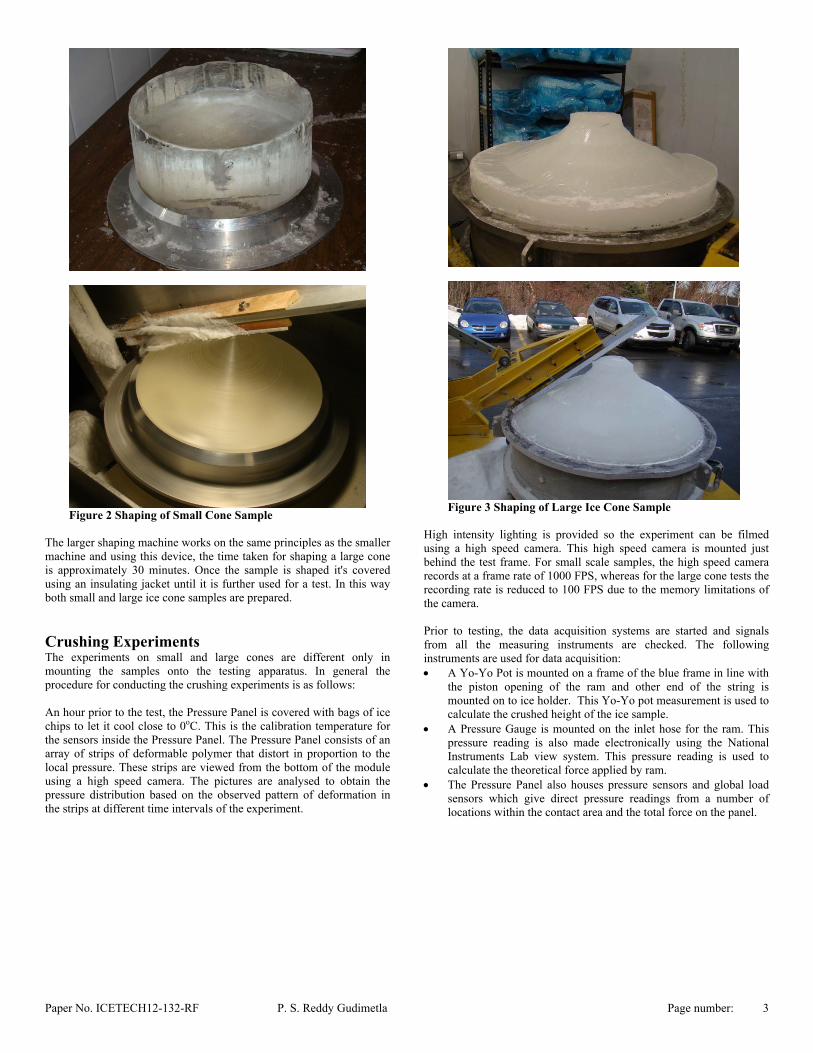
Figure 2 Shaping of Small Cone Sample
The larger shaping machine works on the same principles as the smaller machine and using this device, the time taken for shaping a large cone is approximately 30 minutes. Once the sample is shaped it's covered using an insulating jacket until it is further used for a test. In this way both small and large ice cone samples are prepared.
Crushing Experiments The experiments on small and large cones are different only in mounting the samples onto the testing apparatus. In general the procedure for conducting the crushing experiments is as follows: An hour prior to the test, the Pressure Panel is covered with bags of ice chips to let it cool close to 0oC. This is the calibration temperature for the sensors inside the Pressure Panel. The Pressure Panel consists of an array of strips of deformable polymer that distort in proportion to the local pressure. These strips are viewed from the bottom of the module using a high speed camera. The pictures are analysed to obtain the pressure distribution based on the observed pattern of deformation in the strips at different time intervals of the experiment.
Figure 3 Shaping of Large Ice Cone Sample
High intensity lighting is provided so the experiment can be filmed using a high speed camera. This high speed camera is mounted just behind the test frame. For small scale samples, the high speed camera records at a frame rate of 1000 FPS, whereas for the large cone tests the recording rate is reduced to 100 FPS due to the memory limitations of the camera. Prior to testing, the data acquisition systems are started and signals from all the measuring instruments are checked. The following instruments are used for data acquisition: A Yo-Yo Pot is mounted on a frame of the blue frame in line with
the piston opening of the ram and other end of the string is mounted on to ice holder. This Yo-Yo pot measurement is used to calculate the crushed height of the ice sample.
A Pressure Gauge is mounted on the inlet hose for the ram. This pressure reading is also made electronically using the National Instruments Lab view system. This pressure reading is used to calculate the theoretical force applied by ram.
The Pressure Panel also houses pressure sensors and global load sensors which give direct pressure readings from a number of locations within the contact area and the total force on the panel.
Paper No. ICETECH12-132-RF P. S. Reddy Gudimetla Page number: 4
Figure. 4 Crushing Small and Large Ice Cone Samples
Once all these steps are complete, the ice sample is moved from the cold room and mounted onto the test frame. Different mounting arrangements are used for the two different sized ice samples. For small samples: the ice holder is connected to the end of the ram using an adapter. The ice holder is mounted by first placing the adapter into the ram and then the ice holder is attached onto the other end of the adapter. The large ice holder, when filled with ice, weighs around 750 lb. A 2" thick steel plate is mounted on the end of the ram using a single custom made bolt. This steel plate is provided to give structural stability to the ice holder when it is compressed against the pressure panel. Using a fork lift fitted with a special set of rotatable handling tongs, the ice holder is moved into position and bolted onto the steel plate Once on the ram, the ice holder is slowly lowered towards the pressure panel and all the measuring instruments are zeroed at this location. All the lights are switched on and high speed camera is focused on the tip of the ice cone. All the data acquisition systems including high speed camera are started and the ice sample is crushed against the impact module by moving the ram at a rate than can be varied from approximately 0.5 mm/sec to approximately 5 mm/sec. Once the test is complete, the sample is removed from the test frame and chunks of the ice are cut out of the sample for thin section analysis.
Data Analysis The current results from both small cone and large cone tests are preliminary, and have been obtained as part of test runs and for correcting bugs in the process. These results give insight into the final outcomes from these experiments. The three main outputs from the experiment are the force values, the displacement of the ram, the high speed video of the cone crushing event, the high speed video of the pressure distribution from the Pressure Panel. Using these data, the empirical load vs. time and pressure vs. time plots are obtained. On analyzing the data from the Pressure Panel the actual force and actual pressure area distributions can be obtained. Calculation of Load and Pressure The following procedure is used to obtain load and pressure values for both small and large cone experiments. Ram pressure data is collected from the input hose of the ram and the displacement data is collected using the yo-yo pot. These data values are recorded using national instruments lab view software. Using this software the pressure data is converted into the load exerted by the ram. Load vs. time and nominal ice pressure vs. time plots are then obtained using a MatLab program. In this program, the compressed depth of the ice cone is input from the displacement and the radius and nominal area at that depth is calculated. With the load data and the area obtained the nominal ice pressure for that particular depth is calculated. The output from the pressure panel is the sequence of video frames taken by a high speed camera at a rate of 8 FPS. These pictures are further analysed using a Fortran program to obtain the pressure values. This program calculates the pressure value based on the observed width and brightness of the pressure strips. The other results that are obtained from the pressure panel are the loads exerted on the panel which are recorded using load sensors that support the panel.
Paper No. ICETECH12-132-RF P. S. Reddy Gudimetla Page number: 5
X1
X2
α
R
Cd
Sample Calculation A sample calculation is provided in this section to explain the macro used for calculating empirical load and pressure data.
Figure 5 Schematic of the cone being crushed Let, The given cone angle α = 300 Initial Position of ram = X1; Final Position of ram = X2 Crushed Depth (Cd) = X2 - X1; Radius at the crushed depth (R) =Cd / tan (α) Area corresponding to this depth (A) = π R2 The value of the Load = L Therefore, the value of the Pressure (P) = L / A A series of such load and pressure values are obtained using a loop and these values are then plotted against time. Results Results obtained from both small and large cones are provided in this section. For the small cone tests only loads are calculated. The results for three small cone samples are presented in the following table: Table 1: Sample results from small cone testing
S. No
Cone Angle Sampling Rate Depth of Crushing
Force
1 30 10 Hz 33 mm 11.12 kN 2 35 10 Hz 48 mm 30.25 kN 3 35 1 KHz 72 mm 133.45 kN
Figure 6 Load vs. Distance plot of 30o block ice cone crushed to 33mm depth
Figure7 Load vs. Distance plot of 35o block ice cone crushed to 48mm depth
Figure 8 Load vs. Distance plot of 35o block ice cone crushed to 72mm depth During the small cone experiments, the load is observed to increase, as expected, with the depth of crushing. The results are consistent over a number of tests. From the plots, the typical spalling behavior of the ice can be seen. The view from the impact module is shown and compared with the physical model in the following figure. From Figure 9 it can be clearly seen that the high pressure zones in the pressure profile obtained on the pressure panel can also be observed as hard areas on the ice sample. The study of the pressure profiles from the impact module is currently under further study. For the large cone tests both loads and pressures are calculated. Three different types of cone geometries are studied. One objective is to obtain the strongest ice sample geometry for use in later tests against a structural grillage. The results for these three large cone samples are presented in Table 2. The truncated cone sample presented the most interesting results. The cone is made at a 30o cone angle and the top of the cone is truncated. As the crushing started, the pressure and load built up but at 1190 kN the sample fractured catastrophically, leading to a sharp drop in the load. With continued loading, it reached a maximum capacity of 1645 kN. The nominal calculated pressure is around 6 MPa at the maximum force location.
Paper No. ICETECH12-132-RF P. S. Reddy Gudimetla Page number: 6
Figure 9 Comparison of crushed ice sample with the pressure profile recorded on the pressure panel Table 2: Sample results from large cone testing
In the double angle cone sample, the cone is made at 30o angle and the top of the cone is converted to a shallower cone of 10o angle. In this case, the load capacity is larger compared to the truncated cone but the load cannot be maintained for long. At a load capacity of 1423 kN this sample also fractured catastrophically leading to the drop of the pressure and load. Continued loading led to a second major fracture at around 1230 kN. A typical saw tooth pattern of loading is achieved using double angle cone. The pressure calculated using the nominal area is around 16 MPa at the maximum force location. In the single angle cone sample, the cone is made at 30o angle and the tip of the cone is rounded off to give a proper start at the beginning of the loading. In this case the load rose continuously without major fractures. Typical minor spalling events were observed throughout the loading. The pressure calculated using the nominal area is around 14 MPa at the maximum force location. The pressure calculated here is a nominal value as it considers the total ideal cone sectional area at that particular crushing depth. The actual pressures will be larger than these nominal values. Due to spalling events, the area at any particular given depth will be smaller than the nominal area calculated here. The actual pressure and areas are still being analyzed using the pictures taken from impact module.
Figure 10 Load vs. Time Plot of Truncated Large Cone
Figure 11 Pressure vs. Time Plot of Truncated Large Cone
Figure 12 Load vs. Time Plot of Double Angle Large Cone
Figure 13 Load vs. Time Plot of Double Angle Large Cone
Paper No. ICETECH12-132-RF P. S. Reddy Gudimetla Page number: 7
Figure 14 Load vs. Time Plot of Single Angle Large Cone
Figure 15 Load vs. Time Plot of Double Angle Large Cone Internal Pressure Profiles The internal pressure profiles are currently been analyzed using the pictures obtained from the pressure panel. One example of such analysis is explained in this section. Figure 16 shows the progression of the internal pressure profile from the double angle cone experiment. The first picture shows the initiation of the loading, second picture is just before first major fracture. The third picture shows pressure profile just after the first major fracture and the fourth and fifth pictures show pressure profiles just before and after the second major fracture. From the pictures, it can be seen that after every large fracture event, there is a considerable change in the cross sectional area. The distribution of high pressure zones is also very clearly visible in these pictures. At present the frames are being analyzed to get more quantitative data through the following process: The pictures are sorted in the sequence of time. Using the initial frame before the experiment as a reference frame, noise from the subsequent frames is removed. Once noise free images are obtained, the images are enhanced using edge detection techniques. These enhanced pictures are used as an input to a Fortran program which calculates the pressures depending on the thickness and intensity of the pressure strips. This progression for one of the frames in the above example is shown below.
Fig. 16 Progression of Pressure Profile in Double Angle Cone Test
Paper No. ICETECH12-132-RF P. S. Reddy Gudimetla Page number: 8
Discussion A detailed description of procedures to test both small and large ice cone samples has been developed. Although the results are preliminary as these experiments are conducted as trial runs for the final experimental processes, the dependence of ice loads on the shape and loading history of the ice has been observed in the data. In small samples it is seen that the strength of the ice samples are increasing with the increase in the depth of compression. Using the results of the large cone tests, the cone shape has had a strong influence on the peak force and the regular cone appears to provide the best sample for further testing as it is more stable and progressive. A procedure for calculating nominal pressures has also been developed. The internal pressure profiles are still been analyzed and will be further presented in later publications.. Acknowledgement The authors would like to acknowledge the financial support of Atlantic Canada Opportunities Agency, Research and Development Corporation, American Bureau of Shipping, BMT Fleet Technology, Husky Energy, Rolls-Royce Marine, Samsung Heavy Industries and The National Research Council Canada.
and ice. Solid Mechanics and Its Applications, vol. 94. Kluwer Academic Publishers, pp. 149–160.
2. Frederking, R., 2004. Ice pressure variations during indentation. Proc IAHR Symposium on Ice, pp. 307–314. St Petersburg, Russia.
3. Joensuu, A., Riska, K., 1989. Contact between ice and structure (in Finnish). Report M-88, Laboratory of Naval Architecture and Marine Engineering, Helsinki University of Technology, Espoo, Finland.
4. Jordaan, I.J., Wells, J., Xiao, J., Derradji-Aouat, A., 2008. Ice crushing and cyclic loading in compression. Proc. IAHR Symposium on Ice, Vancouver, Canada.
5. Kry, P.R., 1978. A statistical prediction of effective ice crushing stresses on wide structures. Proc. IAHR International Symposium on Ice, Part.1, pp. 33–47. Luleå, Sweden.
6. Lindholm, J.E., Riska, K., Joensuu, A., 1990. Contact Between Structure and Ice; Results from Ice Crushing Tests with Flexible Indenter. Helsinki University of Technology, Ship Laboratory. Report M-101.
7. Michel, B., Toussaint, N., 1977. Mechanisms and theory of indentation of ice plates. Journal of Glaciology 19 (81).
8. Peyton, H.R., 1966. Sea ice forces. Conference on Ice Pressure against Structures. NRC Technical Memorandum No 92. Laval University, Quebec, Canada.
9. Clawson Machine; Clawson Hail Queen Ice Cube Crusher, 2011. 10. Cole, D. M. ``Preparation of Polycrystalline Ice Samples for
Laboratory Experiments``, 1979, Cold Regions Science and Technology, 1, Amsterdam, pp. 153-159.