26 March 2010 Economics & FI/FX Research Friday Notes UniCredit Research page 1 See last pages for disclaimer. Strongly diverging competitiveness within the eurozone ■ Chimera. The debt crisis involving peripheral countries of the euro zone has disproved the argument that only the EMU aggregates count. Pro- nounced national imbalances do indeed impact the euro zone as a whole and the single currency. After the downgrade of Portugal’s credit rating, the EUR-USD plummeted to a 10-month low. ■ Divergence. The external imbalances could hardly be more diverse. The current account spectrum ranges from a deficit of 11% of GDP to a sur- plus of 5% in 2009. A rapid improvement is not in sight. Ultimately, the competitive countries will profit most from the global economic recovery. This group does not include EMU peripheral countries. ■ Competitiveness. Greece, Portugal, Spain, Ireland and also Italy bring up the rear in the European ranking of price competitiveness. The gap to Germany has widened by 30%-40% over the last 10 years! According to our calculations, the primary culprit here is, however, the relative devel- opment of wages along with the development of productivity (pages 4-8 & chart below). ■ Solution. There is no doubt that stiff global competition requires in- creased efforts to boost competitiveness and innovative power as well as a responsible wage and spending policy of the peripheral countries. But even Germany has to step up to the plate. In the final analysis, ongoing, primarily wage-induced, consumption restraint in all euro zone countries would result in protracted stagnation. ■ Further topics: – Weekly Comment: Team-play (page 2). – EMU: Tackling the side-effects of industrial production revisions (p. 9). – US: Healthcare system – tilting at windmills (page 11). – Data outlook: EMU economic climate to improve (page14). – Market outlook: Euro to remain susceptible (page 23). STRONG DISPARITY IN PRICE COMPETITIVENESS Cumulated growth in 2000-2008, relative to the euro area average -40 -30 -20 -10 0 10 20 30 40 DE AT FI FR BE NL PT IT ES GR IE Labor productivity - person employed (sign changed) Compensation per employee Unit Labor Costs Source: Datastream, UniCredit Research Contents Weekly Comment____________________________ 2 Research Notes _____________________________ 4 Data Monitor_______________________________ 14 FI Outlook_________________________________ 22 FX Outlook ________________________________ 23 MIB View _________________________________ 25 MIB Forecasts _____________________________ 26 Calendar__________________________________ 29 MIB MACRO FORECASTS in % yoy 2009 2010 2011 GDP EMU -3.9 0.9 1.3 CPI EMU 0.3 1.3 1.8 GDP Germany -5.0 1.4 1.3 CPI Germany 0.3 0.8 1.3 GDP Italy -4.9 0.5 1.0 CPI Italy 0.8 1.5 1.9 GDP US -2.4 2.9 2.4 CPI US -0.3 2.2 2.2 MIB FI/FX FORECASTS 2010/11 30-Jun 30-Sept 31-Dec 31-Mar EMU 3M (%) 0.70 0,70 1.00 1.50 EMU 10Y (%) 3.40 3.45 3.80 3.90 US 3M (%) 0.29 0.30 0,35 1.05 US 10Y (%) 3.85 4.10 4.50 4.60 EUR-USD 1.39 1.42 1.38 1.35 USD-JPY 91 93 97 102 Oil Price 82 85 90 90 Global Head of Research & Chief Strategist Thorsten Weinelt, CFA (UniCredit Bank) +49 89 378-15110 [email protected]Head of Economics & FI/FX Research Marco Annunziata, Ph.D. (UniCredit Bank) Chief Economist +44 20 7826-1770 [email protected]Editor Nikolaus Keis (UniCredit Bank) +49 89 378-12560 [email protected]Editorial deadline Friday, 26. Mar., 12:00H Bloomberg UCGR Internet www. research.unicreditgroup.eu
Transcript
26 March 2010 Economics & FI/FX Research
Friday Notes
UniCredit Research page 1 See last pages for disclaimer.
Strongly diverging competitiveness within the eurozone ■ Chimera. The debt crisis involving peripheral countries of the euro zone
has disproved the argument that only the EMU aggregates count. Pro-nounced national imbalances do indeed impact the euro zone as a whole and the single currency. After the downgrade of Portugal’s credit rating, the EUR-USD plummeted to a 10-month low.
■ Divergence. The external imbalances could hardly be more diverse. The current account spectrum ranges from a deficit of 11% of GDP to a sur-plus of 5% in 2009. A rapid improvement is not in sight. Ultimately, the competitive countries will profit most from the global economic recovery. This group does not include EMU peripheral countries.
■ Competitiveness. Greece, Portugal, Spain, Ireland and also Italy bring up the rear in the European ranking of price competitiveness. The gap to Germany has widened by 30%-40% over the last 10 years! According to our calculations, the primary culprit here is, however, the relative devel-opment of wages along with the development of productivity (pages 4-8 & chart below).
■ Solution. There is no doubt that stiff global competition requires in-creased efforts to boost competitiveness and innovative power as well as a responsible wage and spending policy of the peripheral countries. But even Germany has to step up to the plate. In the final analysis, ongoing, primarily wage-induced, consumption restraint in all euro zone countries would result in protracted stagnation.
■ Further topics: – Weekly Comment: Team-play (page 2). – EMU: Tackling the side-effects of industrial production revisions (p. 9). – US: Healthcare system – tilting at windmills (page 11). – Data outlook: EMU economic climate to improve (page14). – Market outlook: Euro to remain susceptible (page 23).
STRONG DISPARITY IN PRICE COMPETITIVENESS
Cumulated growth in 2000-2008, relative to the euro area average
-40
-30
-20
-10
0
10
20
30
40
DE AT FI FR BE NL PT IT ES GR IE
Labor productivity - person employed (sign changed)Compensation per employeeUnit Labor Costs
Source: Datastream, UniCredit Research
Contents Weekly Comment____________________________ 2 Research Notes _____________________________ 4 Data Monitor_______________________________ 14 FI Outlook_________________________________ 22 FX Outlook ________________________________ 23 MIB View _________________________________ 25 MIB Forecasts _____________________________ 26 Calendar__________________________________ 29
MIB MACRO FORECASTS
in % yoy 2009 2010 2011 GDP EMU -3.9 0.9 1.3 CPI EMU 0.3 1.3 1.8
US 3M (%) 0.29 0.30 0,35 1.05 US 10Y (%) 3.85 4.10 4.50 4.60
EUR-USD 1.39 1.42 1.38 1.35 USD-JPY 91 93 97 102
Oil Price 82 85 90 90
Global Head of Research & Chief Strategist Thorsten Weinelt, CFA (UniCredit Bank) +49 89 378-15110 [email protected] Head of Economics & FI/FX Research Marco Annunziata, Ph.D. (UniCredit Bank) Chief Economist +44 20 7826-1770 [email protected] Editor Nikolaus Keis (UniCredit Bank) +49 89 378-12560 [email protected] Editorial deadline Friday, 26. Mar., 12:00H Bloomberg UCGR Internet www. research.unicreditgroup.eu
26 March 2010 Economics & FI/FX Research
Friday Notes
UniCredit Research page 2 See last pages for disclaimer.
Team-play The political debate on intra-eurozone imbalances has be-come ferociously acrimonious, and its negative conse-quences risk extending well beyond the Greek episode. We seem to be at an impasse, with some EU countries calling on Germany to boost consumption, and Germany claiming it has simply played the game better, and protesting that calls for it to change strategy are tantamount to protectionism. We have started to take a closer look at the data, and a few in-teresting facts stand out: within the eurozone, Germany’s competitiveness success is built more on low wage growth than on productivity growth; Italy’s low productivity growth is a far more serious problem than wage dynamics; Greece and Ireland have squandered significant productivity gains through excessive wage growth. Moreover, non-price com-petitiveness and swings in savings and investment have at times also played a key role. This leaves us in a very tricky situation: there is no doubt that Germany has played the game better, but the fact is that the countries which share the euro are on the same team. And indeed, the costs of the large internal imbalances are now being borne by the entire eurozone. These imbalances must be corrected, and every-one must pull his weight: our analysis confirms that yes, Ger-many should do more to stimulate internal consumption; but other countries must equally push harder to raise their pro-ductivity growth and increase their competitiveness. It is high time for eurozone countries to think and act more like a team; joined by the same currency, they are like teammates in a sack race who have to run while keeping one leg each in the same sack: either they coordinate their actions, or they will fall hard together.
France has recently joined the ranks of those who openly call for Germany to stimulate domestic demand so as to help stimulate growth and a reduction in the current account defi-cits of countries like Greece, Portugal and Spain. Germany’s policymakers have reacted in outrage, arguing that the coun-try’s robust export performance is the result of strong innova-tion and productivity by its enterprises, with wages deter-mined by free market dynamics, and that countries should imitate Germany, not criticize it, if Europe is to have any fu-ture. Both sides have some valid points. As I have noted several times in the past, as the eurozone is a large closed economy, the bulk of growth needs to be generated inter-nally. If all countries have stagnant domestic consumption, as has been the case in Germany for several years, then growth prospects for the area as a whole will be dismal. If some countries have stronger domestic consumption, they will most likely end up with large current account deficits, as indeed we have seen. From this perspective, stronger do-mestic consumption in Germany should be part of any solu-tion. On the other hand, Germany is correct in pointing out that the intensifying global competition calls for greater ef-
forts at strengthening competitiveness and innovation, com-bined with affordable wage increases. To shed more light on a debate that risks splitting the eurozone down the middle, we have begun to take a closer look at the data. Our main findings are (cf. Research Note by Loredana Federico & Davide Stroppa):
First, it is not always only an issue of competitiveness: in some cases, European countries have recorded such large autonomous swings in their savings and investment bal-ances as to overwhelm the effect of price competitiveness. Major changes in C/A balances over the last few years have had different causes in different countries. Spain and Ireland have experienced a marked worsening of the C/A deficits driven by stronger investment, mostly linked to the real es-tate bubble; in Greece and Portugal, instead, the C/A has been driven wider by a sharp decline in gross savings, largely due to public dis-saving. On the other extreme, Ger-many, the Netherlands and Austria experienced an im-provement in their CA balance due to both lower investment and higher gross saving – which in the case of Germany re-flected stronger corporate savings in a period of robust reve-nues and a limited wage growth dynamic.
Second, the divergence in price competitiveness across countries has been dramatic. This is well known, but still worth stressing: measured in terms of unit labor costs-based real effective exchange rate, German competitiveness has improved by nearly 18% between 1998 and 2008, while Ire-land’s deteriorated by about 20% and Spain’s by about 15%. Italy, Portugal, the Netherlands and Greece have done a bit better, but have still lost competitiveness to the tune of 8-10%. In other words, the competitiveness gap between Ger-many and the weaker performers has widened by some 30-40% in the space of ten years.
Third and most surprising, the picture on productivity growth is not at all what one would expect: relative to the eurozone average, the outperformers recording stronger productivity growth during 2000-2008 have been Greece and Ireland (to-gether with Finland)! However, these productivity gains in Greece and Ireland (mostly due to a catching up process in the first stage of the EMU) have been more than completely offset by excessive wage growth. Germany has outper-formed on productivity growth, but has gained price competi-tiveness mostly through a much more restrained wage dy-namic than the eurozone average; Italy, on the other hand, does not have a significant wage problem, but has a dra-matic productivity problem.
Fourth: specialization matters. If we take a snapshot as of 2008, we can clearly see that the labor productivity in the four Mediterranean countries is held back by the low level of capital stock; Germany’s productivity growth, on the other hand, is weaker than one would expect given the capital in-
26 March 2010 Economics & FI/FX Research
Friday Notes
UniCredit Research page 3 See last pages for disclaimer.
tensity of its industry – France enjoys higher labor productiv-ity than Germany’s even at a somewhat lower capital inten-sity.
Fifth: non-price competitiveness plays a very important role, and here again the cross country differences are dramatic. For example, in 2008, Finland, Germany, and Austria spent between 2.5% and 4% of GDP on Research and Develop-ment (R&D), while Greece, Italy and Spain lagged well be-hind, with only 0.6-1.4% of GDP. And this is not counting le-gal frameworks, competition, regulations, and other variables that contribute to determining how business-friendly an econ-omy is.
Addressing these issues in a decisive and coordinated way will be essential. As the countries are joined at the hip by a common currency and monetary policy, problems and imbal-ances inevitably have repercussions on all of them, as we are discovering now with Greece. Of course, Germany’s ex-port-oriented strategy did not cause Greece’s fiscal and ex-ternal deficits. By the accumulation of unsustainable deficits in Greece, Ireland, Portugal and Spain has been aided by their membership in the eurozone, which gave them low in-terest rates and currency stability – as Mr. Trichet likes to put it, eurozone membership guarantees ex-ante financing of your external imbalances. At the time of writing, headlines from the EU summit indicate that EU policymakers have fi-nally reached agreement on a support package for Greece. This would include bilateral loans from EU members to Greece, as well as IMF involvement. In other words, more fiscally responsible countries will have to put money at stake, while the eurozone shows that it needs external help to guarantee financing and fiscal discipline in its member coun-tries. It is extremely clear proof that things need to change, with everybody making a determined effort and pulling in the same direction. The eurozone needs new, truly enforceable fiscal rules, and a more coordinated growth strategy.
Marco Annunziata, Ph.D. (UniCredit Bank) +44 20 7826-1770 [email protected]
26 March 2010 Economics & FI/FX Research
Friday Notes
UniCredit Research page 4 See last pages for disclaimer.
EMU: From external imbalances to competitiveness (and return) ■ The recent tensions in sovereign debt markets have con-
firmed that public finances for eurozone countries are not the only concern, and that imbalances in the respective growth models need to be taken seriously into account.
■ We made an assessment of current account dynamics for the largest 11 eurozone countries looking at the underly-ing drivers in terms of savings and investment develop-ments and divergence in export performance.
■ This led us to investigate developments in price and cost competitiveness, hence in different patterns of wage and productivity dynamics across eurozone countries.
■ Another important dimension is related to non-price com-petitiveness and other variables that contribute to deter-mining how business-friendly an economy is. This can help further explain intra-euro area imbalances.
What lies behind C/A dynamics The recent tensions in sovereign debt markets have strengthened the view that public finances for eurozone countries are not the only concern, and that imbalances in the growth model of any given country need to be taken seri-ously into account. In an environment where credit has rap-idly become scarcer and more expensive, the size of the cur-rent account (C/A) deficit – which measures the net external borrowing position – may be an important indicator to gauge the vulnerability of a country. Therefore, the analysis of cur-rent account dynamics and of their underlying drivers has become an important stepping stone to provide useful in-sights into how the recovery in the euro area will actually shape up. To this extent, it is interesting to recall that the last ECB staff forecasts showed an upward revision of GDP growth for 2011 (from 1.2% to 1.5%), on the back of higher-than-expected exports, thanks to buoyant global growth. Thus, this strengthens the need to gain a deeper under-standing of the competitive position of eurozone countries, to see whether reaping the benefits of stronger global growth is something that can happen in a homogeneous fashion.
While so far most of the attention has been devoted to the peripheral countries under heavy market pressure over the past months1, the debate on how to reach a better conver-gence among the eurozone countries leads us to widen our perspective, focusing our assessment on the 11 largest economies in the area. Our starting point is given by current
1 See “Peripheral Countries: The Heart of the Problem” and “A Few Thoughts on a Two-Speed Recovery”, UniCredit Euro Compass February 2010.
account balance developments. The chart below shows that we can broadly distinguish three groups of countries.
DIVERGENT C/A PERFORMANCE IN THE EUROZONE
Current account imbalances, in % of GDP
-16
-12
-8
-4
0
4
8
12
NL DE BE AT FI FR IT IE ES PT GR
2008 2009
Source: National Central Banks, UniCredit Research
The first group is the one of large-surplus countries and in-cludes the Netherlands (NL) and Germany (DE), with a C/A surplus, as a share of GDP, of around 5% in 2009. The sec-ond group includes countries experiencing substantial cur-rent account deficits: Greece (GR), Portugal (PT) and Spain (ES), with C/A deficits ranging from 5% to 11% of GDP in 2009. Finally, a third group embraces other countries holding a middle-range current account balance. This grouping de-rives from diverging current account dynamics over the last decade, which can be better explained adopting an account-ing perspective, which traces back to the evolution of savings and investment activities.2
The chart next page shows that in 1998-2006 the first group (DE and NL) plus Austria (AT) experienced a sizeable im-provement in the external position, with the C/A balances (in % of GDP) up by 7.2, 6.1 and 4.5 percentage points, respec-tively (red squares in the chart). The rise in external surplus likely stemmed from virtuous balance-sheet management in the corporate sector. We have already highlighted that during the post dot.com years, German firms (but this holds true for Dutch and Austrian firms as well) undertook intense restruc-turing, reducing their debt and boosting their savings. In-deed, gross national savings (in % of GDP) increased be-tween 2 and 4pp for the three countries in this group. This was accompanied by a reduction in investment spending roughly of the same size, reflecting weakness in construction and business investment. In turn, this contributed to a signifi-cant improvement in C/A balances in 1998-2006. However, it
2 The current account can be expressed mainly as the difference between gross national savings and gross capital formation. The existing discrepancies reflect net capital transfers, net acquisition of other non-financial assets, and errors and omissions.
26 March 2010 Economics & FI/FX Research
Friday Notes
UniCredit Research page 5 See last pages for disclaimer.
should be noted that, while the external position of Germany and the Netherlands currently is still largely in surplus, the C/A balance has experienced a decline in the last three years (by 1.5pp and 4.1pp respectively – empty red dots in the chart3), on the back of the investment recovery of 2005-2007.
A SAVINGS AND INVESTMENT PERSPECTIVE
Changes in 1998-2006, variables expressed in % of GDP
-12
-8
-4
0
4
8
12
16
DE NL AT FI PT FR BE GR IE IT ES
Gross national savings Investment (sign changed)
Current account balances Current Account (2006-2009)
Source: Eurostat, UniCredit Research
While all other countries experienced a worsening in their current account position between 1998 and 2006, some cases need to be treated with attention. In Spain and Ireland (IE), the deterioration of the current account (-7.8pp and -4.4pp, respectively) can be largely ascribed to a surge in in-vestment, due in particular to the real estate bubble. Al-though the surge in housing investment was coupled with a large increase in household borrowing, this was likely offset by a careful management of public finances, leaving gross national savings roughly stable. In turn, this prevented an even larger deterioration of the current account. In contrast, it was the drop in public savings that likely fuelled the decline in gross savings in Greece and, above all, in Portugal, wors-ening the C/A position to -10/11% of GDP in 2009. In this case, it was the decline in investment (-1.7pp and -5.0pp, re-spectively) that prevented an even larger deterioration of the external position. In the most recent period (2006-2009), Spain was the only country of this group that reversed the trend and actually improved its external position: while the C/A balance remains in deep deficit, the 5% of GDP reached in 2009 is surely a significant improvement from the 10% re-corded in 2007-2008.
Export growth and C/A performance Different current account positions among euro area coun-tries can also be considered looking at divergences in export 3 In order to keep the chart as clear as possible, we just showed the 2006-2009 changes in C/A balances (in % of GDP) larger than +/-1pp.
performance. The chart below shows real export growth over the last decade and confirms the broad grouping we had identified when looking at C/A positions.4
NOT ALL ARE EQUAL IN THE EXPORT PERFORMANCE
Real exports of good & services, in % yoy (average)
0
1
2
3
4
5
6
7
8
9
10
IE DE AT FI NL ES PT BE FR GR IT
1998-2008
1998-2009
average
Source: Eurostat, UniCredit Research
Germany, Austria, Finland, Ireland and the Netherlands en-joyed a stronger-than-average export performance; Italy (IT), Greece and France (FR) recorded the most sluggish growth, much below the average. While these differences in exports can be largely traced back to competitiveness developments, in the case of France this can be explained mainly by a dif-ferent growth model, characterized by more robust domestic demand (for example, in 1998-2009, private consumption was up 2.5% in real terms, vs. 0.8% in Germany).
Certainly, current account balances and divergences in ex-port performances tend to be related to price and cost com-petitiveness: countries with large C/A deficits or/and worsen-ing external positions can easily exhibit losses in price com-petitiveness. A widely used indicator of price and cost com-petitiveness is the real effective exchange rate (REER). When looking at divergences in competitiveness within the euro area, we can consider both the REER based on the GDP deflator and the one based on unit labor costs (ULCs). As the chart next page shows, the three groups we identified in terms of external position are roughly the same when price/cost competitiveness is considered.
4 We considered both periods 1998-2008 and 1998-2009, in order to take into account the plunge in world trade following the Lehman collapse.
26 March 2010 Economics & FI/FX Research
Friday Notes
UniCredit Research page 6 See last pages for disclaimer.
PRICE AND COST COMPETITIVENESS MATTERS
REER (intra-euro area), 1998-2008, in %
-24
-18
-12
-6
0
6
12
18
24
DE FI AT FR BE-LU IT PT NL GR IE ES
GDP deflator Unit labor costs
Source: EC, UniCredit Research
At the one end of the spectrum, there are those countries which improved their competitiveness via a depreciation of REER: notably Germany, Finland and Austria. At the other end, we have countries which had lost competitiveness, as showed by the marked appreciation of the REER: Spain, Ire-land, Greece and Portugal. The intermediate group includes countries where the REER has barely changed and thus have not gained nor lost much competitiveness (France and Belgium (BE), together with Italy where the loss was non-negligible, but surely not comparable with the ones marked in Spain or Ireland.
Ireland and the Netherlands provide two interesting stories: while they have experienced a significant REER apprecia-tion, they also show a sizeable increase in exports (however, keep in mind that the Irish figure is inflated by the 20% aver-age growth marked in 1998-2000) and (for the Netherlands) a sizeable C/A surplus: arguably, elements of non-price competitiveness might have more than offset the poor per-formance of price competitiveness. Another observation can be made looking at the difference between the REER based on the GDP deflator and the ULC-based REER. In fact, Ire-land, Italy and Portugal stand out as the countries where the gap between the appreciation in terms of ULCs and in terms of GDP deflator is the largest. In turn, this can be identified as a potential area of improvement to achieve long-lasting gains in cost competitiveness. Similarly, Germany and Aus-tria are moving in the opposite direction, thanks to a signifi-cant containment of ULCs.
Wage and productivity growth The differences highlighted in the analysis of REER based on ULCs lead us to focus on developments in wages and productivity across countries. In particular, cost competitive-ness in a given country improves/deteriorates if wage growth
stays below/exceeds growth in labor productivity more than in its trade partner economies. The chart below shows that the different developments in external performance and in competitiveness can be a sign of inefficiencies in the func-tioning of labor markets and of a build-up of further imbal-ances in terms of productivity performance.
WAGES AND PRODUCTIVITY STORIES
Cumulated growth in 2000-2008, relative to the euro area average
-40
-30
-20
-10
0
10
20
30
40
DE AT FI FR BE NL PT IT ES GR IE
Labor productivity - person employed (sign changed)
Compensation per employee
Unit Labor Costs
Source: Eurostat, AMECO, UniCredit Research
In particular, lower-than-average ULC cumulated growth in Germany and Austria between 2000 and 2008 seems due to persistent wage moderation, coupled with a better productiv-ity performance. Conversely, Ireland, Greece, Spain, Italy and Portugal show an above-average increase in ULCs, fol-lowing a significant mismatch in growth of compensation per employee and labor productivity.
Within this latter group, it is interesting to note that Greece and Ireland enjoyed a pick-up in productivity growth (espe-cially during the first years of EMU). However, this advantage has been erased by the effects of very rigid labor markets, which kept wage growth well above productivity gains: in turn, this suggests that labor cost developments in these two countries were not economically justified at the time. For Spain, Italy and Portugal, the situation might be even worse, as still robust wage growth is coupled with sluggish produc-tivity: to this extent, Italy stands out as the country that suf-fered the largest underperformance in terms of productivity growth, 8.4pp lower than the euro area. Luckily enough, tame compensation per employee in Italy (in line with that prevailing in the Netherlands, Belgium and France) pre-vented an even more dangerous boost in ULCs.
Don’t forget non-price competitiveness However, considering only measures of price competitive-ness might be limiting and misleading. A second important dimension is related to non-price competitiveness, which can
26 March 2010 Economics & FI/FX Research
Friday Notes
UniCredit Research page 7 See last pages for disclaimer.
help further explain intra-euro area imbalances. Non-price competitiveness can include a large set of factors such as sectoral and geographical specialization of the export sector, production and technology structure, goods market efficiency and institutional quality. The Global Competitiveness Index of the World Economic Forum reflects most of these factors as a composite indicator, and shows that, once again, Finland, Germany and the Netherlands are among the most competi-tive countries, while France, Austria, Belgium and Ireland fol-low suit and Spain, Portugal, Italy and Greece lag behind (cf chart).
COMPETITIVENESS IS MADE OF MANY THINGS
World Economic Forum Index and sub-index averages (ranking)
0
10
20
30
40
50
60
70
80
FI DE NL FR AT BE IE ES PT IT GR
Goods Market Efficiency - Competititon
WEF Competitiveness Index
Higher Education and Training
Source: WEF, UniCredit Research
Looking at some of these factors, the production structure determines how and to what extent rising wage costs can be passed on to international markets. If a country is specialized in the production of labor-intensive goods, the power to pass on prices to international markets will be low, as rising wages are translated into high production costs, given that wages account for a larger share of overall costs. Hence, wage growth in countries with labor-intensive production (PT, GR, ES, IT) can explain the loss of competitiveness relative to countries with capital-intensive production such as Germany, Austria, France and the Netherlands. As shown in the chart next column, capital intensity differs significantly among the countries and helps explain productivity performances. Moreover, labor productivity in the bottom group (PT, GR, ES, IT) seems much lower than in capital-intensive countries and should be compensated for by lower wage increases. Among others, a further element of non-price competitive-ness is the innovative capacity of the economy: a good indi-cator is given by the level of expenditure on Research and Development (R&D), for which we have detected major dif-ferences among eurozone countries. In 2008, countries such as Finland, Germany and Austria spent between 2.5% and 4.0% of GDP in R&D, while Greece, Italy and Spain lagged
PRODUCTIVITY AND CAPITAL INTENSITY GO HAND IN HAND
Capital intensity and labor productivity, 2008
0
10
20
30
40
50
60
70
80
0 50 100 150 200 250Capital intensity (capital stock per person employed)
Labo
r pro
duct
ivity
(per
son
empl
oyed
)
PT
ESGR
IT
FI BE
NL DE
ATFR
IE
2008
Source: AMECO, UniCredit Research
well behind, with 0.6-1.4% of GDP devoted to investment in R&D, something that calls for further action to be taken in this area. We then took the rankings for Higher Education and Training components of the WEF Global Competitive-ness Index to build a composite indicator to gauge the de-gree of competitiveness in secondary/tertiary education and training. The picture (cf. chart left column) is in line with data on R&D, with Finland, the Netherlands and France at the top end and Greece, Italy, Portugal and Spain at the bottom, leaving space for large improvement in this area. Labor mar-ket rigidities are another important factor: a key aspect is the duality of the labor market between permanent and tempo-rary contracts, which are particularly frequent among young people (15-24 years). The chart below shows that the exten-sive use of temporary contracts is positively correlated with the rigidities of employment protection legislation for perma-nent workers.
SOME LABOR MARKET RIGIDITIES ARE STILL IN PLACE
Employment protection legislation for permanent workers, 2008
0
0.5
1
1.5
2
2.5
3
3.5
4
4.5
0 10 20 30 40 50 60Temporary employment 15-24 age group (in % of total employees)
Em
ploy
men
t pro
tect
ion
inde
x
IE
PT
DE
ESFR
NL
IT
FI
AT
BE
GR
Source: Eurostat, OECD, UniCredit Research
26 March 2010 Economics & FI/FX Research
Friday Notes
UniCredit Research page 8 See last pages for disclaimer.
This bears important implications for competitiveness and productivity. A high degree of employment protection clearly dampens productivity gains, slowing down the reallocation of employment to more innovative and high productive sectors. Moreover, leading to the extensive use of temporary con-tracts, it may introduce some distortions in terms of skilled-workers' distribution. The potential increase in productivity which can be achieved via higher labor market flexibility should be pursued not only by less competitive countries (e.g. Portugal and Spain), but also by Germany, if the need for a rebalancing at the area-wide level calls for further im-provement in productivity as a mean to allow higher domestic wages.A final factor which is crucial in shaping non-price competitiveness is efficiency in the goods markets as a de-vice to enhance competition. Indeed, countries with efficient goods markets are well positioned to produce the right mix of products and services given supply-and-demand conditions, and to ensure that these goods can be most effectively traded in the economy. We resorted to the WEF Global Competitiveness Index and employed three of its sub-indices (Intensity of local competition, Extent of market dominance, Effectiveness of anti-monopoly policy) to build a composite indicator for competition. The results are not materially dif-ferent from the ones of the more general Global Competi-tiveness Index (in the chart we show the ranking and not the scores, so that a higher value should be seen as a sign of lower competitiveness). Once again, the existence of a clear competitive edge of Germany, Finland and the Netherlands is demonstrated, while Italy, Greece and Portugal lag well behind.
Bottom line: The recent tensions in the sovereign debt mar-ket in the eurozone have opened up the debate on whether and to what extent one should look at imbalances in individ-ual countries rather than in the eurozone as a whole. We have already argued that individual imbalances do matter and that, absent any adjustment in the exchange rate, they just show up in bond yields. Indeed, divergences in current account and competitiveness within the euro area need to be monitored as they can lead to the build-up of dangerous im-balances, which could prove costly to fix, both at the individ-ual country level and for the euro area as a whole. In this re-spect, the easiest way out would be an adjustment of the growth model of the most competitive countries (i.e. higher wage growth/consumption in Germany, for example). How-ever, this is only part of the solution: our analysis has showed that there is plenty of room for the laggard countries to take an active role in the adjustment process. In particular, they have equally strong responsibility to accelerate struc-tural reforms and boost productivity.
UniCredit Research page 9 See last pages for disclaimer.
EMU: Tackling the side-effects of industrial production revisions ■ Large revisions to the eurozone industrial production se-
ries have become an issue. They negatively affect the fit of our hard-data model for GDP and its forecasting ability.
■ We show that eurozone industrial production revisions are largely driven by Eurostat’s estimate of the seasonal fac-tor, which seems to have become quite unstable since the beginning of the downturn.
■ An easy way to tackle part of the revision problem is get-ting rid of this unstable seasonal factor simply by employ-ing a weighted average of national industrial production data instead of the euro area estimate.
■ At the current juncture, we see the risk that eurozone in-dustrial production data as reported by Eurostat overstate the strength of the industrial recovery.
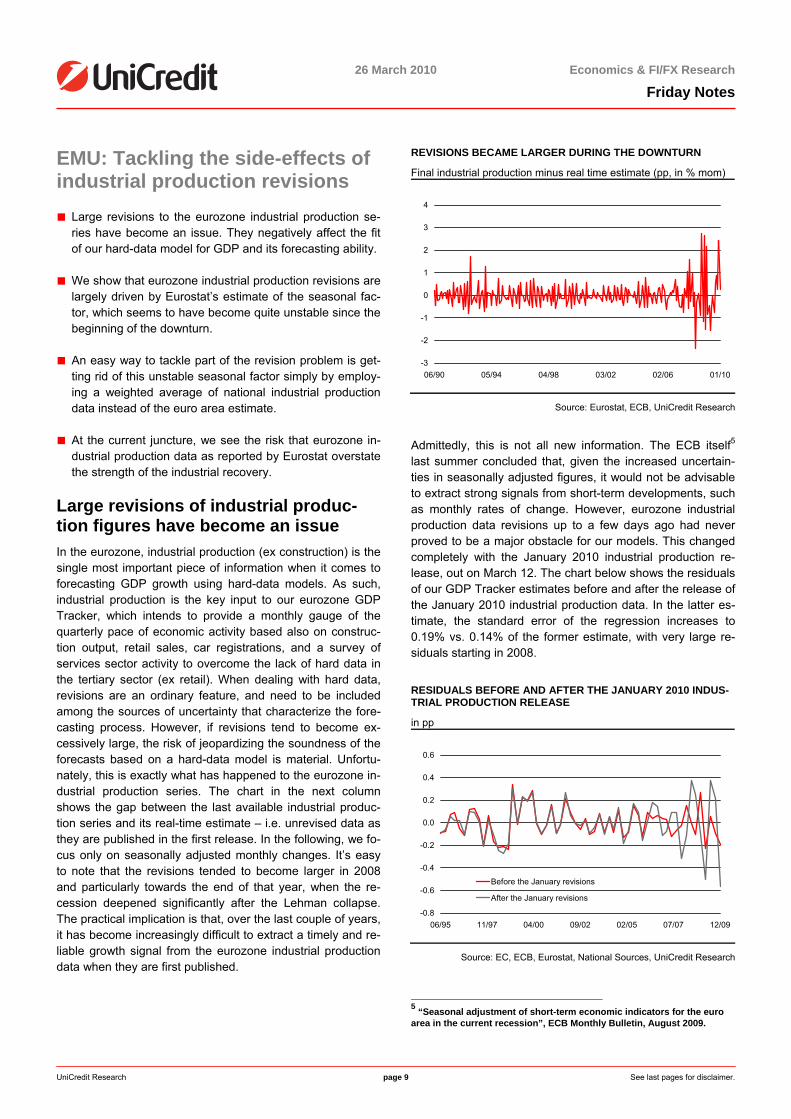
Large revisions of industrial produc-tion figures have become an issue In the eurozone, industrial production (ex construction) is the single most important piece of information when it comes to forecasting GDP growth using hard-data models. As such, industrial production is the key input to our eurozone GDP Tracker, which intends to provide a monthly gauge of the quarterly pace of economic activity based also on construc-tion output, retail sales, car registrations, and a survey of services sector activity to overcome the lack of hard data in the tertiary sector (ex retail). When dealing with hard data, revisions are an ordinary feature, and need to be included among the sources of uncertainty that characterize the fore-casting process. However, if revisions tend to become ex-cessively large, the risk of jeopardizing the soundness of the forecasts based on a hard-data model is material. Unfortu-nately, this is exactly what has happened to the eurozone in-dustrial production series. The chart in the next column shows the gap between the last available industrial produc-tion series and its real-time estimate – i.e. unrevised data as they are published in the first release. In the following, we fo-cus only on seasonally adjusted monthly changes. It’s easy to note that the revisions tended to become larger in 2008 and particularly towards the end of that year, when the re-cession deepened significantly after the Lehman collapse. The practical implication is that, over the last couple of years, it has become increasingly difficult to extract a timely and re-liable growth signal from the eurozone industrial production data when they are first published.
REVISIONS BECAME LARGER DURING THE DOWNTURN
Final industrial production minus real time estimate (pp, in % mom)
-3
-2
-1
0
1
2
3
4
06/90 05/94 04/98 03/02 02/06 01/10
Source: Eurostat, ECB, UniCredit Research
Admittedly, this is not all new information. The ECB itself5 last summer concluded that, given the increased uncertain-ties in seasonally adjusted figures, it would not be advisable to extract strong signals from short-term developments, such as monthly rates of change. However, eurozone industrial production data revisions up to a few days ago had never proved to be a major obstacle for our models. This changed completely with the January 2010 industrial production re-lease, out on March 12. The chart below shows the residuals of our GDP Tracker estimates before and after the release of the January 2010 industrial production data. In the latter es-timate, the standard error of the regression increases to 0.19% vs. 0.14% of the former estimate, with very large re-siduals starting in 2008.
RESIDUALS BEFORE AND AFTER THE JANUARY 2010 INDUS-TRIAL PRODUCTION RELEASE
in pp
-0.8
-0.6
-0.4
-0.2
0.0
0.2
0.4
0.6
06/95 11/97 04/00 09/02 02/05 07/07 12/09
Before the January revisions
After the January revisions
Source: EC, ECB, Eurostat, National Sources, UniCredit Research
5 “Seasonal adjustment of short-term economic indicators for the euro area in the current recession”, ECB Monthly Bulletin, August 2009.
26 March 2010 Economics & FI/FX Research
Friday Notes
UniCredit Research page 10 See last pages for disclaimer.
This is a clear signal that the recently revised industrial pro-duction series does a relatively poor job in tracking GDP growth in the last couple of years. This is bad news for our model, and calls for a quick fix.
Tackling the problem: watch for the unstable seasonal factor Before we move on to tackle the problem, we need to under-stand exactly the properties of the eurozone industrial pro-duction series. For our purposes, it’s important to know that the seasonally adjusted monthly growth rate of eurozone in-dustrial production is estimated by Eurostat collecting work-ing-day adjusted data from member countries, aggregating them together, and then performing its own seasonal ad-justment. This explains why the euro area seasonally ad-justed aggregate usually never coincides with a weighted average of seasonally adjusted national data. The chart be-low shows the gap between eurozone industrial production and a weighted average of country data that are published before the area-wide release – these data refer to countries that account for almost 90% of the eurozone aggregate. Both series are taken at a quarterly frequency, last available data (as opposed to real-time data).
THE SEASONAL FACTOR PLAYS A ROLE IN THE REVISIONS
EMU production minus country weighted average (in pp)
-2.5
-2.0
-1.5
-1.0
-0.5
0.0
0.5
1.0
1.5
2.0
I/96 IV/97 III/99 II/01 I/03 IV/04 III/06 II/08
Source: Eurostat, ECB, UniCredit Research
It’s interesting to note that the gap between the two series has widened significantly since end-2007, showing that revi-sions to national data are not the main reason behind the large revisions to the eurozone industrial production. This suggests that revisions are largely driven by the estimate of the seasonal factor, which seems to have become quite un-stable since the beginning of the downturn. If this is indeed the case, restoring a good specification of our GDP Tracker requires that we circumvent the industrial production sea-sonal factor estimated by Eurostat. The most straightforward way to do this is by replacing the eurozone industrial produc-
tion series with the above-mentioned weighted average of country data, which has also the advantage of better suiting Eurostat methodology to calculate eurozone aggregate GDP as a weighted average of seasonally adjusted national GDP data. The next chart shows that, when we replace eurozone industrial production with the weighted average of country data, both the fit of the regression and the behavior of the re-siduals in the last part of the sample improve significantly – though with some tendency to over-predict in the last few quarters. The standard error of the model is even (margin-ally) lower than the one of the Tracker estimated before the release of the January 2010 industrial production data. This seems the right way to go, and we decide to change the benchmark specification of our GDP Tracker accordingly.
IMPROVING THE SPECIFICATION OF OUR GDP TRACKER
-0.4
-0.2
0.0
0.2
0.4
0.6
0.8
1995 1997 1999 2001 2003 2005 2007 2009-7.0
-5.5
-4.0
-2.5
-1.0
0.5
2.0
Residual (RS) Actual Fitted
Source: EC, ECB, Eurostat, National Sources, UniCredit Research
One final remark: The Eurostat industrial production series and the weighted average of country data show significantly different momentum also at the beginning of 2010. In Janu-ary, the 3M/3M growth rate of the former was 2.9%, the latter only 0.5%. This hints at the possibility that the eurozone in-dustrial production series may be painting an excessively rosy picture of the industrial recovery at this juncture. It is not surprising, then, that the old specification of the Tracker points to 0.7% qoq GDP growth in the first month of the year, while the new one suggests a more contained 0.3%, much more in line with our 0.2-0.3% official forecast for 1Q GDP.
Chiara Corsa (UniCredit Bank Milan) +39 02 8862.2209 [email protected] Marco Valli (UniCredit Bank Milan) +39 02 8862-8688 [email protected]
26 March 2010 Economics & FI/FX Research
Friday Notes
UniCredit Research page 11 See last pages for disclaimer.
US healthcare system: Tilting at windmills! ■ Last weekend, the US administration passed sweeping
healthcare reform. A key objective of the new legislation is to reduce the number of non-elderly people who are unin-sured by more than 30 million in the coming years.
■ Based on initial estimates, it is possible that this objective can be achieved without increasing the federal budget deficit. Over the long term, the bill should even reduce the budget deficit compared to the status quo.
■ Despite (but not because of) the reform, healthcare ex-penditures are still expected to skyrocket in the coming years. The backdrop here is the demographic change caused by the ageing baby-boomer generation. It is tilting at windmills.
■ The positive flipside of this development is that the boom-ing healthcare sector supports consumption and the labor market. Outside healthcare, however, business will probably remain reluctant to take on additional workers.
Health insurance for all! Last week, the US House of Representatives passed sweep-ing healthcare reform, the Patient Protection and Affordable Care Act. President Obama signed the legislation into law on Wednesday, thereby fulfilling one of his key campaign prom-ises. The non-partisan Congressional Budget Office (CBO) and the Joint Committee on Taxation (JCT) estimate that by 2019 the reform will reduce the number of non-elderly people who are uninsured by about 32 million; that is close to 10% of the population. The share of (legal) non-elderly residents with insurance coverage would rise from about 83% currently to about 94%.
But the costs associated with this program are immense: The CBO calculates that gross expenditures in the next 10 years will total USD 938bn (cf. table). Higher outlays result primar-ily from subsidies for health insurance (exchange subsidies), a significant expansion of the eligibility for Medicaid, better healthcare for children (CHIP) as well as tax breaks for small businesses which can put 50% of their healthcare costs off against their taxes.
Six months after enactment • Bar insurers from denying people coverage when they get sick. • Bar insurers from denying coverage to children with pre-existing con-
ditions. • Bar insurers from imposing lifetime caps on coverage. • Requires investors to allow children to stay on their parents’ policies
until they turn 26. 2013
• Increase the Medicare tax and expand it to dividend, interest and other unearned income for singles earning more than USD 200,000 and joint filers making more than USD 250,000.
2014 • Provide subsidies for families earning up to 400% of federal poverty
level, currently about USD 88,000 a year, to purchase health insur-ance.
• Requires most employers to provide coverage or face penalties. • Requires most people to obtain coverage or face financial penalties.
2018 • Imposes a 40% excise tax on high-end insurance policies.
2019 • Expand health insurance coverage to 32 million people.
Source: US Congress, CBO, UBS, UniCredit Research
The reform is to be funded by a combination of spending cuts, and higher taxes and excise taxes (cf. table). On the expenditure side, above all the costs for the federal Medicare and Medicaid programs are to be lowered drastically. Sub-stantial reductions to the growth of Medicare’s payment rates and other changes to payment rules are estimated to reduce direct outlays by USD 511bn over the next ten years. Of the projected USD 420bn in revenues from higher taxes, half alone stems from the increase in the "Medicare Tax" for high-income people (individuals earning more than USD 200,000 and joint filers earning over USD 250,000 per year). In addition, the legislation provides from 2014 for fines on in-dividuals who are not health insured and on businesses with more than 50 employees that do not offer their employees insurance protection. Those penalty payments in combina-tion with an excise tax on high-premium insurance plans are expected to raise revenues over the next ten years by roughly USD 150bn.
FUNDING THE HEALTHCARE REFORM (bn USD)
2011-2014 2015-2019 2010-2019 Lower expenditures for Medicare, Medicaid and other federal programs
79 432 511
Higher taxes (e.g. Medicare tax) 109 311 420 Penalty payments by uninsured individuals and employers plus, excise tax on high-premium in-surance plans
-9 158 149
Total 179 901 1,080
Source: CBO, UniCredit Research
26 March 2010 Economics & FI/FX Research
Friday Notes
UniCredit Research page 12 See last pages for disclaimer.
Significant deficit reduction only in the coming decade According to the CBO, the healthcare reform will, therefore, reduce the federal deficit by about USD 140bn over the next ten years. Experience does, however, show that outlays are often higher than assumed, while at the same time revenues and cost reductions fall short of expectations. Against this backdrop, the projected deficit reduction should probably rather be seen as a sort of cushion. But it would still be a significant achievement if the reform would expand health-care insurance coverage to an additional 10% of Americans without increasing the federal deficit to any noticeable de-gree. And for the decade after 2019, the CBO projects that the legislation would reduce the federal deficit – primarily through slower growth of Medicare’s payment rates – by about USD one trillion (¼%-½% of GDP).
Costs will nevertheless explode The latest reform cannot, however, prevent the threatening explosion of healthcare costs – but it has not exacerbated this development either. The trigger is instead the ageing baby boomer generation. Currently, there are for every per-son 65 or older close to five persons between the age of 20 and 64. By 2030, this ratio will decline to under 3:1 (cf. chart).
DRAMATIC AGEING OF THE POPULATION
Population age 20-64 as a % of the population age 65+
This demographic shift goes hand in hand with massive in-creases in healthcare costs but also a dramatic rise in social security payments. According to the CBO (do not yet factor in possible fallout of the healthcare reform!), by 2019 spend-ing on Social Security, Medicare and Medicaid will increase from currently USD 1.4 trillion to USD 2.7 trillion, which is equivalent to 47% of the projected total federal outlays. If ris-ing interest costs and other mandatory expenditures are in-
cluded, almost three-quarters of federal spending in 2019 will be earmarked for non-discretionary items (cf. chart). The re-maining 26% is divided roughly equally between the defense and non-defense discretionary outlays.
Total mandatory outlaysSocial Security plus Medicare & MedicaidDiscretionary outlaysNet interest
CBO forecast
Source: CBO, UniCredit Research
Healthcare: the boom sector The flipside of this structural development is that in recent years healthcare has been the boom sector of the US econ-omy. In 2009, healthcare spending accounted for 16% of to-tal consumption expenditures. Moreover, the following chart illustrates that the structural increase in healthcare spending in past decades was the reason that consumption as a per-centage of GDP has increased from 60% to 70%!
THAT EXPLAINS WHY CONSUMPTION ACCOUNTS FOR SUCH A LARGE PORTION OF THE US ECONOMY
Consumption expenditures, as % of GDP
54
56
58
60
62
64
66
68
70
72
1960 1965 1970 1975 1980 1985 1990 1995 2000 2005
PCE health care
PCE ex health care
Source: BEA, Thomson Datastream, UniCredit Research
26 March 2010 Economics & FI/FX Research
Friday Notes
UniCredit Research page 13 See last pages for disclaimer.
The US labor market has also benefited from the boom: While employment in the healthcare sector increased by close to 3 million (+27%) between January 2000 and Febru-ary 2010, it fell by 4¼ million (-3½%) in all other sectors. The decline in total employment over the last decade (-1¼ mil-lion; -1%) was therefore reduced to one third thanks to the healthcare sector. As the following chart illustrates, the rise in healthcare payrolls did not even weaken during recessions (shaded areas). That underscores once again the structural character of the healthcare boom.
STEADY EMPLOYMENT GROWTH IN HEALTHCARE
Payrolls, indexed (January 2000 = 100)
95
100
105
110
115
120
125
130
Jan-00 Jan-02 Jan-04 Jan-06 Jan-08 Jan-10
Health care all other sectors
Source: BLS, Thomson Datastream, UniCredit Research
Ramifications for the labor market Outside the healthcare sector, however, business will proba-bly remain cautious when it comes to hiring. Even as pas-sage of the healthcare reform has eliminated considerable planning insecurity, businesses now face the certainty that their labor costs will increase in the coming years. At least firms will fewer than 50 employees, of which currently only 55% offer medical care benefits to their employees, were ex-empted from the obligation to provide insurance (cf. chart next column). But also among businesses with 50 to 100 employees, only 71% currently offer medical care benefits to their employees. Of those 71% of workers with access, in turn only 72% participate in the plan. That means that only 51% of all workers at businesses with 50 to 100 employees currently participate in employer-sponsored medical plans. Against this backdrop, it is at least questionable whether the tax credit will compensate small businesses for the additional costs.
HEALTHCARE REFORM HURTS SMALL BUSINESS
Share of employees with access to medical care benefits, in %
010
203040
50607080
90100
1-49 50-99 100-499 >500
number of employees per firm
Source: Bureau of Labor Statistics, UniCredit Research
Moreover, the uncertainty about the healthcare reform was only one reason why businesses have been reluctant to hire. As many companies remain skeptical about the sustainability of the recovery, they are hiring only temporary workers rather than permanent staff. In addition, 8.8 million employees are still working only part-time for economic reasons. When final demand picks up again, it is likely that businesses will initially increase working hours of their existing staff again before hir-ing new employees. The return of the average working week to the pre-crisis level of 33.8 hours is equivalent to the crea-tion of 2¼ million jobs! For that reason, the rise in employ-ment is likely to continue to lag GDP growth. For the second quarter, we expect growth in nonfarm payrolls of about 50k per month (excluding census hires). It will probably be years before the US economy has recouped the 8.4 million jobs lost during the Great Recession.
Dr. Harm Bandholz, CFA (UniCredit Bank) +1 212 672-5957 [email protected]
26 March 2010 Economics & FI/FX Research
Friday Notes
UniCredit Research page 14 See last pages for disclaimer.
Data Monitor Europe - Preview of the coming week
Monday, March 29
EMU, ECONOMIC CONFIDENCE BUSINESS SENTIMENT IMPROVES AT AN UNIMPRESSIVE PACE
March CIB Cons. Feb Jan
98.2 97.0 95.9 96.0
60
70
80
90
100
110
120
01/99 09/00 05/02 01/04 09/05 05/07 01/09-40
-30
-20
-10
0
10
20
EC economic sentiment
EC consumer confidence (RS)
Bad weather conditions weighed sharply on retail confi-dence in February, causing a slight easing of overall economic sentiment. However, weakness in the retail sector should be temporary, and its reversal will proba-bly contribute to lift economic confidence in March, also on the back of a further moderate improvement in indus-trial and services sentiment.
Source: Thomson Datastream, UniCredit Research
GERMANY, CONSUMER PRICES INFLATION LEVELING OFF (IN % YOY)
March should have seen a moderate mom uptick in con-sumer prices. The rise in energy prices triggered by the oil price should have more than offset the seasonally normal decline in food prices. The yoy rate is, therefore, trending slightly higher again, but remains below the 1% mark. All told, inflationary pressure remains subdued despite the weaker euro, and this should put further slight downward pressure on the core rate in the course of the year.
Source: Federal Statistical Office, UniCredit Research
26 March 2010 Economics & FI/FX Research
Friday Notes
UniCredit Research page 15 See last pages for disclaimer.
Tuesday, 30 March
SPAIN, CONSUMER PRICES EDGING UP
March MIB Cons. Feb Jan in % mom 1.3 -- 0.9 1.1
-1.6
-0.8
0
0.8
1.6
2.4
3.2
4
4.8
5.6
01/97 03/99 05/01 07/03 09/05 11/07 01/10
CIB forecast
We expect that harmonized inflation will rise sharply in March as a sizeable increase in gasoline prices will be compounded by an unfavorable base effect on transport. Core inflation (based on the Eurostat definition) may inch up to 0.1% vs. 0.0% previously.
Source: INE, UniCredit Research
Wednesday, March 31
EMU, CONSUMER PRICES ENERGY TO LIFT INFLATION IN MARCH
March CIB Cons. Feb Jan
in % mom 0.8 -- 0.3 -0.8
in % yoy 1.4 1.1 0.9 1.0
-1.0
0.0
1.0
2.0
3.0
4.0
5.0
01/05 01/06 01/07 01/08 01/09 01/10
CPI headline (in % yoy)
CPI core (in % yoy)
CIB forecast
ECB target zone
In March, headline inflation is expected to accelerate to 1.4% (from 0.9% in February). Risks to our estimate are to the downside. We see this large increase as almost entirely energy-driven, even though we wouldn’t rule out a small technical increase in core inflation. Food prices are off the lows, but remain very moderate.
Source: Eurostat, UniCredit Research
GERMANY, UNEMPLOYMENT OFFICIAL LABOR MARKET NUMBERS REMAIN RESILIENT (UNEMPLOYED IN MN)
The weather has been much kinder recently. Accord-ingly, the spike in winter unemployment should already be followed by a marked recovery in March. The not-adjusted number should have posted a strong decline. For seasonally-adjusted unemployment, in contrast, we expect a further controlled increase for the foreseeable future. But the improved hiring plans no longer point to a strong wave of lay-offs.
Source: Federal Employment Agency, UniCredit Research
26 March 2010 Economics & FI/FX Research
Friday Notes
UniCredit Research page 16 See last pages for disclaimer.
ITALY, CONSUMER PRICES INFLATION SET TO RISE ONLY MARGINALLY IN MARCH
Even though the price of oil products is rising strongly, in Italy the inflation rate should rise by only 0.1pp in March, as tame developments in non-energy components offset part of the energy increase. However, we expect con-sumer prices to accelerate further next month.
Quelle: Thomson Datastream, UniCredit Research
Thursday, April 1
UK, PMI MANUFACTURING TO STABILIZE AT THE CURRENT HIGH LEVEL
March CIB Cons. Feb Jan 56.7 56.8 56.6 56.6
30
35
40
45
50
55
60
01/99 01/01 01/03 01/05 01/07 01/09
PMI Manufacturing
3M moving average
critical level
After having reached the highest level since July 1994 (at 56.6), we expect the March reading of the manufac-turing PMI to stabilize at around the current level, which is well above its long-term average. This corresponds with stronger momentum in manufacturing activity.
Inflation After peaking in mid-2006, house prices have corrected by more than 30%. In addition, lower excess supply of homes is putting less downward pressure on prices. As a result, the yoy decline in the Case Shiller index slowed to -3.1% in December from a record -19.0% at the be-ginning of 2009. For January, we expect a further im-provement to -0.7%, which would be the slowest yoy de-cline since January 2007.
The Conference Board’s consumer confidence index fell in February to its lowest level in ten months. We think that this pronounced decline was largely due to the heavy snowstorms that hit the East Coast in the middle of the month, and accordingly we expect a rebound in March. But even this level would still be more than 40% below the series’ long-term average, and about 50% be-low the pre-crisis levels. Households are particularly concerned about the labor market and their income situation.
Source: Thomson Datastream, UniCredit Research
26 March 2010 Economics & FI/FX Research
Friday Notes
UniCredit Research page 18 See last pages for disclaimer.
Jobless claims (thousands, weekly)4-week moving average
Looking through the weekly volatility caused by weather patterns, seasonal adjustment factors, and national holi-days, initial claims have been basically flat sine late No-vember. The deceleration in layoffs, therefore, has been much more benign than suggested by the strong GDP growth numbers. But as more and more companies have finished the adjustment of their workforce, we ex-pect that the downward trend in jobless claims that started almost one year ago remains intact.
Source: Thomson Datastream, UniCredit Research
ISM MANUFACTURING DYNAMIC IN MANUFACTURING HAS REACHED ITS PEAK
March CIB Cons. Feb Jan
56.5 57.0 56.5 58.4
30
35
40
45
50
55
60
65
01/97 01/99 01/01 01/03 01/05 01/07 01/09
ISM manufacturingISM non-manufacturingCritical value
Contraction
The manufacturing sector in recent months has bene-fited significantly from the turnaround in the inventory cycle. But while the inventory-led production increase continues, there are initial signs that the dynamic has most likely reached its peak. The ISM’s new orders-to-inventory ratio, for example, has declined significantly in recent months. We expect that new orders will continue to ease gradually, while inventories should continue to climb. The production index might recover somewhat if the decline in February to 58.4 from 66.2 was partly weather-related.
Source: Thomson Datastream, UniCredit Research
26 March 2010 Economics & FI/FX Research
Friday Notes
UniCredit Research page 19 See last pages for disclaimer.
Friday, April 2
MONTHLY EMPLOYMENT REPORT CENSUS HIRES TO BOOST PAYROLLS IN MARCH
March CIB Cons. Feb Jan
Nonfarm payrolls in k 250 187 -36 -26 Unemployment rate in % 9.7 9.7 9.7 9.7
-750
-600
-450
-300
-150
0
150
300
450
600
01/97 01/99 01/01 01/03 01/05 01/07 01/09
3.0
3.8
4.6
5.4
6.2
7.0
7.8
8.6
9.4
10.2
11.0
Non-farm payrolls(monthly changes in
thousands)
Unemployment rate (in %, inverted, RS)
The US labor market is gradually moving towards stabi-lization. Between November and February, payrolls were declining at 27k per month, which is much less than the 225k still seen in September and October. Moreover, part of the decline in February might have been due to the severe snowstorms that hit the East Coast in the middle of the month. Accordingly, we expect some "pay-back" for the blizzard related-layoffs (most of the impact was on working hours rather than on payrolls), so that private payrolls might have risen slightly in March (+25k). In addition, the government has significantly stepped up its hiring activity for the Census 2010. Look-ing at the monthly patterns in 1990 and 2000, we esti-mate that more than 200k people were hired in March.
Source: Thomson Datastream, UniCredit Research
Dr. Harm Bandholz, CFA (UniCredit Bank), +1 212 672 5957, [email protected]
26 March 2010 Economics & FI/FX Research
Friday Notes
UniCredit Research page 20 See last pages for disclaimer.
Review Europe
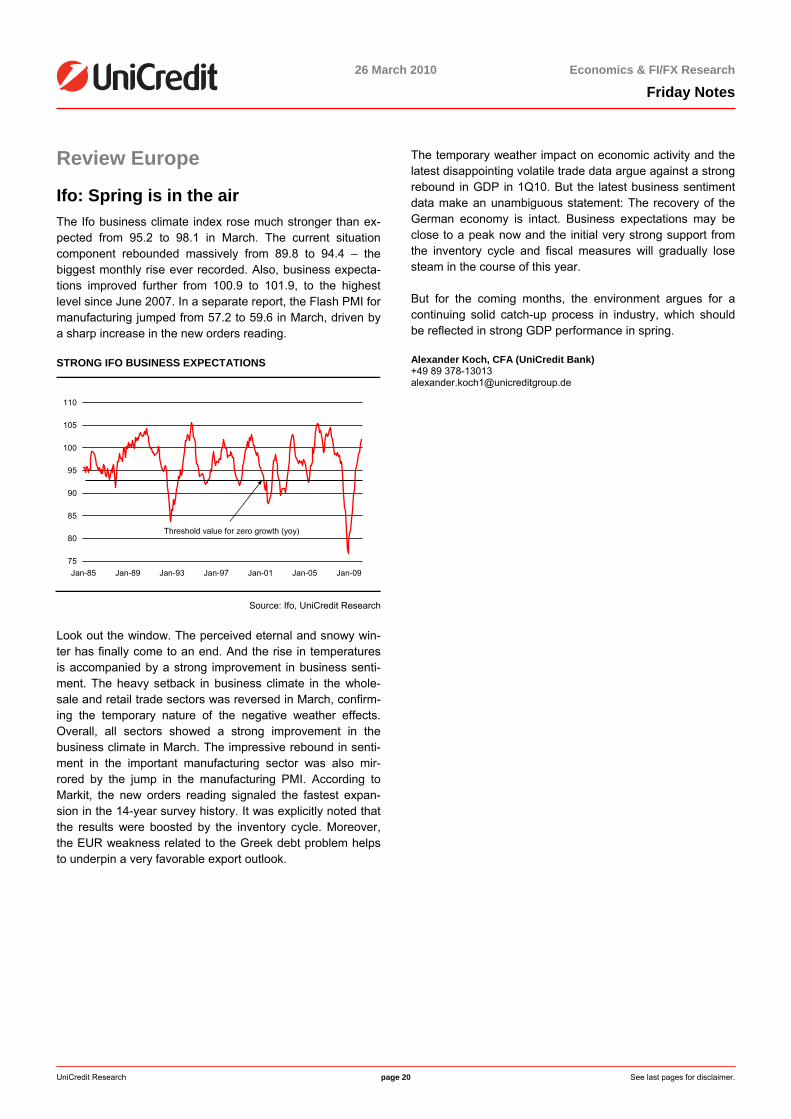
Ifo: Spring is in the air The Ifo business climate index rose much stronger than ex-pected from 95.2 to 98.1 in March. The current situation component rebounded massively from 89.8 to 94.4 – the biggest monthly rise ever recorded. Also, business expecta-tions improved further from 100.9 to 101.9, to the highest level since June 2007. In a separate report, the Flash PMI for manufacturing jumped from 57.2 to 59.6 in March, driven by a sharp increase in the new orders reading.
STRONG IFO BUSINESS EXPECTATIONS
75
80
85
90
95
100
105
110
Jan-85 Jan-89 Jan-93 Jan-97 Jan-01 Jan-05 Jan-09
Threshold value for zero growth (yoy)
Source: Ifo, UniCredit Research
Look out the window. The perceived eternal and snowy win-ter has finally come to an end. And the rise in temperatures is accompanied by a strong improvement in business senti-ment. The heavy setback in business climate in the whole-sale and retail trade sectors was reversed in March, confirm-ing the temporary nature of the negative weather effects. Overall, all sectors showed a strong improvement in the business climate in March. The impressive rebound in senti-ment in the important manufacturing sector was also mir-rored by the jump in the manufacturing PMI. According to Markit, the new orders reading signaled the fastest expan-sion in the 14-year survey history. It was explicitly noted that the results were boosted by the inventory cycle. Moreover, the EUR weakness related to the Greek debt problem helps to underpin a very favorable export outlook.
The temporary weather impact on economic activity and the latest disappointing volatile trade data argue against a strong rebound in GDP in 1Q10. But the latest business sentiment data make an unambiguous statement: The recovery of the German economy is intact. Business expectations may be close to a peak now and the initial very strong support from the inventory cycle and fiscal measures will gradually lose steam in the course of this year.
But for the coming months, the environment argues for a continuing solid catch-up process in industry, which should be reflected in strong GDP performance in spring.
Alexander Koch, CFA (UniCredit Bank) +49 89 378-13013 [email protected]
26 March 2010 Economics & FI/FX Research
Friday Notes
UniCredit Research page 21 See last pages for disclaimer.
US Review
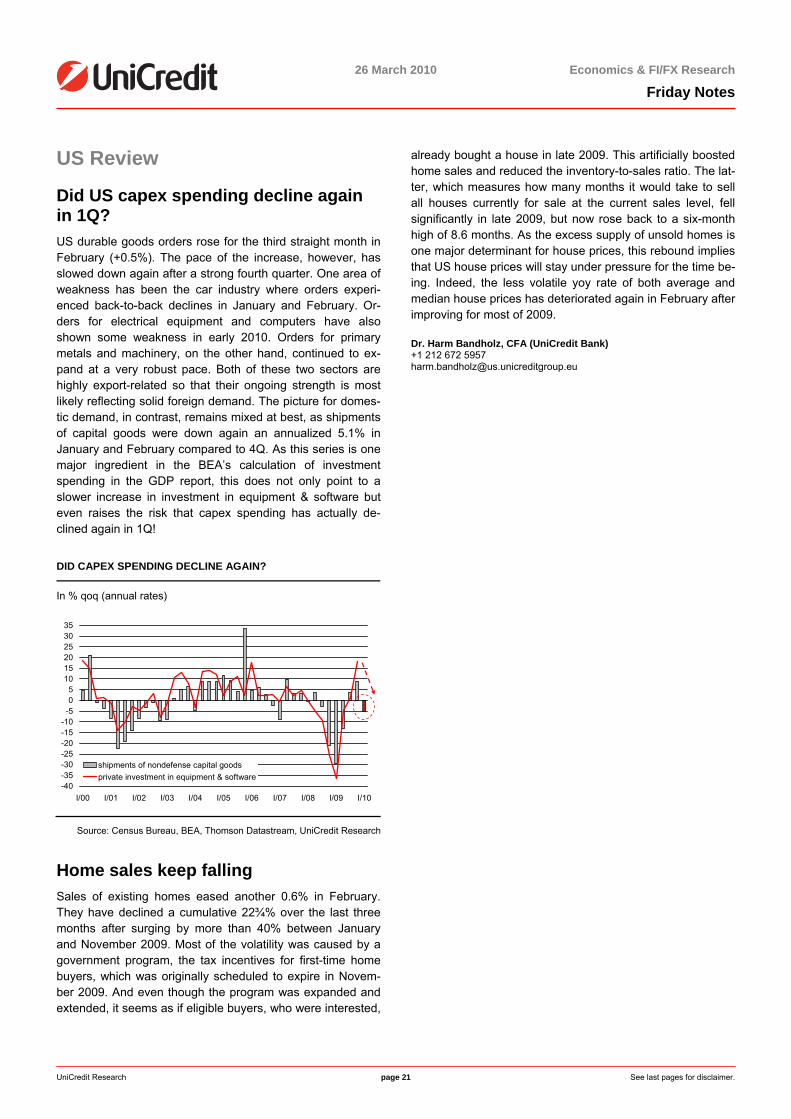
Did US capex spending decline again in 1Q? US durable goods orders rose for the third straight month in February (+0.5%). The pace of the increase, however, has slowed down again after a strong fourth quarter. One area of weakness has been the car industry where orders experi-enced back-to-back declines in January and February. Or-ders for electrical equipment and computers have also shown some weakness in early 2010. Orders for primary metals and machinery, on the other hand, continued to ex-pand at a very robust pace. Both of these two sectors are highly export-related so that their ongoing strength is most likely reflecting solid foreign demand. The picture for domes-tic demand, in contrast, remains mixed at best, as shipments of capital goods were down again an annualized 5.1% in January and February compared to 4Q. As this series is one major ingredient in the BEA’s calculation of investment spending in the GDP report, this does not only point to a slower increase in investment in equipment & software but even raises the risk that capex spending has actually de-clined again in 1Q!
shipments of nondefense capital goodsprivate investment in equipment & software
Source: Census Bureau, BEA, Thomson Datastream, UniCredit Research
Home sales keep falling Sales of existing homes eased another 0.6% in February. They have declined a cumulative 22¾% over the last three months after surging by more than 40% between January and November 2009. Most of the volatility was caused by a government program, the tax incentives for first-time home buyers, which was originally scheduled to expire in Novem-ber 2009. And even though the program was expanded and extended, it seems as if eligible buyers, who were interested,
already bought a house in late 2009. This artificially boosted home sales and reduced the inventory-to-sales ratio. The lat-ter, which measures how many months it would take to sell all houses currently for sale at the current sales level, fell significantly in late 2009, but now rose back to a six-month high of 8.6 months. As the excess supply of unsold homes is one major determinant for house prices, this rebound implies that US house prices will stay under pressure for the time be-ing. Indeed, the less volatile yoy rate of both average and median house prices has deteriorated again in February after improving for most of 2009.
Dr. Harm Bandholz, CFA (UniCredit Bank) +1 212 672 5957 [email protected]
26 March 2010 Economics & FI/FX Research
Friday Notes
UniCredit Research page 22 See last pages for disclaimer.
Fixed Income Outlook ■ The agreement between the EMU Member States and the
IMF on loans to Greece is not yet the solution to the prob-lem, but an important step forward.
■ Market reaction to the agreement was relatively con-strained. Spreads on Greek government bonds still ap-pear (too) wide.
Agreement prompts new questions The member states of the European Monetary Union (EMU) arrived at an agreement on possible loans to Greece. Pro-vided a number of conditions is met, the countries and the In-ternational Monetary Fund (IMF) will provide Greece with funding capital provided Greece needs it. One condition is that Greece faces "insufficient" financing conditions in the primary market. In secondary markets, yield spreads on Greek government bonds over Bunds range from 300 basis points (bp) for 10-year maturities to 350bp for 2-year maturi-ties. The Greek government targets refinancing options at considerably tighter spreads. At times, a cross-reference to Ireland was made. Spreads of Irish government bonds over Bunds are currently at around 150bp for 10-year maturities and only 80bp for 2-year maturities. To achieve Irish-like spread levels, the yield on Greek government bonds would have to fall by 150bp in 10-year maturities or even 270bp in 2-year maturities. Initial market reaction to the EMU/IMF agreement does not signal that these kinds of spread com-pression appear achievable within a reasonable period of time. Since the beginning of the week, the 10-year Greece-Bund spread has been tightening by about 30bp, while the 2-year spread has been tightening by about 80bp. However, only a small fraction of this spread movement was achieved in the immediate aftermath of the EMU/IMF agreement. At time of writing, we even observe a moderate re-widening of the spreads.
The situation is now as follows: Before Greece can have re-course to the credit facilities provided by the EMU/IMF agreement, it must be unsuccessful in accessing funding in capital markets. If Greece were to announce a new 10-year government bond in the coming days, current secondary spread levels suggest that the country would have to calcu-late on a spread over Bunds of around 300bp. Investors would be highly interested in purchasing the bond. All inves-tors who already participated in the Greek bond offerings in late January and early March would be highly interested in acquiring another tranche of Greek debt, since otherwise those investors would put the value of their earlier invest-ments in jeopardy. We see no risk that Greece won't be able to refinance its debt in capital markets. However, it is doubt-ful as to whether the country is actually willing to raise funds at prevailing market levels. The prime minister and finance
minister have repeatedly stressed that they don't intend to obtain funds from EMU Member States or the IMF; instead, their intention is to manage their refinancing needs on their own – at reasonable interest costs. It's probably fair to as-sume that the Greek authorities regard current market levels as derived from secondary market trading as "not reason-able". This would put Greece in a dilemma: if the country were to announce a new bond, this bond placement would in all likelihood be successful in the sense that there it would draw sufficient demand from investors. Greece itself, how-ever, is no longer willing to accept (and finance) spread lev-els in the 300bp plus area. Without a "failed" approach in capital markets, however, the doors to the EMU/IMF funds remain shut.
One possible solution to this dilemma could be achieved in the following way: Greece convinces the other EMU Member States that current spread levels in capital markets are "not reasonable" in the sense of the agreement from 25 March. The Member States might unanimously subscribe to this view, which would open the door to the newly agreed-upon credit facilities.
The discussion above demonstrates that the EMU/IMF agreement does not fully solve the short-term financing needs of the Greek government. In capital markets, the spread tightening of Greek government bonds versus Ger-man Bunds in the immediate aftermath of the agreement has been moderate at best. Uncertainty about the way Greece will obtain the funds which it needs to meet redemptions in April and May (approximately EUR 22bn) will most probably last until after the Easter holidays.
COMPARED TO IRELAND, GREECE HAS TO PAY BETWEEN 150BP AND 300BP HIGHER INTEREST RATES
UniCredit Research page 23 See last pages for disclaimer.
Forex Outlook ■ FX View: The overall picture remains uncertain in the G-
10 FX universe, and thus seesaw trading will continue.
■ EUR: We fear that the euro may stay very volatile in the 1.30-1.40 band for an “extended period of time”.
■ JPY: The yen will drop further, as the new FY in Japan starts in April and this means a return of JPY as the world’s favored carry trade unit.
■ GBP: Sterling will remain fairly fragile in the run-up to the UK elections, but will firm in 2H10.
■ CHF: EUR-CHF will benefit, as Greek funding needs have apparently been resolved, but its rebound should hardly exceed 1.50.
FX View: No easy way-out yet! The inability of both the euro and sterling to hold early gains in the last few weeks is a clear indication that the overall pic-ture remains uncertain in the G-10 FX world, and this should favor more tactical trading, at least throughout 2Q10, rather than well-defined trends. EMU concerns are not over. And the global economic scenario still also fails to show evidence of which country in the G-10 universe is fully exiting the cri-sis, outperforming the others. The US economy shows some signs of hope, but the start of a tightening cycle in the US is to be viewed more as an event of 2011 than of this year. The ECB seems more on the right track, although its exit strategy will be implemented prudently in the rest of 2010, as Trichet’s remarks confirming that the ECB will keep collateral at investment grade beyond the end of 2010 suggested. As a result, interest rate differentials won’t move deeply in favor of a single unit to give it a “competitive advantage” with respect to other FX majors.
EUR: EMU woes will again set the tone The recent dispute among EU members on a rescue pack-age to Greece sparked a new round of heavy sales of EUR-USD, destroying its early attempts to recover above 1.38 and dragging it to fresh 2010 lows below 1.33 in nearly a week. The EUR-USD outlook will depend on the evolution of the fiscal crisis across the eurozone also throughout 2Q10. Greece has still to cover in full an imbalance of nearly EUR 20bn between April and May: its commitment to respect also the EU deadlines, as well as its ability to raise funds from in-vestors will be deeply scrutinized by markets. A test of the 1.30 area cannot be excluded in the next couple of months, but we still think that in the wake of the plunge seen so far, a rebound back to the 1.39-1.42 area is still possible between
end 2Q10 and late 3Q10, once Athens has passed its most critical borrowing deadlines. Positive signs from Greece will reassure markets, reducing fears of contagion, rather than tempting investors to put Portugal and above all Spain in the line of fire and intensify selling pressures on the euro. But this potential bounce will be very far from turning into a trend reversal.
Easing tensions within the eurozone should offer at best the EU unit a cushion to the downside, if signals from the Fed confirm that the central bank is not in a rush to start a hike rate cycle this year. The ECB appears more determined to implement its exit strategy, but given the lack of action on the key refi rate, this may just keep EUR-USD away from a more intense sell-off rather than sparking a prolonged rally. On balance, we think the euro may stay volatile in the 1.30-1.40 band for an “extended period of time”.
JPY: Back to the world’s preferred bor-rowing unit The JPY has obviously benefited from the still uncertain global picture and the consequent resumption of risk aver-sion. Nevertheless, we expect the Japanese unit to return fast on offer, as soon as the new FY in Japan starts next week, becoming again the world’s favored borrowing cur-rency: the market’s preference for the JPY as the main fund-ing unit has already emerged in the Libor fixing, with JPY rates having already fallen below the corresponding US rates since August. Moreover, in the wake of its recent decision to double to JPY 20 trillion its loan program, the BoJ will be easily the last central bank in the G-10 universe to start a tightening cycle. We thus reiterate our call for USD-JPY to return back close to 100 by the end of the year and this should offer some relief to EUR-JPY too. Indeed, due to the limited room we see for a sustained EUR-USD rally, EUR-JPY upside potential won’t exceed the 140 area.
26 March 2010 Economics & FI/FX Research
Friday Notes
UniCredit Research page 24 See last pages for disclaimer.
GBP: Still fragile & volatile, but just in the run-up to the UK elections Sterling has rapidly become a fragile currency this year and at least three structural factors have worked so far as a drag: first, the BoE unexpectedly did not rule out an extension, if needed, of its QE policy, through further Gilt buying, although bond purchases have formally already ended at GBP 200bn. Second, fears have escalated that a further economic down-turn and a sharp worsening of the UK budget deficit may put Britain’s current AAA rating at risk. Third, latest polls have strongly ignited speculation about a hung Parliament after the upcoming UK election, likely on May 6. The two latter is-sues are strictly related: a Tory victory will imply new meas-ures aimed at rapidly reducong the rocketing UK budget defi-cit, now heading towards 13% of GDP, that may push the UK economy again into recession, while Labor’s success will make budget cuts less intensive, with a less negative impact on the economy at the price of a persisting high deficit. The prospects of a hung Parliament will represent the worst sce-nario, as a Lib-lab coalition will point to compromises on the economic policy front.
EUR-GBP: RISK OF PARITY TEST STILL LIMITED
0.82
0.86
0.9
0.94
0.98
1.02
1.06
01/09 03/09 06/09 08/09 11/09 02/1065
67
69
71
73
75
77
79
81
83
85
EUR-GBP
GBP trade weighted index (RS)
Source: Bloomberg, UniCredit Research
The outlined scenario should thus expose sterling to more selling pressure in the months to come, but at the same time, while EUR-GBP will likely fluctuate more above 0.90 than we had anticipated so far, we still view a test of parity as an unlikely scenario, unless one of the outlined “extreme risks” for sterling escalates significantly. On the other hand, as long as the ongoing concerns over the UK economy, its deficit and the banking sector will progressively abate, selling pres-sures on sterling will decline as well. Therefore, we still target a EUR-GBP return back below 0.85 by 1Q11, even in case the BoE will delay the start of its tightening cycle to 1Q11 rather than at the very end of 2010. Likewise, GBP-USD has showed so far a good resilience to the downside, once the 1.50 base has been tested. Hence, while attempts to break
through this threshold are likely in the run up to the elections, we doubt that the New Year’s lows below 1.47 will be reached. Like in EUR-GBP, some sterling recovery will pro-gressively take place after the summer, as soon as the politi-cal picture becomes clearer. We still target cable at around 1.60 in one year.
CHF: Full in the SNB's hands While USD-CHF will fluctuate further at around 1.06, the EUR-CHF fate will depend again on SNB FX intentions: SNB FX reserves doubled since March 2009, indicating almost permanent physical interventions, only few one-off actions have been identified. But the franc has run fast whatever in-dicator is used: in TWI terms, it has risen by more than 17% since late 2007, and also in terms of the “old” DEM-CHF, the franc is at record highs since the early 70s. The SNB's be-havior, particularly after softening its official intervention rhetoric in December 2009 and its obvious absence from markets, leads to the assumption that the SNB's intention is to decelerate the downward trend in EUR-CHF rather than to reverse it. As a good part of the EUR-CHF fall is also due to EUR weakness, which should diminish for several months, once Greek funding problems have been resolved, this pair will find a bottom, with subsequently developing recovery po-tential in the wake of more risk appetite. In any case, the re-bound should hardly exceed 1.50 as long as the CHF hasn't resumed its status of a carry-trade funding currency.
EUR-CHF: SNB TO SLOW ITS SLIDE RATHER THAN TO FULLY REVERSE IT
UniCredit Research page 25 See last pages for disclaimer.
MIB View – Our Global Picture Global economy ■ The Great Recession has run its course last autumn. Real
worldwide GDP growth even accelerated in 4Q09. And most economic indicators still point north. It is, however, so far no more than a technical rebound after the preced-ing economic collapse that is already facing the threat of another setback in the course of 2010 before economic growth should re-accelerate slightly again.
■ For 2010, we expect real GDP to rise 3.5% on a PPP ba-sis (2011: +3.7%; 2009: -1%). That remains, however, be-low trend. Economic activity in industrialized countries should post only a modest plus this year (+2%, 2011: +2%) after having contracted by around 3¼% in 2009. China and Emerging Asia, which were the first to achieve the trend reversal last year, will remain clearly at the top of the growth league also in 2010.
US ■ The US economy exited recession in autumn last year
and real GDP growth has accelerated to a robust 5.7% in 4Q09. But the pace of the recovery is not sustainable. Growth was primarily fuelled by the re-stocking process as well as the advance effects because of federal fiscal programs such as the “cash for clunkers“ program. It was, therefore, borrowed growth from the future. For that rea-son, we expect growth to decelerate to around 1½% in 2Q10 before gaining momentum again – a classic W-shaped recovery. For 2010 as a whole, we expect real GDP to grow by only 2.6% (2011: 2.0%; 2009: -2.4%).
■ The outlook for growth moderation and the still fragile state of the financial sector should not trigger a quick rise in the Fed Funds rate despite the fact that the FOMC raised its discount rate recently. We expect the Fed to stick to its Zero Interest Rate Policy (target rate currently at 0%-0.25%) this year followed by a rate hike of 50 bp in 1Q11. This will be preceded by a further gradual removal of its Quantitative Easing measures.
Eurozone ■ The eurozone exited its deepest recession since WWII
also in autumn last year. Real GDP recovered further at the turn of the year, but only slightly (4Q09: +0.1%). And it was primarily the turnaround in the inventory cycle, the growth effects of economic stimuli programs and improv-ing net exports that lent a helping hand. The exceptionally slow pace of the recovery should continue, but we do not expect the EMU-wide economy to fall back again into re-cession. Eurozone GDP should grow by only 0.9% this year after having contracted by almost 4% last year. For 2011, we expect EMU-wide GDP growth of 1¼%.
■ Assuming that the economic upswing is not sustainable yet, the ECB should not raise its key interest rate of cur-rently 1% this year. But it already stated to remove excess liquidity gradually and at a measured pace. It offered the last 12-month tender at the end of 2009 at a variable rate and will likely scale back other LTROs by mid-year. We expect no first rate hike until the beginning of next year.
Government bond markets ■ The approaching monetary tightening (in early 2011) in
conjunction with a growing risk appetite against the back-ground of improving economic and corporate news will send government bond yields higher (again). Combined with the growing supply of Treasuries, long-term US yields (10Y) should reach the 4½% at the end of this year. 10Y Bund yields should basically follow the US lead, but it will be spring 2011 before they clear the 4% hurdle.
Exchange rates ■ Beyond the current phase of weakness, EUR-USD should
strengthen once again and advance above 1.40 this summer. Only when the start of the Fed’s normalization of its key rate is within reach should the USD strengthen again, bringing down EUR-USD to 1.38 by the end of 2010. We expect the JPY to weaken especially in 2H10. USD-JPY should start to test the 100 mark at the turn of the year.
Comments: *The GDP shares used for aggregation are based on the purchasing-power-parity (PPP) valuation of country GDPs ** Real GDP 2010 unadjusted: +1.9% GDP = Gross Domestic Product, HICP = Harmonized Index of Consumer Prices, CPI = Consumer Price Index, f = forecast
26 March 2010 Economics & FI/FX Research
Friday Notes
UniCredit Research page 27 See last pages for disclaimer.
UniCredit Research page 29 See last pages for disclaimer.
Economic Event & Data Release Calendar Time ConsensusDate (ECB) Country Indicator Period MIB est. (Bloomberg) Prev. period 26 March to 02 April 2010 Fri, 26 Mar '10 14:55 US University of Michigan consumer confidence Apr 73.0 72.5 17:00 GE ECB's Trichet Speaks at Event in Muenster, Germany Mon, 29 Mar '10 UK House price (Nationwide, in % yoy) Mar 8.2 9.2 GE Harmonized CPI (in % yoy) Mar 0.9 0.5 GE Consumer price index, CPI (national, in % yoy) Mar 0.8 0.9 0.6 9:30 UK Mortgage approvals (in thousands) Feb 48 48.198 10:00 EMU European Commission services sentiment (index) Mar 2.0 0.9 10:00 EMU European Commission manufacturing sentiment (index) Mar -10.5 -12.7 10:00 EMU European Commission economic sentiment (index) Mar 98.2 97.0 95.9 10:00 EMU European Commission consumer confidence climate (index) Apr -17.0 -17.2 10:00 EMU European Commission business climate (index) Mar -0.85 -0.98 13:30 US PCE core inflation (in % mom) Feb 0.1 0.0 13:30 US Personal expenditures (in % m-om) Feb 0.3 0.5 13:30 US Personal income (in % mom) Feb 0.1 0.1 Tue, 30 Mar '10 0:50 JP Industrial production (in % yoy) Feb 31.7 18.5 7:45 FR Real GDP (in % qoq) Q1 0.6 9:30 UK Real GDP (in % qoq) Q1 0.3 0.3 14:00 US S&P/Case-Shiller home priceindex (in % yoy) Jan -0.7 -0.6 -3.1 15:00 US Conference Board consumer confidence Mar 54 50 46 18:00 US Former Fed Chairman Volcker Speaks on Financial Reform in DC Wed, 31 Mar '10 GE Retail sales (real, in % mom) Feb 0.2 -0.5 0:01 UK Consumer confidence (GFK, index) Mar -13 -14 2:15 US Fed's Fisher Speaks in Tucson on the Economic Crisis 6:00 JP Tankan survey small business Mar 42.3 7:45 FR Producer price index, PPI (in % mom) Feb 0.7 8:55 GE Unemployment rate (in %) Mar 8.2 8.2 8:55 GE Unemployment change (in thousands) Mar 15 10 7 9:00 IT Producer price index, PPI (in % yoy) Feb 0.4 -0.3 10:00 IT Consumer price index (in % yoy) Mar 1.3 1.3 1.2 10:00 EMU Consumer price index, CPI (in % yoy, flash estimate) Mar 1.1 0.9 10:00 EMU Umemployment rate (in %) Feb 10.0 9.9 10:30 SZ KOF business climate Mar 1.9 1.9 13:15 US ADP employment index (change in thousands mom) Mar 40 -20 14:45 US Chicago Purchasing Managers Index Mar 61.7 62.6 19:30 IT ECB's Bini Smaghi Holds Speech in Rome, Italy Thu, 01 Apr '10 UK House price (HBOS, in % 3M yoy) Mar 4.5 0:15 JP PMI (Nomura) Mar 52.5 0:50 JP Tankan survey large enterprises non-manuf. (forecast) Q1 -15 -19 0:50 JP Tankan survey large enterprises manufacturing Q1 -14 -24 1:00 UK Bank of England Releases Credit Conditions Survey 8:30 SZ Manufacturing PMI (index) Mar 59.0 57.4 8:45 IT Manufacturing PMI (index) Mar 52.6 51.6 8:50 FR Manufacturing PMI (index) Apr 56.3 8:55 GE Manufacturing PMI (index) Apr 59.6 59.6 9:00 EMU Manufacturing PMI (index) Apr 56.3 56.3 9:30 UK Manufacturing PMI (index) Mar 56.7 56.8 56.6 13:30 US Initial jobless claims (in thousands) Mar 26 445 445 442 15:00 US Construction spending (in % mom) Feb -1.0 -0.6 15:00 US ISM manufacturing (index) Mar 56.5 57.0 56.5 17:00 IT New car registration (in % yoy) Mar 20.59 19:00 IT Budget balance (EUR bn) Mar -13 22:00 US Auto sales (in mn) Mar 12 10.36 Fri, 02 Apr '10 13:30 US Unemployment rate (in %) Mar 9.7 9.7 13:30 US Non-farm payrolls (change in thousands mom) Mar 250 187 -36
*Asterisked releases are scheduled on or after the date shown; sa = seasonal adjusted, nsa = not seasonally adjusted, wda = working day adjusted
26 March 2010 Economics & FI/FX Research
Friday Notes
UniCredit Research page 30 See last pages for disclaimer.
Economic Event & Data Release Calendar – The week after Time ConsensusDate (ECB) Country Indicator Period MIB est. (Bloomberg) Prev. period 05 April to 09 April 2010 Mon, 05 Apr '10 15:00 US Pending home sales (in % mom) Feb -7.6 15:00 US ISM Non-manufacturing (index) Mar 53.5 53.0 Tue, 06 Apr '10 8:15 SZ Consumer price index (in % yoy) Mar 0.9 9:30 GE Sentix growth expectations Apr -7.4757 Wed, 07 Apr '10 JP Bank of Japan key rate (in %) Jan 1 0.1 8:45 IT Services PMI (index) Mar 50.8 8:50 FR Services PMI (index) Apr 53.0 8:55 GE Services PMI (index) Apr 54.7 9:00 EMU Composite PMI (index) Apr 55.5 9:00 EMU Services PMI (index) Apr 53.7 9:30 UK Services PMI (index) Mar 58.4 10:00 EMU Private consumption (in % qoq) Q1 0.0 10:00 EMU Government consumption (in % qoq) Q1 -0.1 10:00 EMU Gross fixed capital formation (in % qoq) Q1 -0.8 10:00 EMU Real GDP (in % yoy) Q1 -2.1 10:00 EMU Real GDP (in %qoq) Q1 0.1 10:00 EMU Producer price index, PPI (in % yoy) Feb -1.0 11:00 GE Industrial orders (in % mom) Feb 4.3 19:00 US Fed's Bernanke to Speak at Dallas Luncheon 20:00 US Consumer credit (USD bn) Feb 4.958 Thu, 08 Apr '10 6:45 SZ Unemployment rate (in %) Mar 4.1 7:45 FR Budget balance (EUR bn) Feb -9.206 7:45 FR Trade balance (EUR bn) Feb -3.681 9:30 UK Industrial production (in % mom) Feb -0.5 10:00 EMU Retail sales (volume, in % mom) Feb -0.5 11:00 GE Industrial production (in % mom) Feb 0.6 11:00 GE Industrial production (in % yoy) Feb 2.2 12:00 UK Bank of England repo rate (in %) Jan 1 0.5 0.5 12:45 EMU ECB refi rate (in %) Jan 1 1.0 14:30 EC Trichet Speaks at ECB Monthly News Conference Fri, 09 Apr '10 7:00 GE Exports (in % mom) Feb -6.4 7:00 GE Imports (in % mom) Feb 5.7 7:45 FR Industrial production (in % mom) Feb 1.6 9:30 UK Producer price index, manuf. products (in % mom) Mar 0.
*Asterisked releases are scheduled on or after the date shown; sa = seasonal adjusted, nsa = not seasonally adjusted, wda = working day adjusted
26 March 2010 Economics & FI/FX Research
Friday Notes
UniCredit Research page 31
Disclaimer Our recommendations are based on information obtained from, or are based upon public information sources that we consider to be reliable but for the completeness and accu-racy of which we assume no liability. All estimates and opinions included in the report represent the independent judgment of the analysts as of the date of the issue. We reserve the right to modify the views expressed herein at any time without notice. Moreover, we reserve the right not to update this information or to discontinue it altogether without no-tice. This analysis is for information purposes only and (i) does not constitute or form part of any offer for sale or subscription of or solicitation of any offer to buy or subscribe for any financial, money market or investment instrument or any security, (ii) is neither intended as such an offer for sale or subscription of or solicitation of an offer to buy or subscribe for any financial, money market or investment instrument or any security nor (iii) as an advertisement thereof. The investment possibilities discussed in this report may not be suitable for certain investors depending on their specific investment objectives and time horizon or in the context of their overall financial situation. The investments discussed may fluctuate in price or value. Investors may get back less than they invested. Changes in rates of exchange may have an adverse effect on the value of investments. Further-more, past performance is not necessarily indicative of future results. In particular, the risks associated with an investment in the financial, money market or investment instru-ment or security under discussion are not explained in their entirety. This information is given without any warranty on an "as is" basis and should not be regarded as a substitute for obtaining individual advice. Investors must make their own de-termination of the appropriateness of an investment in any instruments referred to herein based on the merits and risks involved, their own investment strategy and their legal, fiscal and financial position. As this document does not qualify as an investment recommendation or as a direct investment recommendation, neither this document nor any part of it shall form the basis of, or be relied on in connection with or act as an inducement to enter into, any contract or commitment whatsoever. Investors are urged to contact their bank's investment advisor for individual explanations and advice. Neither UniCredit Bank AG, UniCredit Bank AG London Branch, UniCredit CAIB AG, UniCredit Bank AG Milan Branch, UniCredit CAIB Securities UK Ltd., UniCredit Securities, UniCredit Menkul Değerler A.Ş., UniCredit Bulbank, Zagrebačka banka, UniCredit Bank, Bank Pekao, Yapi Kredi, UniCredit Tiriac Bank, ATFBank, nor any of their respective di-rectors, officers or employees nor any other person accepts any liability whatsoever (in negligence or otherwise) for any loss howsoever arising from any use of this document or its contents or otherwise arising in connection therewith. This analysis is being distributed by electronic and ordinary mail to professional investors, who are expected to make their own investment decisions without undue reliance on this publication, and may not be redistributed, reproduced or published in whole or in part for any purpose. Responsibility for the content of this publication lies with: a) UniCredit Bank AG, Am Tucherpark 16, 80538 Munich, Germany, (also responsible for the distribution pursuant to §34b WpHG). The company belongs to UCI Group. Regulatory authority: “BaFin“ – Bundesanstalt für Finanzdienstleistungsaufsicht, Lurgiallee 12, 60439 Frankfurt, Germany. b) UniCredit Bank AG London Branch, Moor House, 120 London Wall, London EC2Y 5ET, United Kingdom. Regulatory authority: “BaFin“ – Bundesanstalt für Finanzdienstleistungsaufsicht, Lurgiallee 12, 60439 Frankfurt, Germany and subject to limited regulation by the Financial Ser-vices Authority (FSA), 25 The North Colonnade, Canary Wharf, London E14 5HS, United Kingdom. Details about the extent of our regulation by the Financial Services Authority are available from us on request. c) UniCredit Bank AG Milan Branch, Via Tommaso Grossi, 10, 20121 Milan, Italy, duly authorized by the Bank of Italy to provide investment services. Regulatory authority: “Bank of Italy”, Via Nazionale 91, 00184 Roma, Italy and Bundesanstalt für Finanzdienstleistungsaufsicht, Lurgiallee 12, 60439 Frankfurt, Germany. The UniCredit CAIB Group, consisting of d) UniCredit CAIB AG, Julius-Tandler-Platz 3, 1090 Vienna, Austria Regulatory authority: Finanzmarktaufsichtsbehörde (FMA), Praterstrasse 23, 1020 Vienna, Austria e) UniCredit CAIB Securities UK Ltd., Moor House, 120 London Wall, London EC2Y 5ET, United Kingdom Regulatory authority: Financial Services Authority (FSA), 25 The North Colonnade, Canary Wharf, London E14 5HS, United Kingdom f) UniCredit Securities, Boulevard Ring Office Building, 17/1 Chistoprudni Boulevard, Moscow 101000, Russia Regulatory authority: Federal Service on Financial Markets, 9 Leninsky prospekt, Moscow 119991, Russia g) UniCredit Menkul Değerler A.Ş., Büyükdere Cad. No. 195, Büyükdere Plaza Kat. 5, 34394 Levent, Istanbul, Turkey Regulatory authority: Sermaye Piyasası Kurulu – Capital Markets Board of Turkey, Eskişehir Yolu 8.Km No:156, 06530 Ankara, Turkey h) UniCredit Bulbank, Sveta Nedelya Sq. 7, BG-1000 Sofia, Bulgaria Regulatory authority: Financial Supervision Commission, 33 Shar Planina str.,1303 Sofia, Bulgaria i) Zagrebačka banka, Paromlinska 2, HR-10000 Zagreb, Croatia Regulatory authority: Croatian Agency for Supervision of Financial Services, Miramarska 24B, 10000 Zagreb, Croatia j) UniCredit Bank, Na Príkope 858/20, CZ-11121 Prague, Czech Republic Regulatory authority: CNB Czech National Bank, Na Příkopě 28, 115 03 Praha 1, Czech Republic k) Bank Pekao, ul. Grzybowska 53/57, PL-00-950 Warsaw, Poland Regulatory authority: Polish Financial Supervision Authority, Plac Powstańców Warszawy 1, 00-950 Warsaw, Poland l) UniCredit Bank, Prechistenskaya emb. 9, RF-19034 Moscow, Russia Regulatory authority: Federal Service on Financial Markets, 9 Leninsky prospekt, Moscow 119991, Russia m) UniCredit Bank, Šancova 1/A, SK-813 33 Bratislava, Slovakia Regulatory authority: National Bank of Slovakia, Stefanikovo nam. 10/19, 967 01 Kremnica, Slovakia n) Yapi Kredi, Yapi Kredi Plaza D Blok, Levent, TR-80620 Istanbul, Turkey Regulatory authority: Sermaye Piyasası Kurulu – Capital Markets Board of Turkey, Eskişehir Yolu 8.Km No:156, 06530 Ankara, Turkey o) UniCredit Tiriac Bank, Ghetarilor Street 23-25, RO-014106 Bucharest 1,Romania Regulatory authority: CNVM, Romanian National Securities Commission, Foişorului street, no.2, sector 3, Bucharest, Romania p) ATFBank, 100 Furmanov Str., KZ-050000 Almaty, Kazakhstan Agency of the Republic of Kazakhstan on the state regulation and supervision of financial market and financial organisations, 050000, Almaty, 67 Aiteke Bi str., Kazakhstan POTENTIAL CONFLICTS OF INTEREST UniCredit Bank AG acts as a Specialist or Primary Dealer in government bonds issued by the Italian, Portuguese and Greek Treasury. Main tasks of the Specialist are to partici-pate with continuity and efficiency to the governments' securities auctions, to contribute to the efficiency of the secondary market through market making activity and quoting re-quirements and to contribute to the management of public debt and to the debt issuance policy choices, also through advisory and research activities. ANALYST DECLARATION The author’s remuneration has not been, and will not be, geared to the recommendations or views expressed in this study, neither directly nor indirectly. ORGANIZATIONAL AND ADMINISTRATIVE ARRANGEMENTS TO AVOID AND PREVENT CONFLICTS OF INTEREST To prevent or remedy conflicts of interest, UniCredit Bank AG, UniCredit Bank AG London Branch, UniCredit CAIB AG, UniCredit Bank AG Milan Branch, UniCredit CAIB Securi-ties UK Ltd., UniCredit Securities, UniCredit Menkul Değerler A.Ş., UniCredit Bulbank, Zagrebačka banka, UniCredit Bank, Bank Pekao, Yapi Kredi, UniCredit Tiriac Bank, ATFBank have established the organizational arrangements required from a legal and supervisory aspect, adherence to which is monitored by its compliance department. Con-flicts of interest arising are managed by legal and physical and non-physical barriers (collectively referred to as “Chinese Walls”) designed to restrict the flow of information be-tween one area/department of UniCredit Bank AG, UniCredit Bank AG London Branch, UniCredit CAIB AG, UniCredit Bank AG Milan Branch, UniCredit CAIB Securities UK Ltd., UniCredit Securities, UniCredit Menkul Değerler A.Ş., UniCredit Bulbank, Zagrebačka banka, UniCredit Bank, Bank Pekao, Yapi Kredi, UniCredit Tiriac Bank, ATFBank and an-other. In particular, Investment Banking units, including corporate finance, capital market activities, financial advisory and other capital raising activities, are segregated by physi-cal and non-physical boundaries from Markets Units, as well as the research department. In the case of equities execution by UniCredit Bank AG Milan Branch, other than as a matter of client facilitation or delta hedging of OTC and listed derivative positions, there is no proprietary trading. Disclosure of publicly available conflicts of interest and other ma-terial interests is made in the research. Analysts are supervised and managed on a day-to-day basis by line managers who do not have responsibility for Investment Banking ac-tivities, including corporate finance activities, or other activities other than the sale of securities to clients.
26 March 2010 Economics & FI/FX Research
Friday Notes
UniCredit Research page 32
ADDITIONAL REQUIRED DISCLOSURES UNDER THE LAWS AND REGULATIONS OF JURISDICTIONS INDICATED Notice to Austrian investors This document does not constitute or form part of any offer for sale or subscription of or solicitation of any offer to buy or subscribe for any securities and neither this document nor any part of it shall form the basis of, or be relied on in connection with or act as an inducement to enter into, any contract or commitment whatsoever. This document is confidential and is being supplied to you solely for your information and may not be reproduced, redistributed or passed on to any other person or published, in whole or part, for any purpose. Notice to Czech investors This report is intended for clients of UniCredit Bank AG, UniCredit Bank AG London Branch, UniCredit CAIB AG, UniCredit CAIB Securities UK Ltd. or UniCredit Bank AG Milan Branch in the Czech Republic and may not be used or relied upon by any other person for any purpose. Notice to Italian investors This document is not for distribution to retail clients as defined in article 26, paragraph 1(e) of Regulation n. 16190 approved by CONSOB on October 29, 2007. In the case of a short note, we invite the investors to read the related company report that can be found on UniCredit Research website www.research.unicreditgroup.eu. Notice to Russian investors As far as we are aware, not all of the financial instruments referred to in this analysis have been registered under the federal law of the Russian Federation “On the Securities Market” dated April 22, 1996, as amended, and are not being offered, sold, delivered or advertised in the Russian Federation. Notice to Turkish investors Investment information, comments and recommendations stated herein are not within the scope of investment advisory activities. Investment advisory services are provided in accordance with a contract of engagement on investment advisory services concluded with brokerage houses, portfolio management companies, non-deposit banks and the cli-ents. Comments and recommendations stated herein rely on the individual opinions of the ones providing these comments and recommendations. These opinions may not suit your financial status, risk and return preferences. For this reason, to make an investment decision by relying solely on the information stated here may not result in consequences that meet your expectations. Notice to Investors in Japan This document does not constitute or form part of any offer for sale or subscription for or solicitation of any offer to buy or subscribe for any securities and neither this document nor any part of it shall form the basis of, or be relied on in connection with or act as an inducement to enter into, any contract or commitment whatsoever. Notice to UK investors This communication is directed only at clients of UniCredit Bank AG, UniCredit Bank AG London Branch, UniCredit CAIB AG, UniCredit CAIB Securities UK Ltd. or UniCredit Bank AG Milan Branch who (i) have professional experience in matters relating to investments or (ii) are persons falling within Article 49(2)(a) to (d) (“high net worth companies, unincorporated associations, etc.”) of the United Kingdom Financial Services and Markets Act 2000 (Financial Promotion) Order 2005 or (iii) to whom it may otherwise lawfully be communicated (all such persons together being referred to as “relevant persons”). This communication must not be acted on or relied on by persons who are not relevant per-sons. Any investment or investment activity to which this communication relates is available only to relevant persons and will be engaged in only with relevant persons. Notice to U.S. investors This report is being furnished to U.S. recipients in reliance on Rule 15a-6 ("Rule 15a-6") under the U.S. Securities Exchange Act of 1934, as amended. Each U.S. recipient of this report represents and agrees, by virtue of its acceptance thereof, that it is such a "major U.S. institutional investor" (as such term is defined in Rule 15a-6) and that it understands the risks involved in executing transactions in such securities. Any U.S. recipient of this report that wishes to discuss or receive additional information regarding any security or issuer mentioned herein, or engage in any transaction to purchase or sell or solicit or offer the purchase or sale of such securities, should contact a registered representative of UniCredit Capital Markets, Inc. (“UCI Capital Markets”). Any transaction by U.S. persons (other than a registered U.S. broker-dealer or bank acting in a broker-dealer capacity) must be effected with or through UCI Capital Markets. The securities referred to in this report may not be registered under the U.S. Securities Act of 1933, as amended, and the issuer of such securities may not be subject to U.S. re-porting and/or other requirements. Available information regarding the issuers of such securities may be limited, and such issuers may not be subject to the same auditing and reporting standards as U.S. issuers. The information contained in this report is intended solely for certain "major U.S. institutional investors" and may not be used or relied upon by any other person for any purpose. Such information is provided for informational purposes only and does not constitute a solicitation to buy or an offer to sell any securities under the Securities Act of 1933, as amended, or under any other U.S. federal or state securities laws, rules or regulations. The investment opportunities discussed in this report may be unsuitable for certain inves-tors depending on their specific investment objectives, risk tolerance and financial position. In jurisdictions where UCI Capital Markets is not registered or licensed to trade in se-curities, commodities or other financial products, transactions may be executed only in accordance with applicable law and legislation, which may vary from jurisdiction to jurisdic-tion and which may require that a transaction be made in accordance with applicable exemptions from registration or licensing requirements. The information in this publication is based on carefully selected sources believed to be reliable, but UCI Capital Markets does not make any representation with respect to its completeness or accuracy. All opinions expressed herein reflect the author’s judgment at the original time of publication, without regard to the date on which you may receive such information, and are subject to change without notice. UCI Capital Markets may have issued other reports that are inconsistent with, and reach different conclusions from, the information presented in this report. These publications reflect the different assumptions, views and analytical methods of the analysts who prepared them. Past performance should not be taken as an indication or guarantee of future performance, and no representation or warranty, express or implied, is provided in relation to future performance. UCI Capital Markets and any company affiliated with it may, with respect to any securities discussed herein: (a) take a long or short position and buy or sell such securities; (b) act as investment and/or commercial bankers for issuers of such securities; (c) act as market makers for such securities; (d) serve on the board of any issuer of such securities; and (e) act as paid consultant or advisor to any issuer. The information contained herein may include forward-looking statements within the meaning of U.S. federal securities laws that are subject to risks and uncertainties. Factors that could cause a company’s actual results and financial condition to differ from expectations include, without limitation: political uncertainty, changes in general economic condi-tions that adversely affect the level of demand for the company’s products or services, changes in foreign exchange markets, changes in international and domestic financial markets and in the competitive environment, and other factors relating to the foregoing. All forward-looking statements contained in this report are qualified in their entirety by this cautionary statement This document may not be distributed in Canada or Australia.
26 March 2010 Economics & FI/FX Research
Friday Notes
UniCredit Research page 33
UniCredit Research* Thorsten Weinelt, CFA Global Head of Research & Chief Strategist +49 89 378-15110 [email protected]
Dr. Ingo Heimig Head of Research Operations +49 89 378-13952 [email protected]
Economics & FI/FX Research
Marco Annunziata, Ph.D., Chief Economist +44 20 7826-1770 [email protected]
Economics & Commodity Research Global Economics Dr. Davide Stroppa, Global Economist +39 02 8862-2890 [email protected]
European Economics Andreas Rees, Chief German Economist +49 89 378-12576 [email protected]
Marco Valli, Chief Italian Economist +39 02 8862-8688 [email protected]
Stefan Bruckbauer, Chief Austrian Economist +43 50505 41951 [email protected]
Herbert Stocker, Technical Analysis +49 89 378-14305, [email protected]
Publication Address
UniCredit Research Corporate & Investment Banking UniCredit Bank AG Arabellastrasse 12 D-81925 Munich Tel. +49 89 378-18927 - Fax +49 89 378-18352
Bloomberg UCGR Internet www.research.unicreditgroup.eu
* UniCredit Research is the joint research department of UniCredit Bank AG (UniCredit Bank), UniCredit CAIB Group (UniCredit CAIB), UniCredit Securities (UniCredit Securities),
UniCredit Menkul Değerler A.Ş. (UniCredit Menkul), UniCredit Bulbank, Zagrebačka banka, UniCredit Bank, Bank Pekao, Yapi Kredi, UniCredit Tiriac Bank and ATFBank.