Structural Evolution during Geopolymerization from an Early Age toConsolidated MaterialPrune Steins,† Arnaud Poulesquen,*,‡ Olivier Diat,§ and Fabien Frizon†
†CEA, DEN, DTCD/SPDE/LP2C-Marcoule, F-30207 Bagnols sur Ceze, France‡CEA, DEN, DTCD/SPDE/LCFI-Marcoule, F-30207 Bagnols sur Ceze, France§Institut de Chimie Separative de Marcoule UMR 5257 (CEA/CNRS/UM2/ENSCM), F-30207 Bagnols sur Ceze, France
*S Supporting Information
ABSTRACT: Time-resolved rheology, small angle X-ray scattering (SAXS),and electron paramagnetic resonance (EPR) techniques were used to study thepolymerization of geopolymers. These polymers are inorganically synthesizedby the alkaline activation of an aluminosilicate source (metakaolin) in aqueoussolution. The influence of the alkali activator (Na+, K+, and Cs+) wasinvestigated at room temperature. As observed through the variation of theviscoelastic moduli (G′, G″), curing proceeds in steps that are well pronouncedwhen NaOH is used. These steps correspond to a specific dissolution/polycondensation mechanism and are smoothed when the size of the alkalications increases. This size effect also has an impact on the gelation time(maximum of tan δ). Structural analysis through SAXS experiments allows us tocharacterize these mechanisms on the nanoscale and to show that the growth ofthe geopolymer is due to the aggregation of oligomers with a size that is evensmaller than the cation is chaotropic. Finally, water behavior during geopolymerization was assessed by using a spin probe. Theresults show that the spin-probe signal progressively disappears during the first moment of the reaction and reappears when thesolid polymeric gel is formed, highlighting the role of water molecules in the different chemical reactions during the process. TheEPR signal is in fact increasingly masked as the ion size decreases (because of the strength of the hydration shell). At the end ofthe reaction, some water molecules were released within the pores, restoring the visibility of the isotropic spin-probe signal.
■ INTRODUCTIONGeopolymers are a class of largely amorphous 3D alumi-nosilicate binder materials synthesized by the reaction of analuminosilicate powder with a concentrated alkali metal silicateor hydroxide solution.1 In addition to commercial applicationsin the field of civil engineering,2 geopolymers are considered tobe potential materials for immobilizing heavy metals or low-level nuclear waste.3−6 For each of these applications, anunderstanding of the chemical and physical phenomenaresponsible for the formation and hardening of thealuminosilicate gel is essential, especially for the developmentof innovative formulations suitable for these specific uses.The mechanisms occurring during the geopolymerization
process are well described in a recent review by Shi et al.,7 andthe reaction steps are relatively well accepted.8,9 The first stepconsists of alkaline digestion and the hydrolysis of thealuminosilicate source, releasing aluminate and silicate mono-mers that are probably partially deprotonated.10,11 Thesespecies react together to form a gel consisting of oligomersrich in aluminates; the gel gradually becomes richer in siliconand thermodynamically more stable.12,13 The consolidation ofthe material is then attributed to the formation of a 3Daluminosilicate network through polycondensation reactions.7
The chemical processes involved during the initial instants ofgeopolymerization thus affect not only the chemical composi-
tion and structure of the phases present in the system14 but alsothe subsequent structural reorganization of the binder.12 Inother words, the final physical and chemical properties of thegeopolymeric gel are controlled by the nanostructural arrange-ment of silicon and aluminum in the geopolymers, which variesaccording to the initial reactivity of the system (i.e., thesynthesis conditions, particularly the temperature,12,15 thereactants used,16 especially the aluminosilicate source,17 andthe nature and concentration of the alkali ions added to theactivating solution15,18). Material structuring is generallystudied in terms of local elemental distributions or the chemicalenvironment, especially for aluminum and silicon,10,13,19−21 butthe material texture/structure remains to be investigated,although it determines the processes of material gelation andits potential subsequent reorganization. The main objective ofthis work is to determine the mechanism(s) of aggregation ofaluminosilicate oligomers and their rearrangement over timewithin the geopolymers. For this purpose, the use of SAXS,coupled with other analysis methods, appears to be verypromising in shedding light on how the formulation and
Received: February 29, 2012Revised: April 27, 2012Published: April 30, 2012
reaction kinetics are correlated to the organization/reorganiza-tion of the gel.
■ MATERIALS AND METHODSGeopolymer Synthesis. To focus on a model system and avoid
the precipitation of calcium silicate hydrate phases mixed withgeopolymeric materials,22 the choice was made to synthesize ametakaolin-based geopolymer paste. The metakaolin used was aPremix MK (Grace Construction) whose main characteristics can befound elsewhere.6
Alkali hydroxide activating solutions were prepared by dissolvingNaOH, KOH, and CsOH (Prolabo, Rectapur, 98%) pellets in Milli-Qwater. Amorphous silica provided by Rhodia (Tixosil 38) was added tothe mix.Three series of mixtures were prepared in the same molar ratios:
1:1.8:1:12 Al/Si/M/H2O (M = Na, K, or Cs). The Al2O3/M2O ratiowas adjusted to 1 to maximize the geopolymerization reactions.23
Mixing was performed in two steps. First, alkali silicate solutionswere prepared by dissolving and mixing amorphous silica in alkalisolution for 24 h. During the second step, geopolymer samples wereprepared by mixing metakaolin and alkali solution. Each type ofmeasurement was performed a few minutes after the mixing. For SAXSexperiments and during the first hours of polymerization, datacollection was performed in situ and the solutions were stored severaldays before being re-exposed to X-rays.Rheological Measurements. Dynamic rheological measurements
were performed using a controlled-stress rheometer (ARG2, TAInstruments) operated in controlled-rate mode. All of the tests wereperformed in the linearity range (γ = 10−4 and ω = 1 rad·s−1) toprevent the structural decomposition of the geopolymer network as itwas formed. Measurements were performed in unconventionalgeometry to facilitate mixing, using a bowl and a helical 316 L steelribbon impeller calibrated according to the procedure described in theliterature.24
The geopolymer paste was prepared manually outside therheometer for approximately 5 min and then introduced into therheometer bowl after mixing. The measurement was made 5 min later.Transferring the geopolymer to the measurement cell generatesresidual stresses that must be released prior to each rheologicalmeasurement. This was done before each test by applying a strain of0.05 and pulsation at a rate of 5 rad·s−1.25 For each geopolymer
investigated containing sodium, potassium, or cesium cations, theevolution of the viscoelastic parameters (G′, the elasticity, G″, theviscous dissipation, and tan δ, the ratio between G″ and G′) wasmonitored during geopolymerization at room temperature.
SAXS Experiments. Small-angle X-ray scattering (SAXS) measure-ments using Mo radiation (λ = 0.71 Å) were performed on a benchbuilt by Xenocs. The scattered beam was recorded using a large onlinescanner detector (345 mm diameter, from MAR Research) located750 mm from the sample stage. A large Q range (2 × 10⁻² to 2.5 Å−1)was covered thanks to off-center detection. Collimation was appliedusing a 12:∞ multilayer Xenocs mirror (for Mo radiation) coupled totwo sets of Forvis scatterless slits providing a 0.8 mm × 0.8 mm X-raybeam at the sample position. Data preanalysis was performed usingFIT2D software, taking into account the electronic background of thedetector (the flat field is homogeneous) and empty cell subtraction.The scattering intensities were expressed versus the magnitude ofscattering vector Q = [(4π)/λ] sin(θ/2), where λ is the wavelength ofincident radiation and θ is the scattering angle. The experimentalresolution was ΔQ/Q = 0.05. Silver behenate in a sealed capillary wasused as the scattering vector calibration standard. A piece of high-density PE sample is used to calibrate the scattering intensity inabsolute units. Glass capillaries 1.8 mm in diameter (for Na- and K-based geopolymers) and 1.2 mm in diameter (for Cs-basedgeopolymer) were used for the kinetic monitoring of geopolymerscontaining sodium, potassium, or cesium. The cesium activatingsolution was measured with a 0.2-mm-thick flat capillary to preventexcessive X-ray absorption by the heavy cesium atom (transmission of36%). The sodium and potassium activating solutions were measuredwith a 1 mm capillary, and the transmission was about 73 and 56%,respectively. SAXS diagrams were recorded at regular intervals duringthe 20 h test at room temperature; the first 10 min after mixing werediscounted for filling and mounting the capillary and starting theacquisition. The absolute intensity was then obtained by subtractingthe intensity scattered through an empty cell from the raw intensities,taking into account the sample thickness, the transmission (measuredbefore each acquisition using a photodiode inserted between thesample and the detector before and after each acquisition), and theacquisition time26 (SI).
EPR Experiments. The geopolymerization kinetics was alsomonitored in situ by electron paramagnetic resonance (EPR). EPRspectra were obtained using a Bruker BioSpin X-Band EMX-plus
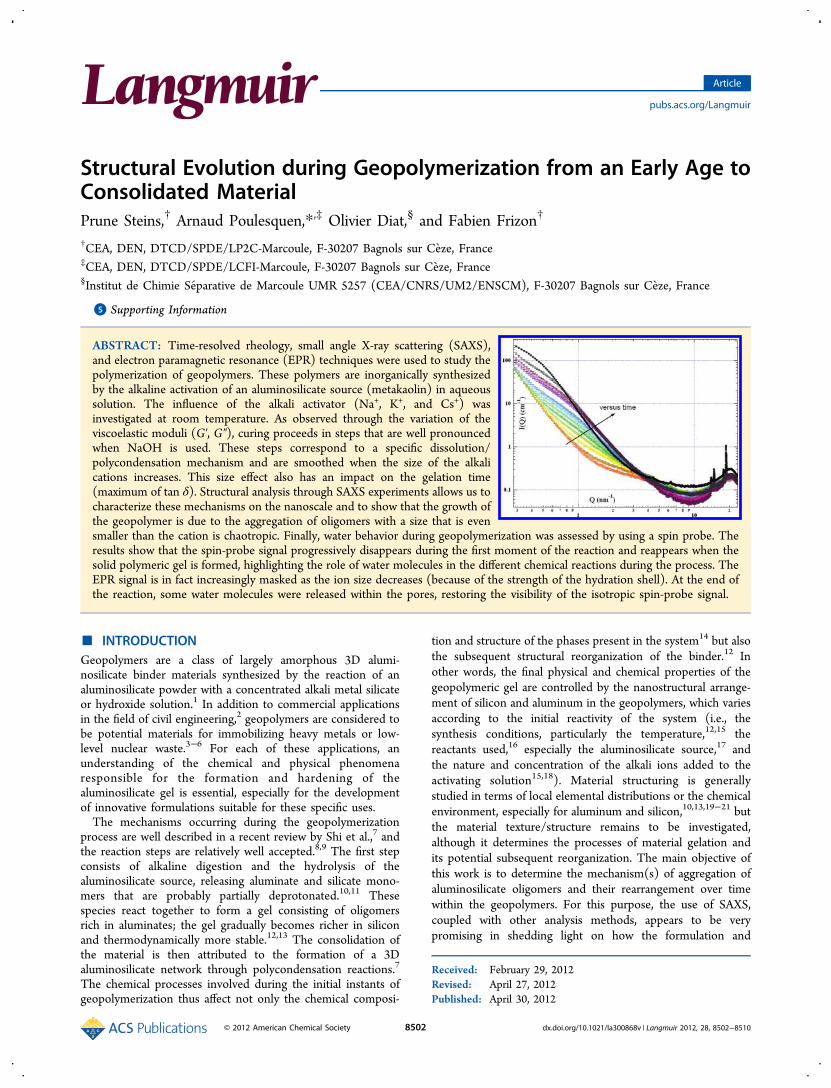
Figure 1. Evolution of the viscoelastic parameters (G′ and G″) as a function of time at room temperature for (a) sodium geopolymer, (b) potassiumgeopolymer, and (c) cesium geopolymer. (d) Variation of tan δ for the three geopolymers.
spectrometer at room temperature. Because most of the geopolymerconstituents are not paramagnetic except for traces of iron or titaniumin the metakaolin, a stable paramagnetic probe was introduced into theactivating solution immediately before adding the metakaolin. Thisparamagnetic probe, 2,2,6,6-tetramethyl-1-piperidinyloxy, often knownas TEMPO (98%, Aldrich), is a nitroxide radical in the liquid phase.The interaction of the free electron with the nitrogen nucleus yields atriplet with a nuclear spin of 1.27 The TEMPO probe is not only stablein solution but also sensitive to the micropolarity and microviscosity ofthe medium.28 The mixture of activating solution, TEMPO (20 mM),and metakaolin was then transferred to a capillary that was 0.85 mm indiameter. The geopolymerization parameters were microwave power,0.7 mW; microwave frequency, 9.8 GHz; mod. frequency, 100 kHz;mod. amplitude, 5.00 G; and gain, 30 dB. Amplitude modulation (1 G)was also applied to cesium at the beginning of the reaction because ofits slower polymerization kinetics and relatively high signal-to-noiseratio. The spectrum of TEMPO in water is given in the SupportingInformation.
■ RESULTS AND DISCUSSIONViscoelastic Parameter Variations over Time. The
influence of the alkali activator during the polymerization onthe viscoelastic parameters (G′, G″, and tan δ) is shown inFigure 1. The heavier the alkali activator, the longer thepolymerization kinetics29 and the greater the interactionsbetween dissolved entities as the difference between G′ andG″ increases (tan δCsOH < tan δKOH < tan δNaOH). Moreover, thestepwise variation observed for G′ and G″ with sodiumgeopolymers (arrows in Figure 1) diminishes for potassiumand completely disappears for cesium. In the previous study,15
these plateaus were attributed to the metakaolin dissolutionmechanisms followed by polycondensation of the dissolvedspecies. Regardless of the alkali activator used, the overallgeopolymerization process is similar but the dissolution−condensation rates and the kinetics are different. By virtue oftheir different charge densities, small ions (Na+) have a muchmore compact hydration sphere than larger alkali ions (K+ andCs+), which more readily bind with the negative charge of thesilicates (partially deprotonated at pH ≫10) and therebystabilize the suspension.30 The disappearance of the steps in theviscoelastic moduli for heavier alkali activators is certainly dueto a combined effect of thermodynamic conditions (T°, pH)and ion speciation (alkali hydration energy). The peak of tan δcorresponds to the gelling time routinely observed forpolymers.31,32
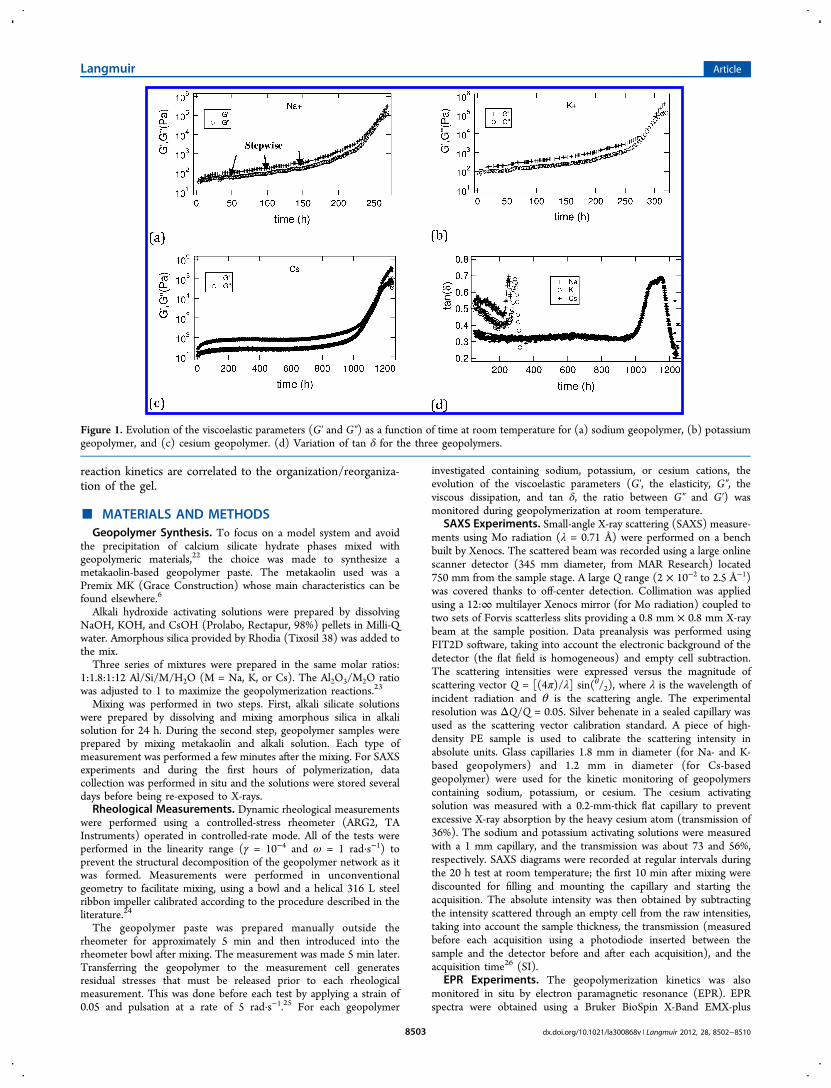
Structural Evolution during Geopolymerization. Acti-vating Solution. Initially, the various activating solutionscontaining silicate species were characterized by SAXS, andthe scattering intensities versus the scattering vector are shownin Figure 2. The spectrum of the solution containing cesium isrelatively noisy because of the small sample volume used toobtain a reasonable transmission. In all three cases, we observedthe water correlation bump at about q = 22 nm−1 (O−Ocorrelation between two water molecules accounts for thelargest volume contribution in X-ray scattering, 2π/q = 2.8Å33). However, for the difference with a pure ionic solution,excess scattering is observed for all of them at q lower than 10nm−1 because of the presence of small scattering entities (SI).Although the scale of observation is beyond the limit ofstandard SAXS analysis, we can still consider in a firstapproximation that these entities have a different scatteringcontrast than the electrolyte solution with a spherical shape.Then this excess scattering intensity can be described by eq 1
φ ρ= ΔI q V P q S q( ) ( ) ( )2(1)
where φ is the volume fraction of solute, V is the volume of thediffusing entities, Δρ is the difference in scattering lengthdensities, P(q) is the form factor describing the size and shapeof the scattering object, and S(q) is the structure factorcharacterizing the interactions between entities. In the case ofNaOH solution, the interactions seem very weak and the excessscattering can be described with only a form factor PS(q)expressed as
=−⎡
⎣⎢⎤⎦⎥Ps q
qR qR qRq R
( ) 3sin cos
2 2
2
(2)
The excess scattering intensity is adjusted with eq 2 (Figure2), and a characteristic radius R of about 0.18 (±0.02) nm isobtained. This scattering entity could be considered to be SiO2monomers with a size consistent with those given by Caremanset al.34 and Bourlon.35 For the activating solution containingheavier alkaline atoms, a correlation bump appears near q = 4.3nm−1 (d ≈ 14.4 Å) and is much more visible for K than for Cssolution because of the presence of a third correlation peak ataround q = 12.2 nm−1. This correlation bump could beattributed to interactions between silicate entities, which arefacilitated in the case of weak interactions between watermolecules and the alkali ion. The smaller the ion, the smallerthe number of water molecules in the hydration sphere,36 whichis thus more tightly bound and compact.37 Consequently, thehydrated ionic radius diminishes depending on the nature ofthe ion (Li > Na > K > Rb > Cs), resulting in strongerinteractions between dissolved entities when the ion is large.38
Even if the concept of a form factor with such small moleculesis questionable, we can compare the characteristic length withthe distribution length of the Si−O or Al−O tetrahedronscentered on 0.166 nm.39 In the case of cesium, it is morecomplicated to determine the object size because a thirdscattering bump appears near q = 14.5 nm−1 (d = 4.3 Å) andmasks the decrease of the form factor. According to theliterature, the correlation distance determined from the positionof this bump is near the characteristic Cs−Cs or Cs−Odistances obtained for solid cesium geopolymers after heattreatment.39 Another feature of these scattering curves is theintensity upturn at low q values. This could be due to the partialaggregation of silicate entities that is increasingly prominent forheavy alkali ions. However, these signals are relatively weak andclose to the beamstop, so this hypothesis must be consideredwith circumspection. Just for information, the small peak(shown by the arrow) observed at about 4 nm−1 is a remnant of
Figure 2. X-ray scattering intensity for the three activating solutions(Na_geopolymer, K_geopolymer, and Cs_geopolymer) at roomtemperature.
subtracting the contribution of the Kapton windows in the
beam path because the acquisition statistics were not optimized.Geopolymerization. When metakaolin is added to the
activating solution, the geopolymerization reaction begins
quickly. The kinetics over time was followed by SAXS for the
three alkali ions (Figures 3−5). The three figures can bedivided into three zones for analysis:
− For small scattering angles and for wave vectors of q < 2nm−1, we observed in the earlier stage a strong scatteringthat varies as q−4. As a function of time, first a decrease inthis scattering intensity with the same q dependence isvisualized and then new excess scattering is super-imposed on the initial profile and is characterized by aweaker slope. Finally, for very long time that depends onthe system, a q−4 scattering curve is slightly recoveredwith a higher intensity level.
− In the intermediate spectrum region (2 < q < 10 nm−1)where the intensities are comparable to those of theactivating solutions, the same excess scattering aspresented when the activating solutions are studied. Itvaries in intensity as a function of time. However, thereare too many scattering contributions to exploit thescattering intensity variation in this q range accurately.
− Finally, for q > 10 nm−1, the intensity reflects fluctuationsin the local electron densities of water molecules40 andionic species in solution as well as those of the structurewith metakaolin crystalline phases.
To clarify the phenomena observed, the results obtained forpotassium geopolymers (Figure 3) are described in detailbelow, and the other types of geopolymers are then brieflydiscussed. At the beginning of geopolymerization withpotassium geopolymers, the small-angle scattering intensitydecreases with q−4, a characteristic signature of the presence ofsharp interfaces between two media of very different electrondensities. It corresponds to the interfaces between metakaolinparticles surrounded by the activating solution. This result wasverified by SAXS on a dispersion of metakaolin in Milli-Q waterto prevent the dissolution of the aluminosilicate source; asimilar decrease in the scattering intensity was observed (SI).At higher q values, the signal was similar to that observed forthe activating solution (Figure 2). Then during the first fewhours, the metakaolin dissolves, which is in agreement with aslight decrease in the overall q−4 signal at low q valuesaccompanied by a simultaneous increase in the scattering signalin the intermediate q range that can be associated first with theformation of new monomers and then with the formation ofsecondary structural and nanometric units. Finally, over a longtime, new aggregation is observed as shown by a scatteringintensity decrease of nearly q−4 that reveals a new interface afterseveral days. The intermediate signal due to the monomers hasdisappeared or become very small. This suggests that theconversion of monomers in oligomers is nearly complete.Similar observations and analyses can be applied to the other
two geopolymers synthesized from NaOH and CsOH, but thereaction kinetics and the relative arrangements of the oligomersare different and will be discussed below.It is clear that several effects occur simultaneously during
geopolymerization: the dissolution of metakaolin resulting inthe appearance of monomers or very small oligomers (theprimary units) in solution and the reaction of these entities withthose from the activating solution, leading to the secondarynanometric units and the gradual formation of the geopolymernetwork. To deconvolute these three main mechanisms
Figure 3. Time-resolved X-ray scattering intensity during geo-polymerization for K_geopolymer at room temperature.
Figure 4. Time-resolved X-ray scattering intensity during geo-polymerization for Na_geopolymer at room temperature.
Figure 5. Time-resolved X-ray scattering intensity during geo-polymerization for Cs_geopolymer at room temperature. (The peakat about 4 nm−1 is like that for Figure 2 showing the remnant peakfrom the Kapton window scattering after the subtraction of thebackground due to weak statistics.)
partially, the scattering intensity corresponding to thedissolution of metakaolin was subtracted from the overallintensity measured over time. This implies a decorrelationbetween metakaolin scattering, corresponding to very largescattering entities, and the secondary units formed by therecondensation of dissolution products that form over time, aswe will show below.First, the intensity at q = 0.26 nm−1 was plotted versus time
(Figure 6). On the basis of this graph, as a rough
approximation, we can assign a constant dissolution rate tometakaolin depending on the alkali activator (eqs 3 and 4):
= − +I q( ) 0.063time (min) 96.9dissoK (3)
= − +I q( ) 0.17time (min) 91.4dissoNa (4)
These rates are determined by the drop in intensity of theinitial scattering points with q−4 observed during the first fewminutes of the process. We associate this decreasing intensitywith a homogeneous loss of dissolved metakaolin and acorresponding decrease in the volume fraction. From theseequations, the intensity resulting from the aggregation ofdissolved species in solution is given by eq 5
= −I I fAqagg diss MK 4remaining (5)
where A/q4 represents the Porod law corresponding to thepresence of an interface between metakaolin and solution (A =0.45 cm−5 for the Na or K geopolymer), with
== −fI
q( 0.26 nm )Aq
MKdisso
1remaining
Na or K
4 (6)
It is also interesting to observe in this figure that after a fewminutes the intensity increases again, indicating a change inconcentration, size, or interactions between scattering entities.For the cesium geopolymer, the intensity at q = 0.26 nm−1 isrelatively constant because of the slow kinetics of dissolution ofmetakaolin. Consequently, fMKremaining
is equal to 1 and A is equalto 0.09 cm−5. Figures 7−9 show the SAXS signal corrected forthis signal component, which is assumed to come only frommetakaolin particles. We can therefore assume that thesecorrected spectra correspond only to the formation and
structuring of new building blocks in a process that evolvesover time. Consequently, this analysis allows us to study thecharacteristics of these secondary structural and nanometricunits and the kinetics of their formation or aggregation to formthe 3D geopolymer network. From these curves, using theGuinier approximation (qRg ≤ 1), we can determine acharacteristic size or radius of gyration (Rg) for these newoligomers developed in solution after the dissolution of themetakaolin particles and according to the following relation (eq7):41
= −P qq R
( ) 13
2g
2
(7)
The values of Rg for the different activating solution are givenin Table 1. In observing Figures 7−9, it appears that this
characteristic size does not change during the first step of thereaction for a given sample material and that only a fraction ofthese entities increase. Then, in a second step, the upturn in thesmall-angle intensity can be analyzed as a sign of aggregation ofthese nanoaggregates; the local interface varies slightly becausethe intensity observed between 2 and 4 nm−1 is very similar forall of the spectra after 3 to 4 h in the case of potassium. Whendifferent alkali activators are used to initiate the reaction, themean size of the oligomers or nanoaggregates diminishes: Rgdecreases in the order Cs+ < K+ < Na+. These results againreflect the magnitude of the effect of the size of the hydratedradius or the bond strength between the water of hydration andthe more or less chaotropic ion42 on the local organization ofsecondary structural units. In other words, the lower the energyof hydration of the alkali cation, the more likely it is to beassociated with negatively charged monomeric or smalloligomeric units,43−45 thereby limiting the polycondensationof larger structural units. Considering the characteristicdimensions of the silica entities (the monomers) determined
Figure 6. Evolution of the scattering intensity at q = 0.26 nm−1 inorder to estimate the dissolution rate of metakaolin as a function of theactivating solution.
Figure 7. Corrected scattering intensity as a function of time andassessment of the radius of gyration by a Guinier model used tocharacterize the aggregation of monomers for K_geopolymer.
Table 1. Assessment of the Radius of Gyration of Oligomersas a Function of Geopolymer Samples
from SAXS measurements in activating solutions (0.18 nm)and assuming that the aluminate and silicate tetrahedra arisingfrom the dissolution of metakaolin are of comparabledimensions, we could estimate the aggregation numbers forthese secondary structural units to be about 5 to 6, 9 to 10, and11 to 12 monomeric repetitions for the samples containingcesium, potassium, and sodium, respectively (by dividing thecorresponding Rg values by 0.18 nm). According to theliterature, these units appear to have a cyclic structure.46
However, the estimation of this degree of polymerization foroligomers does not take into account the hydration numberthat can be significant for Na but much less so for Cs becausethe relative density or compactness of the oligomers isunknown.These secondary structural units (the oligomers) combine to
form a geopolymer up to the point of percolating and gellingthe system (tNaOH < tKOH < tCsOH). As the dissolution ofmetakaolin continues, the geopolymer gradually stiffens assuccessive building blocks are added, until a porous solidnetwork forms with an interface defined by the nanoaggregates.(The intensity varies with q−4 in this intermediate wave vectorrange after 3 months.) Comparing the three systems, we canestimate the beginning of aggregation after more than 4 h for K,between 3.5 and 4 h for Na, and after a much longer time forcesium, for which several days of experiments were necessary torecord the spectra. For all of the geopolymers these time valuesare fully consistent with those obtained by rheology (Figure1d) and correspond to a gel time (i.e., the appearance of apercolating 3D geopolymer network).In Situ Monitoring of Water Behavior. According to the
literature, water follows two opposite dynamics duringgeopolymerization reactions: it is partially consumed duringthe hydrolysis/dissolution of the aluminosilicate source but is atleast partially regenerated during the polycondensationreactions and is then enclosed in the porosity of thegeopolymer.7,8,47 The water behavior during geopolymerizationwas followed by electron paramagnetic resonance (Figure 10).The addition of a stable paramagnetic probe such as TEMPO(Mw = 156.1 g·mol−1, Vp = 170.1 Å3 48) makes it possible toprobe its local environment. The main parameters obtained arethe mean rotational correlation time (s) and the hyperfinecoupling constant (Aiso) of the paramagnetic probe dissolved inthe medium. These parameters provide information on the
microviscosity and micropolarity of the environment.49 Figure10 shows the evolution of the probe versus time for the threealkali ions in this study. At the beginning of the geo-polymerization process, the spectra are asymmetric with amore pronounced effect on the sodium geopolymer. Thisasymmetry reflects the high viscosity of the medium, whichrestricts the movement of the probe and is related to the highsalt content of the activating solution and to a relatively highmetakaolin volume fraction; this is augmented by the effect ofmicroviscosity, which is more pronounced for kosmotropicalkali cations having a high energy of hydration (Na) than forchaotropic cations with a low energy of hydration (Cs). After 5h of geopolymerization, there was no significant change in theEPR spectrum for the K geopolymer and Cs geopolymer otherthan a decrease in intensity. For the Na geopolymer, however,the probe signal disappears almost totally. Two hypotheses canbe postulated: either the probe was destroyed by the high pHvalues (but in this case the probe signal should also disappearfor the K and Cs geopolymers) or the signal was masked. Oneexplanation could be the fact that Na+ ions are incapable ofseparating from their hydration sphere because of the very highhydration energy; consequently, the polarization force of thecation−oxygen bond electron density can even lead to thedeprotonation of water molecules by ion pair production.30
The proposed mechanism is the following:
The lower the hydration energy (i.e., the heavier the ion), themilder the effect, and the signal for the Cs geopolymer ispractically identical to the signal after 10 min. Fifteen days afterproduction, an isotropic signal characteristic of the EPRspectrum of TEMPO in water was obtained for the K andNa geopolymers. The proton that had masked the probe signalwas salted out and reacted with a hydroxide ion to form waterduring the polycondensation process. In addition, the value ofthe hyperfine coupling constant (Aiso = 17 g) corresponds to apolar pore solution (mostly water50). The symmetry of thesignal suggests that the salt load in the final pore solution is
Figure 8. Corrected scattering intensity as a function of time andassessment of the radius of gyration by a Guinier model used tocharacterize the aggregation of monomers for Na_geopolymer.
Figure 9. Corrected scattering intensity as a function of time andassessment of the radius of gyration by a Guinier model used tocharacterize the aggregation of monomers for Cs_geopolymer.
considerably lower than in the activating solution and that theTEMPO probe can move freely in this solution. On one hand,the pore network detected here does not appear to bemicroconfined on the scale of the molecule probe. On the otherhand, for the Cs geopolymer, 15 days after the beginning ofgeopolymerization, the probe signal exhibits broader peaks,indicating a confinement of the paramagnetic probe. The probeconcentration in fine pores favors spin/spin interactionsbetween adjacent probes through dipolar coupling. It decreasesthe T2 relaxation time and results in a broadening of thepeaks.51 In addition, the slower geopolymerization kinetics inthe case of cesium could also imply that the reorganization andpolycondensation processes continue beyond 15 days and thatthe measured signal does not yet correspond to a fully reactedgeopolymer. Regardless of the alkali activator, the paramagneticprobe is gradually masked during geopolymerization because ofthe protonation of the nitroxide radical and reappears duringpolycondensation reactions. This effect is particularly pro-nounced when the geopolymer is activated with a kosmotropicalkali. Moreover, the characteristic dimensions of the poresformed during geopolymerization reactions also appear todepend on the alkali activator: the porosity generated withcesium seems finer than that obtained with sodium orpotassium. This trend has already been observed by Krivenand Bell52,53 in a mixed alkali geopolymer (Na and K), wherethey found that the mean pore size decreases as sodium isprogressively replaced by potassium.
■ CONCLUSIONS
SAXS, rheology, and EPR were used experimentally to providefundamental new information on the phenomenology ofaggregation of aluminosilicate oligomers and on their rearrange-
ment over time within the geopolymeric matrix. The use ofseveral alkali ions (Na, K, and Cs) differing by their size and bytheir kosmotropic or chaotropic properties allowed us todemonstrate that the dissolution of metakaolin and theappearance of a rigid percolating network (maximum tan δ)occur more rapidly with a small alkali activator. Moreover, theresulting oligomers are more numerous with strong interactions(tan δCsOH < tan δKOH < tan δNaOH) when the alkali activator islarge. This result is mainly due to the differences in theelectronic charge density between ions and thus the ability ofthe ion to impede the development of large oligomers. TheSAXS experiments show that the oligomers differ in sizeaccording to the chaotropic cation used as an alkali activator:cesium, potassium, and sodium. The resulting oligomers ornanoaggregates interact to form the geopolymer network overtime. At the end of geopolymerization (96 days), the intensityvariation as a function of q−4 indicates a sharp interface betweentwo media; the interface is defined locally by nanoaggregatesseparating the solid from the pore solution. The reactiondynamics of water during geopolymerization was characterizedby EPR with the use of paramagnetic probes. Before theappearance of the percolating network, water is consumedduring the hydrolysis/dissolution of metakaolin and thenregenerated by polycondensation reactions in the porosity ofthe solid geopolymer. In each case, the energy of hydration andthe organization of the alkali hydration sphere appear to play amajor role in the local organization, gelling, and consolidationof the geopolymeric matrix.
Figure 10. Evolution of the TEMPO spin-probe spectra as a function of time for the three activating solution at room temperature (EPR experimenton the X band).
■ ASSOCIATED CONTENT*S Supporting InformationSAXS experiment treatment. EPR spectra of the TEMPO spinprobe in water. SAXS experiments for the activating solutionand for metakaolin in water. This material is available free ofcharge via the Internet at http://pubs.acs.org.
NotesThe authors declare no competing financial interest.
■ ACKNOWLEDGMENTSWe thank A. Gerenton, T. Piallat, and B. Corso for assistancewith sample preparation, rheological characterization, andSAXS experiments, respectively.
■ REFERENCES(1) Davidovits, J. Geopolymers: inorganic polymeric new materials. J.Therm. Anal. 1991, 37, 1633−1656.(2) Van Deventer, J. S. J.; Provis, J. L.; Duxson, P.; Brice, D. G.Chemical research and climate change as drivers in the commercialadoption of alkali activated materials.Waste Biomass Valorization 2010,1, 145−155.(3) Palomo, A.; Palacios, M. Alkali-activated cementitious materials:alternative matrices for the immobilization of hazardous wastes: PartII. Stabilisation of chromium and lead. Cem. Concr. Res. 2003, 33,289−295.(4) Xu, J. S.; Zhou, Y. L.; Chang, Q.; Qu, H. Q. Study on the factorsof affecting the immobilization of heavy metals in fly ash-basedgeopolymers. Mater. Lett. 2006, 60, 820−822.(5) Berger, S.; Frizon, F.; Joussot-Dubien, C. Formulation of caesiumbased and caesium containing geopolymers. Adv. Appl. Ceram. 2009,108, 412−417.(6) Desbats Le Chequer, C.; Frizon, F. Impact of sulfate and nitrateincorporation on potassium and sodium-based geopolymers: geo-polymerization and materials properties. J. Mater. Sci. 2011, 46, 5657−5664.(7) Shi, C; Fernandez-Jimenez, A; Palomo, A. New cements for the21st century: the pursuit of an alternative to Portland cement. Cem.Concr. Res. 2011, 41, 750−763.(8) Duxson, P; Fernandez-Jimenez, A; Provis, J. L.; Lukey, G. C.;Palomo, A; Van Deventer, J. J. Geopolymer technology: the currentstate of the art. Mater. Sci. 2007, 42, 2917−2933.(9) Rees, C; Provis, J. L.; Lukey, G. C; Van Deventer, J. Attenuatedtotal reflectance fourier transform infrared analysis of fly ashgeopolymer gel aging. Langmuir 2007, 23, 8170.(10) Hajimohammadi, A.; Provis, J. L.; van Deventer, J. S. J. Theeffect of alumina release rate on the mechanism of geopolymer gelformation. Chem. Mater. 2010, 22, 5199−5208.(11) Buchwald, A.; Zellmann, H.-D.; Kaps, Ch. J. Condensation ofaluminosilicate gels−model system for geopolymer binders. J. Non-Cryst. Solids 2011, 357, 1376−1382.(12) Fernandez-Jimenez, A.; Palomo, A.; Sobrados, I.; Sanz, J. Therole played by the reactive alumina content in the alkaline activation offly ashes. Microporous Mesoporous Mater. 2006, 91, 111−119.(13) Rees, C.; Provis, J. L.; Lukey, G. C.; Van Deventer, J. S. J. In situATR-FTIR study of the early stages of fly ash geopolymer gelformation. Langmuir 2007, 23, 9076.(14) Provis, J. L.; Duxson, P.; Lukey, G. C.; Van Deventer, J. S. J.Statistical thermodynamic model for Si/Al ordering in amorphousaluminosilicates. Chem. Mater. 2005, 17, 2976−2986.(15) Poulesquen, A.; Frizon, F.; Lambertin, D. Rheological behaviorof alkali-activated metakaolin during geopolymerization. J. Non-Cryst.Solids 2011, 357, 3565−3571.
(16) Duxson, P.; Lukey, G. C.; Separovic, F.; van Deventer, J. S. J.The effect of alkali cations on aluminium incorporation in geo-polymeric gels. Ind. Eng. Chem. Res. 2005, 44, 832−839.(17) Fernandez-Jiminez, A.; Palomo, A. Characterization of fly ashes.Potencial reactivity as alkaline cements. Fuel 2003, 82, 2259−2265.(18) Lee, W. K. W.; Van Deventer, J. S. J. Structural reorganisation ofclass F fly ash in alkaline silicate solutions. Colloids Surf., A 2002, 211,49−66.(19) Duxson, P.; Provis, J. L.; Lukey, G. C.; Separovic, F.; VanDeventer, J. S. J. 29Si NMR study of structural ordering inaluminosilicate geopolymer gels. Langmuir 2005, 21, 3028−3036.(20) Yip, C. K.; Lukey, G. C.; van Deventer, J. S. J. The coexistenceof geopolymeric gel and calcium silicate hydrate at the early stage ofalkaline activation. Cem. Concr. Res. 2005, 35, 1688−1697.(21) Yip, C. K.; Lukey, G. C.; van Deventer, J. S. J. The coexistenceof geopolymeric gel and calcium silicate hydrate at the early stage ofalkaline activation. Cem. Concr. Res. 2005, 35, 1688−1697.(22) Yip, C. K.; Lukey, G. C.; van Deventer, J. S. J. The coexistenceof geopolymeric gel and calcium silicate hydrate at the early stage ofalkaline activation. Cem. Concr. Res. 2005, 35, 1688−1697.(23) Barbosa, V. F. F.; MacKenzie, K. J. D.; Thaumaturgo, C.Synthesis and characterisation of materials based on inorganicpolymers of alumina and silica: sodium polysialate polymers. Int. J.Inorg. Mater. 2000, 2, 309−317.(24) Ait-Kadi, A; Marchal, P; Choplin, L; Chrissemant, A. S.;Bousmina, M. Quantitative analysis of mixer-type rheometer usingcoquette analogy. Can. J. Chem. Eng. 2002, 80, 1166−1174.(25) Benard, P.; Garrault, S.; Nonat, A.; Cau-Dit-Coumes, C.Hydratation process and rheological properties of cement pastesmodified by orthophosphate addition. J. Eur. Ceram. Soc. 2005, 25,1877−1883.(26) Bosecke., P; Diat., O Small-angle X-ray scattering at the ESRFhigh-brilliance beamline. J. Appl. Crystallogr. 1997, 30, 867−871.(27) Berlinder, L. J., Ed. Spin Labelling: Theory and Applications; NewYork: Academic Press: New York, 1976.(28) Bhat, S.; Sharma, A.; Bhat, S. V. Vitrification and glass transitionof water, insights from spin probe ESR. Phys. Rev. Lett. 2005, 95,235702-1−235702-4.(29) Provis, J. L.; Van Deventer, J. S. J. Geopolymerisation kinetics. 1.In situ energy dispersive X-ray diffractometry. Chem. Eng. Sci. 2007, 62,2309−2317.(30) Sharp, J. H.; Gartner, E. M.; Macphee, D. E. Novel cementsystems. Adv. Cement Res. 2010, 22, 195−202.(31) Foix, D.; Jimenez-Pique, E.; Ramis X. Serra, A. DGEBAthermosets modified with an amphiphilic star polymer. Study on theeffect of the initiator on the curing process and morphology. Polymer2011, 52, 5009−5017.(32) Nicholas, M. K. D.; Waters, M. G. J.; Holford, K. M.; Aduisi, G.Analysis of rheological properties of bone cement. J. Mater. Sci.: Mater.Med. 2007, 18, 1407−1412.(33) Waluyo., I; Huang., C; Nordlund., D; Bergmann., U; Weiss., T;Perttersson., L.; Nilsson, A. The structure of water in the hydratationshell of cations from X-ray Raman and small angle X-ray scatteringmeasurements. J. Chem. Phys. 2011, 134, 064513.(34) Caremans, T. P.; Loppinet., B; Follens, L. R. A.; Van Erp., T. S.;Vermant., J.; Goderis., B.; Kirschhock, C. E. A.; Martens., J. A.; Aerts.,A. Investigation of nanoparticles occurring in the colloidal silicate-1zeolite crystallization process using dissolution experiments. Chem.Mater. 2010, 22, 3619−3629.(35) Bourlon, A. Physico-Chimie et Rheologie de GeopolymeresFrais pour la Cimentation des Puits Petroliers. Ph.D. Dissertation,ESPCI, 2010(36) Johnson, A.-C.; Greenwood, P.; Caterina, C.; Abbas, Z. J. Phys.Chem. B 2011, 115, 9547−9555.(37) Varma, S; Rempe, S. Coordination numbers of alkali metal ionsin aqueous solution. Biophys. Chem. 2006, 124, 192−199.(38) Johnson, A.-C.; Greenwood, P.; Hagstrom, M.; Abbas, Z.; Wall,S. Aggregation of nanosized colloidal silica in the presence of various
alkali cations investigated by the electrospray technique. Langmuir2008, 24, 12798−12806.(39) Bell, J.; Sarin, P.; Provis, J.; Haggerty, R.; Driemeyer, P.; Chupas,P.; Van Deventer, J.; Kriven, W. Atomic structure of a cesiumaluminosilicate geopolymer: a pair distribution function study. Chem.Mater. 2008, 20, 4768−4776.(40) Huang, C.; Wikfeldt, K. T.; Nordlund, D.; Bergmann, U.;McQueen, T.; Sellberg, J.; Pettersson, L. G. M.; Nilsson, A. Wide-angleX-ray diffraction and molecular dynamics study of medium-rangeorder in ambient and hot water. Phys. Chem. Chem. Phys. 2011, 13,19997−20007.(41) Nallet, F. Collect. SFEN 2010, 11, 17−42.(42) Colic, M.; Franks, G. V.; Fisher, M. L.; Lange, F. F. Effect ofcounterion size on short range repulsive forces at highionic strenghts.Langmuir 1997, 13, 3129−3135.(43) McCormick, A. V.; Bell, A. T.; Radke, C. J. Multinuclear NMRinvestigation of the formation of aluminosilicate anions. J. Phys. Chem.1989, 93, 1741.(44) Xu, H.; Van Deventer, J. S. J. The effect of alkali metals on theformation of geopolymeric gels from alkali-felspars. Colloids Surf., A2003, 216, 27−44.(45) Van Jaarsveld, J. G. S.; Van Deventer, J. S. J. Effect of the alkalimetal activator on the properties of fly ash-based geopolymers. Ind.Eng. Chem. Res. 1999, 38, 3932.(46) Sagoe-Crentsil, L. W. Dissolution processes, hydrolysis andcondensasion reactions during geopolymer synthesis: Part II. High Si/Al ratio system. J. Mater. Sci. 2007, 42, 3007−3014.(47) White, C. E.; Provis, J. L.; Proffen, T.; Van Deventer, J. S. J. Theeffects of temperature on the local structure of metakaolin-basedgeopolymer binder: a neutron pair distribution function investigation.J. Am. Ceram. Soc. 2010, 93, 3486−3492.(48) Svajdlenkova, H.; Bartos, J. Spin probe mobility in relation tofree volume and relaxation dynamics of glass-formers: a series of spinprobes in poly(isobutylene). J. Polym. Sci., Part B: Polym. Phys. 2009,47, 1058−1068.(49) Strehmel, V.; Rexhausen, H.; Strauch, P. Synthesis of a newionic spin probe for investigation of polar and non-polar solvents.Tetrahedron Lett. 2008, 49, 7143−7145.(50) Khulbe, K. C.; Hamad, F.; Feng, C.; Matsuura, T.; Gumi1, T.;Palet, C. ESR spectra of spin probe in PPO membrane. Polymer 2003,44, 695−701.(51) Banerjee, D.; Bhat, S. N.; Bhat, S. V.; Leporini, D. ESR evidencefor 2 coexisting liquid phases in deeply super-cooled water. Proc. Natl.Acad. Sci. U.S.A. 2009, 106, 11448−11453.(52) Kriven, W. M.; Bell, J. L. Effect of alkali choice on geopolymerproperties. Ceram. Eng. Sci. Proc. 2004, 25, 99−104.(53) Kriven, W. M.; Bell, J. L.; Gordon, M. Microstructure andnanoporosity of as-set geopolymers. Ceram. Eng. Sci. Proc. 2006, 27,313−324.