Page 1
Available online at www.worldnewsnaturalsciences.com
( Received 20 January 2019; Accepted 06 February 2019; Date of Publication 07 February 2019)
WNOFNS 23 (2019) 128-141 EISSN 2543-5426
Structure of Plankton Communities in Cijulang River Pangandaran District, West Java Province,
Indonesia
Asep Sahidin1,2,*, Isni Nurruhwati2, Indah Riyantini3, Muhamad Triandi2
1Department of Fisheries, Faculty of Fisheries and Marine Sciences, Universitas Padjadjaran, Jatinangor, Indonesia
2Laboratory of Aquatic Resources, Faculty of Fisheries and Marine Sciences, Universitas Padjadjaran, Jatinangor, Indonesia
3Department of Marine Science, Faculty of Fisheries and Marine Sciences, Universitas Padjadjaran, Jatinangor, Indonesia
*E-mail address: [email protected]
ABSTRACT
River is a water ecosystem that plays an important role in the hydrological cycle and functions as
a catchment area for the surrounding area. One of the organisms inhabiting river waters is plankton. The
purpose of this study was to determine and analyze the structure of the plankton community in the waters
of the Cijulang River and study the relationship between plankton abundance and with some physical-
chemical parameters of the water. The study was conducted in January, February, and March 2018 on
the Cijulang River, on 5 (five) stations with a purposive sampling method. The results showed that 17
genera were found from 7 phytoplankton classes consisting of 6 Bacillariophyceae genera, 1
Clorophyceae genera, 2 Cyanophyceae genera, 3 Zygnematophyceae genera, 2 Desmidiaceae genera, 1
Synurophyceae genera, and 2 Fragillariophyceae genera. Also found were 10 genera from 5 classes of
zooplankton consisting of 4 genera Maxillopoda, 2 genera Branchiopoda, 1 genera Gastropoda on
veliger fase, 1 genera Ostracoda, and 2 genera Copepoda. The abundance of fitoplankton obtained
ranges from 11-57 cells / L and zooplankton ranges from 8 – 40 ind/L. diversity index (H ') = 1.397 -
2.275 and dominance index (D) = 0.022 - 0.294. Physical-chemical parameters of the waters respectively
were 22 °C - 31 °C, light intensity 47.5 cm - 254 cm, salinity 0 ppt - 20 ppt, and dissolved oxygen 6.2
mg / L - 13.4 mg / L. Ammonia concentration 0.03 - 0.08 mg / L. All stations have a phosphate value of
less than 0.16 mg / L and a silicate concentration of 0.01 - 0.0581 mg / L.
Keywords: cijulang, plankton, community structure, Cijulang River
Page 2
World News of Natural Sciences 23 (2019) 128-141
-129-
1. INTRODUCTION
River is a water ecosystem that plays an important role in the hydrological cycle and
functions as a catchment area for the surrounding area. As an ecosystem, river waters are
composed of various biotic and abiotic components that interact and influence each other.
Components in the river ecosystem will interact with each other to form an energy flow that
will create the stability of the ecosystem. One of the biotic components found in the river is
plankton. Plankton can be divided into two, namely phytoplankton and zooplankton.
Phytoplankton has a very important role in the river ecosystem, because by its nature autotrophs
are able to convert inorganic matter into organic matter and produce oxygen which is absolutely
necessary for the lives of higher-level creatures. While zooplankton can utilize phytoplankton
as its food source and then it will be utilized by consumers with a higher level.
Rivers are strongly influenced by weather factors, river flow characteristics and the
lifestyle of people who live around the banks of rivers. This condition causes the quality and
quantity of rivers to be strongly influenced by climate change and the activities of surrounding
communities. These factors cause interrelationships between one and the other. If the
interaction of some components is disrupted, changes in conditions will occur which will cause
the ecosystem to become unbalanced. Characteristics of the Cijulang River have several
different salinity in each region due to the influence of tides. The greater the tidal height and
the smaller the river discharge, the further the salt water intrusion. Otherwise the smaller the
tidal height and the greater the river discharge, the shorter the distance of saltwater intrusion.
Cijulang River plays a major role in the lives of the surrounding community, but because
of the many activities around the watershed resulting in Cijulang River can experience changes
in the plankton community structure. The existence of plankton and its community structure in
the waters of the Cijulang River also has no research data yet.
Community structure is a concept that studies species composition or composition and its
abundance in a community. In general there are three approaches that can be used to describe
community structures, namely species diversity, species interactions and functional
interactions. Plankton community structure can change with the influence of water quality.
Water quality includes two variables, namely, physical variables (current, water temperature,
and light transparency) and chemistry (DO, pH, ammonia, and phosphate) that can affect
plankton abundance, diversity, and dominance. Based on the above, the abundance, diversity,
and composition of plankton in the Cijulang, the community structure that will be a natural
indicator of the waters on the Cijulang River.
The results of this research are expected to provide an overview of the condition of the
quality of the waters of the Cijulang River through a description of the biological quality of the
waters and as a basis for decision making in the context of river and coastal management and
conservation as well as conservation-based ecotourism.
2. MATERIALS AND METHODS
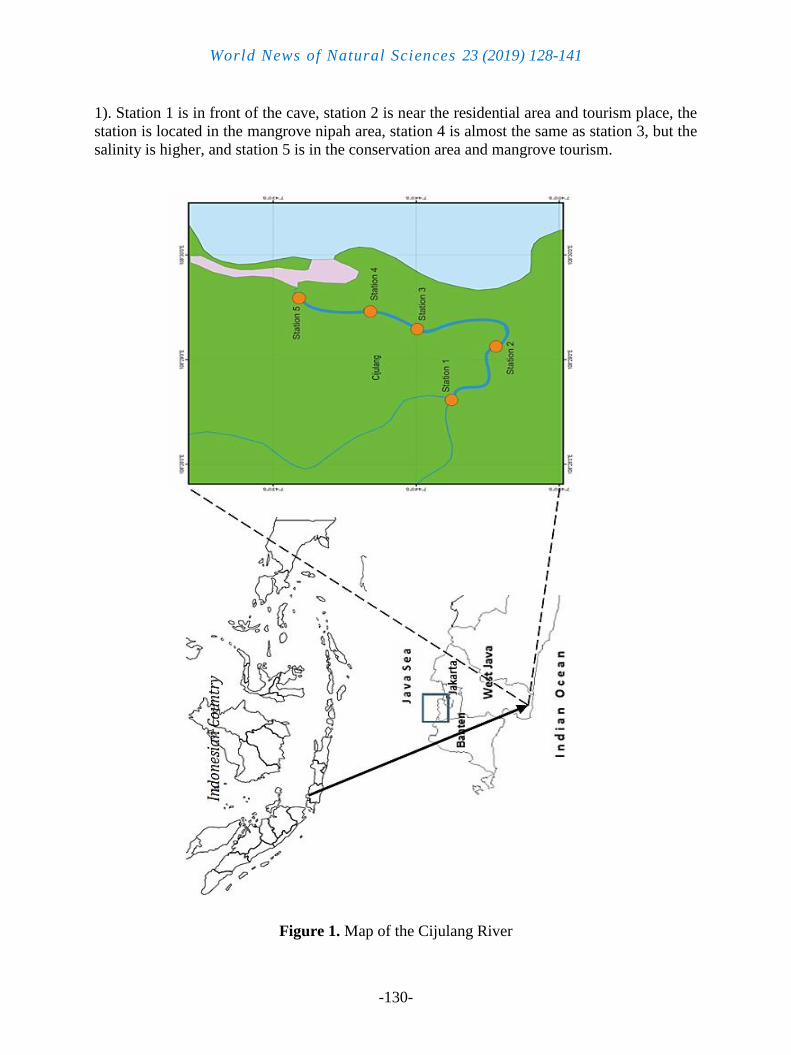
This research was carried out on the Cijulang River, Kertayasa Village, Cijulang District,
Pangandaran Regency, West Java with coordinates 07° 44' 13” 108° 29' 53”. Sampling is done
in January-March 2018. Determination of stations by purposive sampling as many as 5 stations.
Distribution of locations is distinguished based on land use and the hydrological cycle (Figure
Page 3
World News of Natural Sciences 23 (2019) 128-141
-130-
1). Station 1 is in front of the cave, station 2 is near the residential area and tourism place, the
station is located in the mangrove nipah area, station 4 is almost the same as station 3, but the
salinity is higher, and station 5 is in the conservation area and mangrove tourism.
Figure 1. Map of the Cijulang River
Page 4
World News of Natural Sciences 23 (2019) 128-141
-131-
Plankton was identified to the genus level by looking at the morphology of the body with
the help of the book Planktonology and the book The Marine and Fresh-Water.
Water samples taken one bottle at each station are on the surface with a total of 50 ml,
before being put into a sampling bottle, filtering is done using plankton net with a size of 60
µm mesh with a volume of 20 liters. In a 50 ml sampling bottle, 5 drops of lugol were given to
preserve the plankton in it. Furthermore, the bottle sample is inserted into the ice box and taken
to the laboratory for analysis.
Plankton Abundance
N = n 𝑥 (𝑉𝑟
𝑉𝑜) × (
1
𝑉𝑠)
Explanation:
N : plankton abundance (individual / L)
n : identified plankton
Vr : concentrated volume of water
Vo : volume of water examined
Vs : volume of filtered water
Plankton Diversity Index
𝐻′ = − ∑ 𝑃𝑖 ln 𝑃𝑖
Explanation:
H’ : Shannon-Wiener diversity index
Pi : ni/N
ni : abundance of species in rank-i
N : total abundance
The Shannon-Wiener diversity index criteria are divided into 3, namely:
H’ < 1 : Low diversity
1 < H’< 3 : Medium diversity
H’ > 3 : High diversity
Dominance
𝐷 = ∑[𝑛𝑖
𝑁]2
Explanation:
D = Dominance index
ni = Number of individual species-i
N = Total number of individuals
Page 5
World News of Natural Sciences 23 (2019) 128-141
-132-
3. RESULT AND DISCUSSION
3. 1. Physical and Chemical Data of the Cijulang River
The water temperature at Station 3 is higher, presumably because data retrieval is carried
out during the day around 12 while Station 1 is done in the morning around 8 o'clock. The
temperature pattern of river ecosystems is influenced by various factors such as: the intensity
of sunlight, heat exchange between water and the surrounding air, geographical height, and also
the canopy factor (vegetation closure) of trees growing on the edge of the water. Temperatures
in the waters affect molecular movements, fluid dynamics, saturation levels of gas solubility,
and organism metabolism.
Table 1. Water quality at study site.
Parameters Station 1 Station 2 Station 3 Station 4 Station 5
Temperature (°C) 25,8 ±7
(22-28)
27,3 ±7
(24-30)
28,3 ±6
(26-31)
28,3 ±5,5
(26 – 30,5)
28,5 ±5,5
(26-30,5)
Brightness (cm) 101,2 ±84,5
(47,5-132)
118,7 ±91
(59-150)
205,7 ±133
(121-254)
179,5 ±102,5
(117,5-220)
141 ±49
(101-150)
pH 7,1 ±0,4
(6,9-7,2)
7,1 ±0,3
(7-7,2)
7,1 ±0,2
(7-7,1)
7,0 ±0,2
(7-7,1)
7,0 ±0,3
(6,9-7,1)
Salinity (ppt) 0 1,3 ±2
(0-2)
5,3 ±4
(4,0-7)
7 ±6
(5,0-10)
15,3 ±10
(11-20,0)
DO (ppm) 11,5 ±5,7
(7,7-13,4)
9,3 ±5
(6,2-11,2)
9,5 ±4,1
(7-11,1)
9,7 ±4,7
(6,6-11,3)
10,7 ±6,9
(6,5-13,4)
Ammonia (ppm) 0,036 ±0,02
(≤0,03-0,04)
0,052 ±0,047
(≤0,03-0,08)
0,059 ±0,036
(≤0,03-0,07)
0,046 ±0,029
(≤0,03-0,06)
0,056 ±0,019
(0,05-0,07)
Phosphate (ppm) ≤0,16 ≤0,16 ≤0,16 ≤0,16 ≤0,16
Silicate (ppm) 0,05 0,04 0,02 <0,01 <0,01
The lowest brightness in the Cijulang River is 47.5 cm at Station 1 to the highest 254 cm
at Station 3. The highest brightness is found at Station 3, this is because the area at Station 3 is
very open and there is no canopy that blocks the entry of sunlight to the station. Unlike Station
1, there are many trees around it and the width of the water is smaller than Station 3. Data
retrieval time also affects brightness, Station 3 has the highest brightness value because data
collection is done during the day while at Station 1 is done in the morning.
The pH range in the Cijulang River is between 6.9 to 7.2 (Table 1). The pH value shows
almost the same tendency at each station. Based on the measurement results it can be concluded
that the pH range value of the Cijulang River is in the ideal range for plankton growth. The pH
condition is still quite in accordance with the life of plankton on the Cijulang River.
Page 6
World News of Natural Sciences 23 (2019) 128-141
-133-
The ability of water to bind or release a number of hydrogen ions will indicate whether
the solution is acidic or basic. In clean water, the total concentration of H+ and OH¯ ions is in
balance or known as pH = 7.
Aquatic organisms, especially plankton, can live ideally in a smaller pH range or slightly
larger than a pH value of 7. Thus the waters of the Cijulang River have the ability to bind and
release hydrogen ions quite well. Salinity on the Cijulang River is at the value of 0 ppt at Station
1 up to 20 ppt at Station 5.
The difference in the surface salinity of the Cijulang River at each station was due to the
tides that came from Batu Karas Beach. Salinity value can also be affected by rainfall, if rainfall
is high then the salinity in these waters will be relatively lower compared to the condition of
not rain. This is because at Station 5 is the area closest to the river mouth which causes the
salinity at Station 5 to be higher than the other stations.
The range of dissolved oxygen values in the Cijulang River is at 6.2 ppm at Station 2 to
13.4 ppm at Station 1 and Station 5. The highest dissolved oxygen at Station 1 can be caused
because Station 1 has a fairly heavy current. Heavy currents cause wider water levels and more
chance of oxygen diffusion from the air. The highest dissolved oxygen is also found at Station
5, this is suspected because at Station 5 photosynthesis was carried out by phytoplankton and
plants in the waters around the Cijulang River were like mangrove trees.
Ammonia, the ammonia value obtained is relatively small, in fact there are some values
that are below the detection limit of the measuring device. The highest ammonia value is at
Station 2 with a value of 0.08 ppm and the lowest is almost at each station with different time
taking with a value of less than 0.03 ppm. Ammonia has a different value at each station caused
by the process of autolysis or excretion of living things that are on the Cijulang River. Values
of 0.03 to 0.08 are still a low value for ammonia. Ammonia can come from the decomposition
of organic matter through ammonification and the process of cell autolysis and excretion of
ammonia by zooplankton can act as a decomposer.
According to ammonia levels in natural waters are usually less than 0.1 mg NH3 / liter.
According to this data, the Cijulang River is still in a good range based on its ammonium
content.
Phosphate, the phosphate data obtained during the study is <0.16 at each station. It can
be said that the value is not optimum enough for plankton growth. The statement that the low
phosphate content in waters can be caused by physical and biological factors such as currents,
winds, and phytoplankton abundance.
With a low phosphate value, it can be said that many phytoplankton use phosphate as a
source of nutrients for consumption needed for their lives. In addition this is caused by the
properties of phosphate particles which have a particle weight more than the mass of water so
that phosphates will tend to settle in the bottom of the water.
Silicate, Based on the data obtained the highest silicate value is at Station 1 with a value
of 0.06 ppm and the lowest at Station 4 and 5 with a value of less than 0.01 ppm. The silicate
value obtained decreases from Station 1 to Station 5. Bacillariophyceae class phytoplankton is
one of the biological parameters closely related to silicates because of the high and low
abundance of Bacillariophyceae in a waters depending on the silicate content.
Phytoplankton which are mostly found in the Cijulang River, especially at Station 3 and
5 are from the Bachillariophyceae class. Whereas at Station 4 and 5 there is an abundance of
zooplankton which is greater than the other stations.
Page 7
World News of Natural Sciences 23 (2019) 128-141
-134-
This is thought to be a factor in the small amount of silicates in the Cijulang River.
Bachillariophyceae or Diatoms can grow optimally if they are able to effectively absorb
available silicates. The higher the effectiveness of silicate absorption by diatoms, the lower the
concentration of silicates in a waters. The main source of silicates comes from rock weathering,
so that coastal waters generally get a silicate supply through rivers carrying silicate minerals
from rock weathering.
3. 2. Plankton Community Structure
Plankton enumeration results showed that 17 genera were found from 7 phytoplankton
classes consisting of 6 Bacillariophyceae genera, 1 Clorophyceae genera, 2 Cyanophyceae
genera, 3 Zygnematophyceae genera, 2 Desmidiaceae genera, 1 Synurophyceae genera, and 2
Fragillariophyceae genera (Figure 2). There were also 10 genera from 5 zooplankton classes
consisting of 4 Maxillopoda genera, 2 Branchiopod genera, 1 Gastropoda genera in the veliger
phase, 1 Ostracoda genera, and 2 genera Copepoda (Figure 3).
Figure 2. Composition of phytoplankton classes on the Cijulang River.
Figure 3. Composition of the Zooplankton class on the Cijulang River
Bacillariophyceae35%
Fragilariophyceae
12%Chlorophyceae
6%
Zygnematophyceae
17%
Desmidiaceae12%
Synurophyceae6%
Cyanophyceae12%
Maxillopoda40%
Branchiopoda20%
Ostracoda10%
Copepoda20%
Gastropoda10%
Page 8
World News of Natural Sciences 23 (2019) 128-141
-135-
In Figure 2 it indicates that the Bachillariophyceae class has a wide spread with a
percentage of 35%. Dominance of Bachillariophyceae is also found in the waters of Jakarta Bay
(Yuliana 2012), and in Bojo Waters. This condition is a common thing in fresh or sea waters
that the composition of phytoplankton is dominated by the Bachillariophyceae group.
Based on Figure 3 shows that phylum Arthropoda, especially the Maxillopoda class has
the highest spread of 40% and the lowest in the Mollusca phylum in the veliger phase with one
class, namely Gastropod with a percentage of 10%. The presence of arthropods is very
dependent on environmental factors, namely the abiotic environment and biotic environment.
Abiotic environmental factors can be derived from physical factors such as temperature,
water content, porosity, soil structure. While chemical factors such as salinity, pH, soil organic
matter content, and soil mineral elements. Biotic environmental factors that influence the
presence and density of Arthropod populations.
Environmental factors that are suitable for the growth and development of zooplankton
from phylum Arthropoda causes this phylum to overflow on the Cijulang River, especially the
Maxillopoda class.
Figure 4. Graph of plankton composition at each station
On the graph (Figure 4) shows that the comparison of the composition of phytoplankton
and zooplankton in the Cijulang River has a reciprocal relationship. The more the number of
phytoplankton genus, the fewer the number of genus zooplankton and vice versa. This is
because when the number of phytoplankton is more, it will be used by zooplankton, which in
the next station has more genus numbers. But at Station 4 and 5 there was a decrease in the
number of genera in each plankton.
This is because the waters are not suitable like a heavy current, so there are only a few
plankton that can live and develop properly.
0
2
4
6
8
10
12
1 2 3 4 5
nu
mb
er
of
gen
us
Station
phytoplankton
zooplankton
Page 9
World News of Natural Sciences 23 (2019) 128-141
-136-
3. 3. Plankton abundance on the Cijulang River
The abundance of plankton on the Cijulang River has quite a variety of values at each
station and each month (Figure 5). The abundance of identified plankton has varying values at
each station, the highest abundance value is at Station 2, especially in March 2018. This is
because at Station 2 has the physical and chemical characteristics of water that are optimal for
the life of plankton. Whereas in February it was the lowest abundance compared to January and
March, this is because the weather in February is experiencing a rainy season so that the
physical and chemical characteristics of water are less suitable for the life of plankton.
Figure 5. Graph of plankton abundance on the Cijulang River
Figure 5. Abundance of phytoplankton and zooplankton during the study
71,67
100,00
60,83
37,5026,67
40,83
67,50
45,83
18,33 14,17
73,33
122,50
78,33
32,5021,67
0,00
20,00
40,00
60,00
80,00
100,00
120,00
140,00
1 2 3 4 5
Sel /
L
Stasiun
January
February
March
51
57
48
911
8
40
14
20
10
0
10
20
30
40
50
60
1 2 3 4 5
Sel /
Lit
er
Ind
/ L
ite
r
Station
abundance ofphytoplankton
abundance ofzooplankton
Page 10
World News of Natural Sciences 23 (2019) 128-141
-137-
The high abundance value obtained at Station 2 is also caused by environmental
parameters that affect the life and growth of the plankton. At this station environmental
parameters are said to be in the appropriate range, temperature, pH, and water brightness are
optimal values to support the life of plankton, whereas phosphate nutrient is not an optimum
value and has not become a limiting factor for the life of plankton.
Plankton abundance (Figure 6) is highest at Station 2 with phytoplankton abundance
value of 51 per liter cell and zooplankton abundance of 8 per liter cell. The high abundance of
phytoplankton with zooplankton is directly proportional. This is in accordance that most
zooplankton depend on nutritional sources in the form of organic matter, both in the form of
phytoplankton and organic substances that enter the waters.
3. 4. Diversity index
Figure 7. Plankton diversity is average
Calculation results at each station and time of observation show that the plankton diversity
index value is included in the medium category as the criteria put forward by Masson (1981)
that the value of H ≤ 1 is included in low diversity and the value of 1 ≤ H ≤ 3 is the diversity
and stability of the medium category community. The diversity index value obtained ranged
from 1.40 - 2.28 (Figure 7).
3. 5. Dominance Index
Dominance index (Figure 8) illustrates the presence or absence of species that dominate
other species. The calculation results show that more have values close to 0 (zero) compared to
those near 1 (one), It can be concluded that generally in the waters of the Cijulang River during
the study from January to March there was no dominance of plankton.
1,59
2,27 2,28
1,81
1,74
1,40
2,102,24
2,02
1,801,61
1,98
2,24
1,97
1,67
0,00
0,50
1,00
1,50
2,00
2,50
1 2 3 4 5
Station
january
february
march
Page 11
World News of Natural Sciences 23 (2019) 128-141
-138-
The plankton community structure that has been observed shows that there are no species
that predominantly dominate other species, water-physico-chemical parameters are in the
appropriate range so competition does not occur, all species have equal opportunities to grow
and develop well. This shows that the condition of the community structure is stable,
environmental conditions are quite prime, and there is no ecological pressure on the biota in the
habitat.
Figure 8. Dominance of plankton from January to March
4. CONCLUSION
The types of phytoplankton obtained during the study amounted to 7 classes and were
dominated by the Bachillariophyceae class of 34%, in zooplankton there were 5 classes
dominated by Maxillopoda by 40%. The highest number of phytoplankton found at each station
is the genus Closterium, and the highest number of zooplankton at each station is the Cyclops
genus. The highest plankton abundance value is found at station 2 in March with the value of
122 liters cells and the lowest at station 5 in February with a value of 12 liters cells. The
abundance of phytoplankton ranges from 11 - 57 cells / L and zooplankton ranging from 8 - 40
ind / L. The plankton community has an index of species diversity with moderate diversity
values at each station.
Reference
[1] Ariyadej, C., Tansakul, R., Tansakul, P. and Angsupanich, S. (2004). Phytoplankton
diversity and its relationships tothe physico-chemical environment in the Banglang
Reservoir, Yala Province. J. Sci. Technol. 26(5): 595-607
0,29
0,130,16
0,200,22
0,03 0,040,02
0,15
0,10
0,29
0,230,18
0,17
0,25
0,00
0,05
0,10
0,15
0,20
0,25
0,30
0,35
1 2 3 4 5
ind
ivid
ual
/L
Station
january
february
march
Page 12
World News of Natural Sciences 23 (2019) 128-141
-139-
[2] Bilous O, S. Barinova, P. Klochenko. 2014. The role of phytoplankton in the ecological
assessment of the Southern Bug River middle reaches. Fundamental and Applied
Limnology, 184(4): 277-295
[3] Canfield, T.H. and Jones, J.R. (1996). Zooplankton abundance, biomass and size
distribution in selected mid western water bodies and relation with trophic state. J.
Freshwat. Ecol. 11: 171-181.
[4] Chellapa, N.T. Borba, J.M., Rocha, O. (2008). Phytoplankton community and physical-
chemical characteristics of water in the public reservoir of Cruzeta, RN, Brazil. Braz. J.
Biol. 68: 477-494
[5] Rajagopal, T., Thangamani, A., Sevakodiyone, S.P., Sekar, M., Archunan, G. (2010).
Zooplankton diversity andphysico-chemical conditions in three perennial ponds of
Virudhunagar, Tamil Nadu. J. Environ. Biol. 31: 265-272
[6] Joshi, P., Shrivastava, V.K. (2012). Ecological Study and Biodiverity of Tawa
Reservoir and its surrounding areas of Hoshangabad district (Madhya Pradesh). The
Bioscan - An International Quaterly Journal of Life Sciences, 7(1): 129-133
[7] Khanna, D. R., Bhutiani, R., Gagan Matta., Singh, V., Kumar, D. and Ahraf, J. 2009. A
study of Zooplankton diversity with special reference to their concentration in River
Ganga at Haridwar. Env. Con. J. 10(3): 15-20
[8] Negro, A. I., De Hoyos, C., Vega, J.C., 2000. Phytoplankton structure and dynamics in
Lake Sanabria and Valparaíso reservoir (NW Spain). Hydrobiologia 424: 25-37
[9] Zhang, J. Y., Nim, W. M., Zhu, Y. M. & Pan, Y. D., 2013: Effects of different nitrogen
species on sensitivity and photosynthetic stress of three common freshwater diatoms.
Aquat. Ecol. 47: 25-35.
[10] Jianying Y. Zhang, Wanmin M. Ni, Yinmei M. Zhu, Yangdong D. Pan. Effects of
different nitrogen species on sensitivity and photosynthetic stress of three common
freshwater diatoms. Aquatic Ecology March 2013, Volume 47, Issue 1, pp 25-35
[11] Zhang, Y., Yin, Y., Wang, M. & Liu, X., (2012). Effect of phytoplankton community
composition and cell size on absorption properties in eutrophic shallow lakes: field and
experimental evidence. J. Optics Express 20 (11): 11882-11898
[12] Ziglio, G., Siligardi, M. & Flaim, G. (eds), (2006). Biological monitoring of rivers:
applications and perspectives. John Wiley & Sons Ltd, Chichester, England.
[13] Kumari Uma, Prashant Kumar, Ragini Mishra, Dhruv Kumar Singh. Secondary
Productivity of Zooplanktons in Lotic Water of River Saryu and Ganga at Saran
District, Bihar, India. Worls Scientific News 96 (2018) 237-244
[14] S. Dhanam, A. Sathya, B. Elayaraj. Study of physico-chemical parameters and
phytoplankton diversity of Ousteri lake in Puducherry. Worls Scientific News 54 (2016)
153-164
[15] Tihomir S. Kostadinov, Anna Cabré, Harish Vedantham, Irina Marinov, Astrid Bracher,
Robert J.W. Brewin, Annick Bricaud, Takafumi Hirata, Toru Hirawake, Nick J.
Hardman-Mountford, Colleen Mouwj, ShovonlalRoy, Julia Uitz. Inter-comparison of
phytoplankton functional type phenology metrics derived from ocean color algorithms
Page 13
World News of Natural Sciences 23 (2019) 128-141
-140-
and Earth System Models. Remote Sensing of Environment Volume 190, 1 March 2017,
Pages 162-177
[16] Chao Chai, Tao Jiang, Jingyi Cen, Wei Ge, Songhui Lu. Phytoplankton pigments and
functional community structure in relation to environmental factors in the Pearl River
Estuary. Oceanologia Volume 58, Issue 3, July–September 2016, Pages 201-211
[17] Brooks, J. L., 1950. Speciation in ancient lakes (concluded). The Quarterly Review of
Biology 25: 131–176.
[18] Brooks, J. L. & S. I. Dodson, 1965. Predation, body size and composition of plankton.
Science 150: 28–35.
[19] Bucka, H. & R. Zurek, 1992. Trophic relations between phyto-and zooplankton in a
field experiment in the aspect of the formation and decline of water blooms. Acta
Hydrobiologica 34: 139–155.
[20] Carlotti, F. & H. J. Hirche, 1997. Growth and egg production of female Calanus
finmarchicus: An individual-based physiological model and experimental validation.
Marine Ecology Progress Series 149: 91–104.
[21] Defaye, D., 2007. A new Tropocyclops (Copepoda, Cyclopidae) from Lake Matano,
Indonesia. Zootaxa 54: 17–29.
[22] Dumont, H. J. & H. Segers, 1996. Estimating lacustrine zoo-plankton species richness
and complementarity. Hydrobiologia 341: 125–132.
[23] Dumont, H. J., I. van de Velde & S. Dumont, 1975. The dry weight estimate of biomass
in a selection of Cladocera, Copepoda and Rotifera from the plankton, periphyton, and
benthos of continental waters. Oecologica 19: 75–97.
[24] Hall, D. J., S. T. Threlkeld, C. W. Burns & P. H. Crowley, 1976. Size-efficiency
hypothesis and size structure of zooplankton communities. Annual Review of Ecology
and Systematics 7: 177–208.
[25] Hobaek, A., M. Manca & T. Andersen, 2002. Factors influencing species richness in
lacustrine zooplankton. Acta Oecologica 23: 155–163.
[26] Holtan, H., L. Kamp-Nielsen & A. O. Stuanes, 1988. Phosphorus in soil, water and
sediment: An overview. Hydrobiologia 170: 19–34.
[27] Ogutu-Ohwayo, R. & R. E. Hecky, 1991. Fish introductions to Africa and some of their
implications. Canadian Journal of Fisheries and Aquatic Sciences 48: 8–12.
[28] Pinto-Coelho, R., B. Pinel-Alloul, G. Méthot & K. E. Havens, 2005. Crustacean
zooplankton in lakes and reservoirs of temperate and tropical regions: variation with
tropical status. Canadian Journal of Fisheries and Aquatic Sciences 62: 348–361.
[29] Reynolds, C. S., S. N. Reynolds, I. F. Munawar & M. Munawar, 2000. The regulation
of phytoplankton population dynamics in the world’s largest lakes. Aquatic Ecosystem
Health Management 3: 1–21.
[30] Roy, D., M. F. Docker, G. D. Haffner & D. D. Heath, 2007. Body shape vs. colour
associated initial divergence in the Telmatherina radiation in Lake Matano, Sulawesi,
Indonesia. Journal of Evolutionary Biology 20: 1126–1137.
Page 14
World News of Natural Sciences 23 (2019) 128-141
-141-
[31] Sanderson, B. L. & T. M. Frost, 1996. Regulation of dinoflagellate populations:
Relative importance of grazing, resource limitation, and recruitment from sediments.
Canadian Journal of Fisheries and Aquatic Sciences 53: 1409–1417.
[32] Sun, J. & D. Liu, 2003. Geometric models for calculating cell biovolume and surface
area for phytoplankton. Journal of Plankton Research 25: 1331–1346
[33] Von Rintelen, T. & M. Glaubrecht, 2003. New discoveries in old lakes: Three new
species of Tylomelania Sarasin & Sarasin, 1879 (Gastropoda: Cerithoidea:
Pachychilidae) from the Malili Lake system on Sulawesi, Indonesia. Journal of
Molluscan Studies 69: 3–17.