+ All Categories
Home > Documents > STRUCTURE OF REGENERATED SYNAPTIC CONNECTIONS OF ... · STRUCTURE OF REGENERATED SYNAPTIC...

STRUCTURE OF REGENERATED SYNAPTIC CONNECTIONS OF ... · STRUCTURE OF REGENERATED SYNAPTIC...

Date post: 17-Nov-2019
Category:
Upload: others
View: 16 times
Download: 0 times
Share this document with a friend
95
STRUCTURE OF REGENERATED SYNAPTIC CONNECTIONS OF ALLOTRANSPLANTED PHASIC MOTONEURONS ON A TONlC MUSCLE IN CRAYFISH A thesis submitted in conformity with the requirements for the degree of Master of Science, Graduate Department of Zoology, University of Toronto O Copyright by Rahirn Hirji, 1999
Transcript

STRUCTURE OF REGENERATED SYNAPTIC CONNECTIONS OF ALLOTRANSPLANTED PHASIC MOTONEURONS ON A TONlC

MUSCLE IN CRAYFISH

A thesis submitted in conformity with the requirements for the degree of Master of Science,

Graduate Department of Zoology, University of Toronto

O Copyright by Rahirn Hirji, 1999

National Library l*I , cana- Bibliithèque nationale du Canada

Acquisitions and Acquisitions et Bibliographie Services services bibliographiques

395 Wellington Street 395. me WdCinm OnawaON K1AûN4 OttswaON K I A W canada Canada

The author has granted a non- exclusive licence aiiowing the National Library of Canada to reproduce, loan, distriiute or seii copies of this thesis in microfom, paper or electronic formats.

The author retains ownership of the copyright in this thesis. Neither the thesis nor substantial extracts fiom it may be printed or otherwise reproduced wîthout the author's permission.

L'auteur a accordé une licence non exclusive permettant à la Bibliothèque nationale du Canada de reproduire, prêter, distribuer ou vendre des copies de cette thèse sous la forme de microfiche/film, de reproduction sur papier ou sur format électronique.

L'auteur conserve la propriété du droit d'auteur qui protège cette thèse. Ni la thèse ni des extraits substantiels de celle-ci ne doivent être imprimés ou autrement reproduits sans son autorisation.

STRUCTURE OF REGENERATED SYNAPTIC CONNECTIONS OF ALLOTRANSPLANTED PHASIC MOTONEURONS ON A TONlC MUSCLE IN

CRAYFISH

An abstract submitted in confonnity with the requirements for the degree of Master of Science in Zoology,

Graduate Department of Zoology, University of Toronto

Rahim Hi ji, 1999

ABSTRACT

Crustacean neuromuscular systems are highly defined into phasic and tonic

types exemplified by the deep and superficial flexor muscfes in the abdomen of the

crayfish Procambarus clarkii. The deep phasic muscle is used occasionally and briefly

for escape responses while the superficial tonic muscle is used continuously for routine

movements and maintaining posture. To assess the relative importance of the

motoneuron and the target muscle in detennining the synaptic phenotype of

regenerating neuromuscular connections, we attempted a mismatch experiment in

which the denervated tonic SFM received an allotransplanted phasic flexor newe. A

quantitative study of various structural parameters of these regenerated synapses

using serial section electron microscopy revealed that these synapses, on average,

possessed two dense bars that were often closely spaced. Mitochondria comprised a

relativeIy small (6%) volume of the tenninals- Collectively, these structural features

resemble those of native phasic synapses, thereby corroborating the physiological

evidence for the regeneration of phasic type synapses. Therefore, the motoneurons

and not their target muscle fibers are most influential in specifying the phenotype of

regenerated synapses.

ACKNOWLEDGMENTS

I would like to begin by expressing humble gratitude to my supervisor C.K. Govind,

who comrnand of knowledge, dedication and meticulous nature were integral in guiding

me to do my best. I would also like to thank Joanne Pearce for her patience and

willingness to help me whenever I was in need. Our mutual interest in stock markets

has helped fonn a bond that I hope will hold strong over time. 1 woold also like to thank

Asheer Sharman for his friendship, understanding and support in many aspects of my

life. Honourable mentions go out to Naz, Matt and Raymond. I would like to express

my deep gratitude to my family (Azim, Yasrnin, and Adil) for their ongoing motivational

support and for understanding my idiosyncrasies, and Fenulla for being there for me

and loving me for who i am; having al1 of you in my life makes me extremely fortunate.

TABLE OF CONTENTS

...................................................... I . Crustacean Neuromuscular Systems 1 A . Differentiation into excitatory and inhibitory axons ......................... 2

.................................... B . Differentiation into phasic and tonic axons 4

.................................... C . Synaptic differentiation within a tonic axon 8

................................... D . Structural correlates of transmitter release 10

............................................... II . Crustacean Neuromuscular Regeneration 12 A . Regeneration studies in the SFM ....................... ..... .............. 13 B . Neural allotransplantation in the SFM ......................................... 15

. . .................................................................... III . Experimental Objectives 17

MATERIALS AND METHODS ................................................................. 19

............................................................. I . Allotransplantation Procedure 19

II . Electron Microscopy ......................................................................... 20

...................................... III . Quantitative Analysis ...................... .. ... ... 21

IV . Volumetric Analysis ........... .... ..................................................... 23

RESULTS ........................................................................................... 25

I . Excitatory Innewation ................. ... .................................................. 25 A . Nerve terminais ........................................................................... 25 B . Synapses .................................................................................. 30 C . Dense bars ................................................................................. 32

............................................... II . Inhibitory Innervation . ...... ........... .... 40 A . Nerve terminais ............. .... ...................................................... 40 B . Synapses ................................................................................... 43 C . Dense bars ............................................................................... 43 D . Presynaptic inhibition ................................................................... 49

.............................................................. DISCUSSION ....................... .. 51

................................................ I . Nature of Regenerated Nerve Terminais 51 ............................................................ A. Nerve terminal morphology 52

B . Mitochondrial volume .................................................................... 53 ............................................................... C . Dense bars per synapse 54

Structural-Functional Correlations ........................................................ Synapses .................................................................................. a . area ..................................................................................... b . number .................................................................................

Dense bars ................................................................................ a . length ........................ ... ...................................................... b . number ................................................................................

................................................................................ . c spacing

Other factors involved ..................................................................

lnhibitory Innervation ........................................................................

REFERENCES ........................................................................................ 75

APPENDIX ................................................ ...... ...................................... 82

Nerve allotransplantation has ernerged as a useful method for exploring how

motoneurons are capable of fonning specific connections with target cells in the crayfish

Procambarus clarkii (Krause and Velez, 1995). More recently, allotransplantation has

provided an opportunity to test whether the motoneuron or the target muscle detemines

the nature of the regenerating synaptic connections (Coulthard, 1998; Krause et al.,

1998). The current study examines regenerated neuromuscular terminals that fomied

after allotransplantation of a foreign phasic flexor nenre to the tonic superficial flexor

muscle (SFM) in the crayfish abdomen.

One of the primary aims of this study is to determine if ultrastructural

features can be correlated with the large initial EPSPs recorded by Krause et al. (1998)

from the regenerated connections. Another objective is to determine if the regenerated

terminals are phasic in nature, as suggested by the electrophysiology. Through the

exploration of these objectives, I will be able to detennine if the motoneuron or the target

muscle specifies the nature of the regenerating synaptic contacts. I will first provide the

relevant background material related to the crustacean neuromuscular system, paying

particular attention to the types of innervation present, how they are differentiated, and

their function in their respective systems. Next, crustacean neurornuscular regeneration

in the SFM systern will be explored.

1. CRUSTACEAN NEUROMUSCULAR SYSTEMS

One of the most important reasons for the popularity of the crustacean

neuromuscular system in experimental research is that it serves as a good model of the

vertebrate CNS (Atwood, 1976) since the two share key similarities. First, both a n

receive innervation from inhibitory and excitatory neurons, and these two types of

neurons can interact with one another. Second, the cnistacean muscle fiber, like the

vertebrate CNS, has numerous synapses owing to multiteminal innervation. Partiy

because of their heuristic value and partly because of their intrinsic interest, crustacean

neuromuscular systems have received much sc~ t iny by researchers over the past 50

years; the resulting information has been reviewed primarily by Atwood and his

collaborators (Atwood, 1976, 1982; Atwood and Govind, 1990; Atwood and Wojtowicz.

1986; Atwood and Cooper, 1996).

One striking aspect of the cnistacean neuromuscular system is its highly

differentiated nature as reflected in the following properties; (i) there are both excitatory

and inhibitory axons innnewating a muscle, (ii) there are two broad categories of

excitatory and inhibitory axons, phasic and tonic, and (iii) there are differences in

transmitter output capabilities in populations of synapses of single excitatory tonic

axons. l will briefly address each of these aspects as background for studies on the

regeneration of crustacean neuromuscular systems.

A. Differentiation into excitatory and inhibitory axons

Motoneurons can be classified as either excitatory or inhibitory, depending

on the response they elicit in the muscle fibers they innervate (Katz, 1966). While

excitatory motoneurons release the transmitter L-glutamate and bring about contractions

of the muscle fiber by depolarking its membrane potential, inhibitory neurons prevent

contraction by holding the membrane potential at resting level or by hyperpolarizing it

(Atwood, 1976). Stimulation of an inhibitory axon triggers the release of the transmitter

gamma-aminobutyric acid (GABA), which interacts with postsynaptic receptors and

increases chloride conductance. As a result, the membrane potential of the muscle fiber

moves toward the equilibnum potential of chloride (Fatt and Katz, 1953). and

counteracts the depolarizing effect of the action potentials in contracting muscle fibers,

thereby inhibiting muscle contraction (Parnas and Atwood, 1966).

Inhibitory neurons make synaptic contact with the muscle fiber membrane

and bring about postsynaptic inhibition. In addition, some inhibitory neurons make

synaptic contact with the excitatory axon and bRng about presynaptic inhibition (Atwood,

1976). Such peripheral presynaptic inhibition is represented by polarized axo-axonal

contacts from an inhibitory nerve terminal onto an excitatory newe terminal or axonal

region and has been obsewed in many crustacean neuromuscular systems (Atwood

and Morin, 1970; Atwood, 1982). The inhibitory transmitter GABA, which is responsible

for postsynaptic inhibition by inducing an increase in chloride conductance, is also

responsible for presynaptic inhibition through a similar process (Takeuchi, 1976). As a

result, fewer quanta of L-glutamate are released per excitatory impulse (Dudel and

Kuffler, 1961), which decreases the extent of depolarization of the muscle membrane,

and yields a smaller muscle contraction. Presynaptic inhibition can lessen transmitter

release by hyperpolarizing or depolarizhg the excitatory nerve terminal, reducing the

size of the excitatory action potential, or hindering impulse propagation in the excitatory

axon (Atwood and Wojtowicz, 1986).

lnhibitory innervation is present in most crustacean muscles (Atwood and

Wojtowicz, 1986) and appears to share some key similanties with the prevailing

excitatory innervation. The differences in transmitter release and facilitation

characteristics of an inhibitory axon innervating different muscle fibers, as well as

different inhibitory axons innervating the same muscle fiber, minor the differences

observed with excitatory innervation (Atwood, 1976). Atwood and Bittner (1971) have

suggested that the physiological characteristics of excitatory and inhibitory synapses are

similar for a given muscle fiber, supporting the idea that the factors responsible for the

differentiation of excitatory synapses are also responsible for sirnilar differentiation in

in hibitory synapses (Atwood, 1 976).

Both excitatory and inhibitory innervation are found in crustacean

neuromuscular systems. Excitatory axons are known to act postsynaptically, whereas

inhibitory axons can act both pre- and post-synaptically. These two types of

rnotoneurons can be further categorized into phasic and tonic varieties, depending on a

number of characteristics

B. Differentiation into phasic and tonic axons

Excitatory rnotoneurons supplying many crustacean limb muscles were

classified as either Tasr or uslow", depending upon the type of muscle contraction they

induced when the motoneuron was stimulated (Atwood, 1976). Research on the fast

flexor and fast extensor neurons of crayfish and lobster abdominal muscles (Kennedy

and Takeda, 1 965 a,b; Parnas and Atwood, 1966; Selverston and Remler, 1972) helped

develop a phasic / tonic dichotomy for excitatory motoneurons. Phasic and tonic

motoneurons Vary in a number of properties, including baseline activity, size,

morphology, response to stimulation, and plasticity. Phasic motoneurons (such as the

ones supplying the fast abdominal extensor and flexor muscles in crayfish and lobsters)

are filiform in morphology and are considered to be relatively silent, since they fire quite

inf requently. W hen they do fire, however, a significant arnount of transmitter is

reieased; this tendency accounts for the rapid and strong muscle contraction (referred to

as a twitch contraction) obsewed in fibers innenrated by phasic axons. Thus, phasic

axons are useful when vigorous, imrnediate activity is necessary (Atwood and

Wojtowicz, 1986; Atwood and Govind, 1990; Atwood and Cooper, 1996). However, this

levei of contraction cannot be maintained due to rapid fatigue at the neuromuscular

synapses of these axons during continuous stimulation (Atwood and Wojtowicz, 1986).

Tonic axons (such as the ones supplying the slow abdominal extensor and

flexor muscles), on the other hand, are varicose in morphology and are considered fairîy

active since they usually fire continuously at a low frequency of stimulation (Atwood and

W ojtowicz, 1 986). Initially, tonic axons release less transmitter but their synapses

exhibit greater fatigue resistance than their phasic counterparts. In addition, tonic axons

are capable of facilitating transmitter retease at higher firing frequencies. Tonic axons

typically control routine movements and posture (Kennedy and Takeda, 1965a.b;

Atwood and Wojtowicz, 1986). Subtle changes in tonic axon firing frsquency are

capable of slightly modifying movements. The axons supplying the slow superficial

flexor muscle of the crayfish abdomen are tonic axons which have been frequently

studied (Kennedy and Takeda, 1965 a,b; Evoy et al., 1967).

Recent studies have tried to correlate the physiological characteristics of

phasic and tonic neurons with their respective morphological characteristics (Msghina et

al., 1998, 1999). The physiological differences can be accounted for by either

presynaptic or postsynaptic disparities. Since it is believed that presynaptic factors are

the most important physiological determinants, researchers have focused primarily on

the presynaptic region. Examinations of the crayfish claw closer muscle have shown

phasic axons to be thin and non-varicose, and tonic axons to be thick and varicose

(Lnenicka et al., 1986, 1991). Furaiemore, it was shown that phasic terminals house

uniformly distributed synapses, whereas tonic teminals house synapses which are

found primarily on the varicosities (Hill and Govind, 1981; Lnenicka et al., 1986; Florey

and Cahill, 1982). A surprising finding in these studies was that tonic terminals have

more synapses than phasic terminals. This is contrary to what one would expect given

the physiological characteristics of the N o types of neurons. Therefore, there must be

some other presynaptic factor contributing to the difference. One difference identified

by investigators comparing phasic and tonic tenninals of the crayfish Iimb extensor

muscle is the amount of dense bar material found at the synapses (King et al., 1996).

Although fewer in number, phasic synapses were shown to have more dense bar

material than the tonic synapses; the phasic synapses were found to house longer

dense bars and a greater number of dense bars.

Not al1 excitatory motoneurons can be easily categonzed as either phasic or

tonic; some axons exhibit properties of both categories. For instance, the largest axon

that innervates the slow flexor muscles in the crayfish abdomen fires in bursts and

exhibits very little background activity, both of which are features characteristic of phasic

axons (Kennedy and Takeda, 1965b; Gillary and Kennedy, 1969). However, there is

considerable facilitation and little neuromuscular fatigue seen in this axon; these are

features characteristic of tonic axons. Clearly, this motoneuron possesses intenediate

properties, as do many other crustacean motoneurons (Atwood, 1976; Atwood and

Wojtowicz, 1986).

Inhibitory motoneurons, like their excitatory counterparts, can also be

classified on a phasic 1 tonic spectrum; inhibitory axons to the crayfish fast abdominal

muscles appear phasic (like their excitatory counterparts), while the inhibitory axon to

the crayfish opener muscle is considered tonic (Wilson and Davis, 1965), and the

inhibitory axon to the crayfish slow flexor muscles has intennediate properties (Kennedy

and Takeda, 1965 a,b; Evoy et al., 1967). Further research is required, however, to

determine whether inhibitory neuromuscular junctions exhibiting phasic properties

experience rapid fatigue similar to their excitatory counterparts.

Long terni adaptation studies show that sustained increases in electrical

activity of a phasic motoneuron alter its physiology and rnorphology to that of a tonic

motoneuron. There are a number of proteins that may play a role in the conversion of

phasic motoneurons; these same proteins may also be responsible for the obsewed

inherent differences between phasic and tonic nerve terminals. For example, both the

initial reduction in EPSP amplitude and the increase in fatigue resistance could anse

from a decrease in the number of active calcium channels in crayfish nerve terminals

(Atwood and Cooper, 1996). Studies in the moth, Manâuca, and in the lizard, Anolris,

have demonstrated that the number of putative calcium channels at active zones is

lower in tonic than in phasic synaptic connections (Rheuben, 198-5; Walrond and Reese,

1985). Other proteins that rnay be altered include voltage sensitive sodium and

potassium channefs, vesicle associated proteins (Le. VAMPS, syntaxins, synaptotagmin,

and NSF), second rnessengers such as calcium calmodulin-dependent kinases, and

proteins associated with mitochondria (e.g. cytochrome oxidase proteins) (Atwood and

Cooper, 1996). Obtaining knowledge regarding the cellular mechanisms responsible for

regulating the transcription of mRNAs that are translated into proteins would enhance

Our understanding of the rnolecular differences between types of motoneurons (e.g.

phasic and tonic ones) with differing patterns of activity and the changes that result

during activity-dependent transformation (Atwood and Cooper, 1 996). Hence, molecular

differences may be partially responsible for quanta! output disparities between native

phasic and tonic synaptic connections.

Thus, although both excitatory and inhibitory axons can be classified as

either phasic or tonic, some motoneurons have intermediate properties. Long term

adaptation studies suggest that inherent molecular differences may help account for the

differences obsewed between phasic and tonic motoneurons. lnsig hts into the

correlates of synaptic output can be gained by exarnining muscle systems innervated by

a single tonic axon.

C. Synaptic differentiation within a tonic axon

It is a cornmon feature of a single tonic axon to fom neuromuscular

synapses that rekase dierent amounts of transmitter. The best examples of such

synaptic differentiation are the single excitatory axons to the crayfish opener muscle

(reviewed by Atwood and Wojtowicz, 1986) and to the lobster accessory flexor muscle

(reviewed by Govind and Walrond, 1989). The summary below is based fargely on

these studies.

Although individual crustacean muscle fibers are innewated by only a single

excitatory motoneuron, the synaptic potentials produced by neuronal stimulation Vary

both in their amplitude and in their ability to facilitate. In the limb accessory flexor

muscle of the American tobster, for instance. synapses generate larger junctional

potentials on distal muscle fibers than on proximal fibers. The former are referred to as

high-output synapses and exhibit little faciiitation, whereas the latter are low-output and

show considerable facilitation (DeRosa and Govind, 1978; Meiss and Govind, 1979).

Similarly, the excitatory motoneuron in the crayfish limb opener muscle foms regionally

differentiated high- and low-output synapses; high-output synapses are found on

proximal fibers while low-output synapses are found on more central ones (Atwood and

Bittner, 1 971 ; Bittner, 1 968; Linder, 1974). When exposed to low stimulation

frequencies, the larger initial EPSPs recorded in the proximal bundles are 8-10 times

larger than the ones recorded from the central fibers (Iravani, 1965; Cooper et al.,

1995b). Subsequent analysis has revealed that approximately 1/4 of this EPSP

disparity can be attnbuted to a higher input resistance in the proximal fibers. The

remainder of the EPSP disparity is likely due to diïerences in the probability of

transmitter release at synapses, including differences in calcium current and synaptic

cornplexity (Cooper et al., 1995b). The observed disparities between proximal and

central synapses in terms of junctional potential amplitudes and quantal content

positively correlate with discrepancies in dense bar number and length within the

synapses (Govind et a1.,1994). Zucker et al. (1991) showed that a single pulse elicits a

greater calcium flux for synapses housing long, or multiple dense bars as opposed to

small, simple synapses. Although the average dense bar is twice as long in proximal

than central synapses, quantal content is three to five times greater at the same low

frequency. This discrepancy indicates a non-linear relationship between dense bar

length and quantal output, which is in agreement with previous findings at other

crustacean synapses (Atwood and Marin, 1983). As a result, proximal muscle fibers in

the crayfish exhibit manifold larger EPSPs than their central counterparts.

The varicosities made by the excitatory motoneuron innervating the crayfish

limb opener muscle c m be visualized in living preparations with the aid of the dye 4-Di-

2-Asp (Magrassi et al., 1987). Once identified, the varicosities can be individually

contacted by a macropatch electrode for the purpose of recording synaptic currents and

labelling the varicosity with electron dense fluorescent beads. These varicosities can

then be serially sectioned, reconstructed and analyzed with the aid of a transmission

electron microscope (Wojtowicz et al., 1994). A cornparison of the innervation pattern of

different regions of the crayfish opener muscle indicates that on high-output proximal

fibers there are fewer varicosities and l e s terminal branching than on low-output central

fibers (Harrington, 1993; Govind et a1.J 994). Furthemore, quantal release is higher in

proximal terminals, which intuitively appears to disagree with the structural differences

between proximal and central terminals. Thus, it appears that transmission at the

neuromuscular juncüon is predominantly influenced by specific nerve terminal properties

rather than quantitaave differences at the macroscopic level (Govind et al., 1994). Such

an idea supports the use of electron microscopy for conducting ultrastructural analyses

through serial reconstruction in pursuit of the structural basis of transmitter release

differences.

The differentiation of a single tonic motoneuron innewating a group of

muscle fibers suggests that presynaptic properties are primarily responsible for

differential transmitter output and the resulting differential initial EPSP amplitudes at low

stimulation frequencies. Differences in the probability of release at synapses have been

explored primarily through an examination of calcium's involvement in the process of

synaptic transmission.

D. Structural correlates of transmitter release

The idea that calcium is integral to the process of synaptic transmission is

widely accepted. Depolarization induces calcium entry through voltage sensitive

calcium channels in nerve terminais, precipitating a release of neurotransmitter

molecules from spherical synaptic vesicfes (approximately 46-70 nm in diameter)

containing quanta (packets of 10' transmitter molecules) (Atwood. 1982). However. the

direct mechanism by which calcium ions induce a release of vesicles from the

presynaptic terminal has yet to be elucidated and is therefore the focus of much

research. It is clear that an influx of calcium sharply increases transmitter release

probability from the basal state, and that the probability of release is determined by the

mechanisms responsible for coupling the fusion apparatus to calcium ions (Goda and

Sudhof, 1997). In fact, it has been demonstrated that an increase in calcium

concentration can result in a geometric increase in the amount of transmitter released

up to the fourth power (Smith et al., 1985; Augustine and Chariton, 1986; Zucker and

Fogelson, 1 986).

Transmission electron micrographs depict an electron dense material,

known as a dense bar, with clustered synaptic vesicles on either side representing a

putative site of transmitter release, or active zone (Atwood, 1982; Heuser and Reese,

1979). A dense bar may contain cytoplasmic portions of various proteins responsible for

the movement of vesicles toward calcium channefs and release zones contained within

the synapse (Hirokawa et a1.,1989). Quanta are released from the presynaptic terminal

into the synaptic cleft upon fusion of the vesicle with the presynaptic plasmalemma at an

active zone (Katz, 1966; Kuffler and Yoshikami, 1975; Couteaux and Pecot-

Dechavassine, 1 970; Heuser and Reese, 1 979; Heuser et al., 1 979). Furthemore, the

fusion sites of synaptic vesicles are depicted as small circular depressions when

examined in freeze-fracture view (Pearce et al., 1986). The close proximity between the

large intramembranous particles and exocytotic vesicles, coupled with the fact that the

delay between calcium influx and transmitter release is brief, implicated the large

particles as being calcium channels (Pumplin et al., 1981). Given the brief delay, the

idea that more distant structures are directly involved in the release process can be

discounted. Furthermore, a very short latency (approximately 200 ps) between calcium

influx and post-synaptic response has been demonstrated in squid giant synapse

voltage clamp studies (Uinas, 1977). Such a short delay suggests that only vesicles

situated near the quantal emission domains are released when an action potential

occurs (Llinas, 1977). Robitaille et al. (1 990) used specific ligands to show that calcium

channel bands at active zones of the frog neuromuscular junction have locations

corresponding to the intramembranous particles. The active zone is not composed

solely of calcium channels; calcium-activated potassium channels are also present

(Roberts et al., 1990).

There are two key components involved in the calcium dependent control of

transrnitter release probability: calcium channels wtiich allow calcium to enter the

terminal, and calcium sensors present in the fusion machinery that are capable of

regulating exocytosis (Goda & Sudhof, 1997). During repetitive stimulation, calcium

sensitive indicators have further supported the idea that calcium channels are localized

at presynaptic active zones in the squid (Llinas et ai., 1992; Smith et al., 1993).

Recently, the calcium binding protein synaptotagmin, thought to be a putative calcium

sensor for evoked release, has been identified in crayfish motor neurons (Cooper et al.,

1 995a).

In summary, the location, size and number of the large intramembranous

active zone particles support the hypothesis that calcium channels couple an action

potential with transrnitter release (Pumplin et aI.,1 981 ; Simon and Llinas, 1985; Walrond

and Reese, 1985). As a result, the "structure-function hypothesisw has been proposed; it

postulates that the probability of transmitter release from a release site is influenced by

the number of calcium channels located in close proximity to the site (Walrond and

Reese, 1985; Atwood and Lnenicka, 1986). Such a hypothesis raises the possibility that

long term changes in transmitter release could be made via controlling the number

andfor distribution of dense bars present in the nerve terminal (Govind and Walrond,

1 989).

II. CRUSTCEAN NEUROMUSCULAR REGENERATlON

There are a few isolated studies that focus on the neuromuscular synaptic

regeneration obsented when limbs are removed and new ones form in their place. One

such study of the regenerating limb buds of crabs revealed that initial synaptic contacts

were poorly facilitating while later ones were highly facilitating for an identified tonic

motoneuron (Govind et al., 1973). A more recent study in regenerating crayfish clawed

Iimbs showed that the synaptic pfasticity of a phasic motoneuron did not recapitulate

features of its primary development (Stewart and Atwood, 1992). While these two

studies were performed using limb muscles, most studies of neuromuscular

regeneration have been conducted on a body muscle viz the superficial flexor muscle

(SFM) in the abdomen of crayfish. The ability of motoneurons to regenerate in this

system has allowed Velez and his callaborators to explore how axons are able to form

synaptic contacts with the target muscle (Ely and Velez, 1982; Hunt and Velez, 1982,

1 989a, b).

The crayfish abdomen has two very different neuromuscular systems; the

phasic flexor muscle is innervated by the phasic flexor nerve and is active during flight

responses, whereas the tonic superficial flexor nerve innervates the SFM and is

responsible for fine routine movements. The tonic SFM, with its well-known anatomy

and limited number of cells, offers advantages for examining synaptic regeneration.

Over the past two decades, Velez and his collaborators have conducted a series of

elegant studies on the regeneration of neuromuscular synapses on this muscle.

A Regeneration studies in the SFM

Regeneration studies may help us understand synaptogenesis and

neuromuscular interactions. They may aid in detemining whether functional synaptic

properties are a result of an autonomous program of the motoneuron, or are influenced

by retrograde influence from target muscle. There are studies supporting each of these

views. In the crayfish leg extensor muscle, the fact that both phasic and tonic murons

innervate the same target muscle fibers supports the notion that specific neuromuscular

properties are determined presynaptically (King et al., 1996). In the crayfish leg opener

muscle, however, the occurrence of high- and low-output endings of a single tonic

motoneuron on different muscle fibers suggests a target-specific influence on specific

neuromuscular properties (Cooper et al., 1995b).

It is well known that crayfish have excellent powers of regeneration, both of

entire body parts such as limbs as well as of tissues such as nerves. The latter in

particular has allowed the study of the regeneration of synaptic connections in the

superficial flexor muscle (SFM) of the abdomen by Velez and his collaborators. The

SFM consists of approximately 40 tonic muscle fibers arranged in a thin sheet (Velez

and Wyman, 1978a,b). It is considered a "slow" muscle, because of its long sarcomere

length, and graded tension throug h surnmation. The muscle receives polyneural

innervation from six axons in total; five of them provide excitatory innervation, white the

other one provides inhibitory innervation (Kennedy and Takeda, l96Sb). It is important

to note that not al1 excitatory axons have the same properties; some are more tonic than

others, and many of them fire spontaneously. Each SFM muscle fiber is innervated by

at least three axons; two of them are excitatory, and the other one is inhibitory (Kennedy

and Takeda, 1965b; Velez and Wyman, 1978a). Excitatory axons likely use the

transmitter L-glutamate (Evoy and Beranek, 1972; Hildebrand et al., 1974), whereas

inhibitory axons use GABA (Otsuka et al., 1966; Uchizono, 1967; Takeuchi and

Takeuchi, 1965).

The muscle fibers of the SFM are innervated in a position dependent

manner; each motoneuron consistently innewates certain fibers, and EPSP size varies

depending on the fiber's location (Velez and Wyman, 1978a,b). When the native

superficial flexor nerve was transected, connectivity maps were re-established within 8

weeks (Ely and Velez, 1982) via axon sprouts, or satellite axons, growing from the

proximal nerve stump (Krause et al., 1996). Such branching of motoneurons has also

been obsenred in vertebrates upon curare application to reduce neuromuscular a c t ~ t y

(Dahm and Landmesser, 1991). It is likely that since the muscle is not being stimulated

by the motoneurons innervating it, activity dependent retrograde signals induce axon

sprouting (reviewed by Jessel and Kandel, 1993). Thus, in the case of a regenerating

nerve and a denervated muscle, it is quite possible that muscle fibers signal axon

sprouting and reinnervation of denewated targets. Successful regeneration, however,

only occurred approxirnately half of the time (Ely and Velez, 1982). If the newe is cut

very close to the ventral cord, the nerve cannot regenerate because the distance that

the regenerating nerve must travel is too great. Regeneration is first obsewed at 3

weeks post-transection, at which point the transected distal nerve has degenerated and

is incapable of forming viable synaptic connections.

The specificity of regenerated synaptic connections was maintained even

after various experimental manipulations were performed, including a reduction in the

size of the muscle field (Clement et al., 1983) and a change in the nerve's entry location

into the muscle (Goransson et al., 1988). These studies strongly suggest the presence

of cues on the muscle surface that guide the formation of specific synaptic connections

by the regenerating axons. To further test the possibility of guidance by the target

muscle of the regenerating axons, transplanting the SFM nerve into an unusual location

was attempted (Krause and Velez, 1995).

B. Neural allotransplantation in the SFM

The SFM system is ideal for transplantation studies due to the small number

of muscle fibers (40) involved, the well-âocumented innervation of these fibers, and the

regeneration abilities of the rnotor axons to these fibers. A technique for

allotransplanting a SFM newe with its associated ganglia from one animal to the

denervated SFM of another was developed to test whether neurons are able to detect

their position within the target muscle during synaptogenesis, thereby producing a

position-dependent connectivity pattern (Krause and Velez, 1995). The regeneration of

neuromuscular contacts to a previously denewated muscle indicates that the

motoneurons in the transplanted ganglia survive, even though these ganglia are from

another crayfish and are placed in a foreign location without any physical connection to

the host animal's circulatory or nervous system (Krause et al., 1996). The transplanted

ganglia showed structural integrity; they had nucleated cell bodies, blood vessels and

lacunae (indicative of vascularization), healthy neuropil containing dendritic profiles with

synaptic contacts, as well as clear and dense vesicles.

Efectron micrographs of the transplanted newe reveal differences with the

contralateral intact newe (Krause et al., 1996). Specifically, the transplanted nerve is

larger than its intact counterpart, but has five axons over the lateral SFM like its intact

counterpart. Each of these f i e axons has several axon sprouts, rather than appearing

as single axon profiles (as in the intact condition). Axon sprouting is known to occur

from the cut central stump of the motoneuron to the crayfish opener muscle where these

satellite branches may either fuse with the distal stump (Kennedy and Bittner, 1974) or

grow out to the target muscle (Nordlander and Singer, 1972) in order to reconnect the

nerve to the muscle. Interestingly, although the donor nerve was transplanted on the

ventral surface of the SFM, it regenerated on the dorsal surface in a path resembling the

original host SFM nerve, and had twice the diameter when examined 8-10 weeks post-

transplantation (Krause et al., 1 996).

Viable neuromuscular connections were first detected 2 weeks after the

operation; innervation was observed across the entire muscle approximately 4 weeks

later (Krause and Velez, 1995; Krause et al., 1996). Not al1 muscle fibers, however,

were inneniated; the transplanted newe formed synapses on approximately 60% of the

muscle fibers with an innervation pattern very similar to the intact one. Thus, complete

innewation of target muscle is not required for specificity of reconnection following newe

allotransplantation (Krause and Velez, 1995). The specificity of connection of

allotransplants could imply that axons use targetderived positional information to create

similar connectivity maps (Krause and Velez, 1995). Since the regenerate terrninals

were often adjacent to the original degenerating nerve teminals, it is possible that the

new terminals follow the trail of the degenerating terminals to maintain specificity

(Krause et al., 1996).

III. EXPERIMENTAL OBJECTIVES

Recently, Krause et al (1998) used the allotransplantation technique to

mismatch the regenerating nenie to its target muscle. Specifically, they allotransplanted

the phasic branch of the third newe root to a denervated SFM. The transplanted ganglia

survived for 8-10 weeks and showed intact lwking cell bodies and neuropil. The phasic

nerve regenerated ont0 the dorsal surface of the SFM and the axons showed a large

number of sprouts, between 10-50 for individual axons. The large number of sprouts

was also seen for phasic axons in culture (Arcaro and Lnenicka, 1995) and contrasted

sharply with the much fewer sprouts that tonic axons showed in allotranspfanted and

culture conditions. Hence a phasic nerve appeared to have successfully regenerated

ont0 the tonic SFM muscle.

Electrophysiological examination of the neuromuscular synapses formed by

these regenerated phasic axons displayed some very large (25 mV) EPSPs, which are

reminiscent of phasic synapses. Therefore, phasic type synapses appeared to have

regenerated ont0 a tonic muscle, raising the possibility that the neuron rather than its

target muscle regulates the type of synapses that regenerate.

My primary objective was to examine the fine structure of these regenerated

connections via thin serial section electron microscopy which would provide a

quantitative description of the regenerated synapses and their dense bar active zones.

Such a description would allow me to correlate structure with physiology and assess

whether the observed ultrastructural features were capable of accounting for the very

farge initial EPSPs.

A description of the fine structure of these regenerated neuromuscular

connections would also allow me to compare them with other known phasic and tonic

neuromuscular connections in crayfish. This com parison would hopef ully address the

debate regarding whether the motoneuron or the target muscle is most influential in

determining the type of synaptic connections made between a mismatched foreign

phasic nerve and native tonic muscle. If regenerated synapses are deemed to be phasic

in nature, it can be suggested that the motoneuron is most influential in deterrnining the

type of synaptic connections made between a foreign phasic nerve and a native tonic

muscle.

MATERIALS AND METHODS

1. ALLOTRANSPàANïAWON PROCEDURE

The allotransplantation procecure outlined below was perfomed by Kristen

Krause using 15 donor and 15 host crayfish. Adult crayfish, Procambarus clarkri; were

purchased from a Louisiana supply company and held in aerated freshwater tanks in

individual compartments at 22 OC. The host SFM in the third abdominal segment was

denewated by severing the superficial flexor newe of the third root proximal to the

medial edge of the muscle (Clement et al., 1983). Since the newe was cut close to its

point of emergence from the CNS, the regeneration of this nerve was effectively

prohibited (Hoy, 1969). After a penod of 48 hours, these denervated animals were

allotransplanted with a donor flexor newe using a minimally invasive allotransplantation

procedure developed by Krause and Velez (1995). After donors were sacrificed, the

nerve cord was exposed by the removal of the deep flexor and extensor muscles. The

third ganglion and its third root with a long segment of the deep branch which supplies

the phasic muscles, were transplanted along with the fourth ganglion and the connecting

nerve cord to reinnervate the SFM by a phasic nerve.

The transplant obtained from the donor animal was introduced into the

abdominal cavity of the host animal through a hole forrned by removing the left

swimmeret of the third abdominal segment (Krause and Velez, 1995). In order to

accomplish the delicate task of positioning the phasic nerve on the ventral surface of the

host SFM, a tiny needle hole was made in the ventral cuticle irnmediately underneath

the SFM, A human hair was threaded through this hole and made to emerge from the

swimmeret opening and was attached to the deep phasic newe with surgical thread.

The hair was then pulled back out of the hole so that the transplanted newe came to lie

against the SFM, since such an arrangement is necessary for neurornuscular

regeneration to proceed.

A total of 15 crayfish underwent the allotransplantation procedure; five of

these host animals died, and the remaining 10 animals suwived (Krause et al., 1998).

These were examined electrophysiologically 8-1 0 weeks later and eight of these animals

exhibited characteristics of reinnervation, in the form of EPSPs, in response to

stimulation of the regenerate nerve. Five of these animals were used for the present

electron microscopie investigation of regenerated neuromuscular synaptic connections.

il. ELECTRON MICROSCOPY

The following is an outline of the procedure followed by Joanne Pearce to fix

the neuromuscular tissue once the allotranplanted newe regenerated. The SFM tissue

was prepared for electron microscopy using procedures standard to our laboratory

(Govind et al., 1994). The SFM preparations were initially fixed in situ for one hour at

room temperature by superfusing in a prirnary fixative containing 2.5% glutaraldehyde,

0.5% fonnaldehyde, 1 mM calcium chloride, and 0.1M sodium cacodylate buffer (pH

7.4). Next, the ganglion, nerve, and muscle were removed and fixed for an additional

hour in an identical fixative. The tissue was then washed for one hour in a O.lm sodium

cacodylate buffer containing 4 % sucrose and 1 mM CaCI2. The tissue was postfixed for

one hour in 2% OsOI in a O.lm cacodylate buffer, rinsed briefly in buffer before being

dehydrated using a graded ethanol series. Following dehydration, the tissue was placed

for 30 minutes in propylene oxide and left immersed in a 50% propylene oxide - 50°h

Epon-Araldite mixture overnight to allow the resin to infiltrate gradually. The following

day, the tissue samples were placed in moulds of fresh Epon-Araldite. After remaining

at room temperature for eight hours, the moulds were placed in a 60 OC oven for 48

hours for curing.

After the tissue was fixed and embedded in resin, I began my project by

cutting serial thin sections of the tissue using a diamond knife mounted on a Reichert

OMU 2 ultramicrotome. The thickness of each serial section was estimated from its

interference color (the wlor of the reflection of the section as it floated on water).

Successive sections adhered to one another forming ribbons of sections that were

transferred ont0 single slot gnds and placed ont0 Fornivar-coated slotted gridstands.

After a drying period, the gnds holding the serial sections were stained with uranyl

acetate for 30 minutes, and then lead citrate for two minutes. Sections were then

examined for nerve terminal regions using a Zeiss 9s electron microscope. Areas of

interest were photographed in serial (final magnification approximately ~27,000) and

analyzed both quantitatively and qualitatively.

Ill. QUANTITATIVE ANALYSIS

The total number of excitatory and inhibitory nerve terminais was

determined from the serially thin sectioned samples prepared for each of the f i e

animals. The length of an individual nerve terminal was deterrnined by summing the

estimated thicknesses of the sections on which the nerve terminal was present The

total excitatory and inhibitory newe terminal length was calculated by summing the

terminal lengths of every terminal in each of the five animals. The synaptic area was

determined by summing the product of section thickness and synapse length (measured

using calipers pre-set at 2mm) for each of the sections on which the synapse was

present. Only fully sectioned (complete) synapses were used to calculate mean

synaptic area and total synaptic area. If a section was missing for a synapse. the

synaptic length for that section was estimated as the average of the preceding and

following section synaptic lengths.

The nurnber of dense bars per synapse was calculated for complete

synapses; these synapses were then categorized into those containing 0, 1, 2, 3 or

more dense bars to get a better idea of dense bar distribution. The number of dense

bars per synaptic area and per unit terminal volume was also calculated. The length of

dense bars cut in cross-section was deterrnined by summing the thicknesses of the

sections on which the dense bar was present; if a section was missing, then the dense

bar length was deemed incompfete and was omitted from calculations of the total dense

bar length and the mean dense bar length. For dense bars that were cut longitudinally,

length was determined by measuring the extent of the dense bar and multiplying that

value by the magnification factor of the electron micrograph. Dense bar length per

synaptic area and per unit volume was also calculated for each of the five animafs.

Synapses with two or more dense bars were examined for adjacent dense

bars. If adjacent dense bars were obsetved in a single thin section, the distance

between the midpoints of the dense bars was measured and then multiplied by the

magnification factor to obtain a separation distance in Pm. For adjacent dense bars

appearing on different thin sections, the separation distance, c, was determined using

the Pythagorean theorern, a2 + b2 = c2 , where a is the average distance between the

two sections and b is the distance separating the two dense bars had they appeared on

the same section. The number of dense bars that were separated from an adjacent

dense bar by less than or equal to 0.2 Pm was noted.

Two-dimensional reconstructions were produced for some excitatory and

inhibitory synapses to illustrate the number and spacing of dense bars as a visual

indicator of synaptic complexity. In these reconstructions a series of straight parallet

Iines were used to represent a synapse, with each individual Iine representing the

synaptic length on one s e d l section. Dense bars were denoted on these No-

dimensional reconstructions by filled circles in the appropnate locations; dense bars

spanning more than one section had their filled circles connected with a fine.

Statistical tests were used to compare synapse size, dense bar length and

other parameters among means of the five animals. Specifically, a one-way ANOVA

was perfomed to compare inter-animal differences in synaptic area, dense bar length

and dense bar number per synapse. Significance was tested using an alpha level of 5

percent (p c.05). Significant differences in any of these parameters were further

explored using the student's t-test.

IV. VOLUMETRIC ANALYSIS

The percent composition of clear vesicles, dense core vesicles,

mitochondria and axoplasm was deterrnined with the aid of a dot gnd acetate sheet.

The sheet was superimposed on representative terminals found in each of the five

animals. Specifically, the total number of dots landing on each of the terminal

constituents was divided by the total nurnber of dots landing on that particular terminal

to yield a percentage composition for each of the constituents (Le. clear vesicles, dense

core vesicles, mitochondria). This was done for terminals in every fifth section of a

serially sectioned sample.

The mean cross-sectional area of regenerate terminals was calculated by

multiplying the average number of dots per terminal (detemined by adding up the total

number of dots contained within the terminal of interest for al1 sections analyzed, and

dividing this total by the number of sections analyzed) by the squared distance between

the dots on the gridsheet. The volume of the excitatory and inhibitov terminals was

determined by simply multiplying the mean cross-sectional area of each terminal by the

overall length of the terminal (calculated by adding up the individual thicknesses of the

sections in which the terminals were found). Total volume for the regenerate terminals

was obtained by summing the individual terminal volumes calculated using the above

method.

RESULTS

The present experiments on the regeneration of neuromuscular synapses

on the SFM following allotransplantation of a phasic nerve were initiated by Krause et al.

(1 998) who showed that the transplanted newe functionally innewated the muscle

fibers, since stimulation of the regenerated nerve produced EPSPs in eight out of ten

transplant preparations. The muscle fibers in six of seven preparations were innervated

by two or three excitatory axons, many of which generated large (up to 25 mV) EPSPs,

strongly suggesting that the regenerated newe terminals formed phasic-like synaptic

contacts with the tonic SFM (Krause et al., 1 998). Interestingly, electrophysiological

evidence for inhibitory innervation, in the fonn of IPSPs, was not obtained.

My aim was to examine these regenerated neuromuscular terminals in order

to characterize the structural features of their synapses and active zones. Hence,

samples from five different anirnals on which electrophysiological studies had been

performed were examined with thin serial section electron microscopy. The findings are

presented separately for excitatory and inhibitory innervation below.

1. EXCITATORY INNERVATION

A Nerve terminal8

Tissue blocks containing groups of muscle fibers were suweyed in 2-5 pm

increments for the presence of nerve terminal regions. In these survey sections, a useful

indicator of innervation was the presence of muscle granular sarcoplasrn that often

heralded nerve terminals and was usually located around the periphery of the muscle

fiber (Fig. 1). Some of these innervation sites were cut in serials of 1 W-300 sections for

quantitative analysis. A total of between 12-22 excitatory nerve terminals

Figure 1. A. Selected site of innervation in the crayfish SFM by allotransplanted

regenerating axons showing several profiles of excitatory (E) terminals that are densely

populated by spherical clear vesicles. These terminals make synaptic contacts (arrows)

with muscle granular sarcoplasm (s), and at some synapses a presynaptic dense bar is

seen.

B. Another innervation site showing several excitatory (E) terminals in contact with

muscle granular sarcoplasm (s) and containing spherical clear synaptic vesicles. This

innervation site also shows profiles of excitatory axons (EA) recognized by spherical

clear vesides and of an inhibitory axon (IA) recognized by elliptical clear vesicles. The

inhibitory axon gives rise to an inhibitory (1) terminal.

Scale bars: 1 Pm, Magnification: A x24 400; B x17 700.

were identified for each of the five animals. Examination of both the survey and serial

sections revealed that the areas of innewation usually consisted of three to five distinct

excitatory nerve tenninals on any given section (Fig. 1). The terminals were easily

recognized by populations of small, clear synaptic vesicles, a few larger dense core

vesicles, and mitochondrîa. The teminals also displayed characteristic synaptic contacts

with the muscle membrane in the fom of parallel, densely stained pre- and post-

synaptic membranes (Fig. 2). At many of these synapses, distinct active zones for

neurotransmitter release were seen in the fom of presynaptic dense bodies surrounded

by a cluster of clear vesicles.

The majority of the newe terrninals at an innervation site were excitatory

judging from the spherîcal nature of lheir synaptic vesicles (Atwood and Wojtowicz,

1986) (Figs. 1, 2). The few inhibitory nerve terminals identified among the five animals

had elliptically-shaped clear synaptic vesicles indicating inhibitory innervation; these

terminals are described later in this thesis.

The regenerate excitatory nerve terminals, in general, were fairly thin (Fig.

l ) , with mean cross-sectional areas as low as 0.26 I 0.28 pm2 (animal W 7 ) (Table 1).

These terminals were characterized by relatively more clear vesicles than dense

vesicles and mitochondria (Figs. 1, 2). To substantiate these qualitative observations, a

volumetric analysis was perforrned to detemine the percentage of newe terminal

volume that was occupied by the various compositional elements (Le. clear vesicles,

dense core vesicles, and mitochondria). Such an analysis revealed consistently low

percentage values for dense core vesicles and mitochondria relative to the clear

vesicles (Table 1 ). Specifically, clear vesicles occupied between 1 5.7% to 35.9% of

excitatory terminal volume in four of the five animals; a single animal showed an

unusually low volume of 6.1 %. However, the mean across al1 animals was

Figure 2. A. A regenerate excitatory (E) nerve terminal populated with mainly spherical

clear (c) synaptic vesicles, a few dense core (d) vesicles and rnitochondria (m). The

terminal shows a distinct synaptic contact (between bars) made with the muscle

membrane in the region of granular sarcoplasm (s). The synapse possesses a

presynaptic dense bar (arrowhead).

B. Profiles of two excitatory (E) nerve tenninals recognized by the spherical clear

synaptic vesicles and rnaking synaptic contact (between bars) with muscle membrane

(s). The synapse of the upper terminal has a presynaptic dense bar (arrowhead) next to

which is an omega-shaped synaptic profile depicting vesicle exocytosis. The capturing

of such an event confirrns that the regenerated synaptic connections are viable.

Scale bars: 0.5 Pm. Magnification: A x41 900; B x66 300.

Table 1. Quantitative analysis of regenerated excitatory nerve tenninals to the crayfish superficial flexor muscle for fwe animals.

Animal

#2 t 5 #7 #8 #IO PooM TERMINALS:

Number 22 13 20 16 12 83

Mean cross-sectionai 0.66 0.63 0.26 0.35 0.50 0.48 Area @m2) (x f sd) f 0.68 f 0.41 I 0.28 + 0.44 f 0.56 k 0.17

Mean volume (p) 1.83 1.94 0.67 3.04 1 -57 1.81 (X f sd) f 3.37 S 1.84 I l -18 i 6.72 I 2.1 0 + 0.85

Total volume @m3) 40.2 25.3 13.4 48.6 18.8 146.3

% COMPOSITION OF: - Clear vesicles 6.1 35.9 24.0 27.7 15.7 21.9

Dense vesicles 1 -2 3.0 2.3 3.2 3.2 2.6

Mitochondria 2.5 7.9 2.6 6.1 9.6 5.7

Axoplasm 90.0 53.3 71 -1 63.0 71 -9 69.9

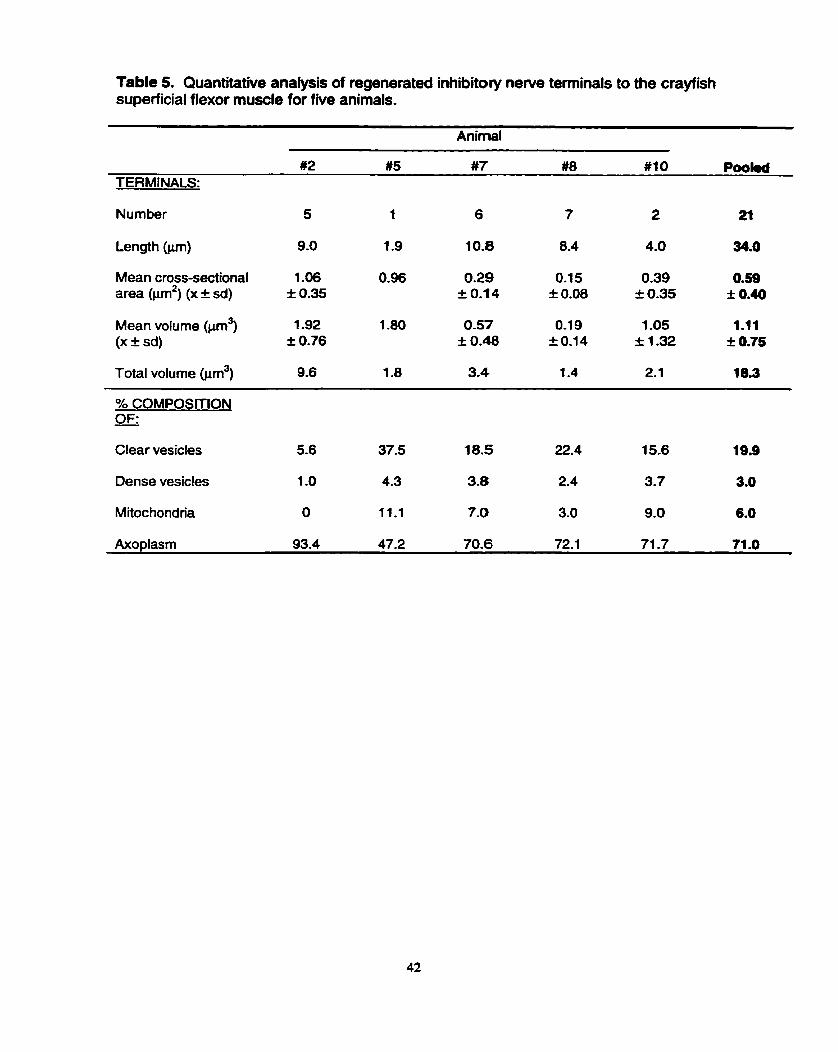
approximately one-fiih of terminal volume (21.9%) for clear vesicles. Dense core

vesicles, on the other hand, were much less prevalent; they occupied between 1.2%

and 3.2% of terminal volume in the five animals. Mitochondria also occupied markedly

l e s terminal volume than the cfear vesicles in each of the five animals; the range

across the five animals studied was 2.5% to 9.6% of terminal volume, with an overall

mean of 5.7% (Table 1). In most terminals across al1 five animals, the mitochondria

appeared simple and unbranched. Furthemore, some of the nerve terminals in each

of the five animals lacked mitochondria-
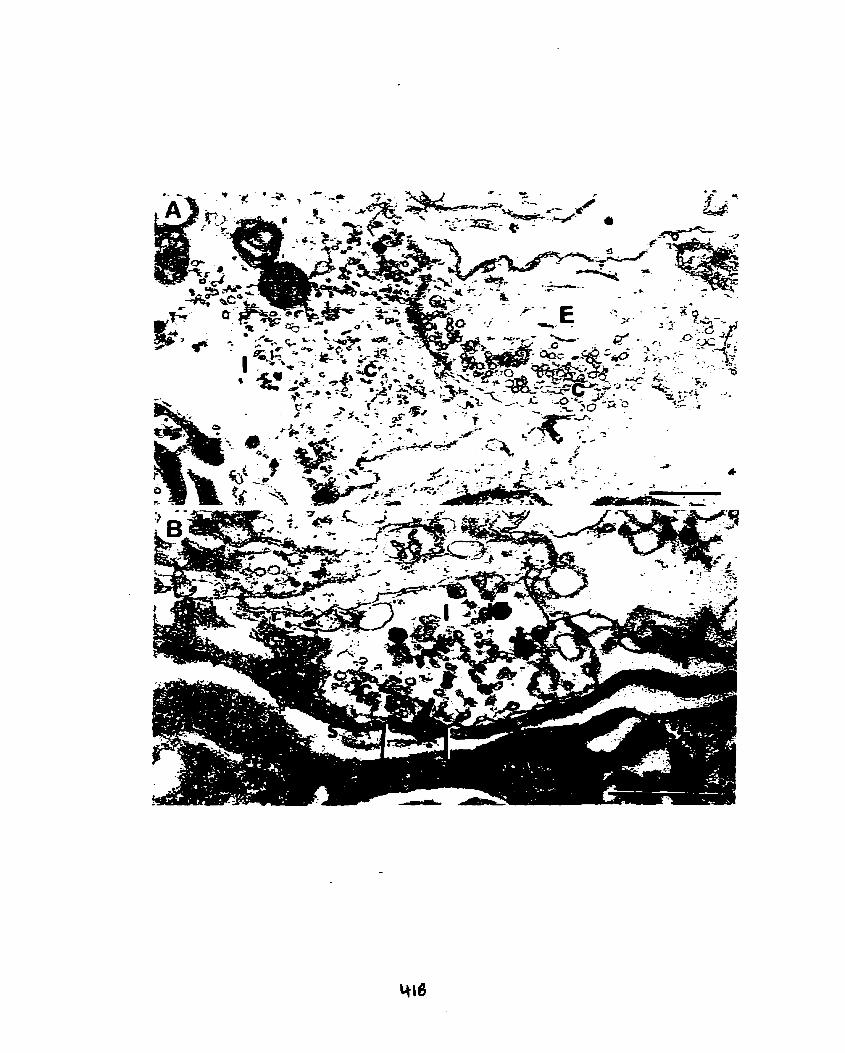
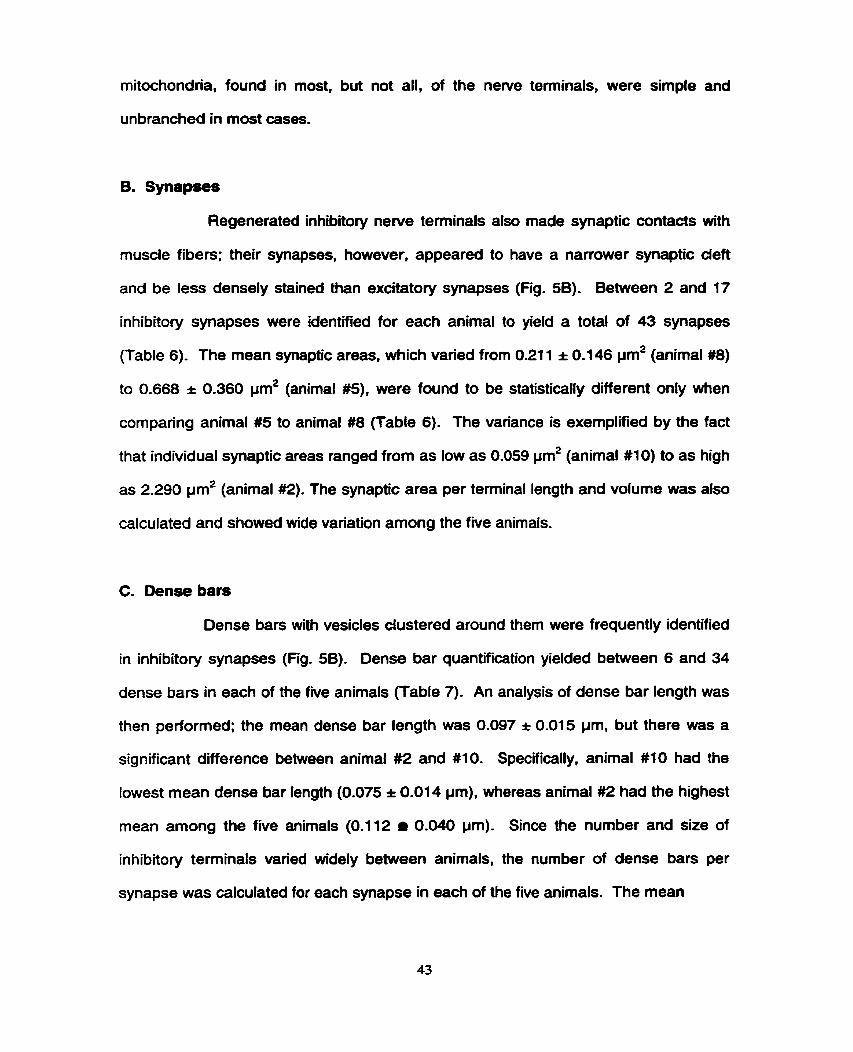
B. Synapses

Neuromuscular synapses, characterized by the close apposition of

presynaptic (newe terminal) and postsynaptic (muscle fiber) membranes, represent

the sites of information exchange between nerve and muscle. The space between

these two membranes is referred to as the synaptic cleft, which is filled with electron

dense material and is typically 15 nm wide (Fig. 2). Once terminal regions were

located, fully sectioned regenerated synapses were identified, and synaptic areas were

calculated (Table 2). Between 37 and 88 excitatory synapses were identified in each

of the five animals. This study also examined the number of synapses per prn of

terminal, revealing similar values among the five animals and a mean (across the five

anirnals) of 1.48 synapses per Pm of terminal. A comparison of the number of

synapses per unit terminal volume, however, revealed great variation among the five

animals. The range was from 1.34 to 5.22 with a mean of 2.52 synapses per pm3 of

newe terminal (Table 2).

Mean synaptic areas for excitatory synapses, which varied from 0.241 * 0.178 pmZ (animal #7) to 0.527 t 0.485 Pm2 (animal #5), were statistically analyzed to

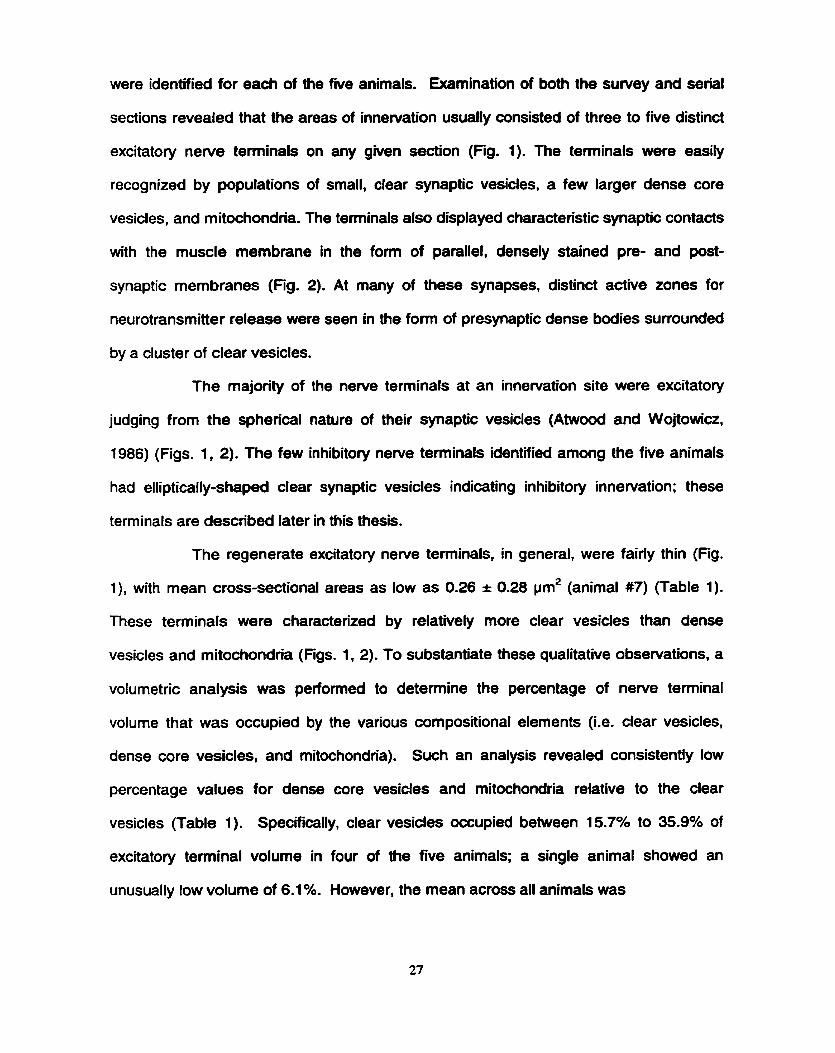
Table 2. Quantitative analysis of regenerated excitatory synapses ta the crayfish superficial flexor muscle for f i e animais.

Animal

#2 R5 Ut? #8 #1 O Poolad SYNAPSES:

Number 54 57 70 88 37 306

Num ber/pm of terminal 1 -64 1-53 1.75 1.12 1.38 1.48

~urnber /~ rn~ of terminal 1 3 4 2.25 5.22 1.81 1.97 2.52

Mean area (pm2 ) 0.377 0.527 0.241 0.404 0.415 0.409 (X k sd) I 0.277 f 0,485 f 0.1 78 f 0.302 i 0246 I 0.111

Total area @rn2) 20.4 30.0 16.8 42.6 15.4 125.2

A r e a m of terminal (pm2) 0.54 0.82 0.48 0.49 0.53 0.57

~ r e a / ~ ~ m = of terminal m2) 0.51 1.19 1 -25 0.88 0.82 0.93

determine if the means were similar. The analysis revealed each of the animals had a

mean synaptic area that significantly differed from at least one other animal; the mean

synaptic area for animal #7 was significantly lower than each of the other four animals.

Overall, 3û6 regenerate excitatory synapses were measured to yield a mean synaptic

area of 0.409 I 0.1 11 pm2. There was considerable variance around this mean; in

fact, individual synaptic areas ranged from as low as 0.017 pm2 (animal #7) to as high

as 2.472 pm2 (animal W).

Due to the great variation in synaptic areas, we looked at the synaptic

area per pm of nenre terminal for each of the five animals. The values ranged from

0.48 to 0.82, with a mean synaptic area per prn of terminal of 0.57 (Table 2). Since

these regenerated terminais are quite thin, synaptic area was then normalized to

terminal volume. The resulting synaptic area per pm3 of terminal volume ranged from

0.51 to 1.25 with a mean of 0.93 for the five animals (Table 2). It is clear that, in

relation to terminal volume, synaptic area is fairly high.

C. Dense bars

Dense bars are sites for the release of neurotransmitter from nerve

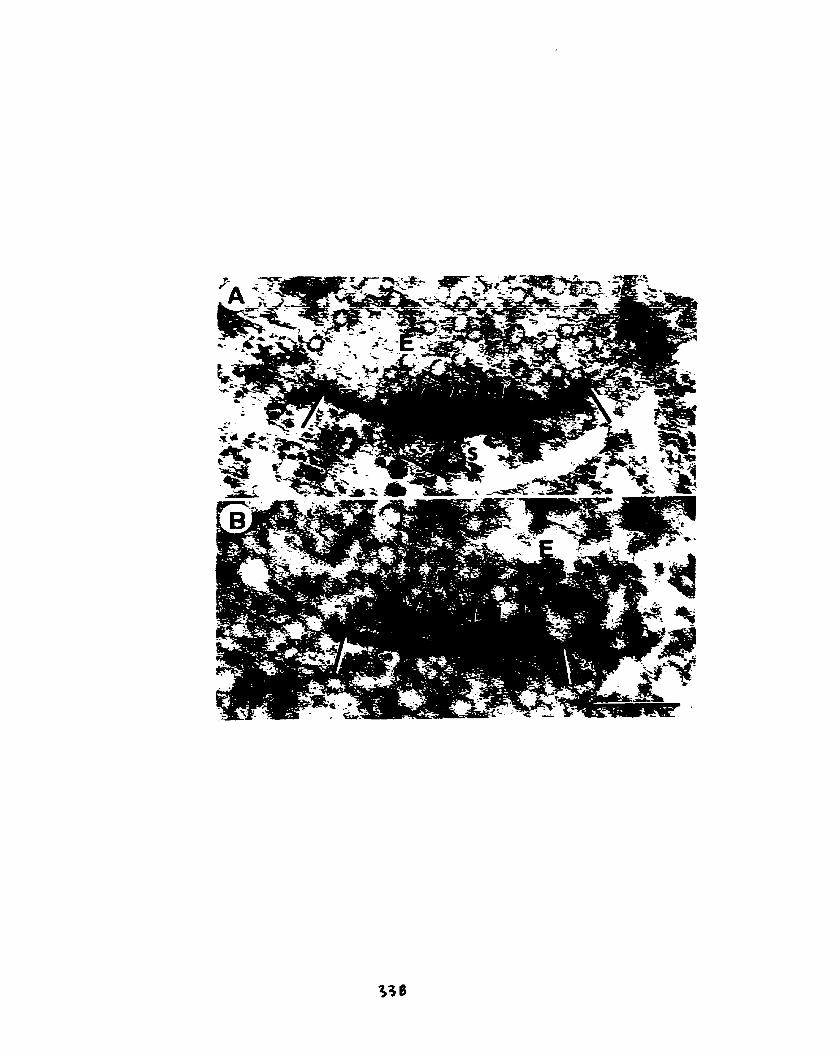
terminals and were obsewed in many of the synapses in al1 five animals (Figs. 2, 3).

Clusters of clear synaptic vesicles were often obsewed surrounding dense bars; we

have captured an omega shaped profile directly adjacent to a dense bar in a thin

section from animal #5 (Fig. 28) which is indicative of clear vesicle exocytosis (Pearce

et al., 1986). Many studies have emphasized the importance of dense bar properties,

especially dense bar number, length, and spacing between dense bars, in detemining

the initial release of neurotransmitter from a nerve terminal (Atwood and Wojtowicz,

1986; Atwood and Cooper, 1996). These parameters were examined in the present

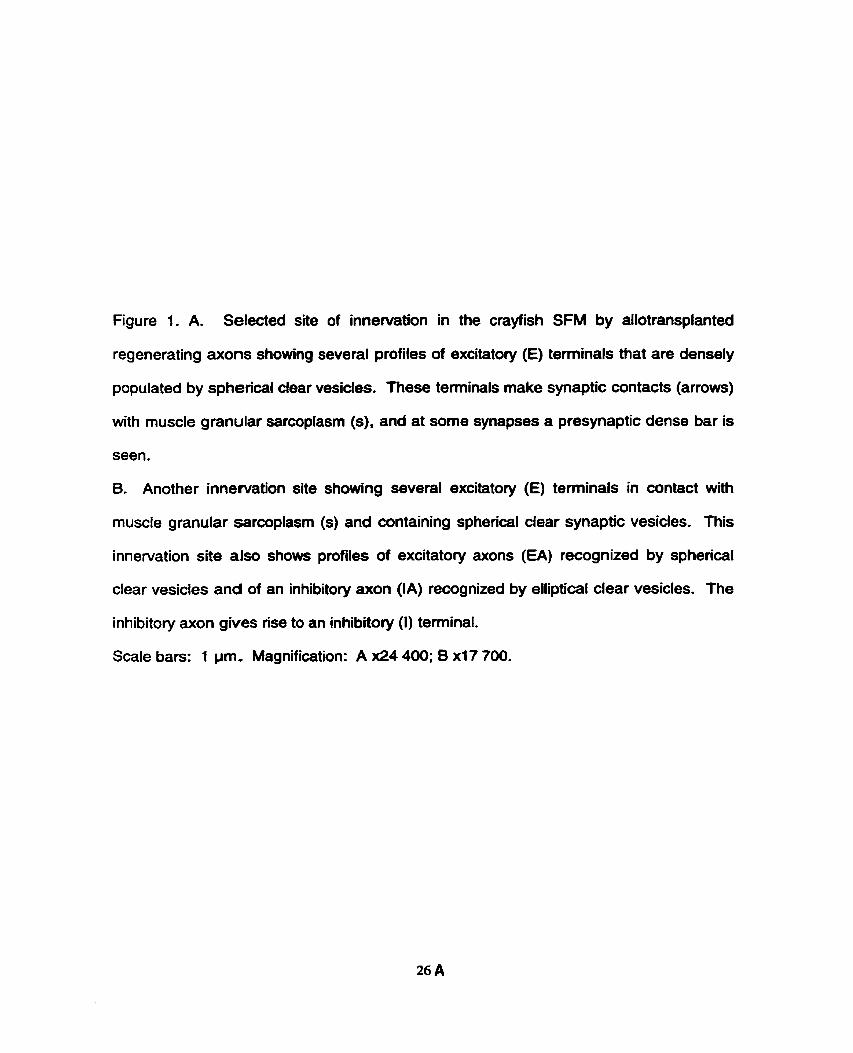
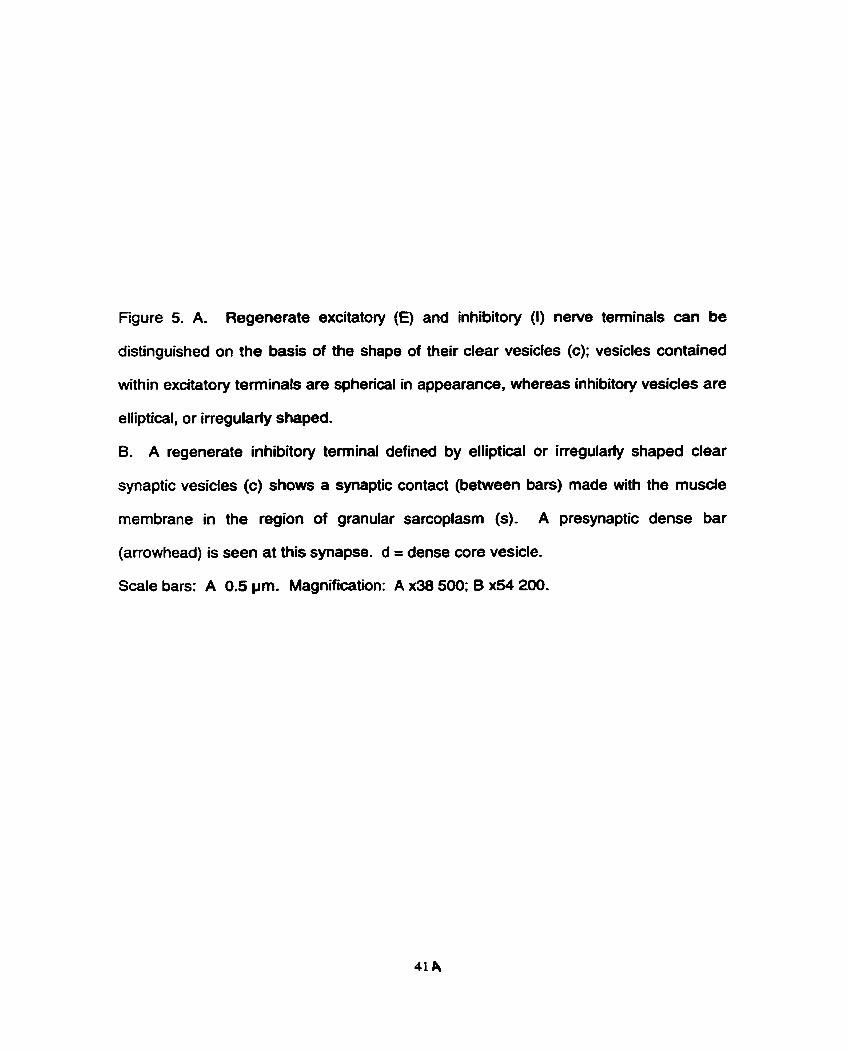
Figure 3. A, B. Regenerate excitatory (E) terminais with spherical clear vesicles,

making synaptic contact (between bars) with muscle membrane in the region of

granular sarcoplasm (s). These synapses display several closely-spaced presynaptic

dense bars (arrowheads).

Scale bar: 0.25 Pm. Magnification: x83 300.

study through a quantitative analysis of dense bars idenüfied in al1 fully sectioned

synapses in the fnre animals (Table 3). Each of the f i e animals housed between 79

and 187 dense bars in total (across al1 synapses), which depicts a fairly wide variance

arnong animals possibly due to differences in the size and extent of the nerve teminal

region examined.

The mean dense bar length for al1 fully sectioned dense bars in the

regenerated excitatory nerve terminals was very close to 0.1 pm (Table 3) and found

not to Vary significantly across the five animals. This aflowed for an examination of the

nurnber of dense bars per synapse as a comparative measure for the f i e animals.

The mean across the f i e animals analyzed was 2.23 I 0.36 dense bars per synapse,

with animal #7 possessing a significantly lower mean (1 -74 I 1.52 dense bars per

synapse) than the other four animals (range of 2.1 3 I 1.57 to 2.70 t 1.80).

To compensate for differences in individual synaptic areas, the number

and length of dense bars per pm2 of synaptic area were also calculated (Table 3). For

the number of dense bats per pm2 of synaptic area, the range across the five animals

was from 4.4 (animal #8) to 7.3 (animal #7) with a mean of 5.7 across the five animals.

Dense bar length per unit synaptic area exhibited a narrower range, and varied from

0.44 prn (animal #8) to 0.67 Pm (animals #2, 5) with a mean of 0.56 Fm for the five

anirnals studied.

To take nerve terminal volume into account, the number of dense bats per

prn3 of terminal was also examined for each animal; the values ranged from 3.3

(animal #2) to 9.1 dense bars per unit volume (animal #7) (Table 3). Similariy, dense

bar length per pm3 of terminal was calculated to assess the amount of dense bar

material present per unit volume. The values ranged from 0.34 pm (animal #2) to 0.83

pm (animal #7), mirroring the pattern observed for number of dense bars per unit

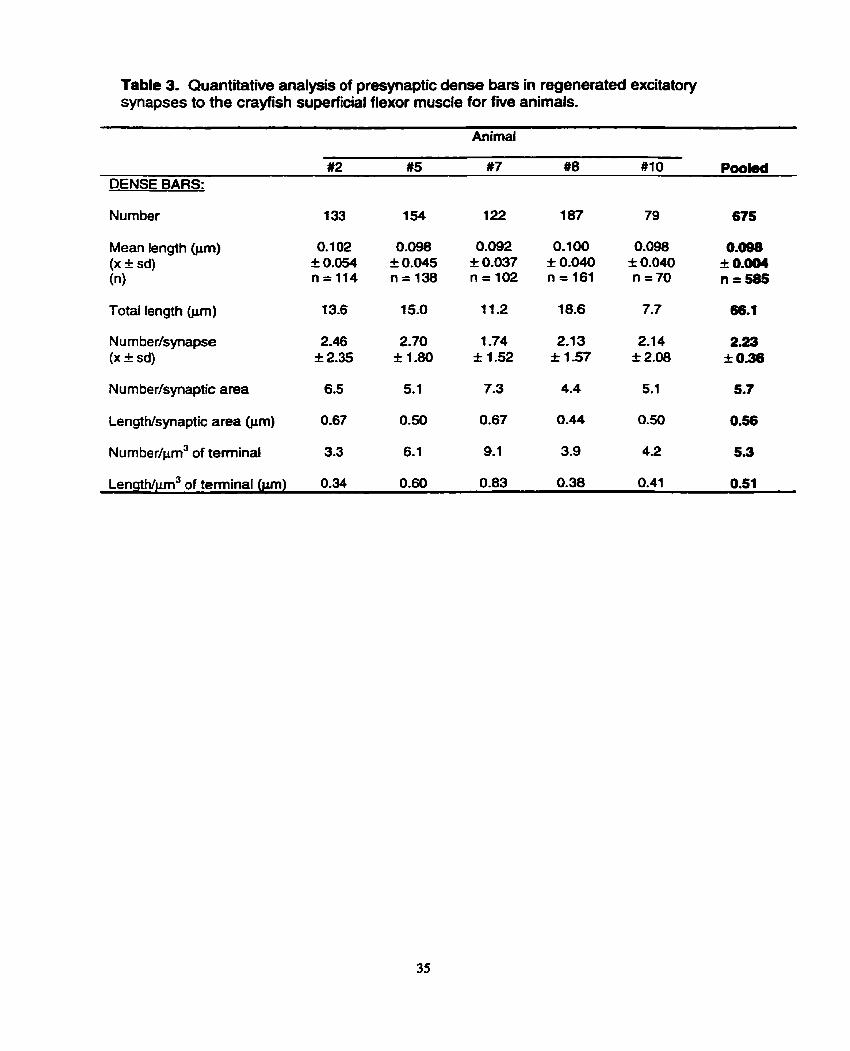
Table 3. Quantitative analysis of presynaptic dense bars in regenerated excitatory synapses to the crayfish superficial flexor muscle for five animals.

Animal

#2 #5 #7 #8 #1 O P w k d DENSE BARS:

Number 1 33 1 54 1 22 187 79 675

Mean length hm) (X f sd) (n)

Total fength (pm) 13.6 15.0 11.2 18.6 7.7 66.1

Number/synaptic area 6.5 5.1 7.3 4.4 5.1 5.7

LengtNsynaptic area (pm) 0.67 0.50 0.67 0.44 0.50 0.56

~umbedprn~ of terminal 3.3 6.1 9.1 3.9 4.2 5.3

~ength/pm~ of terminal (jm) 0.34 0.60 0.83 0.38 0.41 0.51

volume. Interestingly. the number of dense bars per unit volume and the length of

dense bars per unit volume were significantly higher for animal #7. These findings can

be understood by realizing that the number of dense bars per synapse for this animal

was approximately 20% lower than the overall rnean, whereas the mean terminal

cross-sectional area was approximately 40% smaller than the average terminal.

Furthermore, since dense bar length is statistically similar across the five animals,

animal #7 also exhibits a significantly higher dense bar length per unit terminal volume

than the other four animals (Table 3).

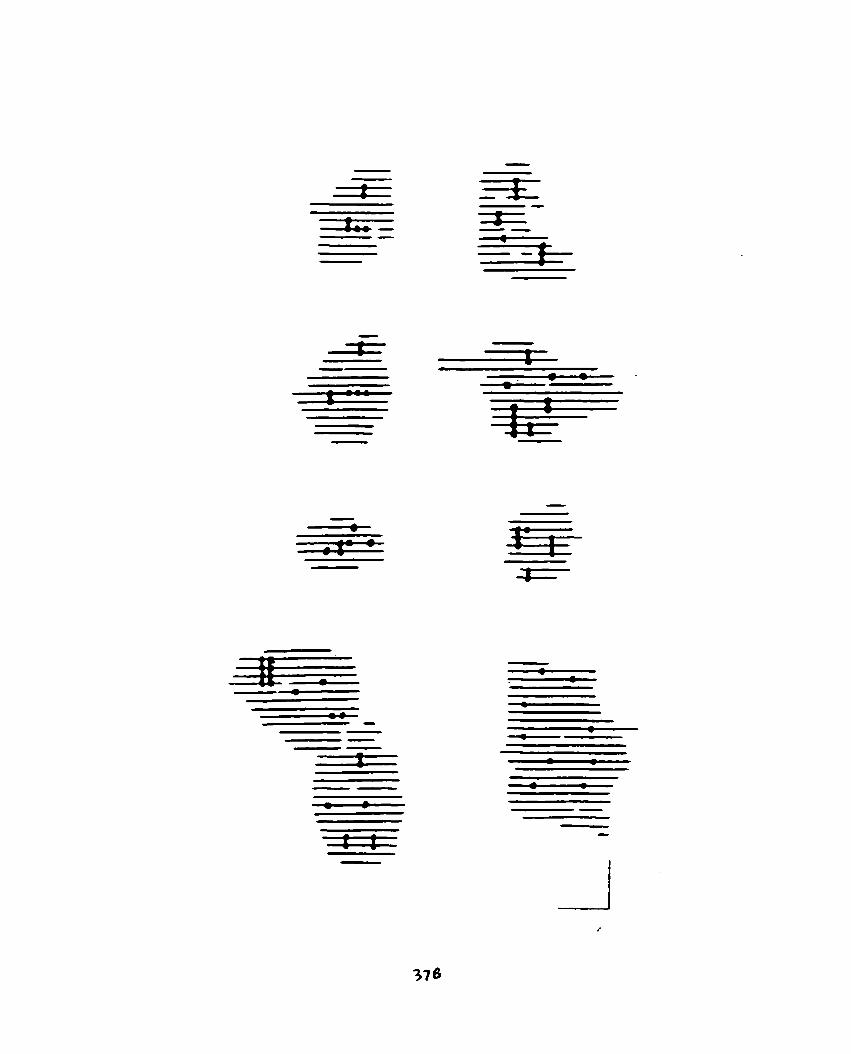
A closer examination of the number of dense bars per synapse showed

wide variance (Table 4). ranging from synapses lacking a dense bar to a synapse in

animal #2 that housed 12 distinct dense ban over its 1.200 pm2 synaptic area.

Synapses with multiple dense bars convey a sense of complexity that is more readily

appreciated by viewing them in two-dimensional reconstruction. Selected examples of

such synapses seen in Figure 4 highlight this complexity and show that most possess

dense bars of variable length, although a few had primarily small dense bars. Figure 3

displays examples of synapses with four distinct dense bars on a single thin section.

Synapses with multiple dense bars are more potent releasers of neurotransmitter

molecules because they have more sites for vesicle docking and fusion, more calcium

channels, and a greater Iikelihood that calcium macrodomains will overlap (Cooper et

al., 1996). We therefore categorized synapses based on the number of dense bars

they possess (Table 4) and found that only a small percentage (between 5.3% and

22.9% with a mean of 14.2%) lacked a dense bar. Thus, the overwhelming majority of

synapses possessed active zones. Among these, a substantial number had a single

dense bar (between 24.3% and 44.3% with a mean of 30.4% of al1 synapses), and a

few synapses possessed two dense bars (between 15.7% and 21.6% with a mean of

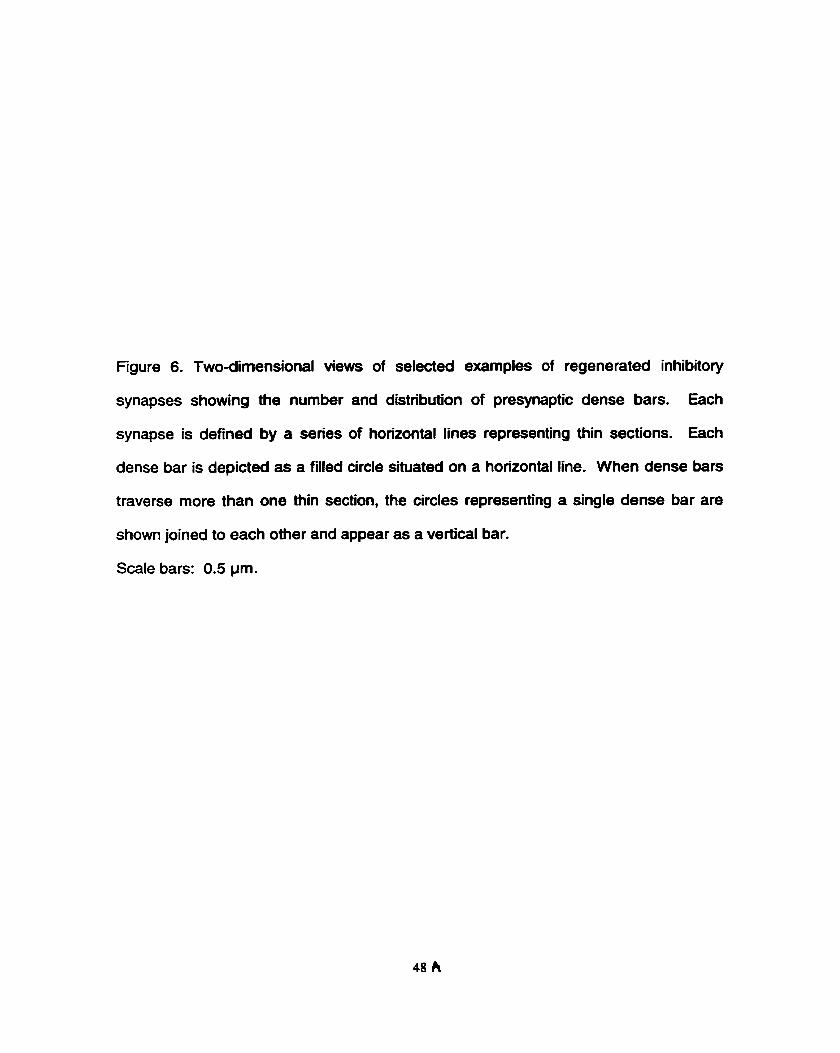
Figure 4. Two-dimensional vie- of selected examples of regenerated excitatory

synapses showing the number and distribution of presynaptic dense bars. Each

synapse is defined by a series of horizontal lines representing thin sections. Each

dense bar is depicted as a filled circle situated on a horizontal line. When dense bars

traverse more than one thin section, the circles representing a single dense bar are

shown joined to each other and appear as a vertical bar.

Scale bars: 0.5 Pm.

Table 4. Quantitative analysis of dense bars in regenerated excitatory synapses to the crayfish superficial flexor muscle for fnre animals.

Animal

#2 #5 #7 #8 #l O Poolsd O/O SYNAPSES W ITH:

O dense bars 16.7 5.3 22.9 4.5 21.6 14.2

1 dense bar 25.9 26.3 31 -4 44.3 24.3 30.4

2 dense bars 20.4 15.8 15.7 17.0 21 -6 18.1

3 dense bars or more 37.0 526 30.0 34.1 32.4 37.2

SIMPLE / COMPLEX SYNAPSES:

% simple synapses 42.6 31.6 54.3 48.8 45.9 44.6 (0-1 dense bar)

% complex synapses 57.4 68.4 45.7 51 -2 54.1 55.4 (2 or more dense bars)

PAIRED DENSE BARS:

O h of paired dense bars 39.8 39.6 37.7 14.4 29.1 32.1 (separated by I 0.2 pm)

% of synapses with 40.7 38.6 25.7 t 4.8 21 -6 28.3 paired dense bars

18.1 %). There was a higher percentage of synapses with three or more dense bars

(37.2%) than synapses with zero, one or two dense bars. Therefore, a large

proportion of synapses possessed multiple dense bars and this can be appreciated if

the synapses are categorized as simple and complex; simple synapses are those with

0-1 dense bar while complex ones are those with 2 or more dense bars (Cooper et al.,

1995b). As Table 4 reveals, there are more complex synapses than simple ones in

regenerated excitatory temiinals in four of the five animals, with animal #7 being the

exception. There was a range from 45.7% complex synapses for animal #7 to a high

of 68.4% of these synapses for animal #S.

Figure 4 also illustrates that dense bars can be veiy closely spaced and

that such close spacing may facilitate transmitter release through the overlapping of

adjacent calcium macrodomains. Previous studies have demonstrated that 0.2 Pm is

the maximum distance for dense bar interaction to occur (Cooper et al., 1996).

Therefore, adjacent dense bars separated by l e s than or equal to 0.2 pm can be

considered an interacting pair. The dense bar spacing analysis revealed that the

percentage of al1 dense bars capable of interacting with an adjacent dense bar varied

from 14.4% (animal #8) to 39.8% (animal #2), with a rnean of 32.1% (Table 4).

Wojtowicz et al. (1994) found that only complex synapses were active at low

frequencies of stimulation; synapses with closely spaced pairs of dense bars are likely

recruited first at such frequencies. Thus, the percentage of synapses with at least one

closely spaced pair of dense bars was calculated and found to range from 14.8%

(animal #8) to 40.7% (animal #2), with a mean of 28.3% (Table 4). Thus, more than

one-fourth of al1 synapses identified in the current study have a closely spaced pair of

dense bars that likely interact to enhance transmitter release.

Il. INHIBKORY INNERVATION

A Nerve terminal*

Regenerated inhibitory nerve teminals were identified on the basis of the

shape of their clear synaptic vesicles; research performed by Atwood and Morin

(1 970), and Atwood et al. (1 972) found that inhibitory clear vesicles appear elliptical

upon aldehyde and osmium fixation, whereas excitatory clear vesicles appear

spherical (Figs. 1A, 5A). In my study, inhibitory nerve tenninals were not as prevalent

as their excitatory counterparts. Each area of innervation had between zero and two

inhibitory newe terminal profiles on any given section, whereas the same sections had

between three and six excitatory nerve terminal profiles. Furthemore, the five anirnals

studied yielded a total of 21 inhibitory terminals, but yielded 83 excitatory terminals, an

approximately 4-fold difference. ln hibitory newe terminals were found primarily at the

periphery of muscle fibers, and were often located adjacent to excitatory newe

terminals (Fig. 1 A, 5A).

There was a wide variance in mean cross-sectional area of regenerated

inhibitory newe terminals from 0.15 I 0.08 pm2 (animal #8) to 1 .O6 I 0.35 prn2 (animal

#2) (Table 5). The regenerate inhibitory nerve terminals, similar to their excitatory

counterparts, appeared to have more of their volume occupied by clear vesicles than

dense vesicles or mitochondria. The volumetric composition of these terminals was

analyzed and revealed that mi le 15.6% to 37.5% of inhibitory terminal volume in four

of the five animals was occupied by clear vesicles (mean of 19.9%), only 1 .O% to 4.3%

was occupied by dense vesicles (Table 5). The volume of terminal occupied by

mitochondria exhibited a much wider range (from 0% to 11.1% arnong the five

animals), but the mean was a relatively low 6.0% of terminal volume. The

Figure 5. A. Regenerate excitatory (E) and inhibitory (1) nerve terminals can be

distinguished on the basis of the shape of their clear vesicles (c); vesicles contained

within excitatory terminals are spherical in appearance, whereas inhibitory vesicles are

elliptical, or irregularly shaped.

B. A regenerate inhibitory terminal defined by elliptical or irregularly shaped clear

synaptic vesicles (c) shows a synaptic contact (between bars) made with the muscle

membrane in the region of granular sarcoplasm (s)- A presynaptic dense bar

(arrowhead) is seen at this synapse. d = dense core vesicle.

Scale bars: A 0.5 Pm. Magnification: A x38 500; B x54 200.

Table 5. Quantitative analysis of regenerated inhibitory nerve tenninals to the crayfish superficial flexor muscle for five animals.

m #5 #7 #8 #IO Pookd TERMINALS:

Number 5 1 6 7 2 21

Mean cross-sectional 1.06 0.96 0.29 0.15 0.39 0.59 area @un2) (x * sd) f 0.35 i: 0.1 4 f 0.08 i 0.35 ; 0.40

Mean volume m3) 1.92 1 .a0 0.57 0.1 9 1 .O5 1.11 (X f sd) f 0.76 f 0.48 f 0.14 1 1 .32 i 0.75

Total volume 9.6 1.8 3.4 1.4 2.1 18.3

% COMPOSITION OF: - Clear vesicles 5.6 37.5 18.5 22.4 15.6 19.9

Dense vesicles 1 .O 4.3 3.8 2.4 3.7 3.0

Mitochondna O 11.1 7.0 3.0 9.0 6.0

Axo~lasm 93.4 47.2 70.6 72.1 71 -7 71 .O

mitochondria, found in most, but not all, of the nerve terrninals, were simple and

unbranched in most cases.

B. Synapses

Regenerated inhibitory nerve teminals also made synaptic contacts with

muscle fibers; their synapses, however, appeared to have a narrower synaptic cleft

and be less densely stained than excitatory synapses (Fig. SB). Between 2 and 17

inhibitory synapses were identïfÏed for each animal to yield a total of 43 synapses

(Table 6). The mean synaptic areas, which varied from 0.21 1 I 0.146 pm2 (animal #8)

to 0.668 i 0.360 pm2 (animal #5), were found to be statistically different only when

comparing animal #5 to animal #8 (Table 6). The variance is exemplified by the fact

that individual synaptic areas ranged from as low as 0.059 pm2 (animal #IO) to as high

as 2.290 pm2 (animal #2). The synaptic area per terminal length and volume was also

calculated and showed wide variation among the five animals.

C. Dense bars

Dense bars with vesicles clustered around them were frequently identified

in inhibitory synapses (Fig. 56). Dense bar quantification yielded between 6 and 34

dense bars in each of the five animals (Table 7). An analysis of dense bar length was

then performed; the mean dense bar length was 0.097 I 0.015 pm, but there was a

signifiant difference between animal #2 and #IO. Specifically, animal #IO had the

lowest mean dense bar length (0.075 I 0.014 pm), whereas animal #2 had the highest

mean among the five animals (0.1 12 0.040 ym). Since the number and size of

inhibitory teminals varied widely between animals, the number of dense bars per

synapse was calcufated for each synapse in each of the five animals. The mean

Table 6. Quantitative analysis of regenerated inhibitory synapses to the crayfish superficial flexor muscle for f i e animals.

Animal

#2 #5 #7 #8 #IO Pwkd SYNAPSES:

Number 12 2 17 7 5 43

Numberfpm of terminal 1.34 1 .O7 1 -71 1 .O1 1.24 1 .n

~ u r n b e r / v ~ of terminal 1 -25 1.11 5.00 5.00 2.38 2.95

Mean area (lun2 ) 0.573 0.660 0.290 0.21 1 0.547 0.414 (X k sd) 10.639 i 0.360 * 0.259 k 0.146 i 0.626 f: 0.470

Total area ()un2 ) 6.9 1.3 4.9 1.5 2.7 17.3

Aredpm of terminal @m2) 0.75 0.72 0.48 0.1 8 0.53 0.53

~ r e d ~ r n ~ of terminal @m2) 0.72 0.74 1.44 1 .O6 1 -30 1 .O5

Table 7. Quantitative analysis of presynaptic dense bars in regenerated inhibitory synapses to the crayfish superficial flexor muscle for fwe animals.

Animal

#2 #5 #7 #8 #1 O Poolad DENSE BARS:

Number 34 6 17 10 10 TI

Mean length (pm) (X f sd) (n)

Total length (pm) 3.8 0-6 1.5 1.1 0.8 7.8

Numberlsynapse (X i sd)

Numbedsynaptic area 4.9 4.6 3.5 6.7 3.7 4.7

LengtNsynaptic area (pm) 0.55 0.46 0.31 0.73 0.30 0.47

~ u m b e r / ~ r n ~ of terminal 3.5 3.3 5.0 7.1 4.8 4.7

~ e n g t h / ~ m ~ of terminal (pm) 0.40 0.34 0.44 0.76 0.36 0.46

number of dense bars per synapse for each of the five animals was statistically similar,

and ranged from 1.00 I 1.58 (animal #7) to 3.00 * 1.41 (animal #5), with an overall

mean of 2.05 0.86 dense bars per synapse across al1 animals.

To standardize for the wide variation in synaptic area, both the number

and length of dense bars per pm3 of newe terminal were calculated (Table 7). The

range for the number per unit volume was from 3.3 (animal #5) to 7.1 (animal #8).

Although animal #5 had the highest mean number of dense bars pet synapse, it had

the lowest number of dense bars per pm3 of terminal. Dense bar length per unit

volume ranged from 0.34 pm (animal #5) to 0.76 pm (animal #8) with a mean of 0.46

pm and followed an inter-animal trend similar to that of the nurnber of dense bars per

unit terminal volume.

The inhibitory innervation was examined more closely in terrns of the

number of dense bars per synapse (Table 8). It is clear frorn Table 8 that there was

tremendous variability, presumably because of a fairly small sample size, in several of

the animals (e.g. 6 dense bars in animal #5 and 10 each in animals #8 and #IO). The

cumulative value from al1 five anirnals shows that approximately one-fifth of the

synapses lack a dense bar, one-fifth have a single dense bar, and almost one-quarter

have two dense bars. Regenerated synapses possessing three or more dense bars

are the most numerous, comprising more than one-third of al1 synapses. Reclassifying

synapses as simple (with 0-1 dense bar) or cornplex (with 2 or more dense bars)

shows that 39.7% of the synapses are simple and 60.3% are complex. A two-

dimensional reconstruction of some selected complex synapses provides a visual

insight into their complexity (Fig. 6).

Close spacing (I 0.2 pm) between dense bars may facilitate transmitter

release via overlapping of adjacent calcium macrodomains. An analysis of such paired

Table 8. Quantitative analysis of dense bars in regenerated inhibitory synapses to the crayfish superficial flexor muscle for fwe animals.

Animal

m #5 #7 #8 #1 O Poolsd O h SYNAPSES WiTH:

O dense bars 16.7 O 58.8 14.3 20.0 22.0

1 dense bar 8.3 O 17.6 42.9 20.0 17.8

2 dense bars 25.0 50.0 5.9 28.6 20.0 25.9

3 dense bars or more 50.0 50-0 17.7 1 4-3 40.0 34.3

SIMPLE / COMPLU( SYNAPSES:

% simple synapses 25.0 O 76.4 57.2 40.0 39.7 (0-1 dense bar)

% complex synapses 75.0 100 23.6 42.8 60.0 60.3 (2 or more dense ban)

PAIRED DENSE BARS:

O h of paired dense bars 55.9 83.3 41.2 20.0 40.0 48.1 (separated by I 0.2 prn)

O h of synapses with 50.0 50.0 17.6 14.3 40.0 34.4 paired dense bars

Figure 6. Two-dimensional views of selected examples of regenerated inhibitory

synapses showing the number and distribution of presynaptic dense bars. Each

synapse is defined by a series of horizontal lines representing thin sections. Each

dense bar is depicted as a filled circle situated on a horizontal Iine. When dense bars

traverse more than one thin section, the circles representing a single dense bar are

shown joined to each other and appear as a vertical bar.

Scale bars: 0.5 Pm.

dense bars was undertaken for the inhibitory synapses (Table 8). The percentage of

the paired intaracting dense bars varied widely from 20.0% in animal #8 to 83.3% in

animal #5 with a mean of 48.1% for the five animais. When the interacting paired

dense bars were considerd in the context of synapses, my analysis revealed that a

substantial percentage of synapses possessed interacting pairs; the range was from

14.3% to 50.0%. with a mean of 34.4%.

D. Presynaptic inhibition

Contacts between adjacent excitatory and inhibitory axons were identified

in two of the five anirnals studied (Fig. 7). The intemembrane space between the

excitatory and inhibitory axons did not display a pronounced density; this finding is in

agreement with previous characterizations of axo-axonal contacts (Atwood and Morin,

1970). At these axo-axonal contacts, the dense bar, with elliptical clear vesicles

clustered around it, was situated on the inhibitory axon membrane. Hence, the

synaptic contact is from the inhibitory axon to the excitatory axon (Fig. 7). Such a

contact is representative of presynaptic inhibition (Atwood and Wojtowicz, 1986).

Figure 7. A, B. Two consecutive serial micrographs showing an excitatory (E) newe

terminal (with spherical ckar vesicles) abutting an inhibitory (1) nerve terminal (with

elliptical clear vesicles). A putative synaptic contact frorn the inhibitory to the excitatory

terminal is indicated by the dense bar (arrow) situated on the inhibitory side, although

synaptic membranes are not clearfy defined. Such a contact would suggest

presynaptic inhibition.

Scale bars: 0.25 Pm. Magnification: x56 300.

DISCUSSION

The present study of regenerated nerve terminals from an allotransplanted

phasic newe on the tonic SFM in crayfish was undertaken with the aim of

characterizing the fine structure of the newe terminals, as well as their synapses and

active zones. Electrophysiology of these regenerated newe terminals was performed

by Krause et al. (1998), who showed that the transplanted nerve functionally

innewated the muscle fibers, since stimulation of the regenerated newe produced

EPSPs. Their study also showed that the two to three excitatory axons innervating

individual muscle fibers gave rise to some very large (25 mV) EPSPs reminiscent of

phasic motor axons in the deep abdominal flexor muscles in crayfish (Kennedy and

Takeda, 1965a). This view was supported with the finding that, at 1 Hz stimulation, the

mean size cf the regenerated EPSP was 8.01 * 7.08 mV (n=102) when the

allotransplanted nerve was the phasic branch, compared to a mean EPSP of 2.3 I

1.41 mV (n=103) when the allotransplanted nerve was the tonic branch (Krause et al.,

1998). The native tonic innervation of the SFM displayed a mean EPSP size of 2.2 I

0.18 mV (Krause and Velez, 1995). Therefore, Krause et al. (1998) suggested that

phasic type synapses regenerated, at least in ternis of the initial release of transmitter,

when a phasic nerve was allotransplanted to the tonic SFM muscle. In view of these

physiological findings, the present ultrastructural analysis of the regenerated

innervation was undertaken primarily for carroboration.

There is a large body of evidence describing features of phasic and tonic

motor nerve terminals in several different crustaceans, notably crabs, crayfish and

lobster (Atwood and Wojtowicz, 1986; Atwood and Cooper, 1996). My study involves

the tonic superficial flexor muscle system, which is innervated by only tonic

rnotoneurons in the native condition, and only phasic motoneurons in the current

experimental condition. Since there are no electron microscopic data on the phasic

flexor nerve innervating the deep flexor muscle, I used the extensor muscle of the

crayfish limb, which is innervated by both a phasic and a tonic excitatory motoneuron,

as a basis for comparison with my results. Collectively, studies in the extensor muscle

point to at least three structural features that distinguish phasic from tonic tenninals:

nerve terminal rnorphology, mitochondrial volume, and the number of dense bars per

synapse. Each of these variables is examined below and compared using other

studies to detemine if the regenerated terminals have a phasic phenotype.

A. Newe terminal morphology

In crayfish limb muscles that receive both phasic and tonic motoneurons

such as the closer (Lnenicka et al., 1986, 1991) and extensor (King et al,, 1996;

Bradacs et al., 1997) it has been well established that the phasic newe terminals are

thin and filiform in appearance and the tonic terminafs as more stout and varicose. As

a result the tonic axon had a volume four times that of the phasic axon for an

equivalent length of terminal in the crayfish extensor muscle (King et al., 1996). In the

present study between 12 and 22 regenerate terminals were examined for each of the

five animals, and the serial sectioning revealed that they were non-varicose and fairly

thin with a mean cross-sectional area of approximately 0.48 t 0.17 ~ r n ~ . In contrast, in

an ongoing electron rnicroscopic study of regenerated newe terminals to the SFM

arising from a tonic allotransplanted nerve, the terminals are distinctly varicose and

fairly thick with a mean cross-sectional area of 2.67 + 2.28 pm2 (see appendix). On the

basis of these measurements, the tonic regenerate terminals have an almost five-fold

greater cross-sectional area and volume than the phasic regenerate terminals. These

differences in terminal morphology in regenerated phasic and tonic teminals parallel

those of previous studies invokring phasic and tonic terminals and strongly suggest

that the regenerated teminals in the cunent study are phasic.

B. Mitochondrial volume

The most striking difference between phasic and tonic terminals is in the

volume of mitochondria with a 3-5 fold diierence between the two in favor of the tonic.

For instance, King et al. (1 996), using serial section electron microscopy, documented

an approximately three-fold greater mitochondrial volume in the tonic teminals (1 6%)

compared to their phasic (5%) counterparts in the crayfish limb extensor muscle.

Bradacs et al. (1997) found a similar difference in mitochondria using light and

confocal microscopy in the same muscle; the tonic terminals showed 16%

mitochondrial volume and the phasic ones 5%. In the crayfish claw doser muscle,

Lnenicka et al. (1 986, 1991 ) recorded an approximately four-fold higher mitochondrial

volume in tonic terminals compared to the phasic ones. The comparatively high

rnitochondrial content presumably allows tonic motoneurons to stay active for

prolonged periods of time, and the low mitochondrial content of the phasic

motoneurons limits them to fire in brief bursts (Kennedy and Takeda, 1965a.b).

Furthemiore, maintaining an adequate supply of transmitter and sustaining the

process of vesicle recycling requires energy (Atwood, 1976); tonic terminals appear to

be more adapted to meet these energy demands because of the relatively high

prevalence of mitochondria,

In the current study, we examined mitochondrial content, and discovered

that only 5.7% of the regenerated newe terminal volume was attributed to

mitochondrial volume. This value is surprisingly similar to that recorded for the phasic

terminals in the Iimb extensor musde (see above), suggesting that the regenerate

terminals were phasic in nature. In fact, many of these regenerate terminals did not

have any mitochondria over the length that they were sectioned and analyzed.

Furthemore, the mitochondria contained within regenerated terminals were simple and

unbranched, which is in accordance with observations made by Lnenicka et al. (1986)

in phasic terminals to the closer muscle of the crayfish claw. It is interesting to note

that physiological conditioning of the phasic axon in the closer muscle of juvenile

crayfish will alter the phenotype towards a tonic condition including increasing

mitochondrial volume but not to the level of the native tonic terrninal (Lnenicka et al.,

1986). It therefore appears that differences in mitochondrial volume between phasic

and tonic axons represent intrïnsic differences which, via extrinsic influences, may be

altered within Iimits but are unlikely to cross over.

Bearing this in mind, we may anticipate that regenerating nerve terminais

on the SFM from an allotransplanted tonic newe would show a much higher

mitochondrial volume than the phasic regenerate terminals. Preliminary data show this

to be the case as regenerate tonic terminals display 19.2% mitochondrial volume (see

appendix). Thus, the mitochondrial volume of the regenerate terminals in my study

clearfy identifies them as phasic in nature.

C. Dense bars per synapse

Another difference that emerged between phasic and tonic nerve terminals

in the crayfish Iimb extensor muscle examined with serial section electron microscopy

was that phasic synapses possessed nearfy two dense bars per synapse white tonic

ones possessed one (King et al., 1996). In a subsequent study for a small number of

physiologically identified nerve terminals, the number of dense bars per synapse was

found to be similar for phasic and tonic terminals at approximately one per synapse

(Msghina et al., 1998). In the most recent study of such physiologically identified

terminals, the number and length of dense bars were computed for nerve terminal

volume to compensate for variation in synapse size (Msghina et al., 1999). The

number per unit volume of newe terminal was 2.13 for phasic terminals and 0.76 for

tonic terrninals; similady, the dense bar length per unit volume of terminal was 0.26 prn

for the phasic and 0.08 pm for the tonic terrninals. Both parameters display an

approximately three-fold higher amount of active zone materiai per unit volume for

phasic terminals than for their tonic counterparts. Dense bar data from King et al.

(1 996), also involving the extensor muscle, revealed a similar three-fold difference in

the above mentioned parameters.

In my study of regenerating nerve terminals from an allotransplanted

phasic nenre on the SFM, the average number of dense bars per synapse was 2.2 and

this was for a reasonably consistent synapse size among the five animals. However, to

compensate for variability in synapse size, I also calculated the dense bar data based

on terminal volume. The mean number of dense bars per unit terminal volume for

phasic regenerate terminals was 5.3, and the mean dense bar length per unit terminal

volume was 0.51 Pm. In an ongoing study in our lab of regenerated synapses from an

allotransplanted tonic newe to the SFM, we found a more than four-fold difference in

favour of the phasic regenerate synapses compared to the tonic ones when

considering both dense bar number (5.3 for phasic vs. 1.3 for tonic) and length (0.51

pm for phasic vs. 0.12 pm for tonic) per unit volume (unpublished observations).

Furthemore, a cornparison between there two types of regenerate synapses for the

number of dense bars per pm2 of synaptic area (5.4 for phasic vs. 2.3 for tonic) or

dense bar length per pm2 of synaptic area (0.53 pm for phasic vs. 0.19 pm for tonic)

reveals a two- to three-fold difference in favour of phasic regenerate connections.

Clearly, the dense bar characteristics of the regenerated terminals in the current study

help identify these terminals as phasic.

II. STRUCTURAL - FUNCTIONAL CORRELAllONS

My electron microscopie examination of regenerated connections yielded

quantitative data on various structural parameters including terminals, synapses and

their active zones which are Iikely responsible for the initial large release of transmitter

upon low frequency stimulation. In this section, I will attempt to correlate structural

features to synaptic output, because of a large body of evidence in support of such a

correlation. The findings of researchers regarding ultrastructural differences has given

rise to the ustructure-function hypothesis", which States that the probability of a

quantum of transmitter being released (binomial parameter p) is correlated to the

arnount of dense bar matenal present (Walrond and Reese, 1985; Atwood and

Lnenicka, 1 986). The structure-function hypothesis has gained support from many

types of studies. For example, studies of differential transmitter release arising from a

single tonic neuron to the crayfish leg opener muscle have revealed high-output

synapses as containing more dense bar material as compared with their low-output

counterparts (Govind et al., 1994; Cooper et al., 1995b). Further support of the

hypothesis comes from studies involving the vertebrate newous system. At the frog

neuromuscular junctions, the total length of the dense bars correlates with the number

of quanta released by a single nerve impulse (Propst and Ko, 1987). Furthemore, at

lizard neuromuscular junctions, the amount of transrnitter released correlates with the

number of intramembranous particles located at the dense bar (Walrond and Reese,

1 985).

This study examines many of the structural parameters of regenerated

synapses and their active zones to determine their degree of correlation to the large

initial EPSP.

A Synapses

a) area

Since synapses represent the sites of contact between nerve and muscle,

it is intuitive to expect higher output connections to have greater synaptic areas than

their lower output counterparts. However, studies by King et al. (1 996) and Msghina et

al. (1998), comparing the phasic and tonic motoneurons innervating the extensor

muscle of the crayfish leg, found that phasic synapses (higher output), were

significantly smaller than tonic synapses (lower output). This finding is interesting,

since the phasic synapses release 100 to 1000 times more transmitter than their tonic

counterparts (Msghina et al., 1998,1999). Hence, synapse size appears to be

inversely correlated with transmitter output since small phasic synapses release more

transmitter than large tonic synapses, at least for low frequencies of stimulation. My

study found that the regenerated synapses exhibited a mean size of 0.409 t 0.1 11

p2, which is much smaller than the mean sire of 1 .O3 I 1.24 pm2 for tonic regenerate

synapses (see appendix). Thus, the inverse relationship between synapse size and

transmitter output may be present for regenerated synapses as well as for intact ones.

b) number

Previously, it was believed that a greater number of synapses were

required to achieve greater quantal output. This idea stems partially from the fact that

the quantal content at indiiidual phasic synapses is not very high; the closer and

extensor muscles of the crab Pachygapsus yielded quantal values between 0.5 and 3

per phasic synapse upon 1 Hz stimulation (Hubbard et al., 1969). Since phasic EPSPs

are relatively large, the density of innervation and the total number of synapses

activated at low frequencies must be fairly high (Atwood, 1976). Specifically, it was

found that at low frequencies of stimulation, synapses with two or more dense bars

(complex synapses) were activated and subsequentfy released transmitter to yield an

EPSP (Zucker, 1 973; Schikorski and Stevens, 1 997; Msghina et al., 1 998). This idea

has been supported by optical studies using the fluorescent dye FMI-43 to examine

active synapses (Msghina et al., 1995; Quigley et al., 1996).

Furthemore, although Cooper et al. (1995b) found a four-fold greater

quantal output at proximal synapses to the crayfish leg opener muscle when compared

to their central counterparts, the difference was attributed to a higher probability of

release, not to a larger number of proximal synapses. Since numerous studies found

that the number of synapses per pm of terminal was fower in the higher output

systems than in the lower output ones (King et al., 1996; Bradacs et al., 1997; Msghina

et al., 1998). it was concluded that synapse number is not a factor when accounting for

the initial EPSP disparity.

My study also found that the number of synapses per pm of regenerated

terminal was low (comparable to high output connections studied previously).

However, King et al. (1996) found an almost two-fold difference in favour of phasic

connections when comparing the number of synapses per pm3 of terminal, suggesting

that high-output connections make more synaptic contacts per unit volume. The

results of the current study revealed many more (approximately four-fold difference)

synapses per pm3 of terminal in the phasic regenerate connections when compared to

the tonic regenerate ones (see appendix). Thus, even though the quantal output per

individual synapse may be low, the high number of synapses per unit terminal volume

(indicative of high density innervation) coupled with the relatively high percentage of

complex synapses could partially explain the high initial EPSPs recorded. In other

words, both a larger number of synapses and a greater probability of release per

synapse may have a physiological impact.

B. Dense bars

a) length

Much research has focussed on the importance of dense bars to the

process of transmitter release. Dense bar length is a parameter often used to explain

differential transmitter release in high- and low-output connections. Since calcium

channel density has been shown to be constant at both lobster (Walrond et al., 1993)

and crayfish (Govind et al., 1994) synapses, a longer dense bar would be indicative of

a larger number of calcium channels, and would facilitate a greater influx of calcium for

a single impulse (Cooper et al., 1996). Given equal probability of channel opening

during an impulse, the ensuing overlap of adjacent calcium microdomains will

exponentially increase transmitter release (Augustine and Charlton, 1986) and

contribute to EPSP amplitude at low stimulation frequencies.

Studies on proximal / central connections in the leg opener muscle

(Govind et al., 1994), as well as phasic and tonic synapses to the leg extensor muscle

(King et al., 1996) in crayfish have revealed that connections producing higher initial

EPSPs have longer mean dense bar lengths. In the current study, however, the mean

dense bar length was fairly close to 0.1 Pm, a value which is almost identical to that

found in other low-output, or tonic, systems (Cooper et al., 199513; King et al., 1996;

Coulthard, 1998). However, a few very long dense bars (i.e. seven that were 0.25 pm

or longer in length and traversed four serial sections) were identified in three of the f i e

anirnals; dense bars of this length are not found in connections yielding mean initial

EPSPs smaller than the mean regenerate initial EPSPs recorded for this study.

Nonetheless, Our findings do not appear to support the idea that longer dense bars are

required ta enhance initial EPSP amplitude. Similarly, Cooper et al. (1995b) did not

find differences in dense bar lengths between tenninals on proximal (high-output) and

central (low-output) muscle fibers. Msghina et al. (1998), studying the extensor

muscle in the crayfish leg, also found that tonic and phasic dense bar lengths did not

differ significantly.

b) nurnber

Unlike dense bar length data, findings related to the number of dense bars

per synapse found in high- and low-output connections in the crayfish opener muscle

(Govind et al., 1 994; Cooper et al., 1 995b), as weH as in phasic and tonic connections

in the crayfish extensor muscle (King et al., 1996; Msghina et al., 1999) are vety

consistent. These studies have invariably shown that a higher nurnber of dense bars

per synapse is correlated with greater quantal output.

High- and low-output synapses, as mentioned earlier, differ in their

synaptic strength. Studies have shown that central varicosities in the crayfish leg

opener muscle c m have the largest number of synapses while concurrently generating

the lowest quantal output following a single impulse- Further examination uncovers a

relatively low percentage of cornplex synapses (2 or more dense bars) and a higher

percentage of synapses wittiout any dense bars when compared to the higher output,

proximal varicosities (Cooper et al., 1995b). In fact, almost half of the proximal

synapses are of the wmplex variety, whereas the ovennrhelming majority of central

synapses are tenned simple, possessing only a single dense bar, or no dense bar at

al1 (Govind et al., 1994). Similady, my study found that more than half of the

regenerated synapses identified were complex. These findings further support the

importance of complex synapses in enhancing quantal release, resulting in a higher

EPSP recorded in the muscle fibers at low frequencies of stimulation.

Previous studies looked at the percentage of completely sectioned

synapses possessing 3 or more dense bars in both high- and low-output synapses

(Cooper et al., 1995b; King et al., t 996). Cooper et al. (1995b) found a large disparity

in proximal versus central synapses containing 3 or more dense bars (28% and 0.6%.

respectively). Similariy, King et al. (1996) found that 17.3% of phasic synapses,

compared to 2.1% of their tonic counterparts, possessed 3 or more dense bars.

These studies point to the relative complexity of the synapses as a contributor to the

amplitude of initial EPSPs. Larger EPSPs are correlated with a higher percentage of

complex synapses, especially those with 3 or more dense bars. The current study

identified fairly high levels of complex synapses containing 3 or more dense bars

(37.2%), which would suggest that the regenerated synapses were in fact capable of

releasing relatively large amounts of transmitter.

Complex synapses have a higher probability of transmission and likely

admit more calcium per impulse, thereby allowing the nerve ending with more complex

synapses to release more transmitter at low frequencies of simulation (Cooper et al.,

1996). This structural hypothesis has been explored in Orosophila by examining both

the structure and function of the RP3 neuron, which innervates the ventral abdominal

longitudinal muscle 6. In one study, a hypomorphic mutant which depresses

expression of Fasll reduces the number of varicosities at the neutomuscular junction

was examined (Stewart et al., 1996). Synaptic transmission was maintained at a

normal level by what appears to be a compensatory mechanism; individual synapses

were larger and had more dense bars per synapse in the mutant, thereby enhancing

quanta! output. A study conducted by Renger et al. (1997) found that the rutabaga

(rut') mutation, which suppresses the level of cyclic AMP in the nervous systern,

exhibits lower than normal synaptic transmission (Zhong and Wu, 1991), possibly by

hindering the vesicle docking process (Atwood et al., 1997). Again, individual

synapses of this mutant are larger than normal and possess more dense bars. It

appears as if the synaptic structure adapts to synaptic transmission deficiencies by

producing larger synapses of a more complex varisty.

Zucker (1991) illustrated that a single pulse elicits a greatet calcium influx

for synapses housing long, or multiple dense bars, as opposed to small, simple

synapses. Cooper et al. (1995b) further explored the involvement of calcium in

differential transmitter release in high- and low-output connections and found greater

calcium buildup in high-output terminals at low frequencies of stimulation- Higher

calcium entry would be expected to result in a greater mean quanta1 content (Cooper

et al., 1995b). Recent work on rnammalian central synapses has provided evidence

for differences in calcium entry as being responsible for differing probabilities of

transmitter release at individual boutons (Manilow et al., 1994).

Further support of calcium's involvement comes from long terrn adaptation

studies, which show that sustained increases in electrical activity of a phasic terminal

alter its physiology and morphology to those of tonic terminals (Atwood et al., 1985;

Lnenicka et al., 1986, 1991). Calcium influx in the soma is necessary for long tem

adaptation to occur in phasic motoneurons in crayfish (Hong and Lnenicka, 1993).

Nguyen and Atwood (1990) showed that an increase in electrïcal activity caused a

decrease in calcium cunents found in the soma; this change was dependent on protein

synthesis. In other words, certain key proteins rnay be up- or dom-regulated to

suppress calcium cunents upon enhanced electrical activity (Hong and Lnenicka,

1995). A similar result rnay occur at nerve terrninals. Therefore, it seems plausible

that native tonic and phasic neurons have differences in calcium currents, which rnay

partially account for the differences in quantal output. These studies support the idea

that complex synapses, with their relatively high calcium influx upon low frequency

stimulation, are capable of releasing large amounts of transmitter. Thus, a relatively

high proportion of complex synapses, as observed in the current study, would

presumably produce a greater quantal output than systems with a lower percentage of

complex synapses.

c) spacing

A number of mechanisms rnay be responsible for the enhanced

transmitter release probability obsewed in synapses containing multiple dense bars.

For instance, dense bars rnay serve to attract and concentrate vesicles at the active

zone. Alternatively, calcium channels contained within closely spaced dense bars rnay

foster overlapping "calcium domains" (Chad and Eckert, 1984; Simon and Llinas,

1985) upon stimulation induced calcium influx, resulting in higher transmitter release.

Thus, a synapse's structural complexity can impact transmitter release since the

distance between dense bars affects the intraterminal calcium concentration; widely

spaced dense bars would be less likely to interact, and would thereby invoke a lower

calcium concentration, than closely spaced ones (Wojtowicz et a1.,1991, 1994; Cooper

et al., 1995b).

Calcium microdomains are present immediately adjacent to calcium

channels; the intemal calcium concentration falls off rapidly as the distance from the

channel increases (Chad and Eckert, 1984; Simon and Llinas, 1985; Zucker and

Fogelson, 1986). The lateral spread of transient calcium domains around an individual

calcium channel is approximately 100-200nm (Simon and Llinas, 1 985; Zucker and

Fogelson, 1986). In synapses possessing more than one dense bar, there is a range

of separation distances between adjacent dense bars; this distance can be as low as

50 nm (Cooper et al., 1996). When dense bars are separated by 200 nrn (0.2 pm) or

less, the intracellular calcium concentration is greatest at the centre of each dense bar,

and at the midpoint between them. As a result, the calcium concentration will be

enhanced at the edges of the dense bar (the location of synaptic vesicle docking and

release), thereby increasing the transient probability of transmitter release. The extent

of the spatial enhancement of transmitter release relies on the number of calcium

channels involved, and on the concentration of calcium required to induce vesicular

release (Cooper et a1.,1996). Although the mean paired dense bar separation did not

differ significantly between tonic regenerate connections (see appendix) and

regenerate connections from the cunent study, phasic regenerate connections had

over five-fold more (32.1% vs. 6.0%) of their dense bars capable of interacting with an

adjacent dense bar. Such a disparity presumably helps explain tha relatively high

quanta1 output at the phasic regenerate synapses examined in the current study.

Since maximum intracellular calcium concentration is greater at the

midpoint between dense bars and at the centre of each one, quanta1 release may have

been further enhanced in synapses with three closely spaced dense bars. The

interaction between these three dense bars would presumably result in a greater influx

of calcium at low frequencies of stimulation, allowing for enhanced quantal release.

A study by Cooper et al. (1996) indicates that ~y,:zpses with two or more

closely spaced dense bars (complex synapses) have a greater transmitter release

probability than those with zero or one dense bar (simple synapses). Wojtowicz et al.

(1994) showed that complex synapses might correlate to the quantal parameter n at

low stimulation frequencies, since the value for n is consistent with the number of

closely spaced pairs of dense bars. At higher frequencies, the ensuing buildup of

intraterminal calcium (Delaney et al., 1989) may enhance dense bar interactions

through the spread of free calcium and binding with immobile, and possibly mobile,

calcium buffers (Cooper et a1.,1996). Further enhancement of calcium concentration

would serve to facilitate the interaction of more widely spaced dense bars, giving the

nerve an additional mechanism by which frequency could alter synaptic output (Cooper

et al., 1996). In my study, therefore, the number of synapses with one or more closely

spaced pairs of dense bars may represent the number of synapses that are active at

low stimulation frequencies. Approximately one-fourth (28.3%) of al1 phasic

regenerate synapses from the cuvent study are of this variety, compared to only one-

twelfth (8.5%) of al1 tonic regenerate synapses (see appendix), or approximately a

three-fold difference in favour of the higher-output, phasic regenerate connections.

This finding supports the initial EPSP disparity identified in the physiological studies

involving these allotransplant preparations.

The importance of calcium entry at an adjacent dense bar is dependent on

the concentration of calcium necessary to induce transmitter release. Apparently, a

relatively small increase in intracellular calcium concentration is capable of enhancing

transmitter release, even though that increment in calcium concentration could not

directly evoke much release (Delaney et al., 1989). Therefore, it is likefy that a small

additional amount of calcium entering the terminal through an adjacent dense bar

could enhance the probability of transmitter release at the synapse (Cooper et al.,

1996). Thus, in the cunent study, the higher prevalence of interacting dense bars in

regenerate synapses suggests a higher transmitter release than in control synapses,

which did not have as many interacting dense bars.

In this study, I have demonstrated that the differences in quantal output

reside primarily in the probability of synaptic release, rather than in the number of

synapses or the number of active zones. Factors contributing to a higher probability of

release include a greater number of dense bars per synapse and a higher prevalence

of "cornplex" synapses with closely spaced dense bar pairs. In neuromuscular

systems innervated by a single excitatory tonic motor neuron, such as the crayfish leg

opener muscle, such factors are believed to be sufficient in accounting for quantal

output and EPSP disparities between high- and low-output fibers. In systems

innervated by distinct phasic and tonic excitatory motor neurons, however, the 100 to

1000 fold disparity in quantal content at low stimulation frequencies can not be

accounted for by dense bar properties or synapse complexity. Since quantal content

measurements have not been made in the regenerated synapses of a flexor newe

onto a previously denewated tonic SFM, it is difficult to conclude whether the structural

features are capable of fully accounting for the large EPSPs recorded.

C) Other factors involved

The structural features discussed above may be sufficient in accounting

for the large initial transmitter output. However, it is quite possible that other

differences beyond the scope of the cuvent study exist, and these additional factors

may contribute to the large initial EPSP amplitudes. One possibility is the density of

postsynaptic glutamate receptors; a relatively high density at regenerated synaptic

contacts rnay allow more of the released transmitter to bind postsynaptically, thereby

producing a greater EPSP. Another possibility relates to differences in calcium

buffering, which rnay increase the amount of calcium available in the regenerated

teminals. Given the importance of calcium in synaptic transmission, diierences in

buffenng capacities may have a significant impact on quantal output, and hence on

EPSP amplitude. A further possibility involves calcium extrusion rates. Msghina et al.

(1999) found that the calcium decay rate is 2-3 times higher for tonic terminals when

cornpared to their phasic counterparts; as a result, calcium accumulation is

suppressed. A relatively low calcium extrusion rate in regenerated tenninals would

enhance calcium accumulation, thereby increasing quantal output. Elevated calcium

channel sensitivity to calcium may also exist in regenerated tenninals, resulting in a

disproportionately high release of transmitter (Msghina et al., 1999).

III. INHIBITORY INNERVATION

The major focus of these transplant studies was the excitatory innervation,

which was assessed in the first instance by the presence of EPSPs upon stimulation of

the regenerated nerve (Krause et al., 1998). Such electrophysiological detection of

innervation was not, however, obvious for an inhibitory neuron in that hyperpolarizing

postsynaptic potentials were not recorded. The use of hyperpolarizing potential as

indicators of inhibitory innervation is not conclusive since, depending on the muscle

fibers' equilibrium potential for chloride, inhibitory potentials can be depolarizing

(Atwood, 1976). However, the present structural study revealed clear-cut evidence for

inhibitory innervation in the form of nerve tenninals with elliptical clear synaptic

vesicles. Crustacean neuromuscular synapses fixed with aldehydes show distinctive

differences in the shape of their clear synaptic vesicles (Atwood and Wojtowicz, 1986);

excitatory vesicles are spherical and inhibitory ones are elliptical. The presence of

these inhibitory nerve terminals therefore provides data on synapse regeneration of a

distinctly different type of neuron. Hence, it may be instructive to compare these

regenerated inhibitory terminals with their excitatory counterparts.

First, regenerate inhibitory terminals were found in each of the five

allotransplanted preparations, making them a consistent feature of the regenerated

innervation. Such consistency is noteworthy since the target muscle, given a choice of

six transplanted neurons with up to fwe excitors and a single inhibitor, accepted the

single inhibitor each time. This outcome most likely occurs because the muscle has

receptor sites for an inhibitory neuron in addition to those for excitatory axons.

Norrnally, fibers of the SFM receive a single inhibitory neuron and two to three

excitatory axons (Kennedy and Takeda, 1965b; Velez and Wyman, 1978a).

Second, the regenerate inhibitory terminals were fewer in number than

excitatory ones in each of the five preparations. This finding points to the possibility

that a single inhibitory neuron regenerated to the SFM, which is in keeping with its

previous history and with the fact that the transplanted phasic nerve would have

possessed a single inhibitory neuron. However, this conclusion is tentative and

requires physiological verif ication.

Third, the size of the regenerated inhibitory terminals, their mean

mitochondrial volume and number of dense bars per synapse were comparable to

those of their excitatory counterparts, suggesting that a phasic type of inhibitory axon,

analagous to the phasic excitatory axons, had regenerated. Such an idea is in

accordance with previous findings; transmitter release characteristics are similar

between excitatory and inhibitory axons to a given muscle fiber (Atwood and Bittner,

1971).

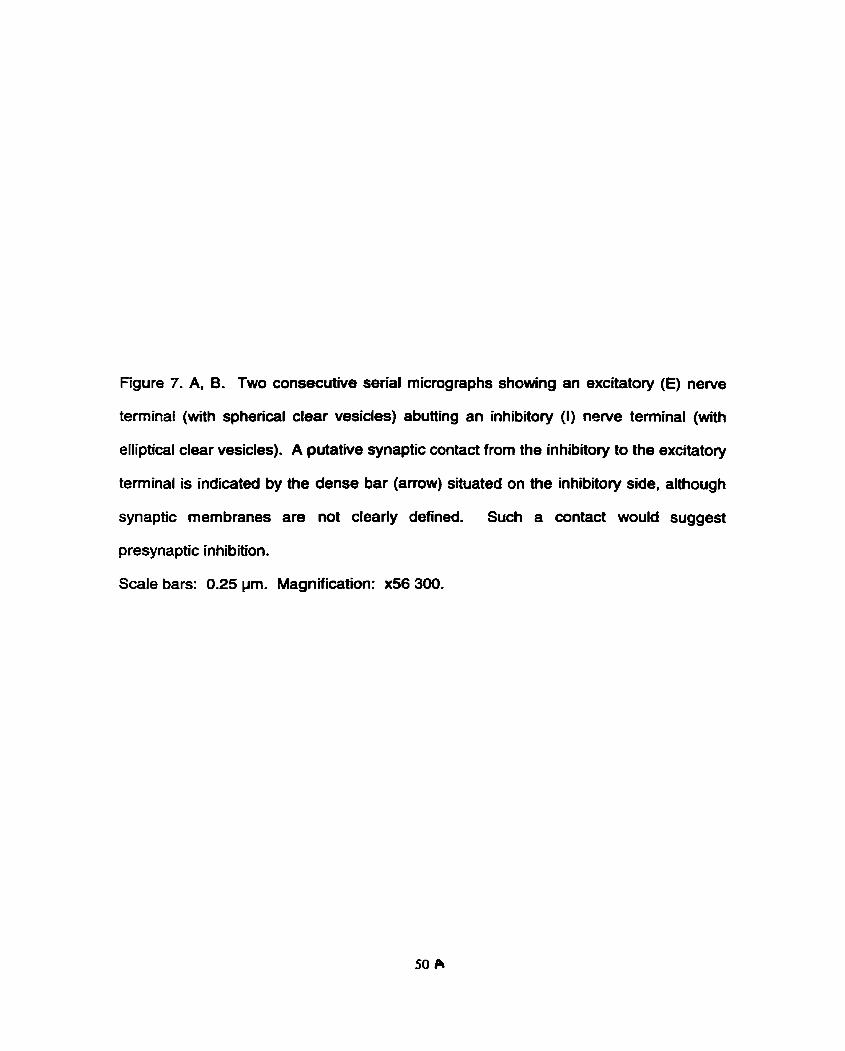
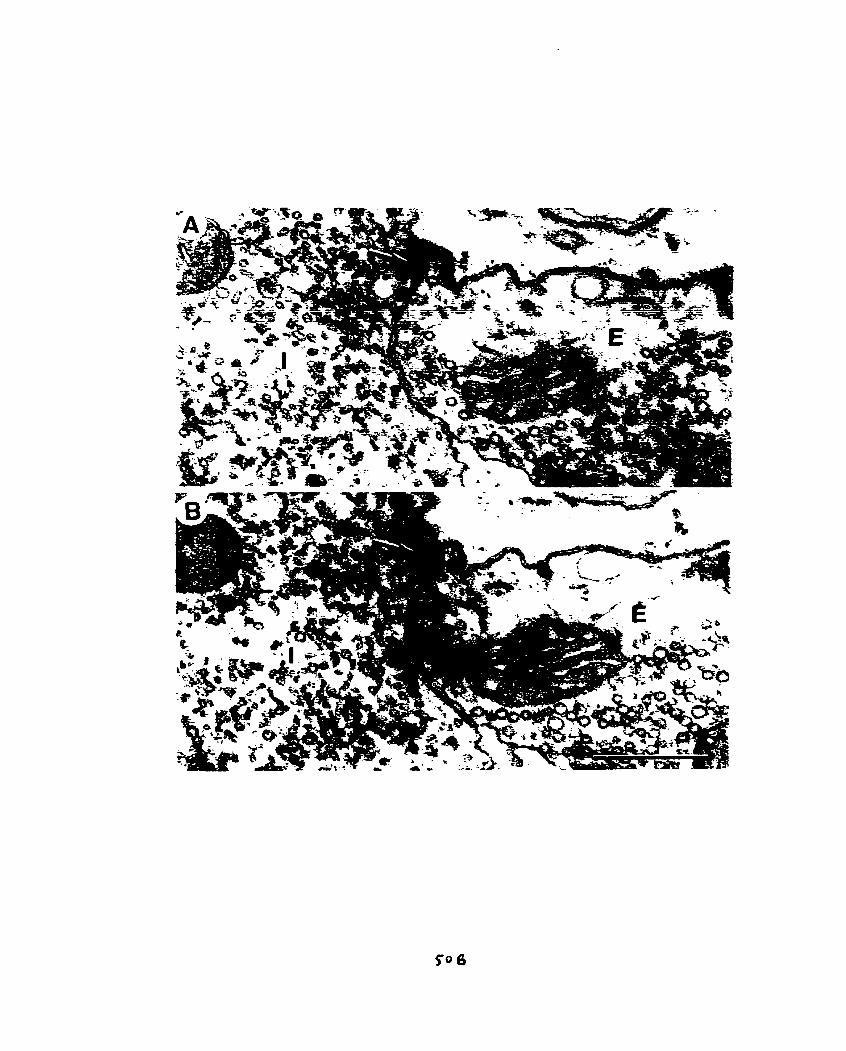
Fourth, inhibitory nerve terminals also make presynaptic contact with

excitatory newe terminals. A functional advantage of presynaptic inhibition is the

conservation of transmitter in excitatory nerve terminals (Bryan and Krasne, 1977).

Furthemore. removal of the inhibition produces a strong synaptic response, since

there is a large readily releasable pool of vesicles that can be drawn upon (Atwood and

Walcott, 1965). Atwood and Morin (1970) foond that axo-axonal synapses polarized

from the inhibitory to the excitatory newe terminal are encountered 10-20 times less

frequently than neuromuscular synapses in the crayfish claw opener muscle.

Physiological examination of these connections at low stimulation frequencies,

however, revealed that presynaptic inhibition is appmximately 10 times more effective

than the more prevalent postsyiiaptic inhibition. Thus, individual axo-axonal synapses

must be at least 100 times more effective than neuromuscular synapses (Atwood and

Morin, 1970). The greater potency of am-axanal contacts may result from the fact that

they are contacting small excitatory nerve terminais instead of much larger muscle

fibers. Therefore, the inhibitory transmitter released upon low frequency stimulation

would have a greater impact on the small excitatory newe terminal membrane

potential than that of a large muscle fiber (Atwood and Morin, 1970). The number of

axo-axonal contacts representative of presynaptic inhibition were seen infrequently in

the current study, yet it is important ta note that these types of contacts, in addition to

al1 of the factors discussed previously, are also capable of controlling the quantal

output from excitatory neuromuscular junctions.

Overall, the presence of regenerated inhibitory innervation shows

robustness of the allotransplanted neural tissue, and alço shows that the muscle target

welcomes, or perhaps even demands, innervation by two different types of axons. In

other words, the muscle has the receptors for both the excitatory and inhibitory axons

and, as a resuit, both types regenerate. Quite possibly, the number of receptor sites

may Iimit the density, and hence the nurnber, of axons regenerating to the SFM.

SUMMARY

1. Crayfish have robust regenerative powers as shown by the fact that after

transecting the superficial flexor newe to the SFM in the abdomen, connecthMy

maps were re-established within 8 weeks (Ely and Velez, 1982). Synaptic

regenerative abilities were further explored through studies involving the

allotransplantation of the superficial flexor newe from a donor animal to a

previously denewated host animal (Krause and Velez, 1995). These studies

showed that the transplanted motoneurons re-established synaptic connectivi

patterns similar to the native patterns.

2. A mismatch experiment involving an allotranspfantation of the phasic flexor nerve

to the previously denewated tonic SFM was attempted (Krause et al., 1998) to

determine if the regenerated connections were tonic in nature (indicating an

instructive retrograde influence), or phasic in nature (indicating that the

regenerating motoneuron follows an autonomous program when forming synaptic

connections). The regenerating newe in these mismatch experiments showed

axons with numerous sprouts indicative of phasic axons; tonic axons have fewer

sprouts. Electrop hysiolog ical studies on experimental animals revealed 3-fold

larger initial EPSPs at low frequencies of stimulation in the regenerated

neurornuscular system when compared to the native SFM system. The EPSP

data strongly suggest that the newly formed connections possess phasic

properties, at least at low frequencies of stimulation.

3. My study examined the ultrastructural properties of the regenerated connections in

these mismatch experiments using thin serial section electron microscopy.

Altogether, fwe animals which had been previously examined with

electrophysiology (Krause et al., 1998) were selected for study. Qualitative

features of regenerated synaptic terminals were typical crustacean-like; nerve

terminals were populated with mostly dear vesicles, a few dense core vesicles and

rnitochondria and possessed well defined synapses, many with one or more dense

bars (active zones). Quantitative analysis of these structural parameters allowed

me to correlate them with the large EPSP and also provided cues as to whether

they were of the phasic type.

4. Previous studies have repeatedly pointed to three primary structural features which

distinguish phasic and tonic terminals: terminal morphology, mitochondrial

volume, and the number of dense bars per synapse. Tonic regenerate terminals

were approximately fie-fold larger than the phasic regenerate terminals examined

in the current study. Phasic regenerate terminals also had fewer mitochondria;

only 5.7% of terminal volume was occupied by mitochondria, compared to a

relatively high 19.2% for tonic regenerate terminals. An examination of the

number and length of dense bars per unit synaptic area as well as per unit volume

revealed No- to four-fold differences between phasic and tonic regenerate

connections. The above mentioned features strongly suggest that the regenerated

newe terminals examined in the current study are phasic in nature.

5. To explore structural-functional correlations in the regenerated system, synapses

and dense bars were examined. Although the phasic regenerate connections had

a smaller mean synaptic area, they had more synapses per unit volume compared

to tonic regenerate connections. An examination of dense bar number and

distribution reveafs that many phasic regenerate synapses were of the complex

variety, and many have 3 or more dense bars. Furthemore, phasic regenerate

synapses had over three-fold more of their dense bars capable of interacting with

an adjacent dense bar when compared to tonic regenerate connections. A

cornparison of the number of synapses possessing an interacting pair of dense

bars revealed a similar trend. These findings collectively support the physiological

finding that the regenerated connections are capable of higher initial transmitter

release than the lower output, tonic connections.

6. Although physiokgical evidence for inhibitory innervation in the form of lPSPs was

not obtained, electron microscopic examination of innervation sites revealed the

presence of inhibitory nerve terrninals. Ultrastructural analysis of the inhibitory

connections revealed key similarities with excitatory connections in newe terminal

morphology, mitochondrial volume and dense bar number per synapse. These

findings suggest that synaptic features of inhibitory innervation are similar to that of

excitatory innervation. lnhibitory nerve terminals also make pre-synaptic contact

with excitatory newe terminals via presynaptic dense bars located on the inhibitory

membrane. Such axo-axonal contacts may represent pre-synaptic inhibition,

which may reduce excitatory impulse activity and help conserve transmitter.

7. In sum, the electrophysiological findings of Krause et al. (1998) of large EPSPs in

regenerated systems were supported by the current ultrastructural analysis.

Although not specifically tested in the mismatch condition, it is quite possible that

connection specificity is maintained by the presence of target derived molecular

cues, which guide regenerated connections to previous sites of innervation. These

cues, however, may have fiffle or no impact on the nature of the regenerated

connections. Thus, an allotransplanted rnotoneuron may use its surroundings to

arrive at the appropriate locations within its novel surroundings, but utilires its

autonomous program to fom synaptic connections.

REFERENCES

Arcaro KF, Lnenicka GA (1 995) lntnnsic differences in axonal growth from crayfish fast and slow motoneurons. Dev Bi01 168:272-283.

Atwood HL (1 976) Organization and synaptic physiology of crustacean neuromuscular systems. Prog Neurobro17:291-391.

Atwood HL (1 982) Synapses and neurotransmitters. In T h e Biology of Crustaceam (H.L. Atwood, and D.C. Sandeman, eds.), pp. 105-150. Academic Press, New York.

Atwood HL, Bittner GD (1971) Matching of excitatory and inhibitory inputs to crustacean muscle f ibers. J Neurophysiol34: 1 57-1 70.

Atwood HL, Cooper RL (1 996) Synaptic diversity and differentiation: crustacean neuromuscular junctions. Invert Neurosci 1 :291-307.

Atwood HL, Govind CK (1990) ActMty-dependent and age-dependent recruitment and regulation of synapses in identified crustacean neurons. J Grp Bi01 153:105- 127.

Atwood HL, Kwan 1 (1976) Synaptic development in the crayfish opener muscle. J Neurobiol7:289-312.

Atwood HL, Lnenicka GA (1986) Structure and function in synapses: emerging correlations. TINS 9:248-250.

Atwood HL, Marin L (1 983) Ultrastructure of synapses with different transmitter- releasing characteristics on motor axon terminais of a crab, Hyas areneas. Cell Ess Res 231 :103-115.

Atwood HL, Morin WA (1 970) Neuromuscuhr and axoaxonal synapses of the crayfish opener muscle. J Ultrastmct Res. 32:351-369.

Atwood HL, Nguyen PV (1 995) Neural adaptation in crayfish. Amer Zoo1 35:28-36.

Atwood HL, Walcott B (1 965) Recording of electrical activity and movement from legs of walking crabs. Can J Zoo1 43:657-665.

Atwood HL, Wojtowicz JM (1 986) Short-terni and long-term plasticity and physiological differentiation of crustacean motor synapses- Int Rev Neurobiol28:275-362.

Atwood HL, Lang F, Morin WA (1972) Synaptic vesicles: selective depletion in crayfish excitatory and inhibitory axons. Science 176:1353-1355.

Atwood HL, Lnenicka GA, Marin L (1985) Morphological responses to conditioning stimulation in a phasic motor axon of crayfish (Procarnbams clarkir). J Physiol (Lond) 365:26P.

Atwood HL, Karunanithi S, Georgiou J, Charlton MP (1997) Strength of synaptic transmission at neuromuscular junctions of crustaceans and insects in relation to calcium entry. lnvert Neurosci 3:81-87.

Augustine GJ, Chariton MP (1 986) Calcium dependence of presynaptic calcium current and post-synaptic response at the squid giant synapse. J Physiol (Lond) 381 :6 1 9-64.

Bittner GD (1 968) Oierentiation of newe tenninals in the crayfish opener muscle and its f unctional significance. J Gen Physiol 51 :731-758.

Bradacs H, Cooper RL, Msghina M, Atwood HL (1 997) Differential physiology and morpho10 y of phasic and tonic motor axons in a crayfish limb extensor muscle. J Ekp Bio 7 200:677-691.

Bryan JS, Krasne FB (1 97ï) Presynaptic inhibition: The mechanism of protection from habituation of the crayfish lateral giant fibre response. J Physiol (Lond) 271 ~369-390.

Chad JE, Eckert R (1 984) Calcium domains associated with individual channels can account for anomalous voltage relations of Ca-dependent responses. Biophys J 45:993-999.

Clernent JF, Taylor AK, Velez SJ (1 983) Effect of a limited target area on regeneration of specif ic neuromuscular connections in the crayfiçh. J Neurophys 49:2l6- 226.

Cooper RL, Hampson DR, Atwood HL (1995a) S aptotagmin-like expression in the motor newe terminais of crayfish. Brarir 4" es 703:214-216.

Cooper RL, Marin L, Atwood HL (1 995b) Synaptic differentiation of a single motor neuron: Conjoint definition of transmitter release, presynaptic calcium signds, and ultrastructure. J Neurosci 1 5:4209-4222.

Cooper RL, Stewart BA, Wojtowicz JM, Wang S, Atwood HL (1995~) Quantal measurement and analysis methoûs compared for crayfish and Drosophila neurom uscular junctions, and rat hippocam pus. J Neurosci Methods. 6 1 :66-79.

Cooper RL, Winslow JL, Govind CK, Atwood HL (1 996) Synaptic structural complexity as a factor enhancing probability of calcium-mediated transmitter release. J Neurophysiol75:2451-2466.

Coulthard R (1 998) The roles of rnotoneurons and their muscle targets in synaptogenesis during regeneration of a foreign transplant. MSc. thesis, University of Toronto, pp. 1-82.

Couteaux R, Pecot-Dechavassine M (1 970) Vesicles synaptiques et poches au niveau des "zones activew de la fonction neuromusculaire. Compt Rend Acad Sci Ser D 271 :2346-2349.

Dahm LM, Landmesser LT (1991) The regulation of synaptogenesis dunng normal development and following activity blockade. Dev Bi01 130:621-644.

Delaney KR, Zucker RS, Tank DW (1989) Calcium in motor nerve terminals associated with posttetanic potentiation. J Neurosci 9:3558-3567.

DeRosa RA, Govind CK (1978) Transmitter output increases in an identifiable lobster motoneurone with growth of its muscle fibers. Nature (Lond) 273:676- 678.

Dudel J, Kuffler SW (1 961 ) Presynaptic inhibition at the crayfish neuromuscular junctions. J Physiol (Lond) 1 55543-562.

Ely P, Velez SJ (1982) Regeneration of specific neuromuscular connections in the crayfish. 1. Pattern of connections and synaptic strength. J Neurophysiol 47~656-665.

Evoy WH, Beranek R (1 972) P hannacoiogical localization of excitatory and in hibito s aptic regions in crayfish slow abdominal flexor muscie fibres. Comp en $am 3:li&l86.

z Evoy WH, Kennedy D, Wilson DM (1 967) Discharge patterns of neurones supplying

tonic abdominal flexor muscles in the crayfish- J Exp Bi01 46:393-411.

Fatt P, Katz B (1 953) The effect of inhibitory nerve impulses on a crustacean muscle f iber. J Physiol (Lond) 1 21 :374-388.

Florey E, Cahiil MA (1982) The innewation pattern of crustacean skeletal muscle. Cell Tissue Res 224527-541.

Gilfary HL, Kennedy D (1 969) Pattem generation in a crustacean motoneuron. J Neurophysiol32:595-606.

Goda Y, Sudhof TC (1 997) Calcium regulation of neurotransmitter release: reliably unreliable? Current Opinion Ce11 Bi0 951 3-51 8.

Goelet P, Castellucci VJ, Schacher S, Kandel ER (1986) The long and short of long- term memory - a rnolecular framework. Nature 322:419-422.

Goransson LG, Hunt WP, Velez SJ (1 98) Regeneration studies on a crayfish neuromuscular system II. Effect of changing the nerve entry point into the muscle field on the gradient of innervation. J Neurobiol 1 9:let -1 52.

Govind CK, Walrond JP (1 989) Structural plasticity at crustacean neuromuscular synapses. J Neurobiol20:409-421.

Govind CK, Atwood HL, Lang F (1973) Synaptic differentiation in a regenerating crab- f im b muscle. Proc Nat/ Acad Sci USA 70:822-826.

Govind CK, Pearce J, Wojtowicz JM. Atwood HL (1 994) "Strong" and "Wear synaptic differentiation in the crayfish opener muscle: structural correlates. Synapse 1 6~45-58.

Harrington CC (1 993) An investigation of structural relationships of the crayfish neuromuscular junctions. M.Sc. thesis, University of Toronto, pp. 1-92.

Heuser JE, Reese TS (1 979) S naptic vesicle exocytosis captured by quick f reezing . F In 'The Neurosciences ourth Study Program," F.O. Schmitt and F.G. Worden, Eds., MIT Press, Cambridge, MA, pp. 573-600.

Heuser JE, Reese TS, Dennis MJ, Jan Y, Jan L, Evans L (1979) Synaptic vesicle exocytosis captured by quick f reezing and correlated with quanta! transmitter release. J Ce11 Bi01 81 :275-300.

Hildebrand JG, Townsel JG, Kravitz €A (1 974) Distribution of acetylcholine, choline, choline acetyltransferase and acetylcholinesterase in regions and single identified axons of the lobster nervous system. J Neurmhem 23:951-963.

Hill RH, Govind CK (1 981 ) Comparison of phasic and tonic synaptic terminals in lobster muscle. Ce11 Tissue Res 221 :303-310.

Hirokawa N, Sobue K, Kanda K, Haraba A, Yorifugi H (1989) The cytoskeletal architecture of the presynaptic terminal and molecular structure of synapsin 1. J Ce11 Bi01 lOû:111-126.

Hong SJ, Lnenicka GA (1993) Long-terni changes in the neuromuscular synapses of a crayfish motoneuron produced by calcium influx. Brain Res 605:121-127.

Hong SJ, Lnenicka GA (1 995) ActMty-dependent reduction in voltage-dependent calcium cuvent in a crayfis h rnotoneuron. J Neurosci 1 535394547.

Hoy RR (1 969) Degeneration and regeneration in abdominal flexor motor neurons in the crayfish. J EXp Zoo1 1 72:219-232.

Hubbard JI, Llinas R, Quastel DMJ (1 969) Electrophysiological Analysis of Synaptic Transmission. Edward Arnold: London.

Hunt W P, Velez SJ (1982) Regeneration of specific neuromuscular connections in the crayfish II. Effect of changes in the target area. J Neurophys 47:666-676.

Hunt WP, Velez SJ (1989a) Regeneration of an identifiable motoneuron in the crayfish 1. Pattems of reconnection and synaptic strength established in normal and altered target areas. J Neurobiol20:703-717.

Hunt WP. Velez SJ (1989b) Regeneration of an identifiable motoneuron in the crayfish II. Patterns of reconnection and synaptic strength established in presence of an extra nerve. J Neurobiol20:718-730.

l ravan i J (1 965) Mem branedepolarisation der Muskelfasern des Offnerm uskels des Flusskrebses auf Nervenreiz und Kaliumapplikation. Expenentia 21 :609-610.

Jahromi SS, Atwood HL (1 974) Three-dimensional ultrastructure of the crayfish neuromuscular apparatus. J Ce11 Bi01 63:599-613.

Jessel TM, Kandel ER (1993) Synaptic transmission: a biochemical and self modifiable forrn of cell-cell communication. Ce1172 / Neuron 10 (suppl):l -30.

Katz B (1966) Nerve, Muscle and Synapse. New York: McGraw-Hill.

Kennedy D, Bittner GD (1 974) Ultrastructural correlates of motor axon nerve regeneration in crayfish. CeIl Tissue Res 148:97-110.

Kennedy O, Takeda K (1965a) Reflex control of abdominal flexor muscles in the crayfish. 1. The twitch system. J Exp Bi01 43321 1-227.

Kennedy D, Takeda K (1965b) Reflex control of abdominal flexor muscles in the crayfish. II. The tonic system. J Exp Bi01 43:229-246.

King MJR, Atwood HL, Govind CK (1 996) Structural features of crayfish phasic and tonic neuromuscular terminais. J Comp New 372:618-626.

Krause KM, Velez SJ (1 995) Regeneration of neuromuscular connections in crayfish allotransplanted neurons. J Neurobiol27:154-1 71.

Krause KM, Pearce J, Govind CK (1998) Regeneration of phasic motor axons on a crayfish tonic muscle: neuron specifies synapses. J Neurophysiol80:994-997.

Krause KM, Pearce J, Velez SJ, Govind CK (1996) Structure of allotransplanted

ganglia and regenerated neuromuscular connections in crayfish. J Neurobid 30:439-453.

Kuffler SW, Yoshikami D (1975) The number of transmitter mofecules in a quantum: an estimate from iontophoretic application of acetylcholine at the neuromuscular synapse. J Physiol (Lond) 251 :465-482.

Linder TM (1 974) The accumulative properties of facilitation at crayfish neuromuscular synapses. J Physiol (Lond) 238223,234.

Llinas R (1 977) In Approaches to the Cell Biology of Neurons, W.M. Cowan and J.A. Ferendelli, Eds. (Society for Neuroscience, Behtesda, MD) vo1.2, pp. 139-1 60.

Uinas R, Sugimori M, Silver RB (1992) Microdomains of high calcium concentration in a presynaptic terminal. Science 256:677-679.

Lnenicka GA, Atwood HL (1 985a) Agedependent long-term adaptation of crayfish phasic motor axon synapses to altered activity. J Neurosci 5:459-467.

Lnenicka GA, Atwood HL (1 985b) Long-terni facilitation and long-temi adaptation at synapses of a crayfish p hasic motoneuron. J Neurobiol 1 6:97-110.

Lnenicka GA, Marin L, Atwood HL (1 986) Morphological transformation of synaptic tenninals of a phasic motoneuron by long-term tonic stimulation. J Neurosci 62252-2258-

Lnenicka GA, Hong SJ, Combatti M, LePage S (1 991) Activity-dependent development of synaptic varicosities at crayfish motor teminals. J Neurosci 1 1 :1040-1048.

Magrassi L, Puwes D, Lichtman JW (1987) Fluorescent probes that stain living nerve terminals. J Neurosci 7: 1 207-1 21 4.

Manilow R, Otmakhov N, Blum KL, Lisman $ (1994) Visualking hippocampal synaptic function b optical detection of Ca ' entry through the Nmethyl-0-aspartate channel. 6 rocNatlAcadSciUSA91:8170-8174-

Meiss DE, Govind CK (1 979) Regional differentiation of neuromuscular synapses in a lobster receptor muscle. J Ekp Bio! 79:99-114.

Msghina M, Charlton MP, Atwood HL (1 995) Differentiation of transmitter release properties and calcium transients in phasic and tonic motor nerve endings of crustacea. Soc Neurosci Abstr 21 : 1 38.1 5.

Msghina M, Govind CK, Atwood HL (1 998) Synaptic structure and transmitter release in crustacean phasic and tonic motor neurons. J Neurosci l8:lW4-l382.

Msghina M, Millar AG, Charlton MP, Govind CK, Atwood HL (1 999) Calcium entry related to active zones and differences in transmitter release at phasic acd tonic synapses. Ce11 Mol Neurosci In press.

Nguyen PV, Atwood HL (1990) Expression of long-terni adaptation of synaptic transmission requires a critical period of protein synthesis. J Neurosci 10:lOgg- 1109.

Nguyen PV, Atwood HL (1994) Altered impulse activity modifies s naptic physiology and mitochondria in crayfish phasic motor neurons. J europhysiol72:2944- 2955.

hl'

Nordlander RH, Sin er M (1972) Uectron rnicroscopy of severed motor fibers in the crayfish. Z 1 elttotsch 1 26:157-181.

Otsuka M, lversen LL, Hall ZW, Kra* EA (1966) Release of amma-aminobutyric acid frorn inhibitory nerves in lobster. Proc Nat1 Acad 8 ci USA 56:1110-1115.

Pamas 1, Atwood HL (1 966) Phasic and tonic neuromuscular s stems in the abdominal

723. 6 flexor muscles of the crayfish and rock lobster. Comp iochem Physiol18:701-

Pearce J, Govind CK, Shivers RR (1 986) lntramembranous organization of lobster excitatory neuromuscular synapses. J Neurocytol 1 5:241-252.

Propst JW, Ko CP (1 987) Correlations between active zone ultrastructure and synaptic function studied with freeze-fracture of physiologically identified frog neuromuscular junctions. J Neurasci 7:3654-3664.

Pumplin DW, Reese TS, Llinas R (1981) Are the resynaptic membrane particles the calcium channels? Proc Nat1 Acad Sci U 8 A 78:7210-7213.

Quigley PA, Cooper RL, Govind CK, Atwood HL (1 996) Recruitrnent of active synapses at the cra ish neuromuscular junction visualized with the fluorescent dye FM 1 -43. Soc C eurosci Abstr 22:309.9.

Renger JJ, Atwood HL, Wu CF (1997) Single-bouton rewrding from the larval neurornuscular junction of Drosqphila CAMP cascade mutants. 38m Annual Drosophila Research Conference.

Rheuben MB (1 985) Quantitative comparison of the structural features of slow and fast neuromuscular junctions in Manduca. J Neurosci 31704-1716.

Roberts WM, Jacobs RA, Hudspeth AJ (1990) Colocalization of ion channels involved in frequency selectivity and synaptic transmission at presynaptic active zones of hair cells. J Neurosci 10:3664-3684.

Robitaille R, Adler EM, Charlton MP (1990) Strategic location of calcium channels at transmitter release sites of frog neuromuscular synapses. Neuron 5773-779.

Schikorski T, Stevens CF (1 997) Quantitative ultrastructural analysis of hippocampal excitatory synapses. J Neurosci t7:5858-5867.

Selverston Al, Remler MP (1 972) Neural geometry and activation of crayfish fast flexor motoneurons. J Neurophysiol35:797-814.

Simon SM, Llinas RR (1 985) Compartmentalization of the submembrane calcium activity during calcium influx and its significance in transmitter release. Biophys J 48:485-498.

Smith SJ, Augustine GJ, Charlton MP (1985) Transmission at voltage-clarnped giant s napse of the squid: evidence for cooperativity of presynaptic calcium action. &oc Nat1 Acad Sci USA 82622-625.

Smith SJ, Buchanan J, Osses LR, Chariton MP, Augustine GJ (1993) The spatial distribution of calcium signals in squid presynaptic terminals. J Physiol (Lond) 472 1573-593.

Stewart BA, Atwood HL (1 992) Synaptic plasticity in a regenerated crayfish phasic motoneuron. J Neurobiol23:881-889.

Stewart BA, Schuster CM, Goodman CS, Atwood HL (1996) Homeostasis of synaptic transmission in D m h i l a with genetically altered newe terminal morphology. J Neurosci 1 630774886.

Takeuchi A (1 976) Studies of inhibitory effects of GABA in invertebrate nervous systems. In =GABA in Newous S stem Functionw (E. Roberts, T.N. Chase, and D.B. Tower, eds.), pp. 255-267. A aven, New York.

Takeuchi A, Takeuchi N (1965) Lacalized action of gamma-butyric acid on crayfish muscle. J Physiol (Lond) 1 77:225-238.

Uchizono K (1 967) lnhibitory s apses on the stretch receptor neurone of the crayf is h. Nature (Lon J" ) 207:642-643.

Velez SJ, Wyman RJ (1 978a) Synaptic connecüvity in a crayfish neuromuscular system. 1. Gradient of innervation and synaptic strength. J Neurophysiol 41 :75-84.

Velez SJ, Wyman RJ (1 978b) Synaptic connectivity in a crayfish neuromuscular system. II. Neive-muscle matching and neive branching patterns. J Neurophysiol41:85-96.

Walrond JP, Govind CK, Huestis SE (1 993) Two structural adaptations for regulating transmitter release at lobster neuromuscular synapses. J Neurosci 13:4831- 4845.

Walrond JP, Reese TS (1985) Strucutre of axon terrninals and active zones at synapses on lizard twitch and tonic muscle fibers. J Neurosci !%Il 1 8-1 1 31.

Wiens TJ (1 982) Srnall systems of neurons: Control of rhythmic and reflex activity. In The Biology of Crustacean (H.L. Atwood and D.C. Sandeman, eds.), Vol. 4, pp. 1 93-240. Academic Press, New York.

Wilson DM, Davis WJ (1965) Newe impulse pattems and reflex control in the rnotor system of the crayfish cîaw. J &p Bi01 43:193-210.

Wojtowicz JM, Mann L, Atwood HL (1994) Activity-induced changes in synaptic release sites at the crayfish neuromuscular junction. J Neurosci 14:3688-3703.

Wojtowicz JM, Smith BR, Atwood HL (1 991) Activity-dependent recruitment of silent synapses. Ann NY Acad Sci 627:169-179.

Zhong Y, Wu CF (1 991) Altered synaptic plasticity in Drosophila memory mutants with a defective cyclic AMP cascade. Science 251 : 1 98-201.

Zucker RS (1 973) Changes in the statistics of transmitter release during facititation. J Physiol (Lond) 229:787-810.

Zucker RS, Delaney KR, Mulkey R, Tank DW (1991) Presynaptic calcium in transmitter release and posttetanic potentiation. Ann NY Acad Sci 635:lgl- 207.

Zucker RS, Fogelson AL (1 986) Relationship between transmitter release and presynaptic calcium influx when calcium enters through discrete channels. Proc Nat1 Acad Sci USA 83:3032-3036.

Quantitative analysis of regenerated excitatory newe terminais to the crayfish superficial flexor muscle upon allotransplantation of a tonic superficial flexor nerve. Surgeries perfomed by Kristen Krause, and data collected by Joanne Pearce and Rahim Hirji.

TONIC REGENERATE

TERMINALS:

Mean cross-sectional 2.67 area @m2) (x I sd) I 2.28

Oh COMPOSITION OF:

CIear vesicles 22.1

Dense vesicles 1.7

Axoplasm 57.2

SYNAPSES:

Number

Mean area ( p 2 ) (X + sd) ~urnber/~m= of terminal

DENSE BARS:

Number

Mean length (pm) (X f sd) (n)

Nurnber/synapse (X t sd)

~urnber f~ rn~ of terminal

~ e n ~ t h l p m ~ of terminal (P)

PAIRED DENSE BARS:

% of paired dense bars 6.0 (separated by I 0.2 pm)

% of synapses with 8.5 paired dense bars


Recommended