University of Kentucky University of Kentucky UKnowledge UKnowledge Theses and Dissertations--Dietetics and Human Nutrition Dietetics and Human Nutrition 2015 STUDENT PERCEPTIONS OF ORGANIC FOOD IN RELATION TO STUDENT PERCEPTIONS OF ORGANIC FOOD IN RELATION TO HEALTH, ENVIRONMENT AND PRICING HEALTH, ENVIRONMENT AND PRICING Stacey Paterson University of Ketucky, [email protected]Right click to open a feedback form in a new tab to let us know how this document benefits you. Right click to open a feedback form in a new tab to let us know how this document benefits you. Recommended Citation Recommended Citation Paterson, Stacey, "STUDENT PERCEPTIONS OF ORGANIC FOOD IN RELATION TO HEALTH, ENVIRONMENT AND PRICING" (2015). Theses and Dissertations--Dietetics and Human Nutrition. 38. https://uknowledge.uky.edu/foodsci_etds/38 This Master's Thesis is brought to you for free and open access by the Dietetics and Human Nutrition at UKnowledge. It has been accepted for inclusion in Theses and Dissertations--Dietetics and Human Nutrition by an authorized administrator of UKnowledge. For more information, please contact [email protected].
Transcript
University of Kentucky University of Kentucky
UKnowledge UKnowledge
Theses and Dissertations--Dietetics and Human Nutrition Dietetics and Human Nutrition
2015
STUDENT PERCEPTIONS OF ORGANIC FOOD IN RELATION TO STUDENT PERCEPTIONS OF ORGANIC FOOD IN RELATION TO
HEALTH, ENVIRONMENT AND PRICING HEALTH, ENVIRONMENT AND PRICING
Right click to open a feedback form in a new tab to let us know how this document benefits you. Right click to open a feedback form in a new tab to let us know how this document benefits you.
Recommended Citation Recommended Citation Paterson, Stacey, "STUDENT PERCEPTIONS OF ORGANIC FOOD IN RELATION TO HEALTH, ENVIRONMENT AND PRICING" (2015). Theses and Dissertations--Dietetics and Human Nutrition. 38. https://uknowledge.uky.edu/foodsci_etds/38
This Master's Thesis is brought to you for free and open access by the Dietetics and Human Nutrition at UKnowledge. It has been accepted for inclusion in Theses and Dissertations--Dietetics and Human Nutrition by an authorized administrator of UKnowledge. For more information, please contact [email protected].
I represent that my thesis or dissertation and abstract are my original work. Proper attribution
has been given to all outside sources. I understand that I am solely responsible for obtaining
any needed copyright permissions. I have obtained needed written permission statement(s)
from the owner(s) of each third-party copyrighted matter to be included in my work, allowing
electronic distribution (if such use is not permitted by the fair use doctrine) which will be
submitted to UKnowledge as Additional File.
I hereby grant to The University of Kentucky and its agents the irrevocable, non-exclusive, and
royalty-free license to archive and make accessible my work in whole or in part in all forms of
media, now or hereafter known. I agree that the document mentioned above may be made
available immediately for worldwide access unless an embargo applies.
I retain all other ownership rights to the copyright of my work. I also retain the right to use in
future works (such as articles or books) all or part of my work. I understand that I am free to
register the copyright to my work.
REVIEW, APPROVAL AND ACCEPTANCE REVIEW, APPROVAL AND ACCEPTANCE
The document mentioned above has been reviewed and accepted by the student’s advisor, on
behalf of the advisory committee, and by the Director of Graduate Studies (DGS), on behalf of
the program; we verify that this is the final, approved version of the student’s thesis including all
changes required by the advisory committee. The undersigned agree to abide by the statements
above.
Stacey Paterson, Student
Dr. Sandra Bastin, Major Professor
Dr. Kelly Webber, Director of Graduate Studies
STUDENT PERCEPTIONS OF ORGANIC FOOD
IN RELATION TO HEALTH, ENVIRONMENT AND PRICING
THESIS
A thesis submitted in partial fulfillment of the Requirements for the degree of Master Science in the College of Agriculture, Food and Environment at the
STUDENT PERCEPTIONS OF ORGANIC FOOD IN RELATION TO HE1ALTH, ENVIRONMENT AND PRICING
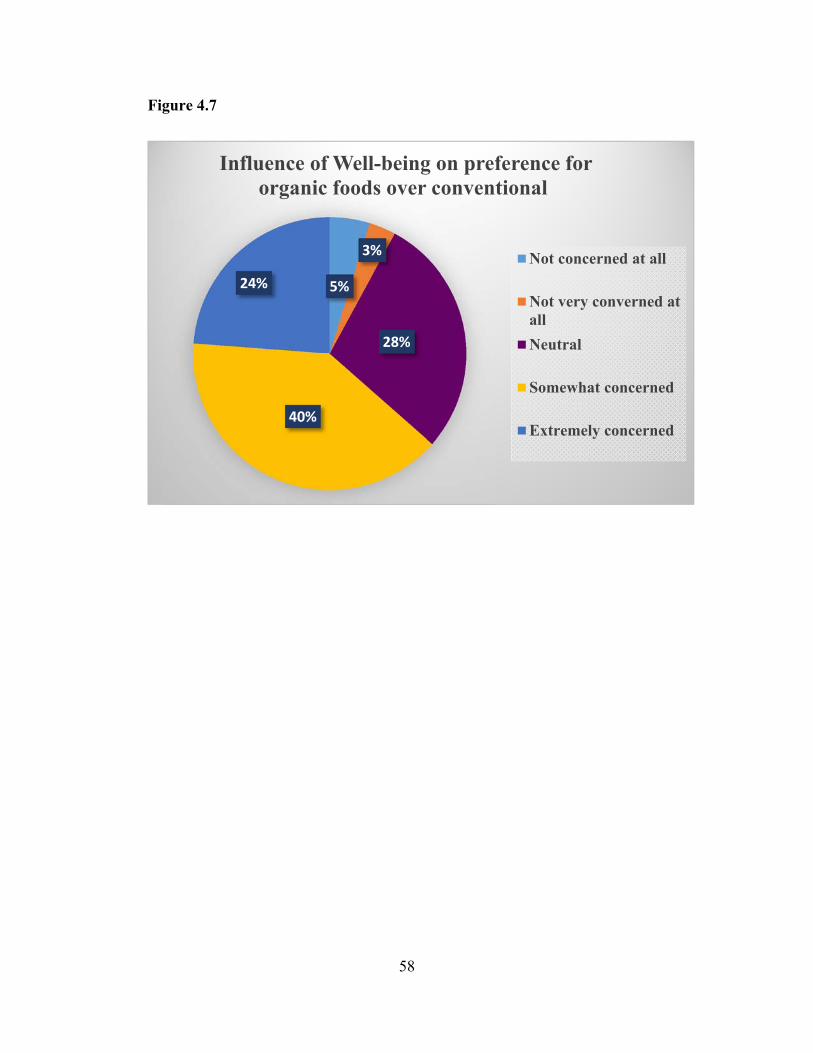
The organic industry is full of opinions and perceptions, which influence consumer purchasing decisions. A convenience sample of 69 college students between the ages of 19-23 registered in a basic food preparation class participated in this study. A sensory analysis of organic and conventional fruits, vegetables, meat and poultry, eggs and dairy measuring categorical taste differences between the two types of food. Student perceptions of organic foods in relation to health, environment and pricing and the likelihood of purchase were also studied. The influence of Diet and Well-being on organic purchases predominantly mattered somewhat to students, while price mattered completely. Overall, it can be concluded from this study, that there is no significant difference in taste between organic and conventional foods and that student perceptions match those examined in previous studies, but perceptions are not as heightened as the typical consumer exhibits. KEYWORDS: Organic, Perceptions, Health, Environment, Taste, Analysis, Students
Stacey Anne Paterson
December 2, 2015
STUDENT PERCEPTIONS OF ORGANIC FOOD IN RELATION TO HEALTH, ENVIRONMENT AND PRICING
By
Stacey Anne Paterson
Dr. Sandra Bastin, PhD, RD, LD, CCE
Director of Thesis
Dr. Kelly Webber, PhD, MPH, RD, LD
Director of Graduate Studies
December 2, 2015
Date
TABLE OF CONTENTS
List of Tables………………………………………………………................................v
List of Figures…………………………………………………………………………..vi
Chapter One: Introduction……………………………………………………………….1 Background……………………………………………………………………....1 Problem Statement……………………………………………………………….2 Purpose Statement………………………………………………………………..2 Justification……………………………………………………………………....2 Research Objectives……………………………………………………………...3 Research Questions…………………………………………………………….....3 Hypotheses………………………………………………………………………..4 Assumptions……………………………………………………………………....4
Chapter Two: Literature Review………………………………………………………….5 History and United States Department of Agriculture (USDA) Regulation……...5
The Organic Consumer……………………………………………………………6 Purchasing Determinant and Barriers……………………………………………..8
Personal Health………………………………………………………………..8 Nutrition, Pesticides and Adverse Health Issue…………………………..10 Quality, Safety and Environmental Concerns……………………………………12 Price……………………………………………………………………………...15 Availability and Insufficient Marketing………………………………………….15 Taste……………………………………………………………………………...16 Summary…………………………………………………………………………17
Chapter Three: Methodology…………………………………………………………….19 Research Design………………………………………………………………….19 Sample……………………………………………………………………………20 Procedures………………………………………………………………………..20 Instrument………………………………………………………………………..23 Data Analysis…………………………………………………………………….24
Perceptions of Purchasing Determinants and Barriers…………………………..51 Primary Reasons for Buying Organic Foods and Products……………………...56 City Suburban or Rural and its Effect on the Palate……………………………..59
iii
Chapter Five: Discussion………………………………………………………………..61 Findings………………………………………………………………………….61 Strengths, Limitations and Future Research…………………………………….68 Conclusions……………………………………………………………………...69
Appendix Organic versus Conventional Sensory Analysis Survey………………………...71
Research has found grass based diets lower in energy and inversely grain based
diets to be higher. Murir and colleagues in their review, attest that meat is flavored by lipid,
and fatty acids. Both of which are affected by feed type, but may not be easily detectable
in sensory analyses. In general, United States (US) cattle finished on grass-based diets, is
least prefered in the market, because of the characteristic “milk or grassy” smell (Proplo,
Micol, & Agabriel, 2001). The results in this case may be due to the grade and brand of
ground beef. The organic sample was a grass-fed ground beef, while the conventional
sample was a generic brand from Kroger. In this case, these results are supported by Proplo
and colleagues (2001) that a difference in flavor, is affected by diet. Time and temperature
64
may also be factors, since the study was conducted over a two day period and the samples,
which werer cooked a day in advance, were reheated at the beginning of each session.
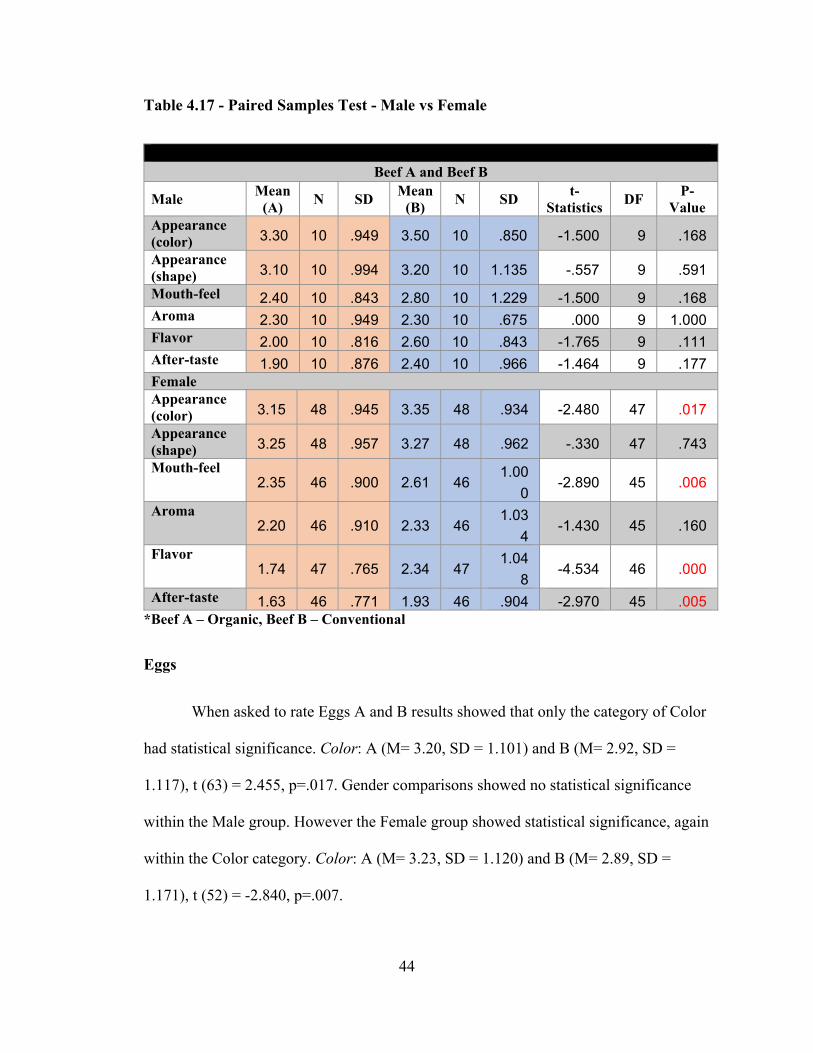
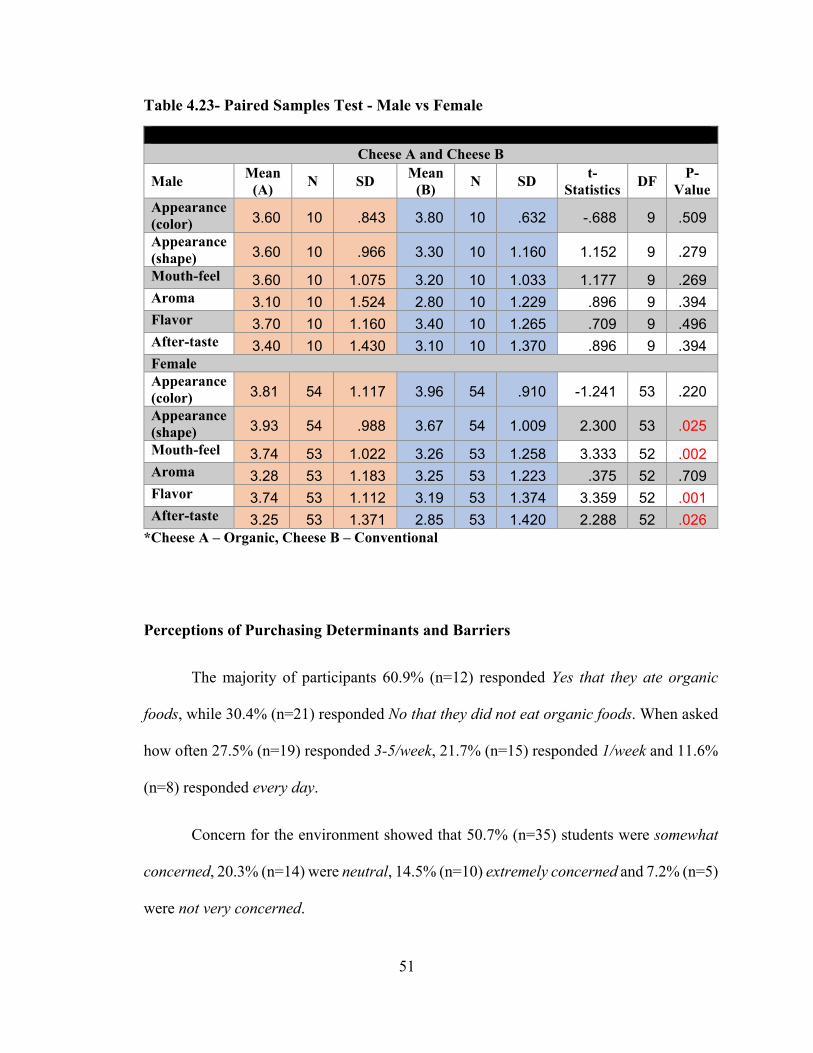
A difference between eggs and dairy product samples were noted in eggs: color
(p=.017), milk; flavor (p=.013) and after-taste (p=.001) and cheese; flavor (p=.001) and
after-taste (p=.016). This group had the most significant results of all the food groups, aside
from the cantaloupe samples. A difference in color between samples were also found in a
study by (Minelli, Sirri, Folegatti, Meluzzi, & Franchini, 2007). Organic yolks were found
to be paler than the conventional in this study. The lightness in color of the egg yolk was
attributed to how and what organic hens were fed. Organic hens receive a diet that is lower
in micronutrients and this affects yolk pigments and nutrient content. However, Woese
and colleagues (1997) state in their review, in which research on eggs at the time was
limited, “that carotenoid content in eggs from free range hens with access to vegetation
compared with caged hens is due to the additional uptake of carotenoid from grass and
green plants”. In this case the eggs in the study they received were darker in the organic
eggs than the conventional eggs.
Milk and cheese samples in this study were found to have significant differences
primarily in the area of taste, contrary to previous research. For instance (Croissant,
Washburn, Dean, & Drake, 2007) and (Khanal, et al., 2005) both reported that significant
taste differences could not be detected between organic and conventional milks and
cheeses.
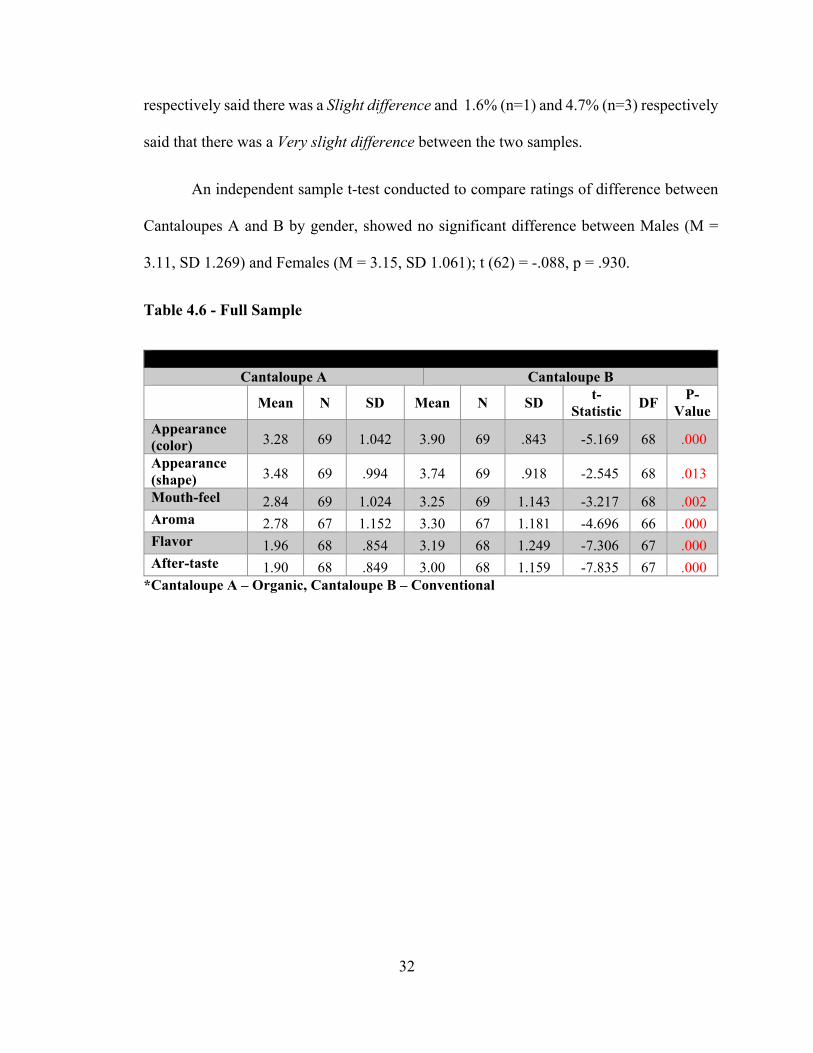
The cantaloupe samples returned results that showed statistical difference between
both the organic and conventional samples. Color (p=.000), shape(p=.013), mouth-feel
65
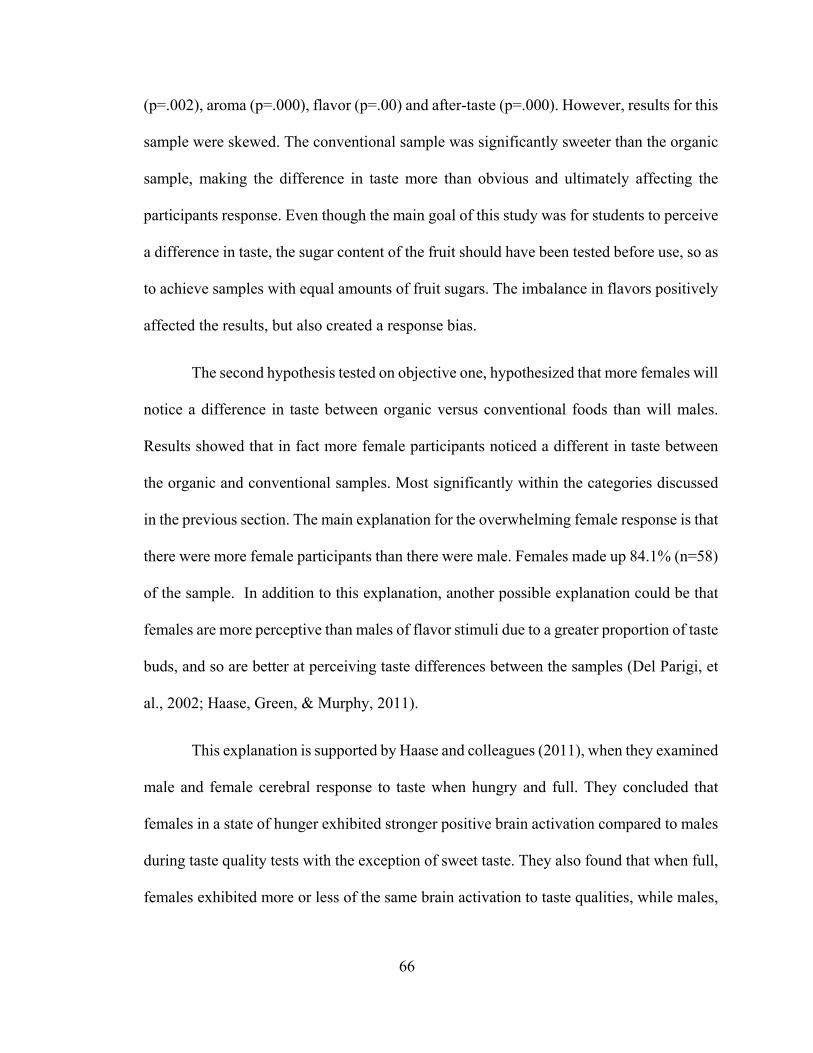
(p=.002), aroma (p=.000), flavor (p=.00) and after-taste (p=.000). However, results for this
sample were skewed. The conventional sample was significantly sweeter than the organic
sample, making the difference in taste more than obvious and ultimately affecting the
participants response. Even though the main goal of this study was for students to perceive
a difference in taste, the sugar content of the fruit should have been tested before use, so as
to achieve samples with equal amounts of fruit sugars. The imbalance in flavors positively
affected the results, but also created a response bias.
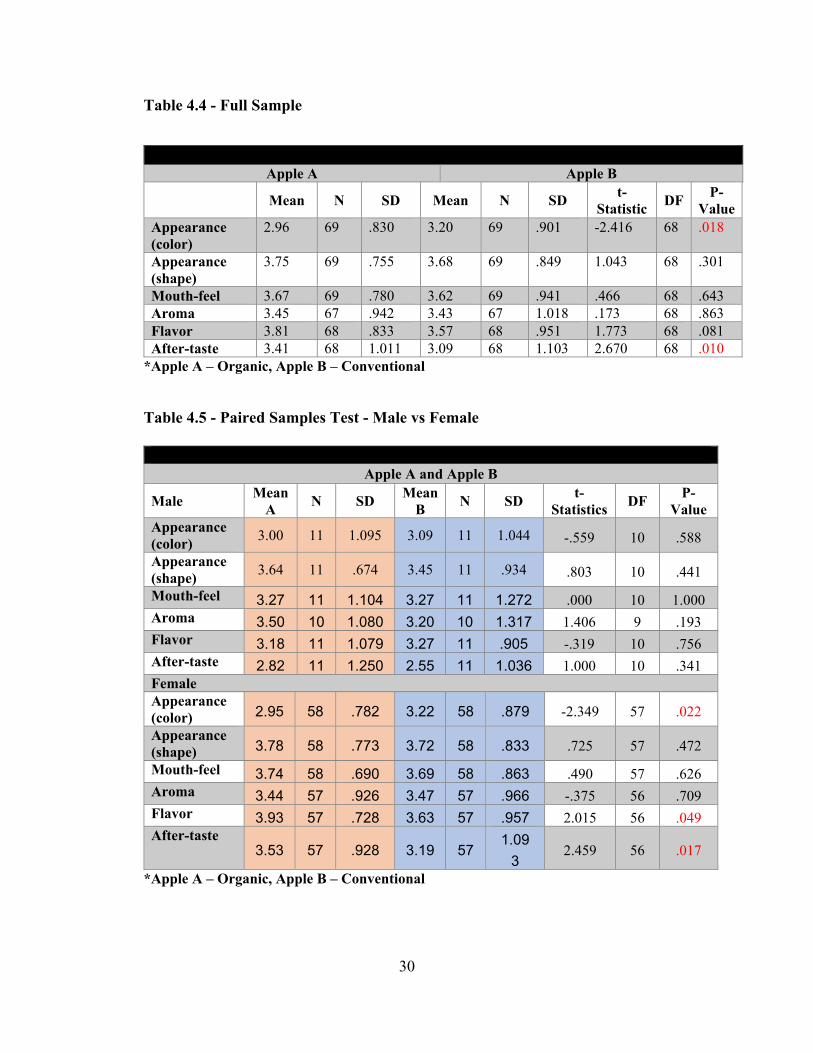
The second hypothesis tested on objective one, hypothesized that more females will
notice a difference in taste between organic versus conventional foods than will males.
Results showed that in fact more female participants noticed a different in taste between
the organic and conventional samples. Most significantly within the categories discussed
in the previous section. The main explanation for the overwhelming female response is that
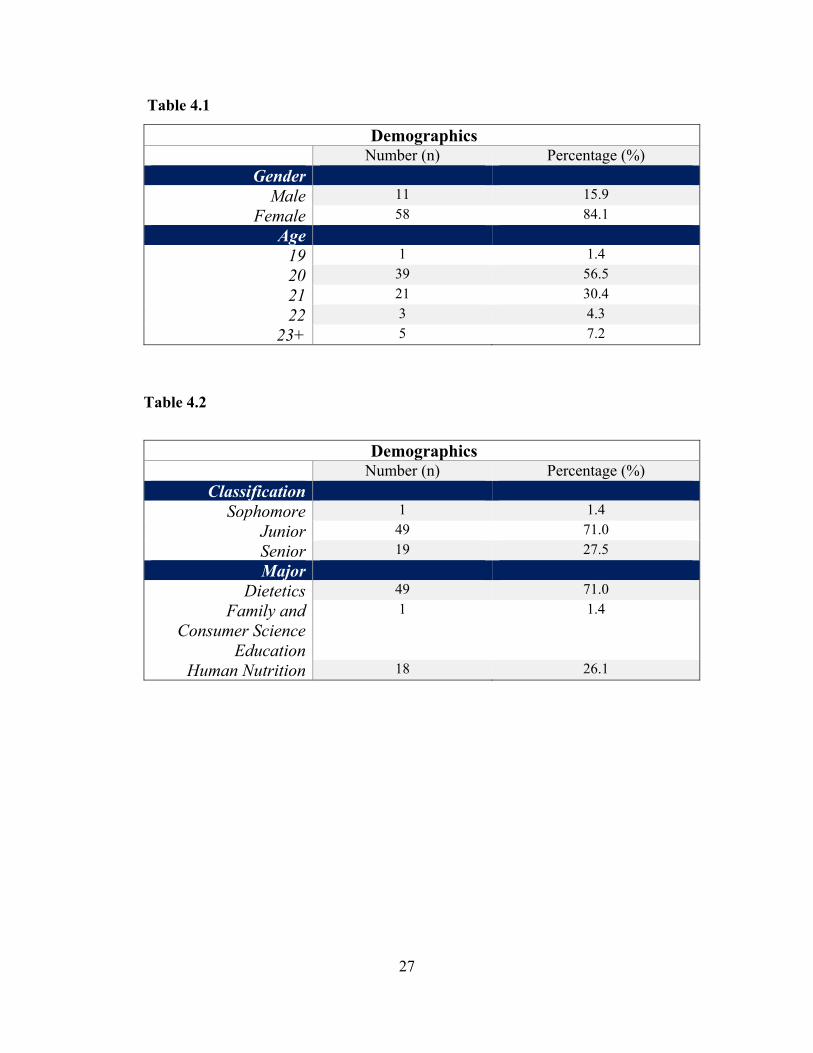
there were more female participants than there were male. Females made up 84.1% (n=58)
of the sample. In addition to this explanation, another possible explanation could be that
females are more perceptive than males of flavor stimuli due to a greater proportion of taste
buds, and so are better at perceiving taste differences between the samples (Del Parigi, et
al., 2002; Haase, Green, & Murphy, 2011).
This explanation is supported by Haase and colleagues (2011), when they examined
male and female cerebral response to taste when hungry and full. They concluded that
females in a state of hunger exhibited stronger positive brain activation compared to males
during taste quality tests with the exception of sweet taste. They also found that when full,
females exhibited more or less of the same brain activation to taste qualities, while males,
66
had more of a negative brain activation response (Haase, Green, & Murphy, 2011). For
future research, gender differences should be studied with a larger sample with equal
numbers of males and females.
The third objective in this study was to determine what type of organic foods
students purchase. Students reported that they mainly purchased organic fruits and
vegetables, grains and cereals, dairy products, eggs and organic snacks. They preferred to
purchase organic fish the least. Dahm and colleagues (2009), found similar results in their
study which examined how eco-friendly attitudes predicted eco-friendly behaviors on
college students. They found that positive perceptions such as health and environmental
awareness, positively influenced behaviors, which led to organic purchases and lifestyle
changes (Dahm, Samonte, & Shows, 2009).
A similar study by Stobbelaar et al (2007), found that 15 and16 year old high school
students, would, when they had the spending capacity to do so, buy organic fruits and
vegetables. The lower income students being more willing to pay for these organic foods.
Also girls were more willing than boys to purchase organic (Stobbelaar et al., 2006). As it
relates to this study, students possibly believe that buying organic fruits and vegetables is
better for their health and are more willing to spend their money on these products. Also
because there were so many girls in the sample, and females are more willing to buy
organic for health reasons, these results are in line with previous research.
The fourth objective tested the students’ area of residence e.g. (city, suburban or
rural) and how it influences the palate when identifying differences in taste between
organic and conventional foods. It was hypothesized that students who grew up in a rural
67
environment will be more perceptive of differences in taste between organic versus
conventional foods. Only the milk group returned significant results (p= .008), when tested
with the suburban group. A possible explanation for this is that, students from rural areas
have grown up on farms and are familiar with fresh cow’s milk, and they can better
perceive a difference between organic and conventional samples. Home town geographic
location though does not appear to be a significant predictor of perception in this case.
Strengths, Limitations and Future Research
One strength of this study was the variety of samples offered for analysis. This set
the stage for results that looked at all food groups instead of at one particular food. Another
strength of this study was the size of the sample used for the sensory analysis. Although
still relatively small, there were enough participants to produce significant results.
There were several limitations to this study. The first major limitation was the larger
proportion of females to males. This may have skewed the significance of the results
because of there were so many more females than males. The second limitation to the study
was time and temperature. As stated before, all the samples were prepared a day in advance
and kept in the refrigerator to preserve freshness, over the two day period. Samples should
have been used at a set temperature every time, instead of being hot (Meat) or cold (all
other samples) and allowed to adjust to room temp. Temperature can have a great effect on
sensory perception, and it was not controlled sufficiently in this study. The effect of time
of on prepared food, left to sit over two days, also could have had an effect on sensory
perception and the final results. A third limitation to the study was the predominant age
group of the sample. All being in their very early twenties, familiarity of the palate to
68
conventional foods, may have been a major influence on their responses, even though it
was a blind sensory analysis.
Future studies should focus on the same age group but with a more diverse group
of majors and ethnicities. Also research should be done with this sample to see how their
parents’ perceptions affect their perceptions of organic and conventional foods. Future
studies should look at what price this particular sample would prefer to pay for organic
foods, and what they think gives organic foods and products its value. Finally, more
controls should be put in place, if this study were to be replicated. Such as food sample
choice, organic farming methods and temperature control. This would help to make a study
such as this ideal for sensory analysis and perception evaluation.
Conclusion
The results of this study have provided some evidence that there are categorical
differences in taste between organic and conventional foods, most notably among the
vegetable, meat, eggs and dairy categories. Price was found to be a major deterrent of
organic purchases, and held a lot of weight in the purchasing decision in this study.
Students were concerned, but not concerned enough to buy organic with the hopes that it
would keep them happy and healthy. Environmental sustainability had some influence on
their purchasing decisions, but again only somewhat. Inevitably, environmental awareness
is not at the forefront of their minds when purchasing food to eat.
Females were better at identifying categorical differences between samples than
males, but in general no major taste differences between samples were detected by students.
Understanding how this demographic is ifluenced by the main purchasing determinants
69
and barriers is important for the future of the organic industry and how it is marketed
towards consumers. Essentially, this demographic needs to be asked; How do organic
products affect your everyday life? How can the organic industry affect their and world’s
future? and What changes to both organic and conventional industries would they like to
see happen? Getting these questions answered, plus further education of this consumer
demographic based on the answers received and further research, may help them to make
better informed decisions rather than being on the fence.
Overall, it can be concluded from this study, that as a whole there is no significant
difference in taste between organic and conventional foods and that student perceptions
match those examined in previous studies. However perceptions are not as heightened as
the typical consumer exhibits. Females however, showed a greater ability to identify
categorical differences in taste between samples. Finally, age and circumsatnce may play
a major role in these results and should be considered when looking at health as a
purchasing determinant, and what students in this sample consider good health to be.
70
Appendix
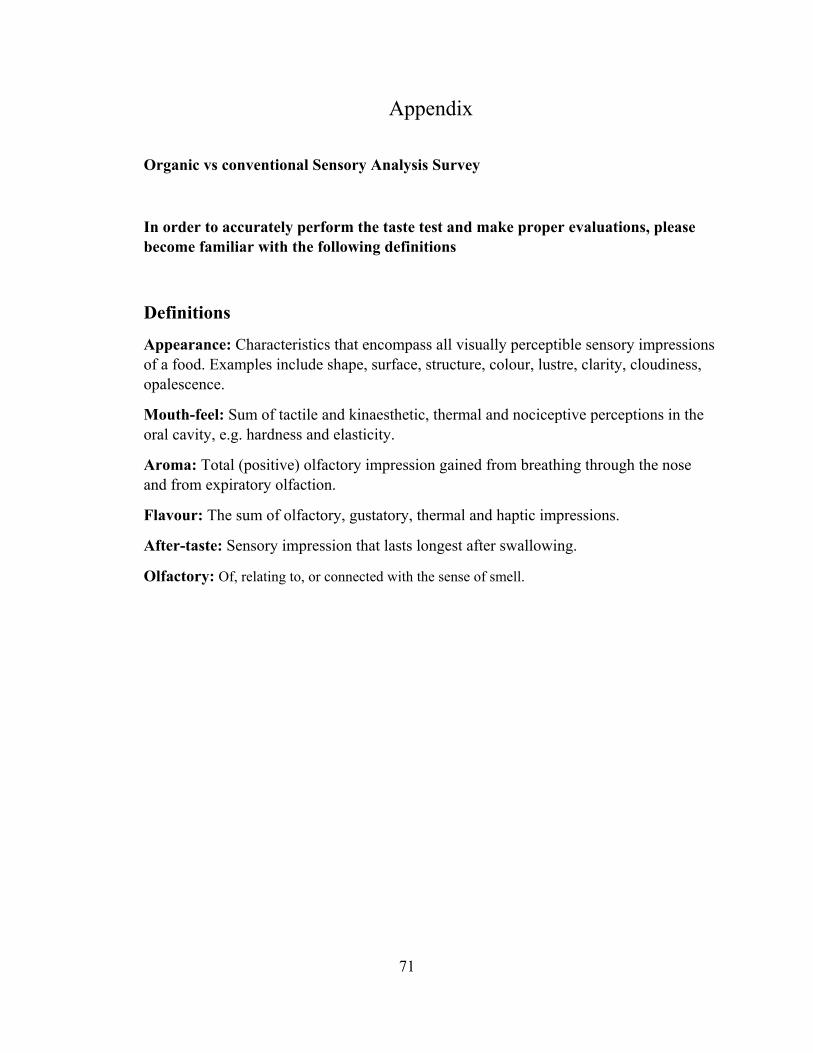
Organic vs conventional Sensory Analysis Survey
In order to accurately perform the taste test and make proper evaluations, please become familiar with the following definitions
Definitions
Appearance: Characteristics that encompass all visually perceptible sensory impressions of a food. Examples include shape, surface, structure, colour, lustre, clarity, cloudiness, opalescence.
Mouth-feel: Sum of tactile and kinaesthetic, thermal and nociceptive perceptions in the oral cavity, e.g. hardness and elasticity.
Aroma: Total (positive) olfactory impression gained from breathing through the nose and from expiratory olfaction.
Flavour: The sum of olfactory, gustatory, thermal and haptic impressions.
After-taste: Sensory impression that lasts longest after swallowing.
Olfactory: Of, relating to, or connected with the sense of smell.
71
Q1 Age
18 19 20 21 22 23+
Q2 Gender
Male Female
Q3 City and State
Q4 Classification
Freshman Sophomore Jr Sr
Q5 Major
Q6 Race
Black White (Non-Hispanic) Asian Hispanic Pacific Islander American Indian Multi-racial Other
72
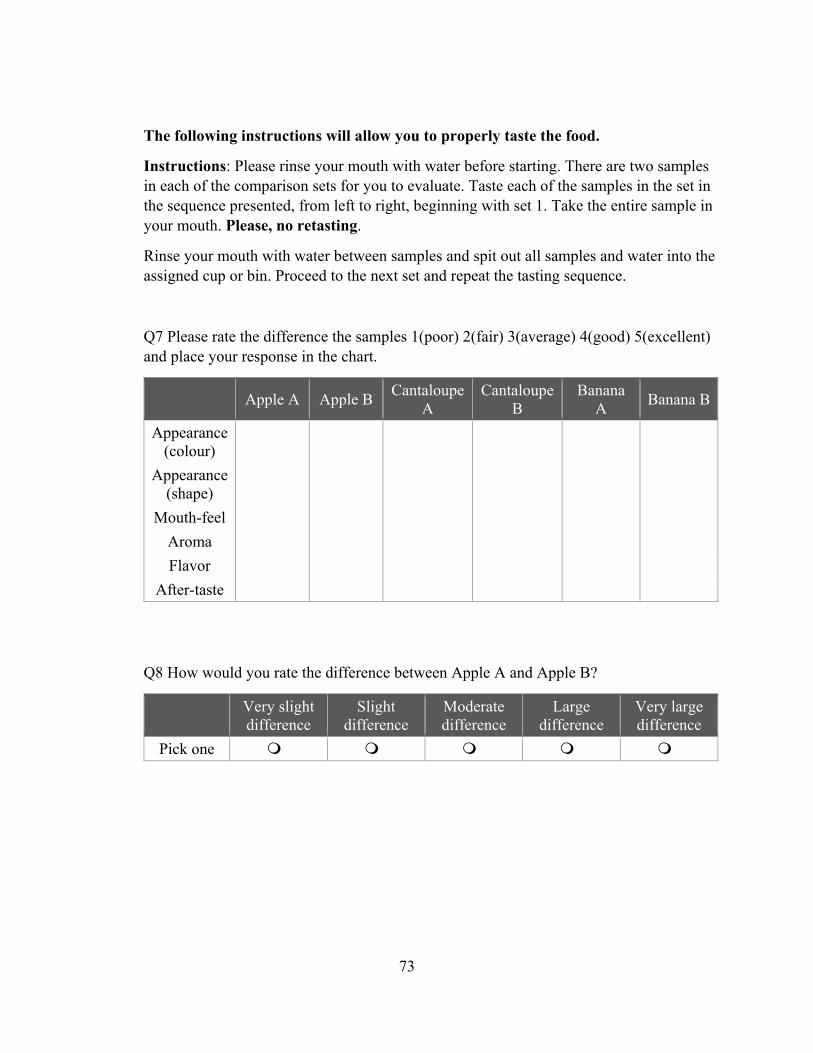
The following instructions will allow you to properly taste the food.
Instructions: Please rinse your mouth with water before starting. There are two samples in each of the comparison sets for you to evaluate. Taste each of the samples in the set in the sequence presented, from left to right, beginning with set 1. Take the entire sample in your mouth. Please, no retasting.
Rinse your mouth with water between samples and spit out all samples and water into the assigned cup or bin. Proceed to the next set and repeat the tasting sequence.
Q7 Please rate the difference the samples 1(poor) 2(fair) 3(average) 4(good) 5(excellent) and place your response in the chart.
Apple A Apple B Cantaloupe
A Cantaloupe
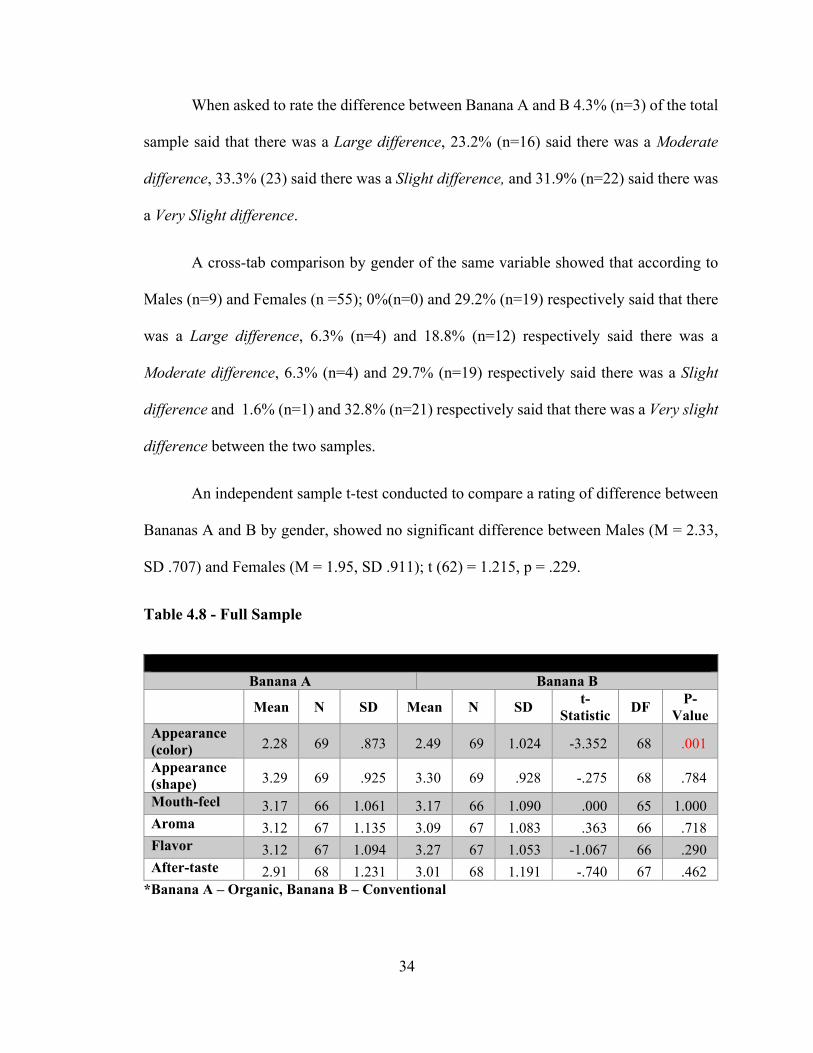
B Banana
A Banana B
Appearance (colour)
Appearance (shape)
Mouth-feel
Aroma
Flavor
After-taste
Q8 How would you rate the difference between Apple A and Apple B?
Very slight difference
Slight difference
Moderate difference
Large difference
Very large difference
Pick one
73
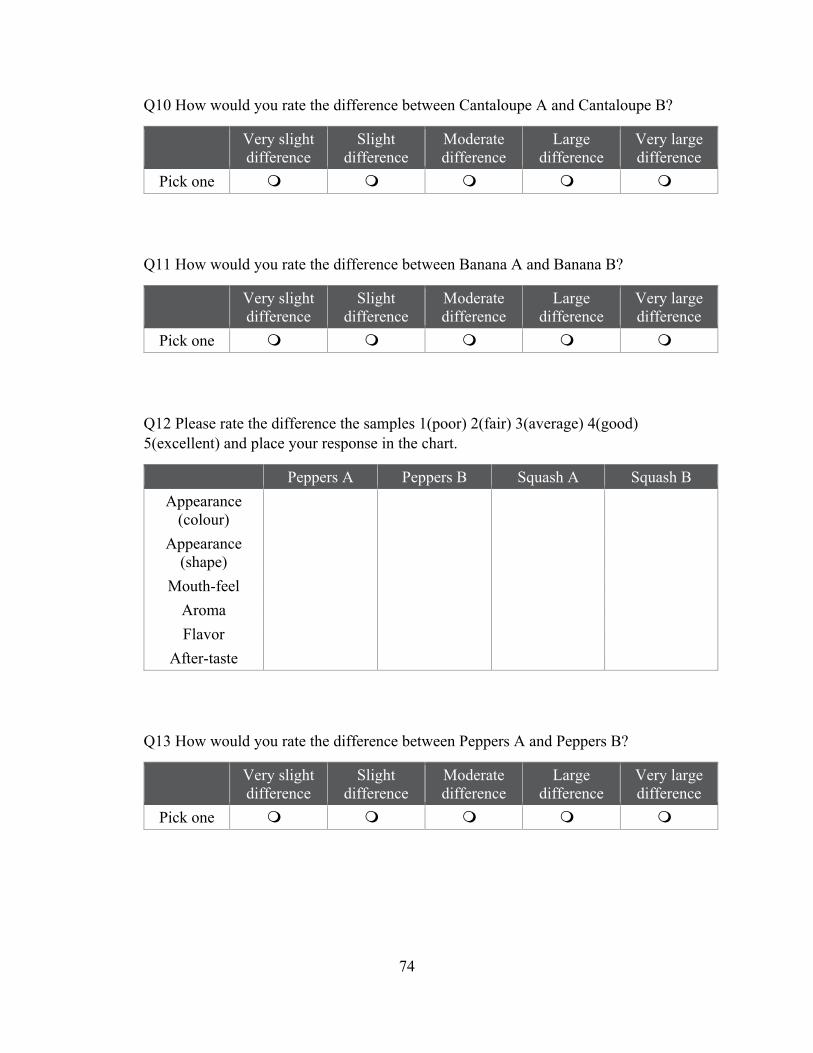
Q10 How would you rate the difference between Cantaloupe A and Cantaloupe B?
Very slight difference
Slight difference
Moderate difference
Large difference
Very large difference
Pick one
Q11 How would you rate the difference between Banana A and Banana B?
Very slight difference
Slight difference
Moderate difference
Large difference
Very large difference
Pick one
Q12 Please rate the difference the samples 1(poor) 2(fair) 3(average) 4(good) 5(excellent) and place your response in the chart.
Peppers A Peppers B Squash A Squash B
Appearance (colour)
Appearance (shape)
Mouth-feel
Aroma
Flavor
After-taste
Q13 How would you rate the difference between Peppers A and Peppers B?
Very slight difference
Slight difference
Moderate difference
Large difference
Very large difference
Pick one
74
Q14 How would you rate the difference between Squash A and Squash B?
Very slight difference
Slight difference
Moderate difference
Large difference
Very large difference
Pick one
Q15 Please rate the difference the samples 1(poor) 2(fair) 3(average) 4(good) 5(excellent) and place your response in the chart.
Chicken A Chicken B Beef A Beef B
Appearance (colour)
Appearance (shape)
Mouth- feel
Aroma
Flavor
After-taste
Q16 How would you rate the difference between Chicken A and Chicken B?
Very slight difference
Slight difference
Moderate difference
Large difference
Very large difference
Pick one
Q17 How would you rate the difference between Beef A and Beef B?
Very slight difference
Slight difference
Moderate difference
Large difference
Very large difference
Pick one
75
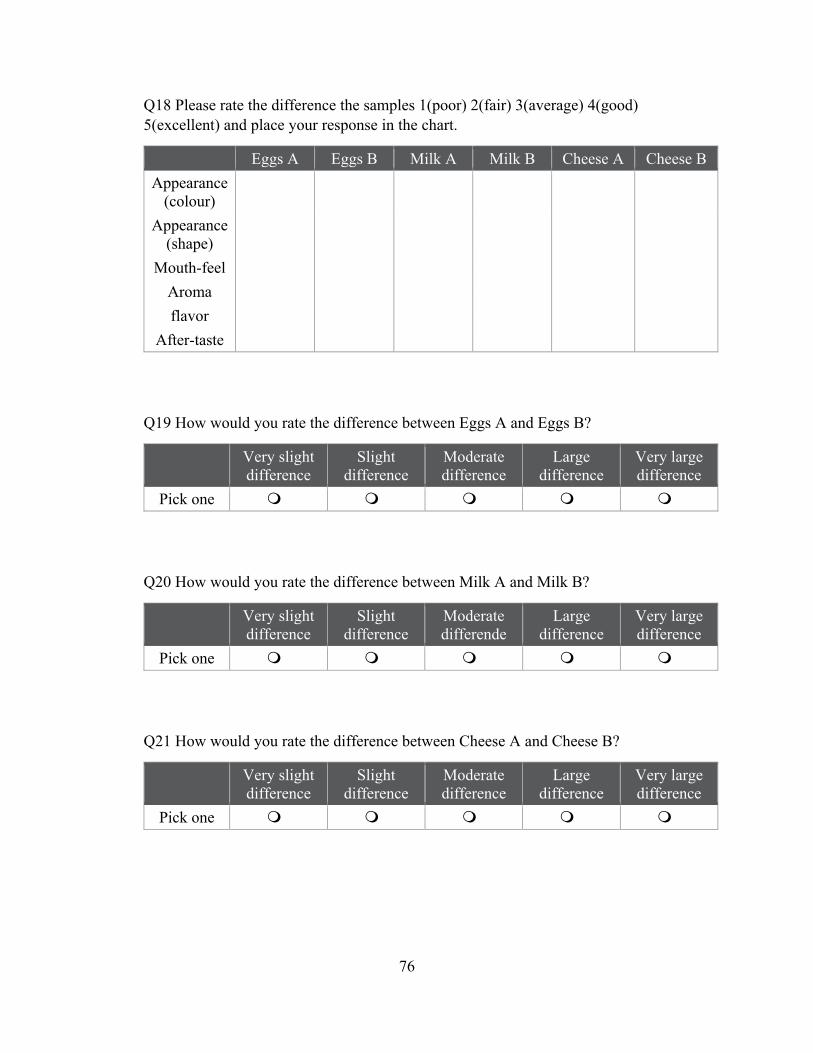
Q18 Please rate the difference the samples 1(poor) 2(fair) 3(average) 4(good) 5(excellent) and place your response in the chart.
Eggs A Eggs B Milk A Milk B Cheese A Cheese B
Appearance (colour)
Appearance (shape)
Mouth-feel
Aroma
flavor
After-taste
Q19 How would you rate the difference between Eggs A and Eggs B?
Very slight difference
Slight difference
Moderate difference
Large difference
Very large difference
Pick one
Q20 How would you rate the difference between Milk A and Milk B?
Very slight difference
Slight difference
Moderate differende
Large difference
Very large difference
Pick one
Q21 How would you rate the difference between Cheese A and Cheese B?
Very slight difference
Slight difference
Moderate difference
Large difference
Very large difference
Pick one
76
Q22 Do you eat organic foods?
Yes No
Q23 If yes, how often?
1 / week 3-5 / week Everyday
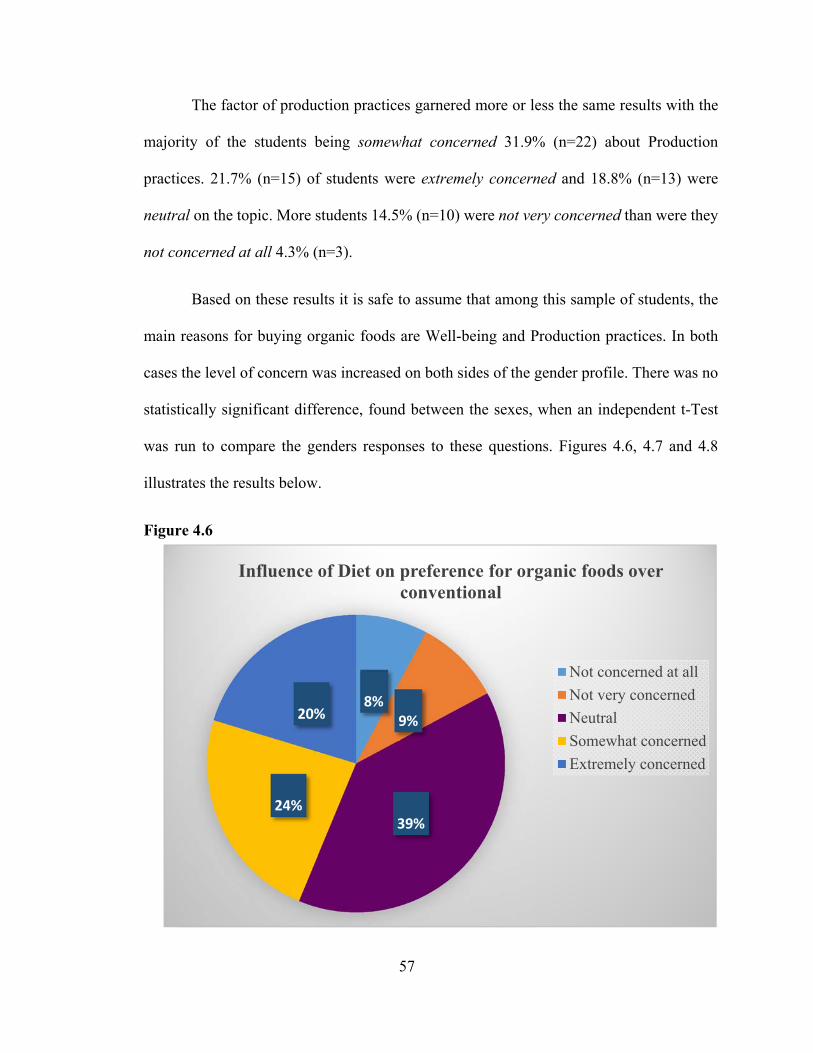
Q24 Indicate how strongly the following factors influence your preference for organic foods over conventional foods.
Not
concerned at all 1
Not very concerned 2
Neutral 3 Somewhat
concerned 4 Extremely
concerned 5
Diet: food and drink regularly
provided or consumed or
food consumed
for habitual nourishment
Well-being: the state of
being happy, healthy or prosperous
Production practices
Q25 Do you perceive foods labeled as organic to be healthier than non-organic foods?
Yes No Maybe
77
Q26 Indicate the level of risk you associate with eating conventionally grown foods vs organically grown foods.
No risk at
all 1 Not a lot of
risk 2 Neutral 3
Some risk involved 4
Extreme risk 5
Pick one
Q27 How concerned are you about the environment?
Not
concerned at all 1
Not very concerned 2
Neutral 3 Somewhat
concerned 4 Extremely
concerned 5
Pick one
Q28 How much do you think buying organic foods helps the environment?
Does not
help at all 1
Does not help much
2 Neutral 3
Helps somewhat 4
Helps completely 5
Pick one
Q29 From what categories do you purchase organic foods? Select all that apply.
Fruits Vegetables Grains and cereals Dairy Eggs Poultry Meat Fish Snacks
78
Q30 How affordable are organic foods vs conventional foods for you?
Not at all
affordable 1 Not very
affordable 2 Neutral 3
Somewhat affordable 4
Very affordable 5
Pick one
Q31 Where do you prefer to purchase organic foods? Select all that apply.
Specialty stores e.g. Whole foods, The Good Foods Co-op Grocery stores with organic sections e.g. Kroger No preference
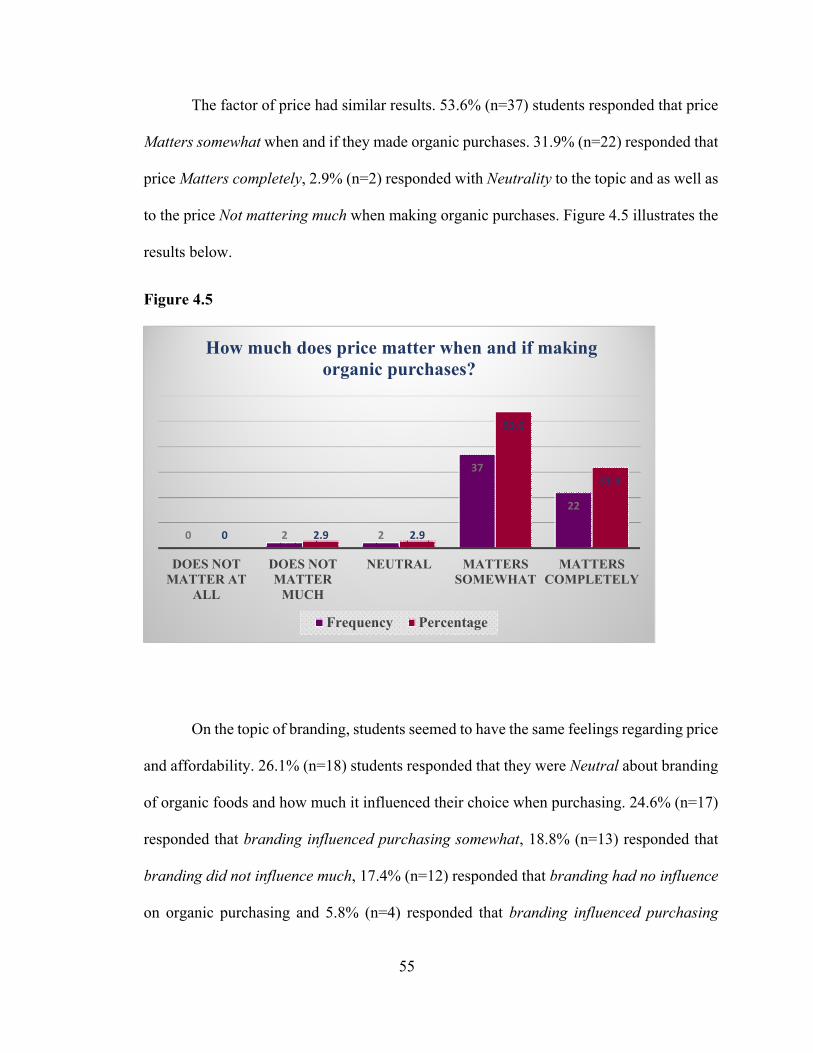
Q32 How much does price matter when and if making organic purchases?
Does not
matter at all 1
Does not matter much 2
Neutral 3 Matter
somewhat 4 Matter
completely 5
Pick one
Q33 How much does branding of organic food influence your choice between buying one product over the other?
No
influence at all 1
Does not matter much 2
Neutral 3 Matters
somewhat 4 Matters
completely 5
Pick one
Q34 Does labelling on organic foods products influence your purchasing decision? E.g. Attractiveness, highlighting of health advantages.
No
influence at all 1
Does not matter much 2
Neutral 3 Matter
somewhat 4 Matters
completely 5
Pick one
79
Q35. What is your definition of organic?
Q36 Vegan or Vegetarian?
Vegan Vegetarian
80
References
Abu-Zahra, T. (2011). Influence of Agricultural Practices on Fruit quality of Bell Peppers. Pakistan Journal of Biological Sciences(14)18, 876-881.
Aertsens, J., Verbeke, W., Mondelaers, K., & Van Huylenbroeck, G. (2009). Personal determinants of organic food consumption: a review. British Food Journal (111)10, 1140-1167.
Barret, J. R. (2006). OP Pesticides in Children's Bodies: The Effects of a Conventional versus Organic Diet. Environmental Health Perspectives(114)2, A112.
Beaudreault, A. R. (2009). Natural: Influence of Students' Organic Food Perceptions. Journal of Food Products Marketing, 379-391.
Buder, F., Feldmann, C., & Hamm, U. (2014). Why regular buyers of organic foodt still buy many conventional products. British Food Journal(116)3, 390-404.
Clark, J. E. (1998). Taste and flavour: their importance in food choice and acceptance. Proceedings of the Nutrition Society(57), 639-643.
Crinnion, W. J. (2010). Organic Foods Contain Higher Levels of Certain Nutrients, Lower Levels of Pesticides and May Provide Health Benefits for the Consumer. Alternative Medicine Review: a journal of clinical therapeutic. (15)1, 4-12.
Croissant, A., Washburn, S., Dean, L., & Drake, M. (2007). Chemical properties and consumer perception of fluid milk from conventional and pasture-based production systems. Journal of Dairy Science(90)11, 4942-4953.
Dahm, M. J., Samonte, A. V., & Shows, A. R. (2009). Organic Foods: Do Eco-Friendly Attitudes Predict Eco-Friendly Behaviors? Journal of American College Health(58) 3, 195-202.
Davies, A., Titterington, A. J., & Conchrane, C. (1995). Who buys organic food? A profile of the purchasers of organic food in Northern Ireland. British Food Journal, 17-23.
Del Parigi, A., K, C., JF, G., AD, S., RE, P., Ravussin E:, R. E., & PA, T. (2002(75)6). Sex differences in the human brain's response to hunger and satiation. American Journal of Clinical Nutrition, 1017-1022.
Dimitri, C., & Dettmann, R. L. (2012). Organic food consumers: what do we really know about them? British Food Journal (114)8, 1157-1183.
Dransfield, E., Ngabo, T., Nielsen, N., Bredhal, L., Sjoden, P., Magnusson, M., . . . Nute, G. (2005). Consumer Choice and suggested price for pork as influenced by its
81
appearance, taste and information concerning country of origin and organic pig production. Meat Science 69, 61-70.
Eskenazi, B., Bradman, A., & Castorina, R. (1999). Exposures of Children to Organophosphate Pesticides and Their Potential Adverse Health Effects. Environmental Health Perspectives(107) Supplement 3, 409-419.
Fillion, L., & Arazi, S. (2002). Does organic food taste better? A claim substantiation approach. Nutrition and Food Science Vol 32 No. 4, 153-157.
Haase, L., Green, E., & Murphy, C. (2011). Males and females show differential brain activation to taste when hungry and sated in gustatory and reward areas. Appetite(57)2, 421-434.
Hill, H., & Lynchehaun, F. (2002). Organic milk: attitudes and consumption patterns. British Food Journal Vol. 104 No. 7, 526-542.
Hughner, R. S., McDonagh, P., Ptothero, A., Shultz II, C. J., & Stanton, J. (2007). Who are organic food consumers? A compilation and review of why people purchase organic food. Journal of Consumer Behaviour Vol 6, 94-100.
Hutchins, R., & Grennhalgh, L. (1997). Organic confusion: sustaining competitive advantage. British Food Journal(99)9, 336-338.
Khanal, R., Dhiman, T., Ure, A., Brennard, C., Boman, R., & McMahon, D. (2005). Consumer Acceptability of Conjugated Linoleic Acid-Enriched Milk and Cheddar Cheese from Cows Grazing on Pasture. Jounal of Dairy Science(88)5, 1837-1847.
Kluger, J. (2010, August 8). What's So Great About Organic Food? Time Vol, 176 Iss: 9, pp. 30-40.
Krystallis, A., & Chryssohoidis, G. (2005). Consumers' willingness to pay for organic food: Factors that affect it and variation per organic food. British Food Journal, Vol. 107 Iss: 5, 320-343.
Lea, E., & Worsley, T. (2005). Australians' organic food beliefs, domegraphics and values. British Food Journal, 855-869.
Lu, C., Barr, D. B., Pearson, M. A., & Waller, L. A. (2008). Dietary Intake and Its Contribution to Longitudinal Oraganophosphorus Pesiticide Exposure in Urban/Suburban Children. Environmental Health Perspectives(116)4, 537-542.
Lu, C., Toepel, K., Fenske, R. A., Barr, D. B., & Bravo, R. (2006). Organic Diets Significantly Lower Children's Dietary Exposure to Organophosphorus Pesticides. Environmental Health Perspectives (114)2, 260-263.
82
Magnusson, M. K., Arvola, A., Hursti Koivisto, U.-K., Aberg, L., & Sjoden, P.-O. (2003). Organic foods is related to perceived consequences for human health and to environmentally freindly behaviour. Appetite (40), 109-117.
Minelli, G., Sirri, F., Folegatti, E., Meluzzi, A., & Franchini, A. (2007). Egg quality of laying hens reared in organic and conventional systems. Italian Journal of Animal Science(6) S1, 728-7302.
Mondelaers, K., Verbeke, W., & Huylenbroeck, V. (2009). Importance of health and environment as quality traits in the buying decision of organic products. British Food Journal Vol 11 No. 10, 1120-1139.
Mondelaers, K., Verbeke, W., & Van Huylenbroeck, G. (2009). Importance of health and environment as quality traits in the buying decision of organic products. British Food Journal (111)10, 1120-1139.
Murir, P., Deaker, J., & Brown, M. (1998). Effects of forage-and grain-based feed on beef quality: A review. New Zealand Journal of Agricultural Research(41)4, 623-635.
Paul, J., & Rana, J. (2012). Consumer behavior and purchase intention for organic food. Journal of Consumer Marketing (29)6, 412-422.
Pearson, D., Henryks, J., & Jones, H. (2010). Organic food: What we know (and do no know) about consumers. Renewable Agriculture and Food Systems, 171-177.
Perez-Lopez, A. L., Moises del Amor, F., Serrano-Martinez, A., Fortea, M. I., & Nunez-Delicado, E. (2007). Influence of agricultural practices on quality of sweet pepper fruits as affected by the maturity stage. Journal of the Science of Food Agriculture(87), 2075-2080.
Proplo, A., Micol, D., & Agabriel, J. (2001). Effects of grass feeding systems on ruminat and flavour. A review. Animal Research(50)3, 185-200.
Rekha, Naik, S., & Prasad, R. (2006). Pesticide residue in organic and conventional food-risk analysis. Journal of Chemical Health and Safety(13)6, 12-19.
Seyfang, G. (2006). Ecological citizenship and sustainable consumption: Examining local organic food networks. Journal of Rural Studies 33, 383-395.
Shepherd, R., Magnusson, M., & Sjoden, P.-O. (2005). Determinants of Consumer Behavior Related to Organic Foods. A Journal of the Human Environment(34)4, 352-359.
Smith-Spangler, C., Brandeau, M. L., Hunter, B., Bavingner, C. J., Pearson, M., Eschbach, P. J., . . . Bravata, D. M. (2012). Are Organic Foods Safer or Healthier
83
Than Conventional Alternatives- A Systematic Review. Annals of Internal Medicne (157)5, 1-23.
Stobbelaar, D., Casimir, G., Borghuid, J., Marks, I., & Meijer, L. a. (2006). Adolescents' attitudes towards organic food: a survey of 15-16 year old school children. International Journal of Consumer Studies, 349-356.
The Organic Institute. (2013). Retrieved from History of the Organic Movement: http://theorganicsinstitute.com/organic/history-of-the-organic-movement/
Thompson, G. D. (1998). Consumer Demand for Organic Foods: What We Know and We need to Know. Agricultural and Applied Economics Association(80)5, 1113-1115.
USDA. (n.d.). Organic Certification. Retrieved from USDA: http://www.usda.gov/wps/portal/usda/usdahome?navid=ORGANIC_CERTIFICATIO
Vindigni, G., Janssen, M. A., & Jager, W. (2002). Organic food consumption: A multi-theoretical framework of consumer decision making. British Food Journal Vol 104 No. 8, 624-642.
Williams, C. M. (2002). Nutritional quality of organic foods: shades of grey or shades of
green. Procedings of the Nutrition Society (61), 19‐24.
Woese, K., Lange, D., Boess, C., & Bogl Werner, K. (1997). A Comparison of Orgnaically
and Conventionally Grown Foods‐ Results of a Review of the Relevant Literature.
Journal of Science Food and Agriculture, 281‐293.
Worthington, V. (2001). Nutritional Quality of Organic Versus Conventional Fruits,
Vegetables and Grains. The Journal of Alternative and Complementary
Medicine(7)2, 161‐173.
Yiridoe, E. K., Bonti‐Ankomah, S., & Martin, R. C. (2004). Comparison of consumer
perceptions and preference toward organic versus conventionally produced
foods: A review and update of the literature. Renewable Agriculture and Food
Systems, 193‐205.
Zhao, X., Chambers IV, E., Matta, Z., Loughin, T. M., & Carey, E. E. (2007). Consumer
Sensory Anlysis of Organically and Conventionally Grown Vegetables. Journal of
Food Science(72)2, S87‐S91.
84
VITA
Place of Birth Port-of-Spain, Trinidad and Tobago, West Indies
Education Expected: Masters of Science, Hospitality and Dietetics Administration,
University of Lexington, KY. 2013-2015 Dietetic Intern, University of Kentucky, Lexington, KY, 2015 Bachelors of Science, Dietetics, Tuskegee University, Tuskegee, AL. 2008-2012 Applied Associate of Science, Culinary Management and Hotel Operations,
Trinidad and Tobago Hospitality Institute, Chaguaramas, Trinidad, WI. 2002-2007
Professional Positions Graduate Teaching Assistant, University of Kentucky, Lexington, KY. 2013-2015 Child Nutrition Program Cafeteria Manager, Macon County Board of Education,
Tuskegee, AL, 2012-2013 Profession Publications
Boushey CJ, Harray AJ, Kerr DA, Schap TE, Paterson S, Aflague T, Bosch Ruiz M, Ahmad Z, Delp EJ,(2015). How Willing Are Adolescents to Record Their Dietary Intake? The Mobile Food Record. JMIR mHealth uHealth 2015;3(2):e47