

University of Kentucky University of Kentucky
UKnowledge UKnowledge
Theses and Dissertations--Dietetics and Human Nutrition Dietetics and Human Nutrition
2015
STUDENT PERCEPTIONS OF ORGANIC FOOD IN RELATION TO STUDENT PERCEPTIONS OF ORGANIC FOOD IN RELATION TO
HEALTH, ENVIRONMENT AND PRICING HEALTH, ENVIRONMENT AND PRICING
Stacey Paterson University of Ketucky, [email protected]
Right click to open a feedback form in a new tab to let us know how this document benefits you. Right click to open a feedback form in a new tab to let us know how this document benefits you.
Recommended Citation Recommended Citation Paterson, Stacey, "STUDENT PERCEPTIONS OF ORGANIC FOOD IN RELATION TO HEALTH, ENVIRONMENT AND PRICING" (2015). Theses and Dissertations--Dietetics and Human Nutrition. 38. https://uknowledge.uky.edu/foodsci_etds/38
This Master's Thesis is brought to you for free and open access by the Dietetics and Human Nutrition at UKnowledge. It has been accepted for inclusion in Theses and Dissertations--Dietetics and Human Nutrition by an authorized administrator of UKnowledge. For more information, please contact [email protected].

STUDENT AGREEMENT: STUDENT AGREEMENT:
I represent that my thesis or dissertation and abstract are my original work. Proper attribution
has been given to all outside sources. I understand that I am solely responsible for obtaining
any needed copyright permissions. I have obtained needed written permission statement(s)
from the owner(s) of each third-party copyrighted matter to be included in my work, allowing
electronic distribution (if such use is not permitted by the fair use doctrine) which will be
submitted to UKnowledge as Additional File.
I hereby grant to The University of Kentucky and its agents the irrevocable, non-exclusive, and
royalty-free license to archive and make accessible my work in whole or in part in all forms of
media, now or hereafter known. I agree that the document mentioned above may be made
available immediately for worldwide access unless an embargo applies.
I retain all other ownership rights to the copyright of my work. I also retain the right to use in
future works (such as articles or books) all or part of my work. I understand that I am free to
register the copyright to my work.
REVIEW, APPROVAL AND ACCEPTANCE REVIEW, APPROVAL AND ACCEPTANCE
The document mentioned above has been reviewed and accepted by the student’s advisor, on
behalf of the advisory committee, and by the Director of Graduate Studies (DGS), on behalf of
the program; we verify that this is the final, approved version of the student’s thesis including all
changes required by the advisory committee. The undersigned agree to abide by the statements
above.
Stacey Paterson, Student
Dr. Sandra Bastin, Major Professor
Dr. Kelly Webber, Director of Graduate Studies

STUDENT PERCEPTIONS OF ORGANIC FOOD
IN RELATION TO HEALTH, ENVIRONMENT AND PRICING
THESIS
A thesis submitted in partial fulfillment of the Requirements for the degree of Master Science in the College of Agriculture, Food and Environment at the
University of Kentucky
By
Stacey Anne Paterson
Lexington, Kentucky
Director: Dr. Sandra Bastin, PhD, RD, LD, CCE
2015
Copyright © Stacey Anne Paterson 2015
ABSTRACT OF THESIS
STUDENT PERCEPTIONS OF ORGANIC FOOD IN RELATION TO HE1ALTH, ENVIRONMENT AND PRICING
The organic industry is full of opinions and perceptions, which influence consumer purchasing decisions. A convenience sample of 69 college students between the ages of 19-23 registered in a basic food preparation class participated in this study. A sensory analysis of organic and conventional fruits, vegetables, meat and poultry, eggs and dairy measuring categorical taste differences between the two types of food. Student perceptions of organic foods in relation to health, environment and pricing and the likelihood of purchase were also studied. The influence of Diet and Well-being on organic purchases predominantly mattered somewhat to students, while price mattered completely. Overall, it can be concluded from this study, that there is no significant difference in taste between organic and conventional foods and that student perceptions match those examined in previous studies, but perceptions are not as heightened as the typical consumer exhibits. KEYWORDS: Organic, Perceptions, Health, Environment, Taste, Analysis, Students
Stacey Anne Paterson
December 2, 2015
STUDENT PERCEPTIONS OF ORGANIC FOOD IN RELATION TO HEALTH, ENVIRONMENT AND PRICING
By
Stacey Anne Paterson
Dr. Sandra Bastin, PhD, RD, LD, CCE
Director of Thesis
Dr. Kelly Webber, PhD, MPH, RD, LD
Director of Graduate Studies
December 2, 2015
Date
TABLE OF CONTENTS
List of Tables………………………………………………………................................v
List of Figures…………………………………………………………………………..vi
Chapter One: Introduction……………………………………………………………….1 Background……………………………………………………………………....1 Problem Statement……………………………………………………………….2 Purpose Statement………………………………………………………………..2 Justification……………………………………………………………………....2 Research Objectives……………………………………………………………...3 Research Questions…………………………………………………………….....3 Hypotheses………………………………………………………………………..4 Assumptions……………………………………………………………………....4
Chapter Two: Literature Review………………………………………………………….5 History and United States Department of Agriculture (USDA) Regulation……...5
The Organic Consumer……………………………………………………………6 Purchasing Determinant and Barriers……………………………………………..8
Personal Health………………………………………………………………..8 Nutrition, Pesticides and Adverse Health Issue…………………………..10 Quality, Safety and Environmental Concerns……………………………………12 Price……………………………………………………………………………...15 Availability and Insufficient Marketing………………………………………….15 Taste……………………………………………………………………………...16 Summary…………………………………………………………………………17
Chapter Three: Methodology…………………………………………………………….19 Research Design………………………………………………………………….19 Sample……………………………………………………………………………20 Procedures………………………………………………………………………..20 Instrument………………………………………………………………………..23 Data Analysis…………………………………………………………………….24
Chapter Four: Results……………………………………………………………………26 Demographics……………………………………………………………………26 Student Taste Perceptions………………………………………………………..28
Fruits…………………………………………………………………………...28 Vegetables……………………………………………………………………...35 Meat…………...……………………………………………………………….39 Eggs……………………………………………………………………………44 Dairy…………………………………………………………………………...46
Perceptions of Purchasing Determinants and Barriers…………………………..51 Primary Reasons for Buying Organic Foods and Products……………………...56 City Suburban or Rural and its Effect on the Palate……………………………..59
iii

Chapter Five: Discussion………………………………………………………………..61 Findings………………………………………………………………………….61 Strengths, Limitations and Future Research…………………………………….68 Conclusions……………………………………………………………………...69
Appendix Organic versus Conventional Sensory Analysis Survey………………………...71
References………………………………………………………………………………..81
Vita……………………………………………………………………………………….85
iv

LIST OF TABLES
Table 3.1, Survey definitions……………………………………………………………22
Table 4.1, Age and Gender demographics………………………………………………27
Table 4.2, Classification and Major demographics……………………………………..27
Table 4.3, City, Suburban or Rural, Race and Vegetarian/Vegan demographics………28
Table 4.4, Full Sample (Apple)…………………………………………………………30
Table 4.5, Paired Samples Test - Male vs Female (Apple)……………………………..30
Table 4.6, Full Sample (Cantaloupe)……………………………………………………32
Table 4.7, Paired Samples Test - Male vs Female (Cantaloupe)………………………..33
Table 4.8, Full Sample (Banana)………………………………………………………..34
Table 4.9, Paired Samples Test - Male vs Female (Banana)……………………………35
Table 4.10, Full Sample (Squash)………………………………………………………36
Table 4.11, Paired Samples Test - Male vs Female (Squash)…………………………..37
Table 4.12, Full Sample (Peppers)……………………………………………………..38
Table 4.13, Paired Samples Test - Male vs Female (Peppers)…………………………39
Table 4.14, Full Sample (Chicken)……………………………………………………..41
Table 4.15, Paired Samples Test - Male vs Female (Chicken)………………………....41
Table 4.16, Full Sample (Beef)…………………………………………………………43
Table 4.17, Paired Samples Test - Male vs Female (Beef)…………………………….44
Table 4.18, Full Sample (Eggs)………………………………………………………...45
Table 4.19, Paired Samples Test - Male vs Female (Eggs)………………………….....46
Table 4.20, Full Sample (Milk)…………………………………………………………48
Table 4.21 Paired Samples Test – Male vs Female (Milk)………………………….....48
Table 4.22 Full Sample (Cheese)……………………………………………………....50
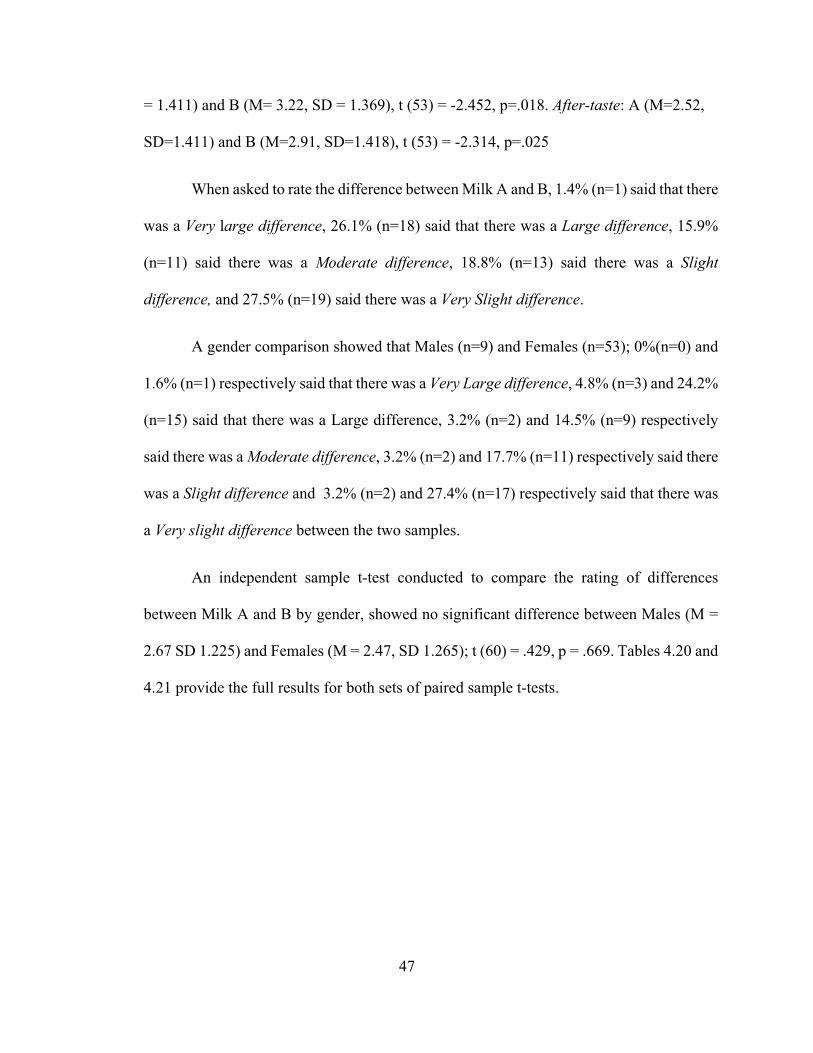
Table 4.23 Paired Samples Test – Male vs Female (Cheese)………………………….51
v
LIST OF FIGURES
Figure 4.1, How concerned are you about the environment..........................................52
Figure 4.2, How much do you think buying organic foods help the environment……53
Figure 4.3, From what categories do you purchase organic foods…………………....54
Figure 4.4, How affordable are organic foods vs conventional foods for you………..54
Figure 4.5, How much does price matter when and if making organic purchases…...55
Figure 4.6 Influence of Diet on preference for organic foods over conventional…….57
Figure 4.7 Influence of Well-being on preference for organic over conventional….. 58
Figure 4.8 Influence of Production Practices on preference for organic foods………59
vi
Chapter One
Introduction
Background
Globally, the organic industry is estimated to exceed $40 billion. While sales in
the United States totaled $26.6 billion in 2010 (Dimitri & Dettmann, 2012; Pearson,
Henryks, & Jones, 2010). There are more than 100 countries growing organic foods and
producing organic products. Ninety of these countries are developing countries with
perfect climatic conditions to produce the best organic product (Krystallis &
Chryssohoidis, 2005). With the escalation of obesity and chronic diseases, promoters of
organic food suggest that greater consumption organic produce can lead to the reduction
of chronic illnesses, cancers, and even help combat obesity. The organic industry is full
of opinions and perceptions, which influence consumer purchasing decisions. Mondelaers
and colleagues (2009) stated, “Consumer food choice is the result of the quality of
expectations before and experience after the purchase.”(p.1120)
In the past 25 years, there have been a plethora of studies comparing the taste and
nutritional value of organically raised food versus foods grown using conventional farming
methods. Most of the studies conclude that there is little to no difference between the
flavors or nutritional content between similar organic and conventional foods (Woese,
Lange, Boess, & Bogl Werner, 1997). In addition, dependent on the quality and price of
the products, certain age groups and women are more likely to purchase organic foods
because of their beliefs that organic food is better for their health (Lea & Worsley, 2005).
This thesis will explore the perceptions of college students in this age old debate. Tertiary
1
level students of today are the first of their generation, to witness the increasing popularity
and availability of organic foods, and organic grocery stores (Beaudreault, 2009). Since
young adults are the consumers of tomorrow; policies aimed at increasing organic food
consumption should address the needs of this group. (Stobbelaar, Casimir, Borghuid,
Marks, & Meijer, 2006).
Problem Statement
Health and environmental preservation are the two most cited reasons for buying
organic foods, and price is the number one reason for not buying among adults over the
age of 30. However, this has not been studied extensively among college students.
Purpose Statement
The purpose of this study is to determine college- age students’ perceptions of
organic foods in relation to health, environment and pricing, whether or not they can taste
the difference between organic and conventionally grown fruits, vegetables, meat, eggs and
dairy products, what types of organic foods college students purchase and whether area of
residence influences the palate when identifying differences between organic and
conventional foods.
Justification
There is limited research examining college students’ perceptions of organic foods
in relation to health, environment and food pricing and whether or not they can taste the
difference between organic and conventionally grown fruits, vegetables, meat, eggs and
dairy products. If a noticeable taste difference can be distinguished between organic and
2
conventional foods, younger consumers may be swayed in the direction of purchasing
organic foods. This study will fill the gap in this area.
Research Objectives
1. To determine college students perceptions of organic food in relation to health,
environment and pricing.
2. To determine if a difference in taste can be perceived by college students between
organic and conventionally grown foods.
3. To determine what types of organic foods students purchase.
4. To determine whether the students’ area of residence e.g. (city, suburban or rural)
influences their palate when identifying differences in taste between organic and
conventional foods.
Research Questions
1. What are the students’ perceptions of organic food, health and environmental
benefits and pricing?
2. Do college students taste a difference between organic foods when compared to
conventionally grown foods?
3. What types of organic food to college students purchase?
4. Does the student’s home location e.g. (city, suburban or rural) influence the palate
when identifying differences in taste between organic and conventional foods?
3

Hypotheses
1. More females will notice a difference in taste between organic versus conventional
foods than will males.
2. Students will notice a difference in taste between the organic and conventionally
grown food, if not told that they are grown and reared differently.
3. Students who grew up in a rural environment will be more perceptive of differences
in taste between organic and conventional foods.
Assumptions
The participants in this study are a small representation of college sophomores and
juniors. It is assumed that students are interested in maintaining a healthy balanced diet,
cook their own meals and that students are living on a strict budget. It was assumed that
the students would answer the questions of the survey, based solely on what they
experienced and not be influenced by others around them. Additionally, it was assumed
that all participants would be willing to try all samples of food presented.
4
Chapter Two
Review of Related Literature
This literature review will focus on the organic consumer, the purchasing
perceptions that often influence consumers and how these perceptions affect their
purchasing decisions to buy organic foods and products.
History and United States Department of Agriculture (USDA) Regulation
The term “organic” came about as a result of protest against excessively
commercialized and industrialized farming. Although all traditional methods of farming
before the industrial revolution were organic, farmers used natural methods to fertilize and
fight pests. It was not until after the 1920s when a shift took place. The industrialization of
agriculture caused farmers in European countries to start seeking alternative ways to grow
their crops naturally as a protest against the industrial movement.
The organic movement has its roots in Europe and events in the 1940s and 1950s
set off the initial spark to the organic food movement that led to initiatives in multiple
countries to develop the practice of what is now known as “organic farming” (Pearson et
al., 2010). Out of the 1960s and ‘70s came the “be natural” approach as a result of increased
consumer concern for health and nutrition, which then spawned the green movement
among both consumers and farmers (The Organic Institute, 2013).
Organic food is regulated by the United States Department of Agriculture’s
National Organic Program (NOP), which regulates organic farming standards on all types
of organic farms (USDA, n.d.). The USDA controls labelling of foods, ensuring that any
5

food that is labelled and approved as organic has met the standards and guidelines set out
by the USDA.
The Organic Consumer
Consumers of organic food do not fall into just one category or demographic. Such
consumers may have more education and more expendable money than the average person
and may be young mothers. These same consumers are more willing to have home gardens
where they grow fruits and vegetable and may also be vegetarian (Pearson et al., 2010). On
the other hand, younger consumers are more positive about organically grown food, while
older consumers will buy organic foods because they can afford to do so (Hughner et al.,
2007). Research shows that consumers hold certain characteristics that make them more
likely to purchase organic food, when found to be of following types: “The Greenies” and
“The Foodies”. Consumers that exhibit the behavior of a “Greeny” according to (Hill &
Lynchehaun, 2002) are interested in helping the environment, are more likely to research
how their food is handled and processed, have an understanding of the benefits of the
environment and are mothers of young children staying abreast of current food trends. A
consumer who is classified as “The Foodies” type, focuses on the sensory pleasure and
long-term “benefits”, meaning that it tastes better to them and they closely identify taste
with diet and well-being.
There are two other types of organic consumer classifications, but they do not fall
into the previously mentioned categories. They are “Dabblers” because they are not
exclusive to organic foods and products and “Potentials” because they are very much
interested, but price remains a major deterrent (Hill & Lynchehaun, 2002).
6

The British supermarket Safeway, ran a study to determine consumer motives for
purchasing organic foods. Motives were categorized according to Davies, Titterington, &
Conchrane, (1995) as; “concerned about the environment (Greens), concerned about
chemical residues (Food phobics), preoccupied with factory farming (Humanists) or
believed that premium products must be better and taste better (Hedonists)”(p.18). The
similarities between both sets of explained consumer types, shows that these are the
dominant and constant characteristics of consumers that have an interest or none, in
purchasing organic products, whether it is environmentally focused or on the long-term
health effects.
Organic purchases based on these behaviors have been found to depend primarily
on the number of young children in the household, household income and less dependent
on the age of the consumer (Davies et al., 1995; Hill & Lynchehaun, 2002; Krystallis &
Chryssohoidis, 2005 & Yiridoe, Bonti-Ankomah, & Martin, 2004). Parents want what is
best for their children and their health and as a result of this may exhibit overlapping
purchasing behaviors. For example; Greeny/Greens in combination with Foodie behaviors,
have a desire to help preserve the environment for their children, while transferring their
sensory enjoyment and perceptions of organic food on to them.
Another example is; Food phobic qualities blended with Hedonist qualities.
Essentially the need to purchase organic produce to avoid harmful residues plus the
perception of organic foods being superior in quality, is a driving force for many parents
when trying to raise healthy children (Magnusson, Arvola, Hursti K, Aberg, & Sjoden,
2003). As mentioned before, women between the ages 30-45 are most likely to practice
7

these behaviors and exclusively buy organic more so than men of the same age. However,
men in this age group have no problem paying more for organic foods and this lessens the
gap between the sexes (Davies, et al., 1995).
Approximately 3% of the market in America buys a broad range of organic foods,
according to the US Department of Agriculture (USDA), (Kluger, 2010). This being said,
Hill & Lynchehaun, (2002) state “consumer demand for organic continues to grow as
current organic consumers buy across different organic food ranges and new consumers
are entering the market” (p.526). The way that people prioritize their food concerns
naturally depends on where they come from, but four factors remains constant among
consumers: health, preservation and concern for the environment, quality and taste (Davies
et al., 1995) (Pearson et al., 2010). The main barriers that determine organic purchases are
price, availability and insufficient marketing.
Purchasing Determinants and Barriers
Personal health
The number one reason that regular and sporadic organic consumers purchase
organic foods is personal health. In an article by Hughner and colleagues, (2007), their
literature review revealed that; “For Regular Consumers of Organic Foods (RCOF),
organic food consumption is part of a way of life. It results from an ideology, connected to
a particular value system that affects personality measure, attitudes and consumption
behavior.” RCOFs believe that eating healthy/organic, is a measure prevention, and a good
way to avoid having to take prescribed medications. A change in diet or lifestyle to make
it a “way of life” could possibly be “a reaction to an adverse situation.” (Pearson, Henryks,
8
& Jones, 2010). Diagnoses of ill-health, may cause consumers to choose a more
homeopathic road to health by using food for healing and recovery purposes. The perceived
benefits of an organic lifestyle, leads them to believe that they will live a healthier life.
Health as a purchasing determinant becomes more important with increasing age (Paul &
Rana, 2012).
In a study by (Aertsens, Verbeke, Mondelaers, & Van Huylenbroeck, 2009), the
researchers examined links between the Schwartz’ values theory, the theory of planned
behavior (TBP) and personal determintants of organic food consumption.
The connection between these two theories and health revealed that the following
determinants had a strong influence on health as a motive. Security described as “Safety,
harmony, and stability of society, of relationships and of oneself.”. Attitudes, which are
strongly affected by health, are a positive influence on purchasing decisions. Attitutde
influencing intention, “organic food purchases are positively and significantly linked with
the intention to purchase organic food, a positive attitude towards organic prodcuts with
respect to health and environmental benefits and higher levels of income and knowledge.”.
Gender, the researchers here too, found that women in general were more health focused
and that teenage girls showed more interest in organic products than boys. In addition to
being a strong indicator of purchase decision, health was found to be strong predictor of
purchase regularity (Magnusson, et al., 2003).
Although health is a major determinant of organic food purchase, the research does
not always return significantly different results between organic and conventional foods
9

(Pearson et al., 2010) (Smith-Spangler, et al., 2012). Research continues on this topic as it
remains the top reason of concern among consumers.
Nutrition, Pesticides and Adverse Health Issue
The organic farming process has been a major influence on the perception that
organic foods are more nutritious because they are free from synthetic pesticides, and
mineral fertilizers. While the practice of crop rotation and soil tillage, cover cropping, the
use of “green manures,” and aged animal & plant waste (composting) helps to maintain
both soil integrity and fertility and releases nutrients in the soil at a slower rate
(Worthington, 2001) (Woese, et al., 1997). However, as Smith-Spangler and colleagues,
(2012) state, livestock “are fed organically produced feed that is free of pesticides and
animal by-products and are provided access to the outdoors, direct sunlight, fresh air, and
freedom of movement (p.1).” Animals reared on organic farms experience little stress,
which in turn should produce better products.
The nutrition content of organic and conventional tomato studies, reviewed by
(Crinnion, 2010) were affected by multiple factors: a) difference between growers and soil
quality, b) differences due to the weather conditions from year-to-year, and c) length of
time using organic methods. All of these factors had a more positive effect on the nutrition
content of the tomatoes grown by organic methods in all the studies reviewed by Crinnion,
(2010). In particular, when the length of time using organic methods was a factor, a
Univeristy of California, Davis study found that over a 10 year period, “organic tomatoes
averaged 70-percent more quercetin and 97-percent more kaemfferol than conventionally
grown tomatoes”. Flavonoid levels that remained constant in non-organic plots, increased
10

each year in those from the organic plots, due to the increasing levels of organic matter and
the reduction of manure application after the plots became rich in organic matter.
In general most studies are successful in finding significant differences of nutritional
content between organic and conventional foods. But, results either show no significant
difference in nutrients between the two groups or only show differences within certain
categories, such as: ascorbic acid (higher in organic), omega-3 fatty acids (higher in
organic), and nitrate levels (lower in organic) (Smith-Spangler, et al., 2012; Williams,
2002; Woese et al., 1997; Worthington, 2001).
Pesticide residues and their link to adverse health issues along with the increasing
consumer concern have been heavily studied. Certified organic foods by law, are not
exposed to synthetic pesticides, but can have secondary exposure to pesticides from soils
that were previously used for conventional farming, drifts in the air, and exposure during
transportation and distribution (Crinnion, 2010).
Globally, there are over 500 registered compounds used as pesticides or as
metabolites of pesticides. The most commonly found pesticide residues found on food and
in the environment are organophosphates (OP), carbamate, organochlorine, pyrethroid, and
herbicide compounds (Eskenazi, Bradman, & Castorina, 1999). Public health is threatened
when pesticide residues on food or in water are in excess of the maximum residue limit
(MRL) (Rekha, Naik, & Prasad, 2006). Health hazards caused by pesticides are directly
related to the type and length of exposure to the particular pesticide. Adverse health issues
related to repeated residue exposure are: headaches, skin rashes, neurological disorders,
11
and even damage to white blood cells & lymphocytes in the immune symptoms (Rekha,
Naik, & Prasad, 2006).
Upon investigation of literature that focused on the difference between residues on
organic and conventional foods and the effect of OP pesticide exposure in children, two
separate studies concluded that organic foods had less residues than conventional, when
comparing urine samples of children who ate exclusive conventional and exclusive organic
diets over an extended period time. Lu and colleagues, (2006) specifically stated that
organic diets of fruits, vegetables, fruit juices and wheat products protected the bodies of
these young children against OP exposure, and that the fighting qualities of the foods were
instant. Authors of the second study, saw dramatic reduction in urine pesticide
concentrations during “the 5- day organic diet intervention period”. When conventional
foods were re-introduced into the childrens’ diets, concentration numbers returned to their
original levels “observed in the days before the introduction of organic diets” (Lu, Barr,
Pearson, & Waller, 2008). It is imperative though, to not employ these results to adults and
the general public and the assumption that an all organic diet would remove all possible
contact with the above mentioned pesticides (Barret, 2006).
Quality, Safety and Environmental Concerns
Quality, safety and environmental concerns are connected as determinants of
organic food purchases. The idea of quality and safety is usually a priority for consumers
before environmental concerns. Organic consumers associate product freshness and
superiority of taste with quality, particularly when buying fruits and vegetables (Pearson
et al., 2010). However, when quality is linked to appearance, consumers in general are
12

found to accept blemishes on organic produce, as this is expected with food that is in its
most natural state (Yiridoe, et al. 2004). As a result of this, quality is found to be a
subjective purchasing determinant, and it relies on the consumer’s expectations of the
product they are seeking. In essence quality equals satisfaction with the product (Pearson,
et al., 2010).
The issue of food safety with contaminated meat and vegetables is caused by
unsanitary production practices particularly in meat and poultry factory farms, and from
poor sanitation of vegetables during the cultivation and distribution process. “Animals not
raised on feedlots have a lesser chance of spreading Escherichia coli (E.coli) bacteria
through contact with other animals’ manure” (Kluger, 2010). Some research has suggested
that consumers view organic farming methods to be safer than conventional intensive
farming (Hughner et al., 2007). Simply because, organic farmers avoid using synthetic
chemicals and are not careless in their farming practices. Organic certifications ensure that
organic farmers follow a protocol that ensures both meat and produce are “produced under
controlled cultivation condition[s] that is environmentally compatible” (Woese et al.,
1997). Companies that act as the middle man, in the process of handling and distribution
of food for public use, must be certified by the US Department of Agriculture (USDA),
(Dahm, Samonte, & Shows, 2009).
Environmental concerns are the last major determinant of organic food purchases.
Chemicals and pesticides used on conventional foods are viewed by consumers as
extremely harmful to the environment, when compared to organic foods which use
naturally derived pesticides and fertilizers (Hughner et al., 2007). Corn crops use
13
approximately 10 million tons of chemical fertilizer per year, a crop which has increased
its yields by 23% from 1990 to 2009. This amount of fertilizer has caused harmful toxic
water runoffs to contaminate ground waters, as well as other inland waterways (Kluger,
2010). Contaminated water run-off contributes to the degradation of the environment.
Idealistic consumers who are most likely to support environmental and political causes
would be swayed in the direction of organic in order to not contribute towards further
destruction of the eco-system (Shepherd, Magnusson, & Sjoden, 2005).
It is also notable that “health and environmental motives differ from each other
because the health concern can be regarded as anthropocentric or egoistic (benefits to the
individual or his/her family) while consideration for the environment and animal welfare
are rather altruistic (benefits society rather than the individual)” (Mondelaers, et al., 2009,
p,1121). These two qualities link back to the organic consumer. The egoistic consumer
would be a ‘Foodie’ who buys organic food for the pleasure and improvement of one’s
health, while the altruistic consumer would be a ‘Greenie’ who buys organic because it
benefits the environment. Athanasios Krystallis and George Chryssohoidis state, “Organic
food purchases are mainly attributed to consumers” environmental concerns and food
quality/safety consciousness. Thus, willingness to purchase (WTP) for organic products
can be a good predictor of organic food demand.” (Krystallis & Chryssohoidis, 2005).
14

Price
Price is the number one barrier of organic purchases. Consumers who may be
seriously interested in purchasing organic food, but do not have the financial means to do
so, often opt for the cheaper alternative. Consumers commonly do not understand why
organic prices are higher than their conventional counterparts (Hill & Lynchehaun, 2002).
However, “willingness to pay increased when consumers were given information about
organic products verbally, as opposed to in a written leaflet format” as stated by (Hughner
et al., 2007, p.103). This shows that education about how organic foods are produced,
processed, and marketed, helps the consumer to understand how the retail price point is
reached and aids in the purchasing decision (Yiridoe et al., 2004).
Research has shown that while some shoppers say that price puts them off buying
organic, those who do understand why there is a price difference are prepared to pay for it.
This may be a reflection of the degree of importance of the perceived benefits of the organic
product (Hill & Lynchehaun, 2002). Consumers use price to form opinions about the
quality and taste of organic food items (Hughner et al., 2007). Price, in this case, is seen as
an investment in a higher quality of product, better taste, or an investment in health. Also,
higher price premiums support the value of labor and alternative methods used to cultivate
or produce the product (Yiridoe et al., 2004).
Availability and insufficient marketing
The lack of availability of organic foods in the market place is another barrier of
purchase (Hughner et al., 2007). There is no balance in the distribution chains of organic
foods. Select stores such as Kroger and Walmart do offer US Department of Agriculture
15
(USDA) Certified organic produce and products, but in general, organic foods and products
can only be purchased at specialty stores, where organic, sustainability, and locally sourced
are central themes. Research suggests that, “store choice is a critical variable in explaining
purchases of organic foods as long as organic products persist in not being regularly
available in most mainstream supermarkets.” (Thompson, 1998, p.1116; Buder, Feldmann,
& Hamm, 2014). Usually it is only the steadfast consumers who are the ones most willing
to venture outside their habitual shopping behavior to find products. Those less loyal may
lack the desire to look further than their neighborhood grocery store (Hill & Lynchehaun,
2002).
The lack of marketing to the general public about organic food is almost non-
existent. There is a lack of promotion and merchandizing in the organic food market
(Hughner et al., 2007). R.K. Hutchings and L.A. Greenhalgh suggest: “in order to promote
organic produce as a means of satisfying increasingly sophisticated consumer needs, it is
necessary to develop a cohesive market strategy, which depends on a better fuller
understanding of food consumers, considers all parties in the food chain, and should be
initiated & led by senior management figures in the industry” (Hutchins & Grennhalgh,
1997, p. 336). If consumers do not see a promoted benefit in organic foods they are less
likely to make purchases.
Taste
No one person has the same number of taste buds. The average person has between
2,000-10,000 taste buds. Taste is considered the weakest of the five senses, all of which
are interconnected. The taste sense tells the brain whether to swallow or not, based upon a
16
food being spoiled or fresh, palatable or unpalatable. A person’s taste preferences mature
over time and do not decline with age. Generally females tend to have more taste buds than
males do, making them more sensitive to different kinds of tastes such as sweet versus
sour. Taste is considered a subjective issue (Hill & Lynchehaun, 2002); specifically, taste
is not based on one specific thing, but is influenced by setting and circumstance.
Understanding how taste and flavor affect choice is important. Essentially people
eat not only to stay alive, but for the enjoyment of it (Clark, 1998). Taste is one of the main
determinants of organic food purchases and consumers often associate the higher price
premiums of organic foods with quality. Quality in this case, is taste. They believe that if
they are paying more for organic food, naturally it should taste better (Hughner et al.,
2007).
It was concluded by Fillion & Arazi, (2002), when testing organic and non-organic
orange juices and milks for differences in taste and quality that even though the organic
orange juices were percieved to taste better than the conventional, and no perceived
differences were found between the milks; “the broad claim that all organic food tastes
different from all conventional food is not a valid one. It necessary to treat each product
type separately, and rephrase the claim accordingly.” (Fillion & Arazi, 2002, p. 157).
Summary
The organic industry is booming. Now more than ever, consumers are seeking to
make lifestyle changes, with health being the number one reason for buying organic. There
is general consensus in the literature on the reasons why people buy organic food. These
have remained stable over time and although there are some slight differences between
17

countries and particular products, the main reasons are: issues associated with personal
health; product quality and concern about degradation of the natural environment. With
price being the main deterrent of purchasing organic and the education of the consumer
about organic prices has been suggested (Aertsens et al., 2009; Dimitri & Dettmann,
Hughner, et al. 2007, 2012 & Pearson et al., 2010 & (Yiridoe et al. 2004). Without
knowledge, there can be no change in purchasing decisions. Research has shown that while
many consumers buy organic, it is not on a consistent basis. Hence they switch between
organic and conventional on a regular basis (Buder, Feldmann, & Hamm, 2014; Pearson,
Henryks, & Jones, 2010; Davies, Titterington, & Conchrane, 1995).
18

Chapter Three
Methodology
The purpose of this study is to determine whether or not consumers can taste the
difference between organic and conventionally grown fruits, vegetables, meats and dairy
products. As well as determine students purchasing perceptions of organic food as it relates
to their health, environmental benefits and pricing, what types of organic foods college
students purchase and whether area of residence influences the palate when identifying
differences between organic and conventional foods.
Research Design
This study utilized a cross-sectional design to obtain the information being sought.
Qualitative and quantitative data were collected and evaluated. Three (3) groups comprised
of both young men and women, attending, a midsize, 30,000+, university in the south USA
were asked to participate in sensory evaluation over two consecutive days. The following
week after the sensory evaluation, the same three groups were asked to fill out a separate
questionnaire related to the study. This was also done over two consecutive days. The study
received IRB approval before going forward with the sensory evaluation.
19
Sample
The sample used for this study would be described as a convenience sample,
because these college students were suitable and convenient to test the hypotheses
presented. Participants, both male and female, were students registered for three (3)
different sections of Principles of Food Preparation, a class offered by the Department of
Dietetics and Human Nutrition. In order to satisfy the inclusion criteria, participants had
to be a student of the university and be registered for the food preparation class.
Procedures
As a result of the study being conducted during three separate class periods,
participants were asked to move through the samples, in their assigned class groups of three
for the first part of the study. The first two class sections were evaluated on a Wednesday
at nine a.m. and at 1 p.m. The last section was evaluated the next day on Thursday at 5:30
p.m. Each class had 7-8 groups of three. Before starting each evaluation, the printed
instructions were read out loud to the participants, as well as demonstrated. The second
installment of the study was conducted the following week, on the same days and at the
same times. Only this time the participants were asked simply, to fill out the additional
survey.
Participants were familiarized with the definitions of the following words;
Appearance, mouth-feel, aroma, flavor and after-taste. Definitions can be found in Table
3.1. The words listed were categories used to determine differences between the samples
20
offered for evaluation during the first phase of the study. Participants were then instructed
to read and re-read the instructions printed on the survey given to them. The instructions
were as follows:
Please rinse your mouth with water before starting. There are two samples in
each of the comparison sets for you to evaluate. Taste each of the samples in the set
in the sequence presented, from left to right, beginning with set 1. Take the entire
sample in your mouth. Please, no re-tasting.
Rinse your mouth with water between samples and spit out all samples and
water into assigned cup or bin. Proceed to the next set and repeat the tasting sequence.
There were four categories of samples; Fruits, Vegetables, Meat/Poultry, Eggs and
Dairy. There were three pairs of samples in the fruit category (apples, cantaloupes and
bananas), two pairs in the vegetable category (bell peppers and yellow summer squash),
which were kept raw for this study, two pairs in the Meat/Poultry category (whole chickens
and ground beef) and three pairs in the dairy category (hard boiled eggs, sharp cheddar
cheese and whole cow’s milk). Both the chicken and the beef were cooked without any
seasonings or additional oils. The chickens were roasted whole and the beef was cooked in
a skillet.
Participants were not instructed as to which was organic or conventional. Neither
did they know that it was an evaluation of organic versus conventional. All of the samples
labeled A were organic products and all of the samples labeled B were conventional
products. Participants were given bottles of water in order to rinse their mouths out after
21

each tasting. Surveys were returned to the proctor at the end of the evaluation, counted and
cross-checked against each sections attendance sheet.
The food items used to conduct the evaluation, were purchased from Elmwood
Stock Farm, Kroger®, and the Good Foods Cooperative. All located less than two hours’
drive from the site of the testing.
Table 3.1
Definitions
Appearance
Characteristics that encompass all visually perceptible sensory impressions of a food.
Examples include shape, surface, structure, colour, luster, clarity, cloudiness, opalescence.
Mouth-feel Sum of tactile and kinesthetic, thermal and nociceptive perceptions in the oral cavity, e.g.
hardness and elasticity.
Aroma Total (positive) olfactory impression gained from breathing through the nose and from expiratory olfaction.
Flavor The sum of olfactory, gustatory, thermal and haptic impressions.
After-taste Sensory impression that lasts longest after swallowing.
22
Instrument
The instrument of choice used in this study was a two part questionnaire. The first
was used during the sensory evaluation and had the sole purpose of collecting quantitative
data about the populations’ ability to blindly taste differences between organic (sample A)
and conventional (sample B) foods placed before them, in each category. The questionnaire
listed 24 questions. The first eight asked for demographic and background information,
such as name, time of class, the participant’s major, where he/she was from, college
classification, gender and race. See the Appendix for Qualtrics Survey.
Questions 9, 13, 16, and 19 focused on the taste and smell characteristics of each
paired sample. These questions asked participants to rate each sample (A&B) from each
category, (fruits, vegetables, meat/poultry and dairy) using a five point Likert scale, where
1=poor, 2=fair, 3=average, 4=good and 5=excellent, based on the following criteria;
Appearance (color), Appearance (shape), Mouth-feel, Aroma, Flavor and After-taste.
Questions 10, 11, 12, 14, 15, 17, 18, 20, 21 and 22 focused on asking how the
difference between the two paired samples in each category, would be rated. A multiple
choice format was used here for participants to select their response. The answer choices
for this group of questions were as follows; Very slight difference, slight difference,
moderate difference, large difference and very large difference.
The second part of the questionnaire, carried somewhat of the same format as the
first, but gathered quantitative data in addition to qualitative. There were 14 questions total.
Again participants were asked to write their names and the date on the paper questionnaire.
Questions 3, 5, 6, 7, 9, 11, 12 and 13 also asked for participants to record their answer with
23

the use of numbers 1-5. One (1) being the least weighted and 5 the most weighted. In listed
order the questions as they were themed were as follows: 3. Factors influencing preference
of organic over conventional (Diet, well-being and Production practices), 5. Risk of
consuming conventional vs organic 6. Concern for the environment 7. How much does
buying organic help the environment 9. Affordability of organic vs conventional 11. Price
as it relates to purchasing 12. Branding of organic foods and 13. Labeling of organic foods.
Please see Appendix A for the questions not listed here.
The survey was developed and designed using the Qualtrics software website.
Surveys were not answered through a link, but rather on paper and then entered into the
built Qualtrics survey by the researcher.
Data Analysis
Raw data collected from the survey were uploaded from Qualtrics into the IBM
SPSS Statistics Version 22 program. Incomplete survey responses, resulted in missing data
fields within some of the data fields. Categorical variables were summarized with count
and percentages and continuous variables were summarized with mean and standard
deviation.
In order to determine if a difference in taste can be perceived between organic and
conventionally grown foods, independent sample t-tests were used to compare the
continuous five point Likert scale variables by gender and/or location (city, suburban or
rural). Paired sample t-tests were also used to compare student taste perceptions, first as
the total sample and then by gender for each of the food categories and their sample pairs.
A linear regression was used to find a relationship between gender and location and the
24

main barriers that hinder students from buying organic foods. Cross tabulations and
frequencies were used to determine what types of organic foods students purchased and
where they purchased them. Cross-tabs were also used to evaluate gender response to each
perception question. Strictly frequency percentages were used in these cases to report
results. A p-value of 0.05 or less was used to determine statistical significance.
25

Chapter Four
Results
There was a final total of 69 participants and a total of 64 participated in the second
half. Eleven (11) of the participants, were either vegetarian 10.1% (n= 7) or vegan 5.8%
(n= 4). These participants did not taste the meats and some or all of the dairy products. As
a result of this, they did not answer the questions related to these categories.
Demographics
The majority of the sample consisted of female 84.1% (n=58) female participants,
between the ages of 20 and 21. The sample was made up primarily of juniors (71%; n=49)
and Dietetic majors. Participants were asked to name the city and state where they were
from and then each city and state was then grouped into a city, suburban or rural area group.
55.1% (n=38) were from a city area, 23.2% (n=16) were from a suburban area and 21.7%
(n=15) were from a rural area. Majority of the participants identified as white 88.4% (n=61)
and 8.7% (6) identified as black. Refer to Tables 4.1, 4.2 and 4.3 for demographic
information.
26
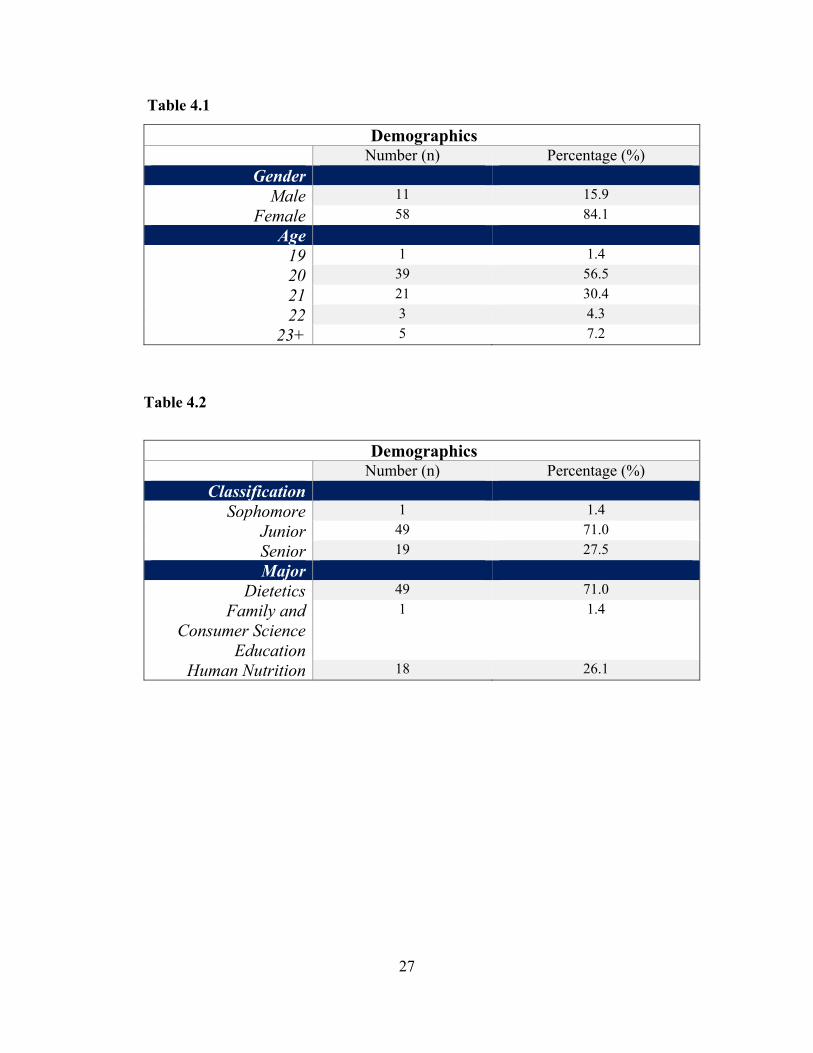
Table 4.1
Demographics Number (n) Percentage (%)
Gender Male 11 15.9
Female 58 84.1
Age 19 1 1.4
20 39 56.5
21 21 30.4
22 3 4.3
23+ 5 7.2
Table 4.2
Demographics Number (n) Percentage (%)
Classification Sophomore 1 1.4
Junior 49 71.0
Senior 19 27.5
Major Dietetics 49 71.0
Family and Consumer Science
Education
1 1.4
Human Nutrition 18 26.1
27
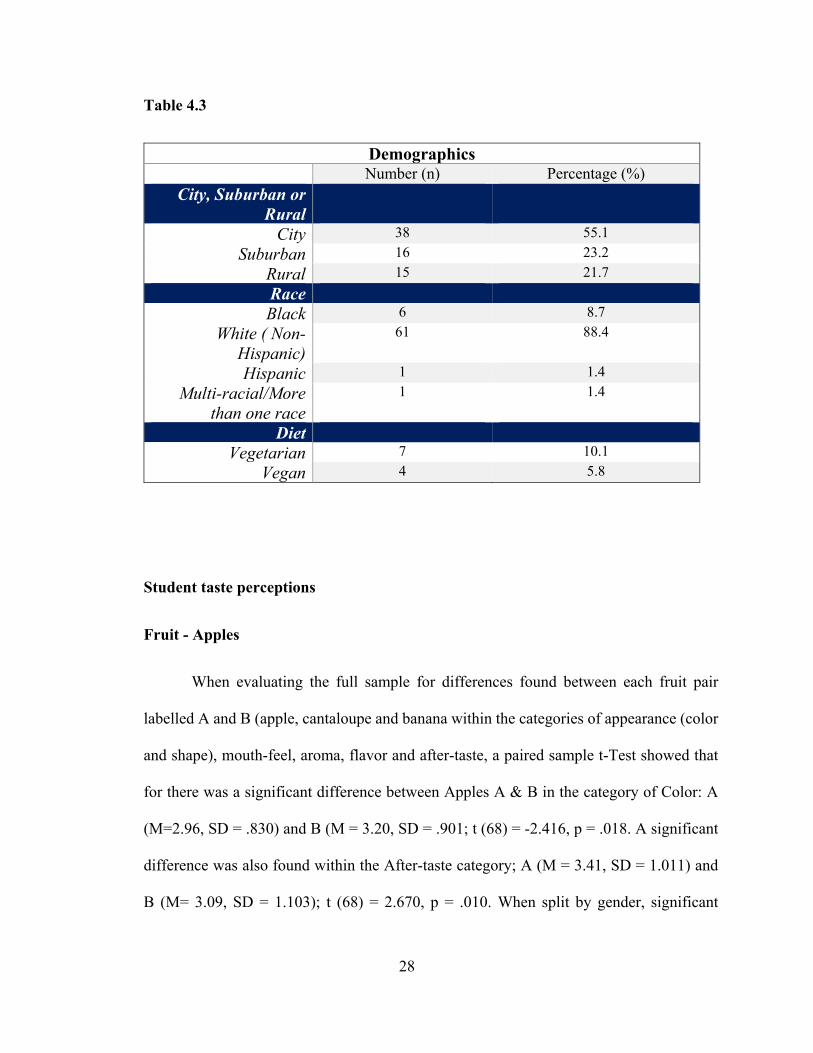
Table 4.3
Demographics Number (n) Percentage (%)
City, Suburban or Rural
City 38 55.1
Suburban 16 23.2
Rural 15 21.7
Race
Black 6 8.7
White ( Non-Hispanic)
61 88.4
Hispanic 1 1.4
Multi-racial/More than one race
1 1.4
Diet
Vegetarian 7 10.1
Vegan 4 5.8
Student taste perceptions
Fruit - Apples
When evaluating the full sample for differences found between each fruit pair
labelled A and B (apple, cantaloupe and banana within the categories of appearance (color
and shape), mouth-feel, aroma, flavor and after-taste, a paired sample t-Test showed that
for there was a significant difference between Apples A & B in the category of Color: A
(M=2.96, SD = .830) and B (M = 3.20, SD = .901; t (68) = -2.416, p = .018. A significant
difference was also found within the After-taste category; A (M = 3.41, SD = 1.011) and
B (M= 3.09, SD = 1.103); t (68) = 2.670, p = .010. When split by gender, significant
28

differences were only found within the Color and Flavor categories. Tables 4.4 and 4.5
provide the full results for both sets of paired sample t-tests.
A frequency test showed that when asked to rate the difference between Apple A
and Apple B of the total sample, the majority responded; 36.2% (n=25) said there was a
Slight difference while only 1.4% (n=1) said that there was a Large difference. A Cross-
tab comparison by gender of the same variable showed that according to Males (n=10) and
Females (n =55); 0% (0) and 1.5% (n=1) respectively said that there was a Large difference,
3.1%( n=2) and 29.2% (n=19) respectively said that there was a Moderate difference, 9.2%
(n=6) and 29.2% (n=19) respectively said there was a Slight difference and 3.1% (n=2) and
24.6% (n=16) respectively said there was a Very slight difference between the two samples.
An independent sample t-test conducted to test compare the ratings of difference
between Apple and Apple B by gender, showed no significant difference between Males
(M = 2.00, SD .667) and Females (M = 2.09, SD .845); t (63) = -.322, p = .749. Tables 4.4
and 4.5 provide the full results for both sets of paired sample t-tests.
29
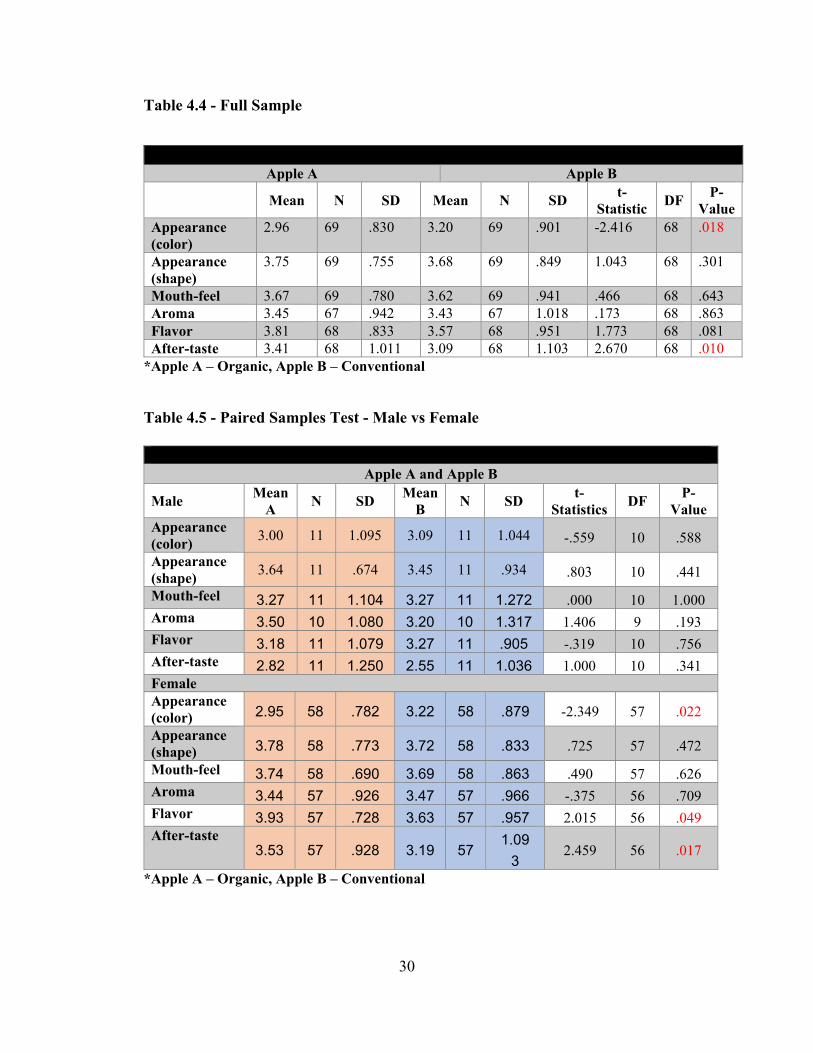
Table 4.4 - Full Sample
*Apple A – Organic, Apple B – Conventional
Table 4.5 - Paired Samples Test - Male vs Female
*Apple A – Organic, Apple B – Conventional
Apple A Apple B
Mean N SD Mean N SD t-
Statistic DF
P-Value
Appearance (color)
2.96 69 .830 3.20 69 .901 -2.416 68 .018
Appearance (shape)
3.75 69 .755 3.68 69 .849 1.043 68 .301
Mouth-feel 3.67 69 .780 3.62 69 .941 .466 68 .643 Aroma 3.45 67 .942 3.43 67 1.018 .173 68 .863 Flavor 3.81 68 .833 3.57 68 .951 1.773 68 .081 After-taste 3.41 68 1.011 3.09 68 1.103 2.670 68 .010
Apple A and Apple B
Male Mean
A N SD
Mean B
N SD t-
Statistics DF
P-Value
Appearance (color)
3.00 11 1.095 3.09 11 1.044 -.559 10 .588
Appearance (shape)
3.64 11 .674 3.45 11 .934 .803 10 .441
Mouth-feel 3.27 11 1.104 3.27 11 1.272 .000 10 1.000 Aroma 3.50 10 1.080 3.20 10 1.317 1.406 9 .193 Flavor 3.18 11 1.079 3.27 11 .905 -.319 10 .756 After-taste 2.82 11 1.250 2.55 11 1.036 1.000 10 .341 Female Appearance (color) 2.95 58 .782 3.22 58 .879 -2.349 57 .022
Appearance (shape) 3.78 58 .773 3.72 58 .833 .725 57 .472
Mouth-feel 3.74 58 .690 3.69 58 .863 .490 57 .626 Aroma 3.44 57 .926 3.47 57 .966 -.375 56 .709 Flavor 3.93 57 .728 3.63 57 .957 2.015 56 .049 After-taste
3.53 57 .928 3.19 57 1.09
3 2.459 56 .017
30

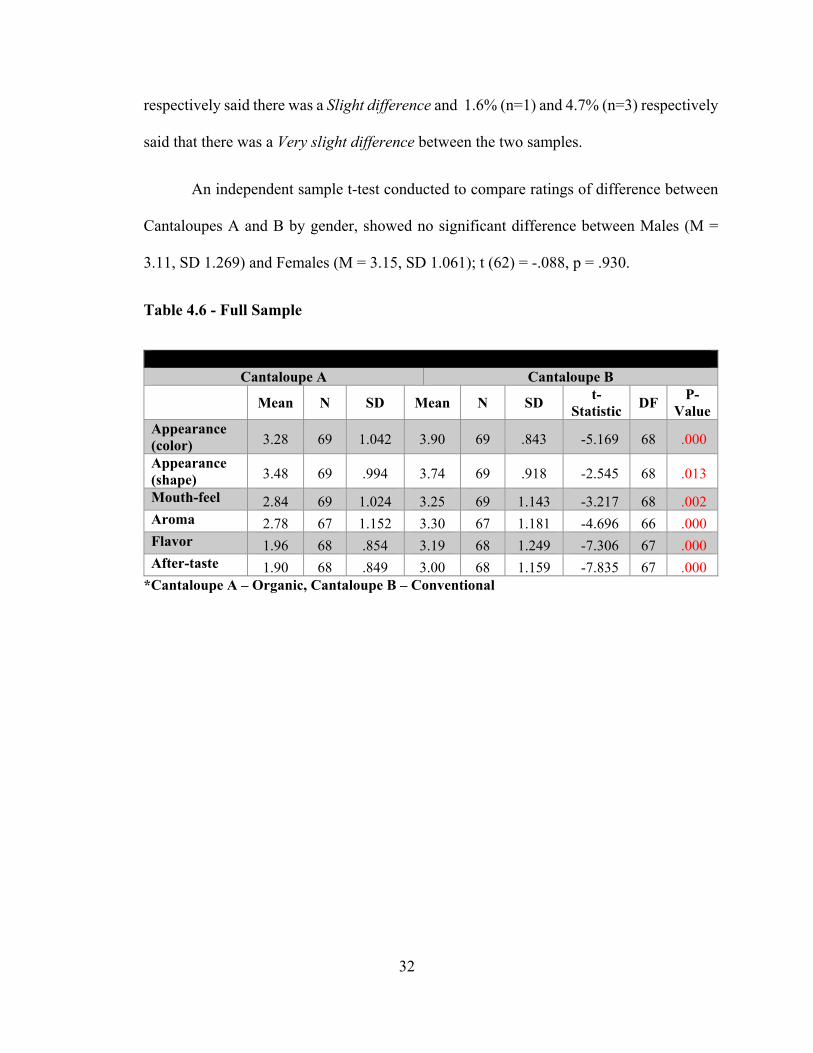
Cantaloupes
A paired sample t-Test found that there was a significant difference between both
cantaloupe samples, within all categories tested. Color; A(M=3.28, SD=1.042), B(M=
3.90); t(68) = -5.169, p=.000; Shape A(M=3.48, SD=.994), B(M=3.74, SD=.918); t(68)=
-2.545, p=.013; Mouth-feel A(M=2.84, SD=1.024), B(M=2.84, SD=1.024), B(M=3.25,
SD=1.143); t(68)= -3.217,p=.002; Aroma A(M=2.78, SD=1.152), B(M=3.30, SD=1.181);
t(66)= -4.696, p=.000; Flavor A(M=1.96, SD=.854), B(M=3.19, SD=1.249); t(67)= 7.306,
p=.000; After-taste A(M=1.90, SD=.849), B(M=3.00, SD=1.159); t(67)= -7.835, p=.000.
When split by gender significant differences were found within the Color and
After-taste categories among the Males, while among Females a significant difference were
found between both cantaloupe samples in all categories Tables 4.6 and 4.7 provide the
full results for both sets of paired sample t-tests.
A frequency test showed that when asked to rate the difference between Cantaloupe
A and B of the total sample 29% (n=20) said that there was a Large difference, 27.5%
(n=19) said there was a Moderate difference, 21.7% (n=15) said there was a Slight
difference, 8.7% (n=6) said there was a Very large difference and 5.8% (n=4) said there
was a Very Slight difference. A cross-tab comparison by gender of the same variable
showed that according to Males (n=9) and Females (n =55); 1.6% (n=1) and 7.8% (5)
respectively said that there was a Very Large difference, 3.1% (n=2) and 29.2% (n=19)
respectively said that there was a Large difference, 4.7% (n=3) and 26.6% (n=17)
respectively said there was a Moderate difference and 3.1% (n=2), 20.3% (n=13)
31
respectively said there was a Slight difference and 1.6% (n=1) and 4.7% (n=3) respectively
said that there was a Very slight difference between the two samples.
An independent sample t-test conducted to compare ratings of difference between
Cantaloupes A and B by gender, showed no significant difference between Males (M =
3.11, SD 1.269) and Females (M = 3.15, SD 1.061); t (62) = -.088, p = .930.
Table 4.6 - Full Sample
*Cantaloupe A – Organic, Cantaloupe B – Conventional
Cantaloupe A Cantaloupe B
Mean N SD Mean N SD
t-Statistic
DF P-
ValueAppearance (color) 3.28 69 1.042 3.90 69 .843 -5.169 68 .000
Appearance (shape) 3.48 69 .994 3.74 69 .918 -2.545 68 .013
Mouth-feel 2.84 69 1.024 3.25 69 1.143 -3.217 68 .002 Aroma 2.78 67 1.152 3.30 67 1.181 -4.696 66 .000 Flavor 1.96 68 .854 3.19 68 1.249 -7.306 67 .000 After-taste 1.90 68 .849 3.00 68 1.159 -7.835 67 .000
32

Table 4.7 - Paired Samples Test - Male vs Female
*Cantaloupe A – Organic, Cantaloupe B – Conventional
Bananas
Evaluation of the Banana A and B samples showed that only Color was significant;
A (M= 2.28, SD = .873) and B (M= 2.49, SD = 1.024), t (68) = -3.352, p=.001. All other
categories were found not to have any significant differences. When comparing the sample
by gender once again only Color among the Females showed a significant difference; A
(M= 2.31, SD.883) and B (m=2.52, SD = 1.047), t (57) = -3.236, p= .002. Tables 4.8 and
4.9 provide the full results for both sets of paired sample t-tests.
Cantaloupe A and Cantaloupe B
Male Mean
A N SD
Mean B
N SD t-
Statistics
DF P-
Value
Appearance (color) 3.00 11 1.000 3.73 11 .786 -2.390 10 .038
Appearance (shape) 3.09 11 1.044 3.55 11 .934 -1.614 10 .138
Mouth-feel 2.36 11 1.027 2.73 11 1.104 -1.077 10 .307 Aroma 2.30 10 .949 2.80 10 1.135 -1.464 9 .177 Flavor 1.82 11 .874 2.55 11 1.293 -1.551 10 .152 After-taste 1.82 11 .982 2.82 11 1.250 -2.622 10 .026 Female Appearance (color) 3.33 58 1.049 3.93 58 .856 -4.561 57 .000
Appearance (shape) 3.55 58 .976 3.78 58 .918 -2.035 57 .046
Mouth-feel 2.93 58 1.006 3.34 58 1.132 -3.020 57 .004 Aroma 2.86 57 1.172 3.39 57 1.176 -4.472 56 .000 Flavor 1.98 57 .855 3.32 57 1.212 -7.435 56 .000 After-taste 1.91 57 .830 3.04 57 1.149 -7.367 56 .000
33
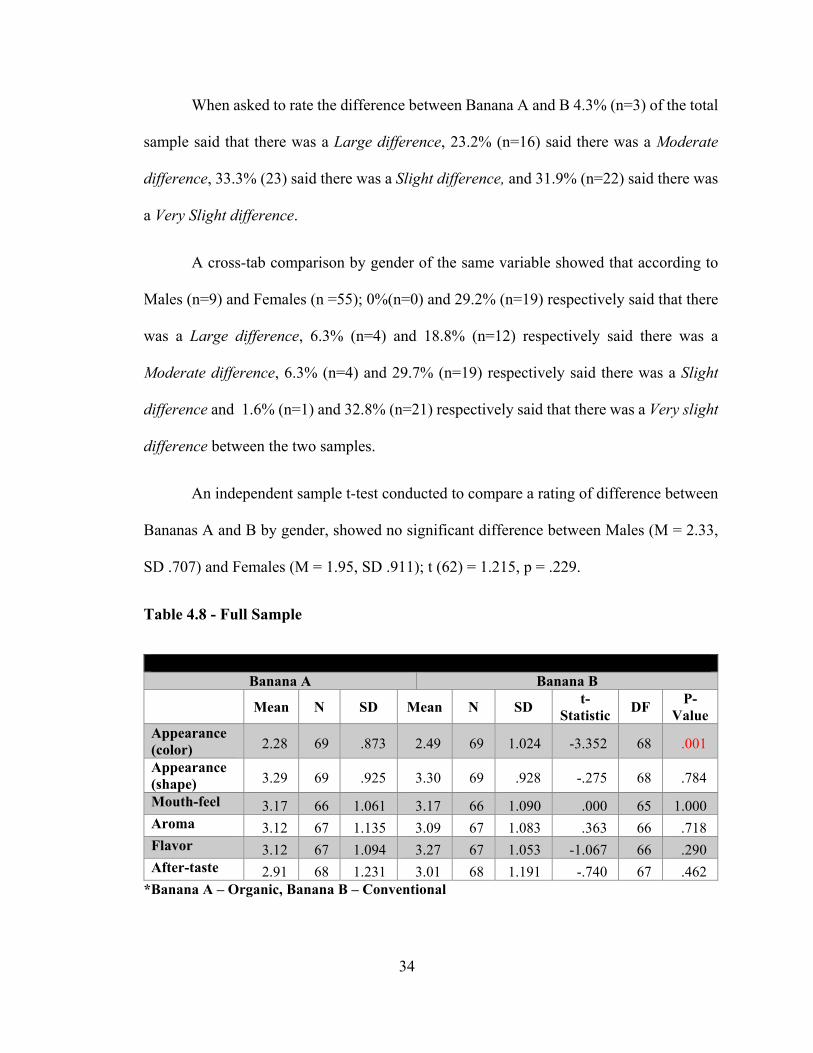
When asked to rate the difference between Banana A and B 4.3% (n=3) of the total
sample said that there was a Large difference, 23.2% (n=16) said there was a Moderate
difference, 33.3% (23) said there was a Slight difference, and 31.9% (n=22) said there was
a Very Slight difference.
A cross-tab comparison by gender of the same variable showed that according to
Males (n=9) and Females (n =55); 0%(n=0) and 29.2% (n=19) respectively said that there
was a Large difference, 6.3% (n=4) and 18.8% (n=12) respectively said there was a
Moderate difference, 6.3% (n=4) and 29.7% (n=19) respectively said there was a Slight
difference and 1.6% (n=1) and 32.8% (n=21) respectively said that there was a Very slight
difference between the two samples.
An independent sample t-test conducted to compare a rating of difference between
Bananas A and B by gender, showed no significant difference between Males (M = 2.33,
SD .707) and Females (M = 1.95, SD .911); t (62) = 1.215, p = .229.
Table 4.8 - Full Sample
*Banana A – Organic, Banana B – Conventional
Banana A Banana B
Mean N SD Mean N SD
t-Statistic
DF P-
Value Appearance (color) 2.28 69 .873 2.49 69 1.024 -3.352 68 .001
Appearance (shape) 3.29 69 .925 3.30 69 .928 -.275 68 .784
Mouth-feel 3.17 66 1.061 3.17 66 1.090 .000 65 1.000 Aroma 3.12 67 1.135 3.09 67 1.083 .363 66 .718 Flavor 3.12 67 1.094 3.27 67 1.053 -1.067 66 .290 After-taste 2.91 68 1.231 3.01 68 1.191 -.740 67 .462
34
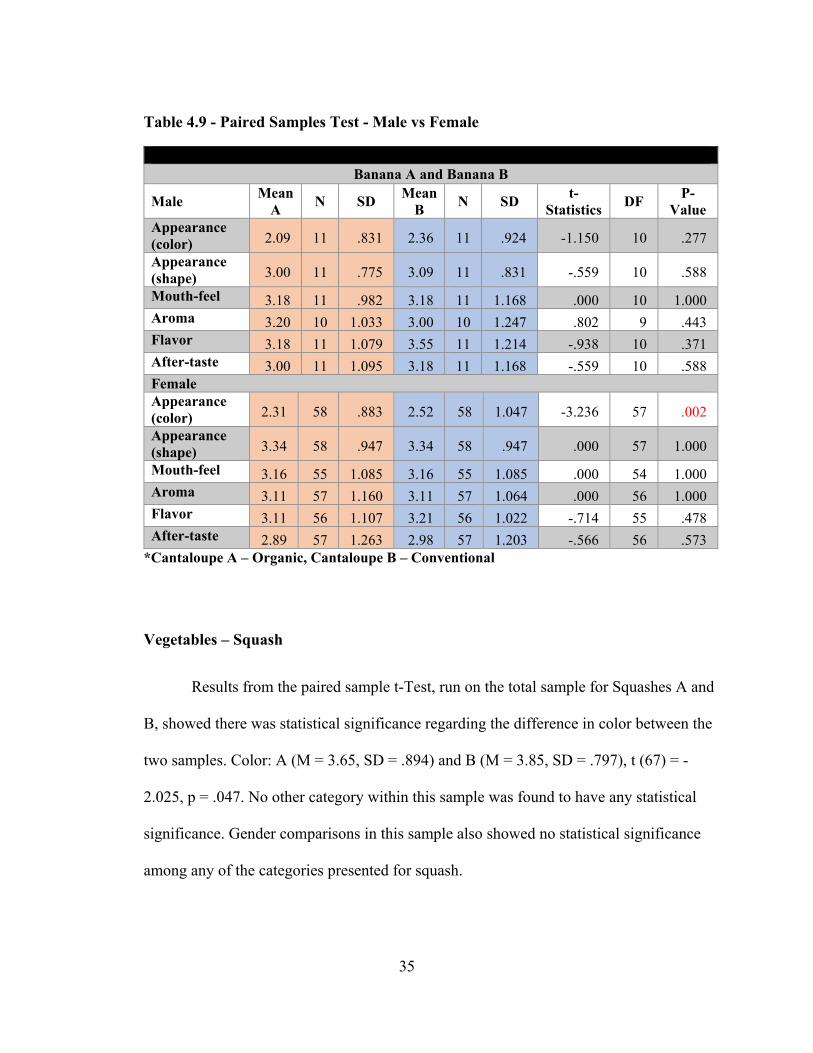
Table 4.9 - Paired Samples Test - Male vs Female
*Cantaloupe A – Organic, Cantaloupe B – Conventional
Vegetables – Squash
Results from the paired sample t-Test, run on the total sample for Squashes A and
B, showed there was statistical significance regarding the difference in color between the
two samples. Color: A (M = 3.65, SD = .894) and B (M = 3.85, SD = .797), t (67) = -
2.025, p = .047. No other category within this sample was found to have any statistical
significance. Gender comparisons in this sample also showed no statistical significance
among any of the categories presented for squash.
Banana A and Banana B
Male Mean
A N SD
Mean B
N SD t-
Statistics DF
P-Value
Appearance (color) 2.09 11 .831 2.36 11 .924 -1.150 10 .277
Appearance (shape) 3.00 11 .775 3.09 11 .831 -.559 10 .588
Mouth-feel 3.18 11 .982 3.18 11 1.168 .000 10 1.000 Aroma 3.20 10 1.033 3.00 10 1.247 .802 9 .443 Flavor 3.18 11 1.079 3.55 11 1.214 -.938 10 .371 After-taste 3.00 11 1.095 3.18 11 1.168 -.559 10 .588 Female Appearance (color) 2.31 58 .883 2.52 58 1.047 -3.236 57 .002
Appearance (shape) 3.34 58 .947 3.34 58 .947 .000 57 1.000
Mouth-feel 3.16 55 1.085 3.16 55 1.085 .000 54 1.000 Aroma 3.11 57 1.160 3.11 57 1.064 .000 56 1.000 Flavor 3.11 56 1.107 3.21 56 1.022 -.714 55 .478 After-taste 2.89 57 1.263 2.98 57 1.203 -.566 56 .573
35

When asked to rate the difference between Squash A and B, 18.8% (n=13) of the
total sample said that there was a Large difference, 23.2% (n=16) said there was a Moderate
difference, 20.3% (n=14) said there was a Slight difference, and 30.4% (n=21) said there
was a Very Slight difference.
A gender comparison showed that Males (n = 9) and Females (n=55); 0%(n=0) and 20.3%
(n=13) respectively said that there was a Large difference, 4.7% (n=3) and 20.3% (n=13)
respectively said there was a Moderate difference, 4.7% (n=3) and 17.2% (n=11)
respectively said there was a Slight difference and 4.7% (n=3) and 28.1% (n=18)
respectively said that there was a Very slight difference between the two samples.
An independent sample t-test conducted to compare the ratings of differences
between Squashes A and B by gender, showed no significant difference between Males (M
= 2.00 SD .856) and Females (M = 2.38, SD .159); t (62) = -.929, p = .356. Tables 4.10
and 4.11 provide the full results for both sets of paired sample t-tests.
Table 4.10 - Full Sample
*Squash A – Organic, Squash B – Conventional
Squash A Squash B
Mean N SD Mean N SD t-
Statistic DF
P-Value
Appearance (color) 3.65 68 .894 3.85 68 .797 -2.025 67 .047
Appearance (shape) 3.72 68 .826 3.72 68 .844 .000 67 1.000
Mouth-feel 2.67 67 .877 2.60 67 .906 .617 66 .539 Aroma 2.31 67 .857 2.39 67 .920 -1.000 66 .321 Flavor 2.16 67 .963 2.30 67 .938 -1.000 66 .321 After-taste 2.15 68 .981 2.13 68 .960 .116 67 .908
36
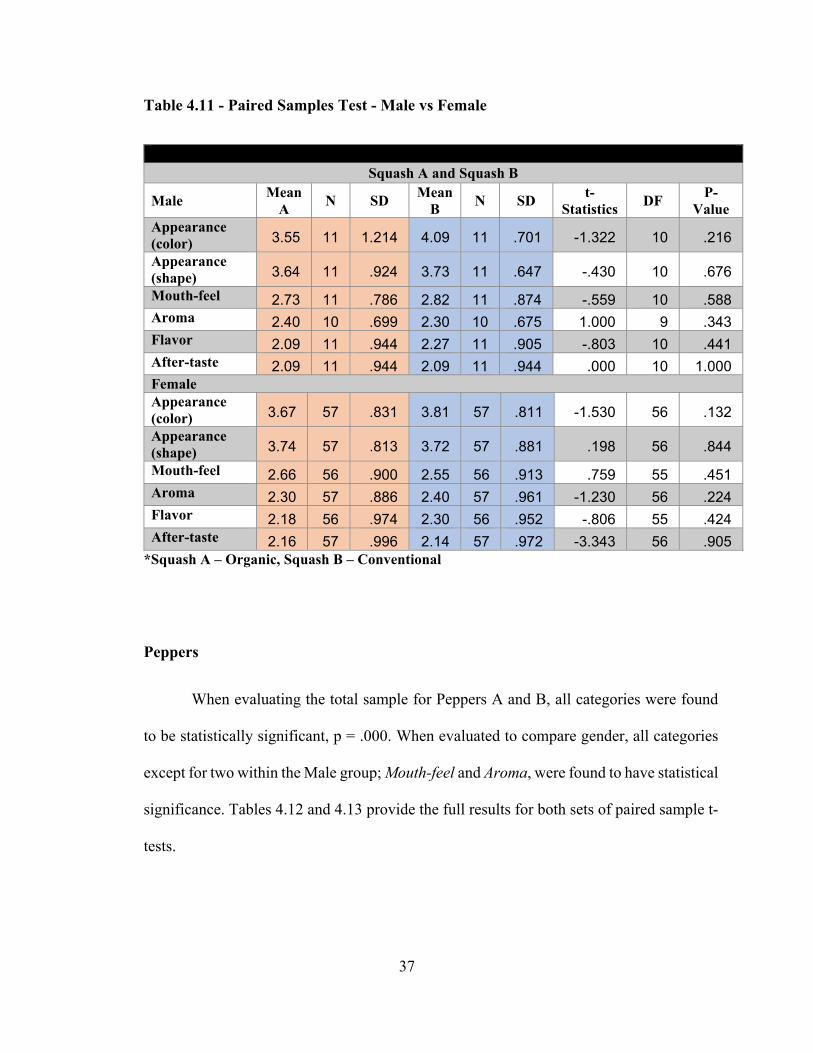
Table 4.11 - Paired Samples Test - Male vs Female
*Squash A – Organic, Squash B – Conventional
Peppers
When evaluating the total sample for Peppers A and B, all categories were found
to be statistically significant, p = .000. When evaluated to compare gender, all categories
except for two within the Male group; Mouth-feel and Aroma, were found to have statistical
significance. Tables 4.12 and 4.13 provide the full results for both sets of paired sample t-
tests.
Squash A and Squash B
Male Mean
A N SD
Mean B
N SD t-
Statistics DF
P-Value
Appearance (color) 3.55 11 1.214 4.09 11 .701 -1.322 10 .216
Appearance (shape) 3.64 11 .924 3.73 11 .647 -.430 10 .676
Mouth-feel 2.73 11 .786 2.82 11 .874 -.559 10 .588 Aroma 2.40 10 .699 2.30 10 .675 1.000 9 .343 Flavor 2.09 11 .944 2.27 11 .905 -.803 10 .441 After-taste 2.09 11 .944 2.09 11 .944 .000 10 1.000 Female Appearance (color) 3.67 57 .831 3.81 57 .811 -1.530 56 .132
Appearance (shape) 3.74 57 .813 3.72 57 .881 .198 56 .844
Mouth-feel 2.66 56 .900 2.55 56 .913 .759 55 .451 Aroma 2.30 57 .886 2.40 57 .961 -1.230 56 .224 Flavor 2.18 56 .974 2.30 56 .952 -.806 55 .424 After-taste 2.16 57 .996 2.14 57 .972 -3.343 56 .905
37

When asked to rate the difference between Peppers A and B 5.8% (n=4) of the total
sample said that there was a Very large difference, 14.5% (n=10) said there was a Large
difference, 33.3% (23) said that there was a Moderate difference, 24.6% (n=17) said there
was a Slight difference, and 15.9% (11) said there was a Very Slight difference.
A gender comparison showed that Males (n = 9) and Females (n = 56);1.5% (n=1)
and 4.6% (n=3) respectively said that there was Very large difference, 4.6%(n=3) and
10.8% (n=7) respectively said that there was a Large difference, 3.1% (n=2) and 32.3%
(n=21) respectively said there was a Moderate difference, 1.5% (n=1) and 24.6% (n=16)
respectively said there was a Slight difference and 3.1% (n=2) and 13.8% (n=9)
respectively said that there was a Very slight difference between the two samples.
An independent sample t-test conducted to compare the rating of differences
between Peppers A and B by gender, showed no significant difference between Males (M
= 3.00 SD .471) and Females (M = 2.63, SD .143); t (63) = -.932, p = .355.
Table 4.12 - Full Sample
*Peppers A – Organic, Peppers B – Conventional
Peppers A Peppers B
Mean N SD Mean N SD t-
Statistic DF
P-Value
Appearance (color) 3.16 68 1.101 4.32 68 .679 -9.164 67 .000
Appearance (shape) 3.46 68 .953 4.25 68 .699 -6.747 67 .000
Mouth-feel 2.90 68 .964 3.41 68 1.026 -4.685 67 .000 Aroma 2.84 68 1.031 3.32 68 1.014 -3.888 67 .000 Flavor 2.51 68 1.203 3.34 68 1.229 -4.769 67 .000 After-taste 2.28 68 1.144 2.88 68 1.127 -4.024 67 .000
38

Table 4.13 - Paired Samples Test - Male vs Female
*Peppers A – Organic, Peppers B – Conventional
Meat – Chicken
When evaluating the total sample for Chicken A and B, all categories were found
to be not statistically significant. When evaluated to compare gender, all categories
except for two each, both in the Male and Female groups, were found to have statistical
significance Flavor and After-taste. Male: Flavor A (M = 3.00, SD = .943), B (M = 3.60,
SD = 1.075), t (9) = -3.674, p = .005 and After-taste A (M = 2.70, SD = 1.252), B (M =
Peppers A and Peppers B
Male Mean
A N SD
Mean B
N SD t-
Statistics DF
P-Value
Appearance (color) 3.18 11 1.471 4.27 11 .647 -2.782 10 .019
Appearance (shape) 3.45 11 1.036 4.27 11 .467 -3.105 10 .011
Mouth-feel 3.00 11 1.183 3.27 11 1.104 -1.399 10 .192 Aroma 2.55 11 1.214 3.36 11 1.120 -2.170 10 .055 Flavor 2.55 11 1.293 3.55 11 1.036 -2.472 10 .033 After-taste 2.27 11 1.348 3.09 11 1.136 -2.516 10 .031 Female Appearance (color) 3.16 57 1.031 4.33 57 .690 -8.855 56 .000
Appearance (shape) 3.46 57 .946 4.25 57 .739 -5.989 56 .000
Mouth-feel 2.88 57 .927 3.44 57
1.01
8 -4.484 56 .000
Aroma 2.89 57 .994 3.32 57
1.00
3 -3.240 56 .002
Flavor 2.51 57 1.197 3.30 57
1.26
7 -4.115 56 .000
After-taste 2.28 57 1.114 2.84 57
1.13
1 -3.343 56 .001
39

3.20, SD = 1.033); t (9) = -3.000, p = .015. Female: Flavor A (M = 3.23, SD =1.026), B
(M = 2.85, SD = .908); t (46) = 2.207, p=.032 and After-taste A (M= 3.04, SD = 1.141),
B (M = 2.70, SD = .998); t (46) = 2.069, p= .044.
When asked to rate the difference between Chicken A and B 8.7% (n=6) of the total
sample said that there was a Large difference, 21.7% (n=15) said there was a Moderate
difference, 26.1% (n=18) said there was a Slight difference, and 20.3% (n=14) said there
was a Very Slight difference.
A gender comparison showed that Males (n = 7) and Females (n = 46); 0%(0) and
11.3% (n=6) respectively said that there was a Large difference, 3.8% (n=2) and 24.5%
(n=13) respectively said there was a Moderate difference, 3.8% (n=2) and 30.2% (n=16)
respectively said there was a Slight difference and 5.7% (n=3) and 20.8% (n=11)
respectively said that there was a Very slight difference between the two samples.
An independent sample t-test conducted to compare the rating of differences
between Chickens A and B by gender, showed no significant difference between Males (M
= 2.00 SD .289) and Females (M = 2.38, SD .159); t (62) = -.929, p = .356. Tables 4.14
and 4.15 provides the full results for both sets of paired sample t-tests.
40

Table 4.14- Full Sample
*Chicken A – Organic, Chicken B – Conventional
Table 4.15 - Paired Samples Test- Male vs Female
*Chicken A – Organic, Chicken B – Conventional
Chicken A Chicken B
Mean N SD Mean N SD t-
Statistic DF
P-Value
Appearance (color) 3.62 58 .895 3.59 58 .726 .362 57 .718
Appearance (shape) 3.55 58 .862 3.43 58 .861 1.264 57 .211
Mouth-feel 2.98 57 1.077 2.86 57 1.008 .708 56 .482 Aroma 3.04 57 1.034 2.89 57 .976 1.383 56 .172 Flavor 3.19 57 1.008 2.98 57 .973 1.369 56 .176 After-taste 2.98 57 1.157 2.79 57 1.013 1.333 56 .188
Chicken A and Chicken B
Male Mean
(A) N SD
Mean (B)
N SD t-
Statistics DF
P-Value
Appearance (color) 4.00 10 .943 3.80 10 .632 .612 9 .555
Appearance (shape) 3.60 10 1.075 3.30 10 1.160 1.964 9 .081
Mouth-feel 2.60 10 1.075 3.00 10 1.333 -1.309 9 .223 Aroma 2.50 10 .972 2.50 10 1.080 .000 9 1.000 Flavor 3.00 10 .943 3.60 10 1.075 -3.674 9 .005 After-taste 2.70 10 1.252 3.20 10 1.033 -3.000 9 .015 Female Appearance (color) 3.54 48 .874 3.54 48 .743 .000 47 1.000
Appearance (shape) 3.54 48 .824 3.46 48 .798 .753 47 .455
Mouth-feel 3.06 47 1.071 2.83 47 .940 1.184 46 .242 Aroma 3.15 47 1.021 2.98 47 .944 1.430 46 .160 Flavor 3.23 47 1.026 2.85 47 .908 2.207 46 .032 After-taste 3.04 47 1.141 2.70 47 .998 2.069 46 .044
41

Beef
Evaluation of the Beef A and B samples showed that Color, Mouth-feel, Flavor
and After-taste categories to have statistical significance. Color: A (M= 3.17, SD = .939)
and B (M= 3.38, SD = .914), t (57) = -2.842, p=.006. Mouth-feel: A (M = 2.36, SD =
.883) and B (M = 2.64, SD = 1.034), t (55) = -3.276, p=.002. Flavor: A (M =1.79, SD
=.773) and B (M= 2.39, SD = 1.013), t (56) = -4.879, p= .000 and After-taste: A
(M=1.68, SD = .789) and B (M =2.02, SD =.924), t (55) =-3.300, p=.002. Gender
comparisons showed no statistical significance within the Male group. However the
Female group showed statistically significant values, again within the Color, Mouth-feel,
Flavor and After-taste. Color; A (M= 3.15, SD = .945) and B (M= 3.35, SD = .934), t
(47) = -2.840, p=.017. Mouth-feel; A (M = 2.35, SD = .900) and B (M = 2.61, SD =
1.000), t (45) = -2.890, p=.006. Flavor; A (M =1.74, SD =.765) and B (M= 2.34, SD =
1.048), t (46) = -4.534, p= .000 and After-taste; A (M=1.63, SD = .771) and B (M =1.93,
SD =.904), t (45) = -2.970, p=.005.
When asked to rate the difference between Beef A and B, 1.4% (n=1) said that there
was a Very large difference, 7.2% (n=5) of the total sample said that there was a Large
difference, 11.6% (n=8) said there was a Moderate difference, 29.1% (n=27) said there was
a Slight difference, and 17.4% (n=12) said there was a Very Slight difference.
A gender comparison showed that Males (n = 7) and Females (n = 46); 0% (n=0)
and 1.9% (n=1) respectively said that there was a Very large difference, 0.0% (n=0) and
9.4% (n=5) respectively said that there was a Large difference, 1.9% (n=1) and 13.2%
42

(n=7) respectively said there was a Moderate difference, 5.7% (n=3) and 45.3% (n=24)
respectively said there was a Slight difference and 5.7% (n=3) and 17.0% (n=9)
respectively said that there was a Very slight difference between the two samples.
An independent sample t-test conducted to compare the rating of differences
between Beef A and B by gender, showed no significant difference between Males (M =
1.71 SD .756) and Females (M = 2.24, SD .970); t (51) = -1.365, p = .178. Tables 4.16 and
4.17 provide the full results for both sets of paired sample t-tests.
Table 4.16 -Full Sample
*Beef A – Organic, Beef B – Conventional
Beef A Beef B
Mean N SD Mean N SD t-
Statistic DF
P-Value
Appearance (color)
3.17 58 .939 3.38 58 .914 -2.842 57 .006
Appearance (shape)
3.22 58 .956 3.26 58 .983 -.574 57 .568
Mouth-feel 2.36 56 .883 2.64 56 1.034 -3.276 55 .002 Aroma 2.21 56 .909 2.32 56 .974 -1.287 55 .204 Flavor
1.79 57 .773 2.39 57 .1.013 -4.879 56 .000
After-taste 1.68 56 .789 2.02 57 .924 -3.300 55 .002
43
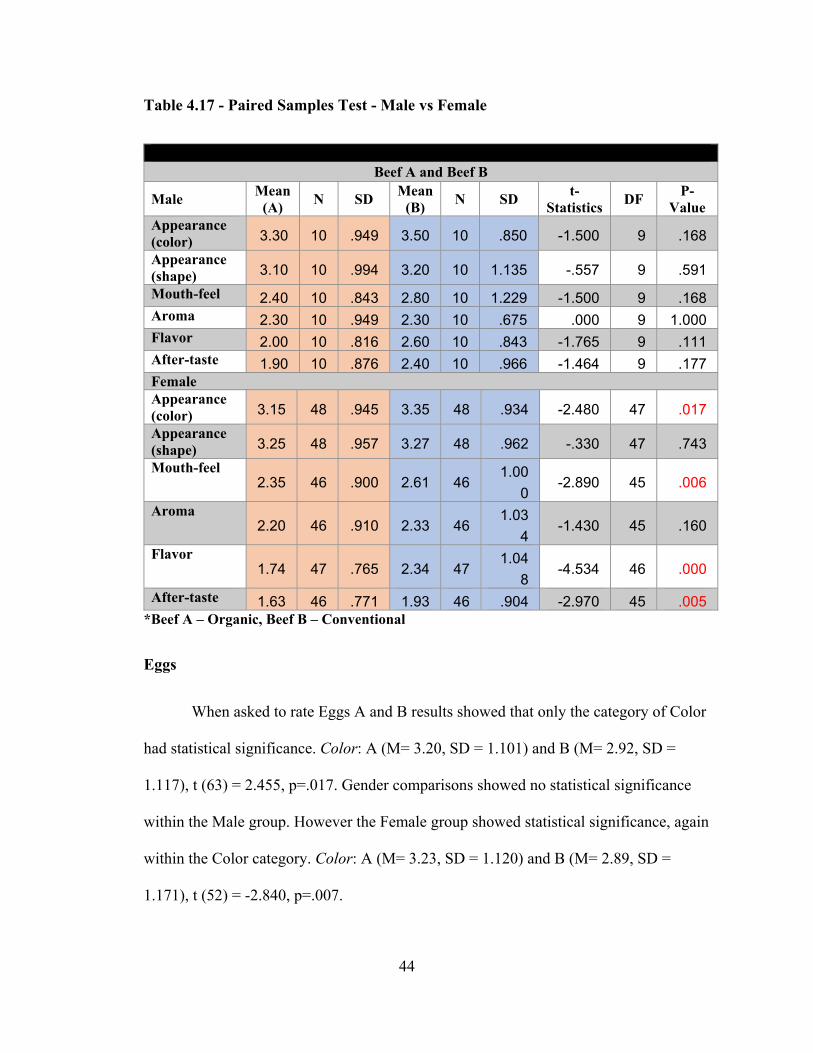
Table 4.17 - Paired Samples Test - Male vs Female
*Beef A – Organic, Beef B – Conventional
Eggs
When asked to rate Eggs A and B results showed that only the category of Color
had statistical significance. Color: A (M= 3.20, SD = 1.101) and B (M= 2.92, SD =
1.117), t (63) = 2.455, p=.017. Gender comparisons showed no statistical significance
within the Male group. However the Female group showed statistical significance, again
within the Color category. Color: A (M= 3.23, SD = 1.120) and B (M= 2.89, SD =
1.171), t (52) = -2.840, p=.007.
Beef A and Beef B
Male Mean
(A) N SD
Mean (B)
N SD t-
Statistics DF
P-Value
Appearance (color) 3.30 10 .949 3.50 10 .850 -1.500 9 .168
Appearance (shape) 3.10 10 .994 3.20 10 1.135 -.557 9 .591
Mouth-feel 2.40 10 .843 2.80 10 1.229 -1.500 9 .168 Aroma 2.30 10 .949 2.30 10 .675 .000 9 1.000 Flavor 2.00 10 .816 2.60 10 .843 -1.765 9 .111 After-taste 1.90 10 .876 2.40 10 .966 -1.464 9 .177 Female Appearance (color) 3.15 48 .945 3.35 48 .934 -2.480 47 .017
Appearance (shape) 3.25 48 .957 3.27 48 .962 -.330 47 .743
Mouth-feel 2.35 46 .900 2.61 46
1.00
0 -2.890 45 .006
Aroma 2.20 46 .910 2.33 46
1.03
4 -1.430 45 .160
Flavor 1.74 47 .765 2.34 47
1.04
8 -4.534 46 .000
After-taste 1.63 46 .771 1.93 46 .904 -2.970 45 .005
44

When asked to rate the difference between Eggs A and B, 2.9% (n=2) said that
there was a Large difference, 11.6% (n=8) said there was a Moderate difference, 44.9%
(n=31) said there was a Slight difference, and 29% (n=20) said there was a Very Slight
difference.
A gender comparison showed that Males (n=10) and Females (n=51); 0%(n=0) and 3.3%
(n=2) respectively said that there was a Large difference, 3.3% (n=2) and 9.8% (n=6)
respectively said there was a Moderate difference, 9.8% (n=6) and 41.0% (n=) respectively
said there was a Slight difference and 3.3% (n=2) and 29.5% (n=18) respectively said that
there was a Very slight difference between the two samples.
An independent sample t-test conducted to compare the rating of differences
between Eggs A and B by gender, showed no significant difference between Males (M =
2.00 SD .667) and Females (M = 1.84, SD .784); t (59) =. 1, p = .557. Tables 4.18 and 4.19
provide the full results for both sets of paired sample t-tests.
Table 4.18- Full Sample
*Eggs A – Organic, Eggs B – Conventional
Egg A Egg B
Mean N SD Mean N SD t-
Statistic DF
P-Value
Appearance (color)
3.20 64 1.101 2.92 64 1.117 2.455 63 .017
Appearance (shape)
3.08 64 1.103 2.98 64 1.031 1.230 63 .223
Mouth-feel 3.18 62 1.124 3.10 62 1.112 .727 61 .470 Aroma 2.50 62 .937 2.58 62 .984 -.778 61 .439 Flavor
3.22 63 1.054
3.06 63 1.120 1.217 62 .228
After-taste 2.92 63 1.036 2.75 63 1.031 1.897 62 .062
45

Table 4.19 -Paired Samples Test - Male vs Female
*Eggs A – Organic, Eggs B – Conventional
Dairy - Milk
When asked to rate Milk A and B results showed statistical significance within
the Flavor and After-taste categories. Flavor: A (M= 2.97, SD = 1.368) and B (M= 3.34,
SD = 1.336), t (63) = -2.553, p=.013. After-taste: A (M=2.64, SD= 1.373) and B
(M=3.02, SD = 1.363), t (63) = -2.553, p=.013. Gender comparisons showed no statistical
significance within the Male group. However, the Female group showed statistical
significance, again within the Flavor and After-taste categories. Flavor: A (M= 2.81, SD
Eggs A and Eggs B
Male Mean
(A) N SD
Mean (B)
N SD t-
Statistics DF
P-Value
Appearance (color) 3.09 11 1.044 3.09 11 .831 .000 10 1.000
Appearance (shape) 3.09 11 .944 3.09 11 .944 .000 10 1.000
Mouth-feel 2.91 11 .944 2.91 11 .944 .000 10 1.000 Aroma 2.45 11 .820 2.64 11 .924 -.803 10 .441 Flavor 3.09 11 .944 2.82 11 .874 1.150 10 .277 After-taste 2.91 11 .701 2.73 11 .905 1.000 10 .341 Female Appearance (color) 3.23 53 1.120 2.89 53 1.171 2.823 52 .007
Appearance (shape) 3.08 53 1.141 2.96 53 1.055 1.352 52 .182
Mouth-feel 3.24 51 1.159 3.14 51 1.149 .778 50 .440 Aroma 2.51 51 .967 2.57 51 1.005 -.503 50 .617 Flavor 3.25 52 1.082 3.12 52 1.166 .895 51 .375 After-taste 2.92 52 1.100 2.75 52 1.064 1.643 51 .107
46
= 1.411) and B (M= 3.22, SD = 1.369), t (53) = -2.452, p=.018. After-taste: A (M=2.52,
SD=1.411) and B (M=2.91, SD=1.418), t (53) = -2.314, p=.025
When asked to rate the difference between Milk A and B, 1.4% (n=1) said that there
was a Very large difference, 26.1% (n=18) said that there was a Large difference, 15.9%
(n=11) said there was a Moderate difference, 18.8% (n=13) said there was a Slight
difference, and 27.5% (n=19) said there was a Very Slight difference.
A gender comparison showed that Males (n=9) and Females (n=53); 0%(n=0) and
1.6% (n=1) respectively said that there was a Very Large difference, 4.8% (n=3) and 24.2%
(n=15) said that there was a Large difference, 3.2% (n=2) and 14.5% (n=9) respectively
said there was a Moderate difference, 3.2% (n=2) and 17.7% (n=11) respectively said there
was a Slight difference and 3.2% (n=2) and 27.4% (n=17) respectively said that there was
a Very slight difference between the two samples.
An independent sample t-test conducted to compare the rating of differences
between Milk A and B by gender, showed no significant difference between Males (M =
2.67 SD 1.225) and Females (M = 2.47, SD 1.265); t (60) = .429, p = .669. Tables 4.20 and
4.21 provide the full results for both sets of paired sample t-tests.
47

Table 4.20-Full Sample
*Milk A – Organic, Milk B – Conventional
Table 4.21 - Paired Samples Test - Male vs Female
*Milk A – Organic, Milk B – Conventional
a. The correlation and t cannot be computed because the standard error of the difference is 0.
Milk A Milk B
Mean N SD Mean N SD t-
Statistic DF
P-Value
Appearance (color)
3.97 65 1.000 4.03 65 .935 -.851 64 .398
Appearance (shape)
4.05 63 .958 4.06 63 .948 -.331 62 .742
Mouth-feel 3.48 64 1.195 3.63 64 1.162 -1.833 63 .072 Aroma 2.95 63 1.275 3.08 63 1.286 -1.051 62 .297 Flavor
2.97 64 1.368 3.34 64 1.336 -2.553 63 .013
After-taste 2.64 64 1.373 3.02 64 1.363 -2.553 63 .013
Milk A and Milk B
Male Mean
(A) N SD
Mean (B)
N SD t-
Statistics DF
P-Value
Appearance (color) 4.00a 10 .667 4.00a 10 .667
Appearance (shape) 4.10a 10 .738 4.10a 10 .738
Mouth-feel 3.90 10 .738 3.90 10 .738 .000 9 1.000 Aroma 3.40 10 1.075 3.40 10 .843 .000 9 1.000 Flavor 3.80 10 .919 4.00 10 .943 -.688 9 .509 After-taste 3.30 10 .949 3.60 10 .843 -1.152 9 .279 Female Appearance (color) 3.96 55 1.053 4.04 55 .981 -.851 54 .399
Appearance (shape) 4.04 53 .999 4.06 53 .989 -.331 52 .742
Mouth-feel 3.41 54 1.252 3.57 54 1.222 -1.923 53 .060 Aroma 2.87 53 1.301 3.02 53 1.352 -1.091 52 .280 Flavor 2.81 54 1.388 3.22 54 1.369 -2.452 53 .018 After-taste 2.52 54 1.411 2.91 54 1.418 -2.314 53 .025
48

Cheese
When asked to rate Cheeses A and B results showed statistical significance within
the Shape, Mouth-feel, Flavor and After-taste categories. Shape: A (M= 3.88, SD = .984)
and B (M= 3.61, SD = 1.033), t (63) = 2.588, p=.012. Mouth-feel; A (M=3.71, SD= 1.023)
and B (M=3.25, SD = 1.218), t (62) = 3.551, p=.001. Flavor: A (M= 3.73, SD=1.1100 and
B (M=3.22, SD= 1.349), t (62) = 3.351, p= .001. After-taste: A (M= 3.27, SD = 1.370) and
B (M= 2.89, SD= 1.404), t (62) = 2.471, p= .016. Gender comparisons showed no statistical
significance within the Male group. The Female group however, showed statistically
significant values, within the Shape, Mouth-feel, Flavor and After-taste categories. Shape;
A (M= 3.93, SD = .988) and B (M= 3.67, SD = 1.009), t (53) = 2.300, p=.025. Mouth-feel:
A (M=3.74, SD=1.022) and B (M=3.26, SD=1.258), t (52) = 3.333, p=.002. Flavor: A
(M=3.74, SD=1.112) and B (M=3.19, SD=1.374), t (52) = 3.359, p=.001 and After-taste:
A (M=3.25, SD= 1.971) and B (M=2.85, SD= 1.420), t (52) = 2.288, p=.026.
When asked to rate the difference between Cheese A and B, 30.4% (n=21) said that
there was a Very large difference, 26.1% (n=18) said that there was a Large difference,
18.8% (n=13) said there was a Moderate difference, 7.2% (n=5) said there was a Slight
difference, and 4.3% (n=3) said there was a Very Slight difference.
A gender comparison showed that Males (n=9) and Females (n=51); 6.7%(n=4) and 28.3%
(n=17) respectively said that there was a Very Large difference, 3.3% (n=2) and 26.7%
(n=16) said that there was a Large difference, 5% (n=3) and 16.7% (n=10) respectively
said there was a Moderate difference, 0% (n=0) and 8.3% (n=5) respectively said there was
49

a Slight difference and 0% (n=0) and 5% (n=3) respectively said that there was a Very
slight difference between the two samples.
An independent sample t-test conducted to compare the rating of differences
between Cheeses A and B by gender, showed no significant difference between Males (M
= 4.11 SD .928) and Females (M = 3.76, SD 1.193); t (58) = .826, p = .412. Tables 4.22
and 4.23 provides the full results for both sets of paired sample t-test.
Table 4.22 -Full Sample
*Cheese A – Organic, Cheese B – Conventional
Cheese A Cheese B
Mean N SD Mean N SD t-
Statistic DF
P-Value
Appearance (color)
3.78 64 1.076 3.94 64 .871 -1.426 63 .159
Appearance (shape)
3.88 64 .984 3.61 64 1.033 2.588 63 .012
Mouth-feel 3.71 63 1.023 3.25 63 1.218 3.551 62 .001 Aroma 3.25 63 1.231 3.17 63 1.225 .798 62 .428 Flavor
3.73 63 1.110 3.22 63 1.349 3.351 62 .001
After-taste 3.27 63 1.370 2.89 63 1.404 2.471 62 .016
50
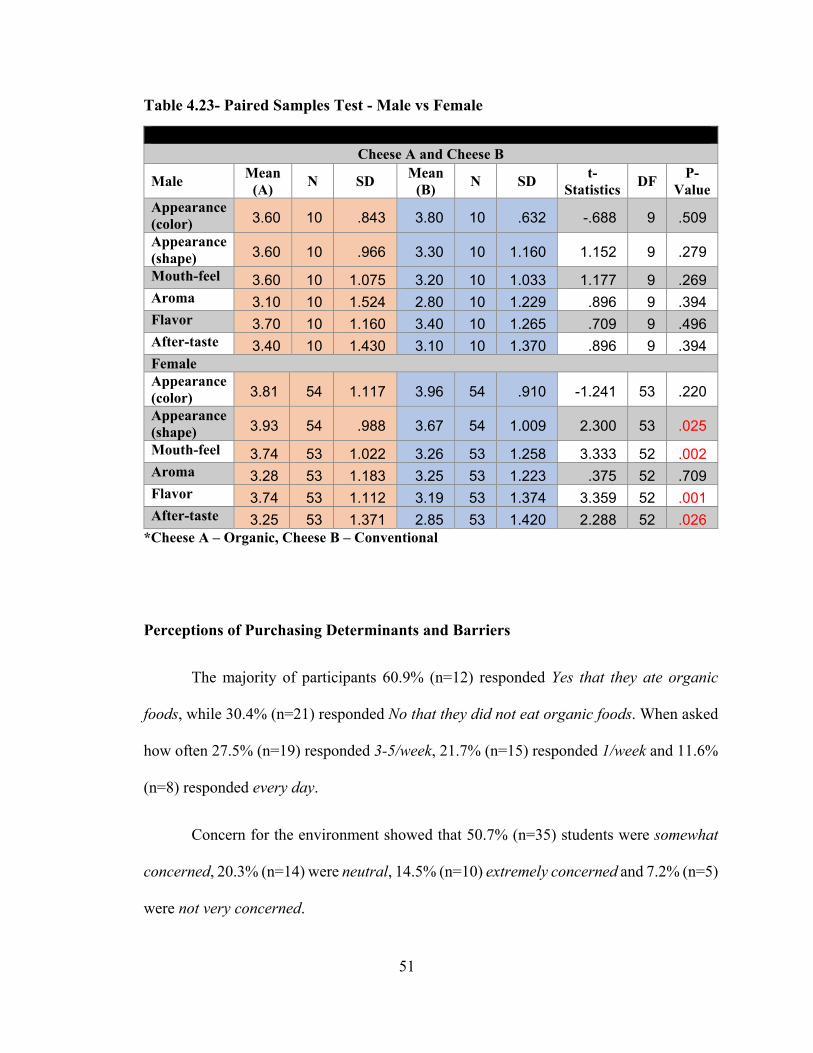
Table 4.23- Paired Samples Test - Male vs Female
*Cheese A – Organic, Cheese B – Conventional
Perceptions of Purchasing Determinants and Barriers
The majority of participants 60.9% (n=12) responded Yes that they ate organic
foods, while 30.4% (n=21) responded No that they did not eat organic foods. When asked
how often 27.5% (n=19) responded 3-5/week, 21.7% (n=15) responded 1/week and 11.6%
(n=8) responded every day.
Concern for the environment showed that 50.7% (n=35) students were somewhat
concerned, 20.3% (n=14) were neutral, 14.5% (n=10) extremely concerned and 7.2% (n=5)
were not very concerned.
Cheese A and Cheese B
Male Mean
(A) N SD
Mean (B)
N SD t-
Statistics DF
P-Value
Appearance (color) 3.60 10 .843 3.80 10 .632 -.688 9 .509
Appearance (shape) 3.60 10 .966 3.30 10 1.160 1.152 9 .279
Mouth-feel 3.60 10 1.075 3.20 10 1.033 1.177 9 .269 Aroma 3.10 10 1.524 2.80 10 1.229 .896 9 .394 Flavor 3.70 10 1.160 3.40 10 1.265 .709 9 .496 After-taste 3.40 10 1.430 3.10 10 1.370 .896 9 .394 Female Appearance (color) 3.81 54 1.117 3.96 54 .910 -1.241 53 .220
Appearance (shape) 3.93 54 .988 3.67 54 1.009 2.300 53 .025
Mouth-feel 3.74 53 1.022 3.26 53 1.258 3.333 52 .002 Aroma 3.28 53 1.183 3.25 53 1.223 .375 52 .709 Flavor 3.74 53 1.112 3.19 53 1.374 3.359 52 .001 After-taste 3.25 53 1.371 2.85 53 1.420 2.288 52 .026
51

More participants 55.1% (n=38) responded that they thought that buying organic
foods Helps the environment. 2.9% (n=2) responded that it Does not help at all, 5.8% (n=4)
responded that it Does not help much, 23.2% (n=16) responded that they felt Neutral about
it and 5.8% (n=4) responded that it Helps completely. Figures 4.1 and 4.2 illustrates the
results below.
Figure 4.1
0 5 14
35
100 7.2
20.3
50.7
14.5
NOT CONCERNED
AT ALL
NOT VERY CONCERNED
NEUTRAL SOMEWHAT CONCERNCED
EXTREMELY CONCERNED
How concerned are you about the environment?
Frequency Percentages
52

Figure 4.2
When asked to select the categories that they purchased organic foods from; 58%
(n=40) responded that they bought Fruits and Vegetables each. 29% (n=20) responded
that they bought Grains and cereals and dairy products, 33% (n=23) responded that they
bought organic eggs, 26.1% (n=18) responded that they bought organic poultry, 21.7%
(n=15) responded that they bought organic meat, 14.5% (n=10) responded that they
bought organic fish and 31.9% (n=22) responded that they bought organic snacks.
Approximately 45% (n=31) respondents said that they preferred to purchase organic
foods from grocery stores with organic sections, while 39.1% (n=27) responded that they
preferred to purchase organic foods from specialty stores like Whole Foods or the Good
Foods Co-op and 23.2% (n=16) responded that they had no particular preference. Figure
4.3 illustrates the results below.
2 416
38
42.9 5.8
23.2
55.1
5.8
DOES NOT HELP AT ALL
DOES NOT HELP MUCH
NEUTRAL HELPS SOMEWHAT
HELPS COMPLETELY
How much do you think buying organic foods helps the environment?
Frequency Percentages
53

Figure 4.3
Affordability of organic versus conventional food for these students was a major
factor. The majority of the students 47.8% (n=33) responded that organic food was Not
very affordable when compared to conventional foods. 18.8% (n=13) responded that it was
somewhat affordable, 11.6% (n=8) were Neutral about the affordability, 10.1% (n=7)
responded that it was Not at all affordable and 4.3% (n=3) responded that it was very
affordable. Figure 4.4 illustrates the results below.
Figure 4.4
7
33
8 13 310.1
47.8
11.618.8
4.3
NOT AT ALL AFFORDABLE
NOT VERY AFFORDABLE
NEUTRAL SOMEWHAT AFFORDABLE
VERY AFFORDABLE
How affordable are organic foods vs conventional foods for you?
Frequency Percentages
40 40
20 20 2318 15 10
22
58 58
29 2933.3
26.121.7
14.5
31.9
From what categories do you purchase organic foods?
Frequency Percentage
54
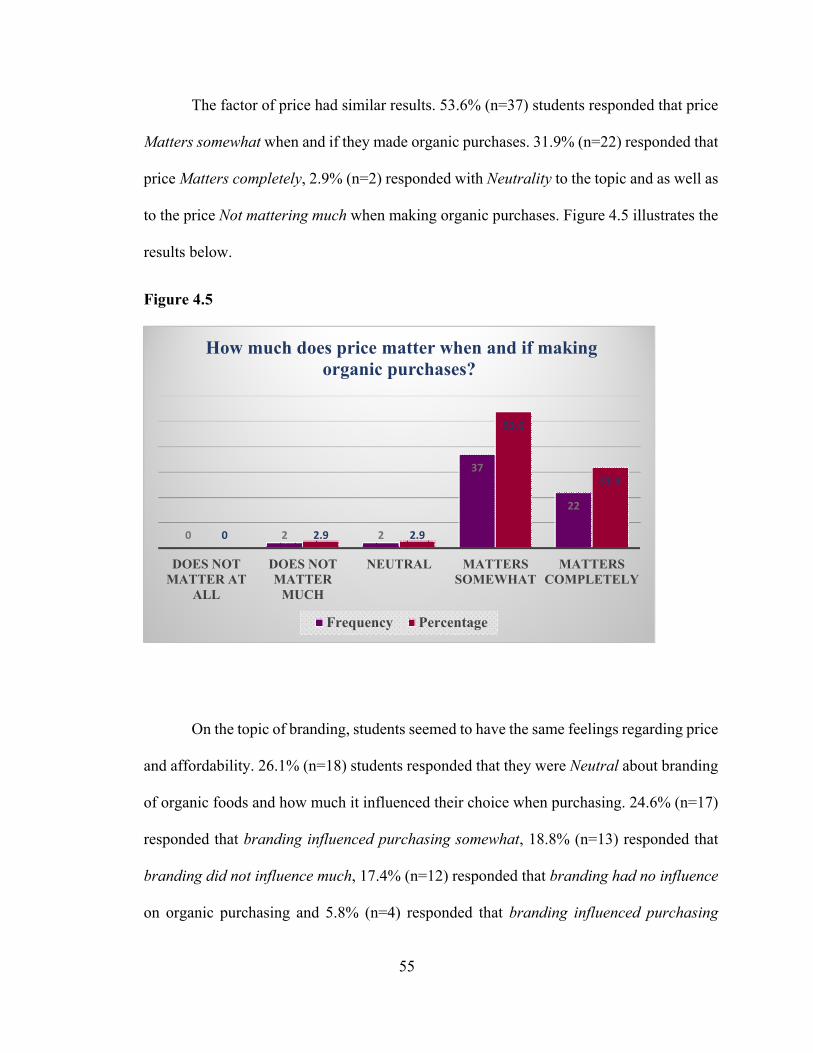
The factor of price had similar results. 53.6% (n=37) students responded that price
Matters somewhat when and if they made organic purchases. 31.9% (n=22) responded that
price Matters completely, 2.9% (n=2) responded with Neutrality to the topic and as well as
to the price Not mattering much when making organic purchases. Figure 4.5 illustrates the
results below.
Figure 4.5
On the topic of branding, students seemed to have the same feelings regarding price
and affordability. 26.1% (n=18) students responded that they were Neutral about branding
of organic foods and how much it influenced their choice when purchasing. 24.6% (n=17)
responded that branding influenced purchasing somewhat, 18.8% (n=13) responded that
branding did not influence much, 17.4% (n=12) responded that branding had no influence
on organic purchasing and 5.8% (n=4) responded that branding influenced purchasing
0 2 2
37
22
0 2.9 2.9
53.6
31.9
DOES NOT MATTER AT
ALL
DOES NOT MATTER
MUCH
NEUTRAL MATTERS SOMEWHAT
MATTERS COMPLETELY
How much does price matter when and if making organic purchases?
Frequency Percentage
55

completely. An independent t-Test of this question had a statistically significant p-value of
(.028), t (62) = -2.248, when testing the difference between genders.
The influence of labeling e.g. attractiveness or highlighting of health advantages on
purchasing choice of organic foods showed that the majority of the students 29% (n=20)
felt that labelling of organic foods had some influence on purchasing. 27.5% (n=19)
responded that they were neutral about labelling, 20.3% (n=14) responded that labelling
did not influence purchasing much, 10.1% (n=7) responded that labelling had no influence
on purchasing and 5.8% (n=4) responded that labelling influenced purchasing completely.
Primary reasons for buying organic foods and products
Students were asked to respond to questions, that asked to indicate how Diet, Well-
being and production practices, influenced their preference for organic foods over
conventional foods. In the case of Diet which was described as; food and drink regularly
provided or consumed or food consumed for habitual nourishment, the majority 36.2% (n=
25) felt that they were not concerned either way about it. Whereas 21.7% (n=15) were
somewhat concerned and 18.8% (n=13) were extremely concerned about their diet and
their choice to buy organic foods versus conventional. 8.7% (n=6) students were not very
concerned while 7.2% (n=5) were not concerned at all.
Results from the question addressing the feeling of Well-being showed that students
were mainly somewhat concerned 36.2% (n=25) about organic foods contributing towards
their state of being happy, healthy of prosperous. 26.1% (n=18) remained neutral, 21.7%
(n=15) students were extremely concerned, 4.3% (n=3) were not concerned at all and 2.9%
(n=2) were not very concerned.
56
The factor of production practices garnered more or less the same results with the
majority of the students being somewhat concerned 31.9% (n=22) about Production
practices. 21.7% (n=15) of students were extremely concerned and 18.8% (n=13) were
neutral on the topic. More students 14.5% (n=10) were not very concerned than were they
not concerned at all 4.3% (n=3).
Based on these results it is safe to assume that among this sample of students, the
main reasons for buying organic foods are Well-being and Production practices. In both
cases the level of concern was increased on both sides of the gender profile. There was no
statistically significant difference, found between the sexes, when an independent t-Test
was run to compare the genders responses to these questions. Figures 4.6, 4.7 and 4.8
illustrates the results below.
Figure 4.6
8%9%
39%24%
20%
Influence of Diet on preference for organic foods over conventional
Not concerned at all
Not very concerned
Neutral
Somewhat concerned
Extremely concerned
57
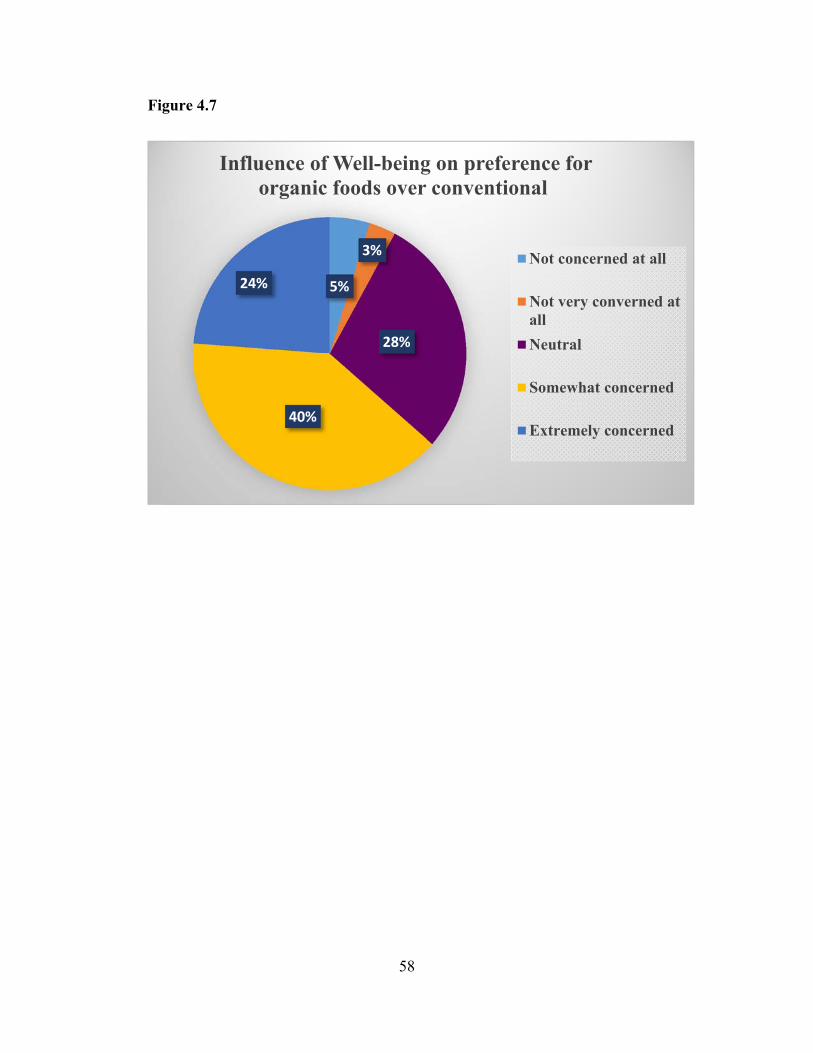
Figure 4.7
5%
3%
28%
40%
24%
Influence of Well-being on preference for organic foods over conventional
Not concerned at all
Not very converned atall
Neutral
Somewhat concerned
Extremely concerned
58

Table 4.8
City, Suburban or Rural and its Effect on the Palate
When trying to find a relationship between the participants’ home location and its
effect on their palate, independent t-Tests were run to find differences between each of
these variables, and how they related to the rating of differences between A and B samples,
each food category, and the purchasing factor questions.
When comparing students from city and suburban areas, a statistically significant
value was found in the Banana group. Bananas; City (M=1.81, SD=.845), Suburban
(M=2.46, SD=.776), t (48) = -2.438, p= .019. Students from suburban and rural areas, were
more able to detect a difference between the Milk A and B samples; Suburban (M=1.85,
SD=.899), Rural (M=3.08, SD=1.256), t (24) = -2.874, p=.008.
5%
16%
20%
35%
24%
Influence of Production Practices on preference for organic foods over conventional
Not concerned at all
Not very concerned
Neutral
Somewhat concerned
Extremely concerned
59
Production practices proved to be the only organic purchasing factor that was
significant among the students who were from city and rural areas. City; (M=3.20,
SD=1.302), Rural (M=4.27, SD = .458), t (48) = -3.078, p= .003.
Linear regressions run to approximate the relationships between purchasing factors,
A and B food samples and gender and location, based on statistically independent t-test
values such as gender and branding returned no statistically significant values.
60

Chapter Five
Discussion
Findings
The first objective in the study was to determine college students’ perceptions of
organic food as it relates to health, environment and food pricing and how it affects their
purchasing decision.
Daily diet had some influence on the students’ preference for organic foods over
conventional foods. The students remained mainly neutral on the topic 36.2% (n=25).
Well-being on the other hand showed more students preferring to purchase organic because
they were “somewhat concerned”, 36.2% (n=25), more than they were neutral 26.1%
(n=18), or extremely concerned 27.1% (n=15). Outside of neutrality, the level of concern
between both aspects teetered between somewhat and extremely concerned.
These results are in line with all previous research that has studied organic
purchasing attitudes. Health is the main reason for organic food purchases, the concern of
health increases with age and is the dominant purchasing attitude of women (Dimitri &
Dettmann, 2012; Hill & Lynchehaun, 2002; Hughner et al., 2007; Lea & Worsley, 2005;
Mondelaers, Verbeke, & Van Huylenbroeck,2009; Pearson, Henryks, & Jones, 2010 &
Shepherd, Magnusson, & Sjoden, 2005).
Age may hold an explanation as to why more participants were only somewhat
concerned than extremely concerned about their diet and well being. Young adults in their
early twenties, are more concerned with eating what tastes good, rather than what is good
61

for them. They have not gotten to the stage in life where they are eating to live, because
typically their bodies are healthy and can withstand the effects of poor food choices better
than someone who is decade or more older.
Students’concern for production practices mirrored their concern for diet and well-
being as most were only somewhat concerned, 31.9% (n=22), about production practices,
but there were those whe were extremely concerned, 21.7% (n=15), and preferred to buy
organic because of this. Direct concern for the environment and environmental
preservation as a result of buying organic, returned results that leaned more toward the
“somewhat category”. Students were more somewhat concerned about the environment
50.7% (n=35) and believed that buying organic foods only helped the environment
somewhat 55.1% (n=38). Unlike the previous reported results, only 5.8% (n=4) believed
that buying organic foods completely helped the environment.
Production practices which include animal welfare, and environmental concern are
considered to be positve attitudes held towards organic foods and products. Students hold
realistic views of the environmental benefit of oraganic systems and practices. However,
holding these positive attitudes, leads a little over a quarter of them to purchase organic
foods often enough to be able to eat it 3-5 times a week 27.5% (n=19).
Price and affordability, returned the results expected from a sample of college
students such as this. 47.8% (n=33) said that organic food was not very affordable, while
18.8% (n=13) said that it was somewhat affordable. Price was very important to these
students as more than half 53.6% (n=37) said that price mattered somewhat and 31.9%
62

(n=22) said that it mattered completely. Price is what makes or breaks the decision to buy
organic over conventional. If the organic product is not affordable at the time of the
purchasing decision, most likely the buyer will go with the cheaper (conventional)
alternative. Given that students usually have less diposable income than the typical
consumer of organic food, it is easier to buy the conventional option even though they may
hold the aforementioned attitudes and beliefs. They may have the best intentions, but can
not at this moment act on them.
The second objective of this study was to determine if a difference in taste could be
perceived by college students between organic and conventionally grown foods. It was
hypothesized that students will notice a difference in taste if not told that the two were
different. Of all the categories of food studied, peppers, meat and dairy returned the most
statistically significant results. With the exception of cantaloupe, which also had significant
p values, but only because of a major limitation which will be discussed at the end of this
section.
Peppers which returned .000 p-values in every sensory category, (color, shape,
mouth-feel, aroma, flavor and after-taste) showed that there was a distinct difference
between the two samples. Even though the research on the taste quality between organic
vegetables and conventional vegetables is limited, the ones that compare agricultural
practices (Perez-Lopez, Moises del Amor, Serrano-Martinez, Fortea, & Nunez-Delicado,
2007) (Abu-Zahra, 2011) and sensory analysis of vegetables (Zhao, Chambers IV, Matta,
Loughin, & Carey, 2007) suggest that many external factors can influence the results of a
sensory analysis. In this case organic farming practices before harvest, seem to positively
63
affect the quality of the bell peppers and a noticeable gustatory difference was perceived
by participants. Perez-Lopez and colleagues (2007), concluded in their study, that “organic
farming had a significant effect on vitamin C activity, phenolic content, colour and total
carotenoid content in sweet peppers. Therfore organic farming had a positive effect on the
nutritional content (p.2079).” A combined positive effect on the nutrient content has an
equal effect on the flavor and taste intensity.
In general participants found there to be significant differences between the organic
and conventional beef samples: color (p=.006), mouth-feel (p=.002), flavor (p=.000) and
after taste (p=.002), but not between the organic and conventional chicken samples. The
amount of energy and nutrients available to cattle during feeding is based solely on the type
of feed being consumed, grass or grain. “These two factors are inevitably and intimately
linked because different feed types vary in the amount of available energy as well as
nutrient composition” (Murir, Deaker, & Brown, 1998).
Research has found grass based diets lower in energy and inversely grain based
diets to be higher. Murir and colleagues in their review, attest that meat is flavored by lipid,
and fatty acids. Both of which are affected by feed type, but may not be easily detectable
in sensory analyses. In general, United States (US) cattle finished on grass-based diets, is
least prefered in the market, because of the characteristic “milk or grassy” smell (Proplo,
Micol, & Agabriel, 2001). The results in this case may be due to the grade and brand of
ground beef. The organic sample was a grass-fed ground beef, while the conventional
sample was a generic brand from Kroger. In this case, these results are supported by Proplo
and colleagues (2001) that a difference in flavor, is affected by diet. Time and temperature
64
may also be factors, since the study was conducted over a two day period and the samples,
which werer cooked a day in advance, were reheated at the beginning of each session.
A difference between eggs and dairy product samples were noted in eggs: color
(p=.017), milk; flavor (p=.013) and after-taste (p=.001) and cheese; flavor (p=.001) and
after-taste (p=.016). This group had the most significant results of all the food groups, aside
from the cantaloupe samples. A difference in color between samples were also found in a
study by (Minelli, Sirri, Folegatti, Meluzzi, & Franchini, 2007). Organic yolks were found
to be paler than the conventional in this study. The lightness in color of the egg yolk was
attributed to how and what organic hens were fed. Organic hens receive a diet that is lower
in micronutrients and this affects yolk pigments and nutrient content. However, Woese
and colleagues (1997) state in their review, in which research on eggs at the time was
limited, “that carotenoid content in eggs from free range hens with access to vegetation
compared with caged hens is due to the additional uptake of carotenoid from grass and
green plants”. In this case the eggs in the study they received were darker in the organic
eggs than the conventional eggs.
Milk and cheese samples in this study were found to have significant differences
primarily in the area of taste, contrary to previous research. For instance (Croissant,
Washburn, Dean, & Drake, 2007) and (Khanal, et al., 2005) both reported that significant
taste differences could not be detected between organic and conventional milks and
cheeses.
The cantaloupe samples returned results that showed statistical difference between
both the organic and conventional samples. Color (p=.000), shape(p=.013), mouth-feel
65
(p=.002), aroma (p=.000), flavor (p=.00) and after-taste (p=.000). However, results for this
sample were skewed. The conventional sample was significantly sweeter than the organic
sample, making the difference in taste more than obvious and ultimately affecting the
participants response. Even though the main goal of this study was for students to perceive
a difference in taste, the sugar content of the fruit should have been tested before use, so as
to achieve samples with equal amounts of fruit sugars. The imbalance in flavors positively
affected the results, but also created a response bias.
The second hypothesis tested on objective one, hypothesized that more females will
notice a difference in taste between organic versus conventional foods than will males.
Results showed that in fact more female participants noticed a different in taste between
the organic and conventional samples. Most significantly within the categories discussed
in the previous section. The main explanation for the overwhelming female response is that
there were more female participants than there were male. Females made up 84.1% (n=58)
of the sample. In addition to this explanation, another possible explanation could be that
females are more perceptive than males of flavor stimuli due to a greater proportion of taste
buds, and so are better at perceiving taste differences between the samples (Del Parigi, et
al., 2002; Haase, Green, & Murphy, 2011).
This explanation is supported by Haase and colleagues (2011), when they examined
male and female cerebral response to taste when hungry and full. They concluded that
females in a state of hunger exhibited stronger positive brain activation compared to males
during taste quality tests with the exception of sweet taste. They also found that when full,
females exhibited more or less of the same brain activation to taste qualities, while males,
66

had more of a negative brain activation response (Haase, Green, & Murphy, 2011). For
future research, gender differences should be studied with a larger sample with equal
numbers of males and females.
The third objective in this study was to determine what type of organic foods
students purchase. Students reported that they mainly purchased organic fruits and
vegetables, grains and cereals, dairy products, eggs and organic snacks. They preferred to
purchase organic fish the least. Dahm and colleagues (2009), found similar results in their
study which examined how eco-friendly attitudes predicted eco-friendly behaviors on
college students. They found that positive perceptions such as health and environmental
awareness, positively influenced behaviors, which led to organic purchases and lifestyle
changes (Dahm, Samonte, & Shows, 2009).
A similar study by Stobbelaar et al (2007), found that 15 and16 year old high school
students, would, when they had the spending capacity to do so, buy organic fruits and
vegetables. The lower income students being more willing to pay for these organic foods.
Also girls were more willing than boys to purchase organic (Stobbelaar et al., 2006). As it
relates to this study, students possibly believe that buying organic fruits and vegetables is
better for their health and are more willing to spend their money on these products. Also
because there were so many girls in the sample, and females are more willing to buy
organic for health reasons, these results are in line with previous research.
The fourth objective tested the students’ area of residence e.g. (city, suburban or
rural) and how it influences the palate when identifying differences in taste between
organic and conventional foods. It was hypothesized that students who grew up in a rural
67

environment will be more perceptive of differences in taste between organic versus
conventional foods. Only the milk group returned significant results (p= .008), when tested
with the suburban group. A possible explanation for this is that, students from rural areas
have grown up on farms and are familiar with fresh cow’s milk, and they can better
perceive a difference between organic and conventional samples. Home town geographic
location though does not appear to be a significant predictor of perception in this case.
Strengths, Limitations and Future Research
One strength of this study was the variety of samples offered for analysis. This set
the stage for results that looked at all food groups instead of at one particular food. Another
strength of this study was the size of the sample used for the sensory analysis. Although
still relatively small, there were enough participants to produce significant results.
There were several limitations to this study. The first major limitation was the larger
proportion of females to males. This may have skewed the significance of the results
because of there were so many more females than males. The second limitation to the study
was time and temperature. As stated before, all the samples were prepared a day in advance
and kept in the refrigerator to preserve freshness, over the two day period. Samples should
have been used at a set temperature every time, instead of being hot (Meat) or cold (all
other samples) and allowed to adjust to room temp. Temperature can have a great effect on
sensory perception, and it was not controlled sufficiently in this study. The effect of time
of on prepared food, left to sit over two days, also could have had an effect on sensory
perception and the final results. A third limitation to the study was the predominant age
group of the sample. All being in their very early twenties, familiarity of the palate to
68

conventional foods, may have been a major influence on their responses, even though it
was a blind sensory analysis.
Future studies should focus on the same age group but with a more diverse group
of majors and ethnicities. Also research should be done with this sample to see how their
parents’ perceptions affect their perceptions of organic and conventional foods. Future
studies should look at what price this particular sample would prefer to pay for organic
foods, and what they think gives organic foods and products its value. Finally, more
controls should be put in place, if this study were to be replicated. Such as food sample
choice, organic farming methods and temperature control. This would help to make a study
such as this ideal for sensory analysis and perception evaluation.
Conclusion
The results of this study have provided some evidence that there are categorical
differences in taste between organic and conventional foods, most notably among the
vegetable, meat, eggs and dairy categories. Price was found to be a major deterrent of
organic purchases, and held a lot of weight in the purchasing decision in this study.
Students were concerned, but not concerned enough to buy organic with the hopes that it
would keep them happy and healthy. Environmental sustainability had some influence on
their purchasing decisions, but again only somewhat. Inevitably, environmental awareness
is not at the forefront of their minds when purchasing food to eat.
Females were better at identifying categorical differences between samples than
males, but in general no major taste differences between samples were detected by students.
Understanding how this demographic is ifluenced by the main purchasing determinants
69
and barriers is important for the future of the organic industry and how it is marketed
towards consumers. Essentially, this demographic needs to be asked; How do organic
products affect your everyday life? How can the organic industry affect their and world’s
future? and What changes to both organic and conventional industries would they like to
see happen? Getting these questions answered, plus further education of this consumer
demographic based on the answers received and further research, may help them to make
better informed decisions rather than being on the fence.
Overall, it can be concluded from this study, that as a whole there is no significant
difference in taste between organic and conventional foods and that student perceptions
match those examined in previous studies. However perceptions are not as heightened as
the typical consumer exhibits. Females however, showed a greater ability to identify
categorical differences in taste between samples. Finally, age and circumsatnce may play
a major role in these results and should be considered when looking at health as a
purchasing determinant, and what students in this sample consider good health to be.
70
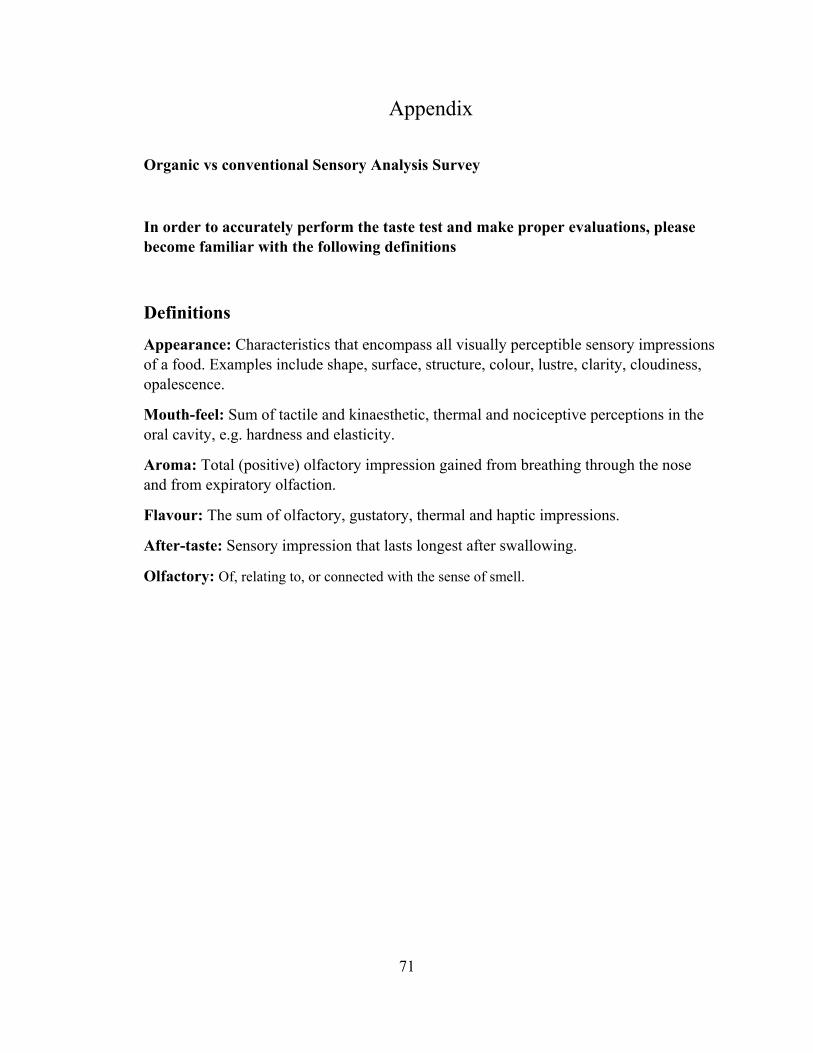
Appendix
Organic vs conventional Sensory Analysis Survey
In order to accurately perform the taste test and make proper evaluations, please become familiar with the following definitions
Definitions
Appearance: Characteristics that encompass all visually perceptible sensory impressions of a food. Examples include shape, surface, structure, colour, lustre, clarity, cloudiness, opalescence.
Mouth-feel: Sum of tactile and kinaesthetic, thermal and nociceptive perceptions in the oral cavity, e.g. hardness and elasticity.
Aroma: Total (positive) olfactory impression gained from breathing through the nose and from expiratory olfaction.
Flavour: The sum of olfactory, gustatory, thermal and haptic impressions.
After-taste: Sensory impression that lasts longest after swallowing.
Olfactory: Of, relating to, or connected with the sense of smell.
71

Q1 Age
18 19 20 21 22 23+
Q2 Gender
Male Female
Q3 City and State
Q4 Classification
Freshman Sophomore Jr Sr
Q5 Major
Q6 Race
Black White (Non-Hispanic) Asian Hispanic Pacific Islander American Indian Multi-racial Other
72
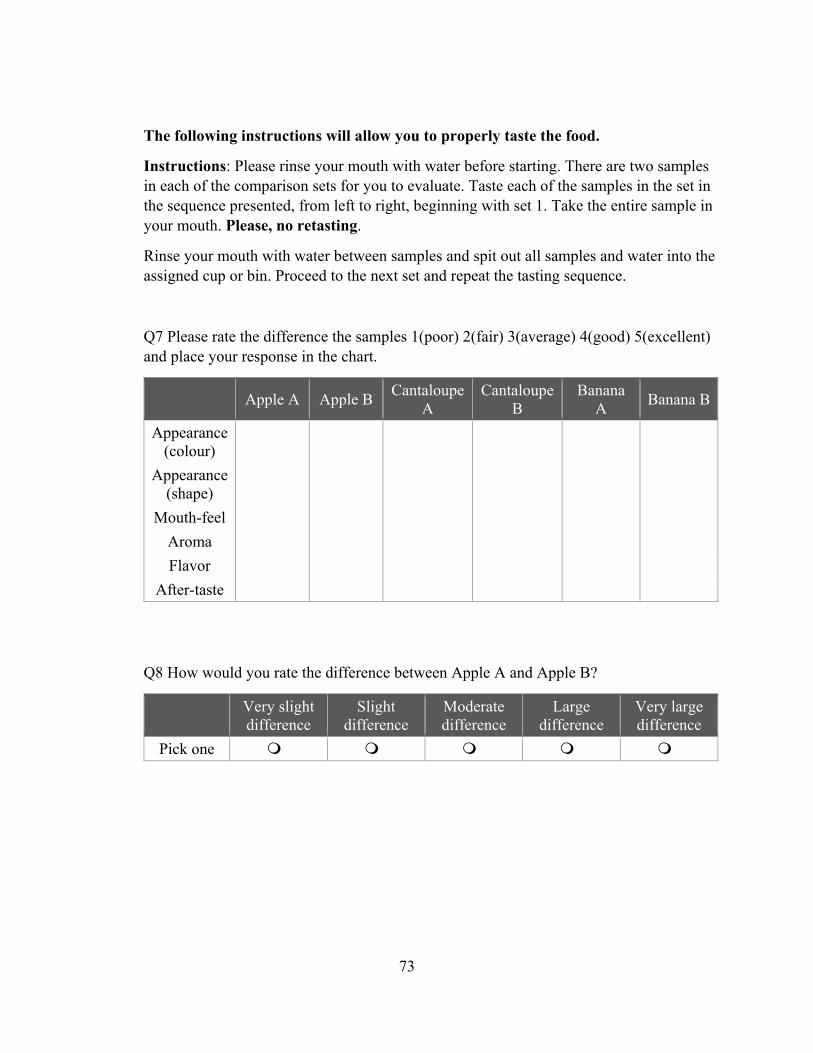
The following instructions will allow you to properly taste the food.
Instructions: Please rinse your mouth with water before starting. There are two samples in each of the comparison sets for you to evaluate. Taste each of the samples in the set in the sequence presented, from left to right, beginning with set 1. Take the entire sample in your mouth. Please, no retasting.
Rinse your mouth with water between samples and spit out all samples and water into the assigned cup or bin. Proceed to the next set and repeat the tasting sequence.
Q7 Please rate the difference the samples 1(poor) 2(fair) 3(average) 4(good) 5(excellent) and place your response in the chart.
Apple A Apple B Cantaloupe
A Cantaloupe
B Banana
A Banana B
Appearance (colour)
Appearance (shape)
Mouth-feel
Aroma
Flavor
After-taste
Q8 How would you rate the difference between Apple A and Apple B?
Very slight difference
Slight difference
Moderate difference
Large difference
Very large difference
Pick one
73
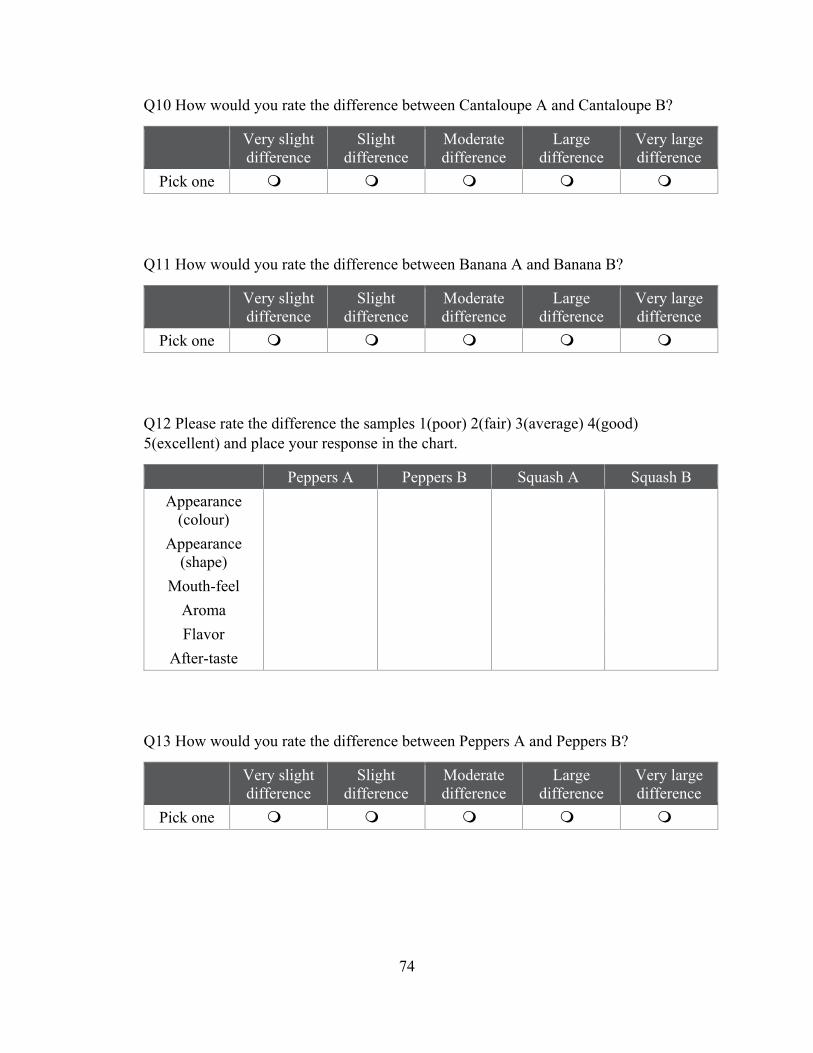
Q10 How would you rate the difference between Cantaloupe A and Cantaloupe B?
Very slight difference
Slight difference
Moderate difference
Large difference
Very large difference
Pick one
Q11 How would you rate the difference between Banana A and Banana B?
Very slight difference
Slight difference
Moderate difference
Large difference
Very large difference
Pick one
Q12 Please rate the difference the samples 1(poor) 2(fair) 3(average) 4(good) 5(excellent) and place your response in the chart.
Peppers A Peppers B Squash A Squash B
Appearance (colour)
Appearance (shape)
Mouth-feel
Aroma
Flavor
After-taste
Q13 How would you rate the difference between Peppers A and Peppers B?
Very slight difference
Slight difference
Moderate difference
Large difference
Very large difference
Pick one
74

Q14 How would you rate the difference between Squash A and Squash B?
Very slight difference
Slight difference
Moderate difference
Large difference
Very large difference
Pick one
Q15 Please rate the difference the samples 1(poor) 2(fair) 3(average) 4(good) 5(excellent) and place your response in the chart.
Chicken A Chicken B Beef A Beef B
Appearance (colour)
Appearance (shape)
Mouth- feel
Aroma
Flavor
After-taste
Q16 How would you rate the difference between Chicken A and Chicken B?
Very slight difference
Slight difference
Moderate difference
Large difference
Very large difference
Pick one
Q17 How would you rate the difference between Beef A and Beef B?
Very slight difference
Slight difference
Moderate difference
Large difference
Very large difference
Pick one
75
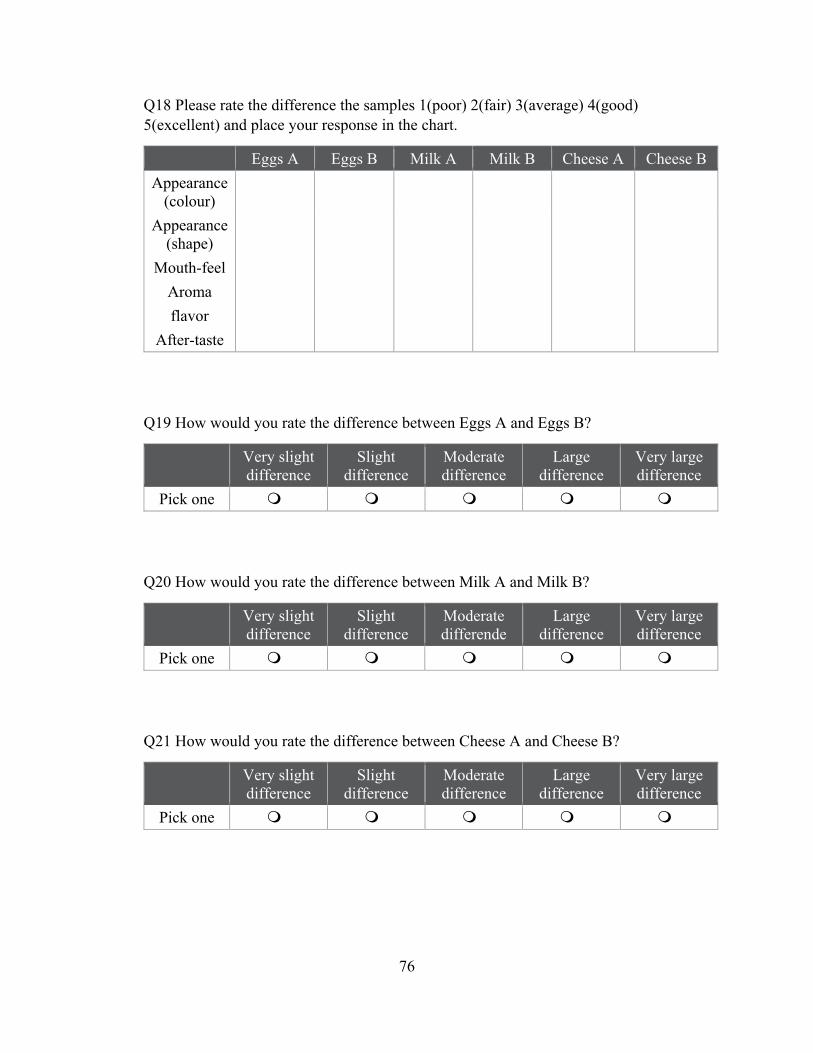
Q18 Please rate the difference the samples 1(poor) 2(fair) 3(average) 4(good) 5(excellent) and place your response in the chart.
Eggs A Eggs B Milk A Milk B Cheese A Cheese B
Appearance (colour)
Appearance (shape)
Mouth-feel
Aroma
flavor
After-taste
Q19 How would you rate the difference between Eggs A and Eggs B?
Very slight difference
Slight difference
Moderate difference
Large difference
Very large difference
Pick one
Q20 How would you rate the difference between Milk A and Milk B?
Very slight difference
Slight difference
Moderate differende
Large difference
Very large difference
Pick one
Q21 How would you rate the difference between Cheese A and Cheese B?
Very slight difference
Slight difference
Moderate difference
Large difference
Very large difference
Pick one
76

Q22 Do you eat organic foods?
Yes No
Q23 If yes, how often?
1 / week 3-5 / week Everyday
Q24 Indicate how strongly the following factors influence your preference for organic foods over conventional foods.
Not
concerned at all 1
Not very concerned 2
Neutral 3 Somewhat
concerned 4 Extremely
concerned 5
Diet: food and drink regularly
provided or consumed or
food consumed
for habitual nourishment
Well-being: the state of
being happy, healthy or prosperous
Production practices
Q25 Do you perceive foods labeled as organic to be healthier than non-organic foods?
Yes No Maybe
77

Q26 Indicate the level of risk you associate with eating conventionally grown foods vs organically grown foods.
No risk at
all 1 Not a lot of
risk 2 Neutral 3
Some risk involved 4
Extreme risk 5
Pick one
Q27 How concerned are you about the environment?
Not
concerned at all 1
Not very concerned 2
Neutral 3 Somewhat
concerned 4 Extremely
concerned 5
Pick one
Q28 How much do you think buying organic foods helps the environment?
Does not
help at all 1
Does not help much
2 Neutral 3
Helps somewhat 4
Helps completely 5
Pick one
Q29 From what categories do you purchase organic foods? Select all that apply.
Fruits Vegetables Grains and cereals Dairy Eggs Poultry Meat Fish Snacks
78

Q30 How affordable are organic foods vs conventional foods for you?
Not at all
affordable 1 Not very
affordable 2 Neutral 3
Somewhat affordable 4
Very affordable 5
Pick one
Q31 Where do you prefer to purchase organic foods? Select all that apply.
Specialty stores e.g. Whole foods, The Good Foods Co-op Grocery stores with organic sections e.g. Kroger No preference
Q32 How much does price matter when and if making organic purchases?
Does not
matter at all 1
Does not matter much 2
Neutral 3 Matter
somewhat 4 Matter
completely 5
Pick one
Q33 How much does branding of organic food influence your choice between buying one product over the other?
No
influence at all 1
Does not matter much 2
Neutral 3 Matters
somewhat 4 Matters
completely 5
Pick one
Q34 Does labelling on organic foods products influence your purchasing decision? E.g. Attractiveness, highlighting of health advantages.
No
influence at all 1
Does not matter much 2
Neutral 3 Matter
somewhat 4 Matters
completely 5
Pick one
79

Q35. What is your definition of organic?
Q36 Vegan or Vegetarian?
Vegan Vegetarian
80
References
Abu-Zahra, T. (2011). Influence of Agricultural Practices on Fruit quality of Bell Peppers. Pakistan Journal of Biological Sciences(14)18, 876-881.
Aertsens, J., Verbeke, W., Mondelaers, K., & Van Huylenbroeck, G. (2009). Personal determinants of organic food consumption: a review. British Food Journal (111)10, 1140-1167.
Barret, J. R. (2006). OP Pesticides in Children's Bodies: The Effects of a Conventional versus Organic Diet. Environmental Health Perspectives(114)2, A112.
Beaudreault, A. R. (2009). Natural: Influence of Students' Organic Food Perceptions. Journal of Food Products Marketing, 379-391.
Buder, F., Feldmann, C., & Hamm, U. (2014). Why regular buyers of organic foodt still buy many conventional products. British Food Journal(116)3, 390-404.
Clark, J. E. (1998). Taste and flavour: their importance in food choice and acceptance. Proceedings of the Nutrition Society(57), 639-643.
Crinnion, W. J. (2010). Organic Foods Contain Higher Levels of Certain Nutrients, Lower Levels of Pesticides and May Provide Health Benefits for the Consumer. Alternative Medicine Review: a journal of clinical therapeutic. (15)1, 4-12.
Croissant, A., Washburn, S., Dean, L., & Drake, M. (2007). Chemical properties and consumer perception of fluid milk from conventional and pasture-based production systems. Journal of Dairy Science(90)11, 4942-4953.
Dahm, M. J., Samonte, A. V., & Shows, A. R. (2009). Organic Foods: Do Eco-Friendly Attitudes Predict Eco-Friendly Behaviors? Journal of American College Health(58) 3, 195-202.
Davies, A., Titterington, A. J., & Conchrane, C. (1995). Who buys organic food? A profile of the purchasers of organic food in Northern Ireland. British Food Journal, 17-23.
Del Parigi, A., K, C., JF, G., AD, S., RE, P., Ravussin E:, R. E., & PA, T. (2002(75)6). Sex differences in the human brain's response to hunger and satiation. American Journal of Clinical Nutrition, 1017-1022.
Dimitri, C., & Dettmann, R. L. (2012). Organic food consumers: what do we really know about them? British Food Journal (114)8, 1157-1183.
Dransfield, E., Ngabo, T., Nielsen, N., Bredhal, L., Sjoden, P., Magnusson, M., . . . Nute, G. (2005). Consumer Choice and suggested price for pork as influenced by its
81

appearance, taste and information concerning country of origin and organic pig production. Meat Science 69, 61-70.
Eskenazi, B., Bradman, A., & Castorina, R. (1999). Exposures of Children to Organophosphate Pesticides and Their Potential Adverse Health Effects. Environmental Health Perspectives(107) Supplement 3, 409-419.
Fillion, L., & Arazi, S. (2002). Does organic food taste better? A claim substantiation approach. Nutrition and Food Science Vol 32 No. 4, 153-157.
Haase, L., Green, E., & Murphy, C. (2011). Males and females show differential brain activation to taste when hungry and sated in gustatory and reward areas. Appetite(57)2, 421-434.
Hill, H., & Lynchehaun, F. (2002). Organic milk: attitudes and consumption patterns. British Food Journal Vol. 104 No. 7, 526-542.
Hughner, R. S., McDonagh, P., Ptothero, A., Shultz II, C. J., & Stanton, J. (2007). Who are organic food consumers? A compilation and review of why people purchase organic food. Journal of Consumer Behaviour Vol 6, 94-100.
Hutchins, R., & Grennhalgh, L. (1997). Organic confusion: sustaining competitive advantage. British Food Journal(99)9, 336-338.
Khanal, R., Dhiman, T., Ure, A., Brennard, C., Boman, R., & McMahon, D. (2005). Consumer Acceptability of Conjugated Linoleic Acid-Enriched Milk and Cheddar Cheese from Cows Grazing on Pasture. Jounal of Dairy Science(88)5, 1837-1847.
Kluger, J. (2010, August 8). What's So Great About Organic Food? Time Vol, 176 Iss: 9, pp. 30-40.
Krystallis, A., & Chryssohoidis, G. (2005). Consumers' willingness to pay for organic food: Factors that affect it and variation per organic food. British Food Journal, Vol. 107 Iss: 5, 320-343.
Lea, E., & Worsley, T. (2005). Australians' organic food beliefs, domegraphics and values. British Food Journal, 855-869.
Lu, C., Barr, D. B., Pearson, M. A., & Waller, L. A. (2008). Dietary Intake and Its Contribution to Longitudinal Oraganophosphorus Pesiticide Exposure in Urban/Suburban Children. Environmental Health Perspectives(116)4, 537-542.
Lu, C., Toepel, K., Fenske, R. A., Barr, D. B., & Bravo, R. (2006). Organic Diets Significantly Lower Children's Dietary Exposure to Organophosphorus Pesticides. Environmental Health Perspectives (114)2, 260-263.
82

Magnusson, M. K., Arvola, A., Hursti Koivisto, U.-K., Aberg, L., & Sjoden, P.-O. (2003). Organic foods is related to perceived consequences for human health and to environmentally freindly behaviour. Appetite (40), 109-117.
Minelli, G., Sirri, F., Folegatti, E., Meluzzi, A., & Franchini, A. (2007). Egg quality of laying hens reared in organic and conventional systems. Italian Journal of Animal Science(6) S1, 728-7302.
Mondelaers, K., Verbeke, W., & Huylenbroeck, V. (2009). Importance of health and environment as quality traits in the buying decision of organic products. British Food Journal Vol 11 No. 10, 1120-1139.
Mondelaers, K., Verbeke, W., & Van Huylenbroeck, G. (2009). Importance of health and environment as quality traits in the buying decision of organic products. British Food Journal (111)10, 1120-1139.
Murir, P., Deaker, J., & Brown, M. (1998). Effects of forage-and grain-based feed on beef quality: A review. New Zealand Journal of Agricultural Research(41)4, 623-635.
Paul, J., & Rana, J. (2012). Consumer behavior and purchase intention for organic food. Journal of Consumer Marketing (29)6, 412-422.
Pearson, D., Henryks, J., & Jones, H. (2010). Organic food: What we know (and do no know) about consumers. Renewable Agriculture and Food Systems, 171-177.
Perez-Lopez, A. L., Moises del Amor, F., Serrano-Martinez, A., Fortea, M. I., & Nunez-Delicado, E. (2007). Influence of agricultural practices on quality of sweet pepper fruits as affected by the maturity stage. Journal of the Science of Food Agriculture(87), 2075-2080.
Proplo, A., Micol, D., & Agabriel, J. (2001). Effects of grass feeding systems on ruminat and flavour. A review. Animal Research(50)3, 185-200.
Rekha, Naik, S., & Prasad, R. (2006). Pesticide residue in organic and conventional food-risk analysis. Journal of Chemical Health and Safety(13)6, 12-19.
Seyfang, G. (2006). Ecological citizenship and sustainable consumption: Examining local organic food networks. Journal of Rural Studies 33, 383-395.
Shepherd, R., Magnusson, M., & Sjoden, P.-O. (2005). Determinants of Consumer Behavior Related to Organic Foods. A Journal of the Human Environment(34)4, 352-359.
Smith-Spangler, C., Brandeau, M. L., Hunter, B., Bavingner, C. J., Pearson, M., Eschbach, P. J., . . . Bravata, D. M. (2012). Are Organic Foods Safer or Healthier
83
Than Conventional Alternatives- A Systematic Review. Annals of Internal Medicne (157)5, 1-23.
Stobbelaar, D., Casimir, G., Borghuid, J., Marks, I., & Meijer, L. a. (2006). Adolescents' attitudes towards organic food: a survey of 15-16 year old school children. International Journal of Consumer Studies, 349-356.
The Organic Institute. (2013). Retrieved from History of the Organic Movement: http://theorganicsinstitute.com/organic/history-of-the-organic-movement/
Thompson, G. D. (1998). Consumer Demand for Organic Foods: What We Know and We need to Know. Agricultural and Applied Economics Association(80)5, 1113-1115.
USDA. (n.d.). Organic Certification. Retrieved from USDA: http://www.usda.gov/wps/portal/usda/usdahome?navid=ORGANIC_CERTIFICATIO
Vindigni, G., Janssen, M. A., & Jager, W. (2002). Organic food consumption: A multi-theoretical framework of consumer decision making. British Food Journal Vol 104 No. 8, 624-642.
Williams, C. M. (2002). Nutritional quality of organic foods: shades of grey or shades of
green. Procedings of the Nutrition Society (61), 19‐24.
Woese, K., Lange, D., Boess, C., & Bogl Werner, K. (1997). A Comparison of Orgnaically
and Conventionally Grown Foods‐ Results of a Review of the Relevant Literature.
Journal of Science Food and Agriculture, 281‐293.
Worthington, V. (2001). Nutritional Quality of Organic Versus Conventional Fruits,
Vegetables and Grains. The Journal of Alternative and Complementary
Medicine(7)2, 161‐173.
Yiridoe, E. K., Bonti‐Ankomah, S., & Martin, R. C. (2004). Comparison of consumer
perceptions and preference toward organic versus conventionally produced
foods: A review and update of the literature. Renewable Agriculture and Food
Systems, 193‐205.
Zhao, X., Chambers IV, E., Matta, Z., Loughin, T. M., & Carey, E. E. (2007). Consumer
Sensory Anlysis of Organically and Conventionally Grown Vegetables. Journal of
Food Science(72)2, S87‐S91.
84

VITA
Place of Birth Port-of-Spain, Trinidad and Tobago, West Indies
Education Expected: Masters of Science, Hospitality and Dietetics Administration,
University of Lexington, KY. 2013-2015 Dietetic Intern, University of Kentucky, Lexington, KY, 2015 Bachelors of Science, Dietetics, Tuskegee University, Tuskegee, AL. 2008-2012 Applied Associate of Science, Culinary Management and Hotel Operations,
Trinidad and Tobago Hospitality Institute, Chaguaramas, Trinidad, WI. 2002-2007
Professional Positions Graduate Teaching Assistant, University of Kentucky, Lexington, KY. 2013-2015 Child Nutrition Program Cafeteria Manager, Macon County Board of Education,
Tuskegee, AL, 2012-2013 Profession Publications
Boushey CJ, Harray AJ, Kerr DA, Schap TE, Paterson S, Aflague T, Bosch Ruiz M, Ahmad Z, Delp EJ,(2015). How Willing Are Adolescents to Record Their Dietary Intake? The Mobile Food Record. JMIR mHealth uHealth 2015;3(2):e47
85


