Page 1
STUDIES OF DIETHYLENETRIAMINEPENTAACETIC
ACID DEGRADATION IN PULP MILL PROCESS
LIQUORS
Damien Mark Blackwell, B.App.Sc.
Submitted in fulfilment of the requirements for the degree of Master of Science
%Love- 4
riwICite/viA0
University of Tasmania (Hobart)
November 1998
Page 2
DECLARATION
To the best of my knowledge this thesis contains no material previously published or
written by another person, except where due reference is made in the text of the
thesis.
ffly/od.54 D. M. Blackwell
November 1998
This thesis may be made available for loan and limited copying in accordance with
the copyright Act 1968
ovYac6,4 Damien Blackwell
November 1998
Page 3
ACKNOWLEDGEMENTS
This project has been developed with the assistance and enthusiasm of many
people. Those in the school of chemistry who deserve special thanks include Drs.
C. Moorhoff, K. Stack, Brett Paul and A. Grosse. To my supervisors Prof. Paul
Haddad and Dr. Des Richardson I extend special thanks for keeping me focused
and motivated. I thank Prof. Pierre Krausz (University of Limoges) and Roberto
Martinez (National University of Mexico) for samples, methods and spectral data
on 2-piperazinone. I would like to thank my fellow post graduate friends for
strong social/ work support throughout the course of the project, particularly when
energy/ motivation were flagging.
The advice from Roger Brown (Monash University) and Alan Sargeson (ANU)
concerning hydrolysis/ esterification of nitriles was also much appreciated. The
assistance of Alan Arnold (ADFA) with software and advice for determination of
stability constants is gratefully acknowledged.
The CSL staff, involved in tireless processing of samples, deserve many thanks;
Noel Davies (MS), Graham Rowbottom (micro analysis/ FTIR) and Evan Peacock
(NMR). The creativity of the technical staff in fabricating apparatus is also
gratefully acknowledged. I wish to recognise the generous financial and in kind
support of ANM (Boyer), particularly library services. Thanks also to Akzo Nobel
for providing samples and spectra of several novel aminopolycarboxylic acids.
Finally thanks to my family who have provided unwavering emotional support
during my post graduate studies.
Page 4
ABSTRACT
The general focus of this study was to synthesise 1-(carboxymethyl)-442-
[bis(carboxymethypamino]ethyl]-2-oxopiperazine (la), a Cyclic degradation
product of diethylenetriaminepentaacetic acid (DTPA) present in pulping liquors,
and then determine its complexing ability with metal ions of relevance to the
paper industry.
HOOCCH2I\ N(CH2 )2N(CH 2COOH) 2
la
Three independent but related methods were developed for the preparation of la,
although ultimately it was necessary to fully develop only one. In this method, 2-
chloroethyliminodiacetonitrile was prepared by Mannich's reaction of 2-
chloroethylamine, formaldehyde and potassium cyanide and converted to dimethyl
2-chloroethyliminodiacetate by treatment with gaseous HC1 in methanol.
Alkylation of 1-methoxycarbonylmethy1-2-oxopiperazine with dimethyl 2-
chloroethyliminodiacetate produced 1-(methoxycarbonylmethyl)-442-
[bis(methoxycarbonylmethyl)amino]ethy1]-2-oxopiperazine, which when
hydrolysed in acidic solution gave the trihydrochloride salt of la. The overall
yield of la trihydrochloride (via 1-methoxycarbonylmethy1-2-oxopiperazine) was
20%. Using this new method, sufficient quantities of la were synthesised for both
characterisation and complexing studies.
Page 5
Protonation constants for la were determined using both NMR and potentiometric
titration methods and showed good general agreement (Table 1). As indicated, one
less plc was determined by the NMR model.
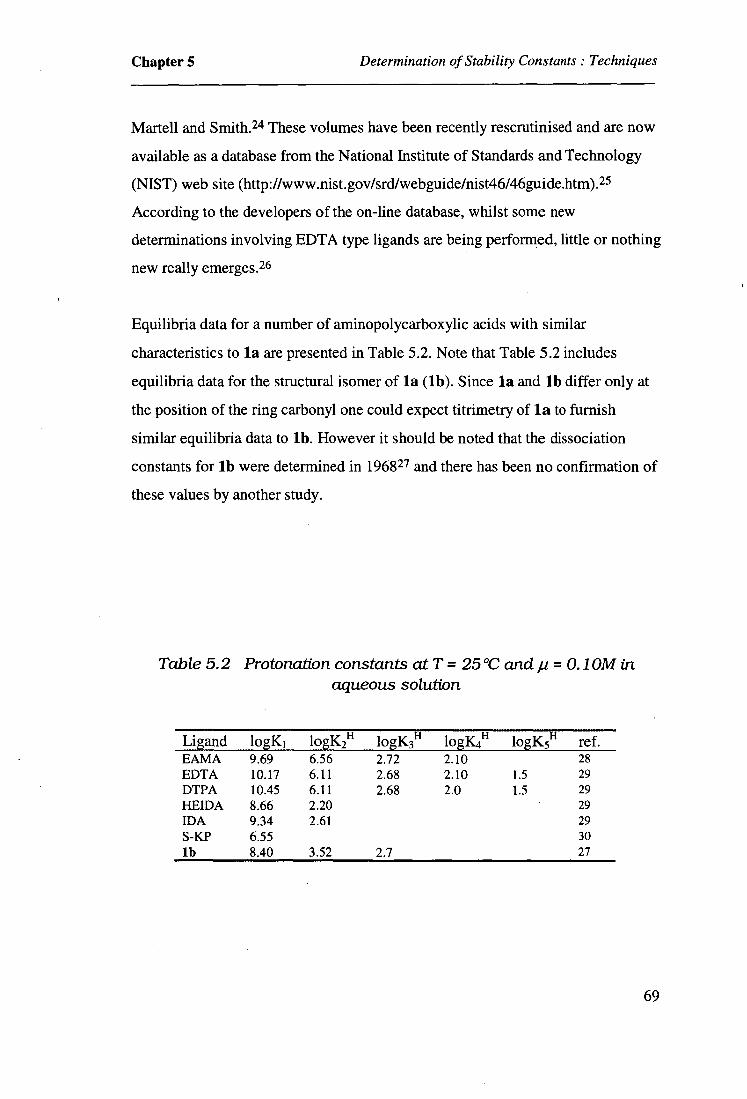
Table 1 Comparison of log protonation constants for la at T = 25°C and
,u = 0.10M (NaC104) in aqueous solution by 1 H NMR and potentiometry
logKi logK2H logK3H logK4H ref. 8.5 3.0 2.0 this work (HYPNMR)
10.5 8.3 3.5 2.5 this work (SQ)
Stability constants were derived from potentiometric titration data. The stability
sequence obtained was Fe(111) > Zn(II) > Hg(H) Pb(H) > Mn(H) and logKmL
values ranged between 12.5 and 16.5. The data confirm the anticipated decrease in
stability of la metal complexes compared with those of DTPA. However, it is
clear that la possesses quite considerable complexing ability, which has possible
implications in terms of pulping and environmental issues.
Premature decomposition of both H202 and DTPA by Mn(H) in the pulping
process has been found to be unlikely, since the stability of Mn(11)-la is similar to
Mn(H)-DTPA so even if DTPA degrades, protection of H202 via complexation of
Mn(11) with la would still occur. Another issue of some concern was the influence
of la on removal of heavy metals during wastewater treatment, since DTPA exerts
some effect on the precipitation of Zn(11) and Mn(ll) at this stage. However, this
influence is not anticipated to be very significant, due to the likely low level of la in pulping liquors.
Page 6
The major outcome of this study is that the use of DTPA as a chelating agent in
thermomechanical pulping at Australian Newsprint Mills (ANM) Albury site is
appropriate given the significant reduction in complexing power and concentration
of DTPA degradation products such as la in pulping liquors. Process changes
with respect to DTPA (eg. dosage) would appear to be unnecessary, but a
monitoring program for la may need to be implemented.
Page 7
CONTENTS
Chapter 1 Introduction and Aims
1.1 Introduction 1
1.2 Project Aims 3
1.3 Thesis Outline 4
1.4 References 6
Chapter 2 Processes Responsible for
Degradation of DTPA in Pulping Liquors
2.1 Introduction
2.2 Possible Mill Locations for Chemical DTPA Degradation
2.3 Chemical Oxidation
7
7
9
2.4 Photodegradation of DTPA 10
2.4.1 Photodecomposition Products of DTPA 14
2.4.2 Determination of Photolytes 14
2.5 Microbial Degradation of DTPA 15
2.6 Thermal Degradation of DTPA 16
2.7 Summary 17
2.8 References 18
Page 8
Chapter 3 Proposed Methods for Synthesis of
Cyclic DTPA Degradation Products
3.1 Introduction 19
3.1.1 Current Preparation of Cyclic DTPA Degradation Products 19
3.2 Unit Structures of the Cyclic DTPA Degradation Product 20
3.2.1 Piperazinone : A Possible Starting Point 20
3.2.2 2-0xo-piperazineacetic acid : A Better Starting Point ? 22
3.3 Other Approaches for Preparation of Alkyl Subtituents 25
3.4 Other Synthetic Methods 27
3.4.1 Diethylenetriamine-N,Y,N"-triacetic acid 27
3.5 Summary 30
3.6 References 31
Chapter 4 Synthesis of the Cyclic DTPA Degradation Product
4.1 Introduction 32
4.2 Scheme II' 34
4.3 Determination of la in the Pulp Mill Environment 37
4.4 Alternative Schemes 38
4.5 Scheme I 38
4.5.1 Chromatography 39
4.6 Scheme I' 41
4.6.1 Future Development of Scheme I' 45
4.7 Scheme III 45
4.8 Conclusions 47
4.9 References 48
Page 9
Chapter 5 Determination of Stability Constants : Techniques
5.1 Introduction 49
5.1.1 Why Determine Stability Constants ? 49
5.2 Techniques Available 50
5.3 Stability Constants 50
5.4 Experimental Procedures in Potentiometric Titrations 51
5.4.1 Preparation and Treatment of Materials 51
5.4.2 Apparatus 53
5.4.3 Reaction Solution 56
5.4.4 Calibration of Titration System 56
5.4.5 Typical Experimental Run 57
5.5 Calculation of Stability Constants 58
5.5.1 Initial Analysis 58
5.5.2 Computational Methods 59
5.5.3 Structure of Programs 61
5.5.4 Examples of Programs 62
5.6 Common Sources of Error and Their Minimisation 64
5.6.1 Measurement Errors 65
5.6.2 Care of Electrodes 65
5.6.3 Reagents 65
5.6.4 Temperature 66
5.6.5 Titration Errors 66
5.7 Equilibrium Measurements 67
5.8 Matrix Effects on Stability Constants in Real Solutions 68
5.9 Stability Constants of Aminopolycarboxylic Acids 68
5.10 Summary 70
5.11 References 71
Page 10
Chapter 6 Determination of Stability Constants : By Experiment
6.1 Introduction 72
6.2 Materials 73
6.3 General Procedures (Potentiometric and NMR Analyses) 73
6.4 Calculations 75
6.5 Uncertainties 76
6.6 Results and Discussion 77
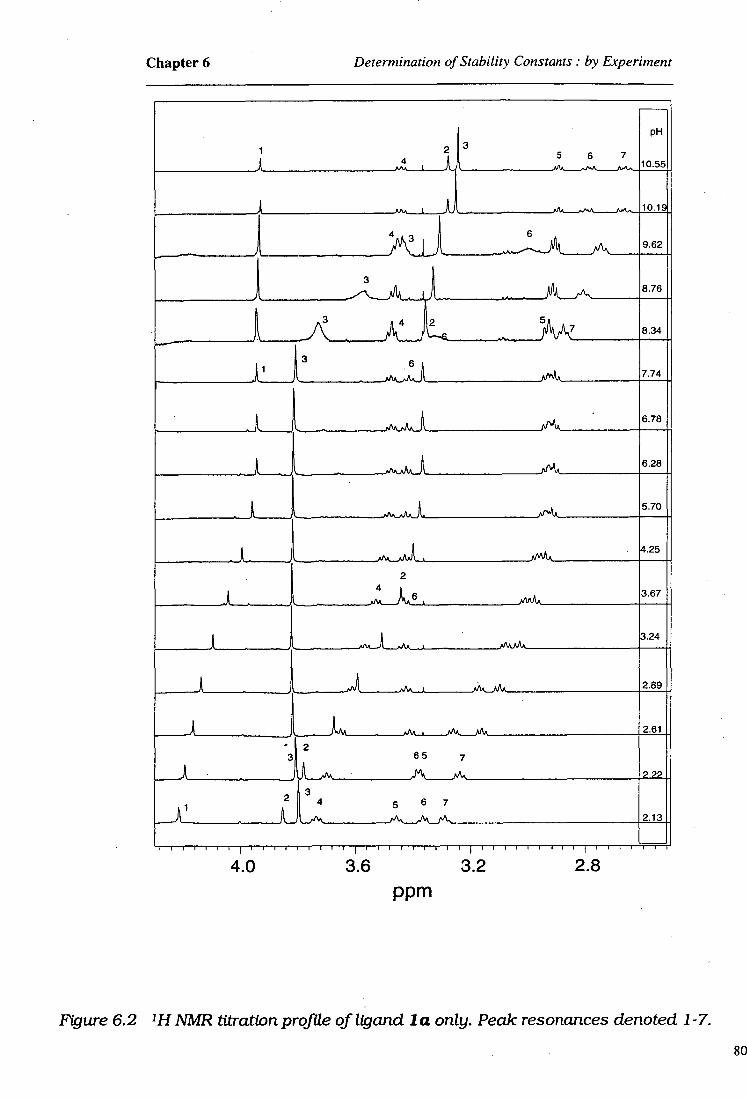
6.6.1 Initial Titration (Ligand Only) 77
6.7 Protonation Constants (by 1 1-1 NMR Titrations) 82
6.8 Stability Constants (by 1 1-1 NMR Titrations) 88
6.9 Protonation Constants (by Potentiometric Titrations) 90
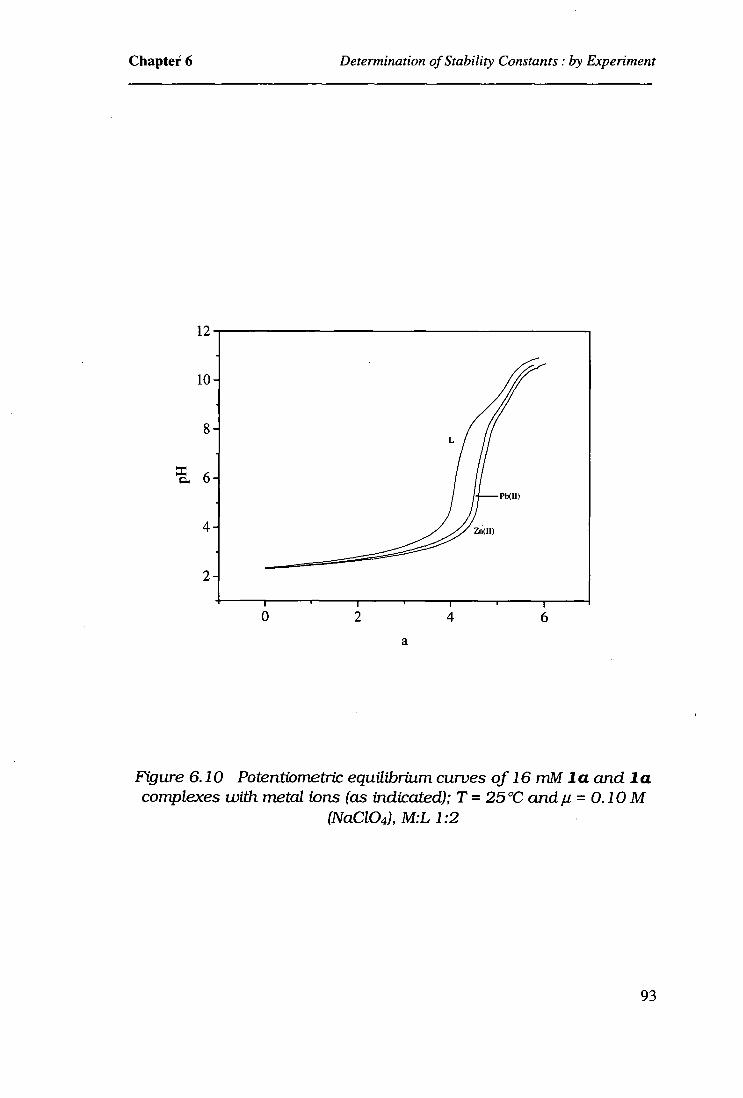
6.10 Stability Constants (by Potentiometric Titrations) 91
6.11 Implications for the Mill and Aquatic Environment 99
6.12 Summary and Conclusions 100
6.13 References 101
Chapter 7 Experimental
7.1 General Procedures 103
7.2 Materials 104
7.2.1 for Chromatography 104
7.2.2 for Organic Preparations 104
7.3 Experimental for Chapter 4 105
7.4 Chromatography 105
7.4.1 Liquid Chromatographic Instrumentation 105
7.4.2 Mobile Phases 105
7.4.3 Preparation and Analysis of Reaction Solutions by HPLC 106
7.4.4 Gas Chromatograph Instrumentation 106
7.4.5 Preparation and Analysis of Reaction Solutions by GC 107
Page 11
7.5 Organic Preparations 107
7.6 Removal of Impurity from Ligand la 121
7.6.1 Crystallisation of the Trihydrochloride Salt 121
7.6.2 Crystallisation of the Free Acid 121
7.6.3 Other Purification Procedures 122
7.7 Conclusions from Purification Work 123
7.8 Experimental for Chapter 6 124
7.8.1 NMR Determinations 124
7.9 References 125
Chapter 8 Conclusions
Conclusions 126
8.1 Future Research 127
8.2 References 129
Page 12
CHAPTER 1
Introduction and Aims
1.1 Introduction
In peroxide bleaching of thermomechanical pulp (TMP), the chelating agent
DTPA is used to chelate transition metal ions responsible for the decomposition of
peroxide. DTPA is usually the chelant of choice because of its stability and
complexing ability at alkaline (9-11) bleaching pH. 1,2 It is standard practice to
dose pulp with DTPA and/ or silicate prior to or at the bleaching stage.
Transition metal ions, notably Fe 3+, Mn2+ and Cu2-F, promote the decomposition of
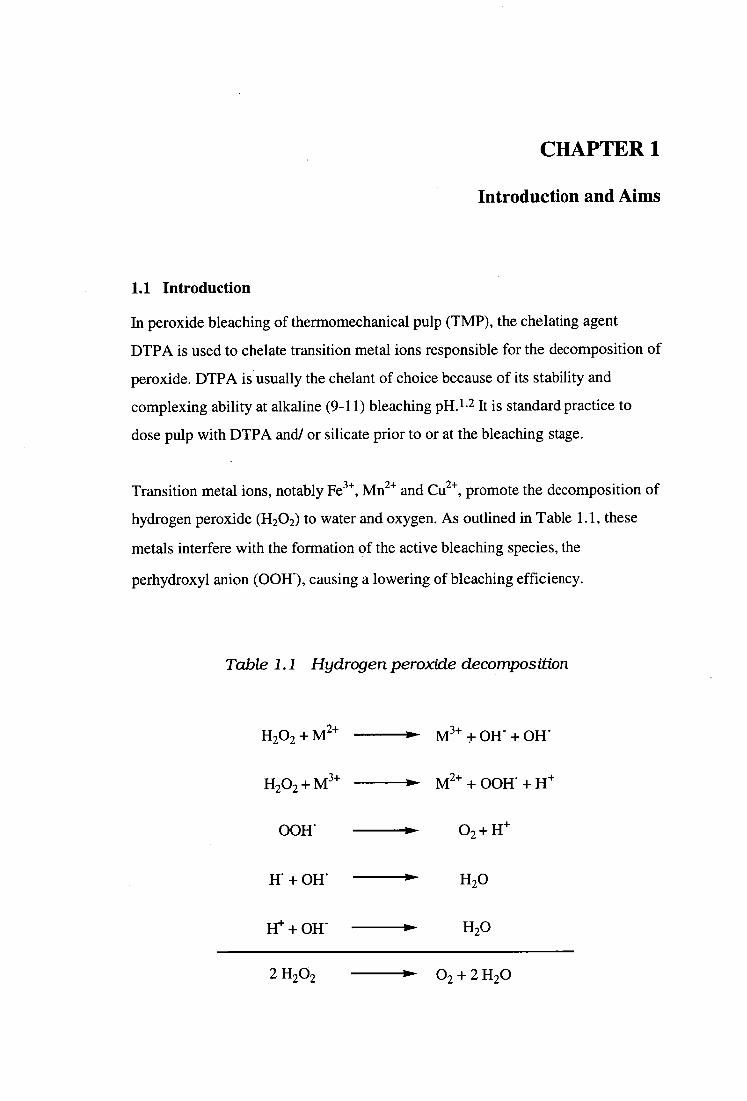
hydrogen peroxide (H 202) to water and oxygen. As outlined in Table 1.1, these
metals interfere with the formation of the active bleaching species, the
perhydroxyl anion (00H-), causing a lowering of bleaching efficiency.
Table 1.1 Hydrogen peroxide decomposition
H202 + M2+
H202 + M3+
00H.
M3+ OH- + OFF
M2+ + 001T + H+
02 + H+
H+ OH
H20
2H202 02 +2H20
Page 13
Chapter 1 Introduction and Aims
Metal ions most commonly associated with bleaching of TMP are Mn 2+, Fe3+,
Cu2+ and Cr3+. Typical concentrations for these metals in wood fibre are given in
Table 1.2. Other metal ions, such as Pb 2+, Zn2+ and Hg2+ also contribute to the
degradation of H202, but are present at far lower concentrations.
Table 1.2 Typical concentrations of metal ions in wood fibre 3
Metal ions (ppm) Mn2+ > Fe 3+ > I Cu2+ > I Cr3+
100
(decreasing decomposition
<5
potential)
<10 1 <5
The effectiveness of DTPA as an agent for binding trace metals has been studied
extensively.4,5 Research has focused on achieving optimal DTPA dosages with
respect to other pulp additives (eg silicate, magnesium sulfate), evaluated by gains
in brightness. However little attention has been directed toward the fate of DTPA
in the pulping system.
Release of DTPA into natural waters by pulp and paper mills has a number of
possible environmental implications, including :
• prevention of heavy metal precipitation and thus removal during effluent
treatment
• mobilisation of heavy metals from sediments and other sinks
• ecotoxicity
These concerns have lead to the regulation of its level in plant discharge. In NSW,
the operating licence for the ANM Albury paper mill specifies a maximum
discharge level for DTPA of 100 ppm (the average concentration of DTPA in
2
Page 14
Chapter 1 Introduction and Aims
Albury mill effluent between 1991-1997 was 2.4 ppm). 6 In comparison, The
National Health and Medical Research Council (NHMRC) have recommended a
level of 0.25 ppm ethylenediaminetetraacetic acid (EDTA) in drinking water. 7
There are currently no restrictions on the discharge levels of products from the
degradation of DTPA, some of which may also exhibit chelating ability.
1.2 Project Aims
Routine monitoring for DTPA at ANM Albury using HPLC has revealed a
significant reduction in its level during passage through the pulping system. 8 The
disappearance of DTPA from pulp mill process liquor was associated with the
appearance of a variety of degradation products, including the recently identified
1-(carboxymethyl)-442-[bis(carboxymethypamino]ethy11-2-oxopiperazine (la).
This DTPA breakdown product has also been detected in European river and
drinking waters in the upper jig! L range but only after several enrichment and
isolation stages. 9 The study also indicated that la and similar
oxopiperazinetricarboxylic acids from the decomposition of DTPA were
extremely stable. Other aminopolycarboxylic acid intermediates (eg. EDTA) were
detected but unlike la were only transient.
Th
HOOCCH 2\ N(CH2 )2N(CH 2COOH)2
la
Figure 1.1 Cyclic DTPA degradation product as identified in effluent stream
3
Page 15
Chapter 1 Introduction and Aims
Since there is a fair likelihood that la will be a reasonably strong ligand, its
chelating ability and concentration in mill discharge are of interest. Thus the two
primary objectives of this project were to :
1. synthesise and fully characterise la
2. determine the complexing ability of la with metal ions of relevance to the
pulping industry, including iron(ll), manganese(1) and mercury(11)
The main purpose of this investigation was to establish the complexing ability of
la relative to DTPA; the discrete values (quantitative) obtained for stability
constants of metal complexes of la were less important than the observed
(qualitative) general trend. Provided sufficient evidence was obtained to show the
relative difference in complexing ability between DTPA and la, the aims of this
project would be satisfied.
1.3 Thesis Outline
The project consists of eight chapters, the first of which is the introduction. The
remaining seven chapters are organised as follows.
Chapter 2 describes the various processes responsible for the degradation of
DTPA in pulping liquors. Degradation mechanisms are explored, products
identified and the contribution of each process to DTPA breakdown in
papermaking is estimated.
Chapter 3 reviews current methods for the preparation of la type compounds.
Possible methods for the preparation of la are then presented and the merits of
each identified and discussed.
The methods proposed for synthesis of la are evaluated by experiment in chapter
4.
4
Page 16
Chapter 1 Introduction and Aims
Techniques for the determination of stability constants of la are discussed in
chapter 5. Chapter 6 details the titration work performed to determine stability
constants for la and also reports the results of this work.
The experimental details for chromatographic (gas and liquid) method
development and all organic preparations are given in chapter 7. Project
conclusions and opportunities for future work are presented in chapter 8.
5
Page 17
Chapter 1 Introduction and Aims
1.4 References
(1) Garland, C. P.; Nelson, P. J. Appita 1989, 42, 354.
(2) Mathur, I. Pulp and Pa. Can. 1993, 94, 55.
(3) Richardson, D. E. Australian Newsprint Mills, personal communication,
1997.
(4) Christiansen, S. H.; Michalowski, R. J. PIMA Mag. 1989, 71, 21.
(5) Whiting, P.; Pitcher, J. M.; Manchester, D. F. J. Pulp & Paper Sci. 1984,
10, 119.
(6) Richardson, D. E. A Review of the Environmental Impact of DTPA at the
ANM Albury Mill, Australian Newsprint Mills, 1998.
(7) NHMRC National water quality management strategy : Australian
drinking water guidelines, National Health & Medical Research Council;
Agriculture & Resource Management Council of Australia & New
Zealand, 1996.
. (8) Richardson, D. E.; Harden, P. E. 48th Annual Appita Conference
Proceedings, Melbourne, Australia, 1994; 45.
(9) Ternes, T. A.; Stumpf, M.; Steinbrecher, T.; Brenner-WeiB, G.; Haberer,
K. Vom Wasser 1996, 87, 275.
6
Page 18
CHAPTER 2
Processes Responsible for Degradation of
DTPA in Pulping Liquors
2.1 Introduction
As indicated in the previous chapter, the level of DTPA detected in effluent
streams is well below that expected, based on the amount dosed and assuming no
losses in the process. It is worth devoting some attention to the processes that
contribute to the degradation of DTPA, in order to understand and appreciate how
la may arise and persist. A variety of processes contribute to the breakdown of
DTPA in pulping liquors, including chemical oxidation, photolysis and biological
and thermal degradation. Each of these processes will now be discussed.
2.2 Possible Mill Locations for Chemical DTPA Degradation
At ANM's Albury mill, DTPA, NaOH and H202 are dosed (in that order) to the
secondary refiner as part of the dilution water. After a few seconds retention,
bleached pulp is passed to the refined stock tank (RST), where bleaching is
quenched by the addition of acid. From the RST pulp moves to the latency chest
prior to screening, cleaning and thickening. The temperature gradually declines
over these stages and the pulp is dewatered. The average retention time for any
given volume of water (and thus DTPA and its degradation products) in the entire
pulping circuit (mill-treatment plant) is about 3 days. In contrast, the retention
time between DTPA addition and quenching of bleaching is extremely short. It
follows then that the opportunity for DTPA breakdown would be greater in the
overall circuit, as a result of the approximately 3 day exposure time. A schematic
of the Albury TMP plant, showing where DTPA is added, is given in Figure 2.1.
Page 19
Storage Tanks
Wennberg Din
Wenntieg Screws
ithc Diversion Chutes
111
2 hours storage
Vibes-Scrim Din Activator ,:c I 7Neen 71
Stone and Tartlet Trap
Cyclone Collector
Cellacis (3501300) Cleaners
I PScreen, 7nary
Stage 2
levN7 Stage 3 Tin 50 CP Rohner'
633 sucm.wokuon
Twin 50 C Refiners
Sproul-Waldron
DTPA addition Refined Stock Tana Stage 4
Chip reed and Penning - Typical Line 1 el 1.4-
SW. Hooper • Conoco ACC UM Rejects Theckener
REJECTS PROCESSING
• Pr (2) Co
v#00,00000,IrThsine ast.. Oislributing Steering Conveyors Batt
CI:=0 Unr•fIned Relecte Tank
Sprout.Wetdron 45-16 Repels Refiners Rejects Pr•s•ur• Screen
IT. 2.suwp
uc>
C.I.R. 1100 Pressure Screens
Relined Rejects Tank
THERMO—MECHANICAL PULPING PLANT
CHIP STORAGE
CHIP WASHING STEAMING SECONDARY
SCREENING THICKENING T.M.P. STORAGE PROPORTIONING REFINING
PRIMARY
CLEANING REFINING
Chips bore Woodman
Figure 2.1 Schematic of the ANM thermomechanical pulping plant
Page 20
Chapter 2 Processes Responsible for Degradation of DTPA in Pulping Liquors
2.3 Chemical Oxidation
Oxidation of EDTA is favoured by elevated temperatures, pH removed from
neutral and the presence of metal ions, particularly Mn(l) and Zn(II). 1,2 In
pulping, such conditions prevail during the bleaching step. However, DTPA and
peroxide are only in contact for a few seconds, so either the kinetics of the
reaction are extremely rapid or oxidation is negligible despite favourable
conditions. A preference by H202 for destruction of chromophores rather than
DTPA is expected during refining, due to high pulp consistency. After quenching
of the bleach liquor in the RST, there exists little or no further potential for DTPA
oxidation by peroxide. However, oxidation by other means may occur. For
example, oxidation of DTPA by Mn(1) at intermediate pH has been observed. 3 Oxidation of DTPA by other metal ions, including Fe(Ill) and Cu(II) at pH 5.5, is
possible depending on the oxidation potentials of these metals and their
concentration.
Whilst a number of studies describe the disposition of "free" DTPA toward
chemical oxidation,4,5 similar oxidation studies using EDTA have found a
significant reduction in oxidation rate when the ligand was complexed with a
metal cation.5 In pulping liquors one could expect DTPA to exist in both bound
and free form; DTPA complexed with metal ions being less amenable to oxidative
attack. Nevertheless, whether free or bound there exists the opportunity for
oxidation of DTPA in the overall water circuit of the pulp and paper mill.
In an oxidative study of particular interest to the current project, 6 EDTA was
successively decarboxylated by Ce 4+ in acidic media to furnish a cyclic by-product
(5) which bears strong resemblance to la (Figure 2.2). Compound 5 was stable to
further oxidation.
9
Page 21
Chapter 2 Processes Responsible for Degradation of DTPA in Pulping Liquors
The study provides some important clues as to the mechanism by which DTPA
may be degraded chemically in pulping liquors.
[CH2N(CH2C00H)2] 2 2
1) 2 Ce(IV) 2) H20 3) 2 Ce(IV)
r L o
CH2COOH
5
H20/ H+ [CH2NHCH2COOM2 H2N(CH2)2N(CH2COOF)2
3 4
further oxidation
(NH2CH2 )2 H2NCH 2 COOH
Figure 2.2 Oxidative decarboxylation of EDTA by acidic Ce(IV)
2.4 Photodegradation of DTPA
Photolysis studies involving DTPA are limited. 7,8 In comparison, photolysis of
EDTA has been investigated quite extensively, due to its more widespread
industrial use than DTPA. 7-11 However, whether the ligand is EDTA or DTPA,
the by-products of photolysis show appreciable similarity. What is important or a
prerequisite for photolysis is the speciation of the ligand.
10
Page 22
Chapter 2 Processes Responsible for Degradation of DTPA in Pulping Liquors
A number of studies report the instability of Fe(III)-DTPA solutions in daylight;
the same solutions were stable in the dark. 3,7 In one study, 3 when solutions
containing ferric ions and DTPA (2:1) were illuminated a reduction in DTPA
concentration from 50 mg L-1 to nil in 14 days was observed. Decomposition of
DTPA complexes commenced immediately upon illumination. A correlation
between absence of iron and high levels of DTPA showed the dependence of
speciation for photolysis of DTPA.
Photodecomposition of DTPA in pulping streams is likely to occur in the
wastewater treatment plant, where Fe(B1), light and dissolved oxygen are freely
available. A schematic of the ANM (Albury) wastewater treatment plant, showing
routine sampling points (SP) and pH regime, is given in Figure 2.3. Typical
residence time for any given volume of water in the treatment circuit is about 6
days : primary clarifier (1 day), aeration and secondary clarifier (1 day) and
holding lagoon (4 days). At pH values between 5-8, one could expect DTPA to be
present as Fe(11)-DTPA, according to the pH versus stability constant curves
given in Figure 2.4.
11
Page 23
FLOCCULANT
PRESS I
SLUDGE DISPOSAL
--*FLOCCULV4T
PRIMARY TREATMENT SECONDARY TREATMENT
pH •
5-6 7-8
PRINAFTI SLUDGE
STORAGE
S P2 COOLING POND
SU1DGE THICKNER
AERATION S P3 TANK
AIR
NUTRIENTS AERATION TAW 3
S P4
SLUDGE re--
OIND MMI •MIM
L. Si
HOLDING LAGOON FINAL
S P5 FILTER
NIJFRAY RIVER
POST SECONDARY TREATMENT
'EFFLUENT'
Figure 2.3 Schematic of the ANM wastewater treatment plant
SLUDGE STORAGE
Page 24
20.0
18.0
16.0
14.0
12.0
10.0
8.0
6.0
4.0
2.0
0.0
—s— Copper (II) Iron (III)
- Zinc (II) - Manganese (II)
Chapter 2 Processes Responsible for Degradation of DTPA in Pulping Liquors
2
4
8
10
12 pH
Figure 2.4 Conditional stability constant vs pH curves for various metal-DTPA complexes 12
In a study3 that monitored the fate of DTPA in pulping liquors it was found that
21% added DTPA was removed by wastewater treatment. Of this 21%, 14%
reduction in DTPA was recorded across an aeration stage (biological treatment)
and 7% over a holding lagoon.
Referring to Figure 2.3, the presence of suspended solids at the aeration stage
would reduce penetration of the light essential for Fe(ll)-DTPA photolysis and
13
Page 25
Chapter 2 Processes Responsible for Degradation of DTPA in Pulping Liquors
thus limit photolytic decomposition. The decomposition occurring at this stage
would most likely be of a chemical and biological nature.
There exists greater opportunity for Fe(111)-DTPA photodegradation in the holding
lagoon. Removal of particulates during the preceding clarifying stages would
permit greater light penetration and thus increase the likelihood of photolysis of
Fe(III)-DTPA . Degradation via Mna-DTPA is still likely to occur, but to a
lesser extent. It should be noted that photolysis of Fe(111)-DTPA is more rapid than
chemical oxidation of Mn(II)-DTPA.3
2.4.1 Photodecomposition Products of DTPA
Several authors 10,13 have identified the major by-products of Fe(110-EDTA
photodegradation, including ethylenediaminetriacetic acid,
ethylenediaminediacetic acid, formaldehyde and carbon dioxide. Other notable by-
products include iminodiacetic acid (IDA), ethylene-diaminemonoacetic acid and
glycine. In a recent study, 3 similar types of photolytes from Mn(II)-DTPA and
Fe(III)-DTPA were identified, including cyclic species not previously observed in
photolytic studies of DTPA. The stabilities of these cyclic products (eg. la) were
not established formally.
2.4.2 Determination of Photolytes
The mono, di and tri acetic acids of ethylenediamine have been methylated and
identified using gas chromatography.w NMR has been used to identify
ethylenediaminetriacetic acid as a cobalt chloride complex. 13 Formaldehyde has
been confirmed by reaction with 2,4-dinitrophenylhydrazine. Other methods for
the detection and quantitation of DTPA photolytes include HPLC and MS
techniques.
14
Page 26
Chapter 2 Processes Responsible for Degradation of DTPA in Pulping Liquors
2.5 Microbial Degradation of DTPA
Biodegradation of DTPA in pulping liquors could be expected to occur in similar
locations to photolysis, that is during wastewater treatment. Again, referring to
Figure 2.3, microbial decomposition of pulp liquor components is certainly
encouraged by the addition of nutrients and aeration during secondary treatment.
However, the specific biodegradation of DTPA during wastewater treatment is
expected to be poor at best. In one review 7 of NTA, EDTA and DTPA
biodegradation, DTPA was found to persist during wastewater treatment. In fact,
DTPA has been found to retard the decomposition of other carbon compounds,
unless complexed with a metal ion. 14 In comparison, nitrilotriacetic acid (NTA)
and EDTA show much more amenability to microbial breakdown. Several
members of the genus Pseudomonas are capable of utilising NTA as the sole
carbon source. 14 Until recently, bacterial strains capable of metabolising EDTA as
the sole carbon source had not been identified. Strains have now been successfully
isolated and enriched which use EDTA as the sole carbon and nitrogen source. 15 The microbes were sourced from industrial sewage receiving EDTA-containing
wastewater.
According to another study, 16 up to 99% degradation of EDTA was achieved for a
model wastewater where inflow [EDTA] was 200 mg L -1 . The output (effluent)
contained in excess of 80% of the theoretically expected nitrate end product. It is
important to note that the model wastewater contained a range of inorganic
nutrients so EDTA was most likely coordinated with a metal. Use of mixed rather
than pure cultures for removal of DTPA from wastewaters appears to be the
recommendation of most studies. Some authors 15,17 contend that microbial
breakdown of DTPA, EDTA and to a lesser extent NTA is poor due to the
inherent chelating action which may bind certain metal cofactors (Mn2+, Ca2+)
required by enzymes for degradative function. Furthermore, the conformation of
the "free" ligand or complex may play a role in poor biodegradability.
15
Page 27
Chapter 2 Processes Responsible for Degradation of DTPA in Pulping Liquors
Most of the intermediates identified when EDTA is photodegraded are also
observed when EDTA is biodegraded. By inference similar intermediates are
expected from microbial degradation of DTPA.
2.6 Thermal Degradation of DTPA
DTPA, whether free or complexed, can encounter temperatures ranging from
60°C (paper machine) to 120°C (secondary refiner) in pulping/ paper making.
Published thermal degradation studies of aminopolycarboxylic acids involve
predominantly EDTA18,19 with some studies on NTA.I 8 Similar information on
DTPA is limited. The assumption is, however, that the thermal behaviour of
DTPA will be similar to EDTA, based on the analogous behaviour of NTA and
IDA.
The thermal stability of EDTA and DTPA at temperatures between 0 -100°C is
well documented.I 8,19 Solid phase DTPA has been shown to be stable to 120°C by
static heating and thermogravimetry. 18 The same study showed sodium
complexones of solid phase DTPA had increased thermal stability with increasing
replacement of H by Na. A similar trend was noted in a study 20 of thermal
degradation of EDTA in alkaline solutions. EDTA was considerably stabilised
toward thermal decomposition through co-ordination with metal ions. However,
silicate was found to catalyse the degradation of certain complexones, such as
Ca(II) and Mg(II) EDTA, presumably due to the formation of insoluble Ca and
Mg silicates, freeing EDTA and enhancing reaction rate.
From the preceding discussion, one would expect thermal degradation of DTPA in
pulping liquors to be negligible. Although during refiner bleaching the
temperature may reach 120°C at pH 10, thermal decomposition would not be
favoured by the short retention time. Furthermore, as indicated previously the
thermal stability of coordinated DTPA can exceed that of the free ligand.
16
Page 28
Chapter 2 Processes Responsible for Degradation of DTPA in Pulping Liquors
2.7 Summary
Various processes by which DTPA may be degraded in pulping liquors and
wastewaters have been presented. Reaction products for each particular
breakdown process have been described, as have techniques for their analysis and
detection. The similarity between breakdown products of both EDTA and DTPA
caused by chemical oxidation, photolytic and biological degradation suggest
strongly that a universal mechanism is responsible for their decomposition. From
the preceding discussion there is strong evidence to suggest that la is a product of
successive oxidative decarboxylation of DTPA. The preceding investigation of
how DTPA might be degraded in pulping liquors will provide valuable leads
toward developing methods for the synthesis of la.
17
Page 29
Chapter 2 Processes Responsible for Degradation of DTPA in Pulping Liquors
2.8 References
(1) Richardson, D. E. A Review of the Environmental Impact of DTPA at the ANM Albury Mill, Australian Newsprint Mills, 1998.
(2) Alary, J.; Coeur, A. Bull. Soc. Chim. France 1965, 9, 2453. (3) Richardson, D. E.; Harden, P. E. 48th Annual Appita Conference
Proceedings, Melbourne, Australia, 1994; 45.
(4) Gupta, N.; Nigam, P. C.; Naik, R. M. Indian J. Chem. A 1986, 25, 39. (5) Lambert, D. G.; Jones, M. M. J. Am. Chem. Soc. 1966, 88, 4615. (6) Hanna, S. B.; Nicholson, L. M.; Hessley, R. K. Z. Anal. Chem. 1972, 258,
126.
(7) Means, J. L.; Kucak, T.; Crerar, D. A. Envir. Poll. Ser. B 1980, 1, 45.
(8) Svenson, A.; Kaj, L.; Bjorndal, H. Chemosphere 1989, 18, 1805.
(9) Kari, F. G.; Hilger, S.; Canonica, S. Environ. Sci. Technol. 1995, 29, 1008.
(10) Lockhart, H. B.; Blakeley, R. V. Environ. Sci. Technol. 1975, 9, 1035.
(11) Natarajan, P.; Endicott, F. J. Phys. Chem. 1973, 77, 2049.
(12) Richardson, D. E. Australian Newsprint Mills, personal communication,
1997.
(13) Carey, J. H.; Langford, C. H. Can. J. Chem. 1973, 51, 3665.
(14) Egli, T. Micro. Sci. 1988, 5, 36.
(15) Nortemann, B. Appl. Environ. Microbiol. 1992, 58, 671.
(16) Gschwind, N. Wasser Abwasser 1992, 133, 546.
(17) Alder, A. C.; Siegrist, H.; Gujer, W. Wat. Res. 1990, 24, 733.
(18) Esteban, M. F. Thermochim. Acta 1983, 62, 267.
(19) Motekaitis, R. J.; Martell, A. E.; Hayes, D. Can. J. Chem. 1980, 58, 1999.
(20) Motekaitis, R. J.; Cox, B.; Taylor, P.; Martell, A. E.; Miles, B.; Tvedt, T.
J. Can. J. Chem. 1982, 60, 1207.
18
Page 30
CHAPTER 3
Proposed Methods for Preparation
of Cyclic DTPA Degradation Products
3.1 Introduction
3.1.1 Current Preparation of Cyclic DTPA Degradation Products
It is well known that chelating agents of the aminopolycarboxylic acid type are
rapidly photolytically oxidised in the presence of the ferric ion.' ANM researchers
confirmed this relationship 2 using DTPA then extended the study to include the
effects of other metal ions, namely Zn2+, Mn2+ and Bi3+. The key finding of their
work was that Mn2+ promoted the decomposition of DTPA independent of light.
This observation led to the preparation of DTPA degradation products (including
la) by direct permanganate oxidation of DTPA in acidic solution. Unfortunately
this preparative approach has limited practical application due to the formation of
a complex mixture of compounds. Thus more elegant and reliable organic
synthetic methods must be developed for the preparation of la.
The structural isomer of la, 142-[bis(carboxymethypamino]ethyl]-4-
(carboxymethyl)-2-oxopiperazine (lb), has been prepared by at least two
independent methods. 3,4 In one study,4 lb was produced by debenzylation of N' -
benzyldiethylenetriaminetetraacetic acid in the presence of palladium and
hydrogen at room temperature. A yield for the conversion was not reported. Other
experimental details not reported included analytical quantities used, work-up
procedures and the percent loading of palladium on the Pd-C catalyst. In another
study,3 researchers at Akzo Nobel (manufacturer of DTPA) prepared 6 initially
Page 31
Chapter 3 Proposed Methods for Synthesis of Cyclic DTPA Degradation Products
then achieved cyclisation in acidic media to lb (Figure 3.1). Further details of this
method have not been published to date. In comparison, though at least two
groups2,5 have detected and identified the presence of DTPA degradation products
(including la and lb) in wastewaters, methods for complete synthesis of la have
not been found. A number of methods for the preparation of la by organic
synthesis are now presented for discussion.
0
H20/ H+ HNRCH2)2N(CH2COOH)212 HOOCCH 2 N(CH2)2N(CH 2COOH)2
6 lb
Figure 3.1 Partial scheme for preparation of lb
3.2 Unit Structures of the Cyclic DTPA Degradation Product
3.2.1 Piperazinone : A Possible Starting Point
An outstanding feature of la is the cyclic unit, the construction of which is viewed
as the logical starting point and perhaps the most difficult part of the synthesis.
Substituents can then be attached to this ring structure over subsequent steps. In its
most basic form the cyclic unit is piperazinone (7, Figure 3.2). This compound is
not available commercially but may be synthesised readily from relatively
common reagents, as depicted in Figure 3.2. Thus treatment of ethyl chloroacetate
with a large excess of ethylenediamine leads to the formation of a
monoalkylethylenediamine, which is then cyclised to 7 under high temperature
and vacuum. Typical yields reported for 3 range between 39-50%. 6,7
20
Page 32
Chapter 3 Proposed Methods for Synthesis of Cyclic DTPA Degradation Products
excess (CH 2NH 2)2
/NH(CH2)2NH2
H2C
\ COOEt
C1CH 2COOEt 165°C, <5minHg
Figure 3.2 Preparation of piperazinone
Due to keen and sustained interest in piperazinone derivatives as
pharmacologically active agents, many synthetic methods involving 7 are
available,8-10 several of which have particular relevance to the current application.
In most cases 7 is not actually prepared as a discrete compound. Rather, the
condensation reactions usually employed to produce piperazinone compounds
give rise to substituents at N-1 and N-4. Such condensation reactions are perhaps
more efficient than forming 7 then alkylating. For this to be realised, however,
great care must be taken when selecting linear precursors.
A possible route for the preparation of la using 7 as precursor is outlined in
Scheme I. After preparation of 7, the aim will be to alkylate N-1 using 2-
chloroethylamine HC1 to give 8. Following activation of N-4 with sodium hydride,
8 may be treated with three equivalents of ethyl chloroacetate, giving the ethyl
ester of la. Mild acid hydrolysis of 9 would then lead to the desired cyclic DTPA
degradation product.
21
Page 33
Chapter 3 Proposed Methods for Synthesis of Cyclic DTPA Degradation Products
(CH2)2N112 (CH2)2N(CH2C00E02
H I I acH2cH2NF12, N 1) NaH, DMF-THF (N
(
N Et3N r 2) 3 C1CH2COOEt HC1(aq), 100°C
N L No 0 N 0 H H I
7 8 CH2COOEt
9
Scheme I
The limitations inherent in Scheme I should be noted. First, the step involving 2-
chloroethylamine has not been verified previously and thus time must be devoted
to its development. Second, access to specialist apparatus, such as a high vacuum
single path distillation unit (eg. Kugelrohr apparatus) is required for production of
7. Other limitations include the likely poor efficiency of alkylation at N-4 and the
requirement to operate under strictly anhydrous conditions during this step.
Despite the identified limitations, 7 would serve as a very useful precursor or
intermediate for la and thus Scheme I will be explored.
3.2.2 2-0xo-1-piperazineacetic acid : A Better Starting Point ?
The other simple cyclic unit contained in la is 2-oxo-l-piperazineacetic acid (S-
KP, 5), which was previously noted (Figure 2.2) as an oxidation product of EDTA
[it is worth noting that lb contains 3-oxo-1-piperazineacetic acid (U-KP), which
may also be derived from EDTA]. In practice, 5 is prepared by treatment of
ethylenediamine-NX-diacetic acid (10) with hot aqueous acid. 11,12 Treatment of
5 with hot alkali regenerates 10. Whilst several authors 11-13 have described this
interconversion, interest in 5 as a potential precursor to novel
aminopolycarboxylic acid ligands has been limited. Although similar in
la
22
Page 34
Chapter 3 Proposed Methods for Synthesis of Cyclic DTPA Degradation Products
appearance to 7, 5 shows no pharmacological activity. The acid dissociation -
constant for 5 has been determined, (Chapter 5) in addition to a limited number of
stability constants with transition metals. 11
A possible route for the preparation of la using 5 as an intermediate is shown in
Scheme II.
(CH2)2N(CH2C00E02 [CH2NHCH2COOH12
I
10 2 C1CH2COOEt, Na2CO3 N
HC1(aq), 100°C
(1 1 N
(r2)2NH2 I 0
H CH2COOH N OCH2CH2NH2, N c 12
C
Et3N
N o HC1(aq), 100°C
N 0
I I CH2COOH CH2COOH
la
5 11
Scheme Il
In essence Scheme II is analogous to Scheme I proposed for piperazinone.
However, Scheme II appears to offer several distinct advantages over Scheme I,
namely :
• a reduction in the number of steps, since there is no need for separate
alkylation at N-4 (cyclisation leads to an intermediate with a carboxymethyl
23
Page 35
Chapter 3 Proposed Methods for Synthesis of Cyclic DTPA Degradation Products
substituent at N-4)
• 10 is commercially available
• as fewer steps are required, time and resources will be better utilised
The disadvantages relating to the untested step involving 2-chloroethylamine still
clearly apply to Scheme H. Another possible limitation of this scheme relates to
the high cost of 10, which may be prohibitive considering the quantity of la
required for subsequent complexing studies. The high cost of 10 could be offset
by preparing quantities of this amino acid in-house using the method outlined in
Figure 3.3. Thus ethylenediamine is alkylated with bromomalonic acid (14) 14 to
give N,N'-ethylenebis(aminomalonic) acid (15) which is then decarboxylated to
10. 15 Since decarboxylation is performed in acidic conditions, some 10 is cyclised
to give 5 as a minor product. The overall yield of 10 from 13 was not reported, but
a yield of 60% has been quoted for 14. 14
COOH COONa 1) 0.5 Et(NE1 2)2, 1) Br2(1), 0°C I 70°C, pH 9-11 2) NaOH 2) pH 1-2
CH2 CHBr [CH2NHCH(COOH)2] 2 15
COOH COONa
13 14 HC1(aq), reflux
10, 5
Figure 3.3 In-house preparation of 10 via 15
24
Page 36
Chapter 3 Proposed Methods for Synthesis of Cyclic DTPA Degradation Products
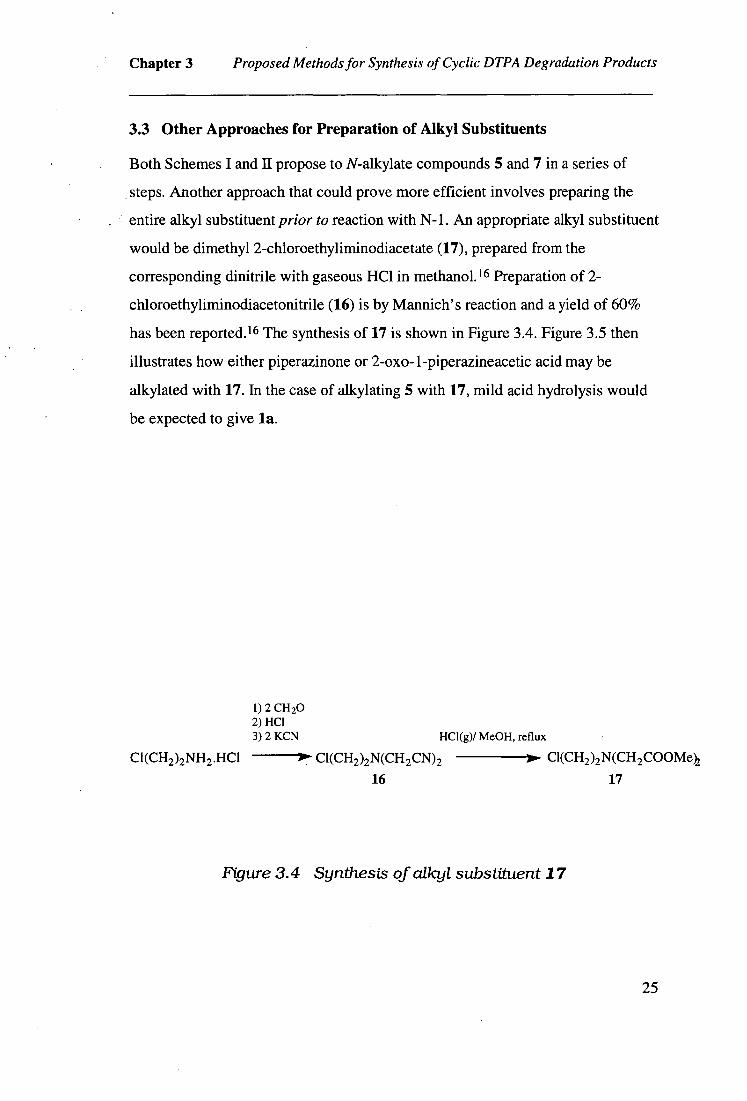
3.3 Other Approaches for Preparation of Alkyl Substituents
Both Schemes I and II propose to N-alkylate compounds 5 and 7 in a series of
steps. Another approach that could prove more efficient involves preparing the
entire alkyl substituent prior to reaction with N-1. An appropriate alkyl substituent
would be dimethyl 2-chloroethyliminodiacetate (17), prepared from the
corresponding dinitrile with gaseous HC1 in methano1. 16 Preparation of 2-
chloroethyliminodiacetonitrile (16) is by Mannich's reaction and a yield of 60%
has been reported. 16 The synthesis of 17 is shown in Figure 3.4. Figure 3.5 then
illustrates how either piperazinone or 2-oxo-1-piperazineacetic acid may be
alkylated with 17. In the case of alkylating 5 with 17, mild acid hydrolysis would
be expected to give la.
1) 2 CH20 2) HC1 3) 2 KCN HC1(g)/ Me0H, reflux
C1(CH2 )2NH2 .HC1 C1(CH2 )2N(CH 2CN)2 Cl(CH2 )2N(CH 2COOMq 16 17
Figure 3.4 Synthesis of alkyl substituent 17
25
Page 37
Chapter 3 Proposed Methods for Synthesis of Cyclic DTPA Degradation Products
H N r „
L N I
0
CH2COOH 5
17 , pH >7
(CH2)2N(CH2COOMe)2
N r „ HC1(aq), reflux
L N I
0
CH2COOH 18
la
(CH2)2N(CH2COOMe) 2 H I N N
r , r ,
H H
7 19
Figure 3.5 N -a/kylation with 17
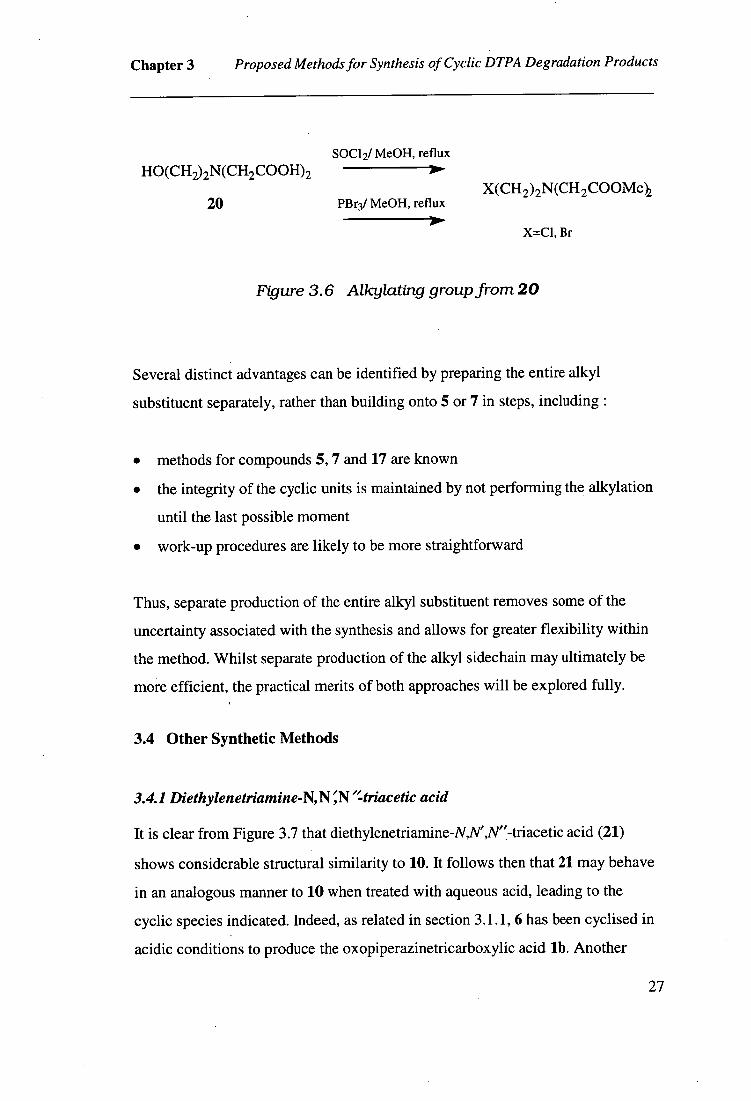
Another, though less attractive way, of producing the entire alkyl substituent could
be to use hydroxyethyliminodiacetic acid (HEIDA, 20). HE1DA itself will not
alkylate either 5 or 7 unless its reactivity is enhanced. Activation could be
achieved by exchanging the hydroxy group for a more suitable leaving group
(such as tosyl or triflate) and converting the carboxy groups to a more neutral (eg.
ester) species. This modification would essentially produce a compound similar to
17. However, the conversion of 20 is not expected to occur readily. Figure 3.6
outlines two possible means of making 20 suitable for alkylation with either 5 or
7. These conversions have not been documented previously.
26
Page 38
Chapter 3 Proposed Methods for Synthesis of Cyclic DTPA Degradation Products
HO(CH2)2N(CH2COOH)2
20
SOC12/ Me0H, reflux
PBr3/ Me0H, reflux X(CH2)2N(CH2COOMO2
X=C1, Br
Figure 3.6 Alkylating group from 20
Several distinct advantages can be identified by preparing the entire alkyl
substituent separately, rather than building onto 5 or 7 in steps, including :
• methods for compounds 5,7 and 17 are known
• the integrity of the cyclic units is maintained by not performing the alkylation
until the last possible moment
• work-up procedures are likely to be more straightforward
Thus, separate production of the entire alkyl substituent removes some of the
uncertainty associated with the synthesis and allows for greater flexibility within
the method. Whilst separate production of the alkyl sidechain may ultimately be
more efficient, the practical merits of both approaches will be explored fully.
3.4 Other Synthetic Methods
3.4.1 Diethylenetriamine -N,N;N"-triacetic acid
It is clear from Figure 3.7 that diethylenetriamine-N,Y,N"-triacetic acid (21)
shows considerable structural similarity to 10. It follows then that 21 may behave
in an analogous manner to 10 when treated with aqueous acid, leading to the
cyclic species indicated. Indeed, as related in section 3.1.1, 6 has been cyclised in
acidic conditions to produce the oxopiperazinetricarboxylic acid lb. Another
27
Page 39
Chapter 3 Proposed Methods for Synthesis of Cyclic DTPA Degradation Products
study,5 where both la and lb were detected in river waters receiving industrial
effluent, postulated the formation of lb (and la) via a similar mechanism.
COOH
z\v/NH
L COOH HN NH
HOOC L
10 21
HOOC COOH
0
CH2COOH
5
?
0
HC1(aq), 100°C
COOH
22
HOOC
Figure 3.7 Proposed cyclisation of 21 with hot acid
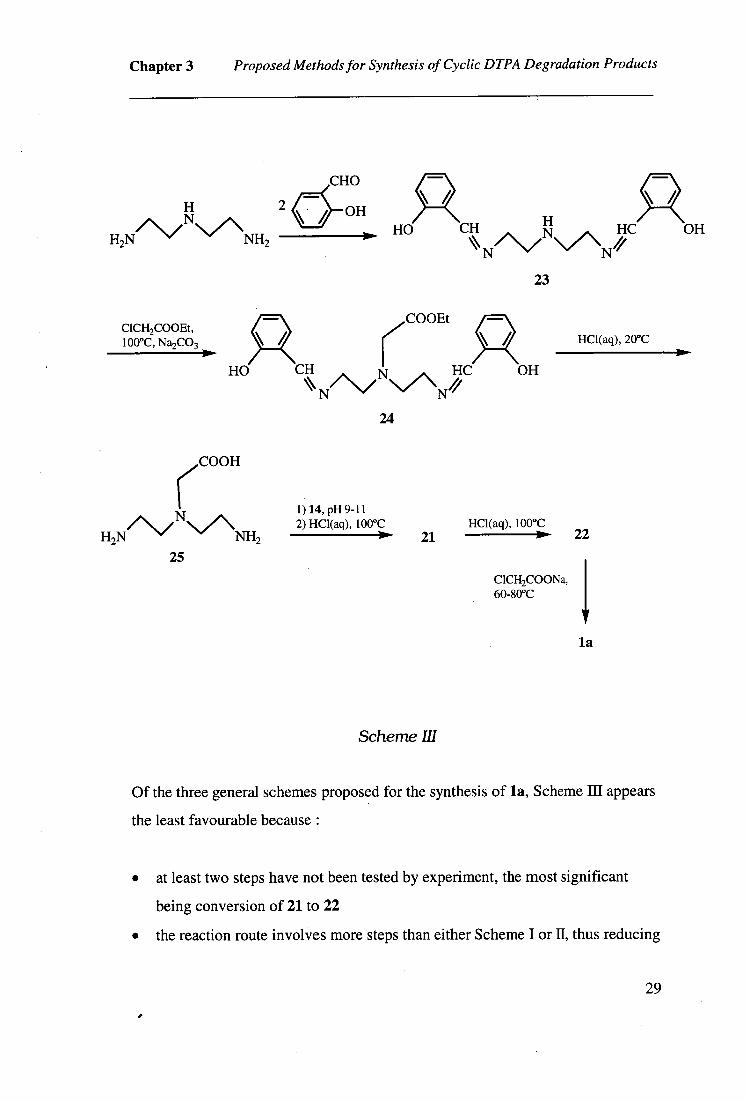
A possible method for the synthesis of la via 21 is illustrated in Scheme III. The
Schiff s base (23) is firstly synthesised 17 then alkylated with ethyl chloroacetate to
give 24. Mild aqueous acid hydrolysis of 24 leads to diethylenetriamine-N'-acetic
acid (25). Diethylenetriamine-N,N',N"-triacetic acid (21) is produced by treating
25 with two equivalents of 14 then decarboxylating. 18 Further exposure of 21 to
hot acid is postulated to give 22. The desired cyclic DTPA degradation product is
then obtained by reacting 22 with excess sodium chloroacetate. Alternatively, 22
could be treated with ethyl chloroacetate then hydrolysed to give la.
28
Page 40
HC OH
23
24
/\./NN/\ H2N NH2
/\./N HO CH
CICH2COOEt, 100°C, Na2CO3
COOEt
HO CH HC
HCI(aq), 20°C
OH
Chapter 3 Proposed Methods for Synthesis of Cyclic DTPA Degradation Products
COOH
1)14, pH 9-11 2) HC1(aq), 100°C HCI(aq), 100°C
21 25
C1CH2COONa, 60-80°C
Scheme III
Of the three general schemes proposed for the synthesis of la, Scheme ifi appears
the least favourable because :
• at least two steps have not been tested by experiment, the most significant
being conversion of 21 to 22
• the reaction route involves more steps than either Scheme I or II, thus reducing
22
1 la
29
Page 41
Chapter 3 Proposed Methods for Synthesis of Cyclic DTPA Degradation Products
efficiency
• previous studies 18,19 suggest that mixtures of amino acid intermediates can be
very difficult to separate and thus purify
Although all schemes will be explored, the main focus will be directed toward I
and II, where the syntheses are shorter, better documented and thus more likely to
succeed.
3.5 Summary
At least three different approaches have been proposed for the synthesis of cyclic
DTPA degradation product la. The merits of each approach have been discussed
and will be evaluated by experiment. It is quite possible that more than one
method will be identified for the production of la. However, only the most
practical will be developed fully. Whatever method is devised, isolation of amino
acid intermediates is expected to be challenging, due to their amphoteric nature.
Previously, crystallisation techniques have been used with success for purification
of compounds including 5, 10 12 and 15. 15 However, both 21 and 25 have not been
isolated as free acids by crystallisation. 18,19 In cases where crystallisation is not
effective the envisaged purification techniques will include chromatography,
distillation and solvent extraction.
30
Page 42
Chapter 3 Proposed Methods for Synthesis of Cyclic DTPA Degradation Products
3.6 References
(1) Kari, F. G.; Hilger, S.; Canonica, S. Environ. Sci. Technol. 1995, 29, 1008.
(2) Richardson, D. E.; Harden, P. E. 48th Annual Appita Conference
Proceedings, Melbourne, Australia, 1994; 45.
(3) Hues, M. Akzo Nobel, personal communication, 1996.
(4) Vasil'eva, V. F.; Lavrova, 0. Y.; Dyatlova, N.; Yashunskii, V. G. Zh. Vses.
Khi. 1969, 14, 461.
(5) Temes, T. A.; Stumpf, M.; Steinbrecher, T.; Brenner-WeiB, G.; Haberer,
K. Vom Wasser 1996, 87, 275.
(6) Aspinall, S. R. J. Am. Chem. Soc. 1940, 62, 1202.
(7) ICrausz, P. University of Limoges, personal communication, 1996.
(8) Pohlmann, A.; Schanen, V.; Guillaume, D.; Quirion, J.-C.; Husson, H.-P.
J. Org. Chem. 1997, 62, 1016.
(9) Schanen, V.; Riche, C.; Chiaroni, A.; Quirion, J.-C.; Husson, H.-P.
Tetrahedron Lett. 1994, 35, 2533.
(10) Tomatis, R.; Salvadori, S.; Sarto, G. P. Eur. J. Med. Chem. 1981, 16, 229.
(11) Genik-Sas-Berezowsky, R. M.; Spinner, I. H. Can. J. Chem. 1970, 48, 163.
(12) Haydock, D. B.; Mulholland, T. P. C. J. Chem. Soc. 1971, 13, 2389.
(13) Doran, M. A. Anal. Chem. 1961, 33, 1752.
(14) Forsterling, H.-D.; Stuk, L. B., A.; McCormick, W. D. J. Phys. Chem.
1993, 97, 2623.
(15) Mashihara, M.; Ando, T.; Murase, I. Bull. Chem. Soc. Japan 1973, 46,
844.
(16) Yoda, R.; Matsushima, Y. Chem. Pharm. Bull. 1994, 42, 686.
(17) Grosse, A. University of Tasmania, personal communication, 1996.
(18) Kawato, T.; Kanatomi, H.; Murase, I. Bull. Chem. Soc. Japan 1973, 46,
1723.
(19) Schneider, P. W.; Collman, J. P. Inorg. Chem. 1968, 7, 2010.
31
Page 43
CHAPTER 4
Synthesis of the Cyclic
DTPA Degradation Product
4.1 Introduction
In Chapter 3 several methods were proposed for the preparation of la. These
methods were evaluated by experiment and the results are now presented.
Practical evaluation found the most appropriate method for synthesis of la to be a
modification of Scheme II (Scheme 11'). As this scheme was ultimately selected
for the production of la, its development will be discussed first. The alternative
proposals, which were explored in some depth and did assist in the development
of Scheme II', will then be presented. These alternative pathways were explored as
part of a general effort to produce la and led ultimately to the selection of Scheme
Ir. Whilst it may be entirely possible to prepare la by the alternative approaches
which will be presented, these methods suffered from a number of crucial
disadvantages. Thus it will be shown in the following section how the synthetic
approach evolved toward Scheme Ir. It should also be re emphasised that
ultimately only one viable method was required, as it was not the synthetic
pathway of la which was the focus but the determination of stability constants.
Detailed experimental methods (including analytical data) for each compound are
given in Chapter 7.
Page 44
Chapter 4 Synthesis of the Cyclic DTPA Degradation Product
[CH2NiiCH2C04:::)H] 2
10 1) 2 CH20 2) HC! 3) 2 KCN
1) SOC12 / Me0H, reflux 2) NaOCH3
53% C1(CH2)2N1-12 .HC1
a (CH2)2N(CH2CN) 2 16 76%
Me0OCCH 2N
26 Me0H, Et3N, 65°C 1 50%
0
/ \
Me0OCCH 2N N(CH2)2N(CH2COOMe) 2
27
1
HC1(aq), 100°C 75%
0
HOOCCH 2N N(CH2)2N(CH2COOH) 2 .3 HC1
la
Scheme Il'
1 HC1(g)/ Me0H, reflux 33%
a (CH2)2N(CH2COOMe) 2
17
33
Page 45
Chapter 4 Synthesis of the Cyclic DTPA Degradation Product
4.2 Scheme II'
Published methods were followed, with some modifications, to produce
compounds 5, 1 14,2 15,3 16, 174 and 26. 1 Note that compounds 5, 14 and 15 are
not shown in Scheme 11'; their synthesis was detailed previously (Figure 3.3). No
deliberate attempts were made to optimise yields.
Ethylenediamine-N,Ar-diacetic acid (10), obtained either commercially or from
decarboxylation of NN-ethylenebis(aminomalonic) acid (15) (refer Figure 3.3),
was cyclised to 1-methoxycarbonylmethy1-2-oxopiperazine hydrochloride in hot
SOC12/Me0H. The free base (26) was liberated by treatment with the calculated
amount of NaOCH3. The yield of 26 increased with increased reaction time, for
example, given the same quantity of 10 (10.0g) the yield of the
monohydrochloride of 26 was 39.0% after 30 h and 59.6% after 36 h.
Dinitrile 16 could be manufactured rapidly "in bulk" in yields up to 76%, a gain of
about 16% on a previous publication. 4 The improvement in yield could be
attributed to both a slower rate of addition of reactants to 2-chloroethylamine HC1
and more efficient means of mixing (paddle stirrer). However, such yields could
not be achieved with the following conversion of 16 to 17. In a previous report 4
100g of 16 was converted to 17 in 9 h. In the present case, a similar period was
required for conversion of only 10g. If shorter reaction times were employed then
the reaction solution contained substantial amounts of the mono ester. It was also
determined that improved yields of 17 could be obtained by a work-up on silica
gel, rather than by high temperature/ high vacuum distillation, which resulted in
considerable decomposition. It should also be noted that neither high
temperature/high vacuum distillation nor the given chromatographic work-up was
able to furnish pure 17 if the mono ester was present to any great extent.
Nevertheless, the mono ester could quite readily be converted to 17 by further
treatment with HC1(g)/Me0H. Yields of 17 ranged between 30-33%. Figure 4.1
34
Page 46
C1(CH2)2N(CH2COOMe)2
Response
4.00 6.00 8.00 10.00 12.00 14.00 16.00 18.00
a)
C1(012)2N(CH2COOMO2
4.00 6.00 8.00 10.00 12.00 14.00
Chapter 4 Synthesis of the Cyclic DTPA Degradation Product
shows typical GCMS chromatograms of 17 as percent of Total Ion Current (TIC)
before and after work-up on silica gel.
Time (mins)
b)
Figure 4.1 GC of 1 7 before (a) and after (b) work-up on silica. See section 7.4 for GC conditions
35
Page 47
Chapter 4 Synthesis of the Cyclic DTPA Degradation Product
N-alkylation of 26 with 17 occurred readily in dry methanol at gentle reflux, as
monitored by TLC and GCMS. Liberated HC1 was effectively buffered by Et3N
and Et3N.HC1 was removed during the work-up using dry (CH3) 2C0 (Et3N.HC1
remains insoluble). No other reaction media were investigated, though
dichloromethane and toluene could serve as suitable alternatives to methanol.
After removing residual amounts of starting esters by an (CH3CH2)20 extraction,
crude 27 usually required treatment with activated carbon before purification on
silica gel (eluent CHC13:Et0H 99:1). The ester 27 was obtained as a light red oil
in about 50% yield. Figure 4.2 shows a GCMS chromatogram of 27 after work-up
on silica gel.
(98% TIC)
Me0OCCH 2N N(CH2)2N(CH2COOMe)2
4.00 6.00 8.00 10.00 12-.00 14-.00 16.00 18.00
Response
Time (mins)
Figure 4.2 GC of 27 after work-up on silica gel. GC conditions as per Figure 4.1.
Mild aqueous acid hydrolysis of 27 furnished la as the trihydrochloride salt in
75.2% yield. It should be noted that several peaks in the 1 H and 13C NMR spectra
36
Page 48
Chapter 4 Synthesis of the Cyclic DTPA Degradation Product
of la could not be assigned to la, indicating the presence of a small percentage of
impurity (refer Chapter 6). However, no further evidence of an impurity in la
could be discerned from either LSIMS or elemental analyses.
Acceptable micro analyses, 1 H and 13C NMR and MS data were obtained for most
compounds and are given in the experimental section (Chapter 7).
4.3 Determination of la in the Pulp Mill Environment
As a means of relating the organic synthesis of la to its actual determination in
pulping wastewaters, an aqueous sample of la was analysed using HPLC. 5 The
method relied on the formation of the ferric complex of la which was then
detected at 258nm. A peak corresponding to Fe(111)-la was eluted at the expected
retention time and UV spectra recorded across the peak gave matching overlays,
thereby showing peak homogeneity. A typical chromatogram showing elution of
Fe(Ill)-la is illustrated in Figure 4.3. All other peaks were system artifacts, as
determined by blank injections.
37
Page 49
Fe la
Chapter 4 Synthesis of the Cyclic DTPA Degradation Product
3 1 ID 1.5 D 2 3 13 1 0D 3.5 4J) 45 Si)513 6 D
Time (mins)
Figure 4.3 Liquid chromatogram of la as its ferric complex. See section 7.4 for HPLC conditions.
4.4 Alternative Schemes
4.5 Scheme I
Synthesis of 7 was performed by adapting several known methods. 6-8 Although
yields up to 50% have been reported, 7 the author's best was 36%. Single path
distillation of the monoalkylethylenediamine using a Kugelrohr apparatus
furnished pure 7 without the requirement for recrystallisation with ethyl acetate.
As indicated in Scheme I (section 3.2.1), N-4 alkylation of 7 with 2-
chloroethylamine had not been documented previously. To conserve 7, the
likelihood of N-4 alkylation was initially evaluated using the commercial model
38
Page 50
Chapter 4 Synthesis of the Cyclic DTPA Degradation Product
compounds N-methylpiperazine (28) and N-(2-hydroxyethyl)piperazine (29)
shown in Figure 4.4. Unfortunately, model compounds with an alpha keto group
could not be sourced. However, both compounds satisfied the minimum criterion
of containing a free secondary amino group available for N-4 alkylation.
/-\ HN NCH3 HN N(CH2)20H
28 29
Figure 4.4 Model compounds for N -4 alkylation test
Model N-4 alkylations were performed typically in either dry ethanol or aqueous
media at 60-80°C with pH control. Excess 2-chloroethylamine was used but gave
no better results than equivalent mole ratios of reactants. It was quickly
established by CEVIS (refer Chapter 7) and I H NMR that both 28 and 29 could be
alkylated at N-4 with 2-chloroethylamine, though to what extent was not
established (no attempts were made to isolate alkylated products, since this was
not intended). Since the work with model compounds suggested 7 may indeed be
alkylated at N-4 with the given agent, all subsequent work was performed with 7.
4.5.1 Chromatography
As a means of monitoring (and perhaps isolating) N-4 alkylation of 7 and possibly
subsequent reactions, a liquid chromatographic method was developed.
Piperazinone (7) and related compounds were detected using a Waters 486
detector operating at 214nm. The analytical column (250 x 4.6mm) was an
Activon Goldpalc 5i.tm C18. The retention behaviour of 7 was manipulated solely
through compositional changes to the mobile phase. Under the given conditions
(refer section 7.4.2) the retention factor for 7 was about 3.8, which was acceptable
39
Page 51
Chapter 4 Synthesis of the Cyclic DTPA Degradation Product
for the monitoring application. N-4 alkylated products (eg. 8) showed greater
retention factors. Typical chromatograms of an N-4 alkylation mixture are
illustrated in Figure 4.5. The alkylation appeared to perform better in aqueous
media than dry ethanol, in that a greater degree of completeness was observed.
Other organic solvents were not tested. No evidence to indicate alkylation at N-1
was found.
1 i i
0 2 4 6 8 10
12
14
16 time (mins)
a)
40
Page 52
Chapter 4 Synthesis of the Cyclic DTPA Degradation Product
2 4 6 8 time (mum)
10 12 14
b)
Figure 4.5 Alkylation of 7 in aqueous media at 4 h (a) and 6 h (b). See section 7.4 for HPLC conditions.
By collecting the fraction suspected as the N-4 alkylated product (8) from the
HPLC column it was possible to identify by high resolution EIMS a species with
the desired empirical formula C6H0N30. Although several attempts were made to
isolate this species using conventional techniques (eg. solvent extraction,
crystallisation) little success was achieved. Thus, yields and other defining data
were not obtained for this N-4 alkylation.
4.6 Scheme I'
The inability to isolate pure quantities of 8 on a macro scale caused a reappraisal
of Scheme I. A decision was made to adopt the alternative approach to N-4
alkylation as outlined in section 3.3. Thus 2-chloroethylamine was replaced by 17
as the alkylating agent; this modification is shown in the revised method (Scheme
I') below. The potential benefits of this approach have been highlighted previously
and several were realised in practice.
41
Page 53
. -- H N, C
7
Chapter 4 Synthesis of the Cyclic DTPA Degradation Product
I 17, Me0H, N, Et3N, 60°C
(CH2)2N(CH2COOMe)2
1)NaH, DMF-THF 2)C1CH2COOEt
I N
I•"
(CH2)2N(CH2COOMe)2
HC1(aq), 100°C la
C
1•" 0
19
0
CH2COOEt
0
30
Scheme I'
Alkylation of 7 at N-4 with 17 proceeded smoothly under the given conditions.
Triethylamine HC1 was removed by treatment with dry (CH3)2C0 and residual
starting materials with (CH 3CH2)20/CH2C12 extractions. The aqueous fraction
contained the majority of 19 which, after drying, was further purified by silica gel
chromatography (eluent CH2C12:Et0H 95:5) to give 19 as a pale yellow oil in
yields up to 32.0%. A typical GCMS chromatogram of 19 after work-up on silica
gel is shown in Figure 4.6.
42
Page 54
Chapter 4 Synthesis of the Cyclic DTPA Degradation Product
Response
4.00
6.00
8.00
10.00
12.00
Time (mins)
Figure 4.6 GC of 19 after silica gel work-up. GC conditions as per Figure 4.1.
Alkylation of 19 at N-1, in contrast to N-4, proved extremely difficult due to the
deactivating effect of the ring carbonyl group and preliminary experiments were
largely unsuccessful. A previous study9 was then located (Figure 4.8) where 4-
benzyloxycarbony1-2-oxopiperazine (31) was treated with NaH/ C1CH2COOEt
followed by mild alkaline hydrolysis to give 1-carboxymethy1-4-
benzyloxycarbony1-2-oxopiperazine (32) in one pot. The yield achieved was 35%.
43
Page 55
Chapter 4 Synthesis of the Cyclic DTPA Degradation Product
T. 1) NaH, DMF-THF 2) 1.5 C1CH 2COOEt N'■ 3) Na0H(aq) (
Toc
N r , L N o
I CH2COOH
32
..--
NO H 31
Figure 4.7 Allcylation at N-1 by NaH activation
This method was performed for 19 with little modification but only moderate
success was achieved. Whilst 30 and la were both identified by GCMS and high
resolution LSIMS respectively their presence was only minor. Unreacted 19 was
the major compound (ca. 35%) recovered from the single pot alkylation/
hydrolysis. Reasons for the poor alkylation result were difficult to formulate. The
most likely cause was premature destruction of the NaH, leading to partial
deprotonation of 19 and thus only limited alkylation. However, such a scenario
would only be possible if solvents were not fully dried or the reaction was not
performed under strictly anhydrous conditions. Great care was taken to ensure that
both of these measures were implemented in all experiments.
As can be seen, alkylation of 19 at N-1 was partial at best, a result that placed a
serious limitation on producing la via this compound. In contrast, it has been
shown that 10 is readily cyclised to give the desired carboxymethyl group at N-1
(section 4.2), thus negating the requirement for separate alkylation at this position.
It is this key difference which selects Scheme II' over I' for preparation of la.
Other reasons in favour of Scheme fir include :
44
Page 56
Chapter 4 Synthesis of the Cyclic DTPA Degradation Product
• better documentation of reactions
• shorter route
• higher overall yield
• no requirement for specialist equipment (eg. Kugelriihr apparatus)
• strictly anhydrous conditions are not required
4.6.1 Future Development of Scheme 1
The options of preparing la via 19 have by no means been fully exhausted but
were beyond the scope of this project. However, for production of la on a small
scale Scheme I' would offer the advantage of significantly lower costs, despite the
two extra steps. In the given case the shortest route with the best yields, that is
Scheme II', was considered to be more desirable than lower costs.
4.7 Scheme III
Referring to Scheme DI (section 3.4.1), protected diethylenetriamine (23) was
prepared in ca. 100% yield by treating diethylenetriamine with two equivalents of
salicylaldehyde.lo Reaction of 23 with an excess of ethyl chloroacetate followed
by a simple work-up in CH2C12 led to 24 in good yield. It was found that 24 could
be deprotected (hydrolysed) using far milder conditions than reported
previously. 11 The sodium salt of 25 could be isolated by treatment with
Na0H(aq), removal of water to dryness then reconstitution in dry methanol.
However, a satisfactory elemental analysis and NMR spectrum were not obtained
for 25.
Attempts were then made to prepare 22 from 25 in one pot, without isolating 21.
Some limited success was achieved, in that a species with desired empirical
formula C10H17N305 was confirmed using high resolution LSIMS. Furthermore,
an amide CO signal indicative of 22 was identified by 13C NMR analysis of the
crude reaction mixture. However, analysis by HPLC showed 22 to be part of a
45
Page 57
25
Chapter 4 Synthesis of the Cyclic DTPA Degradation Product
mixture of at least four related compounds that were poorly resolved (Figure 4.8).
Whilst MS and NMR suggested cyclisation of 21 to 22 had occurred, HPLC
indicated that the conversion was only partial. The majority of 21 was not
cyclised.
I i I 2 4 6
8
10 12 time (mins)
21
22 (7)
Figure 4.8 Chromatogram of attempted conversion of 25 to 22 (via 21). See section 7.4 for HPLC conditions.
Further attempts to resolve the components of the cyclisation experiment were
largely unsuccessful. However, in order to complete investigation of Scheme HI
the final step was performed using mixed product. Thus a sample of mixed 21/22
was treated with excess sodium chloroacetate to furnish a species with correct
molecular formula C12H19N307 (by high res LSIMS). Aside from removing excess
sodium chloroacetate from the reaction mixture no further work-up was done.
Whilst there was some evidence to indicate Scheme BI could generate la, the
approach suffered from several serious limitations, including :
46
Page 58
Chapter 4 Synthesis of the Cyclic DTPA Degradation Product
• amino acid intermediates which were extremely difficult to separate/purify
• at least two extra steps compared with either Scheme I' or II'
• reliance on the cyclisation of 21 to 22 (shown to be the limiting step)
• steps 5 onwards were largely untried, thus yields and other defining data were
not known
These limitations precluded any further development of Scheme DI However it
was of some interest to at least note that 21 may be converted to 22 in acidic
media, analogous to the conversion between 10 and 5 (or 6 and lb). Scheme III
could perhaps be improved if 21 was converted to the methyl ester of 22 using
SOC12/ Me0H. Treatment of the methyl ester with ethyl chloroacetate (rather than
sodium chloroacetate) would then provide an ester which when hydrolysed gave
la. Thus the formation of at least two troublesome amino acid intermediates could
be avoided. In particular Scheme ill showed us that it was best to avoid amino
acid intermediates where possible. Thus the other schemes were developed with
this in mind and incorporate the use of esters, converting to the amino acid la
only at the end.
4.8 Conclusions
At least three independent but related methods have been demonstrated for
preparation of the DTPA cyclic degradation product. By discussing and comparing
the merits of each method it has been possible to select Scheme II' as the most
suitable route to la. Thus Scheme II' has been applied to produce sufficient
amounts of ligand la for potentiometric titrations with selected metal ions.
47
Page 59
Chapter 4 Synthesis of the Cyclic DTPA Degradation Product
4.9 References
(1) Haydock, D. B.; Mulholland, T. P. C. J. Chem. Soc. 1971, 13, 2389.
(2) Forsterling, H.-D.; Stuk, L. B., A.; McCormick, W. D. J. Phys. Chem.
1993, 97, 2623.
(3) Mashihara, M.; Ando, T.; Murase, I. Bull. Chem. Soc. Japan 1973, 46,
844.
(4) Yoda, R.; Matsushima, Y. Chem. Pharm. Bull. 1994, 42, 686.
(5) Richardson, D. E.; Ash, G. H.; Harden, P. E. J. Chromatogr. 1994, 688,
47.
(6) Aspinall, S. R. J. Am. Chem. Soc. 1940, 62, 1202.
(7) Krausz, P. University of Limoges, personal communication, 1996.
(8) Martinez, R. National University of Mexico, personal communication,
1996.
(9) Tomatis, R.; Salvadori, S.; Sarto, G. P. Eur. J. Med. Chem. 1981, 16, 229.
(10) Grosse, A. University of Tasmania, personal communication, 1996.
(11) Schneider, P. W.; Collman, J. P. Inorg. Chem. 1968, 7, 2010.
48
Page 60
CHAPTER 5
Determination of Stability Constants : Techniques
5.1 Introduction
5.1.1 Why Determine Stability Constants ?
At the most fundamental level, a stability (or formation) constant provides a
numerical description of the affinity of a ligand for a metal in solution. There are a
variety of other reasons for calculating such constants, including :
• evaluation of the success of ligand design
• calculation of the concentration of the various species in solution
• calculation of other thermodynamic parameters, particularly enthalpies and
entropies of complex formation
Due to the widespread use of organic ligands, such as EDTA and DTPA, in
industries such as papermakingl and surfactants, 2 knowledge of their behaviour
with metals under a particular set of conditions is vital. Stability constants can
provide at least one indication of this behaviour. In the present study the aim will
be to determine the environmental/ pulping process implications of la by
comparing the stabilities of la complexes with those of DTPA. For example, if la
is found to have significant chelating ability, then the monitoring scheme used for
DTPA might be extended to incorporate la.
Page 61
Chapter 5 Determination of Stability Constants : Techniques
5.2 Techniques Available
There exists a wide variety of experimental techniques for the determination of
formation constants, including potentiometry, spectrophotometry, polarography
and NMR. Stability constants for DTPA have been determined most commonly by
potentiometry3 and also by spectrophotometry.4 Attractive features of
potentiometry include simplicity, rapid analyses, reliability and convenience.
Whilst spectrophotometry is another possibility it is far more tedious and time
consuming compared to potentiometry. It is an ideal method if a compound is only
sparingly water soluble or if its acid dissociation constant lies outside the
recommended range for potentiometry (pK a 2.0-11.0).5 For the given cyclic DTPA
degradation compound a potentiometric technique will be employed for the
determination of stability constants, given the reasons above.
5.3 Stability Constants
Stability constants are the equilibrium constants for reactions between metal ions
(Mx+) and ligands (LY") in aqueous solutions. Equilibria may be represented as
mx+÷ nL
IVILn(x-nY)+
B
y-
in which the role of the solvent and the charge on each species is ignored. The
overall stability constant (0) at equilibrium is defined by convention as (ignoring
charges)
[MI-n] —
n [M]
where square brackets are used to denote concentration and p is the product of the
stepwise formation constants Ki, K2,.. .It should be stressed that all the
coordination sites of M are occupied by water, so that the reaction simply involves
replacement of one or molecules of water by L.
50
Page 62
Chapter 5 Determination of Stability Constants : Techniques
When L is a weak acid or base, hydrogen ions and metal ions compete for sites on
the ligand. At low pH, such a ligand binds fr preferentially. For example, the
overall reaction between glycine and Cu2+ may be given as
2 NH3CH2C00 - Cu2+ Cu(NH2CH2C00 -)2 + 2 H+
Quantitative formation of CuL2 occurs only if the liberated H + is removed by
titration with standard alkali. Titration of the complexant in the presence of M
leads to lower pH values than if L were titrated alone. This can be seen from
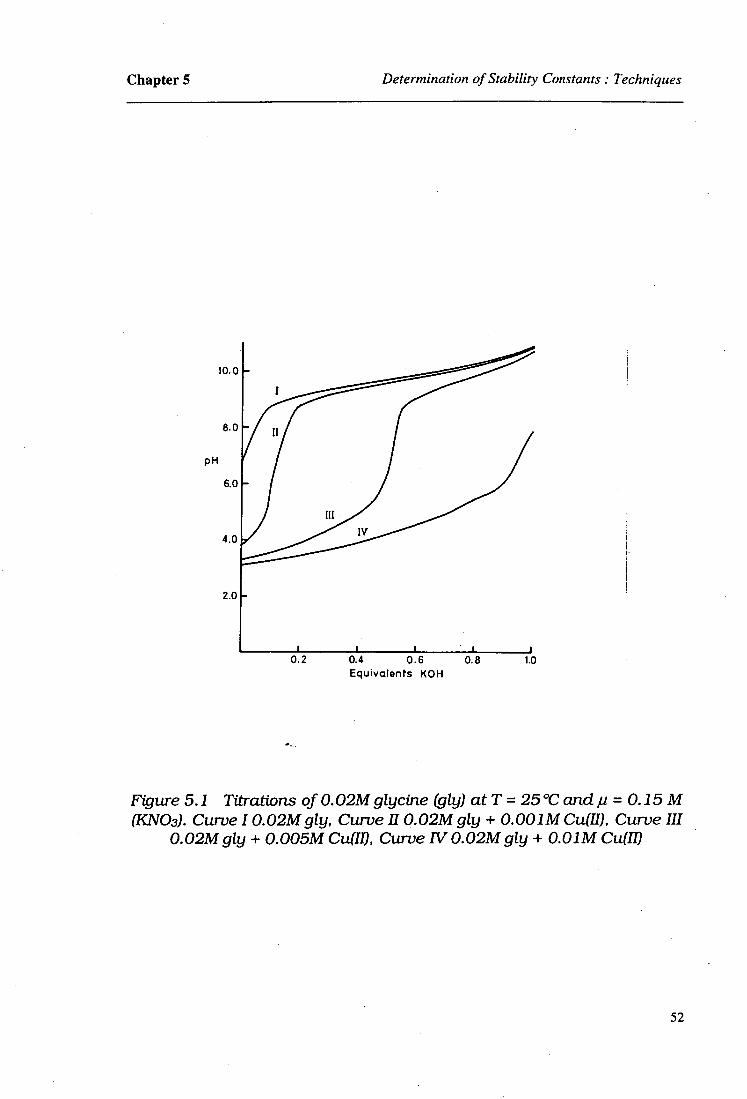
Figure 5.1.
The difference between the curves shown in Figure 5.1 can, by rather lengthy
calculation, reveal the stability constants. The majority of recorded stability
constants (IUPAC) have been determined by such a titration method. 5 Versatility
has been improved by the introduction of software to assist with data collection
and processing. 6,7 Programs involved in the collection and processing of titration
data will be discussed in section 5.5.
5.4 Experimental Procedure in Potentiometric Titrations
5.4.1 Preparation and Treatment of Materials
It is important to ensure that all materials be of the highest possible purity. Precise
measurements depend on good starting materials in addition to good measuring
instrumentation and technique. The ligand should ideally be available in
crystalline form and be recrystallised and characterised by elemental analysis and
NMR prior to use. It may be prepared as a stock solution (0.01-0.05M) if stable or
weighed into the reaction vessel for each run. 6
51
Page 63
Chapter 5 Determination of Stability Constants : Techniques
pH
10.0
8.0
6.0
4.0
2.0
0.2 0.4 0.6
0.8
1.0 Equivalents KOH
Figure 5.1 Titrations of 0.02M glycine (gly) at T = 25°C andp = 0.15 M (KNO3). Curve I 0.02M gly, Curve II 0.02M gly + 0.001M Cu(II), Curve III
0.02M gly + 0.005M Cu(II), Curve IV 0.02M gly + 0.01M Cu(II)
52
Page 64
Chapter 5 Determination of Stability Constants : Techniques
Metal ions to be investigated can be prepared as standard solutions (0.02M) of
their salts or again weighed directly into the reaction vesse1. 6 Perchlorates and
nitrates are common anions of choice, since they have large radii which
discourage competition between L and counter-ion for a site on M. Easily
hydrolysed metals require an excess of acid in the reaction solution to prevent
partial precipitation.
Clearly it is sensible to use the same species as both counter ion and anion for the
background electrolyte. For the bulk cation, a species with little or no tendency to
form complexes with L is required, thus sodium and potassium are popular
choices and their perchlorates are extremely water soluble.
Standard acid and base (eg. HNO3, NaOH) should have similar concentration to
the background electrolyte and furnish the same ionic species. Alkali must be
carbonate free, as determined by a barium hydroxide test. Commercial volumetric
solutions are usually carbonate free. All solutions containing hydroxides should be
prepared with deionised water and standardised against potassium hydrogen
phthalate. Solutions should be stored in polyethylene vessels protected with CO2
adsorbents.
Stock solutions should be analysed by at least two independent methods. 6,8 Since
the initial concentrations of L, M and H form the basis of all subsequent
calculations, great care should be exercised with the initial analyses.
5.4.2 Apparatus
Titrations are conveniently performed in a cell similar to the one depicted in
Figure 5.2.9 Temperature is regulated by the circulation of thermostated water
through a double walled glass vessel. Rubber bungs or 0-rings can be used to
exclude contact with the atmosphere. Sufficient openings are provided in the cap
to accommodate electrodes, gas lines and passage of materials into the cell.
53
Page 65
Syringe plunger removed Used as gas outlet.
let for nitrogen (stirring). And drain stopcock
Chapter 5 Determination of Stability Constants : Techniques
Top view closed titration cell
Figure 5.2 (a) Plan view of custom made glass titration vessel
54
Page 66
Tapered ground glass joints for material exchange, probes & autodispenser
Side View of closed titration cell
Chapter 5 Determination of Stability Constants : Techniques
Figure 5.2 (b) Side view of custom made glass titration vessel
55
Page 67
Chapter 5 Determination of Stability Constants : Techniques
Agitation can be achieved either by use of a paddle or magnetic stirrer or a stream
of inert gas. Standard base (or acid) is delivered via a capillary tip or dispenser just
below the surface of the reaction solution and can be measured to 0.05 mL if
necessary. A cell capacity of 70-100 mL is recommended in order that a volume of
50 mL of experimental solution can be contained. 5,6 The complete titration system
can be automated and interfaced to a computer to facilitate data collection and
analysis. Automatic or semi-automatic titration systems are finding widespread
application in many areas and can produce extremely precise and accurate results.
5.4.3 Reaction Solution
The reaction solution typically comprises precisely measured amounts of L, M,
standard acid (if required) and sufficient background electrolyte to give the desired
ionic strength (often 0.1M). Doubly distilled water is added to make up the final
volume. If common practice is observed, then the reaction solution has low p[H]
and contains the fully protonated form of the ligand.
5.4.4 Calibration of the Titration System
Before a titration can be performed the titration system (ie pH probe) must be
calibrated in terms of either pH or mV. Calibration with standard buffers 10,11 for
which the pKa's are very accurately known under specified conditions is often
used. Two or three point calibrations are possible with these buffer solutions,
covering the expected pH range for the titration. The pH electrode may also be
calibrated using a strong acid/base titration (Gran's method). 6 Another calibration
method involves setting the pH meter to measure mV data which are then
converted to pH using the Nernst equation. Thus calibration involves
determination of system standard potential (E°).
Many types of autotitration apparatus deliver standard acid/base via a rotary
reciprocating pump. These are set in the factory to dispense a standard volume
(often 0.05 mL) per revolution but for best results a pump should be calibrated by
AIlin
en SV
1
56
Page 68
Chapter 5 Determination of Stability Constants : Techniques
the researcher before use. For pump calibration a series of aliquots are dispensed,
weighed, and the average weight used to calculate a calibration constant. An
acceptable calibration constant should be between 0.900 and 1.100 with relative
standard deviation <0.1%.
5.4.5 Typical Experimental Run
As all future work relies on the thorough characterisation of the ligand, initial
titrations are aimed at determining the acid dissociation constants, proton
stoichiometry and formula weight of L. Thus an acidic solution of L is titrated
against standard base such that a generous number of data points are obtained for
each experimental run. Equilibrium, observed as a stable meter reading, must be
established before addition of further base. It has been found that for most systems
protonation and deprotonation are complete within the time required for
mixing. 6, I 2 The titration curve (pH versus mL titrant) thus obtained for the ligand
only is used to calculate pKa values.
In a subsequent run an aliquot of metal ion solution is added, plus sufficient acid
to ensure L is fully protonated, then the solution is titrated as before.
It is important that at least two different mole ratios of M:L be evaluated, since the
internal agreement of any one set of results is insufficient proof to discount
competing equilibria. If identical profiles are obtained using different reactant
mole ratios, then results are clearly reproducible and the formation of mixed or
polynuclear complexes is negligible. Repetition of titrations is probably only
necessary as one step in trouble-shooting if the pH profiles derived from two
different runs on the same system do not correspond.I 2
57
Page 69
Chapter 5 Determination of Stability Constants : Techniques
5.5 Calculation of Stability Constants
5.5.1 Initial Analysis
It is sensible to process any exploratory set of measurements at least by graphical
means, such that a general view of the system behaviour may be obtained. In this
way the presence of polynuclear or mixed complexes may be detected and one can
learn much about mononuclear systems from the shape of the equilibrium curve
(Figure 5.3).
12
10 -
8 - IDA
Citric acid
4 -
2 -1
0 1 2 3 4 a
Figure 5.3 Potentiometric equilibrium curves of IDA and citric acid at T= 25°C, p = 0.10 M (NaC104) and a = moles of base added per mole
of ligand
58
Page 70
Chapter 5 Determination of Stability Constants : Techniques
Plotting an equilibrium curve can also reveal suspect points which may, if shown
to be invalid, be excluded from further analysis. Systematic errors can also be
exposed, which must then be investigated and remedied. If preliminary graphical
analysis suggests the data are free from obvious errors then definitive values for
stability constants can be determined using computational methods.
5.5.2 Computational Methods
The object of any computational method is to find the best fit between
experimental and theoreticaFfunctions. If the data are not in question then the
model (theoretical function) must be flawed. A poor model is either incomplete or
fails to adequately describe the species present. Thus after verification of the
experimental data the model may be altered one item at a time until acceptable
agreement is obtained between the model and the experimental function.
The computational method adopted will vary with the type of system being
studied; the best method for calculating the pK a for a monobasic acid is unlikely to
be the most suitable for evaluating more complicated equilibria. However, the
computational criteria are common to all types of systems.
An acceptable method will incorporate the following features :
• provide a clear indication of the complexes present
• make full use of the experimental data and be flexible to allow weighting of
measurements
• locate systematic errors and allow corrections for them
• yield best values for parameters and give error limits
• be efficient in terms of time and effort
59
Page 71
Chapter 5 Determination of Stability Constants : Techniques
When final values for stability constants have been obtained, it is imperative that
their nature and magnitude be compared with counterparts from previous systems.
By doing so a disagreement between values can be detected and the system
reinvestigated if necessary.
In the current investigation such a comparison will be limited by the fact that the
system is under investigation for the first time. However the values obtained will
be critically evaluated in terms of the principles and guidelines of coordination
chemistry and the requirements for equilibrium constant determination.
It is possible to achieve a good least squares fit whilst the magnitude of the
stability constant is far removed from reality. 6 This can arise from the relative
ratios of [ML] to [M] during the course of the titration. If the reaction is either
substantially incomplete at the end of titration or complete at the start, then
potentiometric data used for calculation of stability constants will incorporate
significant error. Appreciable quantities of all equilibrating species must be
present at once in order that accurate constants be determined. To discern whether
reacting species are present in sufficient amounts (ie measurable) at equilibrium, it
is useful to plot species distribution curves (Figure 5.4). Species distribution
curves can also be helpful in testing the validity of published stability constants.
60
Page 72
Chapter 5 Determination of Stability Constants : Techniques
1.0
0.9 -
0.8 -
0.7 -
0.6 -
.2 0.5 - a.
0.4 -
0.3 -
0.2 -
0.1 -
0.0 0
Ca(11)
Ca(II)-L
Ca(11)- ...........
4 6 8 110 pH
2
12
Figure 5.4 Species distribution curves for 1 mM Ca(11)-EDTA system at 1:1; T = 25°C and ,u = 0.10 M (NaC104)
5.5.3 Structure of programs
Programs for use in equilibrium analysis all have several parts, or blocks, in
common. A typical program for computation of stability constants from titration
data (mL base, pH) may consist of the following blocks :
1.INPUT. This block reads the data and may perform some preliminary
calculations. Most programs require initial estimates for certain parameters, such
as p values.
2. RESIDUAL SUM OF SQUARES. This block computes the standard deviation
of fit (U) which is then minimised.
3. MINIMISATION. A search is made for the values of the parameters (eg. 0's)
involved in the minimisation of U. Many programs use a least squares method
61
Page 73
Chapter 5 Determination of Stability Constants : Techniques
combined with algorithmic processes.
4. ERROR ANALYSIS. This block calculates the confidence interval of the
parameters, their standard deviations, correlation coefficients and other statistics.
5. GOODNESS-OF-FIT TEST. Here statistical methods are used to test the best
models obtained from those put into the computer, giving a final model.
6. ADDITIONAL SUBROUTINES. Various mathematical subroutines are
contained in this block.
7. OUTPUT. Values for parameters, with their statistics, are written here.
A more detailed discussion of program structure can be found in Meloun et al. 7
5.5.4 Examples ofprograms
There are many programs now available for the computation of equilibrium
constants from potentiometric data; some examples are given Table 5.1. Two
programs from Table 5.1 have been selected for further discussion.
Table 5.1 Computer programs for the determination of equilibrium constants from potentiometric data
Program Ref.
BEST 6 BSTAC 13 LOGMIN 14 MAXIPOT-F 15 MINIQUAD 16 MUCOMP 17 PKAS 18 PROTAF 19 SUPERQUAD 20 TITAN 21 TITF1T 22
62
Page 74
Chapter 5 Determination of Stability Constants : Techniques
BEST6 is an example of a FORTRAN program designed to calculate plC a 's and
stability constants from titration data. The basic algorithm in BEST aims to
minimise the standard deviation of fit (SIGFIT, U) between observed and
calculated pH values of the entire titration curve. The program essentially solves a
series of simultaneous equations where some values of 13 are known (from
previous calculations) and some are unknown. The initial pass of the program uses
both known and estimated values of the unknown constants.
The algorithm in BEST is utilised in the following sequence :
1. Begin with a set of known and estimated overall stability constants (13's) and
compute [H+] at all equilibrium points
2. Compute U and minimise
3. Adjust the unknown D's and continue iterations until no further minimisation of
U can be achieved, thus providing the final 13 values
Fine-tuning is possible through minimisation in U by the variation of any of the
input parameters which define the mathematical shape of the titration curve. The
weighting factor used when computing U serves to increase the sensitivity of the
computations in buffer regions and to lessen the influence of less accurate pH
values near inflection points.
Another FORTRAN program for computation of stability constants,
SUPERQUAD (SQ),20 operates in a similar manner to BEST. SQ uses a nonlinear
least squares curve-fitting algorithm for minimisation of U and determination of
stability constants. As with BEST the user must provide initial estimations of any
unknown 13 values which are then refined with repeated passes of the program. SQ
is interactive, allowing the user to vary several input parameters for refinement of
calculations. The authors'of SQ have recently released a suite of programs,
63
Page 75
Chapter 5 Determination of Stability Constants : Techniques
HYPERQUAD (HQ),23 which allow facilities for use of standard data files and
standard procedures across data from a number of different sources, including
potentiometric, spectrophotometric and NMR. The main difference between SQ
and HQ is that HQ is able to deal with spectrophotometric data in addition to
potentiometric data. The authors are currently developing a Windows version of
HQ which they hope will eliminate the restrictions on experimental data (in terms
of processing capability) and allow for the on-screen display of more information
simultaneously using scrolling windows.
The algorithm(s) built into programs such as BEST and SQ assume that the data
were obtained at equilibrium. If hydroxy species are important then equilibrium
conditions will take some time to achieve. Thus it is vital to ensure that sufficient
time is allowed to reach equilibrium such that programs have the most reliable
data with which to work.
It is beyond the scope of this investigation to present a more detailed discussion of
computational methods than that described above. Suitable graphical and
computational treatments of pH measurements generated by potentiometric
titrations may be found in Martell and Motekaitis 6 and Meloun et al: 7
5.6 Common Sources of Error and Their Minimisation
There are many potential sources of error in the determination of stability
constants by titrimetry. It is highly recommended that commercially pure ligands
for which pKa's and stability constants are known (such as citric acid or EDTA) be
investigated prior to any evaluation involving new ligands, such that an
appreciation of the experimental method, equipment and any computational
methods can be gained. 6,8
64
Page 76
Chapter 5 Determination of Stability Constants : Techniques
5.6.1 Measurement Errors
Poor data can arise from several sources, including improper calibration of the pH
meter/ electrode system, problems with behaviour of the glass electrode, impure or
otherwise improper characterisation of the ligand and undesirable side reactions/
phase separations that alter quantities of L, M and H during the course of the
titration.
5.6.2 Care of Electrodes
The pH or ion-selective probe, when not in use, should be stored by immersing the
bulb in saturated KC1. Occasionally the glass electrode may exhibit erratic
behaviour following contact with heavy metal ions. Treatment of the probe with
dilute HC1 for a short period can restore normal function.
Failure of the reference electrode is possible if KC1 crystallises in the opening
which serves as the liquid junction to the experimental solution. Removal of such
blockages restores normal probe function. The liquid junction potential may also
be altered due to the flow of experimental solution back into the reference
electrode. Keeping the reference electrode filled and avoiding immersion above
the filling hole are steps which prevent backflow of experimental solution and
thus minimise undesirable changes to liquid junction potential.
5.6.3 Reagents
Poor standardisation of the reagents can lead to serious error and must be
prevented. For example, a small concentration error for a pentaprotonated ligand
(eg. DTPA) would result in a five-fold error in the amount of available H. Whilst
this may not significantly alter equilibrium constants for major species, a large
deviation could be introduced into the calculations for constants of minor species.
65
Page 77
Chapter 5 Determination of Stability Constants : Techniques
Stock solutions of the less basic metals should contain excess acid to prevent
partial hydrolysis and subsequent precipitation of hydroxides.
Other precautions which should be observed include maintenance of an inert
atmosphere (Ar or N) and careful control of temperature and ionic strength.
5.6.4 Temperature
Temperature can be the most common source of error in pH measurements. The
slope of the pH electrode changes with temperature; modern electrodes
automatically compensate for this effect. For potentiometric titrations performed
at constant temperature thermal effects are not usually a problem.
Temperature may also bring about changes in chemical equilibrium. Calibrating
the electrode with well-characterised buffers, for which pH values are known at
different temperatures, minimises undesirable impact on chemical equilibria.
5.6.5 Titration Errors
A common observation encountered when titrating with alkali is for the values (in
the set of pKa values) to show an upward trend during the course of the titration.
This is usually due to the effect of an impurity, which reduces the actual amount
of ligand present. Water is by far the most common impurity. 5 Thus all ligands
submitted for determination of dissociation constants should be of analytical
purity and dried thoroughly.
Upward trending pH may also signal excessive stirring, causing loss of solution to
the reaction cell walls. Furthermore, the calculated amount of ligand may be
present but not entirely dissolved, thus making it impossible to obtain satisfactory
data. An incongruous set of results is often indicative of decomposition during the
titration.
66
Page 78
Chapter 5 Determination of Stability Constants : Techniques
5.7 Equilibrium Measurements
Equilibrium conditions must be achieved prior to any pH measurements. Two
general criteria apply; that the electrode be given sufficient time to adjust to the
new conditions and that restrictions due to the kinetics of complex formation/
dissociation be considered. The first criterion is usually satisfied within 30 sec
provided the stirring rate is adequate for homogeneous mixing. 6 The boundaries
for the second criterion are usually far broader.
When reaction kinetics are not limiting then sluggish response time may be
attributed to either a spent electrode or one contaminated, for example, by
repeated exposure to polyvalent metal ions. A spent electrode may show slow drift
for hours whilst a contaminated probe stops drifting. Spent electrodes are not
restored by treatment with dilute acid whereas a poisoned probe can be
rejuvenated by following the recommendations of the manufacturer.
The rate of chemical equilibrium clearly depends on the system under
investigation. Suspicion of slow kinetics may be confirmed by allowing longer
equilibration time during a repeat experiment. A titration becomes impractical if
the run time exceeds 12 h since it is difficult to assure system calibration for such
an extended period. 6 Additional problems associated with long equilibration time
include contamination of the experimental solution (electrolyte from the reference
electrode), undesirable side reactions and phase separation. At least two
approaches can be employed to address slow reaction kinetics; successive data
points can be obtained from a number of fresh experimental solutions, or by a
batch method, where solutions representing successive data points are prepared,
stored for the appropriate time then assayed and reassayed to deduce the
equilibrium pH value. 6
67
Page 79
Chapter 5 Determination of Stability Constants : Techniques
5.8 Matrix Effects on Stability Constants in Real Solutions
The stability constants determined for la with selected metal ions in vitro will
represent "ideal" values. The composition of the experimental solution is well
defined in terms of the reactant species (M, L and H) and conditions are carefully
controlled to optimise determinations. In contrast, the real solution (eg. pulping
effluent sample) has quite an undefined composition and M-L equilibria will be a
function of many components, not restricted to pH only. Thus it is likely that
complex formation in real samples will deviate somewhat from formation under
strictly controlled laboratory conditions, leading to differences in the magnitude of
stability constants.
Stability constants calculated for la by the described potentiometric method could
be ranked, in order of decreasing magnitude. This ranking could then be assumed
to hold in the case of real solutions, though values may be elevated or depressed in
relation to the "ideal" values. This is of course a rather gross over-simplification
but may help our understanding of complexing power of la in pulping liquors.
It may ultimately be necessary to thoroughly characterise the real solution then
determine how matrix components affect complex formation. Complete
compositional characterisation of a real pulping liquor is envisaged to be
extremely tedious and time consuming. It may also be that complex formation in
real samples depends only on a few key components, though many may have to be
screened to locate these. In any event the determination of stability constants for
real samples will be a major task, far beyond the scope of this investigation.
5.9 Stability Constants of Aminopolycarboxylic Acids
As indicated in section 5.5.2, the magnitude of dissociation constants for la will
be compared with those of similar aminopolycarboxylic acids. A comprehensive
library of critical stability constants of many ligand types has been compiled by
68
Page 80
Chapter 5 Determination of Stability Constants : Techniques
Martell and Smith. 24 These volumes have been recently rescrutinised and are now
available as a database from the National Institute of Standards and Technology
(NIST) web site (http://www.nist.govisrd/webguide/nist46/46guide.htm). 25
According to the developers of the on-line database, whilst some new
determinations involving EDTA type ligands are being performed, little or nothing
new really emerges. 26
Equilibria data for a number of aminopolycarboxylic acids with similar
characteristics to la are presented in Table 5.2. Note that Table 5.2 includes
equilibria data for the structural isomer of la (lb). Since la and lb differ only at
the position of the ring carbonyl one could expect titrimetry of la to furnish
similar equilibria data to lb. However it should be noted that the dissociation
constants for lb were determined in 196827 and there has been no confirmation of
these values by another study.
Table 5.2 Protonation constants at T = 25°C and ,u = O. 10M in aqueous solution
Ligand logKi logK2 1-1 logK3H log1(411 logK5 1' ref. EAMA 9.69 6.56 2.72 2.10 28 EDTA 10.17 6.11 2.68 2.10 1.5 29 DTPA 10.45 6.11 2.68 2.0 1.5 29 HEIDA 8.66 2.20 29 IDA 9.34 2.61 29 S-1(2 6.55 30 lb 8.40 3.52 2.7 27
69
Page 81
Chapter 5 Determination of Stability Constants : Techniques
5.10 Summary
Several different techniques for the determination of stability constants have been
presented. From this discussion potentiometry has been selected as the most
appropriate method for ligand la. A thorough discussion of experimental
procedure, with particular reference to equilibrium measurements and
computation of titration data, has been given. It should be re-emphasized that the
magnitude of the equilibrium constants calculated for la will be evaluated with
reference to those of other similar ligands.
70
Page 82
Chapter 5 Determination of Stability Constants : Techniques
5.11 References
(1) Bouchard, J.; Nugent, H. M.; Berry, R. M. J. Pulp & Paper Sci. 1995, 21,
203.
(2) Goldstein, M. M.; Lok, W. P. JAOCS 1988, 65, 1350.
(3) Kale, B. D.; Mhaske, T. H. J. Indian Chem. Soc. 1990, 67, 901.
(4) Bucci, R.; Magri, A. L.; Napoli, A. J. Coord. Chem. 1991, 24, 169.
(5) Albert, A.; Serjeant, E. P. The Determination of Ionisation Constants; 3rd
ed.; Chapman and Hall: New York, 1984.
(6) Martell, A. E.; Motekaitis, R. J. Determination and Use of Stability
Constants; 2nd ed.; VCH Publishers Inc.: New York, 1992.
(7) Meloun, M.; Havel, J.; Hogfeldt, E. Computation of Solution Equilibria;
Ellis Horwood Ltd: Chichester, England, 1988.
(8) Serjeant, E. P. Potentiometry and Potentiometric Titrations; J. Wiley and
Sons: New York, 1984; Vol. 69.
(9) Brandon, M. University of Tasmania, personal communication, 1997.
(10) Greenberg, A. E.; Clesceri, L. S.; Eaton, A. D. Standard Methods for the
Examination of Water and Wastewater; 18th ed.; American Public Health
Association/ American Water Works Association and Water Environment
Federation: Washington, USA, 1992.
(11) Vogel, A. I. A Textbook of Quantitative Inorganic Analysis; 3rd ed.;
Longmans: London, 1961.
(12) Rossotti, H. The Study of Ionic Equilibria- An Introduction; Longman:
London, 1978.
(13) Stefano, C. D.; Mineo, P.; Rigano, C.; Sammartano, S. Ann. Chim. 1993,
83, 243.
(14) Poznajlo, A. J. Radioanal. Nucl. Chem. 1989, 134, 97.
(15) Gaizer, F.; Kiss, I. I. Talanta 1994, 41, 419.
(16) Sabatini, A.; Vacca, A.; Gans, P. Talanta 1974, 21, 53.
71
Page 83
CHAPTER 6
Determination of Stability Constants : by Experiment
6.1 Introduction
In Chapter 5 potentiometry was identified as the most appropriate technique for
determination of stability constants of aminopolycarboxylic acid type ligands.
However during an exploration of the solution behaviour of la the opportunity to
utilise NMR for determination of equilibrium constants arose. NMR is being
applied more frequently for the determination of equilibrium constants of
compounds of biological interest including amino acids,' peptides 2 and
antibiotics. 3 NMR measurements offer a particular advantage over potential
measurements (ie potentiometry) because they can be used to monitor the
chemical shift (as a function of pH) of a particular compound in a mixture which
may often contain other acids and bases. Information on chemical shift versus pH
obtained in this way is independent of the presence of protolytic "impurities"
provided there is no direct interaction between the latter and the compound being
monitored. That this is a major advantage can be seen by recalling the importance
in potentiometry of excluding CO2 from reaction solutions (sections 5.4.2 &
5.6.3).
It should be recognised that NMR measurements require an amount of
experimental time that is highly dependent on concentration of the species, the
nucleus being monitored and the pulse sequence employed. Managing these
factors properly is essential, especially if a species shows poor NMR sensitivity or
changes/ degrades with time.
Page 84
Chapter 6 Determination of Stability Constants : by Experiment
This chapter describes how both potentiometry and NMR were employed to
determine equilibrium constants and pH responses of ligand la in aqueous
solution. An evaluation of the magnitude of stability constants has been made with
reference to other similar ligands.
6.2 Materials
All chemicals were obtained from commercial sources and were of analytical
purity. Ligands la and 5 were prepared as outlined in Chapter 7, section 7.5 and
characterised by NMR, MS and microanalysis.
6.3 General Procedure (Potentiometric and NMR Analyses)
A custom made glass titration vessel 4 (section 5.4.2, Figure 5.2a & b) with
sufficient openings for pH electrode (Orion, model 9157), thermocouple,
autodispenser, stirrer (propeller blade), and gas flow was utilised. Temperature
was maintained at 25°C ±0.1°C by circulation of thermostated water through the
jacketed reaction vessel. Atmospheric oxygen and carbon dioxide were excluded
by maintaining a slight positive pressure of either nitrogen or argon in the titration
cell.
Potentiometric titrations were performed using an Orion 960 autochemistry
system interfaced to a computer to facilitate data collection and analysis. The
system was calibrated using prepared buffers (NIST buffers) and strong acid/base
titration. A calibration was performed prior to each titration.
All solutions were prepared using Milli-Q water. Alkali solutions (0.10 M) were
prepared from commercial semi-conductor grade NaOH and stored in PE bottles
protected from carbon dioxide. Ligand stock solutions (100mL) were made from
thoroughly dried material and stored to exclude light and the atmosphere.
73
Page 85
Chapter 6 Determination of Stability Constants : by Experiment
Solutions of metal perchlorates were prepared from AR grade material and stored
in PE bottles protected from the atmosphere. Solution concentrations of ligand and
metal were in the order of 10-20 mM. Alkali solutions were standardised with
weighed quantities of dried potassium hydrogen phthalate. The exact endpoint of
this and other subsequent titrations was determined by the first derivative method.
For a typical run, a weighed amount of sodium perchlorate was added directly to
the reaction vessel, followed by the calculated volumes of ligand and metal
perchlorate solutions. The reaction solution was then made up to volume with
Milli-Q water. The reaction solution was stirred under an inert nitrogen (or argon)
atmosphere and allowed to equilibrate for about 30 min. Successive pH
measurements were then made after each addition of small (0.05 or 0.10 mL)
increments of standard base until the pH reached about 10.5-11.5. Timed
measurements were made. The tip of the autodispenser was immersed in the
reaction solution throughout the titration and stirring was continuous. The
protonation constants were determined from at least duplicate potentiometric
titrations and the stability constants from two titrations where the ratio M:L
differed.
For NMR determinations a typical potentiometric titration (as described above)
was monitored as follows. Briefly, between 0.3-0.5 mL was withdrawn by plastic
syringe from the reaction solution at known pH and analysed by a presaturation
water suppression I II NMR technique (Chapter 7, section 7.8.1). Care was taken
to exclude CO2 from sample solutions in NMR tubes and each 0.3-0.5 mL sample
was returned to the main reaction solution after NMR analysis. Typical NMR
analysis time per experimental point was 5-10 mins. Up to 20 such data points
were collected in this manner starting at low pH (2) and finishing at pH -11.
Assignments of la I I-1 resonances were made possible by using a gradient
enhanced COSY pulse sequence (Chapter 7, section 7.8.1) at some 6-8 arbitrary
pH values during the course of the first NMR monitored titration. Several I I-1
74
Page 86
Chapter 6 Determination of Stability Constants : by Experiment
NMR titrations were performed to evaluate reproducibility.
6.4 Calculations
Protonation constants and metal stability constants were calculated using
programs SQ (Chapter 5, section 5.5.4) and HYPNMR 5 Program SQ was first
available in 1985 but remains essentially unchanged as part of the recently
released HQ suite of programs.6 Program HYPNMR, also part of the HQ package,
calculates pKa's from chemical shift data in a manner similar to how SQ calculates
pKa's from potentiometric data. Further details concerning how the program
operates, including the application of the Gauss-Newtown-Marquardt method in
the refinement are available elsewhere. 5
The suitability of SQ and HYPNMR for equilibrium constant determinations was
established using data generated from titrations of commercially sourced ligands
whose dissociation constants are well known (Table 6.1). The good agreement
achieved between reference and experimental values also indicated a robust
experimental method.
Other programs considered were PICAS 7 and BEST. 7 Program PICAS proved
useful for determination of protonation constants but was not designed for
computation of stability constants. Both pKa's and stability constants could be
calculated using BEST but this software was difficult to use in comparison to SQ.
75
Page 87
Chapter 6 Determination of Stability Constants : by Experiment
Table 6.1 Protonation constants at T =25°C and ,u = 0.10M (NaC104) in aqueous solution by programs SQ and HYPNMR
Ligand logKi logK2H logK3H ref. Citric acid 5.69 4.35 2.87 8
5.71 4.39 2.80 this work (SQ) 5.65 4.34 2.76 this work (HYPNMR)
IDA 9.34 2.61 9 9.25 2.64 this work
S-KP 6.55 10 6.53 this work
6.5 Uncertainties
For each SQ data file the user must provide estimates of error for the parameters
titre volume(mL) and pH (or mV). For the given Orion system these were
determined to be 0.01mL and 0.02 pH units respectively. These values were
incorporated into every SQ data file. No such error estimates were required for
HYPNMR.
Where four pKa's were incorporated in SQ metal-ligand data files the statistical
measures (chi-squared, sigma) appeared quite elevated (eg. 150, 6). By omitting
the pKa associated with the greatest deviation (pKa 2.5) and recalculating, the
statistical measures showed marked improvement and the stability order/ values
(section 6.8) remained essentially unchanged. Thus the stability constants listed in
Table 6.3 have been calculated using pK a's 10.5, 8.3 and 3.5 in SQ metal-ligand
data files.
For the limited HYPNMR determinations chi-squared (a measure of confidence)
was typically 50 or less and sigma (measure of fit) between 1-4. For SQ
determinations chi-squared was found consistently to be below 80, with the
exception of two (larger) results and sigma was consistently in the range 4-6, also
76
Page 88
Chapter 6 Determination of Stability Constants : by Experiment
with the exception of two (larger) results. Similar ranges for these statistics were
observed from the SQ output files of commercial ligands IDA and citric acid.
Whilst these measures of fit appear quite large, the comparison of pKa values in
Table 6.1 shows that reliable results could still be achieved. The measures of fit
are also considered reasonable given the limitations of the experimental apparatus
and method. For example, a number of researchers recommend pH data be
measured to three decimal places. This was not possible with the system used in
this work. The presence of a small percentage of an impurity (section 6.6.1) may
also have had an influence on measures of fit, especially in the case of SQ
determinations. Another possible limitation of the system relates to the
computational model used in SQ. Whilst every effort was made to accommodate
likely species in the model it is quite possible that the exclusion of some species
could affect the output (log betas).
The estimated error (deviation) associated with each experimental log beta was
found usually to be 0.10 for ML and MHL complexes (eg. 100 ,-FeL 16.3 ± 0.10)
and 0.20 for ML2 complexes. Stability data taken from other sources are cited
without estimated deviations but are considered reliable within ±1 unit of the last
significant figure shown.
6.6 Results and Discussion
Representative data/ output files (SQ/ HYPNMR) may be found in Appendix A at
htttp://www.chem.utas.edu.au/students/damienb.html . All files appear in their
original form and can be downloaded if required. File descriptions are provided
and users hot-link directly to each file.
6.6.1 Initial Titration (Ligand Only)
In order to demonstrate that la was not decomposed during the course of a
titration, an acidic solution of la was titrated with 0.10 M NaOH to pH 11 then to
77
Page 89
Chapter 6 Determination of Stability Constants : by Experiment
pH 2 with 0.10 M HC104. The forward/ reverse potentiometric titrations were also
monitored by 1 1-1 NMR (refer section 6.3). As can be seen from Figure 6.1, the
titration curves coincide with each other within experimental error, provided the
dilution effect is taken into consideration. The i ll NMR spectra of the titrations
showed that la species formed during the forward (initial low pH) titration
matched those la species detected in the reverse titration. Furthermore, several
alkaline (8-12) solutions of la were re-analysed by 1 1-1 NMR after 24hr and could
be shown to contain the characteristic resonances for la. Together these
observations suggested that no decomposition of la occurred during the titration.
12
10- ,
,
2
4 6
a.,
a
Figure 6.1 Titration of ligand la at T = 25°C and iti = 0.10 M (NaC104) in aqueous conditions la + 0.10 M HC104; — 1 a +
0.10 M NaOH
78
/1-
Page 90
Chapter 6 Determination of Stability Constants : by Experiment
Examination of the initial titration using SQ revealed a misfit between
experimental and calculated curves in the pH range 6.5-7.5. One possible
explanation for this is that la contained an impurity, despite evidence to the
contrary (eg. satisfactory elemental analysis). Decomposition had been ruled out
but the possibility of rearrangement remained. The most likely rearrangement of
la would involve transition between chair and boat conformers. However, such
behaviour was not considered likely to produce a misfit between experimental and
calculated potentiometric curves.
To further explore the likelihood that la contained an impurity, more thorough
investigation of a typical potentiometric titration using 1 1-1 NMR was made. The
11-1 spectra were processed using linear prediction and combined to generate the
profiles indicated in Figures 6.2 and 6.3. The profile shown in Figure 6.3 is a —
x10 enlargement of the region where the presence and action of an impurity (U)
can be observed. The impurity profile has been produced by subtracting ligand (L)
resonances from each 1 H NMR spectrum. This gives many of the peaks a
"clipped" appearance at the base and also leads to the disappearance of some
peaks. All resonances, aside from L, are due to the impurity.
Whilst the identity of the impurity could not be established (due to limitations in
the sensitivity of the instrument) it is clear from Figure 6.3 that U was a coupled
system (multiplet at pH 4.25) and several of the peaks tracked L resonances during
the course of the titration. This led to the conclusion that U was most likely related
closely to L, perhaps a partially hydrolysed form of the tri ester 27. The level of
impurity appeared to remain constant during the course of a titration, as indicated
by 1 1-1 NMR. Steps were taken to remove the impurity (Chapter 7, section 7.6)
from ligand la prior to any further titration work but ultimately the purity could
not be improved beyond —95%.
79
Page 91
Chapter 6
Determination of Stability Constants : by Experiment
4.0 3.6 3.2
2.8
PPm
Figure 6.2 1 H 1VMR titration profile of ligartd la only. Peak resonances denoted 1-7.
80
Page 92
a 3.67
,Jk
pH
10.19
9.62
IreWLAAANA-p—I 8.76
a
7.74
7.27
cd+U
6.78
5.70
4.25
Chapter 6 Determination of Stability Constants : by Experiment
3.9 3.6 3.3 3.0
PPm
Figure 6.3 1 H 1V1VIR titration profile of impurity (U) in ligand (L) la
Page 93
Chapter 6 Determination of Stability Constants : by Experiment
6.7 Protonation Constants (by 1 14 ISINIR Titrations)
The determination of pKa's of ligand la was explored initially using NMR, given
that this technique is better equipped than potentiometry to handle the presence of
extraneous materials. 5 Of the five dissociation constants predicted for ligand la,
three could be ascertained using HYPNMR. The log protonation constants
determined from chemical shift data are 8.5, 3.0 and 2.0 (Table 6.2). The pK a
values obtained for la are listed in Table 6.2, together with pKa values reported
previously for related ligands.
Table 6.2 Protonation constants of la and related ligands at T = 25°C and p = 0.10M (NaC104) in aqueous solution
Ligand logKi logK2H logK31 ' logK4H logK5 H ref. la 8.5 3.0 2.0 this work lb 8.40 3.52 2.7 11 EAMA 9.69 6.56 2.72 2.10 12 EDTA 10.17 6.11 2.68 2.10 1.5 9 DTPA 10.45 6.11 2.68 2.0 1.5 9 IDA 9.34 2.61 U-EDDA 10.9 5.53 9 U-KP 5.51 10 S-KP 6.55 10
The 1 H NMR titrations of la also allowed some general observations of the
protonation sequence. Ligand la has seven chemically nonequivalent sets of
protons that give rise to seven distinct NMR signals (Figure 6.2). The seven
resonances were assigned as 1-7 respectively (Figure 6.4) based on several
gradient COSY experiments. In general, deprotonation of the ligand causes
chemical shifts to move upfield, most likely due to shielding of proximal 1 1-I
nuclei as oxygen electrons become more localised. 13,14
82
Page 94
Chapter 6 Determination of Stability Constants : by Experiment
3
1 7 6 /CH2COOH
HOOCCH 2N NCH 2CH2N
NCH2COOH 45
1 I I 1 2.8 3.2 3.6
4.0 chemical shift (ppm)
Figure 6.4 pH dependencies of the 1 H NMR chemical shifts in aqueous la solution at T =25°C and p = 0.10M (NaC104). Numbers
1-7 represent 1 H resonances
It is clear from Figure 6.4 that two sets of curves are related (1,4 and 3,6), given
that each pair exhibits similar slope. The upfield movement of resonances 1 and 4
between pH 2.5-4 suggests that initial deprotonation of la is not associated with
the diacetate portion of the molecule. Further addition of base had no major effect
until pH 8.5-10 when resonances 3 and 6 (lesser extent 7 >2 >5 >4) move sharply
2
14 —
12 —
10 —
8 —
,.. -
6 —
4 —
2 —
83
Page 95
Chapter 6 Determination of Stability Constants : by Experiment
upfield, suggesting deprotonation at the diacetate end of the molecule. Beyond pH
10 there is essentially no change to resonances 1, 2, 4, 5 suggesting that
deprotonation associated with the ring was most likely complete. However it can
be seen that resonances 3 and 6 continue to trend upfield, perhaps suggesting that
another pKa may lie above pH 10.
Since it was not possible to determine all the pKa's of la using HYPNMR it is a
little difficult to make any further inferences other than to state that initial
deprotonation appears to occur at the monoacetate portion of the molecule,
followed by deprotonation at the diacetate end.
The third protonation constant (pK3 = 2.0) is not obvious from Figure 6.4. If the
second protonation constant (pK2 = 3.0) is associated with the monoacetate group
(Figure 6.4) then it seems likely that pKi = 8.5 and pK3 = 2.0 are related to the
diacetate region of the molecule. Further weight can be added to this argument
given that lDA and N-(2-hydroxyethypiminodiacetic acid (HIDA) have pK a's of
2.6/9.3 and 2.2/8.7 respectively. A possible dissociation scheme for la based on
the 1 H NMR and potentiometric titrations is given in Figure 6.5.
84
Page 96
Chapter 6 Determination of Stability Constants : by Experiment
0
7 \ /0H2c00-
H+
o) \+ /cH 2coo-
-00CCH 2N NCH 2CH 2N -00CCH 2N NHCH 2CH, I'l
\CH 2C00 - CH 2C00 - \_1
H+ I O
t ./CH2C00-
0,
-coccH 2N micH2cH ici-icH2cD°H 7 \ +
11 cH2c00-
,cH2c00- \ + 4
-0003{ 2N NHCH 2CH. 11/4
CH 2COOH
-00CCH 2N NHCH 2CH.cH
CH2C00"
CH 2COOH
\ + 4/ HOOCCH 2N NHCH 2C1-1,cH
CH2C00 -
H1
/CH 2COOH
\ + /I- HOOCCH 2N NHCH 2CH. NH
CH2COOH
Figure 6.5 Proposed protonation sequence of la
85
Page 97
Chapter 6 Determination of Stability Constants : by Experiment
Figure 6.2 provides a few further points of note regarding the protonation
sequence. The narrow line width of resonance 3 (methylenes adjacent to diacetate)
up to pH —8 suggests either a rapid exchange equilibrium or that the diacetate sites
are equivalent (Figure 6.6). After pH —8.5 the diacetate sites remained equivalent
on the NMR timescale but the exchange rate was much slower (Figure 6.7), giving
rise to line broadening of resonance 3. The signal sharpened in response to an
increase in temperature. The observation that resonance 1 (methylene adjacent to
monoacetate) experienced no broadening as pH was varied was further evidence
to suggest that the slow step (at pH —8.5) is related to some form of exchange
equilibrium involving both groups of the diacetate.
86
Page 98
0
OH N\ JOH
Chapter 6 Determination of Stability Constants : by Experiment
rapid exchange with H20
ii3o 1 0
/ \ rapid / 0- N—
— N\ 0- OH <
\ <
0 0 Hi
rapid exchange with H20
Figure 6.6 Possible HI- exchange equilibria for diacetate groups of la (pH < 8)
NaOH 0,
0 7-/ -- -N H \ 0
' (Na 0
slow
0
k. H/ Na
0 /- N+ HOH 0 rrNa 0
Figure 6.7 Possible equilibria for diacetate groups of la (pH > 8)
87
Page 99
Chapter 6 Determination of Stability Constants : by Experiment
The three protonation constants obtained for la using HYPNMR are compared
with those of analogous ligands (Table 6.2). The pKa's show most similarity to
those of the structural isomer lb. This is not unexpected, given that the two
molecules differ at only one position; the position of the ring carbonyl group has
sufficient influence over solution behaviour to produce slightly different acid
dissociation constants.
6.8 Stability Constants (by NMR Titrations)
The introduction of a metal (Zn or Hg) into the titration system caused substantial
broadening of i ll resonances (Figure 6.8) which made reliable assignments of
chemical shifts impossible. The i ll NMR spectrum (Figure 6.8) at pH 10.3
displayed the minimum peak broadening for solutions pH 2-10.3. The NMR probe
temperature was increased to -50°C but no improvement to the broadening was
observed. The responses of the remaining metals, expected to be analogous to (or
worse than) both Zn and Hg, were not investigated.
Had there been more time available an appropriate method for metals would have
been pursued. Such a method may have involved simplifying the chemical model
used in HYPNMR. For example, by selecting fewer, reliable resonances that still
define the entire ligand, the model may be sufficiently defined for stability
determinations. Work with model compounds (EDTA, IDA) could assist greatly
with method development. For example, use of model compounds would help
conserve the scarce quantities of the synthesised ligand, plus stability constants
determined by HYPNMR could be compared with known values. For some
metals, such as Mn(11), it will never be possible to calculate stability constants by
NMR due to their paramagnetic nature.
In conclusion the robust nature of the NMR technique (citric acid and la
titrations) and the applicability of the processing program HYPNMR has been
demonstrated. It would also seem feasible that the technique could be successfully
88
Page 100
IIII IIII ■ 1111 11111 11111III I1111 11111111 11 111 ■ 11
Chapter 6 Determination of Stability Constants : by Experiment
3.9 3.6 3.3 3.0 2.7
PPm
Figure 6.8 1 H 1VIVIR spectrum of 2.5 rnM la + 2.6 mM Zn(II) solution at pH 10.3 (T = 25°C, =0.10 M NaC104)
Page 101
Chapter 6 Determination of Stability Constants : by Experiment
developed to enable stability constant determinations.
6.9 Protonation Constants (by Potentiometric Titrations)
It was possible to determine four protonation constants from potentiometric data
(Table 6.3). As can be seen from Table 6.3 the pKa's found by the two different
techniques do not fully coincide, a not unusual result given that (HYP)NMR was
expected to better cope with the presence of any extraneous material (section 6.1).
Table 6.3 Comparison of log protonation constants for la at T = 25°C and it = 0.10M (NaC104) in aqueous solution by 1 H NMR and
potentiometry
logKi logK214 logK31{ logK414 ref. 8.5 3.0 2.0 this work (HYPNMR)
10.5 8.3 3.5 2.5 this work (SQ)
The general agreement between pK a values derived from SQ and HYPNMR was
encouraging and had more data points been collected it may have been possible to
locate another pKa near 10.5 using HYPNMR. For consistency and validity the
protonation constants determined by SQ were used for SQ calculations of stability
constants rather than pKa's found by HYPNMR.
90
Page 102
Chapter 6 Determination of Stability Constants : by Experiment
6.10 Stability Constants (by Potentiometric Titrations)
The potentiometric equilibrium curves for the formation of divalent and trivalent
metal chelates of ligand la are shown in Figures 6.9 and 6.10 respectively. It
should be noted that in general one titration was performed per day, with a
calibration between titrations. Results for two different mole ratios of M:L are
shown although four different ratios were explored. The reason for this is as
follows; at M:L of 1:5 similar results to 1:1.5 and 1:2 were obtained but as
expected measures of fit and estimated deviations were far greater. At higher M:L
of 2:1, mass balance was compromised by formation of precipitates at
intermediate pH.
91
Page 103
Chapter 6 Determination of Stability Constants : by Experiment
a
Figure 6.9 Potentiometric equilibrium curves of 16 rnM la and la complexes with metal ions (as indicated); T =25°C and ,u =0.10 M
(NaC104), M:L 1:1.5
92
Page 104
Pb(11)
4 - zn(a)
Chapter' 6 Determination of Stability Constants : by Experiment
12
10 -
8 -
a 6 -
2 -
0 2 4 6 a
Figure 6.10 Potentiometric equilibrium curves of 16 mM 1a and 1a complexes with metal ions (as indicated); T =25°C and u = 0.10 M
(NaCl04), M:L 1:2
93
Page 105
Chapter 6 Determination of Stability Constants : by Experiment
Initial analysis of the curves in Figs. 6.9 and 6.10 indicate reasonably strong
chelate formation with all the metals investigated, with the possible exception of
Mn(11). The relative order of chelation tendencies can also be discerned, the lower
the pH of the initial buffer zone, the greater the stability of the metal chelate. From
an examination of Figs. 6.9 and 6.10 the stability sequence appears to be Fe(ll) >
Zn(11) > Hg(II) Pb(11) > Mn(I1).
Analysis of the data by program SQ shows that la forms mononuclear (1:1)
complexes with all the metals under consideration. All form monoprotonated
chelates (MHL) and binuclear (ML2) complex species also appear possible. No
evidence for M2L complexes was found and hydroxo complexes were not
supported by the model.
The stability constants (shown for divalent metals) were found to be consistent
with the following chemical equilibria :
1\42+ + L3- KmL = [ML1/[M2+] [L31
KmHL =[MHL]/[ML][H+]
Kiva, 2 = [ML2411[ML1 [L31
(1)
(2)
(3)
ML- + H+
ML
ML- + L3-
MHL
ML24-
The stability constants defined by equations 1-3 are presented in Table 6.4.
94
Page 106
Chapter 6 Determination of Stability Constants : by Experiment
Table 6.4 Logarithms of stability constants of metal chelates of la at T = 25°C and ,u = 0.10 M (NaClad
ratio M:L Mn2+ Pb2+
metal ion Hg2+ Zn2+ Fe3+
log KNEL 1:1.5 12.7 14.9 16.3 1:2 12.5 15.1 15.1 15.6 16.6
log 13 1,AHL 1:1.5 18.4 19.4 20.1 1:2 18.2 18.9 19.4 19.1 20.0
1°Avn...L 1:1.5 16.4 19.1 20.8 1:2 16.2 19.1 19.2 19.6 20.7
The stability order discerned from Figs. 6.9 and 6.10 was confirmed by numerical
analysis using SQ and is quite consistent with orders observed for chelates of
other similar ligands.9 As shown in Table 6.4 there are no log stability constant
values for Pb(II) and Zn(l) at M:L 1:1.5. Despite several titrations at this ratio for
both metals, consistent results from SQ could not be obtained. However, based on
the good agreement between 1:1.5 and 1:2 values for other metal chelates one
could assume the 1:2 results for Pb(II) and Zn(1) would be a fair estimation of
their stabilities.
As expected, the values in Table 6.4 show that the chelating ability of la is
significantly less than the parent compound DTPA. The chelating ability of la, in
terms of the five metals investigated, is more akin to NTA for Hg(II) and Fe(ITI)
complexes and EDTA for Zn(II), Pb(ll) and Mn(11) complexes (Table 6.5).
95
Page 107
Chapter 6 Determination of Stability Constants : by Experiment
Table 6.5 Log KML values of metal chelates of la and similar ligands at T =25°C and it = 0.10 M (NaCl04)
ligand LogKmL ref. Mn2+ Pb2+ Hg2+ Zn2+ Fe3+
la ' 12.6 15.1 15.0 15.6 16.5 this work EDDA 7.0 10.6 - 11.1 9 EDTA 13.8 17.9 21.5 16.4 25.0 9 DTPA 15.5 18.7 26.4 18.3 28.0 9 NTA 7.5 11.3 14.6 10.7 15.9 9
The log stability constants obtained for ML2 complexes (Table 6.4) appear low in
relation to values for similar ligands, where ML 2 values are usually double those
for ML. A clear reason for the apparent low ML 2 results is difficult to formulate,
but it is possible that error in ligand concentration was the likely cause.
From work with physical models it appears sterically possible for all three
carboxyl groups of la to coordinate with either a divalent or trivalent metal. The
complex so formed could exhibit appreciable stability due to the high number of
atoms (at least 15) participating in ring formation. It also seems likely that the ring
C=0 group could participate in chelate formation though to a lesser extent than
any of the carboxyl groups. More definitive data from modelling (molecular
mechanics) or X-ray studies would be required to address any further points about
complex structure.
96
Page 108
1.0
0.9 -
0.8 -
0.7 -
0.6 -
6 8 10 12 pH
0.2 -
0.1 -
0.0 0
Chapter 6 Determination of Stability Constants : by Experiment
Figure 6.11 Species distribution curves for 3 mM Mnal)-1 a system containing a 1:1.5 mole ratio of Mn(II) to la. T = 25°C and ,u = 0.10 M
(NaC104)
97
Page 109
Chapter 6 Determination of Stability Constants : by Experiment
1.0
0.9 —
Fe(III)
0.8 —
0.7 —
0.6 —
Fe(III)-L
p., -a
0.4 —
0.3 —
0.2 —
0.1 —
0.0
/ Fe(III)-HL, Fe(11D-L2
0 6 8 10
12 pH
Figure 6.12 Species distribution curves for 3 rnM Fe(111)-1 a system containing a 1:1.5 mole ratio of Fe(III) to 1 a. T = 25°C and p = 0.10 M
(NaC104)
As representative examples, species distribution curves (Figs. 6.11 and 6.12) were
constructed for the most (Fe) and least (Mn) stable metal complexes. As shown,
the ML complexes predominate in solution above pH 4 for Mn(11) and pH 3 for
Fe(II1). The protonated form of the Mn(II) complex shows a maximum
concentration of about 10% whilst for Fe(III) the MHL complex is absent at the
given concentration of L. The absence of the binuclear ML2 species for both
Mnal0 and Fe(111) (and implied for the remaining metals) may suggest that its
concentration is not accurately known under the given conditions, or its existence
is in some doubt. As noted (section 6.5), the greatest uncertainty was also
associated with ML2 results.
98
Page 110
Chapter 6 Determination of Stability Constants : by Experiment
6.11 Implications for the Mill and Aquatic Environment
It is clear from the preceding discussion that la possesses significant complexing
ability. Therefore a monitoring program to determine the level of la in pulping
liquors seems an appropriate response. The remaining quantity of la from this
study could be used as a standard. Implementation would be relatively
straightforward given that la can be detected as the ferric complex by HPLC using
the method developed for monitoring DTPA. 15 Based on previous monitoring
work, 16 the level of la in pulping effluent is anticipated to be less than that of
DTPA, namely 5 ppm.
Of the five metals (Table 6.4) investigated in this study, Mn(II) has been
implicated as having the greatest potential for decompostion of both H202 and
DTPA in the pulping process. 17 However, as the stability of Mn(11)-la is not very
different from Mn(11)-DTPA (Table 6.5), then even if DTPA degrades, protection
of H202 via Mna-la complexation would still occur. Another issue of some
concern is the influence of la on removal of heavy metals during wastewater
treatment, since DTPA exerts some effect on the precipitation of Zn(11) and Mn(II)
at this stage. 18 The influence is not anticipated to be very significant however, due
to the likely low level of la in pulping liquors.
Perhaps the greatest environmental impact of la may be its effect on aquatic
organisms, especially since it shows a tendency to persist in aqueous solutions
over a wide pH range. It has also displayed good temperature and light stability.
Studies of DTPA toxicity toward sensitive indicator organisms 19,20 Daphnia
carinata and Melanotaenia fluviatilis suggest that at the levels present in mill
discharge DTPA would pose little harm to aquatic life. A similar outcome might
therefore be expected for la. Furthermore, treated mill effluent is now being re-
routed for irrigation, so the aquatic impact of la should be negligible. The use of
treated effluent (containing la) for irrigation may in fact be slightly beneficial,
99
Page 111
Chapter 6 Determination of Stability Constants : by Experiment
given that chelating agents are used for micronutrient fertilisation in hydroculture
and soil application.
6.12 Summary and Conclusions
Protonation constants for ligand la have been determined by two different
techniques, namely I II NMR titration and potentiometric titration. The pK a results
showed general agreement, given that each model handles the presence of
extraneous material differently. The utility of the NMR technique has been
demonstrated and a method to facilitate NMR measurement of metal solutions
could be developed in future.
Stability constants of la with five metals were calculated from potentiometric data
and follow the general trend observed for similar ligands. It should be reiterated
(Chapter 1) that the discrete stability values found by SQ are less important than
the observed trend of stabilities. Whilst the anticipated reduction in complexing
ability compared to DTPA was observed, la metal complexes had sufficiently
high stability to justify further attention (eg. establishment of a monitoring
program). The results have few implications for papermaking with regard to
process changes although it may be necessary to evaluate the influence of la on
metal removal during wastewater treatment.
The major outcome of the complexing studies is that the use of DTPA as a
chelating agent in thermomechanical pulping at ANM Albury is appropriate given
the significant reduction in complexing power and concentration of DTPA
degradation products such as la in pulping liquors.
100
Page 112
Chapter 6 Determination of Stability Constants : by Experiment
6.13 References
(1) Rabenstein, D. L.; Sayer, T. L. Anal. Chem. 1976, 48, 1141.
(2) Zhang, M.; Vogel, H. J. J. Biol. Chem. 1993, 268, 22420.
(3) Bieniarz, C.; Young, D. F.; Cornwell, M. J. Anal. Biochem. 1992, 207,
321.
(4) Brandon, M. University of Tasmania, personal communication, 1997.
(5) Frassinetti, C.; Ghelli, S.; Gans, P.; Sabatini, A.; Moruzzi, M. S.; Vacca,
A. Anal. Biochem. 1995, 231, 374.
(6) Gans, P. University of Leeds, personal communication, 1998.
(7) Martell, A. E.; Motekaitis, R. J. Determination and Use of Stability
Constants; 2nd ed.; VCH Publishers Inc.: New York, 1992.
(8) Martell, A. E.; Smith, R. M. Critical Stability Constants : Other Organic
Ligands; Plenum Press: New York, 1977; Vol. 3.
(9) Martell, A. E.; Smith, R. M. Critical Stability Constants : Amino Acids;
Plenum press: New York, 1974; Vol. 1.
(10) Genik-Sas-Berezowsky, R. M.; Spinner, I. H. Can. J. Chem. 1970, 48, 163.
(11) Vasireva, V. F.; Lavrova, 0. Y.; Dyatlova, N.; Yashunskii, V. G. Zh. Vses.
Khi. 1969, 14, 461.
(12) Mashihara, M.; Ando, T.; Murase, I. Bull. Chem. Soc. Japan 1973, 46,
844.
(13) Gunther, H. NMR Spectroscopy; Basic Principles and Concepts; 2nd ed.;
John Wiley & Sons: New York, 1995.
(14) Li, Y.; Martell, A. E.; Hancock, R. D.; Reibenspies, J. H.; Anderson, C. J.;
Welch, M. J. Inorg. Chem. 1996, 35, 404.
(15) Richardson, D. E.; Ash, G. H.; Harden, P. E. J. Chromatogr. 1994, 688,
47.
(16) Richardson, D. E.; Harden, P. E. 48th Annual Appita Conference
Proceedings, Melbourne, Australia, 1994; 45.
101
Page 113
Chapter 6 Determination of Stability Constants : by Experiment
(17) Richardson, D. E. A Review of the Environmental Impact of DTPA at the
ANM Albury Mill, Australian Newsprint Mills, 1998.
(18) Richardson, D. E. Australian Newsprint Mills, personal communication,
1997.
(19) Holdway, D. A. Aust. J. Ecotoxicol. 1996, 2, 17.
(20) van Dam, R. A. Ecotoxicol. Environ. Saf 1995, 31, 117.
102
Page 114
CHAPTER 7
Experimental
7.1 General Procedures
NMR spectra were measured using a Unity-Inova 400 MHz instrument at normal
probe temperatures unless otherwise indicated. Standard 1 H, 13C, HETCOR, 13CDEPT, gHMQC and gHMQB experiments were performed to facilitate
unambiguous assignment of resonances. Chemical shifts are expressed in ppm on the
8 scale; tetramethylsilane (TMS) was used as an internal standard except for
solutions in deuterium oxide, where tetramethylsilane propyl sulfonic acid
(TMSPSA, Na salt) was used. Peaks are reported as singlet (s), doublet (d), triplet (t),
quartet (q) or multiplet (m). All MS data were collected with a Kratos Concept
(Mach 3 software) mass spectrometer. GCMS analyses were performed using a
Hewlett Packard 5790 Mass Selective Detector coupled to a HP 5890 GC fitted with
a HP-1 (25m x 0.32mm i.d., 0.52gm film thickness) column. UV data were measured
using a Shimadzu UV-160 UV-visible recording spectrometer and ER spectra on a
Braker IFS 66 FTIR spectrometer. Melting points were determined with a
Gallenkamp melting point apparatus in open capillary tubes and are uncorrected.
Elemental analyses were performed using a CHNS-0 EA1108 (Carlo Erba
Instruments) in the Central Science Laboratory, School of Chemistry, University of
Tasmania.
Where anhydrous conditions were required all glassware and solvents were driedl
and transfers made via gas-tight syringes.
Page 115
Chapter 7 Experimental
7.2 Materials
7.2.1 For Chromatography
Compounds la, 5, 7, 17, 19 and 27 were prepared according to the methods outlined
in Section 7.5. Their purity was established by NMR, MS and microanalysis.
Acetonitrile (HPLC grade) was sourced from Merck. All other reagents were of
analytical grade and used without further purification.
7.2.2 For Organic Preparations
All chemicals used in the given syntheses were obtained from commercial sources
and were of analytical grade. Where required, solvents were dried according to
standard methods. 1 Silica gel used for column chromatography was flash grade
(Kieselgel 60). For TLC, precoated silica gel (60 F254) aluminium sheets were used.
Samples of 6 (Alczo Nobel, Finland), 7 (University of Limoges/ National University
of Mexico) and 21 (Akzo Nobel, Finland) were obtained and used without further
purification.
104
Page 116
Chapter 7 Experimental
• 7.3 Experimental for Chapter Four
7.4 Chromatography
7.4.1 Liquid Chromatograph Instrumentation
For compound la the liquid chromatograph was a Varian 9010 fitted with a
Rheodyne 7126 injection valve (100mL loop) and a Varian 9060 Polychron
photodiode array detector operating at 258nm. The analytical column was an Alltima
51.im C18 (250 x 4mm). Samples were injected using a Varian 90100 autosampler and
data processed with a Varian Star data system. Separations were performed
isocratically at 2.0 mL/ min and ambient temperature.
For compounds 5 and 7 the liquid chromatograph consisted of a Waters 600
Multisolvent Delivery system equipped with a Waters 486 detector operating at
214nm interfaced with a data station running Maxima software. The analytical
column (250 x 4.6mm) was an Activon Goldpak 5jtm C18. Separations were
performed isocratically at 1.0 mL/ min and ambient temperature.
7.4.2 Mobile Phases
For the trihydrochloride salt of la a 4 mM octylamine solution (2000 mL) containing
8% MeCN was prepared and the pH adjusted to 6 using 2M H2SO4. A mobile phase
comprising 82% octylamine solution and 18% MeCN was used to effect elution of
Fe(l111)-la.
The mobile phase for 5 was prepared by mixing together 5mM octylamine (1850 mL)
and MeCN (150 mL). After adjusting the pH to 7 with acetic acid the mobile phase
was filtered and degassed before use.
105
Page 117
Chapter 7 Experimental
The mobile phase for 7 was prepared by mixing together a solution containing
ammonium acetate/pentanesulfonic acid (Na salt) both at 5 mM (1800 mL) and
MeCN (200 mL). After adjusting the pH to 4.7 with a few drops of acetic acid, the
mobile phase was filtered (0.45m) and degassed prior to use.
7.4.3 Preparation and Analysis of Reaction Solutions by HPLC
A few mg of the trihydrochloride salt of la was dissolved in 2 mL of 0.1M FeCl3
then buffered to pH 7 with phosphate buffer after standing for 15 min. No filtering
was necessary.
, All samples of 5 and 7 (standards and alkylation solutions) were prepared in
deionised H20 and injected at concentrations ranging between 0.5 and 2.5 gL -1 .
Alkylation reactions were monitored by HPLC until no further decrease in either 5 or
7 could be detected, at which point reactions were quenched. For identification of
alkylated products, appropriate fractions were collected from the analytical column
and analysed by MS. It should be noted that octylamine was a major interference in
Cl/ EIMS. Retention factors for 5 and 7 were 2.1 and 3.8 respectively which was
acceptable for monitoring purposes. Alkylated products of 5 and 7 exhibited greater
retention factors.
7.4.4 Gas Chromatograph Instrumentation
The GCMS system was described in Section 7.1. The analytical column used was
HP-1 (25m x 0.32mm i.d., 0.52gm film thickness). The GC temperature program
was as follows: initial temperature 50°C held for 1 min.; increased to 150°C at 30°C/
min, then to 290°C at 10°C/ min, held for 2 min. The injector temperature was 260°C
and detector 290°C. Samples (11xL) were injected in the split mode (10:1). The mass
spectrometer was operated at 70eV with electron impact ionisation using the scan
mode.
-106
Page 118
Chapter 7 Experimental
7.4.5 Preparation and Analysis of Reaction Solutions by GC
Ester samples taken from alcoholic reaction solutions were quenched (usually by pH
adjustment), dried, placed in ampoules then diluted to about lmL with CHC13 and
analysed.
Ester samples ex silica work-up (5-10mg) were placed in ampoules, dissolved in
about 1 mL CHC13, sealed then injected onto the chromatograph.
7.5 Organic Preparations
Known methods were used, usually with some modification, to produce 5, 2 7,3-5 10,6
14,7 15 ,6 16 ,8 17 ,8 21,9 23, 10 25,9 262 and 30. 11 Compounds la, 8, 19, 22, 24 and 27
were prepared according to methods developed by the author.
Typical preparations are given and no attempts were made to optimise yields.
107
Page 119
Chapter 7 Experimental
2-0xo-1-piperazineacetic acid (5)
NX-Ethylenebis(aminomalonic) acid.1/3 H20 (15) (13.5 g, 50 mmol) was heated at
reflux with 100 mL deionised H20 until cessation of CO2 evolution. Concentrated
HC1 (32%, 1 mL) was added and the solution heated at reflux for a further 3 h. After
cooling slightly the solution was evaporated to dryness, recrystallising the crude
product twice in Me0H/(CH3)2C0 to obtain the monohydrochloride of 5 in 69.8%
yield.
NMR (D20, 8 ppm) 4.21 (s, 2H), 3.95 (s, 2H), 3.73 (t, 2H, J = 6 Hz), 3.59 (t, 2H,
J = 6 Hz); 13C NMR 171.6, 165.4, 54.1, 49.8, 45.6, 41.3; LSIMS m/z: 159 (MH +)
Calc. for C6Hi iN203 159.0770, found 159.0776; Anal. Calc. for C6Hi0N203.HC1: C,
36.99; H, 5.65; N, 14.38. Found C, 36.95; H, 5.75; N, 14.30.
The dihydrochloride of ethylenediamine-N,AT'-diacetic acid (10) was recovered from
the filtrate in less than 3% yield.
Piperazinone (7)
Ethyl chloroacetate (9.53 g, 78 mmol) in 50 mL dry Et0H was added dropwise over
2 h to a stirred solution of ethylenediamine (30.2 g, 5000 mmol) in 100 mL dry
Et0H. After standing at room temperature for 2 h solvent and excess
ethylenediamine were removed under vacuum and the crude product neutralised with
alcoholic KOH (4.42 g/ 25 mL). The resulting precipitate of KC1 was removed by
filtration and the yellow filtrate concentrated under vacuum. The oily residue was
distilled in a Kugelrohr apparatus (160°C / lmm Hg) to furnish pure white crystals of
7 in 35.8% yield.
NMR (D20, 8 ppm) 3.33 (s, 2H), 3.28 (t, 2H, J = 5.3 Hz), 2.87 (t, 2H, J = 5.3 Hz);
13C NMR 173.7, 48.3, 42.4, 41.3; UV (?max 214nm, MeCN/ H20 1:1) E= 1331; EIMS
m/z: 100 (M+, 100%; Calc. for C4H8N20 100.0636, found 100.0636), 71(45), 43(70);
108
Page 120
Chapter 7 Experimental
Anal. Calc. for C4H8N20: C, 47.98; H, 8.07; N, 27.97. Found C, 48.14; H, 8.40; N,
28.21.
4-(2-Aminoethyp-piperazinone (8)
To a stirred aqueous solution of 7 (0.50 g, 5 mmol) at 70-80°C was added dropwise
2-chloroethylamine HC1 (0.70 g, 6 mmol) in 30 mL deionised water. The pH was
maintained between 8-9.5 with solid portions of Na2CO3. Samples taken at regular
intervals and analysed by HPLC showed the reaction to be "complete" after about 4
h. The fraction eluting at k — 4.9 was collected from the HPLC column (HPLC
conditions section 7.4.1) and found to be consistent with 8 (high resolution MS).
After removing H20 under reduced pressure several attempts were made to isolate 8
from the reaction mixture but little success was achieved. The quantity of 7 was
reduced by simple extractions with dry Et0H but removal of excess 2-
chloroethylamine proved difficult. No other analytical data were obtained for 8.
EIMS m/z: 143 (M+ , 22%; Calc. for C6H 1 3N30 143.1060, found 143.1061),
113(100), 85(47), 56(20)
Bromomalonic acid, disodium salt (14)
Bromine (45 mL, 870 mmol) dissolved in approximately 225 mL of CC14 was added
dropwise to a stirred solution of powdered malonic acid (90.9 g, 870 mmol)
dissolved in approximately 1800 mL Et 20 on ice. At the end of the reaction the bulk
volume of solvent was removed by gentle distillation. The final 100 mL or so was
removed on a vacuum line at ambient temperature. The crude product was dissolved
with a minimum quantity of deionised H 20 and the pH adjusted to 8.5 with 30%
NaOH (on ice) to give 14. The solution containing 14 was then poured into
approximately 3L of Et0H. The white product (yield 69.0%) was collected by
filtration, dried on a vacuum line and used without further purification.
109
Page 121
Chapter 7 Experimental
1 H NMR (D20, 8 ppm) 4.65 (s, 1H) ; 13C NMR 176.9, 55.8, 55.4; LSIMS m/z: 182.9
(MI-1+) Calc. for C3H4Bra4 182.9293, found 182.9285; Anal. Calc. for C3HBr04.Na2:
C, 15.87; H, 0.44. Found C, 15.82; H, 0.68.
NX-Ethylenebis(aminomalonic) acid (15)
Bromomalonic acid, disodium salt (56.8 g, 250 mmol) was dissolved in
approximately 180 mL deionised H20 with a catalytic amount of KI and the pH
adjusted to about 9 with 30% NaOH. To this stirred solution was added
ethylenediamine (7.6 g, 130 mmol) and the mixture was heated at 70°C for 2.5 h,
maintaining pH 9-11 with 30% NaOH. On cooling, the solution was adjusted to pH
1-2 with conc. HC1 (32%) on ice and the resulting precipitate collected by filtration
and washed with deionised H2O and Me0H. For purification crude 15 was dissolved
in aqueous alkali, precipitated with conc. HC1 then collected by filtration, washing
with small volumes of cold H20 and Me0H. The purification procedure was repeated
three times, furnishing N,M-ethylenebis(aminomalonic) acid. 1/3 H20 in 48.8% yield.
Anal. Calc. for C81112N208.1/3 H20: C, 35.55; H, 4.69; N, 10.37. Found C, 35.45; H,
4.61; N, 10.42.
Note : several attempts were made to obtain 1 H/ 13C NMR spectra for 15 but poor
solubility in deuterated solvents prevented acceptable analyses.
2-Chloroethyliminodiacetonitrile (16)
2-Chloroethylamine HC1 (120.2 g, 1040 mmol) was placed with 200 mL deionised
H20 in a 1L flask equipped with condenser and paddle stirrer. A 35% solution of
formaldehyde (177.9 g, 2070 mmol) was added dropwise to the stirred, cooled (0-
5°C) solution of 2-chloroethylamine HC1, followed by conc. HC1 (32%, 98 mL, 1030
mmol) over a 30 min period. A 35% solution of KCN (134.9 g, 2070 mmol) was then
added dropwise to the reaction solution over a period of 3-4 h. The reaction solution
was stirred for up to 20 h before collecting the white precipitate by filtration, washing
110
Page 122
Chapter 7 Experimental
with small volumes of cold H20 and Et0H. The white product (16) was partially
dried under vacuum then recrystallised a single time from Et0H (yield 75.5%).
1 1-1 NMR (DMSO, 8 ppm) 3.92 (s, 4H), 3.75 (t, 2H, J = 6.4 Hz), 2.93 (t, 2H, J = 6.4
Hz); 13C NMR 115.7, 53.9, 41.8, 41.0; EI/VIS m/z: 157 (M +, 25%; Calc. for
C6H8C1N3 157.0407, found 157.0410), 131(18), 108(100), 67(23); Anal. Calc. for
C6H8C1N3: C, 45.66; H, 5.07; N, 26.63. Found C, 45.53; H, 5.11; N, 26.51.
2-Chloroethyliminodiacetate, dimethyl (17)
2-Chloroethyliminodiacetonitrile (10.23 g, 65 mmol) was placed with 80 mL dry
Me0H and dissolved with heating and stirring. Dry HC1 gas (generated from H2SO41
NH4C1) was passed into this vigorously stirred solution at constant rate, at reflux, for
about 4 h. After HC1 addition the amber coloured solution was stirred for an
additional 4 h before removing heat. The reaction solution was allowed to cool then
stored at 0°C overnight.
The chilled solution was filtered and the filtrate evaporated to dryness. The pH of the
residue was adjusted to 6 using a combination of ice H20 and 30% KOH, then to 8
with solid portions of K2CO3. The alkaline solution was extracted with 120 mL (3 x
40 mL) Et20, the ether extracts dried over Na2SO4 then decolourised with a small
quantity of activated carbon. After removing the carbon (filtration) and solvent, crude
17 was purified by silica gel chromatography, (CHC13:Et0H 99:1). No further
purification was required and 17 was obtained in 33.0% yield.
I ff NMR (CDC13, 8 ppm) 3.60 (s, 6H), 3.52 (s, 4H), 3.48 (t, 2H, J = 6.8 Hz), 3.00 (t,
2H, J = 6.8 Hz); 13C NMR 171.5, 56.3, 55.2, 51.2, 42.0; EIMS m/z: 223 (M +, 5%;
Calc. for C8Hi4C1N04 223.0611, found 223.0605), 187(13), 164(100), 136(36),
106(23); Anal. Calc. for C8Hi4C1N04: C, 42.95; H, 6.32; N, 6.26. Found C, 43.06; H,
6.30; N, 6.36.
111
Page 123
Chapter 7 Experimental
4-[2-[bis(Carboxymethyl)amino]ethy1]-2-oxopiperazine (19)
A stirred solution of 7 (3.50 g, 35 mmol) and 17 (7.5 g,34 mmol) in 50 mL dry
Me0H was heated at 65°C for 10 min before dropwise addition of Et3N (5.5 g, 54
mmol). After stirring for an additional 6.5 h excess Et3N and Me0H were removed
under vacuum and the residue stored at 0°C overnight.
Dry (CH3)2C0 (10 mL) was added to the residue and the resultant precipitate
(Et3N.HC1 with some piperazinone HC1) was removed by filtration. After
evaporation of the (CH3)2C0 the crude residue was reconstituted in a small volume
of H20 and extracted with 60 mL (2 x 30 mL) of Et20. The aqueous phase was
evaporated to dryness, dissolved in dry CH2C12 then filtered. The volume of the
filtrate was reduced almost to dryness and the residue purified by silica gel
chromatography (CH2C12:Et0H 95:5) giving 19 (yield 31.1%) as a light yellow oil.
1 1-1/ "C NMR are shown in Figure 7.1.
NMR (CDC13, 8 ppm) 6.82 (J = 2.1 Hz), 4.75 (s, 6H), 3.54 (s, 4H), 3.31 (m, J =
5.6 Hz, J = 2.1 Hz), 3.14 (s, 2H), 2.86 (t, 2H, J = 6.4 Hz), 2.69 (t, 2H, J = 5.6 Hz),
2.58 (t, 2H, J = 6.4 Hz); 13C NMR 171.6 (COOMe) 169.2 (NHCOCH2) 56.8
(NHCOCH2) 55.8 [CH2N(CH2COOMe)2] 55.4 (CH2COOMe)2 51.5 (0Me) 50.7
(NHCOCH2NCH2) 49.0 (NHCH2CH2N) 41.0 (NHCH2CH2N); FTIR (KBr disc)
1750, 1675cm-1 ; LSIMS m/z: 288 (Mfr) Calc. for Ci2H22N305 288.1560, found
288.1576; Anal. Calc. for C12H2IN30 5 : C, 50.16; H, 7.38; N, 14.62. Found C, 48.79;
H, 7.43; N, 14.15. Note : sample contained residual CH2C12, -1/7 mole, which
extremely difficult to remove. CH2C12confirmed by GCMS).
112
Page 124
Chapter 7
Experimental
till I II I 1111 111111 II 1111111 t II
4.5 4.0
3.5
3.0 2.5
PPm
(r2)2N(cH 2cocm,40 2.
N
N
roorromegooloimpooloietariswoomsol•m••••••ftwovoisowmaigreopoomeohersrimmoorrepoompm I i I . I . I . I I
I 1 i IIIIIIIIIIIIIII IiIIII
160.0 120.0 80.0 40.0 PPm
Figure 7.1 1 1-1 and 13C NMR spectra of compound 19
113
Page 125
Chapter 7 Experimental
1-(Carboxymethyl)-4-[2-(carboxymethyDaminoethy1]-2-oxopiperazine (22)
A mixture of 25 (8.5 g) and 14 (21.1 g, 93 mmol) in 80 mL deionised H20 was
stirred at 70-80°C for 2 h, maintaining pH 9-11 with 30% NaOH. After concentrating
the solution to about 20 mL under vacuum, the pH was adjusted to 2 with conc. HC1
and the solution heated at reflux until cessation of CO2 evolution. The solution was
then treated with additional conc. HC1 and heated at reflux for another 1 h. The
solution was decolourised with activated carbon whilst still warm, filtered and
evaporated to dryness. HPLC analysis of the residue showed the presence of at least
four compounds and the desired molecular ion for C 1 0H 1 9N305 (MIT) was identified
by high resolution LSIMS. No further work-up of the residues was performed.
LSEVIS m/z: 260 (MH+) Calc. for Ci0Hi9N305 260.1259, found 260.1261.
bis(Salicylidineiminate)diethylenetriamine (23)
Diethylenetriamine (60.0 g, 581 mmol) was added dropwise to a chilled and stirred
(paddle stirrer) solution of salicylaldehyde (142.0 g, 1163 mmol) in 700 mL dry
Et0H. After addition of diethylenetriamine the solution was stirred at room
temperature for a further 5 h then Et0H removed under reduced pressure.
Evaporation of solvent furnished 23 as a yellow oil. On standing in a desiccator large
clear crystals of 23 (yield ca. 100%) formed.
1 1-1 NMR (CDC13, 8 ppm) : 7.26 (t, 2H, J = 7.5 Hz), 6.79 (t, 2H, J = 7.5 Hz), 2.51 (t,
2H, J = 6.2 Hz), 1.77 (t, 2H, J = 6.2 Hz); 13C NMR (CDC13, 8 ppm) 163.2, 133.4,
119.7, 119.0, 117.9, 58.0, 50.6; LSIMS m/z: 312 (MW) Calc. for C18H22N302
312.1707, found 312.1706; Anal. Calc. for C12H2IN302: C, 69.43; H, 6.81; N, 13.49.
Found C, 69.21; H, 6.82; N, 13.59.
114
Page 126
Chapter 7 Experimental
Ethyl bis(salicylidineiminate)-4-diethylenetriamineacetate (24)
A solution containing 23 (5.0 g, 16 mmol), ethyl chloroacetate (3.1 g, 25 mmol) and
Na2CO3 (1.7 g, 16 mmol) in 70 mL dry Et0H was heated at reflux for 4.5 h. After
cooling slightly the reaction solution was concentrated to about 20 mL, filtered to
remove salts then the filtrate evaporated to dryness. The crude residue was
reconstituted in a minimum quantity of dry CH2C12 and the remaining insoluble
inorganic salts removed by filtration. The CH2C12 was removed to give 24 (yield
72.7%) as a viscous yellow oil.
LS1MS m/z: 398 (MH+) Calc. for C22H28N304 398.2071, found 398.2070; Anal.
Calc. for C22H27N304: C, 66.42; H, 6.79; N, 10.57. Found C, 66.20; H, 6.91; N,
10.84.
4-Diethylenetriamineacetic acid (25)
A solution of 24 (4.0 g, 10 mmol) in chilled 3M HC1 (20 mL, 60 mmol) was stirred
overnight then extracted with 80 mL (2 x 40 mL) dry CH2C12 to remove liberated
salicylaldehyde. The aqueous phase was concentrated, the pH adjusted ca. 9 to with
solid portions of Na2CO3, then the solution evaporated to dryness. The residues were
reconstituted in dry Me0H, filtering to remove inorganic salts. The product, assumed
to be the sodium salt of 25, was used without further purification.
LS1MS m/z: 162 (MH+) Calc. for C6H16N302 162.1243, found 162.1255
1-Methoxycarbonylmethy1-2-oxopiperazine (26)
a)
Ethylenediamine-N,N'-diacetic acid (10.0 g, 58 mmol) was placed with 200 mL dry
Me0H containing SOC12 (11.5 mL, 160 mmol) and heated at reflux for about 37 h.
After cooling slightly, the solution was concentrated to 20-30 mL by evaporation,
whereupon pure N,N '-bis(methoxycarbonylmethypethylenediamine dihydrochloride
115
Page 127
Chapter 7 Experimental
(yield 17%) separated from solution. This solution was stored overnight at 0°C then
filtered. Immediately following filtration prolific crystallisation of the
monohydrochloride of 26 occurred. The crystals were harvested by filtration (yield
57.6%) and no further purification was necessary.
The free base (26) was obtained in 91.0% yield by treating the monohydrochloride
with one equivalent of Na0Me, removing solvent then dissolving 26 in CH2C12 to
remove NaCl.
b)
5 (7.0 g, 44 mmol) was placed with 150 mL dry Me0H containing SOC12 (8.0 mL,
112 mmol) and heated at reflux for 16 h. Work-up as per part a), yield 62.6%.
NMR (CDC13, 8 ppm) 3.92/ 3.90 (s, 2H, chair/ boat conformers), 3.41 (s, 2H),
3.40 (t, 2H, J = 5.6 Hz), 3.34 (s, 3H), 3.06 (t, 2H, J = 5.6 Hz); t3C NMR 175.6,
170.4, 51.7, 49.7, 49.6, 42.9; EIMS rrilz: 172 (M + , 74%; Calc. for C7f1i2N203
172.0848, found 172.0853), 102(40), 85(78), 56(100); Anal. Calc. for
C71112N203.HC1: C, 40.28; H, 6.29; N, 13.43. Found C, 40.25; H, 6.28; N, 13.44;
Anal. Calc. for C7H12N203: C, 48.84; H, 6.98; N, 16.28. Found C, 48.60; H, 6.94; N,
16.08.
1-(Methoxycarbonylmethyl)-4-[2-[bis(methoxycarbonylmethyl)amino]ethyl]-2- oxopiperazine (27)
To a stirred solution of 26 (9.6 g, 56 mmol) in 150 mL dry Me0H was added 17
(12.6g, 56 mmol). The solution was then heated to 65°C and after about 20 min Et3N
(8.5 g, 84 mmol) added dropwise. After a further 11 h stirring at 65°C the solution
was cooled slightly before removing the solvent under reduced pressure.
116
Page 128
Chapter 7 Experimental
Dry (CH3)2C0 (40 mL) was added to the residue and the resultant white precipitate
(Et3N.HC1) was removed by filtration. After stirring the filtrate with a few spatula
tips of activated carbon to decolourise, the solution was filtered once again and the
filtrate evaporated to dryness. The amber coloured residue was dissolved in a
minimum volume of deionised H20 then extracted first with 120 mL (3 x 40 mL) of
Et20/ pet ether (4:1) then 120 mL (3 x 40 mL) CHC13. The CHC13 extracts were
dried over Na2SO4, the CHC13 removed under reduced pressure then crude 27
purified by silica gel chromatography (CHC13:Et0H 99:1) giving pure 27 (yield
50.0%) as an amber coloured oil. 1 H/13C NMR are shown in Figures 7.2.
1 H NMR (CDC13, 8 ppm) 4.08 (s, 2H), 3.68 (s, 3H), 3.64 (s, 6H), 3.55 (s, 4H), 3.41
(t, 2H, J=4.8 Hz), 3.33 (s, 2H), 2.95 (t, 4H, J=4.8 Hz), 2.68 (t, 2H, J=4.8 Hz); DC
NMR 8: 171.49 [(COOCH3)2], 169.02 (COOCH3), 166.14 (NCO), 56.33
(NCOCH2N), 55.32 [(CH2COOCH3)2], 55.25 [NCOCH2NCH2)], 52.21 (COOCH3),
51.59 [(COOCH3)2], 50.52 [CH2N(CH2COOH)2], 49.31 (CH2CH2NCO), 47.36
(NCH2COOCH3), 46.54 (CH2CH2NC0); UV (X ma. 232nm, MeCN) E= 790; FUR
(thin film) 1749, 1657cm -1 ; ELMS m/z: 359 (M +, 31%; Calc. for Ci5H25N307
359.1692, found 359.1704), 300(22), 185(90), 174(100), 157(76), 146(50); Anal.
Calc. for C15H25N307: C, 50.13; H, 7.03; N, 11.69. Found C, 48.11; H, 6.85; N,
11.31.
117
Page 129
IIIIIIIIIIIIIIII•111 I I I II 111111111111111111111
11111111111
180.0 60.0 0.0 120.0
PPm 240.0
Me0OCCH 2N N(CH 2)2N(CH 2COOMe)s
Chapter 7 Experimental
4.5 4.0 3.5
3.0
2.5
PPm
Figure 7.2 1H and 13C 1VMR spectra of compound 27
11
Page 130
Chapter 7 Experimental
1-(Carboxymethyl)-4-[24bis(carboxymethyl)aminolethyl]-2-oxopiperazine (la)
a) from 19
A solution of 19 (1.0 g, 3.5 mmol) and NaH (0.17 g, 7.4 mmol) in 25 mL thy THF
was stirred at room temperature for 1 h then 80°C for 3 h. After cooling to room
temperature, ethyl chloroacetate (0.55 g, 4.5 mmol) was added dropwise; the mixture
was stirred 3 h at room temperature then 80°C for 5 h. The mixture was filtered,
washing the solid with dry THF. After removal of THF from the filtrate, GCMS
showed the residue to comprise mainly unreacted 19 with some 30. Further treatment
of the residue was not pursued.
The solid was treated for about 30 min with dilute HC1 then H20 removed by
evaporation. Analysis of the residues by LSIMS showed they contained (amongst
others) la and a compound with formula weight 259 (not identified). The relative
quantities of la / impurity were not determined.
EIMS m/z: 373 (M+, 10%; Calc. for C16H27N307 373.1857, found 373.1858),
287(18), 202(25), 174(100), 146(40)
b) from 22
A solution of crude 22 (a mixture of 21 and 22) in 60 mL deionised H20 was
neutralised with Na2CO3 before treating with an excess of sodium chloroacetate. This
mixture was heated at 70-80°C for about 5 h, maintaining pH 8-9 with solid portions
of Na2CO3. After standing overnight at 0°C the pH of the solution was reduced to 2
with conc. HC1 and excess chloroacetic acid removed by extraction with CH2C12.
HPLC of the crude product showed it to be a mixture of several amino acids
including 21, 22 and la (Figure 4.9). Positive identification of la was made by high
resolution LSIIVIS. No further treatment (ie work-up) was performed on the crude
reaction mixture.
119
Page 131
Chapter 7 Experimental
c) from 27
A solution of 27 (8.4 g, 23 mmol) in 80 mL deionised H20 containing 3 mL conc.
HC1 was heated at reflux for about 3 h. The solution was decolourised with a small
amount of activated Carbon, filtered and the filtrate evaporated to dryness. The
trihydrochloride of la was recovered in 75.2% yield. Several unsuccessful attempts
were made to crystallize the trihydrochloride salt. The trihydrochloride salt was
hygroscopic and stored over desiccant when not in use.
1 H NMR (D20, 8 ppm) 4.09 (s, 2H), 3.92 (s, 2H), 3.67 (t, 2H, J = 6 Hz), 3.56 (s, 4H),
3.54 (t, 2H, J = 6 Hz), 3.27 (t, 2H, J = 5.6 Hz), 3.08 (t, 2H, J = 5.6 Hz); 13C NMR
175.66 [(CH2COOH)2], 172.70 (CH2_COOH), 164.99 (NCO), 56.77 (CH2COOH),
55.51 (NCOCH2NCH2), 53.90 (NCOCH2N) 50.32 [CH2N(CH2COOH)2], 49.58
(CH2CH2NCO), 49.37 RCH2COOH)21, 49.17 [(CH2COOH)2], 45.33 (CH2CH2NC0).
Exchangeable (acidic) protons were detected by 1 H NMR (DMSO) at 100°C. A
single broad exchangeable peak at 8.98 gave an integration of 6H, consistent with the
microanalysis. The position of the peak at 8.98 was indicative of rapid exchange.
(NMR timescale) between ligand protons and free HC1 protons (which occur at 5.28
in DMS0); FT1R (KBr disc) 1739 and 1661cm-1 ; LSIMS m/z: 318 (MEI +) Calc. for
Ci2H20N307 318.1301, found 318.1315; Anal. Calc. for Ci2Hi9N307.3HC1: C, 33.74;
H, 5.21; N, 9.84. Found C, 33.34; H, 5.43; N, 9.69.
120
Page 132
Chapter 7 Experimental
7.6 Removal of Impurity from Ligand la
After detecting a small percentage (— 5%) of impurity in la by 1 1-1 NMR titration
(Chapter 6, section 6.6.1) steps were taken to remove it. Several approaches were
attempted, some of which are now described.
7.6.1 Crystallisation of the Trihydrochloride Salt
For many aminopolycarboxylic acids simple water-alcohol mixtures have been used
to recrystallise.2,6,12 Acetone has also been frequently used. 2,12 Such an approach
could not be used in the given case due to the complete solubility of la
trihydrochloride in cold H20, Me0H and Et0H. Furthermore it had been shown
(using LSIMS/EIMS) that partial reesterification of la could occur during treatment
with hot Me0H . The ligand as the trihydrochloride was found to be insoluble in hot
chlorinated solvents, MeCN, Et0Ac and THF. These solvents were thought most
appropriate for recrystallisation and no other solvents were trialed. Several solvent
mixtures, including Me0H/DCM, Me0H/CHC13 and MeCN/Et20 were used without
success; the main disadvantage using these mixtures was the presence of Me0H.
Evaporation of water from an aqueous solution containing la trihydrochloride using
a slow, steady stream of nitrogen caused "clumps" of product to form at the interface.
Individual crystal growth was not observed. Similar results were obtained when
Et0H was used in place of water.
7.6.2 Crystallisation of the Free Acid
Much of the difficulty associated with recrystallisation of the trihydrochloride salt
has been attributed to its hygroscopic nature. Similar difficulties were encountered by
other authors9,13 when trying to recrystallise salts of aminopolycarboxylic acids.
Whilst it was convenient and practical to preserve la as a trihydrochloride salt for
titrations, in order to address the impurity situation attempts were made to generate
the free acid form for further recrystallisation trials. The method used to produce free
121
Page 133
Chapter 7 Experimental
la involved treatment of the trihydrochloride with the calculated amount of either
weak inorganic (eg. NaHCO3) or weak organic base (eg. Et3N). The free acid was
readily formed in these ways but cleaning up inorganic/organic salts proved
extremely difficult. For example, organic bases (eg. Et3N) effectively buffered the
hydrochloride but subsequent separation of Et3N.HC1 from free la was not achieved.
Extraction of an aqueous solution containing la and Et3N.HC1 with CHC13 resulted
in both la and Et3N.HC1 being extracted into the organic layer. Further workup of the
extract failed to yield the free acid form of la.
7.6.3 Other Purification Procedures
As indicated in section 7.5 bromomalonic acid and N,Ar-ethylenebis(aminomalonic)
acid were purified / isolated as sodium salts. This procedure was also pursued for la.
Whilst there was little difficulty producing quantities of the trisodium salt, either by
treatment with Na2CO 3 or NaHCO3, inorganic salts were difficult to eliminate. Like
the trihydrochloride, the trisodium salt proved soluble in Me0H and Et0H.
One option for preparation of the free acid, elution of the trisodium salt through catex
resin, proved unsuccessful. The ligand could not be recovered from the column
despite copious washing with H20 and various alcohol-water, acetonitrile-water
mixtures. Agitating the loaded resin for several hours in water also failed to liberate
the free acid. A similar result had been observed previously for the HC1 salt of 4-
diethylenetriamineacetic acid and other derivatives of this acid.
Attempts made to freeze out the trihydrochloride from various aqueous solutions also
failed. Consideration was also given to purification by complexation but a suitable
technique could not be located or developed.
122
Page 134
Chapter 7 Experimental
7.7 Conclusions of purification work
As indicated some considerable time and energy were put toward purification of la
without reward. A considerable portion of ligand la was consumed by the
purification work and could not be recovered. A decision was made to continue with
the titration work bearing in mind la contained a small percentage of impurity (<
5%) and that this impurity could have a negative influence on potentiometric
titrations.
123
Page 135
Chapter 7 Experimental
7.8 Experimental for Chapter Six
7.8.1 NMR Determinations
Natural abundance spectra were recorded using a Varian Inova-400 Wide Bore
instrument with an inverse detection probe operating at 399.98 ( 1 H) and 100.58 ( 13C)
MHz. Titrations were performed in water containing ligand, background electrolyte
(sodium perchlorate) and/or metal perchlorate. Calibration and lock were achieved by
means of a capillary insert containing benzene-d6 and TMS. Water resonance
suppression was implemented via a binomial 1-3-3-1 presaturation pulse sequence or
by shaped pulses. Peak assignments during the course of titrations were made
possible by the use of a gradient enhanced COSY pulse sequence; presaturation of
the water resonance was unnecessary in this case. NMR analysis of an aqueous
solution containing only background electrolyte showed no organic signals other than
residual protonated benzene and TMS.
Up to 20 1 H spectra were recorded between pH 2-11 and TMS calibration was used
with every experiment.
124
Page 136
Chapter 7 Experimental
7.9 References
(1) Perrin, D. D.; Armarego, W. L. F. Purification of Laboratory Chemicals; 3rd
ed.; Butterworth-Heinemann: London, 1988.
(2) Haydock, D. B.; Mulholland, T. P. C. J. Chem. Soc. 1971, 13, 2389.
(3) Aspinall, S. R. J. Am. Chem. Soc. 1940, 62, 1202.
(4) Krausz, P. University of Limoges, personal communication, 1996.
(5) Martinez, R. National University of Mexico, personal communication, 1996.
(6) Mashihara, M.; Ando, T.; Murase, I. Bull. Chem. Soc. Japan 1973, 46, 844.
(7) Forsterling, H.-D.; Stuk, L. B., A.; McCormick, W. D. J. Phys. Chem. 1993,
97, 2623.
(8) Yoda, R.; Matsushima, Y. Chem. Pharm. Bull. 1994, 42, 686.
(9) Kawato, T.; Kanatomi, H.; Murase, I. Bull. Chem. Soc. Japan 1973, 46, 1723.
(10) Grosse, A. University of Tasmania, personal communication, 1996.
(11) Tomatis, R.; Salvadori, S.; Sarto, G. P. Eur. J. Med. Chem. 1981, 16, 229.
(12) Genik-Sas-Berezowsky, R. M.; Spinner, I. H. Can. J. Chem. 1970, 48, 163.
(13) Schneider, P. W.; Collman, J. P. Inorg. Chem. 1968, 7, 2010.
125
Page 137
CHAPTER 8
Conclusions
Identifying the processes that are most likely to contribute to the degradation of
DTPA in pulping liquors (Chapter 2) provided valuable insight into possible ways of
synthesising the cyclic DTPA degradation product 1-(carboxymethyl)-442-
[bis(carboxymethypamino]ethyll-2-oxopiperazine (la). The similarity between
breakdown products of both EDTA and DTPA due to these processes (chemical
oxidation, photodegradation and biodegradation) strongly implicated a universal
mode of decomposition, namely successive oxidative decarboxylation. This
mechanism has been verified in vitro using the action of KMnat on DTPA in acidic
aqueous conditions. 1 Furthermore, in each of the three methods developed for
manufacture of ligand la, oxidative decarboxylation was utilised.
As described in Chapter 4 it was possible to produce la by three individual but
related methods. It was necessary to fully develop one of these only (Scheme IF,
section 4.2). Sufficient amounts of la (as the trihydrochloride) were produced using
Scheme II' for subsequent complexing studies.
Of the techniques available for determination of equilibrium constants, NMR and
potentiometry were selected for this study. The protonation constants determined by 1 1-1 NMR and potentiometric titrations showed general agreement (section 6.9) and
compared favourably with published values for lb. The stability sequence obtained
was Fe(HI) > Zn(H) > Hg(H) Pb(H) > Mn(H) and logKmL values ranged between
12.5 and 16.5. Immediately obvious from these data is the significant decrease (as
expected) in the stability of la metal complexes compared with DTPA metal
complexes. However it is clear that la possesses quite considerable complexing
Page 138
Chapter 8 Conclusions
ability, comparable to NTA for Hg(H) and Fe(M) complexes and EDTA for Zn(H),
Pb(H) and Mn(H) complexes (Chapter 6, Table 6.5).
The stability sequence is also slightly different to what might be anticipated in light
of data from similar ligands. However, the least stable (Mn 2÷) and most stable (Fe 3÷)
complexes are in agreement with previous published rankings. 2 The range of log
stability constants is also much narrower than the corresponding range for DTPA.
One could have expected a much greater difference between the divalent metals and
trivalent Fe. Such a difference occurs for EDTA and DTPA, less so for NTA. Perhaps
keen competition (from water) for coordination sites about ligand la prevents Fe(ll)
from forming stronger chelates compared to the given divalent metal ions. Without
further investigation (eg. molecular mechanics/ X-ray analysis) it is difficult to assign
a definitive reason for the apparent low stability constant value for Fe(HI).
The major outcome of this study is that the use of DTPA as a chelating agent in
thermomechanical pulping at ANM (Albury) is appropriate given the significant
reduction in complexing power and concentration of DTPA degradation products such as la in pulping liquors. Process changes with respect to DTPA (eg. dosage)
would appear to be unnecessary. The other major outcome of this investigation is that a monitoring program for la may need to be implemented (section 8.1).
•
8.1 Future research
The next obvious step would be to determine actual levels of la in pulping liquors. It has been demonstrated previously that la can be detected as its ferric complex by
HPLC in the same manner as DTPA. 1 Thus an analytical method already exists and it
should be possible to use remaining la from this study as a standard for determinations. The level of la in pulping effluent is expected to be less than DTPA 3 (ie < 5 ppm) and thus should pose no major concerns whether effluent is discharged
to land or catchments.
127
Page 139
Chapter 8 Conclusions
Other possibilities for further investigation might include :
• the use of la as a chelating agent (or precursor) in its own right. It has been found
that the cyclic DTPA degradation product has considerable complexing ability
and so could prove to be a useful ligand or ligand precursor
• X-ray analysis of la crystals and la complexes to gain more information about
the likely form and solution behaviour of the ligand and its complexes. Molecular
mechanics may also prove useful in such an examination
• identification of the specific locations of DTPA degradation in the papermaking
process. Whilst this would be useful in terms of helping complete the file on la it
may not offer much more practical benefit, since the information would not really
have any process implications
There do not appear to be many other lines of investigation (in terms of the
papermaking process) involving la.
128
Page 140
Chapter 8 Conclusions
8.2 References
(1) Richardson, D. E.; Harden, P. E. 48th Annual Appita Conference
Proceedings, Melbourne, Australia, 1994; 45.
(2) Martell, A. E.; Smith, R. M. Critical Stability Constants : Amino Acids;
Plenum press: New York, 1974; Vol. 1.
(3) Richardson, D. E. Australian Newsprint Mills, personal communication, 1997.
129