STUDIES ON LASER ABLATION OF POLYMER COATED PROPELLANT FILMS Except where reference is made to the work of others, the work described in this thesis is my own or was done in collaboration with my advisory committee. This thesis does not include proprietary or classified information. _______________________ Artem Dyachenko Certificate of Approval: German Mills Associate Professor Chemistry and Biochemistry Rik Blumenthal, Chair Associate Professor Chemistry and Biochemistry Andreas J. Illies Professor Chemistry and Biochemistry Stephen L. McFarland Acting Dean Graduate School
Transcript
STUDIES ON LASER ABLATION OF POLYMER COATED PROPELLANT FILMS
Except where reference is made to the work of others, the work described in this thesis is my own or was done in collaboration with my advisory committee. This thesis does not
include proprietary or classified information.
_______________________ Artem Dyachenko
Certificate of Approval: German Mills Associate Professor Chemistry and Biochemistry
Rik Blumenthal, Chair Associate Professor Chemistry and Biochemistry
Andreas J. Illies Professor Chemistry and Biochemistry
Stephen L. McFarland Acting Dean Graduate School
STUDIES ON LASER ABLATION OF POLYMER COATED PROPELLANT FILMS
Artem Dyachenko
A Thesis
Submitted to
The Graduate Faculty of
Auburn University
in Partial Fulfillment of the
Requirements for the
Degree of
Master of Science
Auburn, Alabama August 7, 2006
iii
STUDIES ON LASER ABLATION OF POLYMER COATED PROPELLANT FILMS
Artem Dyachenko
Permission is granted to Auburn University to make copies of this thesis at its discretion, upon request of individuals or institutions at their expense. The author reserves all
publication rights.
Signature of Author
Date of Graduation
iv
VITA
Artem Aleksandrovich Dyachenko, son of Alexander and Elena, was born in
Moscow, Russia on December 22, 1979. Upon graduation from High School in June,
1996, he entered the Physical Chemistry Department at Russian University of Chemical
Technology where he graduated from in March, 2003 with a Bachelor of Science degree
in Chemical Engineering. Artem began his graduate studies at Auburn University,
Auburn, Alabama in August, 2003.
v
THESIS ABSTRACT
STUDIES ON LASER ABLATION OF POLYMER COATED PROPELLANT FILMS
Artem Dyachenko
Master of Science, August 7, 2006 (B.S., Russian University of Chemical Technology, 2003)
69 Typed Pages
Directed by Rik Blumenthal
In artillery, safety issues make propellants highly preferable as compared to
ordinary explosives. However, the same properties that make propellants safer, such as
their low shock sensitivities, also make them more difficult to ignite directly. In large
bore artillery shells, ignition of the propellant is achieved using a small amount of an
ordinary explosive, such as lead azide, as the primer. This sequential ignition process
results in irreproducible delays that prevent targeting of fast moving objects. Numerous
attempts have been made to develop improved ignition processes. Laser ignition would
overcome the ignition delay problem and be practical. Unfortunately, all of the
propellants used today cleanly ablate under laser irradiation, and ignition cannot be
vi
achieved. Electrothermal Chemical (ETC) ignition has proved capable of overcoming the
ignition delay problem, but it is not practical. In this method, a large capacitor is
discharged across a small piece of plastic, generating a high-pressure, high-temperature
plasma that ignites the propellant after a short and highly reproducible delay.
Unfortunately, the capacitor and related power supply to charge it are too large and heavy
for practical application of ETC ignition. In this work, a new approach to ignition is
developed based on the generation of a high-temperature, high-pressure plasma, directly
at the propellant surface, that has a chemical composition similar to that of the ETC
igniter, using laser ablation of the plastic coating on the propellant.
vii
ACKNOWLEDGMENTS
First of all, I would like to express my deepest appreciation to my advisor Dr. Rik
Blumenthal who provided me with valuable knowledge, academic guidance and support.
I would like to thank my group members, especially Rodney Valliere who has been a
great help, as well as Huijiao Sun who recently joined our group. I thank James Black for
his assistance with polymer coating and Dr. German Mills for providing his laboratory
facilities. I acknowledge Army Research Office for financial support of this project. I
thank all my committee members for taking their time reading this thesis. Last but not
least, I am grateful to the Faculty of the Department of Chemistry and Biochemistry for
their teaching and for giving me the opportunity to gain valuable teaching experience.
viii
Style manual or journal used: American Chemical Society style
Computer software used: MS Word 2003, MS Excel 2003, Adobe Photoshop CS2
A propellant is defined as a rapid burning charge that propels a bullet, shell,
rocket, or missile.1 Unlike primary explosives, propellants are temperature and pressure
dependent and therefore require the use of detonator and also possibly a booster. A
detonator contains a primary explosive as an essential element; however, it may be more
complex. This is true particularly of military detonators, or fuses and delay blasting caps
in which timing, safety, and other mechanisms are also built into the detonator. A booster
is a sensitive secondary explosive which reinforces the detonation wave from the primary
explosive, or detonator, and delivers thereby a more powerful detonation wave to the
main (secondary) explosive charge. Examples of primary explosives include lead azide,
mercury fulminate and nitromannite. Primary explosives are very sensitive to heat,
impact or friction and detonate or burn very rapidly. Nearly all combustible gases and
dusts can be explosive when mixed with air in certain proportions, e.g.:
CH4 + 2O2 → CO2 + 2H2O + heat (1)
Many gaseous and dust-air or dust oxygen explosives are, in fact, primary explosives,
since they are readily detonated in a manner characteristic of primary explosives,
frequently with exceedingly small sources of energy. For this reason, combustible gases
and dusts are extremely dangerous explosion hazards and have been responsible for
numerous residential and industrial accidents and fatalities. Primaries often need O2 gas
as a reactive. Grain dust such as lycopodium powder is not especially flammable but
when grain is dumped into a grain silo, some of the finer dust particles can remain
suspended in air surrounded by oxygen. This mixture can be ignited by a spark, resulting
in an explosion. Primary explosives, detonate when initiated, but they are extremely
sensitive and, as a class, have less power than secondary explosives such as TNT, RDX
and HMX which have the highest energy outputs of any explosives.2, 3 The energy output
is proportional to the volume of the gaseous products of explosion, e.g. during detonation
of RDX, a relatively large number of net gas molecules formed:
C3H6O6N6 → 3CH2N + 3NO2 (2)
Propellants have a number of advantages over primary explosives. They are less
sensitive to heat and shock than primary explosives: most simply burn rather than
explode when ignited in air, and can be detonated only by the nearby explosion of a
primary initiator. Two common propellants used by the Army are RDX (Research
Department Explosive) and HMX (High Melting Explosive), see Figure 1.1.
2
O N
C H
O N
N
O
O
CHHC
N NN
O
O
2 2
2
N C
N
C
N C
N
C
N
N
N
N
O
O
OO
O O
O
O
H2
H2
H2
H2
a b
Figure 1.1 – a) RDX molecule; b) HMX molecule
Propellants are used by military as fillings for bombs and shells with only a small amount
of primary explosive needed. This makes the explosive devices safer and less susceptible
to accidental explosions. The initiation of secondary explosives generally requires the
shock wave energy from a primary explosive. Secondary explosives will not detonate
when subjected to a spark, flame, or a hot wire as will a primary explosive.
I.2 IGNITION TECHNIQUES
Conventional ignition requires the use of primary explosive such as a military
fuse to initiate the explosion of a less sensitive secondary explosive. The simplest fuse is
a length of combustible material which burns from the free end, through a small opening
in the casing, into the explosive charge, where it then ignites the explosive material, see
Figure 1.2. A typical large bore shell contains an ordinary fuse cap, primary and
secondary explosives. The black powder in an ordinary fuse cap refers to a low explosive
such as sodium nitrate, sulfur or charcoal and serves as a safety fuse.
Primary Explosive ((Pb(N3)2) Fuse with Black Powder Core
Figure 1.2 - Ordinary fuse cap.
3
In the ordinary fuse cap, a primary explosive such as lead azide is used alone to fulfill the
threefold primary purposes of the cap: ignition of pre-detonation explosion, creation of
the detonation wave, and delivery of sufficiently intense detonation wave to a secondary
charge to detonate this main charge.2 Lead from the primary explosive is released in the
barrel of the gun and then deposits on the interior of the barrel and must be removed later
as it builds up. Lead also is released into the air where it may result in a hazardous
exposure to the troops operating the gun. One motivation to replace conventional ignition
is the elimination of lead.
A typical primary explosive used in the Army is environmentally hazardous lead
azide (Pb(N3)2) which can be avoided by using plasma ignition technique. The interest of
this research is the process of plasma ignition which removes the need for lead azide
completely. In plasma ignition systems, also referred to as electrothermal chemical (ETC)
ignition, an ordinary fuse cap is replaced by a high temperature and pressure plasma,
generated by the application of high-current, short-lifetime electrical discharge to a
polymer capillary, see Figure 1.3.
Interest in plasma ignition of propellants began in the early 1990’s and was
primarily focused on liquid propellants.4 Interest in the plasma ignition of solid
propellants did not start to develop until several years later, when an enhanced burn rate
was thought to have been discovered.5 Despite the fact that the existence of an enhanced
burn rate is still questionable today,6 it did produce a substantial interest in ETC ignition.
4
5
Conventional Ignition
Lead Azide
Plasma Ignition
Capacitor + -
Propellant (RDX)
Propellant (RDX)
Figure 1.3 – Large bore artillery shell.
Plastic tubing
Further investigations resulted in the observations of significant advantages of the
plasma ignition such as: a short and highly reproducible ignition delay7 and the
possibility of temperature compensation using a trivial adjustment of the electrical energy
needed to initiate combustion.8 Subsequent simulations of the ETC igniter9 did not
explain the benefits, but yielded many insights into the process which was not possible to
obtain from the more prevalent studies of pressure transients.
Recent work at the Army Research Laboratory in Aberdeen, MD, has showed
numerous observations that may provide significant insight into the process of plasma
ignitions. Namely, the studies have showed that the choice of a polymer liner plays an
important role in the ignition process. Polyethylene liners, used in the early work, were
discovered to leave a residual “soot” on the grains at the time when the detonation was
6
terminated, while plasma ignition achieved with Mylar (polycarbonate) liners left a
“clean” surface. Studies of compositional and morphological changes in grains exposed
to the ignition source have proved that pits, gouges, blisters and wormholes are formed
on the surface of the propellant grains.10, 11, 12, 13 Moreover, the normal melt layer was
found to be either very thin or absent on the plasma-treated grains and the observed
denitration was extending 0.5-0.75 mm into the surface depending on the chemical
composition of the propellant. All existing experimental data suggest an ablative, rather
than a combustive, process occurring during the initial stages of plasma ignition where
increased surface area may be an explanation of the increased burn rate.
Attempts to determine the mechanism of plasma ignition include large variety of
techniques which test the influence of specific components of the plasma. Some of these
studies are as follows: Andreasson and Carlson14 built a closed vessel cell in which an
electrical current is passed through a test charge while ignited and burned. Despite a
number of difficulties coming from a poorly reproducible ignition delay, they did
demonstrate an existence of a burn rate enhancement with the application of external
electrical power. Katulka et al.15, 16 investigated the power dependence of ignition for a
various propellant compositions. They also demonstrated the effects of Mylar and
aluminum films on the samples to reduce exposure of the samples to the UV and ion
radiation coming from the plasma. The results of these studies are clouded by the
reactivity of some of the films, however, some important observations were still made
such as the presence of metal clusters from the plasma source on the samples, radiation
transmitted through polyethylene films changed the chemical composition of some
7
propellant mixtures, and all the effects depended strictly on the chemical nature of the
propellant. Others focused on heat loss,17 and modeling of the ignition process.18, 19
Modeling of a standard plasma ignition system has showed that the flux of
species arising from the plasma ignition source is mostly hydrogen and carbon atoms
with their ions.9 Besides the work at Aberdeen, the Army has also supported several
groups that are working in collaboration with the ARL group. For example, at
Pennsylvania State University a “standard” ETC igniter has designed and constructed.
Moreover, their mass spectrometric measurements of the plasma composition as it
expands out of the plasma source are providing experimental results which can be
compared directly with the modeling.20 Another group, at North Carolina State
University, uses optical probing of the ETC igniter pulse to investigate the shape and
temperature profiles of the expanding plasma pulse.21 Meanwhile, the group at the
University of Texas uses optical probing technique to image individual chemical
constituents of the pulse.22
In order to understand the process of erosion of propellant films in the plasma it is
important to understand the physical processes taking place in plasma environment. It is
not unreasonable to assume that physical sputtering is responsible for erosion of
propellant films in plasma. At the microscopic level physical sputtering can be
considered as a result of fast moving ions bombarding a surface which leads to a transfer
of entire energy and momentum to the lattice. This process is well known for many types
of materials,23 however propellants are unusual sputter targets. First, they are molecular
solids, meaning they are composed of molecular units that are held together by relatively
8
weak Van de Waals forces as compared to the covalent forces which bind the atoms of
the more traditional sputter targets, such as metals and semiconductors. Due to the
weaker bonding between the units, molecular solids tend to have higher sputter yields.
Second, propellants can spontaneously combust, if sufficient pressure and temperature
are achieved. When a propellant surface is impacted by an ion, combustion may become
an additional and likely outcome. The mechanism of ion stimulated propellant
combustion can be understood through either an atomistic or a continuum model of the
interaction. From atomistic point of view, the glancing angle collisions of an ion with a
propellant molecule can transfer sufficient amount of energy and momentum to the
vibrational and electronic energy manifolds of the propellant molecule to initiate
combustion. From a continuum viewpoint, the ion bombardment event may be seen as
the source of a short-lived, local pressure and temperature spike as the ion transfers its
momentum and energy to the surface. When the spike in pressure and temperature are
large enough, local conditions suitable for the spontaneous combustion of propellant
molecules can result within a few nanometers of the ion impact point.
Ion energy plays a large role in determining the outcome of the ion bombardment
process. The resulting combination of effects as a function of ion energy is the logical
consequence of competing factors in the bombardment process: the energy dependent, or
more specifically the velocity dependent cross-section for collision and the average
energy transferred to target atoms. At very low ion energies (0-50 eV), the ions move
relatively slowly and the collision cross-section with surface layer atoms is very large.
Hence, all of the ions undergo “hard” collisions with the uppermost surface atomic layer,
where they transfer most of their energy to target atoms. However, with little energy in
9
the ions, the energy transferred to individual target atoms is most likely below the
threshold for ejection of target atoms, and only a small fraction of the atoms are ejected.
The result is a low sputter yield. As the ion energy is increased within the low energy
regime, the velocity of the ions goes up, and thus, the cross-section for collisions with the
uppermost layer goes down. In this regime, ions can penetrate as much as a few
nanometers into the surface before suffering a hard collision with a target atom.
Meanwhile, the average energy transferred to the target atoms also rises and an increasing
fraction of the target atoms now have enough energy to be ejected. In the low ion energy
ion regime, the sputter yield reaches a maximum. As the ion energy is further increased
to the medium and high energy regime, a large fraction of the ions begin to penetrate
deep into the surface layer before suffering a hard collision. Despite the fact that the
average energy transferred to target atoms is large, they are too deep to be able to escape
the solid and the energy is dispersed within the lattice. As a result, the sputter yield
decreases. In the medium to high energy regime, implantation of ions takes place over
sputtering and other surface effects.
The modeling of the plasma-propellant interactions (PPI) using laser ablation is
based on the fact that the laser ablation of plastics, especially the ones used as liner in
ETC igniters produces plasma that in many ways resembles the output pulse of the ETC
igniters. By laser ablating a polymer film of proper thickness deposited directly on top of
a propellant film, a miniature replica of the ETC igniter pulse can be created at the
surface of the propellant. As laser ablation process is highly controllable and can be done
on a large variety of sizes by focusing and adjusting power of the laser pulse, the
10
advantage of this approach is obvious since actual ETC igniters cannot easily be
miniaturized.24
I.3. LASER ABLATION
I.3.1 INTRODUCTION
Ablation, in the broadest sense, is removal of material by incident light. In most
metals and glasses/crystals the removal is by vaporization of the material due to heat. In
polymers the removal can be induced by photochemical changes which include a
chemical degradation of the polymer, akin that employed in photolithography. If the
removal is by vaporization, special attention must be given to the plume. The plume will
be a plasma-like substance consisting of molecular fragments, neutral particles, free
electrons and ions, and chemical reaction products. The plume will be responsible for
optical absorption and scattering of the incident beam and can condense on the
surrounding material and/or the beam delivery optics. Normally, the ablation site is
cleared by a pressurized inert gas, such as nitrogen or argon. If the material to be ablated
has a poor absorption, such as diamond, a thermally converted form of the material, such
as graphite which has relatively good absorptivity, is used to cover the diamond surface
with a thin coating. The laser beam will ablate the graphite and in doing so the surface of
the underlying diamond will be converted to graphite allowing efficient absorption.
Sequentially, graphite is ablated and each newly formed layer of diamond is converted to
graphite. The ability of the material to absorb photons limits the depth to which that
energy of light can perform useful ablation. Ablation depth is determined by the
11
absorption depth of the material and the heat of vaporization of the substrate. The depth is
also a function of beam energy density, the laser pulse duration, and laser wavelength.
Laser energy per unit area of substrate is measured in terms of the energy fluence.25
The peak intensity and fluence of the laser beam is given by:
Intensity (Watts/cm2) = peak power (W) / focal spot area (cm2)
Fluence (Joules/cm2) = laser pulse energy (J) / focal spot area (cm2)
while the peak power is
Peak power (W) = pulse energy (J) / pulse duration (sec)
There are several key parameters to consider for laser ablation. The first is
selection of a wavelength with a minimum absorption depth. This will help ensure a high
energy deposition in a small volume for rapid and complete ablation. The second
parameter is short pulse duration to maximize peak power and to minimize thermal
conduction to the surrounding work material. This is analogous to a vibrating system
where the mass is large and the forcing function is of high frequency. This combination
will reduce the amplitude of the response. The third parameter is the pulse repetition rate.
If the rate is too low, all of the energy which was not used for ablation will leave the
ablation zone allowing cooling. If the residual heat can be retained using a high repetition
rate, thus limiting the time for conduction, then ablation will be more efficient. More of
the incident energy will go toward ablation and less will be lost to the surrounding work
material and the environment. The fourth parameter is the beam quality. Beam quality is
12
measured by the brightness (energy), the focusability, and homogeneity. The beam
energy is of no use if it can not be properly and efficiently delivered to the ablation
region. Further, if the beam is not of a controlled size, the ablation region may be larger
than desired with excessive slope in the sidewalls.
Typical laser sources commonly used in surface modifications include Nd:YAG
and excimer lasers. Since this work is focused on laser ablation of polymers
(polyethylene and polycarbonate) which both absorb light in the UV region, only
ultraviolet laser ablation mechanisms are discussed hereafter.
I.3.2 LASER ABLATION MECHANISMS
Laser-induced ablation results from the conversion of an initial electronic or
vibrational photoexcitation into kinetic energy of nuclear motion, leading to the ejection
of atoms, ions, molecules, and even clusters from a surface. Laser ablation is a sputtering
process in which material removal rates typically exceed one-tenth monolayer per pulse;
the surface is structurally or compositionally modified at mesoscopic length scales; and
particle yields are superlinear functions of the density of excitation. The formation of an
ablation plume (a weakly ionized, low-to-moderate density expanding gas cloud) adds to
laser ablation the complications of plasma-surface interactions, gas dynamics, and laser-
induced photochemistry.
Lasers deposit energy in irradiated surfaces and the near-surface region of the
bulk material down to a penetration depth that is characteristic of the laser frequency (or
wavelength) and the material. The energy may be deposited either by exciting free
electrons or by exciting electronic or vibrational transitions in atoms, ions, molecules, or
optically active defects. The mechanism, density, and lifetime of the induced excitation
depend on the electronic structure, composition, surface topography, and defect
populations of the irradiated solid as well as on the laser frequency and pulse duration.
There are two steps in the mechanism by which UV laser pulses bring the etching of
polymer surfaces with a minimum of thermal damage to the substrate.
Ene
rgy
Interatomic Distance
a
b
Figure 1.4 - Energy-level diagram for a hypothetical bond A-B. The lower broken line represents
the ground electronic state; the upper broken line and the solid line represent excited states.
The principal reaction steps that have been proposed can be understood by referring to an
energy diagram, Figure 1.4. It is generally accepted that the absorption of UV photons
results in electronic excitation (step a). The excited electronic state can undergo
decomposition in that state, which would be a purely photochemical reaction, or, if the
13
excited molecule undergoes internal conversion (step b) to a vibrationally excited ground
state, any subsequent decomposition can be considered to be the equivalent of a thermal
process. This is the so-called photothermal mechanism in which the photons merely act
as a source of thermal energy.26
In Figure 1.5, a schematic diagram of the energy pathways present in ultraviolet
processing of polymers is shown. Photochemical and photothermal mechanisms can both
lead to decomposition as well as changes in absorption properties. As polymer ablation
and modification involves actual chemical transformation of the material, absorption can
change with laser processing. Some polymers which are initially only lightly absorbing
become absorbing after the first few laser pulses and ablation does not begin until
“incubation” is accomplished.25 The details of surface alteration by laser ablation – such
as large-scale material removal – will also be influenced by surface morphology, by
surface roughening and instabilities, and by the ambient atmosphere. Finally, the amount
Photochemical Process
Photothermal Process
Decomposition Electronic States
Electronic Excitation
Radiative Transitions
UV Laser
Radiationless Transitions
Incubation
Incubation
Phase Transition
Kinetic Energy
Dissociation
Figure 1.5 – Various energy pathways in UV processing of polymers.25
14
15
of light absorbed at the surface may be influenced by laser interactions with the ejected
material and, in case of thin irradiated samples, by internal reflections and phase changes
at internal boundaries.
I.3.3 LASER ABLATION OF POLYMERS
It is commonly accepted that laser ablation involves photothermal and/or
photochemical processes, depending on the nature of the polymers used and the
experimental conditions, for example laser fluence, wavelength, and pulse duration. The
photothermal process involves the absorption of photons, followed by the release of the
photon energy into the polymer matrix via vibrational cooling. This induces a rapid
temperature rise in the bulk material leading to the thermal decomposition of the
polymer. If the vibrational energy attains a particular fluence threshold, then bonds in the
polymer will break, resulting in a phenomeneon known as photofragmentation. These
fragments typically occupy a larger volume compared to the surrounding material. The
increase in volume, if confined by non-irradiated material below and adjacent to the
irradiated material, leads to a sharp increase in pressure and a forward ejection of ablated
material. The photochemical process involves the breaking of chemical bonds due to
interaction with nanosecond (or shorter), high power, UV pulses yielding gaseous
photoproducts. During this process, thermal and mechanical damage to the surrounding
polymer is minimal and more precise control over the ablated region is realized.
The ablation of the surface of a polymer by a UV laser pulse is a function of the
energy deposited in the solid in unit time. If a typical UV pulse has a full width at half-
maximum (FWHM) of 20 ns and an energy of 450 mJ and the size of the beam at the
polymer surface is 1.5 cm2, the fluence at the surface will be 300 mJ/cm2 and the power
density will be 15 MW/cm2. When this pulse strikes the surface a loud audible sound will
be heard and depending upon the wavelength, 0.01-0.1 micron of the material can be
removed with a geometry that is defined by the light beam. If this experiment is
performed in air, a bright plume will be ejected from the surface and will extend to a few
millimeters. Figure 1.6 shows images of laser ablation plumes from polycarbonate films
using different laser focusing conditions. In Figure 1.6 (a), the ablation plume can be
readily seen. The mushroom cloud like appearance of the plume is the result of emission
from the ablated species and the fireball that results when the plume materials combust in
the air. In Figure 1.6 (b), the bright spot in the air is light from the ionization of air at the
focal point of the laser.
a b
Figure 1.6 – Laser Ablation Plume.
16
Typically, UV laser ablation is carried out with a succession of pulses. R.
Srinivasan and Bodil Braren27 have shown that the depth etched is a linear function of the
number of pulses and that there is a very long extrapolation between the origin (zero
pulses) and the first data point.
Laser Beam
Mask
Organic Polymer
Long-Chain Molecules
Irradiation
(a)
Absorption
(b)
Bond Breaking
(c)
Ablation
Figure 1.7 – Schematic impact of laser pulse on polymer surface.
A pictorial representation of the interaction of a laser pulse with a polymer
surface is shown in Figure 1.7. As shown in Figure 1.7 (a), the stream of photons from a
single laser pulse falls on the polymer and is absorbed in a depth that can he as little as a
17
18
fraction of a micron for intense absorbers, to many tens of microns for weakly absorbing
polymers. Obviously, weak absorption and strong absorption refer to specific
wavelengths so that the same polymer can absorb weakly at one laser wavelength and
strongly at another. Figure 1.7 (b) shows that within the absorption depth, there are
numerous bond breaks. In Figure 1.7 (c), the fragments are shown to be ejected from the
surface, leaving an etched pit behind.
The general features of UV laser ablation of polymers are summarized as follows:
• Polymer ablation takes place within 10 to 100 nanoseconds.
• The threshold energy fluence, defined as the fluence at which the etch depth is
0.05 μm per pulse, is low for polymers (typically in the range 10 to 100
MJ/cm2).
• For fluences near or below the threshold, the etch depth follows Beer-Lambert's
law (photo-chemical, linear absorption). For fluences above the threshold,
thermal effects contribute to the etch depth. In addition, the longer the
wavelength, the stronger are the thermal effects.
• Wavelength affects absorption and threshold fluence. The etch depth per pulse
(lower absorption coefficient) is larger for a weaker absorber than for a stronger
absorber.
• The formation and expansion of the plasma plume during the laser pulse
characterize the rapid etching process. The etch depth per pulse increases with
19
energy fluence until the phenomenon of saturation is reached. "Saturation" is a
mechanism involving the blocking of the trailing part of the laser pulse by both
the plume and the excited polymer species generated by the leading part of the
pulse. This occurs only at high energy densities and prevents additional material
removal.
• Ablation is accompanied by an acoustic signal that decreases with increasing
laser wavelength.
• Ablation creates numerous products, which may include atoms, monomers and
fragments normal to the surface. The velocities of ablation products are high, up
to 101 m/s. The velocity distribution of ejected material is not dependent on the
energy fluence.
• Ablation takes place in the temperature range 400 to 800 0C.
• The small absorption depth coupled with short laser pulses and low thermal
conductivity of polymers restricts the extent of heat transfer, leading to precise
material removal and a small heat-affected zone.
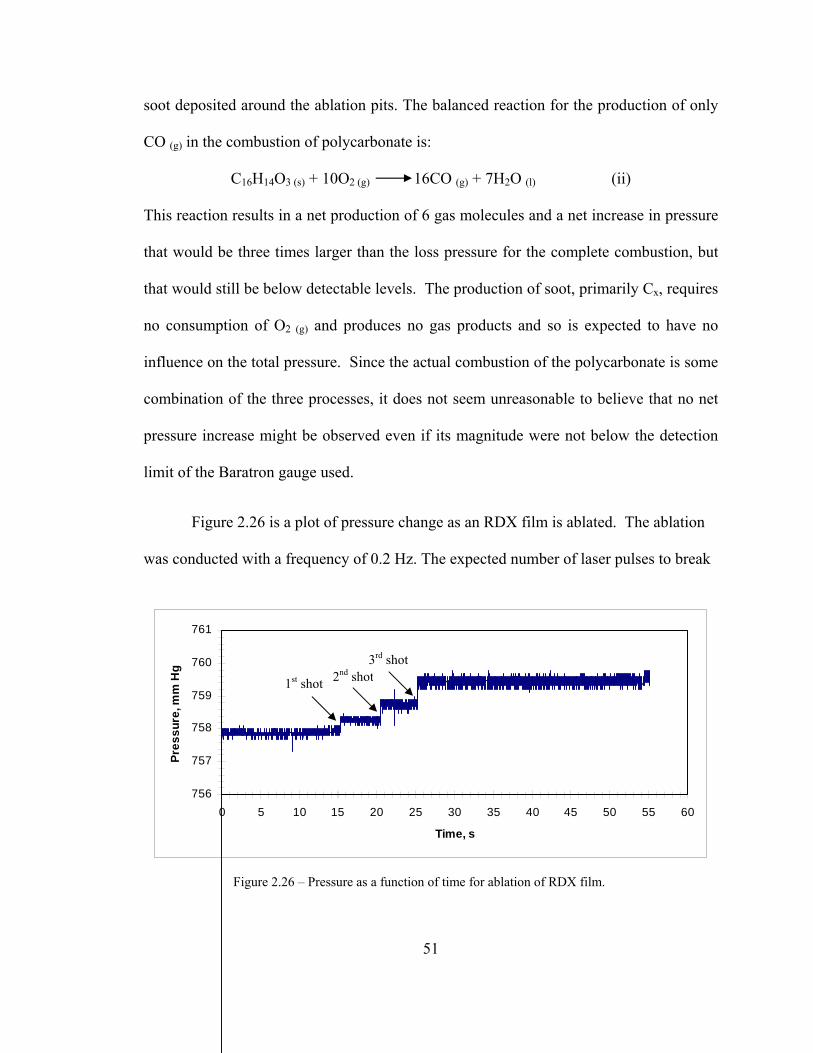
I.3.4 LASER ABLATION OF RDX FILMS
When a sample is illuminated with a short pulse of intense laser radiation, a few
monolayers of material may be "cleanly" removed from the surface, see Figure 1.8.
Substrate
Pulsed Laser
Plasma Plume
Plasma Emission
Substrate
Atomic layers of material to be ablated
a
b
Figure 1.8 – a) Ablation of material; b) Sample after ablation.
In laser ablation, the rapid adsorption of laser energy generates a high-pressure,
high-temperature plasma that then extinguishes rapidly as it expands into the ambient
environment, see Figure 1.8 (a). Experimental measurements and theoretical studies of
laser ablation both indicate that pressures of several MPa and temperatures of several
20
21
thousand degrees are typically realized in the ablation process.28,29 Hence, it is no
coincidence that images of laser ablation plumes closely resemble the plumes recently
observed by Varghese30 observed to emerge from an ETC ignition source.
In this work, the laser ablation of thin films of ETC liner material deposited
directly onto propellant samples is studied. Polyethylene and polycarbonate films are
typically used by the Army as ETC liners and have been shown to be effective igniters
when ablated, consequently they have been chosen for study herein. Ablation of both of
these polymers can be achieved with UV irradiation with the fourth harmonic of an Nd-
YAG laser. Ablation of deposited layers of these polymers will produce short-lived
plasma very similar to those found at the exit ETC igniter.
Finally, it should be noted that the ablation process removes only a few
monolayers (see Figure 1.8) of material at a time and that the deposition of the films will
most likely result in thickness on the order of microns. Therefore, a single pulse ablation
experiment will simply measure the ablation products of the bulk films. However,
repeated ablation of the same region, using a laser spot size of ~ 1mm as compared to the
micron thickness, will successively thin the film until pure propellant is revealed. When
the polymer film thickness exactly matches the ablation depth, the surface of the
propellant will be presented with plasma comparable in composition and pressure to the
output of an ETC igniter. Under these conditions, the propellant is expected to burn at
least until the pressure of the ablation pulse dissipates. For identically ablated structures
where the polymer film is 10-20% thicker, the ablation will not reach the surface of the
propellant and only the pressure of the pulse, but not the chemical species of the plasma,
will reach the surface of the propellant. In this case, the propellant film is expected to
remain mostly intact after the laser pulse. For structures that have polymer films 10-20 %
thinner than the ablation depth, some of the propellant will be expected to ablate directly,
a process that has been shown not to be capable of igniting the propellant.16
I.4 THIN PLASTIC FILMS I.4.1 DEPOSITION METHODS
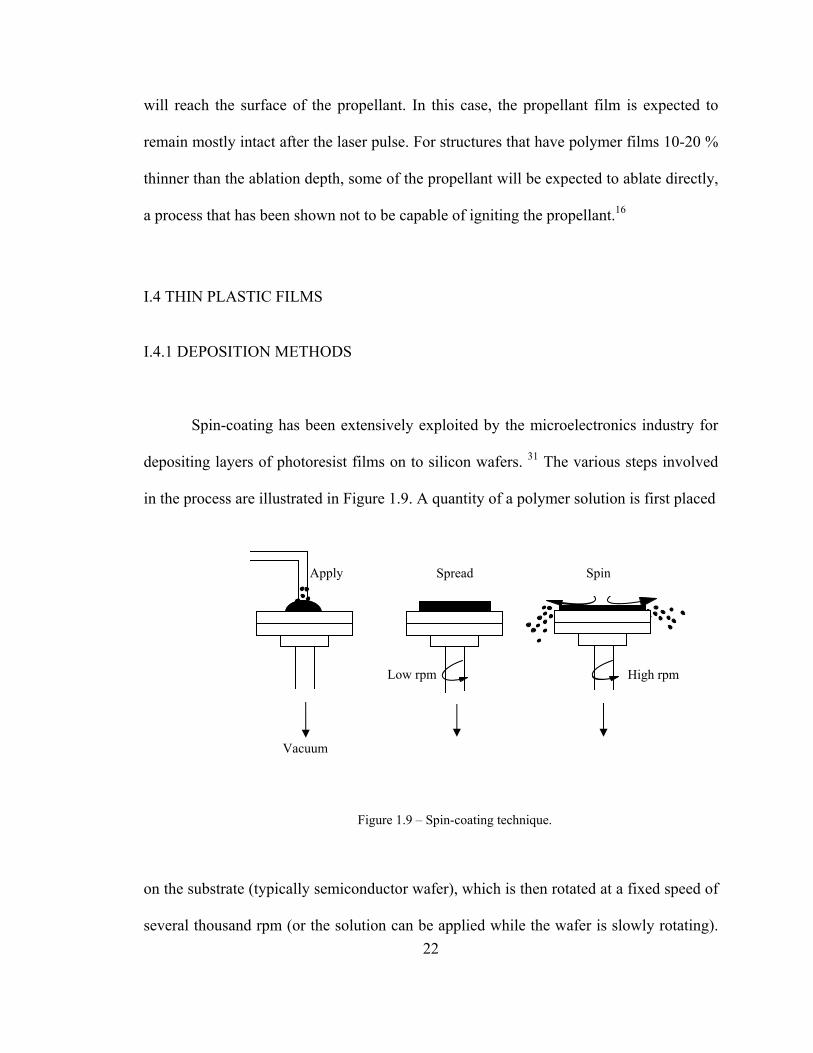
Spin-coating has been extensively exploited by the microelectronics industry for
depositing layers of photoresist films on to silicon wafers. 31 The various steps involved
in the process are illustrated in Figure 1.9. A quantity of a polymer solution is first placed
Apply Spread Spin
Vacuum
Low rpm High rpm
Figure 1.9 – Spin-coating technique.
on the substrate (typically semiconductor wafer), which is then rotated at a fixed speed of
several thousand rpm (or the solution can be applied while the wafer is slowly rotating). 22
23
The resist solution flows radially outwards, thus reducing the fluid layer thickness.
Evaporation of the solvent results in a film of uniform thickness. The initial stage
involves delivering a quantity of solution to the surface of the substrate. The polymer
viscosity (dependent on the concentration of the starting solution) and final film speed are
both important process parameters. An increase in angular velocity decreases the film
thickness; an inverse power-law relationship usually holds for the thickness dependence
on the final spin speed. For a given speed, the film thickness decreases rapidly at first, but
then slows considerably at longer times. A simple theory32 predicts the following
relationship between the thickness of the spun film, d, the viscosity coefficient of the
solution, η, its density, ρ, the angular velocity of the spinning, ω, and the spinning time, t:
d = (η/(4π ρ ω2)1/2t-1/2 (3)
Organic compounds that have been successfully deposited by spin-coating include
electrically insulating polymers such as poly (vinylidene fluoride), conductive polymers
and dyes developed for electroluminescent displays, and certain phtalocyanine
materials.33, 34, 35, 36, 37 Although spin-coating is expected to produce films in which
individual molecules are relatively disordered, this is not always the case. For example,
organized phtalocyanine layers have been deposited.35 The way in which the order is
achieved is not fully understood but may result from the centrifugal forces acting upon
the individual molecules during spinning. Spin-coating is the preferred method for
application of thin, uniform films to flat substrates.
Other methods of thin film formation include dip-coating, spraying, painting, and
screen printing. Most of these techniques are relatively easy to carry out and require a
minimum of equipment. Polymer films of materials such as polypropylene, polystyrene
24
and poly(vinyl chloride) (PVC) can be obtained by the technique of direct isothermal
immersion of a substrate into a suitable solution of the polymer (e.g. PVC in
cyclohexanone). Material will be deposited on the immersed substrate until equilibrium is
reached between the deposition rate and the re-solution rate. Satisfactory films can also
be obtained by solution casting – allowing the evaporation of a polymer-containing
solution placed on a substrate (e.g. polystyrene in chloroform).
The technology of screen printing offers a further inexpensive method for the
preparation of films. The process consists of dispensing a paste (the ink) of the material
to be deposited on a mesh-type screen on which a desired pattern may be defined
photolithographically. The substrate is placed at a short distance beneath the screen. A
flexible wiper then moves across the screen surface, deflecting it vertically and bringing
it into contact with the substrate. This forces the paste through the open mesh areas. The
substrate is allowed to stand at ambient temperature for some time in order to enable the
paste to coalesce to form a coherent film.32
In the spraying method, a polymer solution is typically sprayed onto a pre-heated
substrate. The thickness of the coating is governed by the total exposure time and the
concentration of the spraying solution. In our case, the film thickness is controlled by the
number of repeated passes of the spray across the substrate. A large particle size
originating from insufficiently soluble polymers or a wide molecular weight distribution
may facilitate the formation of numerous heterogeneities within the microstructure of the
coating. In this work, polyethylene powder is only partially dissolved in a solvent
(toluene) to form a saturated solution which is then used to spray on to a pre-heated
substrate. The resulting thin films often have a rough surface with inconsistent thickness
measured in different spots. In fact, the thickness can vary over the surface the film by as
much as 50 %.
I.4.2 THIN FILM CHARACTERIZATION
Two main characteristics of polymer thin film quality are film hydrophobicity and
uniformity. The first parameter can be estimated by measuring a contact angle (the angle
at which liquid/vapor meets the solid surface), see Figure 1.10.
25
θ
θ
Figure 1.10 - Contact angle.
a b
Figures 1.10 (a) and 1.10 (b) demonstrate a difference in wettability. Figure 1.10 (a)
shows how a water droplet might appear on a hydrophobic surface such as wax. Figure
1.10 (b) shows how a water droplet might appear on a hydrophilic surface.
To evaluate the thin film uniformity, various techniques such as optical
microscopy, scanning electron microscopy (SEM), transmission electron microscopy
(TEM) as well as scanning probe microscopes – AFM, STM, etc. can be employed. In
26
this work, to evaluate the surface uniformity, a water droplet is placed on a surface of
polymer coated glass slide: if the surface is uniform, the droplet is observed to roll freely
over the entire surface of the film as the slide is tipped. To confirm the reliability of the
technique, SEM images were also obtained. .
27
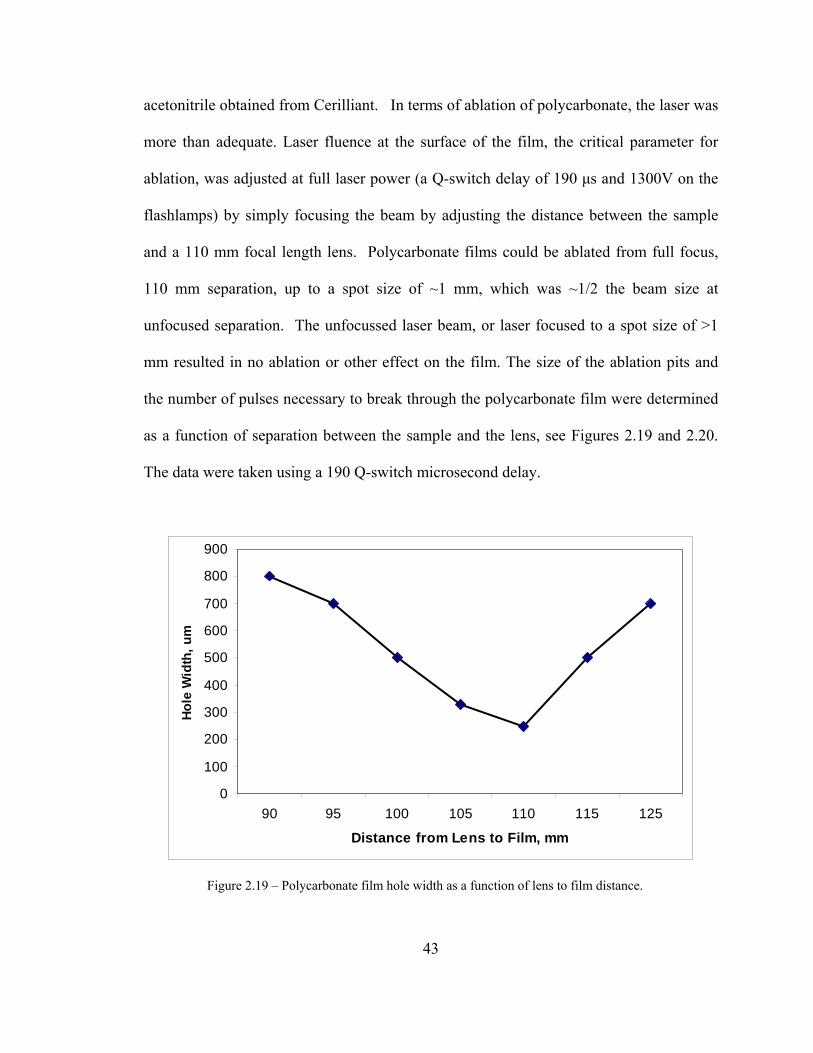
II. EXPERIMENTAL
II.1 THIN PLASTIC FILMS
II.1.1 INTRODUCTION
Electrothermal Chemical (ETC) ignition is a new technology based on the
generation of a high temperature and pressure plasma by the capacitive ablation of a
polymer liner. Polyethylene and polycarbonate are two of the more common polymers
used in ETC research. Efforts to develop spray-on technologies of polymer films have
been focused on the preparation of polyethylene and polycarbonate films, to correlate
with the ETC igniters used by the ARL (Army Research Lab) group and Varghese,30
respectively. In the spraying method, a polymer solution is sprayed on to a pre-heated
substrate and the thickness of the coating is governed by the number of repeated passes of
the spray across the substrate. Another common technique of forming thin polymer films
is spin coating. In the spin coating method, a quantity of polymer solution is placed on
the substrate which is then rotated at a fixed speed. To prepare smoother, more uniform
polymer thin films, it would be preferable to develop spin-coat technologies for both
polyethylene and polycarbonate.
Film quality was judged by several standards. The first standard was the
hydrophobicity determined by the contact angle of 10 µL water droplets placed on the
films. Figure 2.1 shows 10 µL water droplets placed on a microscope slide covered with
polycarbonate film (right) and on a droplet placed on a microscope glass slide without
film (left).
Figure 2.1 – Water droplets placed on a microscope slide covered with polycarbonate film (right) and on a droplet placed on a microscope glass slide without film (left).
In this work, the contact angle is defined as the angle between the surface and the rising
edge of the droplet. A film judged as good is less than 90 degrees, while, in poor quality
films, the angle may be as large as 140 degrees, see Figure 2.1. The second standard was
the presence of pinholes. This was determined in one of two ways. If pinholes exist, the
droplet is observed to adhere to an individual point on the surface as the sample is tipped.
If pinholes are not present the droplet freely rolls across the surface as the slide is tipped.
Another test for pinholes is the stability of the surface to the presence of water drops. If
pinholes exist, water seeps through them and below the film to wet the hydrophilic glass
surface. This undermines the film and in a matter of minutes the film tears and the droplet
Figure 2.2 – Polycarbonate film with pinholes
28
appears to be below the fragments of the film, see Figure 2.2. To confirm the reliability
of these tests, SEM images were also taken, see Figure 2.3.
29
a b
Figure 2.3 – SEM images of polyethylene films: a) film with pinholes; b) film without pinholes
The thickness of the films has been measured by using a Tencor Alpha-Step 200 surface
profiler. The device measures surface profiles by means of scanning a mechanical stylus
across the sample. The small motions of the stylus are amplified and displayed as a chart
on the computer. The thickness of the film is then determined as a difference between
two points: the surface height of the glass slide covered with polymer and the surface
height of the glass slide alone.
II.1.2 EXPERIMENTAL SETUP
SPRAYING TECHNIQUE
A 50 ml round bottom flask is attached to the sprayer unit using a standard 14/20
ground glass joint and is secured by rubber bands see Figure 2.4. The sprayer has a thick
wall 1.5 mm I.D. feed tube that extends ~ 40 mm from ground glass, is bent 90 degrees
and terminates in a 0.5 mm capillary. The capillary feeds through the wall of a 15 mm
I.D. closed-end tube that extends ~ 60 mm above the joint. The outer closed-end tube has
both a feed port for N2 pressurization and an opening in the side for pressure relief. No
sheath gas is designed into the sprayer as the polymer solutions are at, or near, saturation
and any significant loss of solvent would inhibit flow of the droplets once on the
substrate surface, resulting in rougher films.
Spraying port
N2 feed port
Flask with solution to spray
Point of pressure relief
Figure 2.4 – Sprayer. (Note that the food dye was added to allow the reader to see the normally colorless solution)
30
To spray a film, the round bottom flask is filled with polymer solution, the sprayer is
attached, a N2 flow is applied, and the pressure relief opening is covered with a finger,
see Figure 2.5. The glass substrate is heated to ~ 100 °C.
N2 hose
Sprayer
Glass slide
Heater
Figure 2.5 – Spraying technique.
SPIN-COATING TECHNIQUE
To prepare thin films by spin coating, a Laurell WS-400 B spin-coater device was
used. After a substrate is loaded on to the chuck, vacuum hold-down is engaged from the
side mounted control panel and the lid is closed, a pre-programmed process is selected
and then initiated. A 1 ml of polymer solution is placed on the substrate. The spin-coater
was programmed to operate in 2 stages. Stage one is a spin coating with a revolution rate
of 500 rpm for 5 seconds. Stage two was programmed to spin coat for 45 seconds with a
31
revolution rate of 1500 rpm. The first stage was necessary to insure that the polymer
solution coats uniformly and is not lost to walls of the
device. The program panel is shown on Figure 2.5.
Figure 2.6 – Spin-coater WS-400
Process Controller.
II.1.3 SPRAYED-ON FILMS
Polyethylene films were sprayed from a nearly saturated solution, typically
0.01364 g/ml, in toluene. The solutions were prepared by adding a pre-weighed quantity
of polyethylene powder (Alfa Aesar A10239 and Acros 178505000) to 30 ml of toluene,
and refluxed for several hours or overnight to insure dissolution of the solid.
Polyethylene solutions with concentrations significantly higher than 0.014 g/ml were too
viscous to spray and therefore were not used. Solutions with concentration significantly
lower than 0.0135 g/ml formed discontinuous films that had numerous pinholes. Images
of 8.2 µm thick polyethylene films sprayed-on at room temperature and at ~100 °C are
shown in Figure 2.6. Polyethylene films sprayed onto room temperature glass slides did
not pass any of the tests for a high quality film. These films appeared an almost opaque
32
white. They were insufficiently hydrophobic and riddled with pinholes.
33
Figure 2.7 - Polyethylene films sprayed at room
temperature (left) and at ~100 °C (right).
Films sprayed onto glass slides heated to ~ 100 °C, as measured with an optical
pyrometer, appeared more transparent and proved to be very hydrophobic, and displayed
no evidence of pinholes. Spraying at temperatures significantly above 100 °C resulted in
0
2
4
6
8
10
12
14
10 15 20 30 45 60
Thic
knes
s, u
m
Time, s
Figure 2.8 - Thickness of sprayed-on polyethylene films as a function of spraying time.
instant melting of the polymer film. Figure 2.8 is a plot of the thickness of the resulting
films as a function of spraying time.
Figure 2.9 – Polyethylene film alone (top) and polyethylene film with underlying RDX film (bottom) placed on a glass slide.
34
10
20
30
40
50
60
70
10 15 20 30 45 60
Time, s
Thic
knes
s, u
m
Figure 2.10 - Thickness of sprayed-on polyethylene films as a function of spraying time
Polyethylene films have also been sprayed onto glass slides where RDX films had
previously been prepared. The spraying of the polyethylene films had no visually
detectable effect on the morphology of the underlying RDX film, see Figure 2.9.
Polycarbonate films were prepared from a pre-weighed amount of cut
polycarbonate sheet (McMaster Carr 10mil, 85585K13) that was dissolved in 99.5%
methylene chloride (UN 1593 Acros) to yield a solution of 0.023 g/ml. Solutions with
concentrations significantly smaller than 0.023 g/ml failed to form a good quality film,
while solutions with concentrations significantly higher than 0.023 g/ml were too viscous
to spray. Pinhole free, hydrophobic films of polycarbonate can be prepared by spraying
onto a glass slide heated to ~ 100 °C. Room temperature polycarbonate films were
significantly less hydrophobic and had a large number of pinholes. Figure 2.10 is a plot
of the thickness of the resulting films as a function of spraying time. The morphology of
a sprayed-on polycarbonate film closely resembled the morphology of the polyethylene
films sprayed onto a ~ 100 °C substrate, see Figure 2.11. Polycarbonate films have also
been sprayed onto glass slides where RDX films had previously been deposited. The
spraying of the polycarbonate films had no visually detectable effect on the morphology
of the underlying RDX film, see Figure 2.11.
35
Figure 2.11 - Polycarbonate film alone (top) and polycarbonate film with underlying RDX film (bottom) placed on a glass slide.
II.1.4 SPIN-COATED FILMS
None of the efforts to spin-coat polyethylene films have been successful. Spin
coating from solution resulted in highly discontinuous films that appeared to have
crystallized at the surface of evaporating solvent droplets. This is primarily due to the
low solubility of polyethylene in all solvents investigated. In an attempt to spin-coat
molten polyethylene, a custom top cover for a spin coating device was made, see Figure
2.12. Heater wire was connected to form spirals around the glass tube to ensure melting
of the polyethylene. Once the melting point is reached the polyethylene granules, which
Figure 2.12 – Spin coating from a molten polyethylene.
Low MW polyethylene
Heating electrodes
Teflon valve
Program panel
36
are supplied from the top opening, start to melt down the tube and the Teflon valve is
opened allowing molten polymer to spin coat the glass slide.
All attempts to spin-coat from molten polyethylene produced only thick string-
like deposits (see Figure 2.13), presumably due to the high viscosity of the polymer, even
using the low molecular weight (M.W. 50,000 Acros) material.
Figure 2.13 - Molten polyethylene spin coated on a glass slide.
Polycarbonate films were readily prepared by spin-coating from methylene
chloride solutions of various concentrations. The resulting films were smooth,
continuous, hydrophobic and pinhole free, see Figure 2.14.