Technical Report Documentation Page 1. Report No. FHWA/TX-09/0-5561-1 2. Government Accession No. 3. Recipient's Catalog No. 5. Report Date October 2008 Published: December 2008 4. Title and Subtitle STUDIES TO IMPROVE THE MANAGEMENT OF REGULATORY SPEED LIMITS IN TEXAS WORK ZONES 6. Performing Organization Code 7. Author(s) Melisa D. Finley, LuAnn Theiss, Nada D. Trout and Gerald L. Ullman 8. Performing Organization Report No. Report 0-5561-1 10. Work Unit No. (TRAIS) 9. Performing Organization Name and Address Texas Transportation Institute The Texas A&M University System College Station, Texas 77843-3135 11. Contract or Grant No. Project 0-5561 13. Type of Report and Period Covered Technical Report: September 2006-August 2008 12. Sponsoring Agency Name and Address Texas Department of Transportation Research and Technology Implementation Office P.O. Box 5080 Austin, Texas 78763-5080 14. Sponsoring Agency Code 15. Supplementary Notes Project performed in cooperation with the Texas Department of Transportation and the Federal Highway Administration. Project Title: Improving Regulatory Speed Limit Management in Texas Work Zones URL: http://tti.tamu.edu/documents/0-5561-1.pdf 16. Abstract This report describes the methodology and results of analyses performed to (1) improve existing procedures on establishing and managing work zone speed limits, and (2) evaluate new technologies and strategies that can be used to better manage work zone speed limits. Field studies indicated that motorists reduce their speed adjacent to most of the work zone conditions currently used in Texas to justify reduced work zone speed limits; however, the amount of the speed reduction is dependent upon the normal non-work zone operating speed of the roadway. Based on the field study findings, researchers recommended a 5 mph maximum speed reduction for shoulder activity and lane encroachment conditions. A 10 mph maximum speed reduction is still warranted for lane closures and temporary diversions. Speed limit reductions should be discouraged on roadways with existing speed limits less than 65 mph for all conditions except lane closures when workers are in a closed lane unprotected by barrier and only a single travel lane remains open. Short term work zone speed limits are reduced speed limits that are posted only when work activity is present. When the work activity is not present, the short term work zone speed limit signs should be removed or covered; thereby allowing the legal speed limit for that segment to revert back to the normal non-work zone speed limit. The major challenge with short term work zone speed limits is the daily install/remove or uncover/cover process. Field studies and motorist surveys verified that electronic speed limit (ESL) signs and static flexible roll-up work zone speed limit signs are easily implemented, effective at reducing speeds, and understood by motorists. Based on these results, researchers recommended the use of ESL signs and static flexible roll-up work zone speed limit signs. Additional findings from all of the studies and detailed recommendations are discussed in the report. 17. Key Words Work Zone Speed Limits, Reduced Speed Limits, Work Zones, Speed Management, Electronic Speed Limit Signs, Roll-up Signs, Changeable Message Signs 18. Distribution Statement No restrictions. This document is available to the public through NTIS: National Technical Information Service Springfield, Virginia 22161 http://www.ntis.gov 19. Security Classif.(of this report) Unclassified 20. Security Classif.(of this page) Unclassified 21. No. of Pages 172 22. Price Form DOT F 1700.7 (8-72) Reproduction of completed page authorized
3. Recipient's Catalog No. 5. Report Date October 2008 Published: December 2008
4. Title and Subtitle STUDIES TO IMPROVE THE MANAGEMENT OF REGULATORY SPEED LIMITS IN TEXAS WORK ZONES
6. Performing Organization Code
7. Author(s) Melisa D. Finley, LuAnn Theiss, Nada D. Trout and Gerald L. Ullman
8. Performing Organization Report No. Report 0-5561-1 10. Work Unit No. (TRAIS)
9. Performing Organization Name and Address Texas Transportation Institute The Texas A&M University System College Station, Texas 77843-3135
11. Contract or Grant No. Project 0-5561 13. Type of Report and Period Covered Technical Report: September 2006-August 2008
12. Sponsoring Agency Name and Address Texas Department of Transportation Research and Technology Implementation Office P.O. Box 5080 Austin, Texas 78763-5080
14. Sponsoring Agency Code
15. Supplementary Notes Project performed in cooperation with the Texas Department of Transportation and the Federal Highway Administration. Project Title: Improving Regulatory Speed Limit Management in Texas Work Zones URL: http://tti.tamu.edu/documents/0-5561-1.pdf 16. Abstract
This report describes the methodology and results of analyses performed to (1) improve existing procedures on establishing and managing work zone speed limits, and (2) evaluate new technologies and strategies that can be used to better manage work zone speed limits. Field studies indicated that motorists reduce their speed adjacent to most of the work zone conditions currently used in Texas to justify reduced work zone speed limits; however, the amount of the speed reduction is dependent upon the normal non-work zone operating speed of the roadway. Based on the field study findings, researchers recommended a 5 mph maximum speed reduction for shoulder activity and lane encroachment conditions. A 10 mph maximum speed reduction is still warranted for lane closures and temporary diversions. Speed limit reductions should be discouraged on roadways with existing speed limits less than 65 mph for all conditions except lane closures when workers are in a closed lane unprotected by barrier and only a single travel lane remains open.
Short term work zone speed limits are reduced speed limits that are posted only when work activity is present. When the work activity is not present, the short term work zone speed limit signs should be removed or covered; thereby allowing the legal speed limit for that segment to revert back to the normal non-work zone speed limit. The major challenge with short term work zone speed limits is the daily install/remove or uncover/cover process. Field studies and motorist surveys verified that electronic speed limit (ESL) signs and static flexible roll-up work zone speed limit signs are easily implemented, effective at reducing speeds, and understood by motorists. Based on these results, researchers recommended the use of ESL signs and static flexible roll-up work zone speed limit signs. Additional findings from all of the studies and detailed recommendations are discussed in the report.
17. Key Words Work Zone Speed Limits, Reduced Speed Limits, Work Zones, Speed Management, Electronic Speed Limit Signs, Roll-up Signs, Changeable Message Signs
18. Distribution Statement No restrictions. This document is available to the public through NTIS: National Technical Information Service Springfield, Virginia 22161 http://www.ntis.gov
19. Security Classif.(of this report) Unclassified
20. Security Classif.(of this page) Unclassified
21. No. of Pages 172
22. Price
Form DOT F 1700.7 (8-72) Reproduction of completed page authorized
STUDIES TO IMPROVE THE MANAGEMENT OF REGULATORY SPEED LIMITS IN TEXAS WORK ZONES
by
Melisa D. Finley, P.E. Associate Research Engineer Texas Transportation Institute
LuAnn Theiss, P.E.
Associate Research Engineer Texas Transportation Institute
Nada D. Trout
Assistant Research Scientist Texas Transportation Institute
and
Gerald L. Ullman, Ph.D., P.E.
Senior Research Engineer Texas Transportation Institute
Report 0-5561-1 Project 0-5561
Project Title: Improving Regulatory Speed Limit Management in Texas Work Zones
Performed in cooperation with the Texas Department of Transportation
and the Federal Highway Administration
October 2008 Published: December 2008
TEXAS TRANSPORTATION INSTITUTE The Texas A&M University System College Station, Texas 77843-3135
v
DISCLAIMER
This research was performed in cooperation with the Texas Department of Transportation
(TxDOT) and the Federal Highway Administration (FHWA). The contents of this report reflect
the views of the authors, who are responsible for the facts and the accuracy of the data presented
herein. The contents do not necessarily reflect the official view or policies of the FHWA or
TxDOT. This report does not constitute a standard, specification, or regulation. This report is
not intended for construction, bidding, or permit purposes. The United States Government and
the State of Texas do not endorse products or manufacturers. Trade or manufacturers’ names
appear herein solely because they are considered essential to the object of this report. The
engineer in charge of the project was Melisa D. Finley, P.E. (TX-90937).
vi
ACKNOWLEDGMENTS
This project was conducted in cooperation with TxDOT and FHWA. The project was
overseen by a TxDOT Project Monitoring Committee. Carlos Ibarra served as the project
director and Wade Odell served as the Research Management Committee (RMC) 4 program
coordinator. Linden Burgess, Sherri’ Eaglin, Theresa Lopez, Darren McDaniel, Mark Olson,
Doug Skowronek, and Rebecca Wells served as project advisors. The assistance and direction
provided by these individuals over the course of the project is gratefully acknowledged.
The authors wish to acknowledge the contributions of Sandra Schoeneman, Dan Walker,
Brooke Ullman, Marcus Brewer, and Sarah Young in the design and conduct of the field studies
and motorist surveys for this project. The authors also wish to express their thanks to Jason
Richter who assisted with the project as part of the 2007 Texas A&M University Undergraduate
Transportation Scholars Program.
vii
TABLE OF CONTENTS
Page List of Figures............................................................................................................................... ix List of Tables ................................................................................................................................. x Introduction................................................................................................................................... 1
Statement of the Problem............................................................................................................ 1 Background................................................................................................................................. 2
Overview of Speed Zoning ..................................................................................................... 2 Current Speed Zoning in Texas Work Zones ......................................................................... 3 Do Slower Speeds Improve Safety? ....................................................................................... 8 How Do Motorists Drive in Work Zones?.............................................................................. 9
Contents of This Report ............................................................................................................ 10 PART 1 – Guidelines and Procedures on Establishing and Managing Work Zone Speed Limits ................................................................................................................................ 11 Chapter 1.1: Current Work Zone Speed Limit Practice in Texas ......................................... 13
Chapter 1.2: Motorist Perceptions and Reactions to Reduced Work Zone Speed Limits and Other Work Zone Conditions ................................................................................ 19
Field Studies.............................................................................................................................. 23 Study Design......................................................................................................................... 23 Study Locations .................................................................................................................... 24 Data Reduction and Analysis................................................................................................ 26 Results................................................................................................................................... 26
Summary ................................................................................................................................... 40 Motorist Survey .................................................................................................................... 40 Field Studies.......................................................................................................................... 41
Chapter 1.3: National Comparison of Work Zone Speed Limit Laws .................................. 43 Introduction............................................................................................................................... 43 Speed Limit Restrictions in Other States .................................................................................. 45
Authorization to Use Variable Speed Limits ........................................................................ 45 Summary ................................................................................................................................... 49
PART 2 – Alternative Work Zone Speed Limit Devices ......................................................... 51 Chapter 2.1: Identification of Alternative Work Zone Speed Limit Devices........................ 53
Introduction............................................................................................................................... 53 Alternative Devices................................................................................................................... 54
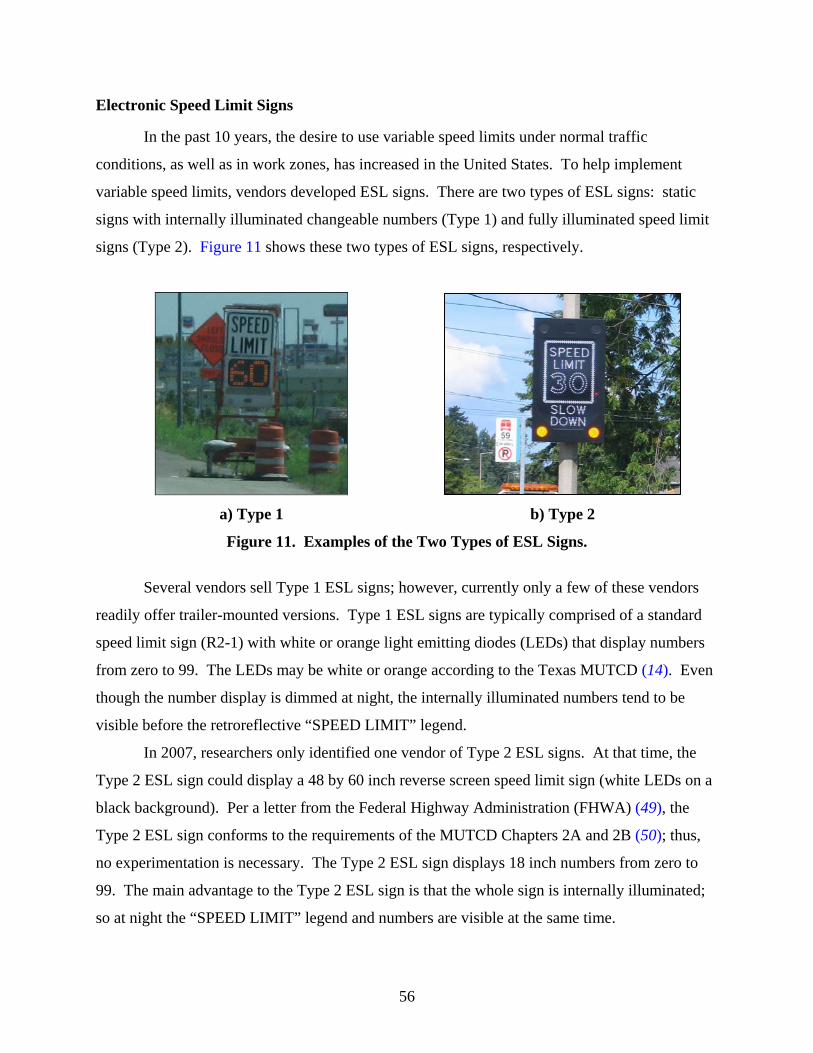
Electronic Speed Limit Signs................................................................................................ 56 Other Various Technologies ................................................................................................. 58
Evaluation Recommendations .................................................................................................. 60 Chapter 2.2: Long Term Study of Electronic Speed Limit Signs in a Work Zone............... 61
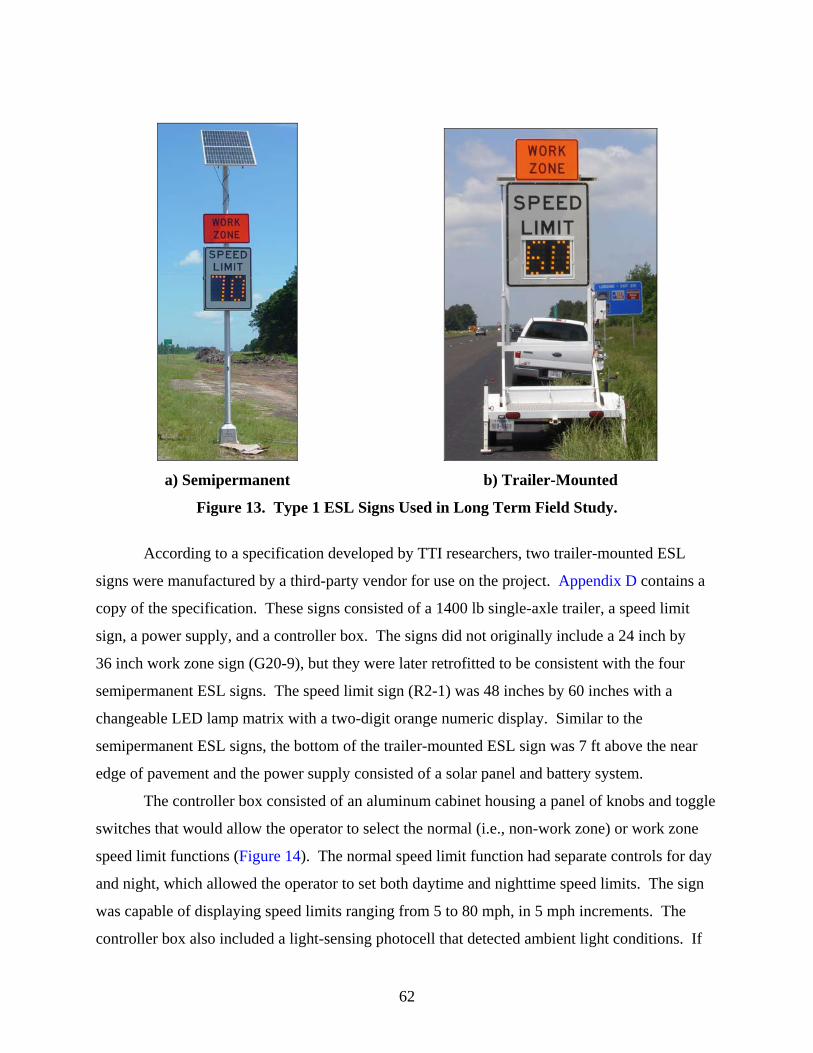
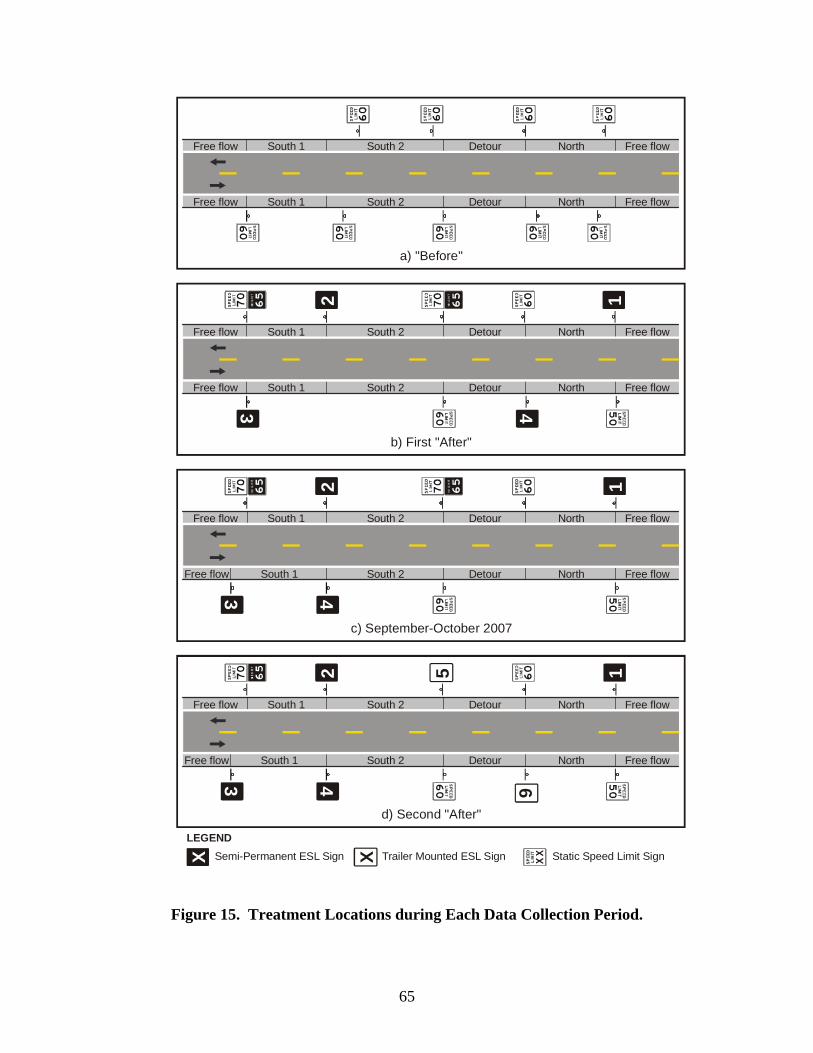
Type 1 ESL Signs ..................................................................................................................... 61 Field Study................................................................................................................................ 64
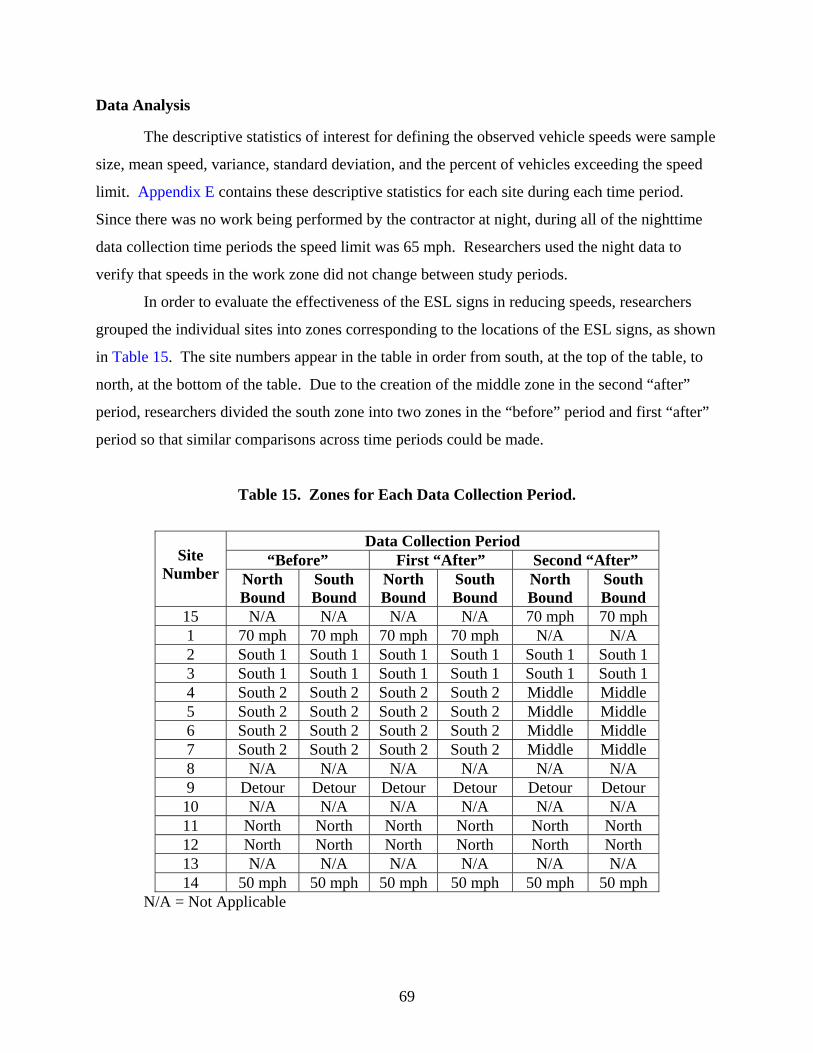
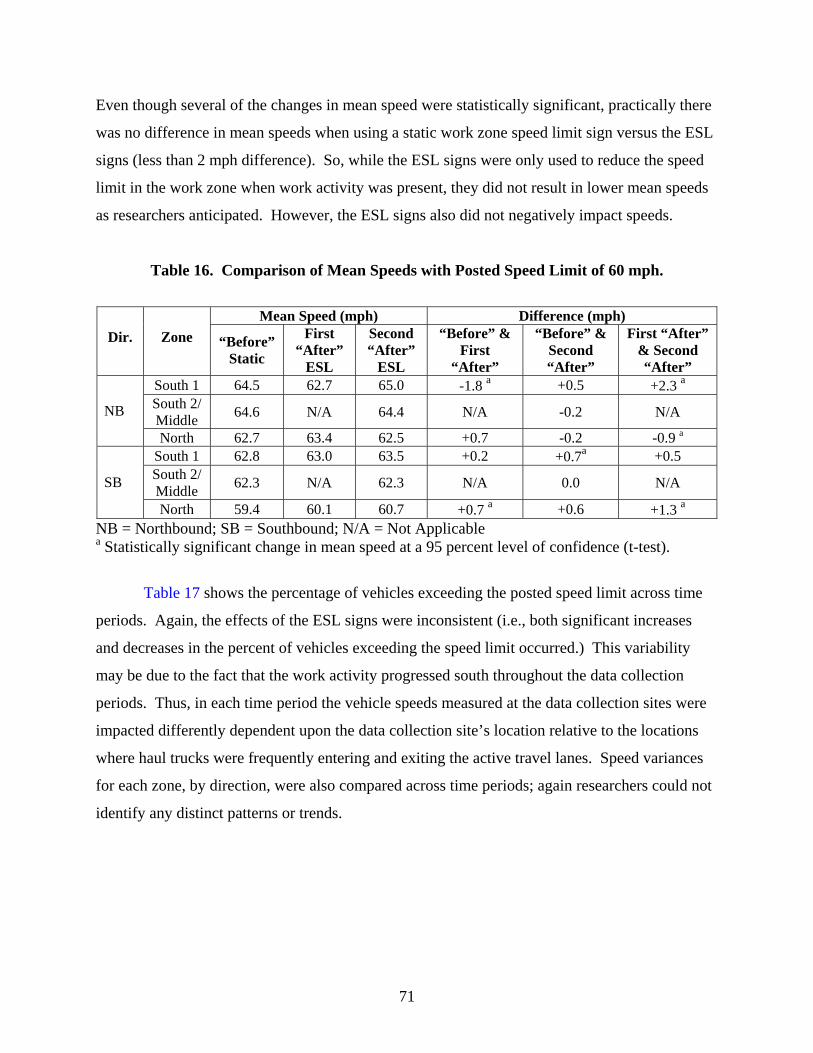
Study Design......................................................................................................................... 64 ESL Sign Utilization ............................................................................................................. 68 Data Analysis ........................................................................................................................ 69 Results................................................................................................................................... 70
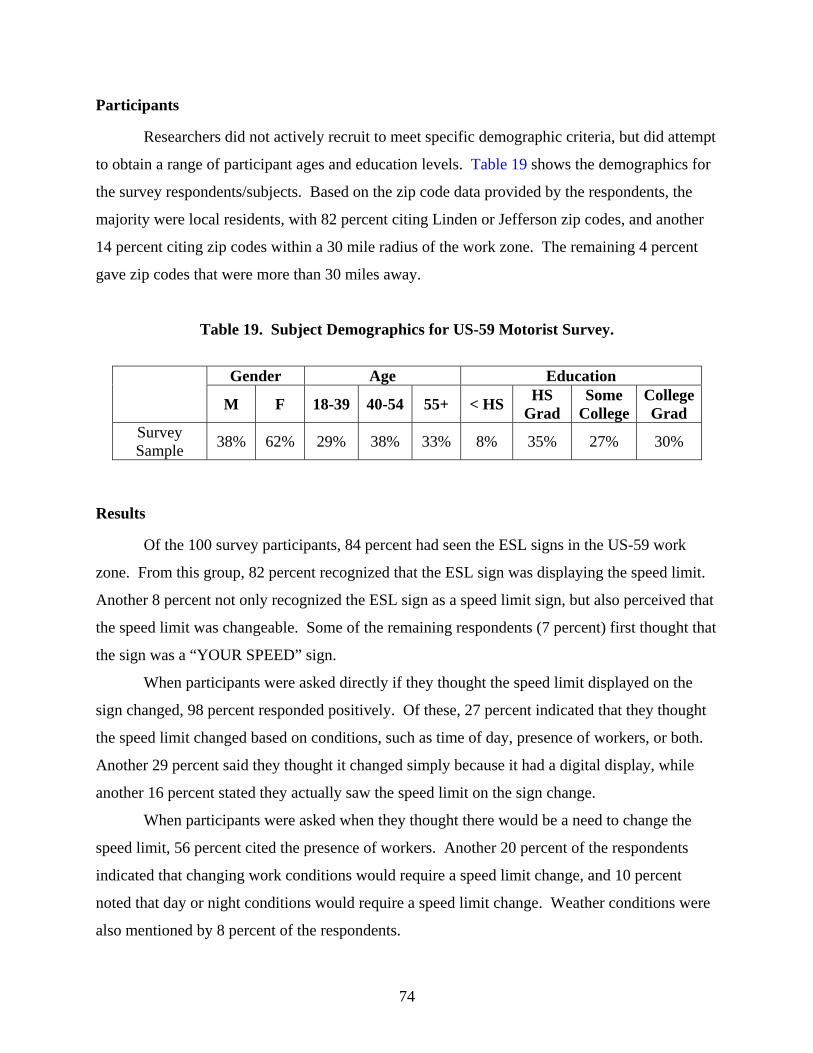
Motorist Surveys....................................................................................................................... 73 Study Design......................................................................................................................... 73 Participants............................................................................................................................ 74 Results................................................................................................................................... 74
Police Discussion Group........................................................................................................... 75 Study Design......................................................................................................................... 75 Results................................................................................................................................... 76
Summary ................................................................................................................................... 77 Chapter 2.3: Short Term Field Studies of Alternative Work Zone Speed Limit Sign Devices....................................................................................................................................................... 79
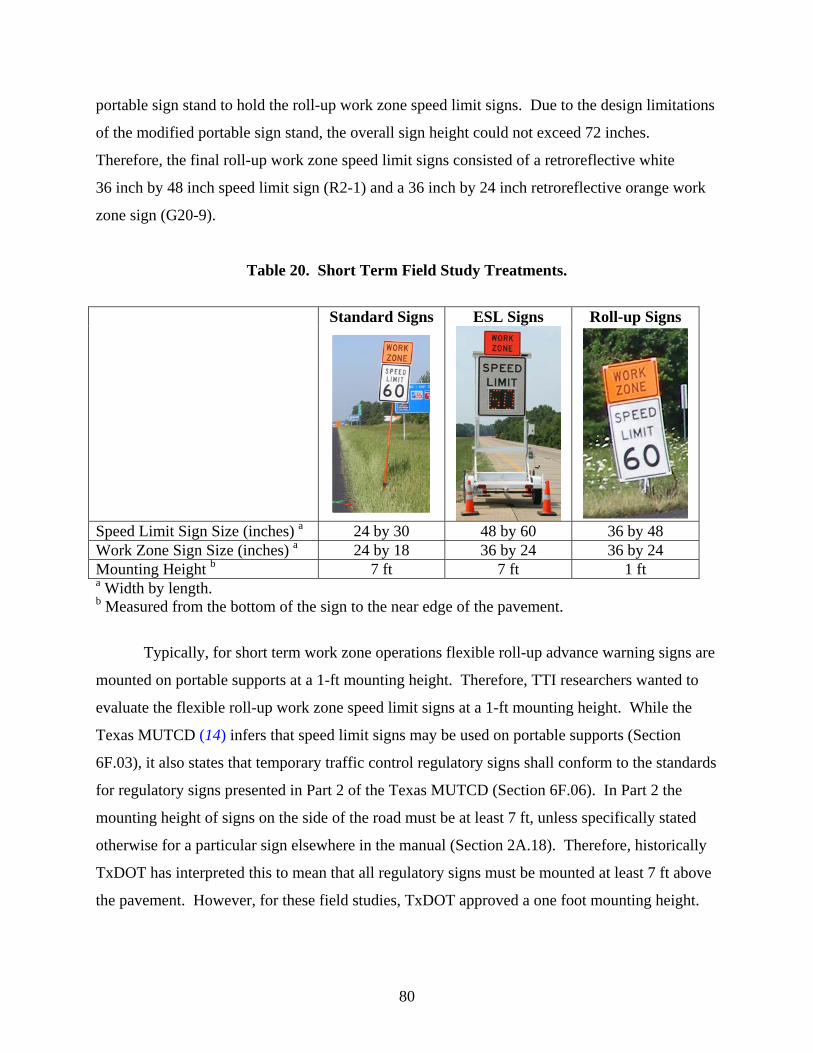
Treatments................................................................................................................................. 79 Study Locations and Study Design ........................................................................................... 81 Data Analysis ............................................................................................................................ 82 Results....................................................................................................................................... 82 Other Issues............................................................................................................................... 83 Summary ................................................................................................................................... 85
Chapter 2.4: Motorist Surveys................................................................................................... 95 Study Design and Protocol....................................................................................................... 95
Overview............................................................................................................................... 95 Survey Locations and Demographics ................................................................................... 95 Treatments............................................................................................................................. 96 Experimental Design and Protocol ....................................................................................... 96
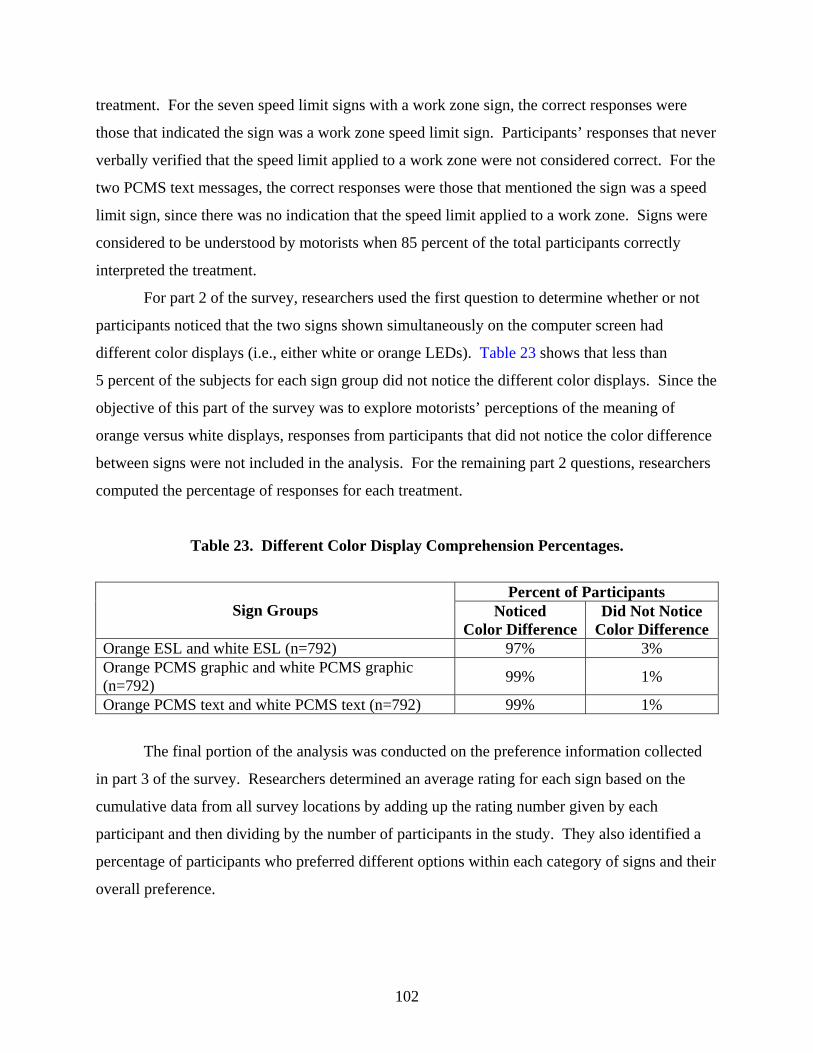
Data Analysis .......................................................................................................................... 101 Results..................................................................................................................................... 103
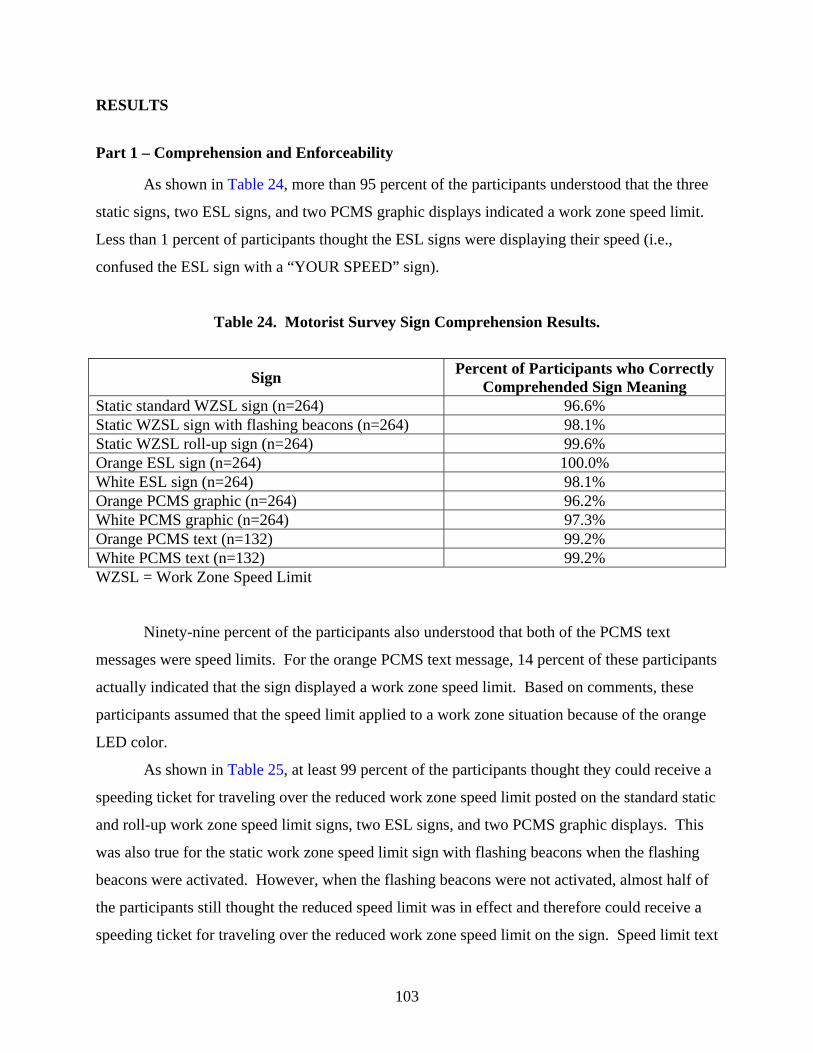
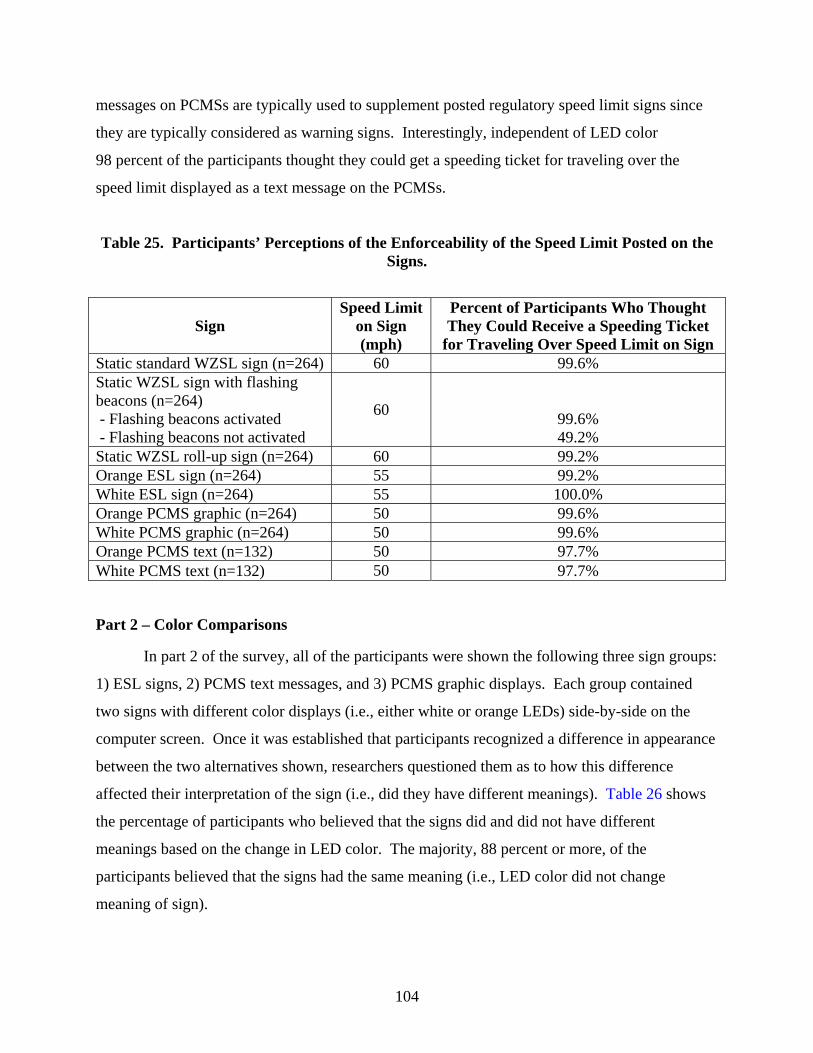
Part 1 – Comprehension and Enforceability ....................................................................... 103 Part 2 – Color Comparisons................................................................................................ 104 Part 3 – Preferences ............................................................................................................ 107 Summary ............................................................................................................................. 109
LIST OF FIGURES Page Figure 1. Percent of the Time Spent Driving in Work Zones...................................................... 22 Figure 2. Percent of Work Zones with Reduced Speed Limits.................................................... 22 Figure 3. 85th Percentile Speeds Upstream of the Work Zone..................................................... 28 Figure 4. 85th Percentile Speed Changes Downstream of the Reduced Work Zone Speed Limit
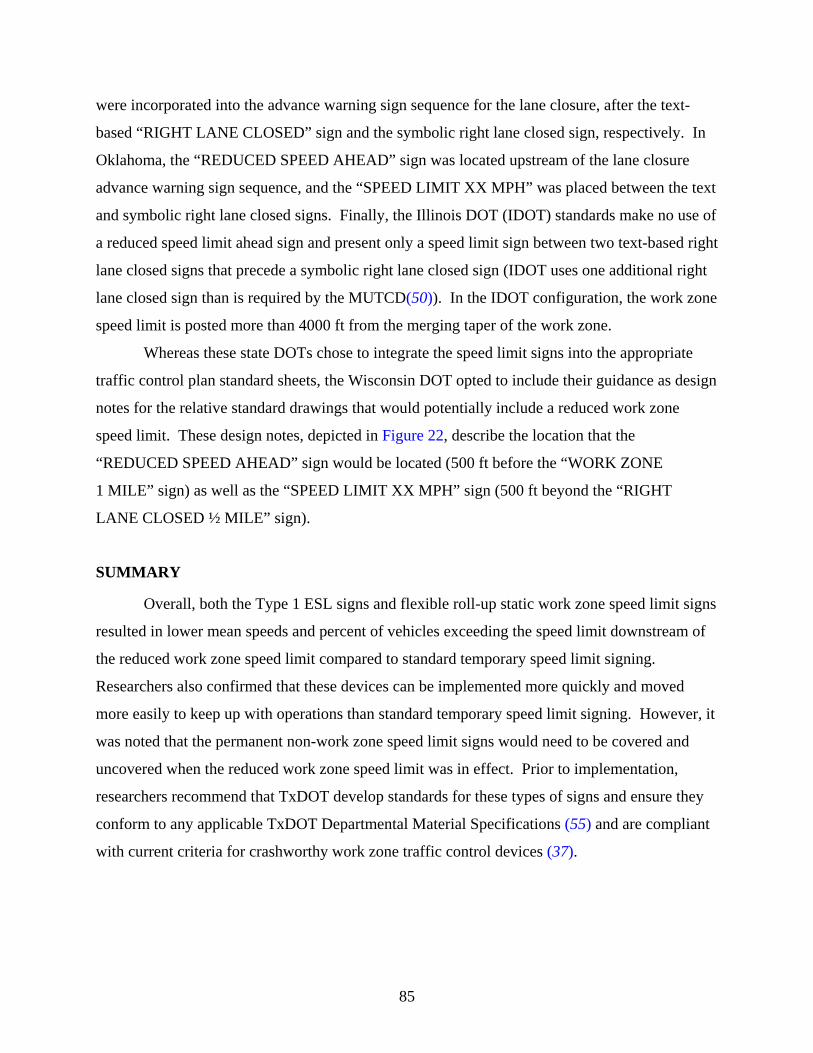
............................................................................................................................................... 29 Figure 5. Texas Transportation Code Excerpts Regarding Speed Limits (3). ............................. 44 Figure 6. Texas Statutes Regarding Covering of Work Zone Speed Limit Signs. ...................... 45 Figure 7. Speed Limit Statutes in Oklahoma (46). ...................................................................... 48 Figure 8. Speed Zoning Statutes in Minnesota (47). ................................................................... 49 Figure 9. Example of Portable Static Speed Limit Sign Used in Indiana.................................... 54 Figure 10. Example of Flexible Roll-up Work Zone Speed Limit Sign...................................... 55 Figure 11. Examples of the Two Types of ESL Signs................................................................. 56 Figure 12. Example of Speed Limit Message on a PCMS. ......................................................... 59 Figure 13. Type 1 ESL Signs Used in Long Term Field Study................................................... 62 Figure 14. Trailer-Mounted ESL Sign Controller Box................................................................ 63 Figure 15. Treatment Locations during Each Data Collection Period......................................... 65 Figure 16. Excerpt from I-30 Traffic Control Plans – Lane Closure with Reduced Work Zone
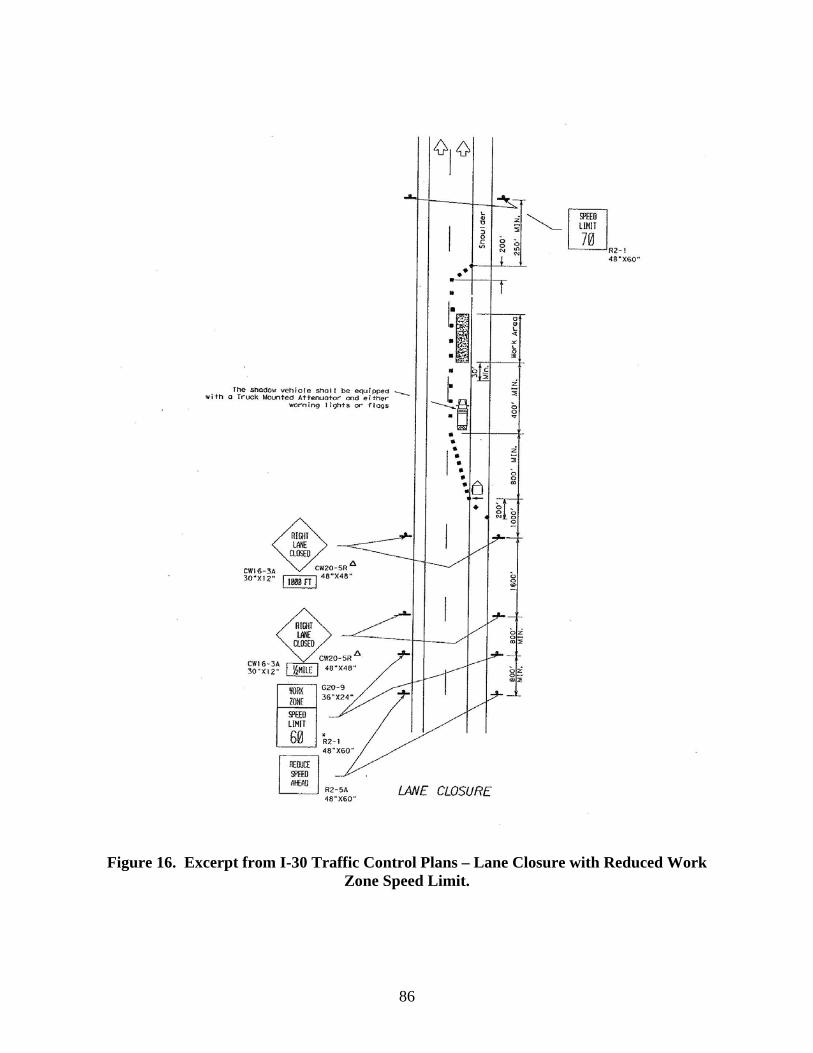
Speed Limit. .......................................................................................................................... 86 Figure 17. Excerpt from I-30 Traffic Control Plans – TCP-(6-1)-98. ......................................... 87 Figure 18. Typical Application of Lane Closure on a Multilane Road with a Reduced Speed
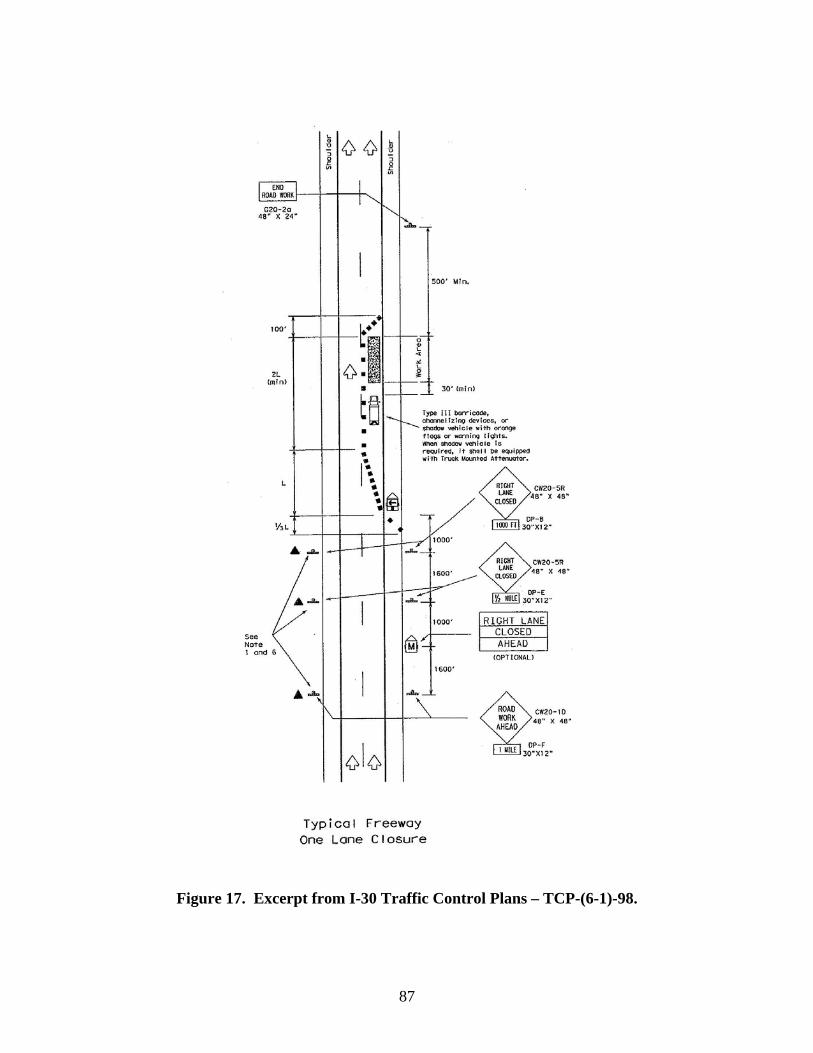
Limit in Minnesota................................................................................................................ 88 Figure 19. Typical Application of Lane Closure on a Multilane Road with a Reduced Speed
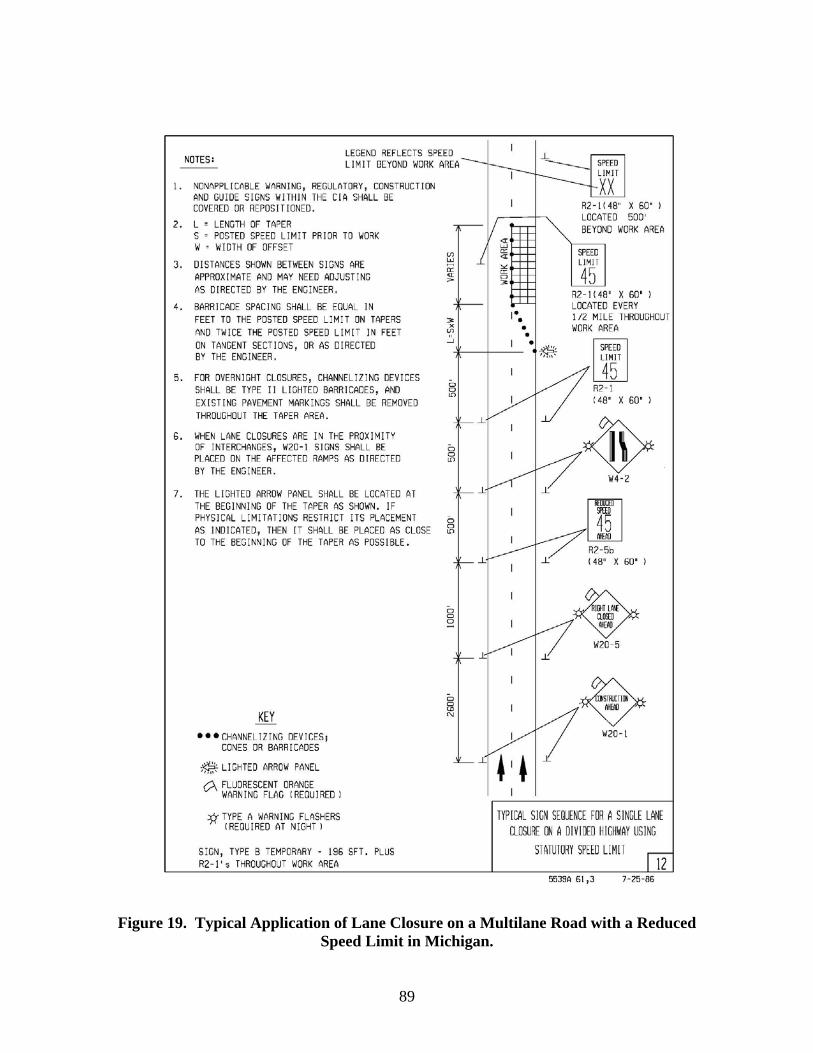
Limit in Michigan. ................................................................................................................ 89 Figure 20. Typical Application of Lane Closure on a Multilane Road with a Reduced Speed
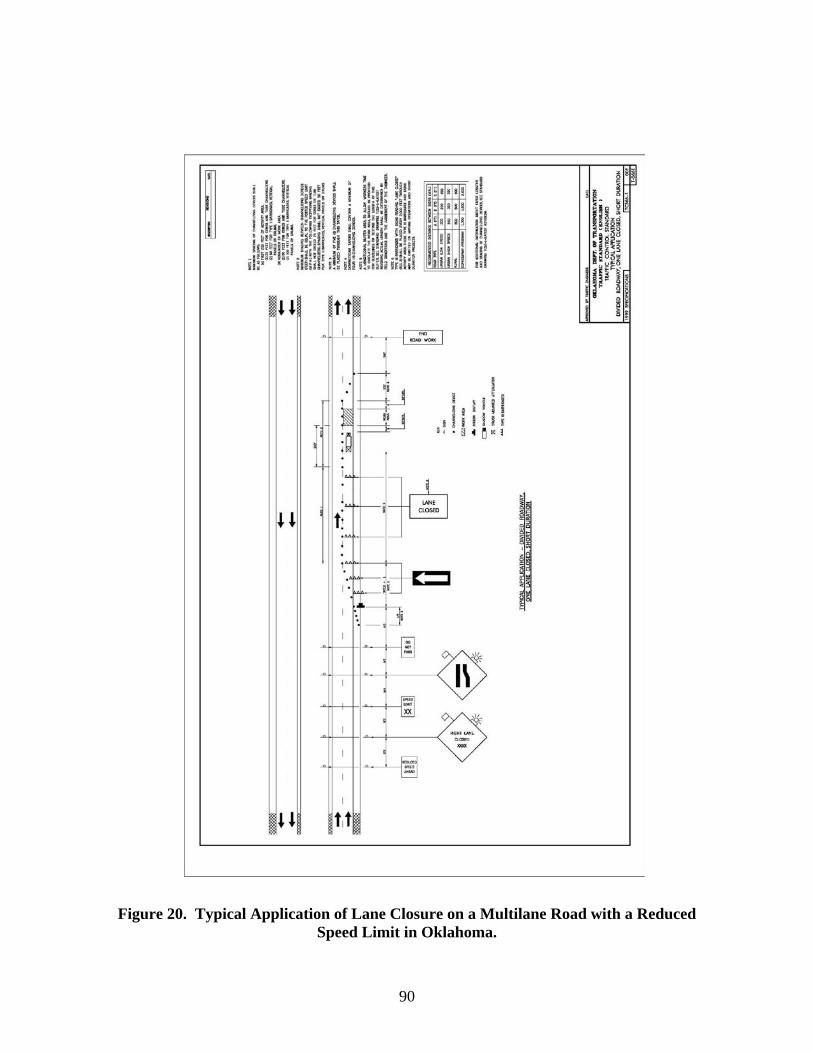
Limit in Oklahoma................................................................................................................ 90 Figure 21. Typical Application of Lane Closure on a Multilane Road with a Reduced Speed
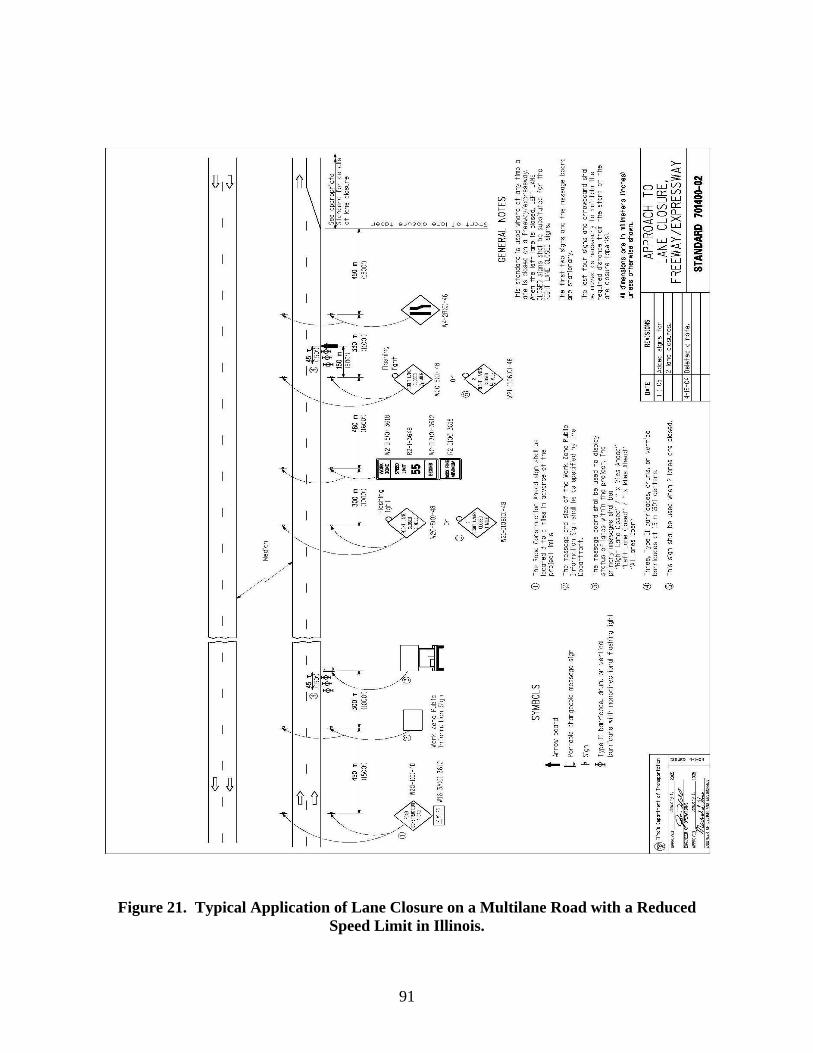
Limit in Illinois. .................................................................................................................... 91 Figure 22. Design Notes for Typical Applications with a Reduced Speed Limit in Wisconsin
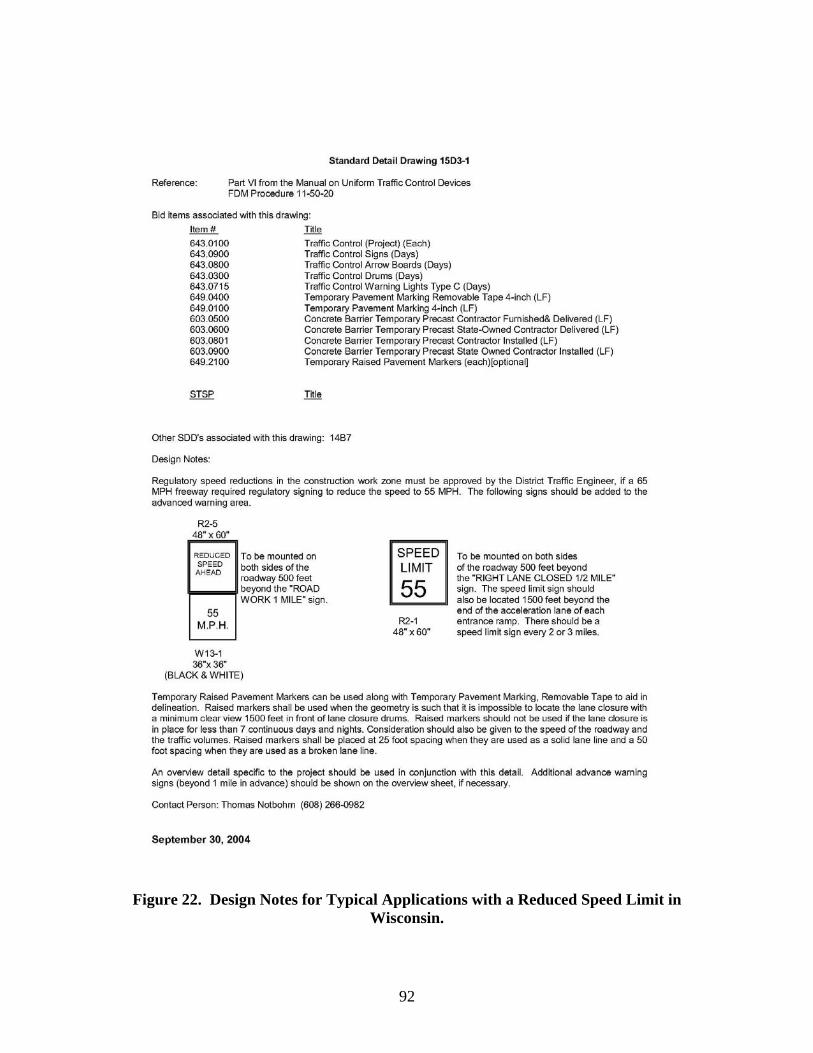
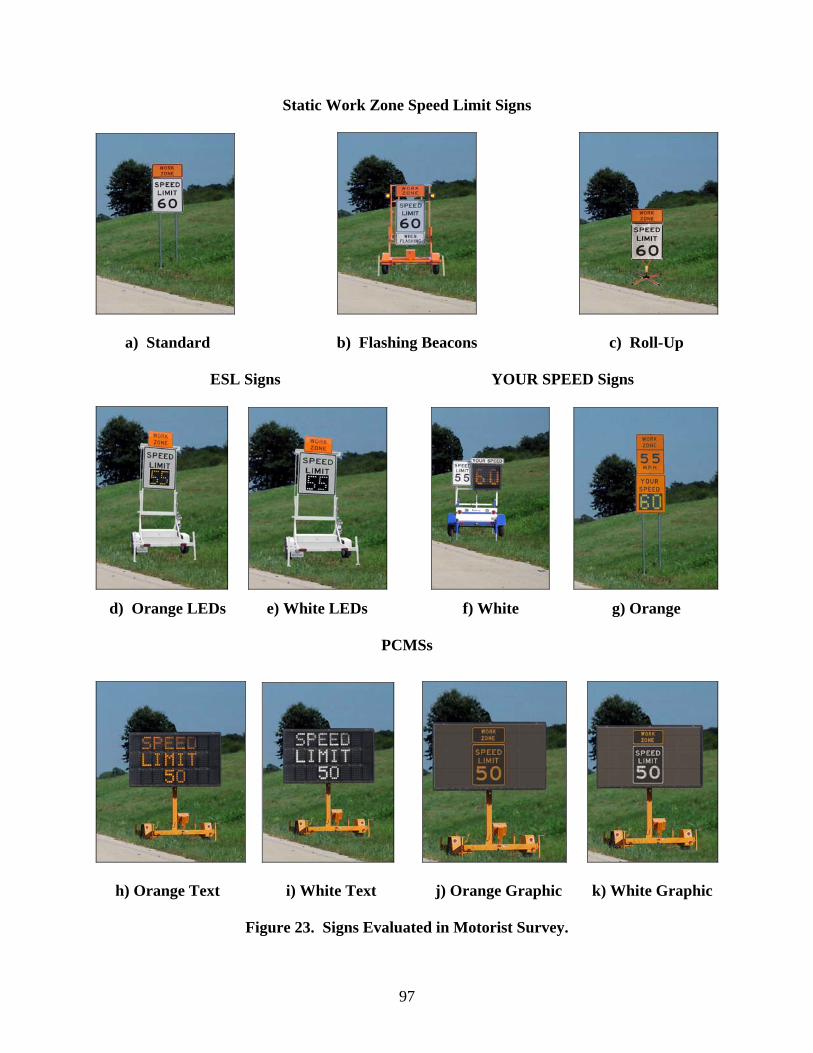
............................................................................................................................................... 92 Figure 23. Signs Evaluated in Motorist Survey. .......................................................................... 97 Figure 24. Example of Display Shown on Computer Screen in Part 1........................................ 99
x
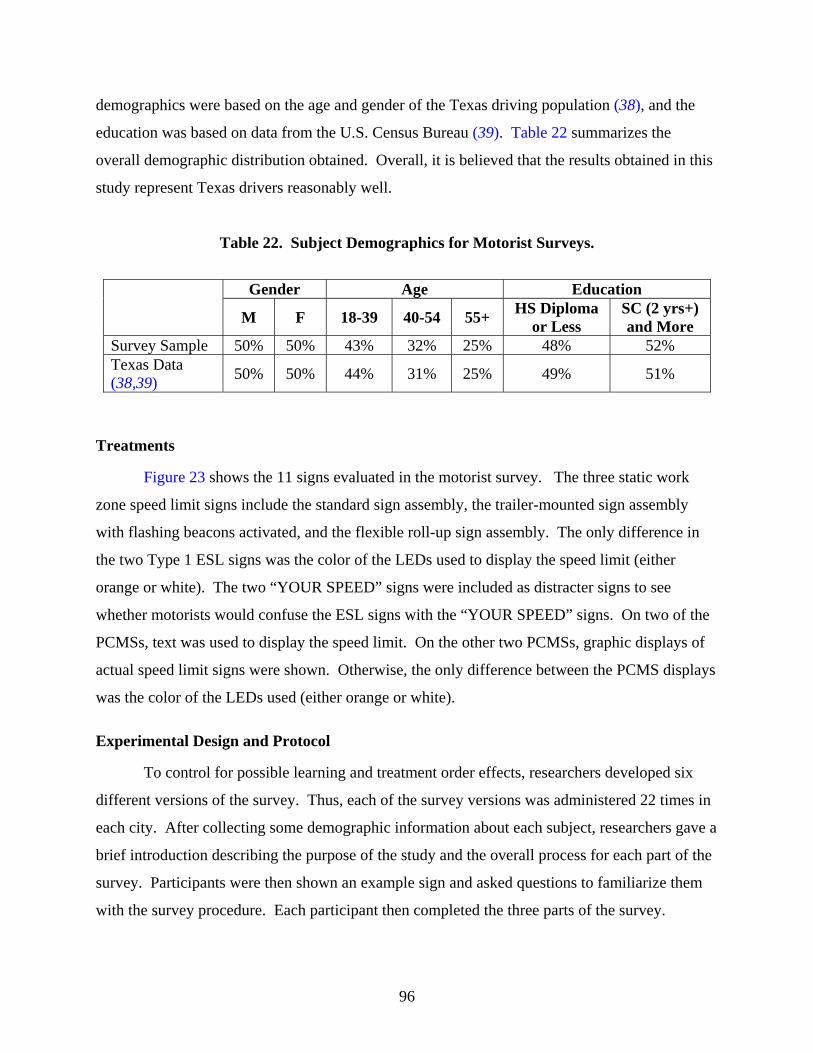
LIST OF TABLES Page Table 1. TxDOT Work Zone Regulatory Speed Limit Determination Guidelines (16). ............... 5 Table 2. Percentage of Reduced Speed Limit Requests by Type of Work Zone Condition........ 16 Table 3. Percentage of Reduced Speed Limit Requests by Type of Work Zone Factor Present
............................................................................................................................................... 16 Table 4. Subject Demographics for Work Zone Speed Limit Motorist Survey. ......................... 21 Table 5. Work Zone Conditions for which Motorists Would Slow Down.................................. 23 Table 6. Field Study Locations and Characteristics..................................................................... 25 Table 7. Conditions and Factors Used to Justify Speed Limit Reductions at Field Study
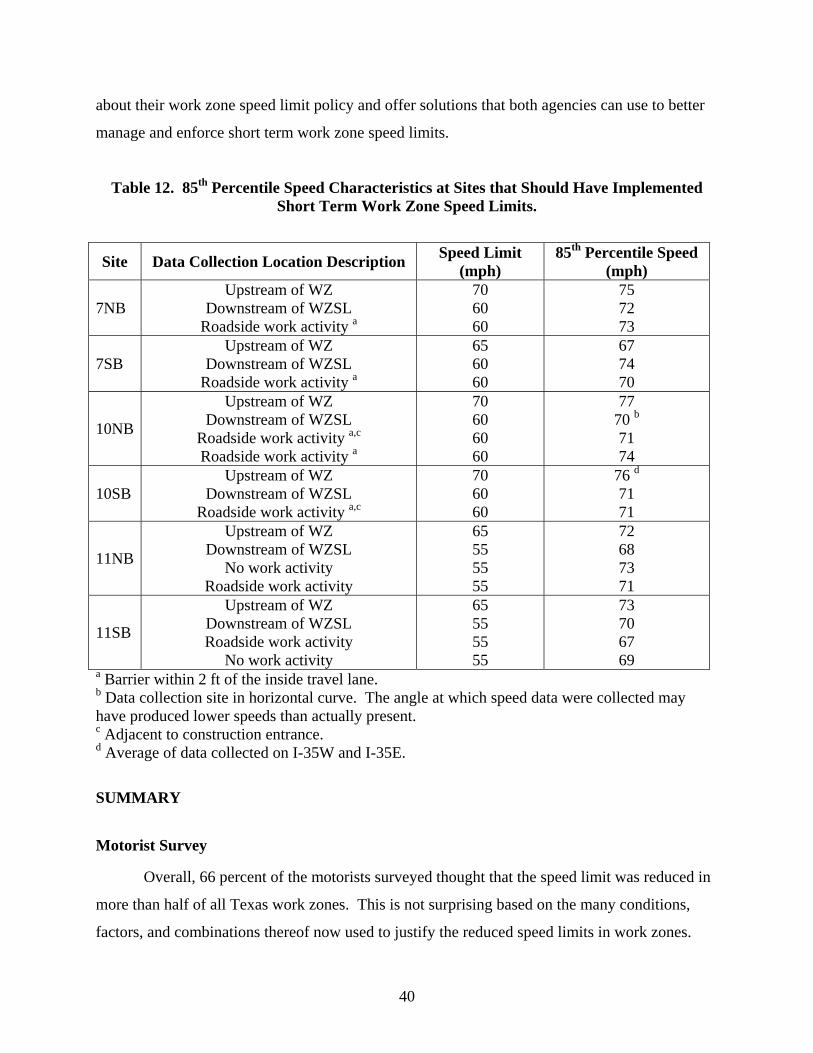
Locations............................................................................................................................... 27 Table 8. 85th Percentile Speed Changes at Lane Encroachment.................................................. 31 Table 9. 85th Percentile Speed Changes at Lane Closures. .......................................................... 34 Table 10. 85th Percentile Speed Changes at Temporary Diversions............................................ 37 Table 11. 85th Percentile Speed Changes at Unexpected Conditions. ......................................... 38 Table 12. 85th Percentile Speed Characteristics at Sites that Should Have Implemented Short
Term Work Zone Speed Limits. ........................................................................................... 40 Table 13. Statutes in VSL States Explicitly Authorizing VSLs. ................................................. 46 Table 14. Statutes in VSL States without Explicit Authorization of VSLs. ................................ 47 Table 15. Zones for Each Data Collection Period. ...................................................................... 69 Table 16. Comparison of Mean Speeds with Posted Speed Limit of 60 mph. ............................ 71 Table 17. Comparison of Percent of Vehicles Exceeding the Posted Speed Limit of 60 mph.... 72 Table 18. Comparison of Mean Speeds with ESL Display at 70 mph and 60 mph..................... 72 Table 19. Subject Demographics for US-59 Motorist Survey..................................................... 74 Table 20. Short Term Field Study Treatments............................................................................. 80 Table 21. Short Term Field Study Results................................................................................... 83 Table 22. Subject Demographics for Motorist Surveys............................................................... 96 Table 23. Different Color Display Comprehension Percentages............................................... 102 Table 24. Motorist Survey Sign Comprehension Results.......................................................... 103 Table 25. Participants’ Perceptions of the Enforceability of the Speed Limit Posted on the Signs
............................................................................................................................................. 104 Table 26. Percentage of Responses to Question “Do These Signs Have the Same Meaning?”
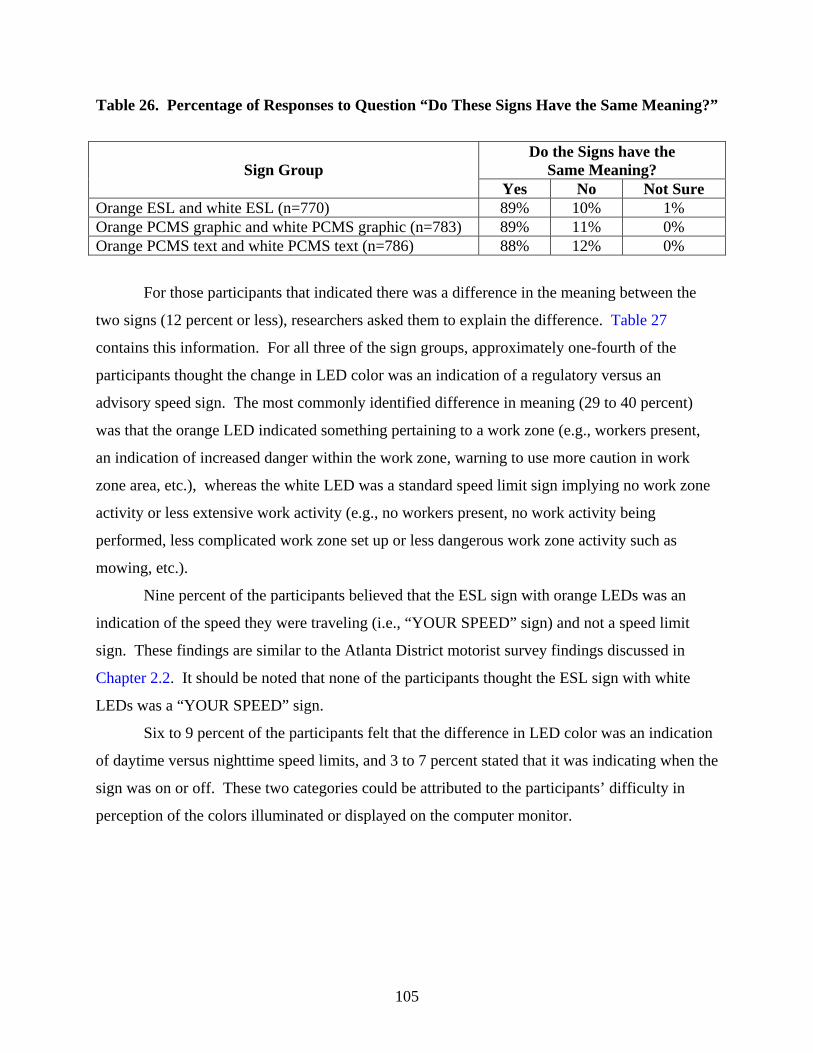
............................................................................................................................................. 105 Table 27. Percentage of Participants that Identified Differences in Sign Meanings. ................ 106 Table 28. Percentage of Responses to Question “Do You Think You Could Get a Speeding
Ticket if You Continue Going 70 mph?”............................................................................ 107 Table 29. Average Rating of Work Zone Speed Limit Sign Alternatives. ................................ 108 Table 30. Participant Preference Percentages for Work Zone Speed Limit Sign Alternatives
In 2005, the Texas Legislature passed House Bill 1925, which instructed the Texas
Department of Transportation (TxDOT) and highway contractors to remove or cover reduced
regulatory speed limit signs in work zones whenever no hazards that necessitate the need for a
reduced speed limit are present. Although TxDOT’s speed zoning procedures for work zones
already allowed for this, the law placed additional emphasis on proper management of reduced
regulatory speed limits in work zones.
Unlike speed zoning for permanent roadway segments, the actual speeds at which
motorists will travel within a particular work zone cannot be accurately predicted prior to the
establishment of that work zone on the roadway. Thus, TxDOT’s procedures for determining
whether or not a reduced regulatory speed limit in a work zone is warranted take into
consideration the type of work activity and a number of other site-specific factors. Undoubtedly,
an improved understanding of the relationship between factors used to justify reduced work zone
speed limits and motorist perceptions of the need to reduce their speed could improve the speed
limit selection process. However, which factors are actually perceived as more hazardous by
motorists and therefore result in slower speeds is still not well understood. Research was needed
to improve existing guidance and procedures on establishing and managing work zone speed
limits, including a better understanding of the factors that should be used to determine the need
for reduced speed limits.
If the reduced speed limits are not necessary for the safe operation of traffic during
certain construction operations or those days and hours the contractor is not working, the
regulatory construction speed limit signs should be made inoperative by moving the signs to the
edge of the right of way and facing them away from the roadway or by covering the signs when
the reduced speed limits are not necessary. The daily install/remove or uncover/cover process of
signs represents an additional task for the contractor that reduces overall work productivity, and
thus some contractors may simply choose not to cover or remove signs. In addition, the potential
exists for the contractor to simply forget to cover or remove signs when the reduced speed limit
is not appropriate. Therefore, research was also needed to identify and evaluate new
technologies and strategies that can be used to better manage work zone speed limits in Texas.
2
This report describes the efforts and results of a research project that examines both of these
issues.
BACKGROUND
Overview of Speed Zoning
Most transportation professionals view the setting of appropriate regulatory speed limits
on all publicly traveled roadways, including those under repair or reconstruction, as an important
tool in promoting safe and efficient operations on the highway system (1). Properly set speed
limits are believed to provide unfamiliar drivers with an indication of speeds that are considered
to be safe and reasonable for that section of roadway, to reduce speed variation between vehicles
and thus improve safety, and to provide a basis for enforcement to identify unreasonable drivers
and issue citations. Texas law requires that drivers never exceed speeds that are safe and prudent
for conditions, regardless of whether the posted speed limit indicates a higher speed is allowable
(2). Exceeding a posted regulatory speed limit on a section of highway is considered prima facie
evidence that the speed being traveled is not reasonable and prudent, and is therefore unlawful.
The Texas Transportation Commission (the Commission) has legal authority to set the
maximum speed limits on a particular roadway section, based on the results of an engineering
and traffic investigation (3). The responsibility for conducting the engineering and traffic
investigations lies with TxDOT. TxDOT has formalized the procedures for establishing speed
zones (as well as advisory speeds) on all roadways in the state (4). In most cases, the
establishment of a speed zone is predicated on the assumption that most drivers operate their
vehicles in a safe, reasonable, and prudent manner. The speeds that the majority of drivers
choose to travel on a given roadway segment are therefore considered to be an indication of a
safe and reasonable speed. The 85th percentile speed, the speed at which 85 percent of drivers
travel at or below at a given point on the roadway, is commonly taken to be the maximum speed
considered safe and reasonable for that segment by the majority of drivers. This driver-defined
maximum safe speed can then be adjusted slightly if necessary based on site factors such as crash
history, narrow lane widths, or horizontal or vertical curvature that may limit sight distance (4).
A speed limit to the nearest 5 mile per hour (mph) increment of that maximum safe speed is then
typically requested for approval by the Commission.
3
Even though the speed limit may be based on the 85th percentile speed, many studies
have reported that the speed limit is usually significantly lower than the measured 85th percentile
value. For example, the Institute of Transportation Engineers (ITE) (5) found that for roadways
with posted speed limits of 45 mph and below, most of the measured speeds are higher than the
posted speed limit. When the posted speed limit is 55 mph or more, about half of the measured
speeds are above the posted speed limit. This indicates that there is very little motorist
compliance with existing speed limits. This may be due in part to the difficulty with predicting
operating speeds (and thus the speed limit) based on the roadway geometry and roadside features
(6,7,8,9,10,11,12).
Statutory limits, established by legislation at the national, state, or municipal level, are
another way of setting speed limits. These limits are typically applied to a category of highways,
vehicles, or period of time. Examples include the revoked 55 mph national speed limit,
differential speed limits for passenger cars and commercial vehicles, and a maximum nighttime
speed limit.
Current Speed Zoning in Texas Work Zones
Although the above procedure works well for permanent roadway segments, a different
approach must be taken when determining the speed limit to be established on a roadway
segment that is undergoing repair, rehabilitation, or reconstruction, since one cannot measure
actual work zone driving speeds prior to the establishment of the work zone itself. The Texas
Administrative Code (TAC) (13), Texas Manual on Uniform Traffic Control Devices (MUTCD)
(14), and TxDOT Procedures for Establishing Speed Zones (4) all indicate that traffic control
through construction and maintenance work zones should be designed on the assumption that
motorists will only reduce their speeds through the work zone if they clearly perceive a need to
do so. Reduced speed limits in work zones should be avoided as much as practical, although
these decisions require engineering judgment depending on the nature of the project and other
factors which affect the safety of the traveling public and construction workers. Regulatory
construction speed limits should only be established where speed control is of major importance
and adequate enforcement is available. In addition, reduced speed limits should only be posted
in the specific portion of the work zone where conditions or restrictive features are present, not
throughout the entire project.
4
Unfortunately, trying to predict whether a given set of work zone conditions will actually
result in lower travel speeds is extremely difficult. There have been a few attempts to try and
model travel speeds based on the roadway and work zone characteristics present, but only for a
very limited set of conditions (15). Typically the selection of the maximum safe speed is based
on consideration of safe stopping sight distances, construction equipment crossings, the nature of
the construction project, and any other factors which are believed to affect the safety of the
traveling public and construction workers. TxDOT has adopted policies and procedures for
determining if a reduced regulatory speed limit should be established in a construction work zone
(16). The procedure takes into consideration the type of work activity and a number of other
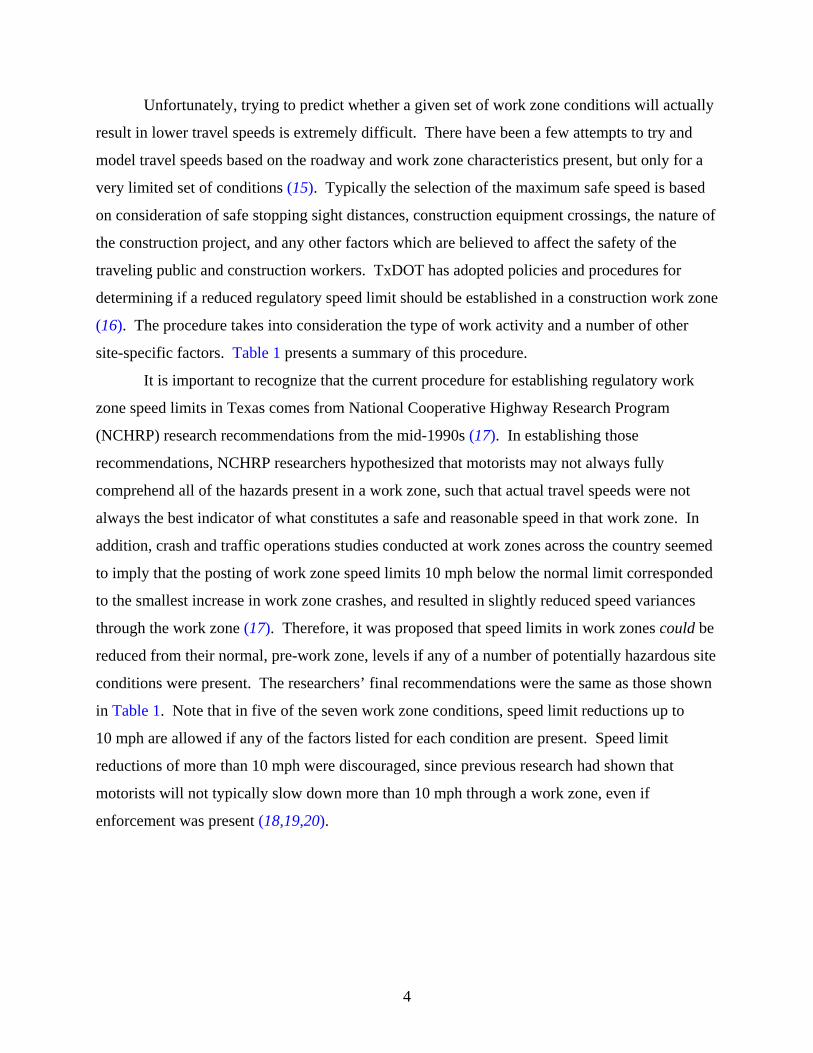
site-specific factors. Table 1 presents a summary of this procedure.
It is important to recognize that the current procedure for establishing regulatory work
zone speed limits in Texas comes from National Cooperative Highway Research Program
(NCHRP) research recommendations from the mid-1990s (17). In establishing those
recommendations, NCHRP researchers hypothesized that motorists may not always fully
comprehend all of the hazards present in a work zone, such that actual travel speeds were not
always the best indicator of what constitutes a safe and reasonable speed in that work zone. In
addition, crash and traffic operations studies conducted at work zones across the country seemed
to imply that the posting of work zone speed limits 10 mph below the normal limit corresponded
to the smallest increase in work zone crashes, and resulted in slightly reduced speed variances
through the work zone (17). Therefore, it was proposed that speed limits in work zones could be
reduced from their normal, pre-work zone, levels if any of a number of potentially hazardous site
conditions were present. The researchers’ final recommendations were the same as those shown
in Table 1. Note that in five of the seven work zone conditions, speed limit reductions up to
10 mph are allowed if any of the factors listed for each condition are present. Speed limit
reductions of more than 10 mph were discouraged, since previous research had shown that
motorists will not typically slow down more than 10 mph through a work zone, even if
enforcement was present (18,19,20).
5
Table 1. TxDOT Work Zone Regulatory Speed Limit Determination Guidelines (16).
Condition Maximum
Speed Limit Reduction
Factors That Justify Speed Limit Reduction
Roadside Activity (greater than 10 ft from traveled way)
None • None
Shoulder Activity (2 to 10 ft from traveled way)
10 mph • Workers present for extended periods within 10 ft of travel lane(s) not protected by barriers
• Horizontal curvature that might increase vehicle encroachment rate Lane Encroachment (from edge to within 2 ft of traveled way)
10 mph • Workers present for extended periods within 2 ft of travel lane(s) not protected by barriers
• Horizontal curvature that might increase vehicle encroachment rate • Barrier or pavement edge drop off within 2 ft of travel lane(s) • Reduced design speed for stopping sight distance • Unexpected conditions
Moving Activity on Shoulder
None • None
Lane Closure (between centerline and edge of traveled way)
10 mph • Workers present for extended periods in the closed lane unprotected by barriers
• Lane width reduction of 1 ft or more with a resulting lane width of less than 11 ft
• TCDs encroaching on a lane open to traffic or in a closed lane within 2 ft of the edge of the open lane
• Reduced design speed for taper length or speed change lane length • Barrier or pavement edge drop off within 2 ft of travel lane(s) • Reduced design speed for horizontal curve • Reduced design speed for stopping sight distance • Traffic congestion created by a lane closure • Unexpected conditions
Temporary Diversion 10 mph • Lane width reduction of 1 ft or more with a resulting lane width of less than 11 ft
• Reduced design speed for detour roadway or transitions • Unexpected conditions
Centerline or Lane Line Encroachment
10 mph • Workers present on foot for extended periods in the travel or closed lanes unprotected by barriers
• Remaining lane plus shoulder width is less than 11 ft • Reduced design speed for taper length or speed change lane length • Barrier or pavement edge drop off within 2 ft of travel lane(s) • Reduced design speed for horizontal curve • Reduced design speed for stopping sight distance • Traffic congestion created by a lane closure • Unexpected conditions
TCDs = Traffic Control Devices
6
The approach presented by NCHRP researchers and used by TxDOT is logical. In fact,
speed zoning procedures in non-work zone locations also allow for speed limits lower than those
implied by actual travel speeds to be posted on a roadway when other factors, such as higher than
normal crash rates, exist to suggest that drivers may not be fully perceiving the true hazard of the
location and thus are driving too fast for conditions (4). However, locations where the need for
lower speed limits below actual travel speeds exists are the same locations where enforcement
should be targeted in order to encourage motorist compliance and to raise motorist awareness of
their surroundings.
According to the TAC and TxDOT procedures, if the reduced speed limits are not
necessary for the safe operation of traffic during certain construction operations or those days
and hours the contractor is not working, the regulatory construction speed limit signs should be
made inoperative by moving the signs to the edge of the right of way and facing them away from
the roadway or by covering the signs when the reduced speed limits are not necessary (4,13). As
also noted in the TAC, leaving speed limit signs in place when not needed has at least three
adverse effects:
• drivers ignore the signs, and by doing so, they are subject to citation;
• respect for all speed limit signs is lessened; and
• the law-abiding driver becomes a traffic hazard by observing the reduced speed.
To address this concern, TxDOT has identified both long/intermediate term and short
term regulatory work zone speed limits (21). Long/intermediate term limits are to be included in
the design of the traffic control plan when restricted geometrics with a lower design speed are
present and the modification of the geometrics to a higher design speed is not feasible.
Furthermore, long/intermediate term speed limits are said to be appropriate if work activity at the
project occurs for more than 12 hours at a time continuously, or if any of the following
conditions are present:
• rough road or damaged pavement surface,
• substantial alterations of roadway geometrics (diversions),
• construction detours,
• grade,
7
• width, and
• other conditions readily apparent to the driver.
As long as any of these conditions exist, the work zone speed limit signs should remain in place.
Short term work zone speed limits, on the other hand, are to be included in the design of
the traffic control plans when workers or equipment are not behind concrete barriers, work
activity is within 15 ft of the pavement edge, or work is actually occurring on the pavement. In
these situations, short term work zone speed limit signs should be posted and visible to the
motorists only when work activity is present. Work activity in the area of reduced speed should
be less than 12 consecutive hours. When work activity is not present, signs should be covered
with an approved sign cover or removed from the work area. According to TxDOT standards,
turning the signs from view or laying signs over or down is not an allowable method of
indicating that the short term work zone speed limit is not in effect (21). The use of short term
speed limits has been emphasized in recent legislation. According to the latest language in the
Texas Transportation Code, Section 201.907 (22):
“The department shall remove or cover or require the removal or covering of a
sign that restricts the speed limit in a construction or maintenance work zone
during any period when no hazard exists that dictates the need for a restricted
speed limit.”
Although TxDOT has allowed short term work zone speed limits to be used for several
years, the addition of this language suggests public frustration with how work zone speed limits
are currently being applied and perceptions that reduced speed limits are in effect more often
than they should be within highway work zones.
One challenge with current TxDOT procedures is in the implementation of the
appropriate type of work zone speed limit (long/intermediate term versus short term) to
conditions and factors present at a particular work zone. As noted previously, the use of short
term work zone speed limits is appropriate where the justifications for a lower limit (unprotected
workers, presence of work activity near or on the travel lanes) exist for time periods less than
12 hours duration. The speed limit signs in these types of work zones are to be removed or
covered at the end of each work activity period, thereby allowing the legal speed limit for that
segment to revert back to the normal non-work zone speed limit.
8
It is important to recognize that the daily install/remove or uncover/cover process of signs
represents an additional task for the contractor that reduces overall work productivity. In
addition, the potential exists for the contractor to forget or simply choose not to cover or remove
signs. In effect, the failure to cover or remove the signs turns the short term limit into a
long/intermediate one and further reduces the credibility of TxDOT’s work zone speed limit
procedures with the public.
Recently, vendors have developed and are marketing internally illuminated and other
types of signs that will allow a regulatory speed limit to be displayed during portions of the day
or night when work activity is occurring, and then extinguished when the reduced speed limit is
no longer applicable. Such a device would simplify the short term work zone speed limit
implementation process and could lead to a greater use of short term work zone speed limits in
general. However, such technologies have not been used extensively for work zone speed limits
in Texas. Testing is needed to determine how motorists interpret the displays and respond to the
reduced speed limits posted, and their ease of use within a highway work zone.
Do Slower Speeds Improve Safety?
It is generally perceived that slowing down traffic in a work zone improves the overall
safety of the work zone. Such claims are based predominantly on common sense recognition
that slower vehicle speeds increase the time available for the motorist to react to any surprises in
the work zone, reduce required stopping distances, and allow for more significant evasive
maneuvers to be executed without further loss of vehicle control. Slower speeds past the work
area also reduce wind and vacuum effects of large trucks (there are multiple anecdotal stories in
industry of large trucks blowing hard hats off of workers and into active travel lanes, for
example). Finally, slower vehicle speeds would presumably allow greater time for workers to
move out of the way should an errant vehicle enter the workspace, and also reduce the likelihood
of severe injury to workers and motorists should a crash occur.
Logically, crashes are likely to be more severe at higher operating speeds than if speeds
are reduced, simply because there is more kinetic energy that has to be dissipated during the
crash. However, it is not clear whether the use of reduced speed limits themselves are sufficient
to drop vehicle speeds enough to significantly reduce the probability of a severe injury should an
accident with a vehicle occur. In addition, vehicle crash statistics across roadway types suggest
9
that actual operating speeds do not have a strong correlation with crash frequency (23). Rather,
it is the variance in speed between vehicles that appears to have the greater effect on crashes (i.e.,
the greater the variability in vehicle speeds the greater the crash risk) (23,24,25,26). In other
words, traffic moving along at a steady pace, albeit a fast one, may be safer than attempting to
slow down traffic by reducing the speed limit since this can increase the variability in speeds
(i.e., some drivers reduce their speed while others do not). Consequently, reducing vehicle
speeds too dramatically or too quickly can sometimes reduce safety if it increases the variability
in speeds between vehicles in the work zone.
How Do Motorists Drive in Work Zones?
Previous research (27,28,29) shows that the majority of motorists reduce their speed as
they enter a work zone, further reduce their speed near the work activity, and then increase their
speed after they pass the work activity and exit the work zone. The amount of speed reduction is
highly variable, but typically only a small percentage of motorists reduce their speed by large
amounts. Thus, throughout the work zone most motorists are still exceeding the speed limit.
A limited number of surveys conducted during that earlier NCHRP work did find that
over 90 percent of drivers believed that lane closures were locations where drivers should reduce
their speed (17). Conversely, only 25 percent of motorists believed that speed limit reductions
for roadside activities were needed or justified. The perceived need for speed limit reductions
for other work zone conditions and factors were less conclusive, no doubt in part to the small
sample size collected. Nevertheless, the low levels of compliance with reduced work zone speed
limits reported in a number of studies suggests that many conditions, factors, and combinations
thereof now used to warrant lower speed limits are not perceived by motorists as justifying the
need for slower speeds (30,31).
Research has shown enforcement to be the most effective method of speed control
available in work zones (18,19). In a work zone, reduced speed limits that correspond to
motorist perceptions that reduced speeds are necessary would be less likely to need enforcement
activity since actual travel speeds and the reduced work zone speed limit would be more closely
aligned. On the other hand, work zones where motorists do not adequately perceive the hazard
factors that are used to justify a reduced speed limit would be those in most need of enforcement,
since motorists would be less likely to reduce their speeds voluntarily.
10
Given the fact that reduced speed limits can be justified in a large majority of work zones
according to the conditions and factors listed in Table 1, it is apparent that the potential need for
enforcement typically outstrips funding and manpower availability if drivers do not actually
reduce their speeds in response to those reduced speed limits. Although many speed reduction
technologies and enforcement surrogates have been tested over the years, most have been shown
to have only a limited effect on driver behavior (18,30,32,33,34,35). In those same studies, one
often finds dismally-low compliance rates with the work zone speed limits at their study sites, an
indication of the extent to which the reduced speed limits and driver perceptions of the need to
slow down are incongruous. Undoubtedly, an improved understanding of the relationship
between factors used to justify reduced work zone speed limits and motorist perceptions of the
need to reduce their speed could improve the speed limit selection process. In turn, this could
also raise the credibility of all work zone traffic control devices with the public.
CONTENTS OF THIS REPORT
This report describes the methodology and results of analyses conducted to: 1) improve
existing guidance and procedures on establishing and managing work zone speed limits, and
2) identify and evaluate new technologies and strategies that can be used to better manage work
zone speed limits. Because of the duality in research project purpose, this report has been
prepared in two distinct parts. Part 1 addresses the research tasks and results pertaining to the
guidance and procedures on establishing and managing work zone speed limits, and Part 2
addresses the new technologies and strategies assessment.
11
PART 1 – GUIDELINES AND PROCEDURES ON ESTABLISHING AND MANAGING WORK ZONE SPEED LIMITS
13
CHAPTER 1.1: CURRENT WORK ZONE SPEED LIMIT PRACTICE IN TEXAS
INTRODUCTION
As discussed previously, TxDOT has procedures for establishing regulatory speed limits
in work zones (4,16). These procedures allow for the speed limit in a work zone to be reduced
by up to 10 mph under certain conditions, if one or more factors believed to justify the need for a
lower speed limit are present. In order to determine the most common work zone conditions,
factors, and combinations thereof currently being used as reasons to reduce the speed limit in
work zones, Texas Transportation Institute (TTI) researchers conducted telephone interviews
with 54 TxDOT personnel. At least one person from each TxDOT district was interviewed.
Topics discussed included the following:
• current process used to determine the need for a speed limit reduction,
• work zone conditions and factors used to justify a speed limit reduction (in general),
• opinions about the current process,
• number and locations of existing work zones with speed limit reductions in their
district,
• work zone conditions and factors used to justify each project’s speed limit reduction,
and
• speed limit reduction in place for each identified project.
Researchers also reviewed 51 requests for reduced speed limits in work zones received
by the TxDOT Traffic Operations Division (TRF) between April 2006 and September 2006.
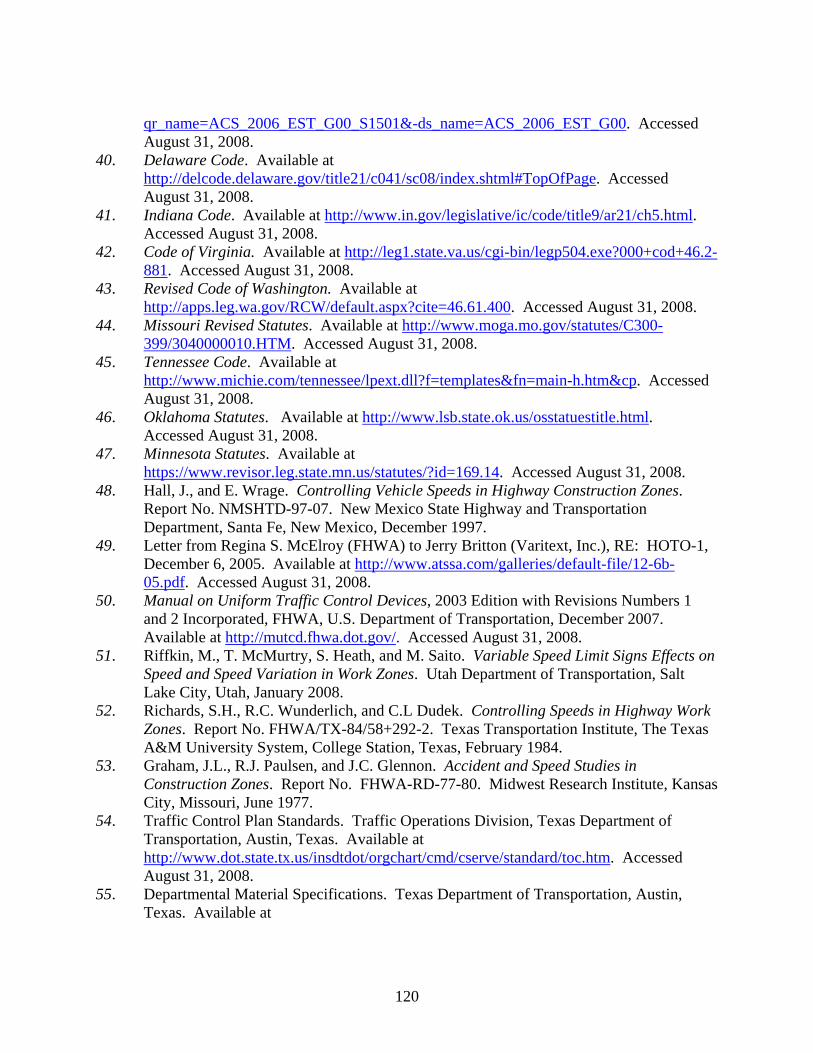
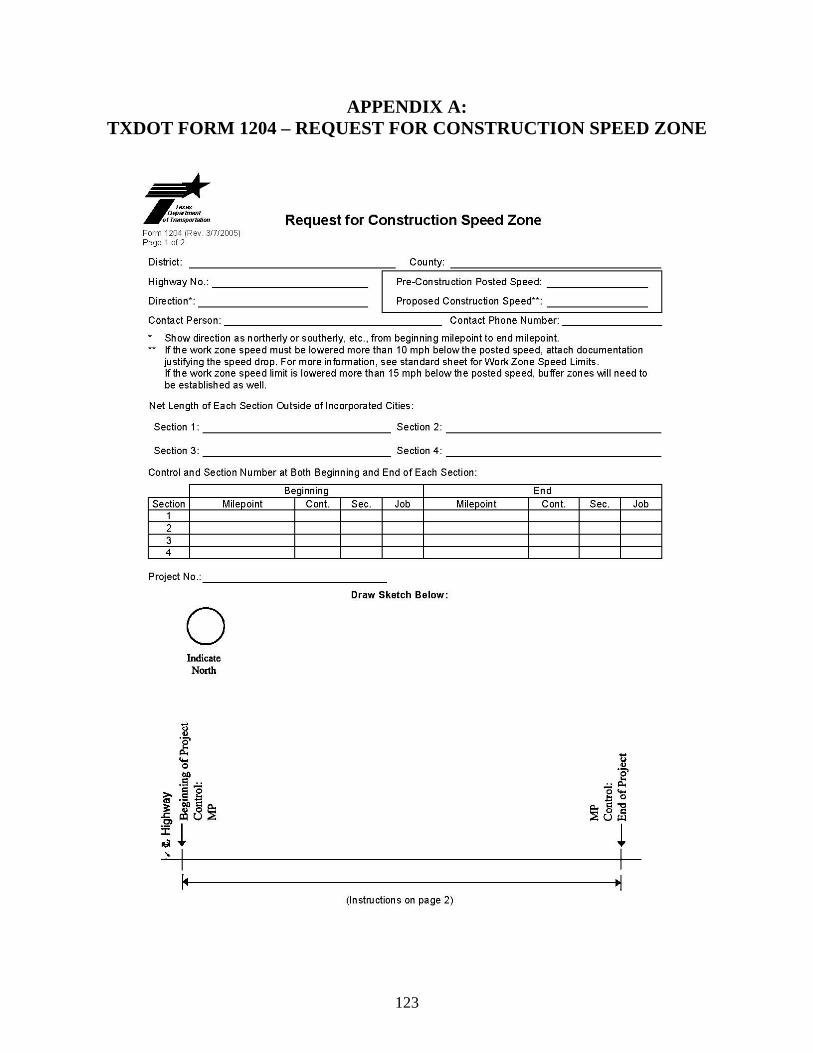
Typically, the only documentation for these requests was TxDOT Form 1204 Request for
Construction Speed Zone (36) (see Appendix A). However, this form does not specifically
require documentation of the reasons used to justify the speed limit reduction; thus, in most cases
TxDOT TRF personnel, through a review of plans or direct communication, identified and
documented only the primary reason for the need for a reduced speed limit. In some cases,
additional information, such as a letter explaining the need for the request or traffic control plans,
was also available for review. Still, for a majority of the requests, researchers were unable to
determine the work zone condition and if any additional factors, other than the primary one
documented by TxDOT TRF, were present.
14
It should be noted that the interviews and review of projects documented in this chapter
occurred at the beginning of the research project. Throughout the project TxDOT TRF personnel
kept researchers abreast of the current TxDOT practice. Therefore, the following section
contains the results from the interviews, review of projects, and communication between
researchers and TxDOT TRF personnel throughout the duration of the project.
RESULTS
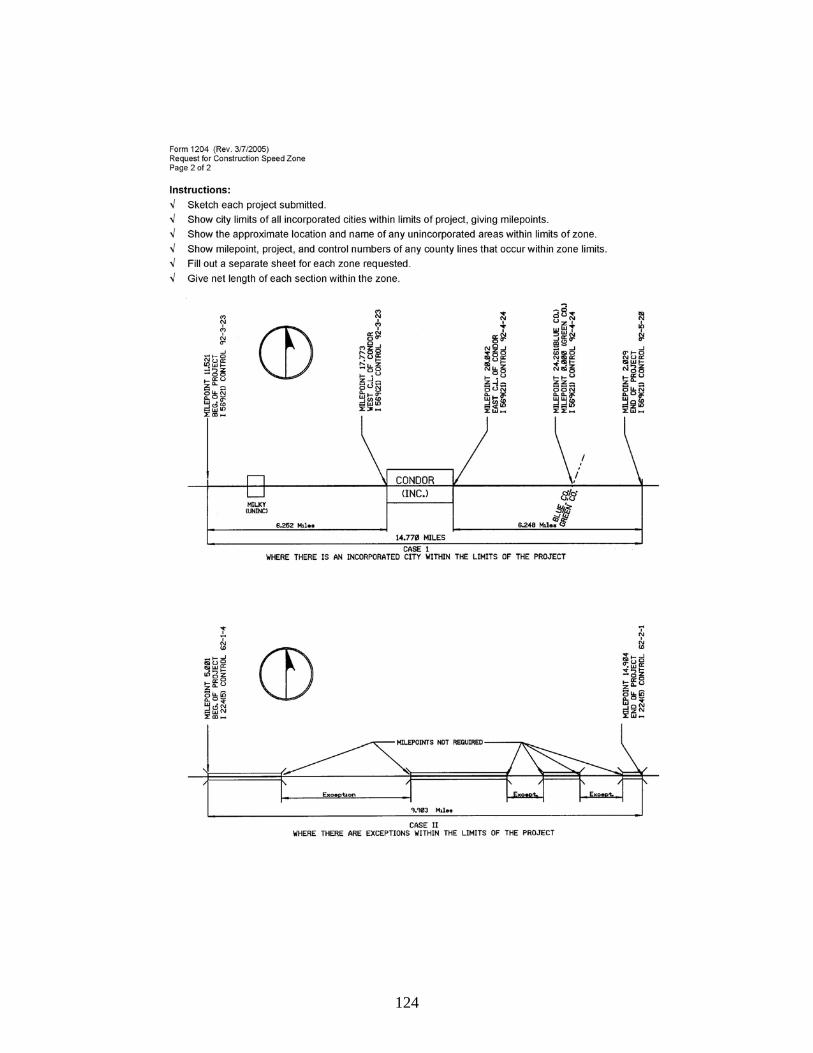
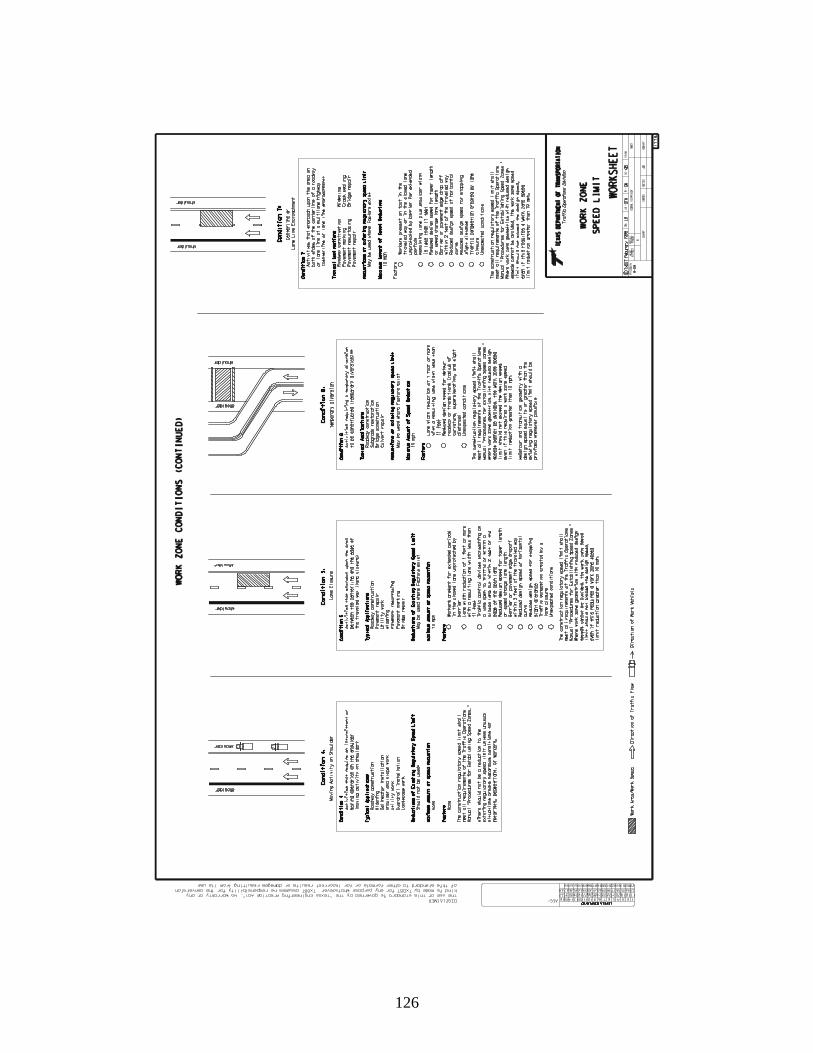
Most districts use the TxDOT Work Zone Speed Limit Worksheet (16) that is part of the
set of Standard Plans maintained by TxDOT TRF to determine if there is a need for a reduced
speed limit in a work zone (see Appendix B). In addition, the districts rely on safety team
reviews, engineering judgment, input from the project engineer, and input from design personnel.
The majority of the personnel interviewed believed that the current process works reasonably
well and stated that they try to minimize the use of work zone speed limit reductions. A few
districts mentioned discrepancies between TxDOT’s work zone speed limit policy and the
desires of contractors and law enforcement agencies. Specifically, some district personnel noted
that contractors prefer to have the work zone speed limit apply to the entire length of the work
zone instead of only in the immediate vicinity of the work activity. In addition, several districts
commented that law enforcement agencies prefer longer term work zone speed limits over short
term work zone speed limits that change more often.
The TxDOT Work Zone Speed Limit Worksheet (16) contains the following seven work
zone conditions: roadside activity, shoulder activity, lane encroachment, moving activity on
shoulder, lane closure, temporary diversion, and centerline or lane line encroachment. For the
roadside activity and moving activity on shoulder conditions, no speed limit reduction is
recommended. For all other conditions, a maximum allowable speed limit reduction of 10 mph
may be used where at least one of the listed factors exists. Factors include:
• workers present close to or in the roadway and not protected by barrier;
• horizontal curvature that might increase vehicle encroachment rate;
• barrier or pavement edge drop off within 2 ft of traveled way;
• reduced design speed for stopping sight distance, taper length, speed change lane
length, horizontal curvature, or detour;
• lane width reduction of 1 ft or more resulting in a lane width less than 11 ft;
15
• traffic control devices encroaching on an open travel lane or within a closed lane but
within 2 ft of the edge of the open travel lane;
• traffic congestion; and
• unexpected conditions.
Not all of these factors are listed under each work zone condition. Larger reductions are
allowed where work zone geometrics with reduced design speeds cannot be avoided or where
unusual situations create hazardous conditions for motorists, pedestrians, or workers.
Based on the 51 requests for reduced work zone speed limits received by TxDOT TRF
and information regarding the 31 projects identified by TxDOT personnel in the telephone
interviews, researchers computed the percentage of projects for which each of the work zone
conditions was the primary condition used to justify a reduced speed limit. Researchers also
computed the percentage of projects for which each factor was present. Table 2 and Table 3
contain the percentages for the conditions and factors, respectively. While the work zone
condition could not be determined for almost one half of the projects, it is evident that lane
closures and temporary diversions are the most prominent work zone conditions where reduced
speed limits are requested. As mentioned previously, the current TxDOT procedure does not
recommend a speed limit reduction for roadside activities unless unusual situations create
hazardous conditions for motorists, pedestrians, or workers. The implementation of reduced
speed limits for the two roadside activity projects shown in Table 2 was due to a high number of
crashes that occurred within the work zone prior to the speed reduction.
As shown in Table 3, workers present close to or in the roadway and not protected by
barrier occurred in 21 percent of the projects with reduced work zone speed limits. Similarly,
reduced design speed and changes in roadway alignment for lane shifts, detours, etc. were
present in 20 percent of the projects. Current TxDOT work zone speed limit procedures note
that the work zone speed limit should not exceed the design speed, even if this requires a speed
limit reduction greater than 10 mph. TxDOT is currently working hard to reduce the use of
lower design speeds for temporary diversions, lane shifts, etc. so that the speed limit does not
have to be reduced for this reason alone.
16
Table 2. Percentage of Reduced Speed Limit Requests by Type of Work Zone Condition.
Work Zone Condition Percent of Projects Roadside activity 2% Shoulder activity 2% Lane encroachment 7% Moving activity on shoulder 0% Lane closure 25% Temporary diversion 22% Centerline or lane line encroachment 0% Unknown 42%
Table 3. Percentage of Reduced Speed Limit Requests by Type of Work Zone Factor Present.
Work Zone Factor Percent of Projects a Unprotected workers 21% Reduced design speed and changes in alignment (e.g., lane shifts, detours, etc.) 20%
Lane width reduction 16% Barrier or pavement edge drop off 13% Unexpected conditions 9% Horizontal curvature that might increase vehicle encroachment rate 2%
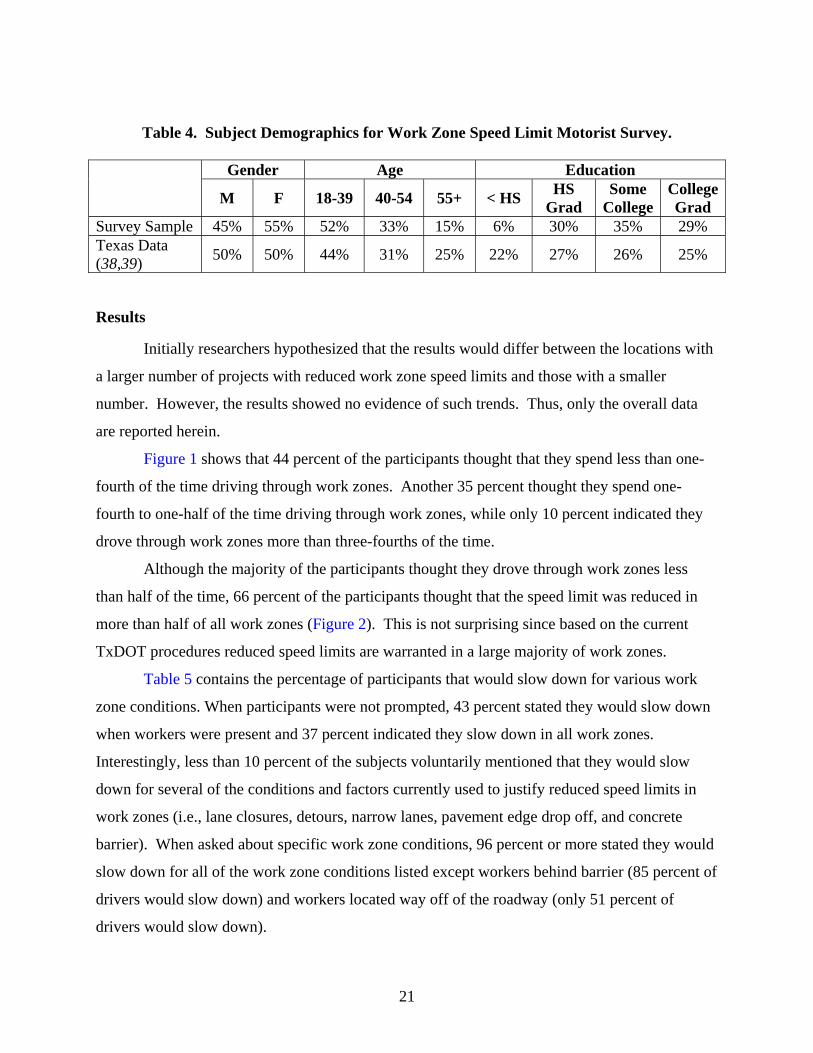
Initially researchers hypothesized that the results would differ between the locations with
a larger number of projects with reduced work zone speed limits and those with a smaller
number. However, the results showed no evidence of such trends. Thus, only the overall data
are reported herein.
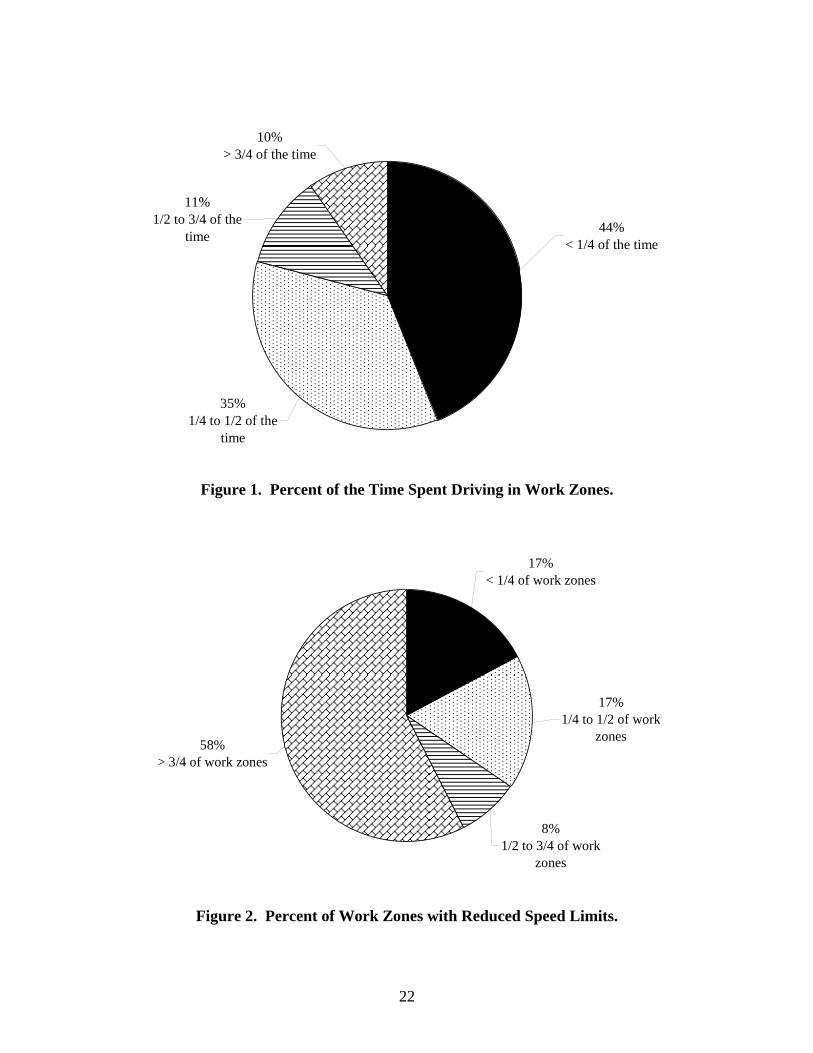
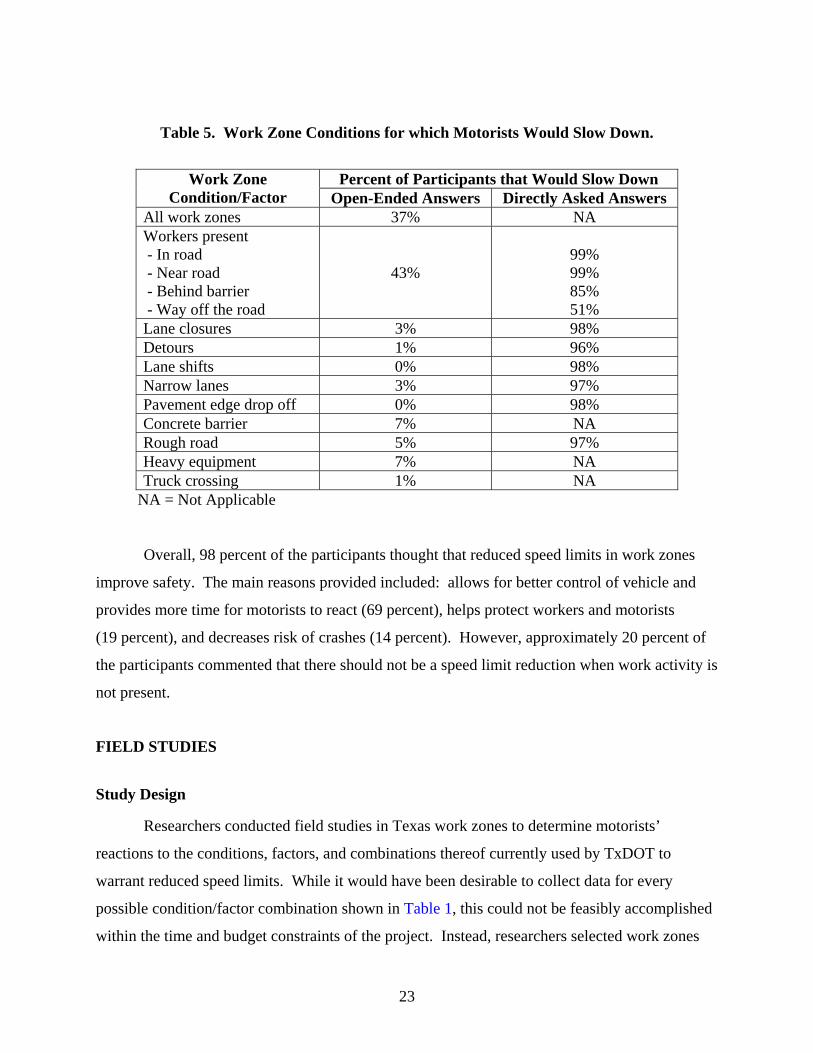
Figure 1 shows that 44 percent of the participants thought that they spend less than one-
fourth of the time driving through work zones. Another 35 percent thought they spend one-
fourth to one-half of the time driving through work zones, while only 10 percent indicated they
drove through work zones more than three-fourths of the time.
Although the majority of the participants thought they drove through work zones less
than half of the time, 66 percent of the participants thought that the speed limit was reduced in
more than half of all work zones (Figure 2). This is not surprising since based on the current
TxDOT procedures reduced speed limits are warranted in a large majority of work zones.
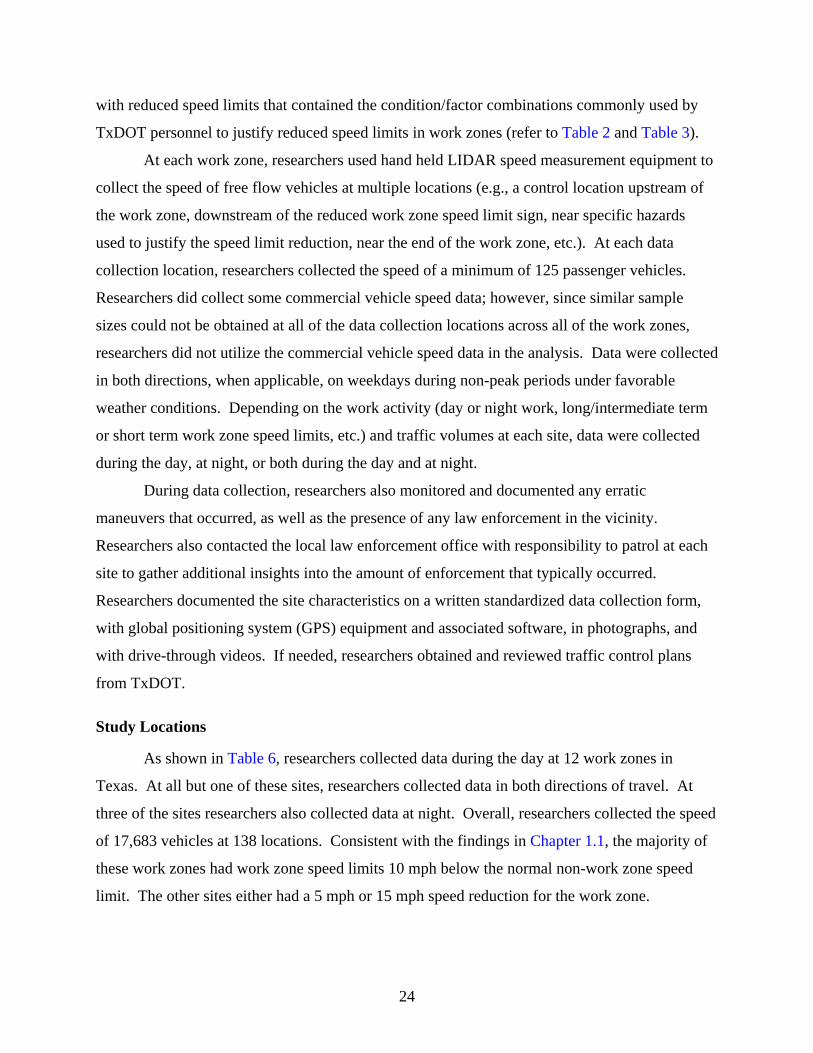
Table 5 contains the percentage of participants that would slow down for various work
zone conditions. When participants were not prompted, 43 percent stated they would slow down
when workers were present and 37 percent indicated they slow down in all work zones.
Interestingly, less than 10 percent of the subjects voluntarily mentioned that they would slow
down for several of the conditions and factors currently used to justify reduced speed limits in
work zones (i.e., lane closures, detours, narrow lanes, pavement edge drop off, and concrete
barrier). When asked about specific work zone conditions, 96 percent or more stated they would
slow down for all of the work zone conditions listed except workers behind barrier (85 percent of
drivers would slow down) and workers located way off of the roadway (only 51 percent of
drivers would slow down).
22
Figure 1. Percent of the Time Spent Driving in Work Zones.
Figure 2. Percent of Work Zones with Reduced Speed Limits.
35%1/4 to 1/2 of the
time
11%1/2 to 3/4 of the
time
10%> 3/4 of the time
44%< 1/4 of the time
8%1/2 to 3/4 of work
zones
17%1/4 to 1/2 of work
zones
17%< 1/4 of work zones
58%> 3/4 of work zones
23
Table 5. Work Zone Conditions for which Motorists Would Slow Down.
Percent of Participants that Would Slow Down Work Zone Condition/Factor Open-Ended Answers Directly Asked Answers
All work zones 37% NA Workers present - In road - Near road - Behind barrier - Way off the road
43%
99% 99% 85% 51%
Lane closures 3% 98% Detours 1% 96% Lane shifts 0% 98% Narrow lanes 3% 97% Pavement edge drop off 0% 98% Concrete barrier 7% NA Rough road 5% 97% Heavy equipment 7% NA Truck crossing 1% NA
NA = Not Applicable
Overall, 98 percent of the participants thought that reduced speed limits in work zones
improve safety. The main reasons provided included: allows for better control of vehicle and
provides more time for motorists to react (69 percent), helps protect workers and motorists
(19 percent), and decreases risk of crashes (14 percent). However, approximately 20 percent of
the participants commented that there should not be a speed limit reduction when work activity is
not present.
FIELD STUDIES
Study Design
Researchers conducted field studies in Texas work zones to determine motorists’
reactions to the conditions, factors, and combinations thereof currently used by TxDOT to
warrant reduced speed limits. While it would have been desirable to collect data for every
possible condition/factor combination shown in Table 1, this could not be feasibly accomplished
within the time and budget constraints of the project. Instead, researchers selected work zones
24
with reduced speed limits that contained the condition/factor combinations commonly used by
TxDOT personnel to justify reduced speed limits in work zones (refer to Table 2 and Table 3).
At each work zone, researchers used hand held LIDAR speed measurement equipment to
collect the speed of free flow vehicles at multiple locations (e.g., a control location upstream of
the work zone, downstream of the reduced work zone speed limit sign, near specific hazards
used to justify the speed limit reduction, near the end of the work zone, etc.). At each data
collection location, researchers collected the speed of a minimum of 125 passenger vehicles.
Researchers did collect some commercial vehicle speed data; however, since similar sample
sizes could not be obtained at all of the data collection locations across all of the work zones,
researchers did not utilize the commercial vehicle speed data in the analysis. Data were collected
in both directions, when applicable, on weekdays during non-peak periods under favorable
weather conditions. Depending on the work activity (day or night work, long/intermediate term
or short term work zone speed limits, etc.) and traffic volumes at each site, data were collected
during the day, at night, or both during the day and at night.
During data collection, researchers also monitored and documented any erratic
maneuvers that occurred, as well as the presence of any law enforcement in the vicinity.
Researchers also contacted the local law enforcement office with responsibility to patrol at each
site to gather additional insights into the amount of enforcement that typically occurred.
Researchers documented the site characteristics on a written standardized data collection form,
with global positioning system (GPS) equipment and associated software, in photographs, and
with drive-through videos. If needed, researchers obtained and reviewed traffic control plans
from TxDOT.
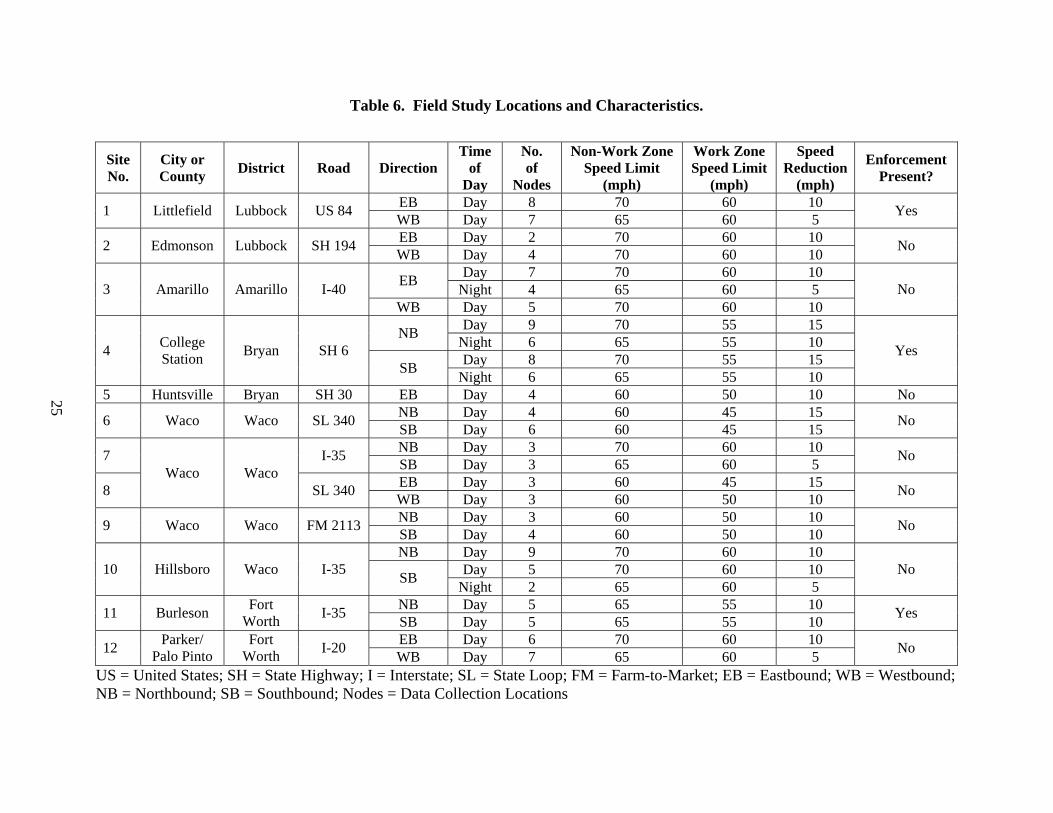
Study Locations
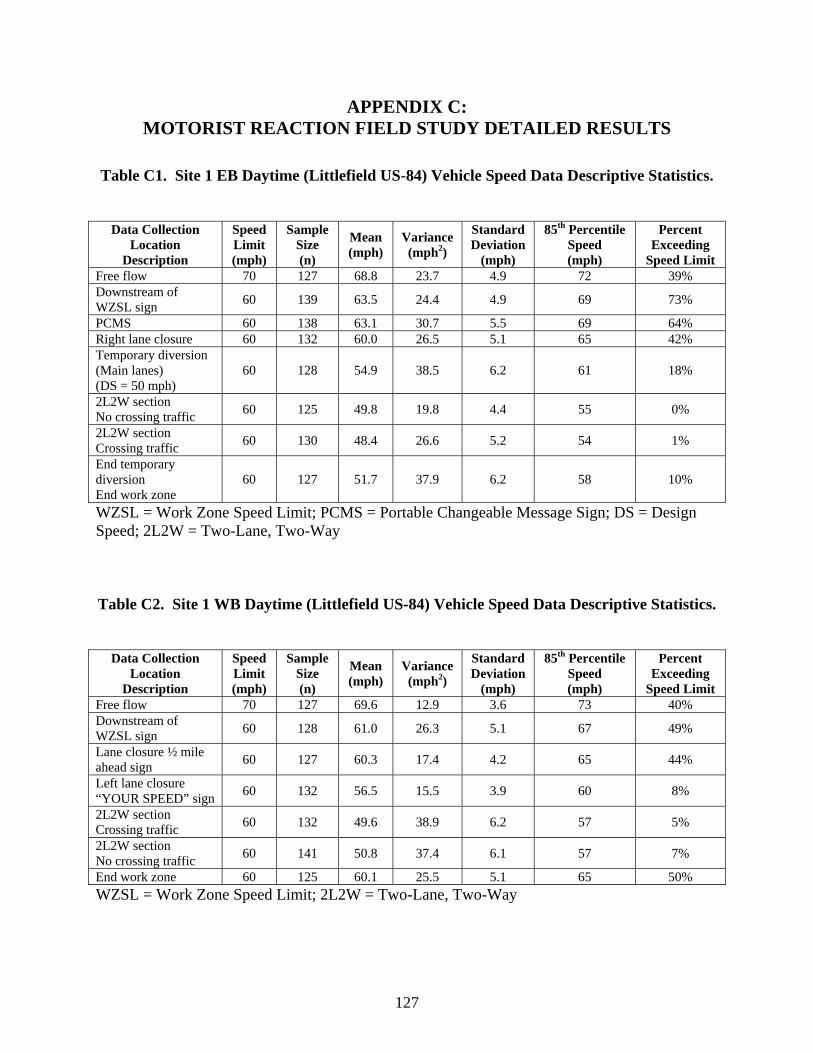
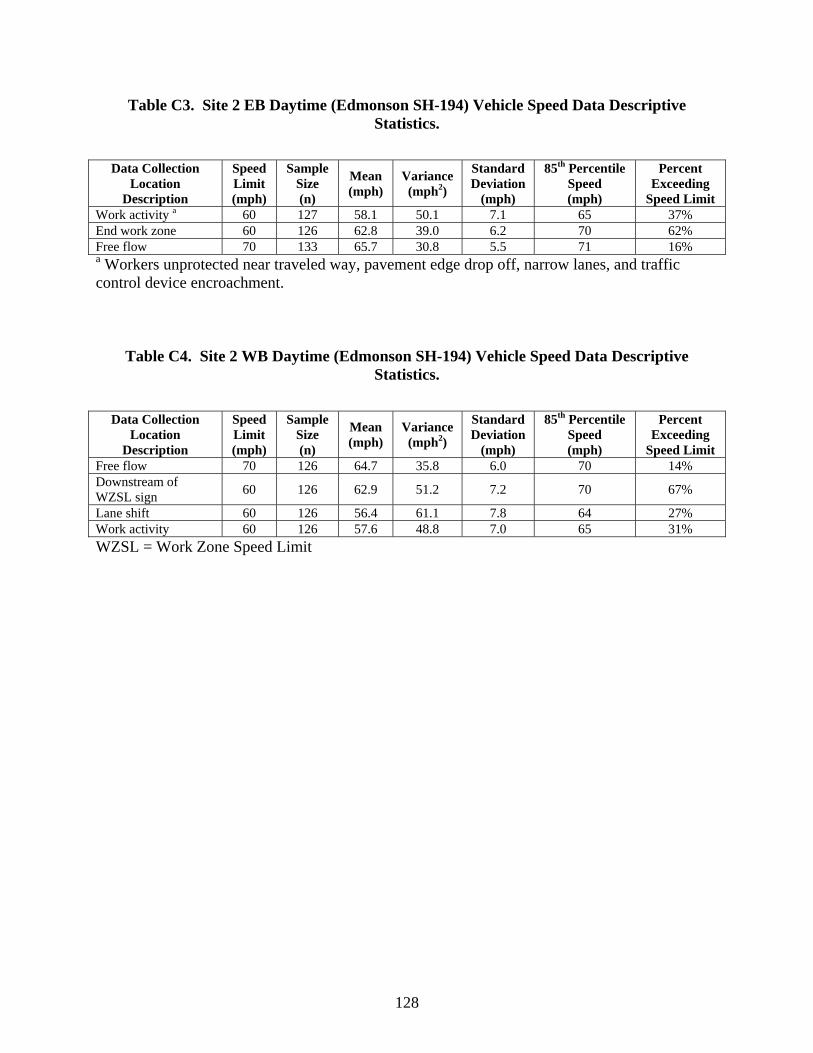
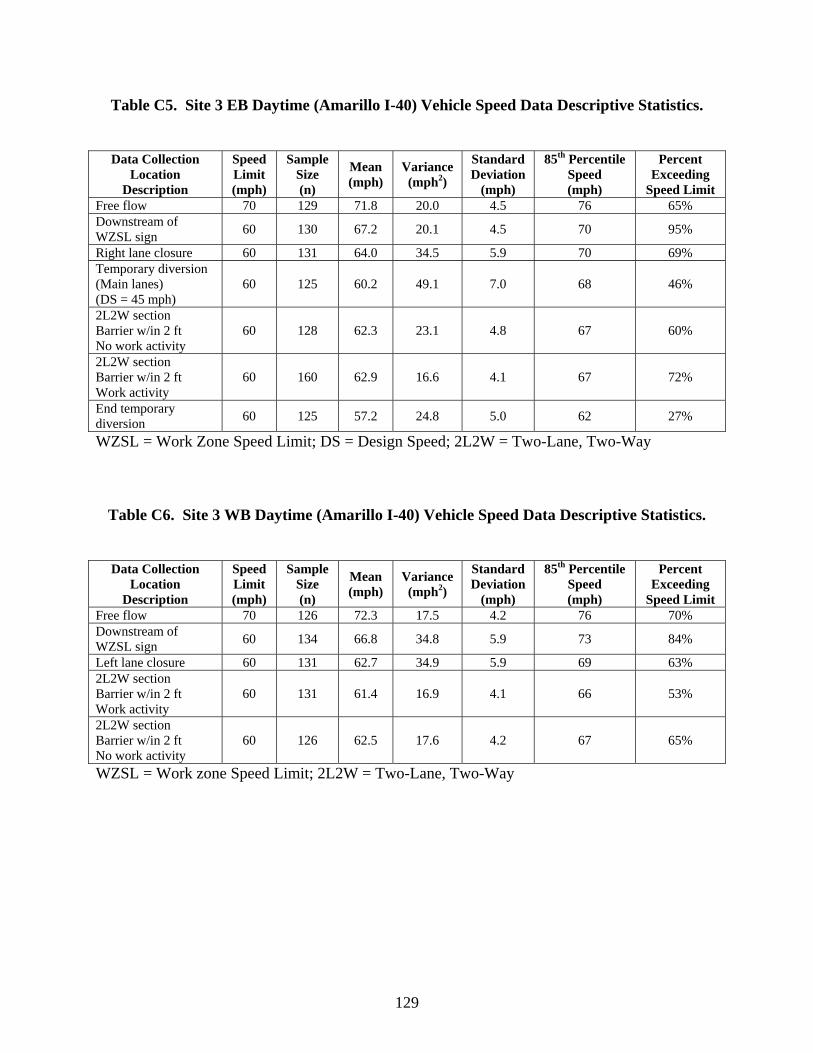
As shown in Table 6, researchers collected data during the day at 12 work zones in
Texas. At all but one of these sites, researchers collected data in both directions of travel. At
three of the sites researchers also collected data at night. Overall, researchers collected the speed
of 17,683 vehicles at 138 locations. Consistent with the findings in Chapter 1.1, the majority of
these work zones had work zone speed limits 10 mph below the normal non-work zone speed
limit. The other sites either had a 5 mph or 15 mph speed reduction for the work zone.
25
Table 6. Field Study Locations and Characteristics.
Site No.
City or County District Road Direction
Time of
Day
No. of
Nodes
Non-Work Zone Speed Limit
(mph)
Work Zone Speed Limit
(mph)
Speed Reduction
(mph)
Enforcement Present?
EB Day 8 70 60 10 1 Littlefield Lubbock US 84 WB Day 7 65 60 5 Yes
EB Day 2 70 60 10 2 Edmonson Lubbock SH 194 WB Day 4 70 60 10 No
Day 7 70 60 10 EB Night 4 65 60 5 3 Amarillo Amarillo I-40 WB Day 5 70 60 10
No
Day 9 70 55 15 NB Night 6 65 55 10 Day 8 70 55 15 4 College
Station Bryan SH 6 SB Night 6 65 55 10
Yes
5 Huntsville Bryan SH 30 EB Day 4 60 50 10 No NB Day 4 60 45 15 6 Waco Waco SL 340 SB Day 6 60 45 15 No
NB Day 3 70 60 10 7 I-35 SB Day 3 65 60 5 No
EB Day 3 60 45 15 8 Waco Waco
SL 340 WB Day 3 60 50 10 No
NB Day 3 60 50 10 9 Waco Waco FM 2113 SB Day 4 60 50 10 No
NB Day 9 70 60 10 Day 5 70 60 10 10 Hillsboro Waco I-35 SB Night 2 65 60 5
No
NB Day 5 65 55 10 11 Burleson Fort Worth I-35 SB Day 5 65 55 10 Yes
EB Day 6 70 60 10 12 Parker/ Palo Pinto
Fort Worth I-20 WB Day 7 65 60 5 No
US = United States; SH = State Highway; I = Interstate; SL = State Loop; FM = Farm-to-Market; EB = Eastbound; WB = Westbound; NB = Northbound; SB = Southbound; Nodes = Data Collection Locations
26
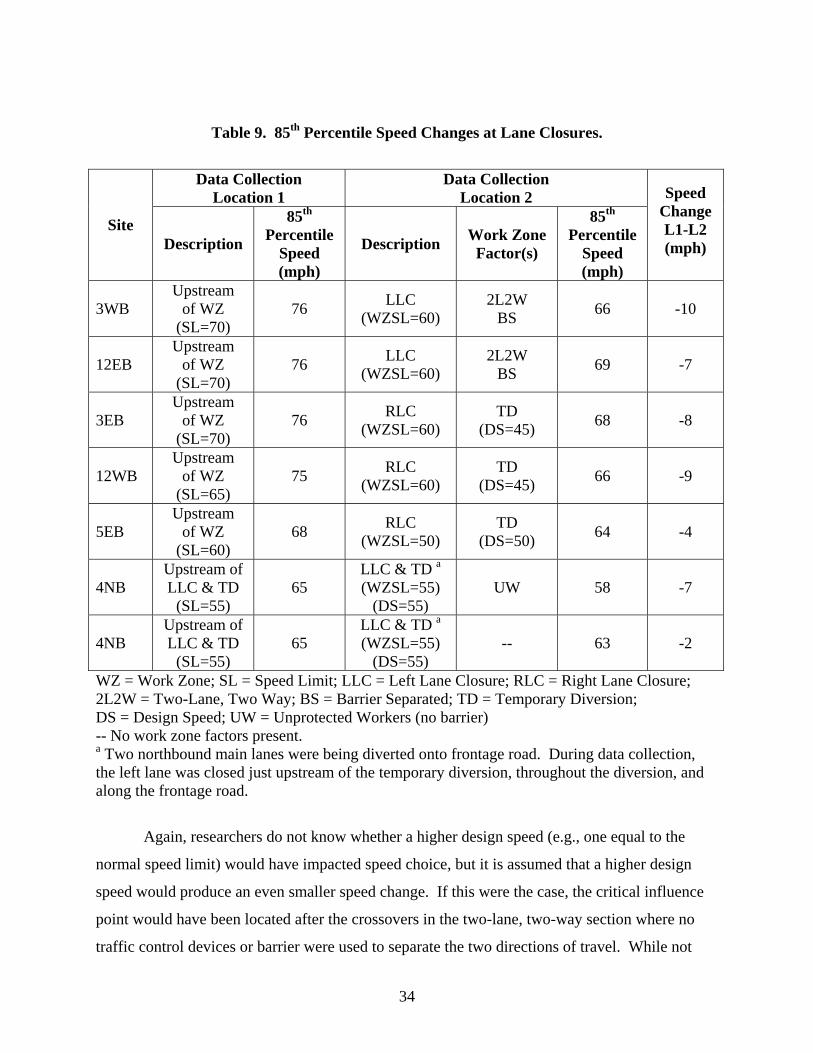
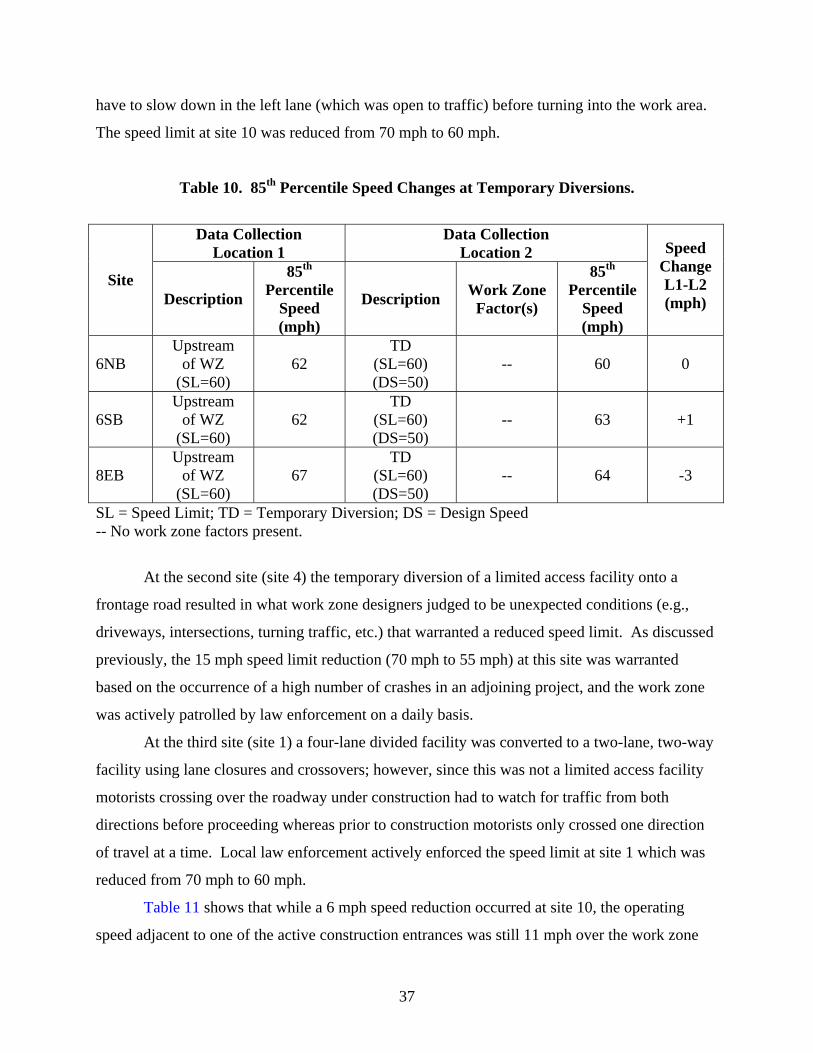
The 15 mph reductions were justified due to a high number of crashes (site 4) or a limited access
roadway being diverted onto a frontage road (site 6 and site 8).
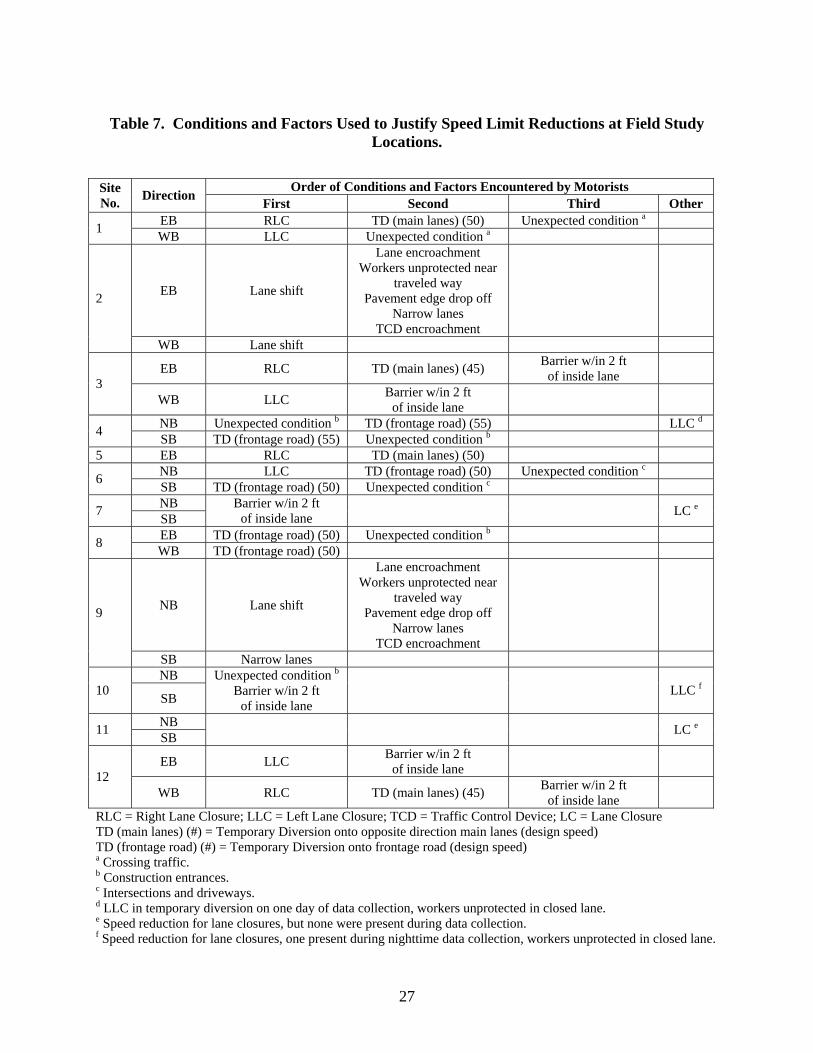
As shown in Table 7, the study sites included three of the five work zone conditions for
which the speed limit may be reduced (i.e., lane encroachment, lane closure, and temporary
diversion). In addition, many of the factors used to warrant reduced speed limits in work zones
were present.
Data Reduction and Analysis
At each site, researchers computed the following descriptive statistics for each data
collection location: sample size, mean speed, variance, standard deviation, 85th percentile speed,
and the percent of vehicles exceeding the speed limit. Appendix C contains these descriptive
statistics. Researchers did not use statistical analysis to determine if there were significant
differences between the mean speed, variance, and percent of vehicles exceeding the speed limit
at each site. Instead, researchers utilized the 85th percentile speed (i.e., operating speed) to assess
motorists’ reaction to various work zone condition/factor combinations. Speed reductions were
computed as the difference between the 85th percentile normal operating speed of the roadway
(measured upstream of the work zone) and the 85th percentile speed at the work zone
condition/factor combinations of interest.
Results
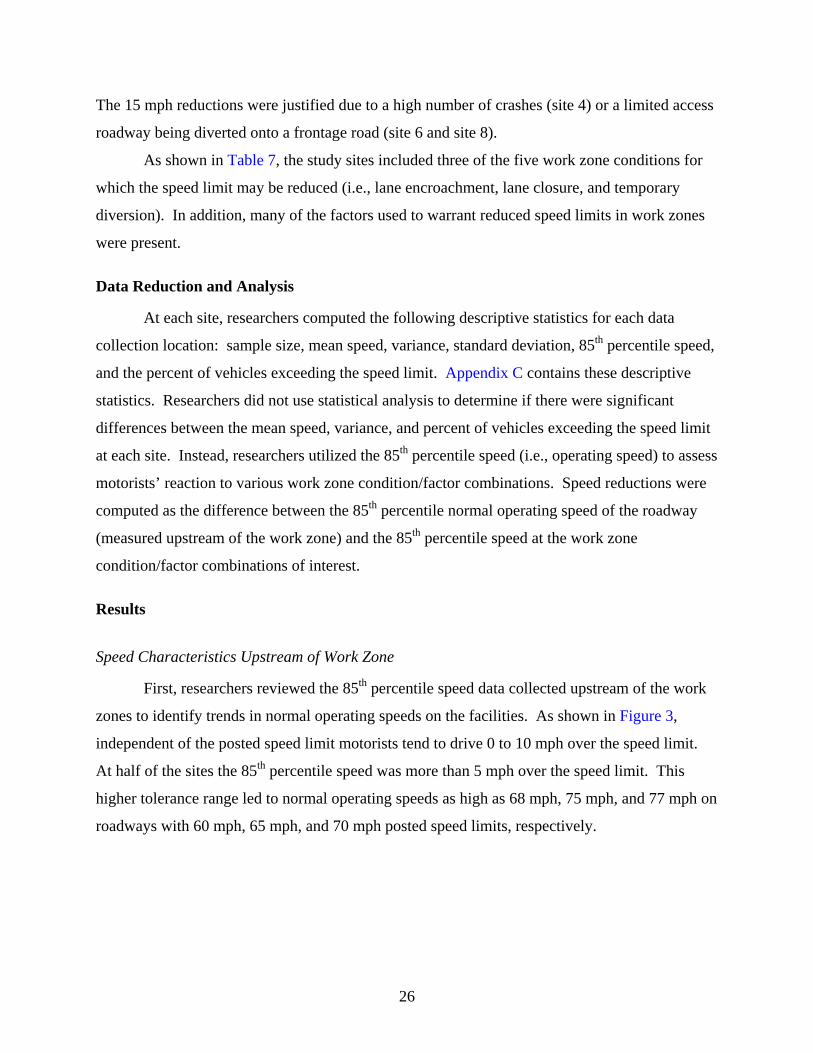
Speed Characteristics Upstream of Work Zone
First, researchers reviewed the 85th percentile speed data collected upstream of the work
zones to identify trends in normal operating speeds on the facilities. As shown in Figure 3,
independent of the posted speed limit motorists tend to drive 0 to 10 mph over the speed limit.
At half of the sites the 85th percentile speed was more than 5 mph over the speed limit. This
higher tolerance range led to normal operating speeds as high as 68 mph, 75 mph, and 77 mph on
roadways with 60 mph, 65 mph, and 70 mph posted speed limits, respectively.
27
Table 7. Conditions and Factors Used to Justify Speed Limit Reductions at Field Study Locations.
Order of Conditions and Factors Encountered by Motorists Site
No. Direction First Second Third Other EB RLC TD (main lanes) (50) Unexpected condition a 1 WB LLC Unexpected condition a
EB Lane shift
Lane encroachment Workers unprotected near
traveled way Pavement edge drop off
Narrow lanes TCD encroachment
2
WB Lane shift
EB RLC TD (main lanes) (45) Barrier w/in 2 ft of inside lane
3 WB LLC Barrier w/in 2 ft
of inside lane
NB Unexpected condition b TD (frontage road) (55) LLC d 4 SB TD (frontage road) (55) Unexpected condition b 5 EB RLC TD (main lanes) (50)
NB LLC TD (frontage road) (50) Unexpected condition c 6 SB TD (frontage road) (50) Unexpected condition c NB 7 SB
RLC = Right Lane Closure; LLC = Left Lane Closure; TCD = Traffic Control Device; LC = Lane Closure TD (main lanes) (#) = Temporary Diversion onto opposite direction main lanes (design speed) TD (frontage road) (#) = Temporary Diversion onto frontage road (design speed) a Crossing traffic. b Construction entrances. c Intersections and driveways. d LLC in temporary diversion on one day of data collection, workers unprotected in closed lane. e Speed reduction for lane closures, but none were present during data collection. f Speed reduction for lane closures, one present during nighttime data collection, workers unprotected in closed lane.
28
Figure 3. 85th Percentile Speeds Upstream of the Work Zone.
Speed Characteristics Downstream of Work Zone Speed Limit
Next, researchers compared the normal operating speed of the roadway upstream of the
work zone to the operating speed downstream of the reduced work zone speed limit to determine
whether simply lowering the speed limit effected motorist’s speed choice. Researchers did not
include sites where the first work zone speed limit sign was in close proximity to another work
zone condition (e.g., lane closure, temporary diversion, etc.), in order to isolate the effects of the
work zone speed limit sign itself.
Figure 4 shows that in general the 85th percentile speed decreased downstream of the
work zone speed limit (WZSL) sign. At two sites (2WB and 12EB) there was no change in the
85th percentile speed, while at one site an increase occurred (7SB). Four of the sites (11NB,
11SB, 1EB, and 4NB) had active enforcement within the work zone on the day of data
62 62
67
60 61
67
75
7270
76 76 75 76
72
76
71
68
73
77
73
40
45
50
55
60
65
70
75
80
85
905E
B
6NB
6SB
8EB
8WB
9SB
7SB
12W
B
11N
B
11SB
2WB
3EB
3WB
7NB
10N
B
12EB 1E
B
1WB
4NB
4SB
Site
85th
Per
cent
ile S
peed
(mph
)
SL = 60 mph SL = 65 mph SL = 70 mph
29
collection. In addition, at two of these sites (1EB and 4NB) law enforcement actively patrolled
the work zone on a daily basis throughout the duration of the project. Nevertheless, a large
speed reduction (10 mph) downstream of the work zone speed limit sign was only achieved at
one of these sites (4NB), and even with this large speed reduction the operating speed was still
11 mph over the reduced speed limit.
Figure 4. 85th Percentile Speed Changes Downstream of the Reduced Work Zone Speed Limit.
Removing the sites that had active enforcement, the reduction in speed downstream of the
work zone speed limit ranged from 0 to 6 mph and averaged 3 mph (if one considers the increase
in speed at site 7SB an anomaly). In addition, at all but one of the sites the speed reduction
downstream of the work zone speed limit was 3 mph or less. While the 85th percentile speed
downstream of the work zone speed limit did decrease slightly, the operating speeds were still
9 to 16 mph over the reduced work zone speed limit. These findings are consistent with previous
research (27,28).
Overall, it does appear that motorists slightly decrease their speed downstream of the
work zone speed limit. However, since the normal operating speeds on these facilities were
typically more than 5 mph over the normal non-work zone speed limit (Figure 3), the small
speed reductions (3 mph on average) still resulted in 85th percentile speeds 9 to 16 mph over the
reduced work zone speed limit. In addition, the small speed reductions occurred at sites with
speed limit reductions of 5 and 10 mph; thus, when no other work zone conditions are present it
does not appear that motorists utilized the amount of the speed limit reduction to determine how
much they should reduce their speed.
Speed Characteristics at Sites with Lane Encroachment
Currently in Texas, a maximum speed reduction of 10 mph may be used when activities
encroach upon the area from the edge of the traveled way to 2 ft from the edge of the traveled
way (i.e., lane encroachment). Researchers collected speed data at two sites with lane
encroachment (site 2 and site 9) that had 10 mph work zone speed limit reductions (70 mph
reduced to 60 mph and 60 mph reduced to 50 mph, respectively). Both of these sites were two-
lane roadways where one direction of travel had been shifted onto the shoulder and the other
direction was traveling in the opposite direction’s original travel lane. The lane encroachment
work activity was on one side of the road only and included the following work zone factors that
can currently be used to justify a reduced work zone speed limit:
• unprotected workers,
• pavement edge drop off within 2 ft of a travel lane,
• narrow lanes (10 ft), and
• cones encroaching into the travel lane.
Researchers felt that this combination of factors represented a worst case scenario.
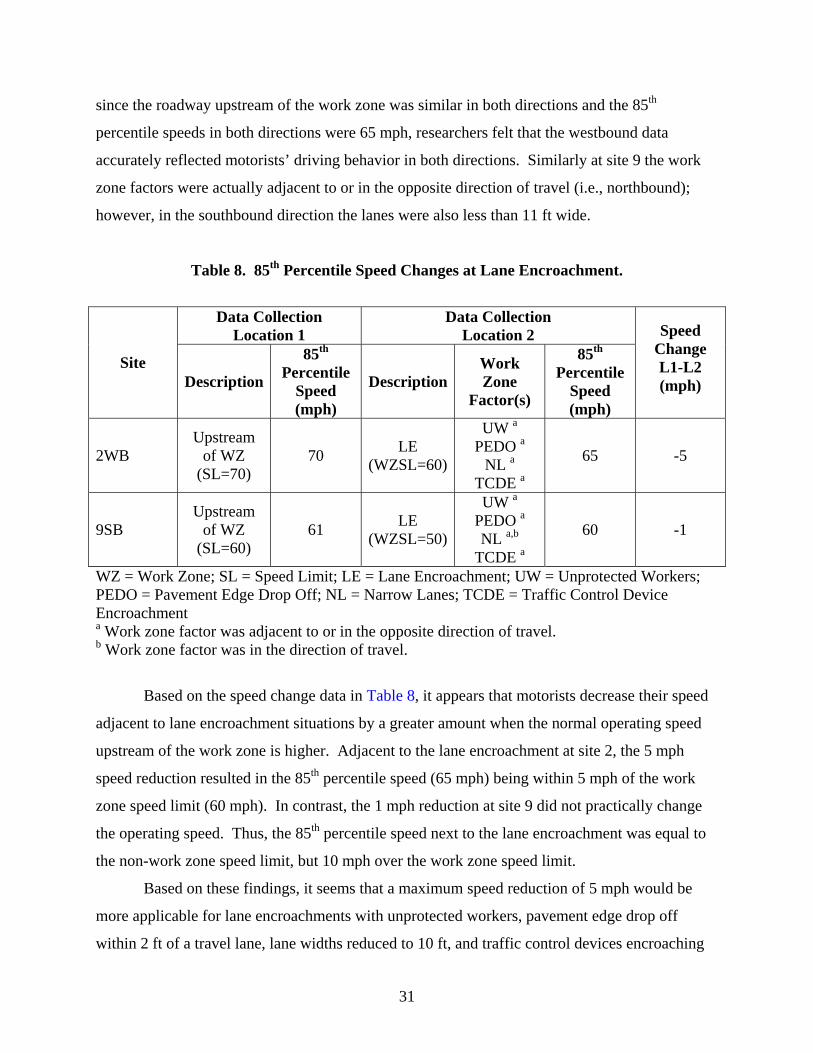
Table 8 shows the speed changes that occurred at two sites with lane encroachment. At
site 2 the work zone factors were actually adjacent to or in the opposite direction of travel (i.e.,
eastbound). The speed change in the eastbound direction could not be computed because there
was not a safe place for researchers to collect speed data upstream of the work zone. However,
31
since the roadway upstream of the work zone was similar in both directions and the 85th
percentile speeds in both directions were 65 mph, researchers felt that the westbound data
accurately reflected motorists’ driving behavior in both directions. Similarly at site 9 the work
zone factors were actually adjacent to or in the opposite direction of travel (i.e., northbound);
however, in the southbound direction the lanes were also less than 11 ft wide.
Table 8. 85th Percentile Speed Changes at Lane Encroachment.
Data Collection Location 1
Data Collection Location 2
Site Description
85th Percentile
Speed (mph)
DescriptionWork Zone
Factor(s)
85th Percentile
Speed (mph)
Speed Change L1-L2 (mph)
2WB Upstream
of WZ (SL=70)
70 LE (WZSL=60)
UW a PEDO a
NL a TCDE a
65 -5
9SB Upstream
of WZ (SL=60)
61 LE (WZSL=50)
UW a PEDO a NL a,b
TCDE a
60 -1
WZ = Work Zone; SL = Speed Limit; LE = Lane Encroachment; UW = Unprotected Workers; PEDO = Pavement Edge Drop Off; NL = Narrow Lanes; TCDE = Traffic Control Device Encroachment a Work zone factor was adjacent to or in the opposite direction of travel. b Work zone factor was in the direction of travel.
Based on the speed change data in Table 8, it appears that motorists decrease their speed
adjacent to lane encroachment situations by a greater amount when the normal operating speed
upstream of the work zone is higher. Adjacent to the lane encroachment at site 2, the 5 mph
speed reduction resulted in the 85th percentile speed (65 mph) being within 5 mph of the work
zone speed limit (60 mph). In contrast, the 1 mph reduction at site 9 did not practically change
the operating speed. Thus, the 85th percentile speed next to the lane encroachment was equal to
the non-work zone speed limit, but 10 mph over the work zone speed limit.
Based on these findings, it seems that a maximum speed reduction of 5 mph would be
more applicable for lane encroachments with unprotected workers, pavement edge drop off
within 2 ft of a travel lane, lane widths reduced to 10 ft, and traffic control devices encroaching
32
into the travel lane. Furthermore, it may not be necessary to reduce the speed limit even by
5 mph if operating speeds are already near or below 60 mph.
Speed Characteristics at Sites with Lane Closures
Lane closure activities are those that encroach upon the area between the centerline and
the edge of the traveled way. Currently in Texas, a maximum speed reduction of 10 mph may
also be used for lane closures. Researchers collected speed data at four sites with lane closures.
At two of the sites (site 3 and site 12), in one direction of travel (3WB and 12EB) a left lane
closure was in place to reduce the number of open lanes from two to one. In the opposite
direction of travel (3EB and 12WB) traffic was reduced from two lanes to one lane using a right
lane closure and then diverted through a crossover into the left lane of the opposite direction of
travel (3WB and 12EB). Along the two-lane, two-way section of roadway, the two directions of
the travel were separated by concrete barrier that was within 2 ft of the travel lanes. At site 3, the
speed limit was reduced from 70 mph to 60 mph for the work zone (a 10 mph speed limit
reduction). This was also the case in the eastbound direction at site 12. However, in the
westbound direction at site 12, the speed limit was only reduced by 5 mph, since the normal non-
work zone speed limit was 65 mph. Based upon a review of the speed reduction data, the critical
influence point (data collection location with the largest speed change) was after the left lane
closure in the two-lane, two-way section for sites 3WB and 12EB, and in the crossover for sites
3EB and 12WB.
The third site (5EB) was similar to the first two sites; however, researchers only collected
data in the direction of travel with a right lane closure followed by crossover. The work zone
speed limit was 10 mph below the normal non-work zone speed limit (60 mph reduced to
50 mph). At this site, researchers considered the critical influence point to be in the crossover.
At the fourth site (4NB) the left lane closure was actually in a crossover that diverted
both of the main lanes off of the original roadway onto a frontage road using an existing exit
ramp that had been widened. During data collection, the left lane was closed just upstream of the
temporary diversion, throughout the diversion, and along the frontage road where commercial
vehicles parked in the closed lane to unload bridge piers. Unprotected workers and construction
equipment were located in the lane closure on the frontage road. The work zone speed limit for
this construction project (55 mph) was implemented approximately 9 miles upstream of the lane
33
closure at the beginning of an adjacent construction project that did not involve active work in
the travel lanes nor did it require any roadway alignment changes, but it had experienced a high
number of crashes. Regular active enforcement within the adjacent construction project resulted
in a large speed reduction throughout the project. Therefore at this site, comparisons utilized the
85th percentile speed immediately upstream of the lane closure instead of upstream of the work
zone to determine the speed changes. At this site, researchers considered the critical influence
point to be after the left lane closure adjacent to workers.
Table 9 shows the speed changes that occurred at the four sites with lane closures. At
site 3 and site 12 where operating speeds were very high approaching the work zone, the 85th
percentile speed at the critical influence points decreased by 7 to 10 mph, showing that motorists
do decrease their speed when they encounter an apparent need to do so. These speed reductions
resulted in 85th percentile operating speeds between 66 and 69 mph. While these operating
speeds are still more than 5 mph over the reduced work zone speed limit (60 mph), they are
similar to the “tolerance” levels drivers were traveling at upstream of the work zone.
It should be noted that design speed of the temporary diversions (i.e., crossovers) was
45 mph. A higher design speed may have resulted in smaller speed reductions. However, then
the critical influence points would have been located after the crossovers in the two-lane, two-
way sections (similar to the opposite direction of travel). While not included in Table 9, the
speed reductions at these two points were 7 and 9 mph (for 12WB and 3EB, respectively) which
are similar to those in the opposite direction of travel that did not encounter a temporary
diversion. Thus, the controlling factor seems to be the two-lane, two-way operations with
concrete barrier separating the opposite directions of travel.
While site 5 had similar characteristics (i.e., a right lane closure followed by crossover),
the lower initial operating speed (68 mph) and higher temporary diversion design speed (50 mph)
resulted in a lower speed reduction (4 mph). Since the operating speed upstream of the work
zone (68 mph) was 8 mph over the normal non-work zone speed limit (60 mph), and the speed
reduction was small (4 mph) compared to the speed limit reduction (10 mph), the 85th percentile
speed in the crossover (64 mph) was 14 mph over the work zone speed limit (50 mph). If the
speed limit had not been reduced (i.e., remained at 60 mph), the operating speed in the crossover
would have been within 5 mph of the speed limit (assuming the same reduction in speed would
have occurred regardless of the speed limit posted).
34
Table 9. 85th Percentile Speed Changes at Lane Closures.
Data Collection Location 1
Data Collection Location 2
Site Description
85th Percentile
Speed (mph)
Description Work Zone Factor(s)
85th Percentile
Speed (mph)
Speed Change L1-L2 (mph)
3WB Upstream
of WZ (SL=70)
76 LLC (WZSL=60)
2L2W BS 66 -10
12EB Upstream
of WZ (SL=70)
76 LLC (WZSL=60)
2L2W BS 69 -7
3EB Upstream
of WZ (SL=70)
76 RLC (WZSL=60)
TD (DS=45) 68 -8
12WB Upstream
of WZ (SL=65)
75 RLC (WZSL=60)
TD (DS=45) 66 -9
5EB Upstream
of WZ (SL=60)
68 RLC (WZSL=50)
TD (DS=50) 64 -4
4NB Upstream of LLC & TD
(SL=55) 65
LLC & TD a (WZSL=55)
(DS=55) UW 58 -7
4NB Upstream of LLC & TD
(SL=55) 65
LLC & TD a (WZSL=55)
(DS=55) -- 63 -2
WZ = Work Zone; SL = Speed Limit; LLC = Left Lane Closure; RLC = Right Lane Closure; 2L2W = Two-Lane, Two Way; BS = Barrier Separated; TD = Temporary Diversion; DS = Design Speed; UW = Unprotected Workers (no barrier) -- No work zone factors present. a Two northbound main lanes were being diverted onto frontage road. During data collection, the left lane was closed just upstream of the temporary diversion, throughout the diversion, and along the frontage road.
Again, researchers do not know whether a higher design speed (e.g., one equal to the
normal speed limit) would have impacted speed choice, but it is assumed that a higher design
speed would produce an even smaller speed change. If this were the case, the critical influence
point would have been located after the crossovers in the two-lane, two-way section where no
traffic control devices or barrier were used to separate the two directions of travel. While not
35
included in Table 9, the speed reduction at this point was equal to the speed reduction at the
crossover; thus, motorists did not further reduce their speed once in the two-lane, two-way
section. Since the operating speeds adjacent to the concrete barrier in the two-lane, two-way
sections for site 3 and site 12 were all greater than 65 mph, researchers do not think that the use
of concrete barrier between opposing travel directions at site 5 would have led to further speed
reductions (considering the operating speed was already less than 65 mph).
At site 4, the 85th percentile speed adjacent to unprotected workers and equipment in the
closed lane (58 mph) was 7 mph less than the 85th percentile speed immediately upstream of the
lane closure. Again, it appears that motorists do decrease their speed when they encounter a
perceived apparent need to do so (i.e., the presence of workers and equipment operating right
next to the open travel lane). While data were not collected at sites with more than one travel
lane remaining open, researchers believe that the speed reductions adjacent to the work activity
would have been less since motorists would have more room to maneuver.
Researchers also collected data when the lane closure was in place but no work activity
was occurring in the closed lane (i.e., between deliveries of the bridge piers). The last row of
Table 9 shows these data. Similar to the findings at site 5, when workers were not present the
lane closure and temporary diversion did not result in a large speed reduction (2 mph).
Based on the results in Table 9, it seems that a maximum speed reduction of 10 mph is
justified on roadways with higher operating speeds when the work zone traffic control plan
includes: 1) lane closures or crossovers to temporarily divert traffic, and 2) traffic traveling on a
two-lane, two-way roadway section with concrete barrier within 2 ft of the travel lanes.
However, these same conditions do not seem to justify a reduced speed limit when the existing
speed limit is less than 65 mph. At all operating speeds, a 10 mph maximum speed reduction
seems reasonable when workers are in a closed lane unprotected by barrier and only a single
travel lane remains open in the work zone.
Speed Characteristics at Sites with Temporary Diversions
Currently in Texas, a maximum speed reduction of 10 mph may also be used for
activities requiring a temporary diversion to be “constructed.” Data for “constructed” temporary
diversions (i.e., crossovers) were discussed in conjunction with the lane closure data above.
36
Researchers collected speed data at two sites with temporary diversions that used existing
exit ramps with some modifications (e.g., extended pavement, widened width to accommodate
two lanes, etc.). While these temporary diversions were not “constructed,” researchers wanted to
investigate their impacts on motorists’ speed choice.
At the first site (site 6) only one lane of traffic was diverted onto the frontage road. In the
southbound direction, upstream of the temporary diversion there was only one lane of traffic
since this section of roadway was a two-lane, two-way facility. In the northbound direction, the
roadway was a four-lane divided facility; thus, a left lane closure was used to reduce the number
of open lanes from two to one prior to entering the temporary diversion. At site 6, the speed
limit (60 mph) was not reduced for the temporary diversion. At the second site (site 8)
temporary diversions were used in both directions of travel to divert two main lanes of traffic
from the original roadway to the frontage road. Similar to site 6, the speed limit (60 mph) at
site 8 was not reduced for the temporary diversion.
Table 10 shows that the speed changes at these sites were mixed. Negligible speed
changes occurred on facilities with operating speeds upstream of the work zone closer to 60 mph.
While a 3 mph reduction occurred at the site with the highest operating speed upstream of the
work zone, this speed decrease did not result in an operating speed lower than the normal speed
limit. Overall, these data imply that a speed limit reduction is not needed prior to temporary
diversions that utilize existing exit ramps and have design speeds of at least 50 mph. The impact
on speed choice with these same types of temporary diversions with lower design speeds is not
known.
Speed Characteristics at Sites with Unexpected Conditions
“Unexpected conditions” are listed as a factor that can be used to justify a speed limit
reduction in work zones. As the name implies, these conditions are not always readily apparent
to motorists. Researchers collected data at three sites where “unexpected conditions” were used
to justify a reduced speed limit. At the first site (site 10) the work activity was in the median
between the two directions of travel and concrete barrier was used to separate the work activity
from the active travel lanes. At various locations there were openings in the concrete barrier to
allow for construction vehicles to enter and exit the work area. At these entrances trucks would
37
have to slow down in the left lane (which was open to traffic) before turning into the work area.
The speed limit at site 10 was reduced from 70 mph to 60 mph.
Table 10. 85th Percentile Speed Changes at Temporary Diversions.
Data Collection Location 1
Data Collection Location 2
Site Description
85th Percentile
Speed (mph)
Description Work Zone Factor(s)
85th Percentile
Speed (mph)
Speed Change L1-L2 (mph)
6NB Upstream
of WZ (SL=60)
62 TD
(SL=60) (DS=50)
-- 60 0
6SB Upstream
of WZ (SL=60)
62 TD
(SL=60) (DS=50)
-- 63 +1
8EB Upstream
of WZ (SL=60)
67 TD
(SL=60) (DS=50)
-- 64 -3
SL = Speed Limit; TD = Temporary Diversion; DS = Design Speed -- No work zone factors present.
At the second site (site 4) the temporary diversion of a limited access facility onto a
frontage road resulted in what work zone designers judged to be unexpected conditions (e.g.,
driveways, intersections, turning traffic, etc.) that warranted a reduced speed limit. As discussed
previously, the 15 mph speed limit reduction (70 mph to 55 mph) at this site was warranted
based on the occurrence of a high number of crashes in an adjoining project, and the work zone
was actively patrolled by law enforcement on a daily basis.
At the third site (site 1) a four-lane divided facility was converted to a two-lane, two-way
facility using lane closures and crossovers; however, since this was not a limited access facility
motorists crossing over the roadway under construction had to watch for traffic from both
directions before proceeding whereas prior to construction motorists only crossed one direction
of travel at a time. Local law enforcement actively enforced the speed limit at site 1 which was
reduced from 70 mph to 60 mph.
Table 11 shows that while a 6 mph speed reduction occurred at site 10, the operating
speed adjacent to one of the active construction entrances was still 11 mph over the work zone
38
speed limit (60 mph). This is not surprising since the “unexpected condition” of trucks entering
and exiting the work area was not readily apparent to motorists unless they were directly
impacted by a truck entering or exiting the traffic stream. In contrast, at the sites where
enforcement was used on a regular basis to emphasize the need to slow down (site 1 and site 4),
85th percentile speeds at the “unexpected condition” locations decreased by 10 to 18 mph. At
site 1, these speed reductions resulted in operating speeds lower than the work zone speed limit
(60 mph). While the operating speed at site 4 was still 6 mph over the work zone speed limit, it
was closer to the work zone speed limit than the operating speed at the site without enforcement.
Overall, these data support the theory that when the hazardous condition used to justify a reduced
speed limit is not readily apparent to motorists, they are less likely to reduce their speeds
voluntarily. Therefore, work zones where motorists do not adequately perceive the hazardous
condition would be those most in need of enforcement.
Table 11. 85th Percentile Speed Changes at Unexpected Conditions.
Data Collection Location 1
Data Collection Location 2
Site Description
85th Percentile
Speed (mph)
Description Work Zone Factor(s)
85th Percentile
Speed (mph)
Speed Change L1-L2 (mph)
10NB Upstream
of WZ (SL=70)
77 CE (WZSL=60) UC 71 -6
4SB Upstream
of WZ (SL=70)
71 FR (WZSL=55) UC 61 -10
1EB Upstream
of WZ (SL=70)
72 2L2W (WZSL=60) UC 54 -18
1WB Upstream
of WZ (SL=60)
73 2L2W (WZSL=60) UC 57 -16
WZ = Work Zone; SL = Speed Limit; CE = Construction Entrance; FR = Frontage Road; UC = Unexpected Conditions; 2L2W = Two-Lane, Two-Way
39
Short Term Work Zone Speed Limits
All of the work zones included in the field studies used long term work zone speed limits;
thus, the reduced speed limit was in effect 24 hours a day, seven days a week. However, at three
sites (site 7, site 10, and site 11) there were no restricted geometrics or other conditions readily
apparent to motorists for the speed limit reductions. Discussions with TxDOT personnel
confirmed that the reduced speed limits were requested and granted since lane closures with
unprotected workers were used at various times throughout the projects’ durations. While
TxDOT initially planned to implement short term work zone speed limits only when the lane
closures were in place, long term work zone speed limits had been implemented instead due to
the desires of local law enforcement for the reduced speed limit to always be in effect.
As shown in Table 12, the 85th percentile speed at these sites typically decreased
downstream of the reduced work zone speed limit and then practically remained the same
adjacent to the roadside work activity even though at some sites concrete barrier was located
within 2 ft of the inside lane. Researchers believe that the concrete barrier had less of an effect
on motorists’ speed choice at these sites since more than one travel lane was open; thus, the
motorists were not as “restricted” by the concrete barrier (as compared to two-lane, two-way
operations with barrier dividing opposing directions of travel). All of the operating speeds
throughout the work zones remained above 65 mph, which is well above the reduced speed
limits. Obviously, motorists did not perceive a need to slow down to the posted work zone speed
limit since the work activity was removed from the active travel lanes and there was no other
apparent hazard.
As discussed previously, at site 11 the ingress and egress of construction trucks entering
the work area (i.e., “unexpected condition”) was another valid reason for implementing reduced
speed limits. When there was no work activity present and thus trucks were not using the
construction entrances, the reduced work zone speed limit could have been removed. In
addition, when the reduced work zone speed limit was in effect for the “unexpected condition”
law enforcement should have been used to actively enforce it.
Overall, short term work zone speed limits should have been utilized at all three of these
sites (as initially planned). However, it appears that differences between TxDOT’s work zone
speed limit policy and law enforcement’s speed limit philosophies seem to be hindering the
implementation of short term work zone speed limits. TxDOT needs to educate law enforcement
40
about their work zone speed limit policy and offer solutions that both agencies can use to better
manage and enforce short term work zone speed limits.
Table 12. 85th Percentile Speed Characteristics at Sites that Should Have Implemented Short Term Work Zone Speed Limits.
Site Data Collection Location Description Speed Limit (mph)
85th Percentile Speed (mph)
7NB Upstream of WZ
Downstream of WZSL Roadside work activity a
70 60 60
75 72 73
7SB Upstream of WZ
Downstream of WZSL Roadside work activity a
65 60 60
67 74 70
10NB
Upstream of WZ Downstream of WZSL
Roadside work activity a,c
Roadside work activity a
70 60 60 60
77 70 b
71 74
10SB Upstream of WZ
Downstream of WZSL Roadside work activity a,c
70 60 60
76 d 71 71
11NB
Upstream of WZ Downstream of WZSL
No work activity Roadside work activity
65 55 55 55
72 68 73 71
11SB
Upstream of WZ Downstream of WZSL Roadside work activity
No work activity
65 55 55 55
73 70 67 69
a Barrier within 2 ft of the inside travel lane. b Data collection site in horizontal curve. The angle at which speed data were collected may have produced lower speeds than actually present. c Adjacent to construction entrance. d Average of data collected on I-35W and I-35E.
SUMMARY
Motorist Survey
Overall, 66 percent of the motorists surveyed thought that the speed limit was reduced in
more than half of all Texas work zones. This is not surprising based on the many conditions,
factors, and combinations thereof now used to justify the reduced speed limits in work zones.
41
While 98 percent of the participants thought that reduced speed limits in work zones improve
safety, they prefer that the speed limit reduction be removed when no work activity is present.
Since numerous studies have shown low levels of compliance with reduced work zone
speed limits, some may question whether the participants would actually slow down for the work
zone conditions addressed. However, the survey results only indicate that the participants would
slow down from their normal operating speed for these work zone conditions. This does not
necessarily imply that they would slow down to the posted work zone speed limit. Nonetheless,
the survey results do suggest that motorists are aware of the potential hazards present in work
zones and believe that they adjust their speeds accordingly when they encounter such hazards.
Field Studies
Surprisingly, at half of the field study sites the 85th percentile speed upstream of the work
zone was 5 to 10 mph over the normal non-work zone speed limit. Consistent with previous
research, in general the 85th percentile speeds downstream of a reduced work zone speed limit
sign decreased slightly (on average by 3 mph); however, the operating speeds were still 9 to
16 mph over the work zone speed limit. In addition, the speed reduction downstream of the
work zone speed limit sign was fairly consistent across the sites although the sites included both
5 and 10 mph speed limit reductions. Therefore when no other work zone conditions are present,
it does not appear that motorists utilized the amount of the speed limit reduction to judge how
much they should reduce their speed.
Researchers observed motorists’ driving behavior (i.e., speed choice) adjacent to several
work zone condition/factor combinations currently used to justify reduced speed limits in work
zones. Based on the results of the field studies, researchers concluded the following.
• A 5 mph maximum speed reduction is more applicable for lane encroachment
conditions with unprotected workers, pavement edge drop off within 2 ft of a travel
lane, lane widths reduced to 10 ft, and traffic control devices encroaching into the
travel lane. Furthermore, it may not be necessary to reduce the speed limit even by
5 mph if operating speeds are already near or below 60 mph.
• Even though data were not collected for shoulder activities, researchers expect that
motorists’ speed choice would be similar to those found next to lane encroachment
situations.
42
• Independent of operating speed, a 10 mph maximum speed reduction is warranted
when workers are in a closed lane unprotected by barrier and only a single lane
remains open in the work zone. When more than one travel lane will remain open,
speed reductions less than 10 mph should be considered.
• For lane closures where unprotected workers is not a factor, a 10 mph maximum
speed reduction is justified on roadways with existing speed limits greater than or
equal to 65 mph when the lane closure results in only a single lane remaining open
and concrete barrier is within 2 ft of the travel lane. However these same conditions
do not seem to justify a reduced speed limit when the existing speed limit is less than
65 mph. In addition, reduced speed limits do not seem warranted for lane closures on
roadways with existing speed limits greater than or equal to 65 mph when more than
one travel lane remains open (and unprotected workers is not a factor).
• A 10 mph maximum speed reduction is justified on roadways with existing speed
limits greater than or equal to 65 mph when the work zone traffic control plan
includes a “constructed” temporary diversion (i.e., crossover) and traffic traveling on
a two-lane, two-way roadway with concrete barrier within 2 ft of the travel lanes.
However these same conditions do not seem to justify a reduced speed limit when the
existing speed limit is less than 65 mph.
• A speed limit reduction is not needed prior to temporary diversions that utilize
existing exit ramps and have design speeds of at least 50 mph.
• Some hazardous work zone conditions used to justify reduced speed limits in work
zones (e.g., construction entrances, turning traffic, crash history, etc.) are not
adequately perceived by motorists and thus are in the most need of enforcement since
motorists are less likely to reduce their speeds voluntarily.
• Differences between TxDOT’s work zone speed limit policy and law enforcement’s
speed limit philosophies are hindering the implementation of short term work zone
speed limits. TxDOT should educate state and local law enforcement agencies about
their work zone speed limit policy and offer solutions that both agencies can use to
better manage and enforce short term work zone speed limits.
43
CHAPTER 1.3: NATIONAL COMPARISON OF WORK ZONE SPEED LIMIT LAWS
INTRODUCTION
The Texas legislature has established prima facie speed limits on all public roadways in
Texas. Recognizing that the prima facie speed limits are not always appropriate for specific
roadway conditions, the Texas legislature has assigned the Texas Transportation Commission the
authority to set regulatory speed limits for specific roadway segments. This authority is defined
in Section 545.353 of the Texas Transportation Code, the relevant parts of which are presented in
Figure 5 below (3).
As noted in subsection (a), the law only allows the Texas Transportation Commission to
establish a prima facie speed limit on a section of roadway by means of an order documented in
the meeting minutes of the Commission. Consequently, speed limits can only be changed when
the Commission meets. Furthermore, the subsection refers to “a” prima facie speed limit
(singular tense), which indicates that only one speed limit can be defined at a time for a given
roadway segment through the Commission minute order process.
Theoretically, a reduced speed limit could be changed during the time a work zone is in
place if a second request was taken to the Commission and once again approved in its meeting
minutes. However, the practicality of preparing multiple speed limit reduction requests and then
timing their submission to the Commission to match up with changes in work zone conditions is
very limited. As a result, a speed limit reduction request is normally based on the worst-case
conditions that are anticipated to exist at any time while the work zone is in place. Then, the
reduced speed limit sign is either left covered until the time that the worst-case conditions occur
in the work zone, or established as a long term speed limit that remains in place for the duration
of the work zone. This latter approach is almost mandated if there is any need for a second,
smaller speed limit reduction any other time during the course of work activities at the site. For
example, TxDOT might perceive the need for only a 5 mph reduction in the speed limit most of
the time in a work zone where the lane widths have been reduced slightly, but desire a 10 mph
speed limit reduction during times when work crews are at the site and in close proximity to
traffic moving through the work zone. Under current Texas law, TxDOT would be forced to
request a 10 mph speed limit reduction for those times when the workers are present, and either
44
leave that reduction up at other times (even though a 5 mph speed limit reduction would be more
applicable), or leave the normal speed limit in place during the times when no work activity is
present (although a 5 mph reduction may be desired for reduced lane widths) and then post the
10 mph reduced speed limit only during those hours when workers are present.
§ 545.353. AUTHORITY OF TEXAS TRANSPORTATION COMMISSION TO ALTER SPEED LIMITS. (a) If the Texas Transportation Commission determines from the results of an engineering and
traffic investigation that a prima facie speed limit in this subchapter is unreasonable or unsafe on a part of the highway system, the commission, by order recorded in its minutes, and except as provided in Subsection (d), may determine and declare:
(1) a reasonable and safe prima facie speed limit; and (2) another reasonable and safe speed because of wet or inclement weather. (b) In determining whether a prima facie speed limit on a part of the highway system is
reasonable and safe, the commission shall consider the width and condition of the pavement, the usual traffic at the affected area, and other circumstances.
(c) A prima facie speed limit that is declared by the commission under this section is effective
when the commission erects signs giving notice of the new limit. A new limit that is enacted for a highway under this section is effective at all times or at other times as determined.
.
.
. (e) The commission, in conducting the engineering and traffic investigation specified by
Subsection (a), shall follow the "Procedure for Establishing Speed Zones" as adopted by the commission. The commission may revise the procedure to accommodate technological advancement in traffic operation, the design and construction of highways and motor vehicles, and the safety of the motoring public.
(f) The commission's authority to alter speed limits applies:
(1) to any part of a highway officially designated or marked by the commission as part of the state highway system; and
(2) both inside and outside the limits of a municipality, including a home-rule municipality, for a limited-access or controlled-access highway.
(g) For purposes of this section, "wet or inclement weather" means a condition of the roadway
that makes driving on the roadway unsafe and hazardous and that is caused by precipitation, including water, ice, and snow.
45
Texas law does specifically authorize TxDOT to remove or cover reduced work zone
speed limit signs when they are not needed, thereby returning the speed limit to its pre-work
zone value, as shown in Figure 6.
Figure 6. Texas Statutes Regarding Covering of Work Zone Speed Limit Signs.
SPEED LIMIT RESTRICTIONS IN OTHER STATES
Authorization to Use Variable Speed Limits
Other states appear to have more flexibility in how they establish regulatory speed limits.
A number of states (Delaware, Indiana, Virginia, and Washington) have specific language that
allows variable speed limits (VSLs) to be displayed, if desired (Table 13). Delaware, Virginia,
and Washington each have specific roadways where variable speed limits have been
implemented.
Although the language is fairly consistent across the four states shown, it should be noted
that no such language exists in the statutes for two other states (Missouri and Tennessee) which
also allow variable speed limits on part of its roadway system (Table 14). In Missouri, the
transportation and highway commission is granted authority to reduce the speed limits, but
without the minute order requirement that exists in Texas law. In Tennessee, the Department of
Transportation (DOT) is empowered to modify speed limits on roadways, although the
transportation commissioner must issue a policy statement regarding the reduced speed limit that
is to be placed in effect once appropriate signs are installed. Presumably, such statements can be
issued at any time without the need for any type of formal meeting. (Tennessee does not have
§ 201.907. REMOVING OR COVERING SIGNS IN CONSTRUCTION OR MAINTENANCE WORK ZONE. (a) In this section, "construction or maintenance work zone" has the meaning assigned by
Section 472.022. (b) The department shall remove or cover or require the removal or covering of a sign that
restricts the speed limit in a construction or maintenance work zone during any period when no hazard exists that dictates the need for a restricted speed limit.
46
multiple transportation commissioners, making scheduled meetings where business of this nature
can be formally addressed unnecessary.)
Table 13. Statutes in VSL States Explicitly Authorizing VSLs.
The Department shall declare a reasonable and safe maximum limit thereat, which limit shall be effective when posted. Such maximum limit may be declared to be effective either part or all of the time and differing limits may be established for different times of the day, for different types of vehicles, for different weather conditions and when other significant factors differ. Such maximum limits may be posted on fixed or variable signs.
Indiana (Title 9, Article 21, Chapter 5) (41)
A maximum speed limit under this section may be declared to be effective at all times or at times indicated on the signs. Differing limits may be established for different times of day, different types of vehicles, varying weather conditions, and other factors bearing on safe speeds. The differing limits are effective when posted on appropriate fixed or variable signs.
Virginia (Title 46.2, Chapter 8, Section 881) (42)
The Commonwealth Transportation Commissioner is expressly authorized to establish and indicate variable speed limits on such structures or roadways to be effective under such conditions as would in his judgment, warrant such variable limits, including but not limited to darkness, traffic conditions, atmospheric conditions, weather, emergencies, and like conditions which may affect driving safety. Any speed limits, whether fixed or variable, shall be prominently posted in such proximity to such structure or roadway as deemed appropriate by the Commonwealth Transportation Commissioner.
Washington (Title 46, Chapter 61, Section 400) (43)
(A) maximum speed limit may be declared to be effective at all times or at such times as are indicated upon the said signs; and differing limits may be established for different times of day, different types of vehicles, varying weather conditions, and other factors bearing on safe speeds, which shall be effective (a) when posted upon appropriate fixed or variable signs.
47
Table 14. Statutes in VSL States without Explicit Authorization of VSLs.
State and Statute or Code Relevant Sections
Missouri (Chapter 304, Section 304.010)(44)
On any state road or highway where the speed limit is not set pursuant to a local ordinance, the highways and transportation commission may set a speed limit higher or lower than the uniform maximum speed limit provided in subsection 2 of this section, if a higher or lower speed limit is recommended by the department of transportation. The department of public safety, where it believes for safety reasons, or to expedite the flow of traffic a higher or lower speed limit is warranted, may request the department of transportation to raise or lower such speed limit, except that no speed limit shall be set higher than seventy miles per hour.
Tennessee (Title 55, Chapter 8, Section 153) (45)
The department of transportation is empowered to lower the speed limits prescribed in § 55-8-152 in business, urban or residential districts, or at any congested area, dangerous intersection or whenever and wherever the department shall determine, upon the basis of an engineering and traffic investigation, that the public safety requires a lower speed limit. Engineering and traffic investigations used to establish special speed zone locations and speed limits by municipalities on state highways shall be made in accordance with established traffic engineering practices and in a manner that conforms to the Tennessee manual on uniform traffic control devices (MUTCD). The investigations shall be documented and documentation shall be maintained by the jurisdiction performing or sponsoring the investigation. When the department shall determine that it is necessary to reduce the speed limits set in subsection (a), the commissioner shall so indicate the reduced speed limit via a letter of policy statement, and the commissioner shall cause signs indicating the new speed limit to be erected.
Based on these examples, one could conclude that it is the Texas Transportation
Commission meeting minute order requirement to alter speed limits in Texas law that is most
constraining when attempting to adjust work zone speed limits to conditions as they are changed
48
over the course of a project. One way in which this constraint could be overcome would be for
the Texas legislature to grant TxDOT authority to determine and post appropriate speed limits in
work zones, separate from the way that speed limits are established for normal, non-work-zone
conditions. In fact, this is the approach that has been taken by Oklahoma (46). Oklahoma law is
very similar to Texas law in that the state highway commission is authorized to establish speed
limits for most situations. However, a special statute targeted specifically at work zone speed
limits has been included to allow the DOT itself to determine the appropriate speed limit in a
work zone and to post that speed limit without formal approval by the commission (Figure 7).
Figure 7. Speed Limit Statutes in Oklahoma (46).
As another example of how some states accommodate reduced speed limits in work
zones, Minnesota law normally requires the transportation commissioner to authorize a speed
limit based on the results of a traffic and engineering investigation (47). However, this
requirement is explicitly waived for work zone situations, as shown in Figure 8.
§47-11-802. ESTABLISHMENT OF STATE SPEED ZONES. Whenever the State Highway Commission shall determine upon the basis of an engineering and traffic investigation that any maximum speed hereinbefore set forth is greater or less than is reasonable or safe under the conditions found to exist at any intersection or other place or upon any part of the state highway system, said Commission may determine and declare a reasonable and safe maximum limit thereat which, when appropriate signs giving notice thereof are erected, shall be effective at all times, or during hours of daylight or darkness or at such other times as may be determined at such intersection or other place or part of the highway. 46-11-806. Special Speed Restrictions C. Where any state or federal highway or turnpike shall be under construction, maintenance,
or repair or when a detour shall have been designated by reason of construction, maintenance, or repairs in progress and a maximum safe, careful, and prudent speed shall have been determined by the Oklahoma Department of Transportation on the highway or highway detour or by the Oklahoma Transportation Authority on the turnpike or turnpike detour during the period of the construction, maintenance, or repairs and shall have plainly posted at each terminus thereof and at not less than each half mile along the route thereof the determined maximum speed, no person shall drive any vehicle upon the portion of the highway or the highway detour or upon the portion of the turnpike or the turnpike detour at a speed in excess of the speed so determined and posted.
49
Figure 8. Speed Zoning Statutes in Minnesota (47).
SUMMARY
Relative to several other states, current Texas law is fairly restrictive in terms of
establishing reduced speed limits in work zones. Most of the difficulties lie in the need to
establish a single speed limit on a roadway segment through an order documented in the meeting
minutes of the Texas Transportation Commission. Whereas current law allows TxDOT to
deactivate a work zone speed limit when not needed (by removing or covering the sign that
designates the lower speed limit), it does not provide TxDOT with the flexibility to easily
accommodate changes in geometrics or traffic conditions that occur as a highway project is
completed.
It does appear that changes to the current code would be needed to provide additional
flexibility to TxDOT to address changing conditions in a work zone through changes in a
reduced work zone speed limit. Several other states have recognized the need for this flexibility
and have laws on their books to grant the DOT or its representative the authority to determine
and post appropriate work zone speed limits. Given that a precedent has been set, TxDOT
should consider requesting legislative action to grant authority to the Executive Director or his
designee to establish work zone speed limits, rather than the Texas Transportation Commission.
169.14 SPEED LIMITS, ZONES Subd. 4. Establishment of zones by commissioner. On determining upon the basis of an engineering and traffic investigation that any speed set forth in this section is greater or less than is reasonable or safe under the conditions found to exist on any trunk highway or upon any part thereof, the commissioner may erect appropriate signs designating a reasonable and safe speed limit thereat, which speed limit shall be effective when such signs are erected. Subd. 5d. Speed zoning in work zone; surcharge. (a) The commissioner, on trunk highways and temporary trunk highways, and local authorities, on streets and highways under their jurisdiction, may authorize the use of reduced maximum speed limits in highway work zones. The commissioner or local authority is not required to conduct an engineering and traffic investigation before authorizing a reduced speed limit in a highway work zone.
51
PART 2 – ALTERNATIVE WORK ZONE SPEED LIMIT DEVICES
53
CHAPTER 2.1: IDENTIFICATION OF ALTERNATIVE WORK ZONE SPEED LIMIT
DEVICES
INTRODUCTION
According to the TxDOT Barricade and Construction (BC) Standard Sheets (21), the use
of short term work zone speed limits is appropriate when work activity is within 15 ft of the
pavement edge or actually on the pavement and workers or equipment are not behind concrete
barrier. In these situations, short term work zone speed limits should be posted and visible to
motorists only when work activity is present, and should only be posted in the vicinity of the
work activity, not throughout the entire project.
When work activity is not present, the short term work zone speed limit signs should be
removed or covered; thereby allowing the legal speed limit for that segment to revert back to the
normal non-work zone speed limit. Turning signs from view or laying signs over or down is not
an allowable method of indicating that the short term work zone speed limit is not in effect.
It is important to recognize that the daily install/remove or uncover/cover process of signs
represents an additional task for the contractor that reduces overall work productivity. In
addition, the potential exists for the contractor to forget or simply choose not to cover or remove
signs. In effect, the failure to cover or remove the signs turns the short term limit into a
long/intermediate one and further reduces the credibility of TxDOT’s work zone speed limit
procedures with the public.
Recently, vendors have developed and are marketing internally illuminated and other
types of signs that will allow a reduced regulatory speed limit to be displayed during portions of
the day or night when work activity is occurring, and the normal non-work zone regulatory speed
limits to be displayed when the reduced speed limit is no longer applicable. Such a device would
simplify the short term work zone speed limit implementation process and could lead to a greater
use of short term work zone speed limits in general. Thus, during the first year of the research
project TTI researchers identified and critiqued alternative technologies for better managing
short term work zone speed limits. Based on these findings, researchers made recommendations
for further evaluations.
54
ALTERNATIVE DEVICES
The alternative work zone speed limit devices identified and critiqued by researchers
were grouped into three categories: portable static speed limit signs, electronic speed limit
(ESL) signs, and various other technologies. The following sections describe these categories in
more detail.
Portable Static Speed Limit Signs
In Indiana, trailer-mounted static speed limit signs with flashing beacons are used to
indicate reduced speed limits in work zones (Figure 9). This device’s portability allows it to be
easily moved along with the work activity; therefore, potentially reducing the occurrence of
installing work zone speed limit signs throughout the entire project. When the beacons are
flashing, the reduced speed limit is in effect. When the beacons are not flashing, the reduced
speed limit is not in effect (i.e., the normal non-work zone speed limit is in effect.)
This concept is similar to the use of flashing beacons in school zones to indicate when
reduced school zone speed limits are in effect. However, according to the Texas Transportation
Code (22), a work zone speed limit sign can only be made inoperative by removing or covering
the sign. Thus, Texas law does not currently allow for flashing beacons to be used to indicate
whether or not a short term work zone speed limit is in effect. In addition, previous research (48)
found that this device produced mixed results with respect to reducing speeds. In 2007, these
devices cost approximately $4000 (including everything shown in Figure 9 plus two additional
speed limit signs).
Figure 9. Example of Portable Static Speed Limit Sign Used in Indiana.
55
Flexible reflective roll-up work zone warning signs (diamond shape) are used extensively
in Texas for short term stationary and short duration operations due to their ease of use (can
quickly be installed/removed and are more portable). Interestingly, TTI researchers identified a
few vendors that currently sell flexible roll-up speed limit signs (Figure 10). In 2008, these signs
cost approximately $175 each (does not include sign stand).
Figure 10. Example of Flexible Roll-up Work Zone Speed Limit Sign.
Another potential static technology explored by researchers was STOP/SLOW automated
flagger assistance devices (AFADs). Via remote operation, these devices can either display a
STOP sign or a SLOW sign to approaching motorists. Researchers talked with multiple vendors
about retrofitting and/or redesigning AFADs for the display of two speed limit signs (normal
non-work zone and reduced work zone speed limits) in order to more easily change between the
two speed limits and eliminate the need to remove or cover the signs each day. However,
without extensive changes to the typical AFAD design this could not be easily accomplished. In
addition, further adaptations would be required if the use of a third speed limit sign (i.e.,
nighttime non-work zone) was needed. Researchers could not obtain a cost estimate since this
application of an AFAD was not readily available.
56
Electronic Speed Limit Signs
In the past 10 years, the desire to use variable speed limits under normal traffic
conditions, as well as in work zones, has increased in the United States. To help implement
variable speed limits, vendors developed ESL signs. There are two types of ESL signs: static
signs with internally illuminated changeable numbers (Type 1) and fully illuminated speed limit
signs (Type 2). Figure 11 shows these two types of ESL signs, respectively.
a) Type 1 b) Type 2
Figure 11. Examples of the Two Types of ESL Signs.
Several vendors sell Type 1 ESL signs; however, currently only a few of these vendors
readily offer trailer-mounted versions. Type 1 ESL signs are typically comprised of a standard
speed limit sign (R2-1) with white or orange light emitting diodes (LEDs) that display numbers
from zero to 99. The LEDs may be white or orange according to the Texas MUTCD (14). Even
though the number display is dimmed at night, the internally illuminated numbers tend to be
visible before the retroreflective “SPEED LIMIT” legend.
In 2007, researchers only identified one vendor of Type 2 ESL signs. At that time, the
Type 2 ESL sign could display a 48 by 60 inch reverse screen speed limit sign (white LEDs on a
black background). Per a letter from the Federal Highway Administration (FHWA) (49), the
Type 2 ESL sign conforms to the requirements of the MUTCD Chapters 2A and 2B (50); thus,
no experimentation is necessary. The Type 2 ESL sign displays 18 inch numbers from zero to
99. The main advantage to the Type 2 ESL sign is that the whole sign is internally illuminated;
so at night the “SPEED LIMIT” legend and numbers are visible at the same time.
57
Both types of ESL signs allow for the posted speed limit to be adjusted without having to
physically change the sign. Thus, ESL signs can be used to more easily change between the
reduced work zone speed limit, normal non-work zone daytime speed limit, and normal non-
work zone nighttime speed limit (when needed). However, the process by which this is
accomplished varies between vendors. While some Type 1 ESL signs can be controlled
manually at the device, most are designed to be remotely controlled via wireless communication
(e.g., pager, cell phone, personal digital assistants [PDAs], webpage interface). Permanent
installations can also use hard wire connections (e.g., dial-up, fiber, Ethernet, etc.). Some of the
Type 1 ESL signs also include a scheduling feature similar to those used to control flashing
beacons on school zone speed limit sign assemblies. In theory, personnel could create a speed
limit schedule for a highway project for a given time period (e.g., week, month, year, etc.);
however, unlike school zones highway work activity periods vary from day to day (e.g., begin or
end earlier or later than planned, cancelled due to weather, etc.).
A Bluetooth™ enabled PDA with special software must be used to communicate with the
Type 2 ESL sign. A speed limit schedule must be developed on a desktop computer, transferred
to the PDA, and then uploaded to speed limit sign. More than one speed limit schedule may be
created and personnel can override the scheduling. However, overriding the scheduling does not
allow personnel to change the speed limit. Instead, it just places the sign into the “default” mode
(which is user defined). Concerns regarding the use of wireless communications include:
• additional cost of wireless communication devices (pager, cell phones, PDA, etc.);
• additional cost of data services (for those that require internet access);
• additional cost for software;
• training; and
• not being able to change the speed limit in the field.
Most ESL signs also have event logging capabilities that can be used to document the
date and time of speed limit changes. In addition, radar and cameras can be added to some ESL
signs to collect data (e.g., the date, time, and speed of passing vehicles, vehicle count,
compliance, etc.). Trailer-mounted ESL signs are battery operated and use solar panels to
recharge the batteries. In 2007, trailer-mounted Type 1 ESL signs and Type 2 ESL signs cost
approximately $10,000 and $11,000, respectively (there are additional costs for data logging,
scheduling feature, software, and remote communications).
58
Recently, Type 1 ESL signs were evaluated in Utah to determine motorist response to
speed limits that varied based on work zone conditions (51). The 2.5 month study was
conducted on I-80 during a crackseal project that required the roadway to be restricted to one
travel lane in each direction at all hours for the duration of the project. The Type 1 ESL sign
consisted of a 30 inch by 36 inch standard speed limit sign with 18 inch by 12 inch illuminated
numbers. Vehicle speed data were collected under three different signing conditions:
• standard 65 mph speed limit signs;
• ESL sign posted at 65 mph 24 hours a day, 7 days a week; and
• ESL sign varying between 55 mph during the day (work activity) and 65 mph at night
(no work activity).
The results showed that both the average speed and variation in speeds were reduced
when the Type 1 ESL signs were used. The Type 1 ESL signs also resulted in greater
compliance than the standard speed limit signs. However, TTI researchers did identify several
issues with the data collection and analysis methodology. The primary issue was that at various
times congestion occurred due to the construction activity and resulted in vehicle speeds
dropping into the 10 to 30 mph range. However, in the data analysis the congested and non-
congested data were not separated. Thus, the descriptive statistics computed included both types
of situations, which depending upon the number of occurrences and duration of the congestion
could have resulted in lower average speeds, less variation in speed, and higher compliance rates.
Overall, the main advantage of both types of ESL signs is that multiple speed limits
(short term work zone, normal non-work zone daytime, and normal non-work zone nighttime)
can be shown to motorists with one sign. The major disadvantage of both types of ESL signs is
that in most cases personnel cannot change the speed limit displayed on the sign in the field. In
addition, wireless communication devices and additional software are needed to program the
speed limit shown on the signs.
Other Various Technologies
Portable changeable message signs (PCMSs) are traffic control devices commonly used
in work zones to notify motorists of unexpected conditions, including speed reductions. As
shown in Figure 12, speed limit messages are typically created using multiple lines of text which
do not resemble standard speed limit signs (R2-1). Therefore, this display is considered a
59
warning message instead of a regulatory message and thus is used to supplement posted
regulatory speed limit signs.
Figure 12. Example of Speed Limit Message on a PCMS.
In the past few years, full-matrix PCMSs have become available. These devices come
with pre-programmed and user-programmed graphics. While the graphics typically displayed
are construction warning signs (diamond shape), according to discussions with vendors it is
possible to display a speed limit sign (rectangular shape). Although, vendors have recently
introduced full-color, full-matrix PCMSs to the market, the majority of full-matrix PCMSs in use
today only utilize one LED color (e.g., orange). According to the Texas MUTCD (14), it would
seem that a graphic display of a rectangular speed limit sign on a PCMS comprised of only
orange LEDs would not constitute a regulatory speed limit. However, it is unknown whether an
all white LED graphic display of a rectangular speed limit sign on a PCMS would be considered
a regulatory speed limit sign, although the concept is similar to the Type 2 ESL sign which was
approved by FHWA. In 2007, a full-matrix PCMS (orange LED color only) cost approximately
$20,000.
Louvered signs are another type of technology that could potentially be used to display
short term work zone speed limits. These signs are comprised of vertical or horizontal louvers.
Graphics can be applied to both sides of the louvers and the stationary background (if included in
the design), allowing for up to three images. Currently, this type of technology is mainly used in
the advertising industry; thus, no cost estimates were readily available.
60
EVALUATION RECOMMENDATIONS
Based on the critique of the alternative technologies identified for better managing short
term work zone speed limits, researchers recommended that TxDOT evaluate flexible reflective
roll-up static work zone speed limit signs and Type 1 ESL signs. Since these technologies have
not been used extensively for work zone speed limits in Texas, researchers recommended that
field studies be conducted to determine how motorists respond to reduced speed limits posted on
the devices and the ease of use of the devices within a highway work zone. In addition,
researchers recommended that motorist surveys be used to assess motorist understanding and
opinions of the devices.
TxDOT was also interested in the trailer-mounted static speed limit signs with flashing
beacons and the concept of utilizing full-matrix PCMS to display work zone speed limit signs,
even though these devices cannot currently be used to establish work zone speed limits based on
current Texas law and TxDOT standards, respectively. Therefore, researchers recommended that
these two devices also be further explored in the motorist survey.
61
CHAPTER 2.2: LONG TERM STUDY OF
ELECTRONIC SPEED LIMIT SIGNS IN A WORK ZONE
TTI researchers conducted a long term study of the Type 1 ESL signs at a work zone on
US-59 south of Linden in the Atlanta District. The purpose of the study was to determine: 1) the
effect of the ESL signs on vehicle speeds; 2) motorist understanding and opinion of the ESL
signs; and 3) law enforcement’s opinions of the ESL signs. To accomplish this, researchers
performed a “before-after” field study, conducted motorist surveys, and held police discussion
groups.
TYPE 1 ESL SIGNS
Figure 13 shows the two types of ESL signs used in the long term field study. Atlanta
District TxDOT personnel constructed four semipermanent ESL signs from “YOUR SPEED”
signs that were no longer being used by the district. Each sign consisted of a speed limit sign, a
power supply, a light-sensing photocell, and a controller switch. Each sign had an 18 inch by
24 inch work zone sign (G20-9) and a 24 inch by 36 inch speed limit sign (R2-1) with a
changeable LED lamp matrix with a two-digit orange numeric display. The sign height was 7 ft
from the near edge of pavement to the bottom of the sign. The power supply consisted of a solar
panel and battery system that provided continuous power for the LED display. The controller
switch had two settings: non-work zone and work zone. When the controller switch was set to
the non-work zone function, a 70 mph speed limit was displayed during the day, and a 65 mph
speed limit was displayed at night. The photocell detected ambient light conditions to determine
which non-work zone speed limit should be displayed. When the controller switch was set to the
work zone function, a 60 mph speed limit was displayed. The semipermanent ESL signs were
wired such that only these speed limits could be displayed on the sign.
62
a) Semipermanent b) Trailer-Mounted
Figure 13. Type 1 ESL Signs Used in Long Term Field Study.
According to a specification developed by TTI researchers, two trailer-mounted ESL
signs were manufactured by a third-party vendor for use on the project. Appendix D contains a
copy of the specification. These signs consisted of a 1400 lb single-axle trailer, a speed limit
sign, a power supply, and a controller box. The signs did not originally include a 24 inch by
36 inch work zone sign (G20-9), but they were later retrofitted to be consistent with the four
semipermanent ESL signs. The speed limit sign (R2-1) was 48 inches by 60 inches with a
changeable LED lamp matrix with a two-digit orange numeric display. Similar to the
semipermanent ESL signs, the bottom of the trailer-mounted ESL sign was 7 ft above the near
edge of pavement and the power supply consisted of a solar panel and battery system.
The controller box consisted of an aluminum cabinet housing a panel of knobs and toggle
switches that would allow the operator to select the normal (i.e., non-work zone) or work zone
speed limit functions (Figure 14). The normal speed limit function had separate controls for day
and night, which allowed the operator to set both daytime and nighttime speed limits. The sign
was capable of displaying speed limits ranging from 5 to 80 mph, in 5 mph increments. The
controller box also included a light-sensing photocell that detected ambient light conditions. If
63
the speed limit function toggle switch was set to normal speed limit and the
“AUTO/DAY/NIGHT” switch was set to “AUTO,” the detection of nighttime conditions
through the photocell would automatically trigger the display of the nighttime speed limit. When
daytime conditions were detected, the daytime speed limit would automatically be displayed.
Free flow South 1 South 2 Detour North Free flow2 1
43Free flow South 1 South 2 Detour North Free flow
Free flow South 1 South 2 Detour North Free flow
2 1
43
Free flow South 1 South 2 Detour North Free flow
Free flow South 1 South 2 Detour North Free flow
2 1
43
5
6
XX
Figure 15. Treatment Locations during Each Data Collection Period.
66
The first data collection period was in May of 2007, prior to installation of the ESL signs,
when the reduced work zone speed limit was posted using several standard static 60 mph
regulatory speed limit signs with work zone signs (Figure 15a). These signs reduced the speed
limit in the work zone 24 hours a day, seven days a week, whether or not work activity was
present. At that time, the exact locations for the future ESL sign installations were not known.
Data were collected at 14 different sites, which were approximately three-fourths of a mile apart.
Twelve of the sites were located within the reduced work zone speed limit. The other two sites
were located upstream of the work zone in both directions in order to obtain data regarding
normal operating conditions of the roadway. Researchers collected daytime speed data at all
sites and nighttime speed data at four sites. However, it should be noted that no work activity
occurred at night.
Figure 15b shows the four semipermanent ESL signs installed in July of 2007. The ESL
sign locations formed two separate and distinct zones in which the inspector could reduce speed
limits as needed dependent upon the location of the work activity. The south 1 and north zones
were approximately 1.6 and 1.9 miles in length, respectively. In the southbound direction after
the detour a static 70/65 mph sign was displayed when no speed reduction was desired in the
south 2 zone. However, a similar sign was not used at the beginning of the south 2 zone in the
northbound direction; therefore, the speed limit displayed on the ESL sign at the beginning of
south 1 zone also applied to the south 2 zone.
The first “after” data were collected in August of 2007, about 30 days after the
semipermanent ESL signs were installed, in order to reduce impacts of any novelty effects from
the signs. Daytime and nighttime data were collected at the same locations as during the
“before” period. During this phase of data collection, the ESL signs were being used to reduce
the work zone speed limit from 70 mph to 60 mph in the south zone on a daily basis, since the
contractor was performing earthwork on the south end of the project and dump trucks were
entering and exiting the active travel lanes. The north zone speed limit was not regularly being
reduced, but was temporarily reduced from 70 mph to 60 mph for one day for some minor
grading work.
As shown in Figure 15c, in September of 2007, two of the semipermanent signs were
relocated in anticipation of the contractor’s work progressing southward, as well as to
accommodate future work on an adjacent project on the south end. By moving the northbound
67
semipermanent ESL sign at the beginning of the south zone (sign 3 in Figure 15c) further south,
the south zone was extended by 1.1 miles. The northbound semipermanent ESL sign at the
beginning of the north zone (sign 4 in Figure 15c) was also moved. It was placed in the
northbound direction at the beginning of a newly created middle zone which was 3.4 miles in
length. However, there was no corresponding southbound ESL sign to regulate speeds in the
southbound direction of the middle zone. Instead, the inspector continued to use a static
70/65 mph sign when no speed reduction was desired in the southbound middle zone.
Movement of the northbound semipermanent ESL sign at the beginning of the north zone (sign 4
in Figure 15c) also removed the inspector’s ability to regulate speeds in the northbound direction
of the north zone.
In October of 2007, when the researchers returned to collect the second “after” data, the
contractor was performing paving work just south of the detour. However, reducing the speed
limit on the northbound semipermanent ESL sign at the beginning of the middle zone would
have also reduced the speed limit in the northbound direction for the north zone, because an ESL
sign was no longer present after the detour at the beginning of the north zone. Thus, the
inspector had not been using the ESL signs since September, because he did not want to reduce
the speed limit in sections where no activity was occurring. The researchers felt that sign
credibility may have been impacted by the lack of use of the ESL signs and therefore, no data
were collected in October.
After discussions with the inspector and Atlanta District personnel, the researchers
developed a plan to establish the desired speed reduction zones with use of the two trailer-
mounted ESL signs. By adding these ESL signs, a bidirectional middle zone was created to
accommodate the inspector’s need to reduce the speed limit in both directions near the paving
work activity, and the north zone was re-established in both directions. Figure 15c shows the
resulting sign configuration.
In December of 2007, the researchers conducted the second “after” data evaluation. At
this time, data were collected at the same 14 sites as in previous data collection periods plus one
additional site on the south end was added in order to obtain normal operating conditions of the
roadway (i.e., relocation of semipermanent signs on the south end of the project altered the free
flow data collection location). During this phase of data collection, the ESL signs were being
used to reduce the work zone speed limit from 70 mph to 60 mph in the middle zone on a daily
68
basis, since the contractor was performing paving work in the middle zone and concrete trucks
were entering and exiting the active travel lanes. Prior to the second “after” data collection
period, neither the north nor south zone speed limit was regularly being reduced, but each was
temporarily reduced from 70 mph to 60 mph for one day during this data collection period for
work activities. As in the two previous data collection periods, nighttime data were collected at
four locations.
ESL Sign Utilization
The TxDOT inspector manually recorded the use of the ESL signs to reduce the work
zone speed limit in a log book. From the time when the semipermanent ESL signs were installed
(July) until the first “after” data collection period (August), the ESL signs were used to reduce
the work zone speed limit to 60 mph on 82 percent of the contractor’s work days. Similarly,
from the first “after” data collection period (August) until the sign relocations occurred
(September), the ESL signs were used to reduce the work zone speed limit to 60 mph on
80 percent of the contractor’s work days. After the sign relocations, the ESL signs were not used
at all to reduce the work zone speed limit for approximately one month. After the addition of the
trailer-mounted ESL signs, the ESL signs were only used on 40 percent of the contractor’s work
days to reduce the work zone speed limit to 60 mph. This reduction is due to the fact that haul
trucks were able to access the paving operation without entering the active traffic lanes, so no
speed limit reduction was necessary. Overall, during the long term field study the ESL signs
were used on 67 percent of the contractor’s work days.
In order to obtain information about the ease of use of the ESL signs, researchers
interviewed the TxDOT inspector. Overall, the inspector felt that using the ESL signs benefitted
the project and that speeds were “somewhat” reduced when the ESL signs were displaying the
reduced speed limit. The solar power was mentioned as a desirable feature, since an outside
power source was not required to operate the ESL signs. The inspector also felt that the
appearance of the ESL signs was different than the normal work zone speed limit signs, which
made them more noticeable, especially at night. In addition, he indicated that both the
semipermanent and trailer-mounted signs were easy to use, and that he would like to see them
used again on another project.
69
Data Analysis
The descriptive statistics of interest for defining the observed vehicle speeds were sample
size, mean speed, variance, standard deviation, and the percent of vehicles exceeding the speed
limit. Appendix E contains these descriptive statistics for each site during each time period.
Since there was no work being performed by the contractor at night, during all of the nighttime
data collection time periods the speed limit was 65 mph. Researchers used the night data to
verify that speeds in the work zone did not change between study periods.
In order to evaluate the effectiveness of the ESL signs in reducing speeds, researchers
grouped the individual sites into zones corresponding to the locations of the ESL signs, as shown
in Table 15. The site numbers appear in the table in order from south, at the top of the table, to
north, at the bottom of the table. Due to the creation of the middle zone in the second “after”
period, researchers divided the south zone into two zones in the “before” period and first “after”
period so that similar comparisons across time periods could be made.
Table 15. Zones for Each Data Collection Period.
Data Collection Period “Before” First “After” Second “After” Site
Number North Bound
South Bound
North Bound
South Bound
North Bound
South Bound
15 N/A N/A N/A N/A 70 mph 70 mph 1 70 mph 70 mph 70 mph 70 mph N/A N/A 2 South 1 South 1 South 1 South 1 South 1 South 1 3 South 1 South 1 South 1 South 1 South 1 South 1 4 South 2 South 2 South 2 South 2 Middle Middle 5 South 2 South 2 South 2 South 2 Middle Middle 6 South 2 South 2 South 2 South 2 Middle Middle 7 South 2 South 2 South 2 South 2 Middle Middle 8 N/A N/A N/A N/A N/A N/A 9 Detour Detour Detour Detour Detour Detour 10 N/A N/A N/A N/A N/A N/A 11 North North North North North North 12 North North North North North North 13 N/A N/A N/A N/A N/A N/A 14 50 mph 50 mph 50 mph 50 mph 50 mph 50 mph
N/A = Not Applicable
70
During the “before” and first “after” period, researchers collected data upstream of the
work zone in both directions (site 1 and site 14) in order to assess the normal operating
conditions of the roadway. Prior to the second “after” period, relocation of semipermanent signs
on the south end of the project resulted in site 1 being within the south zone of the work zone;
thus, during the second “after” period researchers collected data at a new site upstream of the
south end of the project (site 15). Although data were still collected at site 1 during the second
“after” period, it was not included in the analysis in order to maintain similar comparisons across
time periods for the south zone.
As discussed previously, researchers selected the data collection locations prior to
installation of the four semipermanent ESL signs. After the installation of these signs, several of
the data collection sites (site 8, site 10, and site 13) were located close to the ESL signs. During
both “after” periods, researchers noted that some drivers were making speed adjustments as they
passed these data collection sites; therefore, data from these sites were not included in the final
analysis.
For each zone, the sample size, mean speed, variance, standard deviation, and percent
exceeding the posted speed limit were computed. Researchers then used t-test pairwise
comparisons to determine if there were significant differences among the mean speeds between
time periods and among various uses of the ESL signs within a time period (i.e., displaying
normal non-work zone speed limit and work zone speed limit). In addition, researchers utilized a
two-sided F-test and a test of proportions (z-test) to compare the variances in speed and percent
of vehicles exceeding the speed limit, respectively. Researchers used a 95 percent level of
confidence (alpha = 0.05) for all statistical analyses.
Results
Table 16 presents the before-and-after analysis of the mean speed in each zone when the
work zone speed limit was reduced to 60 mph. In the “before” period, static 60 mph work zone
speed limit signs were used throughout the entire length of the project to reduce the speed limit
24 hours a day, seven days a week, whether or not work activity was present. In both “after”
periods, the ESL signs were used to display the 60 mph reduced work zone speed limit. A
comparison of mean speeds from the “before” period and the two “after” periods shows mixed
effects of the ESL signs (i.e., some increases in mean speed and some decreases in mean speed).
71
Even though several of the changes in mean speed were statistically significant, practically there
was no difference in mean speeds when using a static work zone speed limit sign versus the ESL
signs (less than 2 mph difference). So, while the ESL signs were only used to reduce the speed
limit in the work zone when work activity was present, they did not result in lower mean speeds
as researchers anticipated. However, the ESL signs also did not negatively impact speeds.
Table 16. Comparison of Mean Speeds with Posted Speed Limit of 60 mph.
Mean Speed (mph) Difference (mph) Dir. Zone “Before”
Static
First “After”
ESL
Second “After”
ESL
“Before” & First
“After”
“Before” & Second “After”
First “After” & Second “After”
South 1 64.5 62.7 65.0 -1.8 a +0.5 +2.3 a South 2/ Middle 64.6 N/A 64.4 N/A -0.2 N/A NB
North 62.7 63.4 62.5 +0.7 -0.2 -0.9 a South 1 62.8 63.0 63.5 +0.2 +0.7a +0.5 South 2/ Middle 62.3 N/A 62.3 N/A 0.0 N/A SB
North 59.4 60.1 60.7 +0.7 a +0.6 +1.3 a NB = Northbound; SB = Southbound; N/A = Not Applicable a Statistically significant change in mean speed at a 95 percent level of confidence (t-test).
Table 17 shows the percentage of vehicles exceeding the posted speed limit across time
periods. Again, the effects of the ESL signs were inconsistent (i.e., both significant increases
and decreases in the percent of vehicles exceeding the speed limit occurred.) This variability
may be due to the fact that the work activity progressed south throughout the data collection
periods. Thus, in each time period the vehicle speeds measured at the data collection sites were
impacted differently dependent upon the data collection site’s location relative to the locations
where haul trucks were frequently entering and exiting the active travel lanes. Speed variances
for each zone, by direction, were also compared across time periods; again researchers could not
identify any distinct patterns or trends.
72
Table 17. Comparison of Percent of Vehicles Exceeding the Posted Speed Limit of 60 mph.
Percent Exceeding Speed Limit Difference (mph) Dir. Zone “Before”
Static
First “After”
ESL
Second “After”
ESL
“Before” & First
“After”
“Before” & Second “After”
First “After” & Second “After”
South 1 76% 66% 81% -10% a +5% +15% a South 2/ Middle 76% N/A 77% N/A +1% N/A NB
North 66% 68% 67% +2% +1% -1% South 1 66% 70% 75% +4% +9% a +5% a South 2/ Middle 64% N/A 65% N/A +1% N/A SB
North 38% 45% 53% +7% a +15% a +8% a NB = Northbound; SB = Southbound; N/A = Not Applicable a Statistically significant change in mean speed at a 95 percent level of confidence (z-test).
In order to determine if motorists would react to a change in the speed limit on a short
term basis, mean speeds were compared within each data collection period with the ESL sign
speed limits set at both 70 mph and 60 mph. As shown in Table 18, in all cases, mean speeds
decreased significantly when the work zone speed limit was reduced using the ESL signs,
indicating that motorists did react to the reduced work zone speed limit. All of the reductions
were generally in the 2 to 3 mph range, which is consistent with previous research (52,53).
Researchers anticipate that the same reductions would have occurred as a result of the use of
static work zone speed limit signs. However, changing between the normal non-work zone and
work zone speed limits could not have been as easily accomplished.
Table 18. Comparison of Mean Speeds with ESL Display at 70 mph and 60 mph.
First “After” Period Second “After” Period Dir. Zone 70 mph 60 mph Change 70 mph 60 mph Change South N/A N/A N/A 67.2 65.0 -2.2 a NB North 65.5 63.4 -2.1 a 65.8 62.5 -3.3 a South N/A N/A N/A 67.3 63.5 -3.8 a SB North 62.3 60.1 -2.2 a 62.5 60.7 -1.8 a
NB = Northbound; SB = Southbound; N/A = Not Applicable a Statistically significant change in mean speed at a 95 percent level of confidence (t-test).
73
MOTORIST SURVEYS
Researchers conducted a survey to assess motorist understanding and opinion of the ESL
signs used on the US-59 project. The surveys were conducted outside of several local businesses
in the cities of Linden and Jefferson. Linden is located in Cass County and is adjacent to the
north end of the US-59 project. Jefferson is located in Marion County near the south end of the
US-59 project.
Study Design
Researchers approached potential respondents and asked for voluntary participation in the
survey. Potential participants were then asked if they had recently traveled through the work
zone located on US-59 between Linden and Jefferson. If they had not recently traveled through
the work zone, researchers thanked them for their time, but did not administer the remainder of
the survey.
Researchers administered the survey verbally to 100 participants (all of which had
recently traveled through the US-59 work zone) and recorded their responses on the survey form.
Each survey took about five minutes to complete and the participants received no compensation.
First, researchers collected basic demographic data about each participant, including
gender, age, education, and zip code of residence. The researchers then asked the following
questions.
• Can you describe the speed limit signs that you saw driving through the work zone?
• Is this the sign that you saw (displayed photo of ESL sign)?
• What do you think the sign is telling you?
• Do you think the speed limit changes?
• When do you think there would be a need to change the speed limit?
• Do you think this sign was effective at displaying speed limits appropriate for the
existing conditions?
• Do you think you could get a speeding ticket for going over the speed limit shown on
this sign?
• Is there anything about the sign that you like or dislike?
74
Participants
Researchers did not actively recruit to meet specific demographic criteria, but did attempt
to obtain a range of participant ages and education levels. Table 19 shows the demographics for
the survey respondents/subjects. Based on the zip code data provided by the respondents, the
majority were local residents, with 82 percent citing Linden or Jefferson zip codes, and another
14 percent citing zip codes within a 30 mile radius of the work zone. The remaining 4 percent
gave zip codes that were more than 30 miles away.
Table 19. Subject Demographics for US-59 Motorist Survey.
Results
Of the 100 survey participants, 84 percent had seen the ESL signs in the US-59 work
zone. From this group, 82 percent recognized that the ESL sign was displaying the speed limit.
Another 8 percent not only recognized the ESL sign as a speed limit sign, but also perceived that
the speed limit was changeable. Some of the remaining respondents (7 percent) first thought that
the sign was a “YOUR SPEED” sign.
When participants were asked directly if they thought the speed limit displayed on the
sign changed, 98 percent responded positively. Of these, 27 percent indicated that they thought
the speed limit changed based on conditions, such as time of day, presence of workers, or both.
Another 29 percent said they thought it changed simply because it had a digital display, while
another 16 percent stated they actually saw the speed limit on the sign change.
When participants were asked when they thought there would be a need to change the
speed limit, 56 percent cited the presence of workers. Another 20 percent of the respondents
indicated that changing work conditions would require a speed limit change, and 10 percent
noted that day or night conditions would require a speed limit change. Weather conditions were
also mentioned by 8 percent of the respondents.
Gender Age Education M F 18-39 40-54 55+ < HS HS
Grad Some
College CollegeGrad
Survey Sample 38% 62% 29% 38% 33% 8% 35% 27% 30%
75
When participants were asked if they thought the sign was effective at displaying speed
limits that were appropriate for the existing conditions, 88 percent responded positively. When
asked to explain their responses, 62 percent indicated that the ESL sign changed based on
conditions, and another 26 percent thought that the ESL sign was more visible and easy to read.
All of the respondents (100 percent) stated that they could receive a speeding ticket for going
over the speed limit shown on the ESL sign.
POLICE DISCUSSION GROUP
Researchers conducted discussion groups with local law enforcement that patrol the
US-59 work zone to obtain their opinions of the ESL signs. In total, researchers met with four
Texas DPS law enforcement officers. The first discussion group included three officers from
Cass County, while the second discussion group included one officer from Marion County.
Study Design
Researchers developed a discussion guide to set the agenda for the group discussion and
provide direction to the TTI facilitator. The discussion guide was divided into four parts. Part 1
focused on the law enforcement officers’ general perceptions of reduced work zone speed limits.
Part 2 addressed the work zone on US-59 between Linden and Jefferson, and Part 3 looked at the
ESL signs located within this work zone. Finally, Part 4 was used to obtain the officers’ overall
suggestions, issues, or concerns with the use of ESL signs.
Prior to beginning the discussion, each officer filled out an information form that
included some general questions about their expertise and concerns about speed limits in work
zones and their enforcement. The objective of these questions was not only to encourage the
officers to focus on law enforcement in work zones during the discussion but to obtain an
unbiased opinion about work zone speed limits and their enforcement prior to the discussion.
At the beginning of the discussion, researchers explained that the purpose of the
discussion was to obtain their expert opinions about reduced speed limits in work zones and the
ESL signs being used in the work zone located on US-59 between Linden and Jefferson. Each
officer interviewed was told that the questions should be answered based on their personal
experience and their observation of motorists’ driving behavior in their county. Officers were
76
also told that the interview would be anonymous and that their names would not be used in any
reports. Researchers then conducted the discussion group.
Results
Based on the input received on the information form and the first part of the discussion,
the officers thought the following about work zone speed limits in general.
• The speed limit should be reduced in all work zones, but reduced speed limits are
especially needed when workers are present.
• In most cases, the work zone speed limit should be reduced more.
• Reduced work zone speed limits should be posted throughout the whole work zone.
• The work zone speed limit should be the same throughout the whole work zone.
This includes both directions of travel, even if one direction is currently not under
construction.
• The work zone speed limit should not be changed too often so that the officers and
motorists will know the speed limit from the time they enter the work zone until they
reach the end of the work zone.
• More advance warning is needed for reduced work zone speed limits.
• Depending on the location and type of work zone, it is sometimes hard to enforce
work zone speed limits.
• A method is needed to help officers know when workers are present.
With respect to the work zone located on US-59 between Linden and Jefferson, officers
felt that prior to the installation of the ESL signs most motorists did not comply with the reduced
work zone speed limit of 60 mph and that this remained the case even after the ESL signs were
installed (i.e., ESL signs did not affect vehicle speeds). However, officers did feel that the ESL
signs were more visible than standard static speed limit signs and thus could potentially make
motorists more aware of the speed limit. Additional advantages of the ESL signs identified by
officers were:
• the digital display was easy to read,
• the ability to automatically change between daytime and nighttime speed limits, and
• the log that was kept showing every time the speed limit was changed and that the
sign was working properly.
77
While the officers liked the ESL signs, they expressed the following concerns regarding
the signs:
• officers would need to be notified when the speed limit was reduced and what
reduced speed limit was posted,
• not being able to prove what speed limit was displayed on the sign and that the sign
was functioning properly,
• obtaining the log and using it in court cases,
• potential motorist confusion if the speed limit was changed too often,
• potential motorist confusion with “YOUR SPEED” signs (and the use of this excuse
to get out of a citation),
• the orange color of the speed limit numbers indicating an advisory sign instead of a
regulatory sign and the related effects on enforcement,
• what is displayed if the sign malfunctions, and
• vandalism.
SUMMARY
In the long term study, the Type 1 ESL signs were used to reduce the speed limit in the
US-59 work zone only when work activity was present (i.e., implementation of a short term work
zone speed limit). While the field study results did not indicate a practical difference in mean
speeds when the ESL signs were used compared to standard static speed limit signs that reduced
the speed limit 24 hours a day, seven days week, it also did not indicate that the ESL signs
negatively impacted operations. In addition, the ESL signs allowed the TxDOT inspector to
more easily change between the normal non-work zone speed limit and reduced work zone speed
limit on a daily basis. Most importantly, the motorist surveys in the area showed that the public
understood the ESL signs and recognized that the speed limit on the ESL signs changed based on
conditions (e.g., workers present, changing work conditions, time of day, etc.); therefore,
improving the credibility of TxDOT’s work zone speed limit procedures with the public.
The discussions with local law enforcement once again exemplified the differences in
philosophies between law enforcement and TxDOT regarding the implementation of reduced
work zone speed limits. However, all of the officers thought the ESL signs were beneficial.
79
CHAPTER 2.3: SHORT TERM FIELD STUDIES OF
ALTERNATIVE WORK ZONE SPEED LIMIT SIGN DEVICES
In Texas, reduced work zone speed limits are not typically implemented for maintenance
projects, such as seal coat operations, due to the time it takes to install/remove the temporary
speed limit signs compared to the time it takes to conduct the work activity. When reduced work
zone speed limits are used, they are commonly posted at the beginning of the project limits, since
it is difficult to keep the temporary speed limit signs in the vicinity of the work activity given
that these operations move fairly quickly down the roadway. Both the trailer-mounted Type 1
ESL signs and flexible roll-up static work zone speed limit signs can be implemented more
quickly and moved more easily to keep up with operations than standard temporary speed limit
signing. Thus, researchers evaluated these devices at two short term stationary work zones in
Texas to determine how motorists respond to reduced speed limits posted on these two
alternative devices compared to standard work zone speed limit signing.
TREATMENTS
Table 20 shows the characteristics of the three treatments evaluated in the short term field
studies. The trailer-mounted ESL signs were described in detail in Chapter 2.2. According to
the TxDOT Traffic Control Plans for the I-30 work zone, the contractor’s speed limit signs and
work zone signs were supposed to be 48 inches by 60 inches and 36 inches by 24 inches,
respectively. However, the actual signs used by the contractor on the day that researchers
collected data were much smaller.
Many vendors currently sell flexible reflective roll-up work zone warning signs (diamond
shape) but only a few of them presently sell roll-up regulatory signs (rectangular in shape).
Discussions with vendors revealed that the maximum size of an off-the-shelf roll-up speed limit
sign was 48 inches by 60 inches. While this was the desired size of the speed limit sign for this
project, TxDOT standards (21) require that a work zone sign (G20-9) be placed on top of the
speed limit sign. Consequently, researchers worked directly with one vendor to specially
manufacturer a roll-up work zone speed limit sign. In addition, a typical portable sign stand used
to mount roll-up warning signs 1 ft above the pavement could not be used due to the desired
larger sign size. Thus, researchers worked with the vendor to modify another type of existing
80
portable sign stand to hold the roll-up work zone speed limit signs. Due to the design limitations
of the modified portable sign stand, the overall sign height could not exceed 72 inches.
Therefore, the final roll-up work zone speed limit signs consisted of a retroreflective white
36 inch by 48 inch speed limit sign (R2-1) and a 36 inch by 24 inch retroreflective orange work
zone sign (G20-9).
Table 20. Short Term Field Study Treatments.
Standard Signs ESL Signs Roll-up Signs
Speed Limit Sign Size (inches) a 24 by 30 48 by 60 36 by 48 Work Zone Sign Size (inches) a 24 by 18 36 by 24 36 by 24 Mounting Height b 7 ft 7 ft 1 ft a Width by length. b Measured from the bottom of the sign to the near edge of the pavement.
Typically, for short term work zone operations flexible roll-up advance warning signs are
mounted on portable supports at a 1-ft mounting height. Therefore, TTI researchers wanted to
evaluate the flexible roll-up work zone speed limit signs at a 1-ft mounting height. While the
Texas MUTCD (14) infers that speed limit signs may be used on portable supports (Section
6F.03), it also states that temporary traffic control regulatory signs shall conform to the standards
for regulatory signs presented in Part 2 of the Texas MUTCD (Section 6F.06). In Part 2 the
mounting height of signs on the side of the road must be at least 7 ft, unless specifically stated
otherwise for a particular sign elsewhere in the manual (Section 2A.18). Therefore, historically
TxDOT has interpreted this to mean that all regulatory signs must be mounted at least 7 ft above
the pavement. However, for these field studies, TxDOT approved a one foot mounting height.
81
STUDY LOCATIONS AND STUDY DESIGN
TTI researchers conducted the short term field studies at work zones on I-30 and US-59.
Both of these facilities are four-lane divided roadways in the Atlanta District. The work activity
was a seal coat operation that required one lane to be closed. At both sites, researchers collected
data during the day when there was a right lane closure. The normal non-work zone speed limit
and reduced work zone speed limit were 70 mph and 60 mph, respectively. The sign treatments
were located on both sides of the roadway.
At the I-30 site researchers evaluated all three treatments. However, at the US-59 site
researchers were only able to collect data for the two alternative devices, since according to the
original project plans the contractor was not responsible for providing standard work zone speed
limit signs (given that a reduced speed limit was not initially requested). In addition, there was a
limitation on the amount of time available for data collection. The contractor planned to install a
2-mile lane closure, conduct the work activity, and then remove the lane closure. This process
was to be repeated for the entire length of the project; therefore, the work activity would
progressively move down the road in 2-mile segments instead of having the lane closure extend
the entire length of the project. However, researchers desired to compare the treatments at the
same locations to reduce the potential for confounding effects (e.g., changes in sight distance,
roadway alignment, intersections, etc.). Discussions between researchers, TxDOT, and the
contractor resulted in the beginning of the lane closure (and thus the reduced work zone speed
limits) remaining in place long enough for only two treatments to be evaluated.
Similar to the long term field study in the Atlanta District, researchers collected free flow
speed data with hand held LIDAR speed measurement equipment and documented the work
zone and roadway characteristics at each site. At each site, speed data were measured
approximately one to two miles upstream of the work zone in order to calculate the normal
operating speed of the facility (i.e., free flow speed) and approximately 1000 ft downstream of
the treatments to assess motorists’ reactions to the various reduced work zone speed limit signs.
Due to the short duration nature of the work activities, speed data could not be collected at
additional locations within the work zone itself. In order to obtain an adequate sample size for
statistical analysis, spot speeds were collected for at least 125 passenger vehicles and
25 commercial vehicles at each data collection location.
82
DATA ANALYSIS
First, researchers computed the following descriptive statistics for each treatment at each
data collection location at each site: sample size, mean speed, variance, standard deviation,
95 percent confidence interval of the mean speed, and the percent of vehicles exceeding the
speed limit. Appendix F contains these descriptive statistics.
Researchers utilized a one-way analysis of variance (ANOVA) to determine if there was
a significant difference among the mean speeds at each site. Tukey’s honestly significant
difference (HSD) was then used to make all pairwise comparisons between groups. A two-sided
F-test and a test of proportions were used to compare the variances in speed and percent of
vehicles exceeding the speed limit, respectively. With respect to the latter test, the two
proportions were considered statistically different when the test statistic, Z, was greater than
1.96. Researchers used a 95 percent level of confidence (alpha = 0.05) for all statistical analyses.
RESULTS
Table 21 contains the mean speed and percent of vehicles exceeding the speed limit for
each treatment (i.e., standard signs, ESL signs, and roll-up signs) and the mean speed upstream
of the work zone at each site. The free flow speeds among the treatments at each site were not
statistically different, verifying that traffic conditions just upstream of the work zone remained
the same throughout both evaluations.
At both sites, all of the treatments resulted in significantly lower mean speeds
downstream of the reduced work zone speed limit signs compared to the free flow location (4 to
9 mph decrease). In addition, at both sites the mean speeds downstream of the ESL signs and the
roll-up signs were not statistically different. However, at the I-30 site, the mean speeds
downstream of the two alternative devices (62.8 and 63.8 mph) were significantly lower (2.9 and
1.9 mph) than the mean speed downstream of the standard treatment (65.7 mph). In addition, at
the I-30 site, the percent of motorists exceeding the speed limit downstream of standard
treatment (81 percent) was greater than for the alternative devices (64 and 71 percent)
(Z-statistics = 3.328 and 1.937, respectively). At both sites, there was not a significant difference
in the percent of motorists exceeding the speed limit downstream of the two alternative devices
(I-30 and US-59 Z-statistics = 1.406 and 1.869, respectively). However, the ESL signs did result
in 7 to 10 percent fewer motorists exceeding the speed limit.
83
Table 21. Short Term Field Study Results.
Mean Speed (mph)
Site Treatment Free Flow
Downstream of Treatment Delta
Percent Exceeding the Speed Limit Downstream of
Treatment
Standard 70.0 (n=149)
65.7 (n=160) -4.3 81%
ESL 69.9 (n=150)
62.8 (n=158) -7.1 64% I-30
Roll-up 70.2 (n=159)
63.8 (n=157) -6.4 71%
ESL 69.1 (n=154)
59.7 (n=154) -9.4 36%
US-59 Roll-up 68.4
(n=163) 60.3
(n=156) -8.1 46%
As discussed previously, the variation in vehicle speeds appears to have a greater effect
on crashes (i.e., the greater the variability in vehicle speeds the greater the crash risk). At the
US-59 site speed variance was not statistically significant between the two alternative devices or
between the two data collection locations. At the I-30 site the variation in speed was also not
statistically significant between treatments; however, the speed variances downstream of the
treatments (24.3 to 28.7 mph2) were statistically higher than the speed variances upstream of the
work zone (approximately 14 mph for all three treatments). Thus, independent of the reduced
work zone speed limit treatment, at the I-30 site the reduced work zone speed limit resulted in an
increase in the differences in vehicle speeds.
OTHER ISSUES
Many TxDOT maintenance contracts that include short term operations such as seal
coats, utilize traffic control plans straight from the TxDOT Traffic Control Plan Standards (54).
However, these plans do not include information on the location of work zone speed limit
signing (both the reduced speed limit and accompanying advance warning of the reduced speed
limit) with respect to the work activity and other required work zone signing (e.g., lane closure).
The TxDOT Barricade and Construction Work Zone Speed Limit Standard (21) can be
referenced, but it only shows the general location of these signs with respect to the work activity.
84
Thus, the contractor and TxDOT inspector ultimately determine the location of the work zone
speed limit signing in the field. The other option is to create a traffic control plan that shows the
signs necessary to implement a work zone speed limit in relationship to the signs needed for the
specific condition for which the reduced speed limit was warranted (e.g., lane closure).
Figure 16 shows an excerpt from the traffic control plan created by TxDOT for the I-30
site to show the placement of the work zone speed limit signing with respect to the required lane
closure signing. While it is clear that the work zone speed limit signing should be located in
advance of the lane closure signing, the distance between the work zone speed limit signs and the
first lane closure signs is only a minimum distance. This is also true for the distance between the
speed reduction signs and the work zone speed limit signs. Thus, dependent upon where the
contractor actually places these signs, they may not be in the vicinity of the work activity, but
still meet the requirements of the traffic control plan.
Another complication was identified when researchers sketched the locations of the work
zone speed limit signing on the TxDOT standard traffic control plan for a one lane closure on a
freeway (TCP-(6-1)-98) which was also included in the I-30 plans (Figure 17). When the work
zone speed limit signing is placed at the minimum distances given in Figure 16, these signs are
located between the “ROAD WORK AHEAD 1 MILE” signs and the “RIGHT LANE CLOSED
½ MILE” signs, instead of in advance of the lane closure signing. While both locations of the
work zone speed limit signing are acceptable, leaving the location of these signs open for
interpretation leads to inconsistent applications.
A few states have incorporated reduced regulatory speed limits (and accompanying
advance warning of the reduced limits) into the overall temporary traffic control plan standard
sheets for various work operations. In this way, the relationship between the advance warning
signs for the work zone operation and those for the reduced work zone speed limit are defined
for field crews deploying the temporary traffic control. Figure 18 through Figure 21 provide
examples of these standards from Minnesota, Michigan, Oklahoma, and Illinois, respectively.
One sees that each of these states took a slightly different approach. The Minnesota DOT
(MnDOT) chose to only incorporate the “REDUCED SPEED AHEAD” sign into the advance
warning sign sequence for the lane closure and to display the actual reduced speed limit sign
once past the transition zone and in the work area. In Michigan, both the “REDUCED SPEED
AHEAD” sign and the “SPEED LIMIT XX MPH” sign itself (shown as 45 mph in Figure 19)
85
were incorporated into the advance warning sign sequence for the lane closure, after the text-
based “RIGHT LANE CLOSED” sign and the symbolic right lane closed sign, respectively. In
Oklahoma, the “REDUCED SPEED AHEAD” sign was located upstream of the lane closure
advance warning sign sequence, and the “SPEED LIMIT XX MPH” was placed between the text
and symbolic right lane closed signs. Finally, the Illinois DOT (IDOT) standards make no use of
a reduced speed limit ahead sign and present only a speed limit sign between two text-based right
lane closed signs that precede a symbolic right lane closed sign (IDOT uses one additional right
lane closed sign than is required by the MUTCD(50)). In the IDOT configuration, the work zone
speed limit is posted more than 4000 ft from the merging taper of the work zone.
Whereas these state DOTs chose to integrate the speed limit signs into the appropriate
traffic control plan standard sheets, the Wisconsin DOT opted to include their guidance as design
notes for the relative standard drawings that would potentially include a reduced work zone
speed limit. These design notes, depicted in Figure 22, describe the location that the
“REDUCED SPEED AHEAD” sign would be located (500 ft before the “WORK ZONE
1 MILE” sign) as well as the “SPEED LIMIT XX MPH” sign (500 ft beyond the “RIGHT
LANE CLOSED ½ MILE” sign).
SUMMARY
Overall, both the Type 1 ESL signs and flexible roll-up static work zone speed limit signs
resulted in lower mean speeds and percent of vehicles exceeding the speed limit downstream of
the reduced work zone speed limit compared to standard temporary speed limit signing.
Researchers also confirmed that these devices can be implemented more quickly and moved
more easily to keep up with operations than standard temporary speed limit signing. However, it
was noted that the permanent non-work zone speed limit signs would need to be covered and
uncovered when the reduced work zone speed limit was in effect. Prior to implementation,
researchers recommend that TxDOT develop standards for these types of signs and ensure they
conform to any applicable TxDOT Departmental Material Specifications (55) and are compliant
with current criteria for crashworthy work zone traffic control devices (37).
86
Figure 16. Excerpt from I-30 Traffic Control Plans – Lane Closure with Reduced Work Zone Speed Limit.
87
Figure 17. Excerpt from I-30 Traffic Control Plans – TCP-(6-1)-98.
88
Figure 18. Typical Application of Lane Closure on a Multilane Road with a Reduced
Speed Limit in Minnesota.
89
Figure 19. Typical Application of Lane Closure on a Multilane Road with a Reduced Speed Limit in Michigan.
90
Figure 20. Typical Application of Lane Closure on a Multilane Road with a Reduced Speed Limit in Oklahoma.
91
Figure 21. Typical Application of Lane Closure on a Multilane Road with a Reduced Speed Limit in Illinois.
92
Figure 22. Design Notes for Typical Applications with a Reduced Speed Limit in Wisconsin.
93
Currently, TxDOT standards (21,54) do not specifically show the exact location of work
zone speed limit signing with respect to the work activity and other required work zone signing.
Thus, when TxDOT maintenance contracts include the use of a short term work zone speed
limits but utilize these standard plans, the actual location of the work zone speed limit signing in
the field is determined by the contractor and TxDOT inspector, unless a specific traffic control
plan is created by TxDOT personnel for the project. This issue has been addressed by other state
DOTs, who have either (a) modified their standard sheets to integrate the speed limit signing
with the work zone advance warning signing or (b) included specific guidance about the location
of the speed limit signs as design notes in their standards. The researchers recommend that
similar modifications be made to the TxDOT standard sheets so as to facilitate the use of short
term work zone speed limits by contractors and TxDOT field personnel (when properly
authorized through the Transportation Commission Minute Order process).
95
CHAPTER 2.4: MOTORIST SURVEYS
Researchers used the results in Chapter 2.1, along with input from the project advisory
committee, as a basis for the experimental design of the surveys discussed in this chapter. The
primary objectives were to determine: 1) motorists’ understanding and opinion of alternative
short term work zone speed limit signs and their enforceability, 2) if the orange or white LED
color used on ESL signs and PCMSs indicate to motorists that they are advisory or regulatory
signs, respectively, and 3) motorist preference.
STUDY DESIGN AND PROTOCOL
Overview
Researchers used a laptop computer to administer the surveys; however, it was not
necessary for the participants to have any computer experience. The survey included four
categories of signs: 1) static work zone signs, 2) ESL signs, 3) “YOUR SPEED” signs, and
4) speed limits displayed on PCMSs. The motorist survey findings in Chapter 2.2 indicated that
a small percent of participants mistook the ESL signs as “YOUR SPEED” signs; therefore,
researchers included the “YOUR SPEED” signs in this survey to further investigate this issue.
The study was divided into three parts. The first part was used to determine motorists’
comprehension and opinion of short term work zone speed limit signs and their enforceability.
The second part assessed whether the orange or white LED color used on ESL signs and PCMSs
indicate to motorists that they are advisory or regulatory signs, respectively. The third part was
administered to ascertain motorist preference. Appendix G contains an example of the motorist
survey.
Survey Locations and Demographics
In the summer of 2008, researchers conducted the motorist surveys at Texas DPS offices
in the following cities: Bryan, Dallas, Rosenberg, and San Antonio. These sites were chosen in
order to obtain a statewide representative sample. In each city, researchers recruited
198 participants; thus, in total 792 motorists were surveyed. The only criteria of the participants
recruited were that they be over the age of 18 and have a current Texas driver’s license. The
96
demographics were based on the age and gender of the Texas driving population (38), and the
education was based on data from the U.S. Census Bureau (39). Table 22 summarizes the
overall demographic distribution obtained. Overall, it is believed that the results obtained in this
study represent Texas drivers reasonably well.
Table 22. Subject Demographics for Motorist Surveys.
Sign Percent of Participants who Correctly Comprehended Sign Meaning
Static standard WZSL sign (n=264) 96.6% Static WZSL sign with flashing beacons (n=264) 98.1% Static WZSL roll-up sign (n=264) 99.6% Orange ESL sign (n=264) 100.0% White ESL sign (n=264) 98.1% Orange PCMS graphic (n=264) 96.2% White PCMS graphic (n=264) 97.3% Orange PCMS text (n=132) 99.2% White PCMS text (n=132) 99.2% WZSL = Work Zone Speed Limit
Ninety-nine percent of the participants also understood that both of the PCMS text
messages were speed limits. For the orange PCMS text message, 14 percent of these participants
actually indicated that the sign displayed a work zone speed limit. Based on comments, these
participants assumed that the speed limit applied to a work zone situation because of the orange
LED color.
As shown in Table 25, at least 99 percent of the participants thought they could receive a
speeding ticket for traveling over the reduced work zone speed limit posted on the standard static
and roll-up work zone speed limit signs, two ESL signs, and two PCMS graphic displays. This
was also true for the static work zone speed limit sign with flashing beacons when the flashing
beacons were activated. However, when the flashing beacons were not activated, almost half of
the participants still thought the reduced speed limit was in effect and therefore could receive a
speeding ticket for traveling over the reduced work zone speed limit on the sign. Speed limit text
104
messages on PCMSs are typically used to supplement posted regulatory speed limit signs since
they are typically considered as warning signs. Interestingly, independent of LED color
98 percent of the participants thought they could get a speeding ticket for traveling over the
speed limit displayed as a text message on the PCMSs.
Table 25. Participants’ Perceptions of the Enforceability of the Speed Limit Posted on the Signs.
Sign Speed Limit
on Sign (mph)
Percent of Participants Who Thought They Could Receive a Speeding Ticket
for Traveling Over Speed Limit on Sign Static standard WZSL sign (n=264) 60 99.6% Static WZSL sign with flashing beacons (n=264) - Flashing beacons activated - Flashing beacons not activated
60
99.6% 49.2%
Static WZSL roll-up sign (n=264) 60 99.2% Orange ESL sign (n=264) 55 99.2% White ESL sign (n=264) 55 100.0% Orange PCMS graphic (n=264) 50 99.6% White PCMS graphic (n=264) 50 99.6% Orange PCMS text (n=132) 50 97.7% White PCMS text (n=132) 50 97.7%
Part 2 – Color Comparisons
In part 2 of the survey, all of the participants were shown the following three sign groups:
1) ESL signs, 2) PCMS text messages, and 3) PCMS graphic displays. Each group contained
two signs with different color displays (i.e., either white or orange LEDs) side-by-side on the
computer screen. Once it was established that participants recognized a difference in appearance
between the two alternatives shown, researchers questioned them as to how this difference
affected their interpretation of the sign (i.e., did they have different meanings). Table 26 shows
the percentage of participants who believed that the signs did and did not have different
meanings based on the change in LED color. The majority, 88 percent or more, of the
participants believed that the signs had the same meaning (i.e., LED color did not change
meaning of sign).
105
Table 26. Percentage of Responses to Question “Do These Signs Have the Same Meaning?”
Do the Signs have the Same Meaning? Sign Group
Yes No Not Sure Orange ESL and white ESL (n=770) 89% 10% 1% Orange PCMS graphic and white PCMS graphic (n=783) 89% 11% 0% Orange PCMS text and white PCMS text (n=786) 88% 12% 0%
For those participants that indicated there was a difference in the meaning between the
two signs (12 percent or less), researchers asked them to explain the difference. Table 27
contains this information. For all three of the sign groups, approximately one-fourth of the
participants thought the change in LED color was an indication of a regulatory versus an
advisory speed sign. The most commonly identified difference in meaning (29 to 40 percent)
was that the orange LED indicated something pertaining to a work zone (e.g., workers present,
an indication of increased danger within the work zone, warning to use more caution in work
zone area, etc.), whereas the white LED was a standard speed limit sign implying no work zone
activity or less extensive work activity (e.g., no workers present, no work activity being
performed, less complicated work zone set up or less dangerous work zone activity such as
mowing, etc.).
Nine percent of the participants believed that the ESL sign with orange LEDs was an
indication of the speed they were traveling (i.e., “YOUR SPEED” sign) and not a speed limit
sign. These findings are similar to the Atlanta District motorist survey findings discussed in
Chapter 2.2. It should be noted that none of the participants thought the ESL sign with white
LEDs was a “YOUR SPEED” sign.
Six to 9 percent of the participants felt that the difference in LED color was an indication
of daytime versus nighttime speed limits, and 3 to 7 percent stated that it was indicating when the
sign was on or off. These two categories could be attributed to the participants’ difficulty in
perception of the colors illuminated or displayed on the computer monitor.
106
Table 27. Percentage of Participants that Identified Differences in Sign Meanings.
Orange LEDs 64% 2% ESL signs White LEDs 36% 2% Orange Text 27% 7% White text 32% 9%
Orange graphic 13% 2% PCMSs
White graphic 28% 2%
Summary
Overall, more than 95 percent of the participants understood that the static roll-up sign,
ESL signs, and PCMS graphic sign displays indicated a work zone speed limit. In addition, over
99 percent of the participants felt they could get a speeding ticket if they traveled over the work
zone speed limit displayed. While 98 percent of the participants understood that the static signs
with flashing beacons activated signified a work zone speed limit that was enforceable with a
speeding citation, almost half of the participants (49 percent) thought that the work zone speed
limit was still in effect when the flashing beacons were not activated (i.e., could receive a
speeding ticket for traveling over the reduce speed limit). Interestingly, 98 percent of the
participants thought the PCMS text messages (which are warning signs used to supplement
posted regulatory speed limit signs) were also enforceable with a speeding citation.
In color comparisons (orange versus white LED displays), the majority (88 percent or
more) of the participants felt there was no difference in the meaning of the signs based on the
change in LED color. In fact, there were less the 2 percent of the participants that stated the
difference in the color of the signs was attributed to orange being an advisory sign and white
being a regulatory sign.
All of the sign options evaluated had an average rating, with the exception of the roll-up
static sign. The sign preferred by participants was the static sign with flashing beacons;
however, this sign was not understood by almost half of the participants.
111
RECOMMENDATIONS
Accurately predicting the actual speeds at which motorists will travel within a particular
work zone prior to the establishment of that work zone on the roadway is difficult. Therefore,
the selection of the maximum safe speed is based on work zone conditions which are believed to
affect the safety of the traveling public and construction workers. TxDOT’s procedure for
determining if a reduced regulatory speed limit should be established in a construction work zone
came from NCHRP research recommendations from the mid 1990s. The procedure takes into
consideration the type of work activity and a number of other site-specific factors; however, for
most of the work zone conditions speed limit reductions up to 10 mph are allowed if any of the
factors listed for each condition are present. Thus, reduced speed limits can be justified in a
large majority of work zones, and while a speed limit reduction of 5 mph may be used, the one
typically requested by TxDOT personnel is the maximum allowable speed reduction (10 mph).
Unfortunately the low levels of compliance with reduced work zone speed limits reported
in a number of studies suggest that many conditions, factors, and combinations thereof now used
to warrant lower speed limits are not perceived by motorists as justifying the need for slower
speeds. Changes to the speed limit selection process that result in reduced speed limits that more
closely correspond to motorist perceptions that reduced speeds are necessary should raise the
credibility of TxDOT’s work zone speed limit procedures with the public. In addition, the actual
travel speeds through the work zone should be more closely aligned with the reduced work zone
speed limit. Based on the results presented in Part 1 of this report and input from the TxDOT
Project Monitoring Committee, researchers recommend the following changes to the Work Zone
Speed Limit Worksheet located in the TxDOT Work Zone Standards (16) (see Appendix B).
• All references to conditions that do not currently warrant speed limit reductions (i.e.,
roadside activity and moving activity on shoulder) should be removed.
• For shoulder activity the maximum amount of speed reduction should be changed to
5 mph. Speed reductions should be discouraged on roadways with existing speed
limits less than 65 mph.
• For lane encroachment the maximum speed reduction should be changed to 5 mph.
Speed reductions should be discouraged on roadways with existing speed limits less
than 65 mph. The following factors should be added: 1) “lane width reduction of
112
1 foot of more with a resulting lane width between 10 and 11 feet” and 2) “traffic
control devices encroaching on a lane open to traffic or within a closed lane but
within 2 feet of the edge of the open lane.” The “reduced design speed for stopping
sight distance” factor should be removed since TxDOT TRF prefers not to reduce the
speed limit based solely on reduced design speeds. Instead of reducing the speed
limit, advisory speeds can be used where design standards or physical conditions of
the roadway restrict safe operating speeds to values less than the posted regulatory
speed limit.
• For lane closures the maximum speed reduction should remain 10 mph. Independent
of operating speed, the maximum speed reduction should be used when workers are
in a closed lane unprotected by barrier and only a single travel lane remains open in
the work zone; however, when more than one travel lane will remain open, speed
reductions less than 10 mph should be considered. When unprotected workers are not
a factor, speed limit reductions should be discouraged on roadways with existing
speed limits less than 65 mph and on roadways with existing speed limits greater than
or equal to 65 mph when more than one travel lane will remain open. The factors
addressing reduced design speed for taper length or speed change lane length,
horizontal curve, and stopping sight distance should be removed based on the reasons
previously identified. The factor for “traffic congestion created by a lane closure”
should also be removed since this can be considered an unexpected condition.
• For temporary diversions the maximum speed reduction should remain 10 mph.
Speed limit reductions should be discouraged on roadways with existing speed limits
less than 65 mph. The following factor should be added: “barrier within 2 feet of the
traveled way.”
• Centerline or lane line encroachment should be removed since this condition is just
another type of lane closure; and thus, is addressed under the lane closure condition.
• The following statement should be removed to discourage the use of reduced speed
limits based solely on reduced design speeds: “Where work zone geometrics with
reduced design speeds cannot be avoided, the work zone speed limit should not
exceed the design speed, even if this requires a speed limit reduction greater than
10 mph.” Again, advisory speeds can be used where design standards or physical
113
conditions of the roadway restrict safe operating speeds to values less than the posted
regulatory speed limit.
• The following statement should be added to allow TxDOT TRF the ability, when
justified, to implement reduced speed limits greater than those recommended or for
other types of work zone situations not specifically addressed: “There should not be
a reduction in the existing regulatory speed limit greater than those recommended
herein or for any other work zone conditions unless unusual situations create
hazardous conditions for motorists, pedestrians, or workers. Requests of this nature
will be reviewed and approved by TxDOT TRF on a case-by-case basis.”
Researchers also recommend that TxDOT revise Form 1204, Request for Construction
Speed Zone (36). This form should include a place for TxDOT to document the work zone
condition(s) and factor(s) used to justify the reduced work zone speed limit, as well as the
maximum amount of speed reduction allowed for the work zone condition/factor combination.
This will allow TxDOT TRF personnel to more easily determine whether the requested work
zone speed limit is warranted.
Unfortunately, motorists do not always recognize the work zone hazard and thus may be
driving too fast for conditions. Where the need for lower speed limits below actual travel speeds
exists due to a work zone hazard that is not adequately perceived by motorists, enforcement
should be targeted in order to encourage motorist compliance and to raise motorist awareness of
their surroundings. Examples include: unexpected conditions (e.g., construction entrances when
work is occurring, turning traffic, crash history, etc.), speed reductions greater than those
recommended above, and speed reductions for other work zone conditions that result in unusual
situations that create hazardous conditions for motorists, pedestrians, or workers.
Current Texas law is fairly restrictive in terms of establishing reduced speed limits in
work zones. Most of the difficulties lie in the need to establish a single speed limit on a roadway
segment through an order documented in the meeting minutes of the Texas Transportation
Commission. Whereas current law allows TxDOT to deactivate a work zone speed limit when
not needed (by removing or covering the sign that designates the lower speed limit), it does not
provide TxDOT with the flexibility to easily accommodate changes in the work zone speed limit
based on the existing work conditions (e.g., 5 mph for a lane encroachment condition and
10 mph when a lane is closed). Therefore, changes to the current code would be needed to
114
provide additional flexibility to TxDOT to address changing conditions in a work zone through
changes in a reduced work zone speed limit. Several other states have recognized the need for
this flexibility, and have laws on their books to grant the DOT or its representative the authority
to determine and post appropriate work zone speed limits. Given that a precedent has been set,
researchers recommend that TxDOT consider requesting legislative action to grant authority to
the Executive Director or his designee to establish work zone speed limits, rather than the Texas
Transportation Commission.
Short term work zone speed limits are reduced speed limits that are posted and visible to
motorists only when work activity is present. When the work activity is not present, the short
term work zone speed limit signs should be removed or covered; thereby allowing the legal
speed limit for that segment to revert back to the normal non-work zone speed limit. Although
TxDOT has allowed short term work zone speed limits to be used for several years, recent Texas
legislation (22) has emphasized their use.
The major challenge with short term work zone speed limits is the daily install/remove or
uncover/cover process of the signs which represents an additional task for the contractor that
reduces overall work productivity. In addition, the potential exists for the contractor to forget or
simply choose not to cover or remove signs. In effect, the failure to cover or remove the signs
turns the short term limit into a long/intermediate one. In addition, differences between
TxDOT’s work zone speed limit policy and law enforcement’s speed limit philosophies (e.g.,
local law enforcement prefers the reduced speed limits always be in effect whether or not work
activity is present) are hindering the implementation of short term work zone speed limits.
In this project, researchers evaluated several alternative work zone speed limit devices
that could be used to better manage short term work zone speed limits. Based on the results
presented in Part 2 of this report, researchers recommend the use of ESL signs and flexible roll-
up static work zone speed limit signs. In order to reduce the potential confusion between ESL
signs and “YOUR SPEED” signs, and ensure that the speed limit is considered a regulatory
speed limit, the changeable display should be comprised of white LEDs. Prior to
implementation, researchers recommend that TxDOT develop standards for both types of signs
and ensure they conform to applicable TxDOT Departmental Material Specifications (55) and
are compliant with current criteria for crashworthy work zone traffic control devices (37).
115
Currently, TxDOT standards (21,54) do not specifically show the exact location of work
zone speed limit signing with respect to the work activity and other required work zone signing.
Thus, when TxDOT maintenance contracts include the use of short term work zone speed limits
but utilize these standard plans, the actual location of the work zone speed limit signing in the
field is determined by the contractor and TxDOT inspector, unless a specific traffic control plan
is created by TxDOT personnel for the project. This issue has been addressed by other state
DOTs, who have either (a) modified their standard sheets to integrate the speed limit signing
with the work zone advance warning signing or (b) included specific guidance about the location
of the speed limit signs as design notes in their standards. Researchers recommend that similar
modifications be made to the TxDOT standard sheets so as to facilitate the use of short term
work zone speed limits by contractors and TxDOT field personnel (when properly authorized
through the Transportation Commission Minute Order process).
117
REFERENCES 1. Synthesis of Safety Research Related to Traffic Control and Roadway Elements. Report
No. FHWA-TS-82-233. FHWA, U.S. Department of Transportation, Washington, D.C., December 1982.
2. Maximum Speed Requirement. Texas Transportation Code, Section 545.351, Available at http://tlo2.tlc.state.tx.us/statutes/tn.toc.htm. Accessed August 31, 2008.
3. Authority of Transportation Commission to Alter Speed Limits. Texas Transportation Code, Section 545.353. Available at http://tlo2.tlc.state.tx.us/statutes/tn.toc.htm. Accessed August 31, 2008.
4. Procedures for Establishing Speed Zones. Texas Department of Transportation, Austin, Texas, November 2006. Available at http://onlinemanuals.txdot.gov/txdotmanuals/szn/szn.pdf. Accessed August 8, 2008.
5. Survey of Speed Zoning Practices. Institute of Transportation Engineers, Washington, D.C., 2001.
6. McLean, J.R. Review of the Design Speed Concept. Australian Road Research, Vol. 8, No. 1, 1978, pp. 3-16.
7. McLean, J.R. An Alternative to the Design Speed Concept for Low Speed Alignment Design. In Transportation Research Record: Journal of the Transportation Research Board, No. 702, Transportation Research Board of the National Academies, Washington, D.C., 1979, pp. 55-63.
8. Glennon, J.C., J.E. Leisch, and T.R. Newman. Safety and Operational Considerations for Design of Rural Highway Curves. Report No. FHWA-RD-83/035. Federal Highway Administration, Washington, D.C., August 1983.
9. Lamm, R., E.M. Choueiri, J.C. Haywood, and A. Paluri. Possible Design Procedure to Promote Design Consistency in Highway Geometric Design on Two-Lane Rural Roads. In Transportation Research Record: Journal of the Transportation Research Board, No. 1195, Transportation Research Board of the National Academies, Washington, D.C., 1988, pp. 111-121.
10. Islam, M.N., and P.N. Seneviratne. Evaluation of Design Consistency of Two-Lane Rural Highways. In ITE Journal, February 1994, pp. 28-31.
11. Anderson, I.B., R.Q. Brackett, K.M. Collins, K.L. Fink, R.A. Krammes, C.J. Messer, J.L. Ottesen, O.J. Pendleton, and M.A. Shafer. Horizontal Alignment Design Consistency for Rural Two-Lane Highways. Report No. FHWA-RD-94-034, Federal Highway Administration, Washington D.C., 1995.
12. Poe, C.M., J.P. Tarris, and J.M. Mason, Jr. Relationships of Operating Speed to Roadway Geometric Design Speeds. Report No. FHWA-RD-96-024, Federal Highway Administration, Washington, D.C., 1996.
13. Procedures for Establishing Speed Zones. Texas Administrative Code, Title 43, Part 1, Chapter 25, Subchapter B. Available at http://info.sos.state.tx.us/pls/pub/readtac$ext.ViewTAC?tac_view=5&ti=43&pt=1&ch=25&sch=B&rl=Y. Accessed August 31, 2008.
14. Texas Manual on Uniform Traffic Control Devices. Texas Department of Transportation, Austin, Texas, 2006. Available at http://www.dot.state.tx.us/publications/traffic.htm. Accessed August 31, 2008.
15. Mahoney, K., R.J. Porter, D.R. Taylor, B.T. Kulakowski, and G.L. Ullman. Design of
Construction Work Zones on High-Speed Highways. NCHRP Report 581, Transportation Research Board of the National Academies, Washington, D.C., 2007.
16. Work Zone Speed Limit Worksheet. Work Zone Standards, Traffic Operations Division, Texas Department of Transportation, Austin, Texas, March 2003. Available at http://www.dot.state.tx.us/insdtdot/orgchart/cmd/cserve/standard/toc.htm. Accessed August 31, 2008.
17. Crowther, L.R., and K.S. Opiela. Procedure for Determining Work Zone Speed Limits. NCHRP Research Results Digest 192. TRB, National Research Council, Washington, D.C., September 1996.
18. Ullman, G.L., and D.R. Riesland. Catalog of Work Zone Speed Control Methods. Research Report FHWA/TX-89/1161-2. Texas Transportation Institute, The Texas A&M University System, College Station, Texas, May 1990.
19. Richards, S.H., and C.L. Dudek. Implementation of Work Zone Speed Control Measures. In Transportation Research Record: Journal of the Transportation Research Board, No. 1086, Transportation Research Board of the National Academies, Washington, D.C., 1986, pp. 36-42.
20. Benekohal, R.F., P.T.V. Resende, and R.L. Orloski. Effects of Police Presence on Speed in a Highway Work Zone: Circulating Marked Police Car Experiment. Report No. FHWA-IL/UI-240. University of Illinois, Urbana, Illinois, 1992.
21. Work Zone Speed Limit Standard. Barricade and Construction Work Zone Speed Limit Standard BC(3)-07. Traffic Operations Division, Texas Department of Transportation, Austin, Texas, 2007. Available at http://www.dot.state.tx.us/insdtdot/orgchart/cmd/cserve/standard/toc.htm. Accessed August 31, 2008.
22. Removing or Covering Signs in Construction or Maintenance Work Zone. Texas Transportation Code, Section 201.907. Available at http://tlo2.tlc.state.tx.us/statutes/tn.toc.htm. Accessed August 31, 2008.
23. A Policy on Geometric Design of Highways and Streets. American Association of State Highway and Transportation Officials, Washington, D.C., 2004.
24. Solomon, D. Accidents on Main Rural Highways Related to Speed, Driver, and Vehicle. Federal Highway Administration, Washington, D.C., 1964 (reprinted in 1974).
25. Harkey, D.L., H.D. Robertson, and S.E. Davis. Assessment of Current Speed Zoning Criteria. In Transportation Research Record: Journal of the Transportation Research Board, No. 1281, Transportation Research Board of the National Academies, Washington D.C., 1990, pp. 40-51.
26. Garber, N.J., and R. Gadiraju. Factors Affecting Speed Variance and Its Influence on Accidents. In Transportation Research Record: Journal of the Transportation Research Board, No. 1213, Transportation Research Board of the National Academies, Washington D.C., 1989, pp. 64-71.
27. Benekohal, R.F., L. Wany, R. Orloski, and L.M. Kastel. Speed-Reduction Patterns of Vehicles in a Highway Construction Zone. In Transportation Research Record: Journal of the Transportation Research Board, No. 1352, Transportation Research Board of the National Academies, Washington D.C., 1992, pp. 35-45.
28. Benekohal, R.F., and L. Wang. Speed Change Distribution of Vehicles in a Highway
Work Zone. In Transportation Research Record: Journal of the Transportation Research Board, No. 1409, Transportation Research Board of the National Academies, Washington D.C., 1993, pp. 42-51.
29. Benekohal, R.F., and L. Wang. Relationship Between Initial Speed and Speed Inside a Highway Work Zone. In Transportation Research Record: Journal of the Transportation Research Board, No. 1442, Transportation Research Board of the National Academies, Washington, D.C., 1994, pp. 41-48.
30. Brewer, M.A., G. Pesti, and W.A. Schneider. Identification and Testing of Measures to Improve Work Zone Speed Limit Compliance. Report No. FHWA/TX-06/4704-1. Texas Transportation Institute, The Texas A&M University System, College Station, Texas, October 2005.
31. Ullman, G.L., P.J. Carlson, and N.D. Trout. Work Zone-Related Traffic Legislation in Texas. Report No. FHWA/TX-99/1720-3. Texas Transportation Institute, The Texas A&M University System, College Station, Texas, March 1999.
32. Ullman, G.L. Effect of Radar Transmissions on Traffic Operations at Highway Work Zones. In Transportation Research Record: Journal of the Transportation Research Board, No. 1304, Transportation Research Board of the National Academies, Washington D.C., 1991, pp. 261-269.
33. Fontaine, M.D., P.J. Carlson, and H.G. Hawkins, Jr. Evaluation of Traffic Control Devices for Rural High-Speed Maintenance Work Zones: Second Year Activities and Final Recommendations. Report No. FHWA/TX-01/1879-2. Texas Transportation Institute, The Texas A&M University System, College Station, Texas, October 2000.
34. Garber, N.J., and S.T. Patel. Control of Vehicle Speeds in Temporary Traffic Control Zones (Work Zones) Using Changeable Message Signs with Radar. In Transportation Research Record: Journal of the Transportation Research Board, No. 1509, Transportation Research Board of the National Academies, Washington D.C., 1995, pp. 73-81.
35. Wang, C., K.K. Dixon, and D. Jared. Evaluating Speed-Reduction Strategies for Highway Work Zones. In Transportation Research Record: Journal of the Transportation Research Board, No. 1824, Transportation Research Board of the National Academies, Washington, D.C., 2003, pp. 44-56.
36. Request for Construction Speed Zone. Form 1204. Texas Department of Transportation, Austin, Texas, March 7, 2005.
37. Ross Jr., H.E., D.L. Sicking, R.A. Zimmer, and J.D. Michie. Recommended Procedures for the Safety Performance of Highway Features. National Cooperative Highway Research Program Report 350, Transportation Research Board of the National Academies, Washington, D.C., 1993.
38. U.S. Department of Transportation, Federal Highway Administration Statistics 2005, Table DL-22. Available at http://www.fhwa.dot.gov/policy/ohim/hs05/htm/dl22.htm. Accessed August 31, 2008.
39. U.S. Census Bureau, American Community Survey 2006, Table ACS Demographic and Housing Estimates 2006. Available at http://factfinder.census.gov/servlet/STTable?_bm=y&-geo_id=04000US48&-
qr_name=ACS_2006_EST_G00_S1501&-ds_name=ACS_2006_EST_G00. Accessed August 31, 2008.
40. Delaware Code. Available at http://delcode.delaware.gov/title21/c041/sc08/index.shtml#TopOfPage. Accessed August 31, 2008.
41. Indiana Code. Available at http://www.in.gov/legislative/ic/code/title9/ar21/ch5.html. Accessed August 31, 2008.
42. Code of Virginia. Available at http://leg1.state.va.us/cgi-bin/legp504.exe?000+cod+46.2-881. Accessed August 31, 2008.
43. Revised Code of Washington. Available at http://apps.leg.wa.gov/RCW/default.aspx?cite=46.61.400. Accessed August 31, 2008.
44. Missouri Revised Statutes. Available at http://www.moga.mo.gov/statutes/C300-399/3040000010.HTM. Accessed August 31, 2008.
45. Tennessee Code. Available at http://www.michie.com/tennessee/lpext.dll?f=templates&fn=main-h.htm&cp. Accessed August 31, 2008.
46. Oklahoma Statutes. Available at http://www.lsb.state.ok.us/osstatuestitle.html. Accessed August 31, 2008.
47. Minnesota Statutes. Available at https://www.revisor.leg.state.mn.us/statutes/?id=169.14. Accessed August 31, 2008.
48. Hall, J., and E. Wrage. Controlling Vehicle Speeds in Highway Construction Zones. Report No. NMSHTD-97-07. New Mexico State Highway and Transportation Department, Santa Fe, New Mexico, December 1997.
49. Letter from Regina S. McElroy (FHWA) to Jerry Britton (Varitext, Inc.), RE: HOTO-1, December 6, 2005. Available at http://www.atssa.com/galleries/default-file/12-6b-05.pdf. Accessed August 31, 2008.
50. Manual on Uniform Traffic Control Devices, 2003 Edition with Revisions Numbers 1 and 2 Incorporated, FHWA, U.S. Department of Transportation, December 2007. Available at http://mutcd.fhwa.dot.gov/. Accessed August 31, 2008.
51. Riffkin, M., T. McMurtry, S. Heath, and M. Saito. Variable Speed Limit Signs Effects on Speed and Speed Variation in Work Zones. Utah Department of Transportation, Salt Lake City, Utah, January 2008.
52. Richards, S.H., R.C. Wunderlich, and C.L Dudek. Controlling Speeds in Highway Work Zones. Report No. FHWA/TX-84/58+292-2. Texas Transportation Institute, The Texas A&M University System, College Station, Texas, February 1984.
53. Graham, J.L., R.J. Paulsen, and J.C. Glennon. Accident and Speed Studies in Construction Zones. Report No. FHWA-RD-77-80. Midwest Research Institute, Kansas City, Missouri, June 1977.
54. Traffic Control Plan Standards. Traffic Operations Division, Texas Department of Transportation, Austin, Texas. Available at http://www.dot.state.tx.us/insdtdot/orgchart/cmd/cserve/standard/toc.htm. Accessed August 31, 2008.
55. Departmental Material Specifications. Texas Department of Transportation, Austin, Texas. Available at
End work zone 60 125 60.1 25.5 5.1 65 50% WZSL = Work Zone Speed Limit; 2L2W = Two-Lane, Two-Way
128
Table C3. Site 2 EB Daytime (Edmonson SH-194) Vehicle Speed Data Descriptive Statistics.
Data Collection
Location Description
Speed Limit (mph)
Sample Size (n)
Mean (mph)
Variance (mph2)
Standard Deviation
(mph)
85th Percentile Speed (mph)
Percent Exceeding
Speed Limit Work activity a 60 127 58.1 50.1 7.1 65 37% End work zone 60 126 62.8 39.0 6.2 70 62% Free flow 70 133 65.7 30.8 5.5 71 16% a Workers unprotected near traveled way, pavement edge drop off, narrow lanes, and traffic control device encroachment.
Table C4. Site 2 WB Daytime (Edmonson SH-194) Vehicle Speed Data Descriptive Statistics.
On frontage road 55 134 57.5 17.2 4.1 62 71% Left lane closure a No work activity 55 132 58.0 23.5 4.8 63 67%
Left lane closure a Work activity 55 142 53.9 15.3 3.9 58 31%
WZSL = Work Zone Speed Limit; DS = Design Speed a Lane closure data were collected on a different day. The lane closure was located in the temporary diversion.
131
Table C9. Site 4 SB Daytime (College Station SH-6) Vehicle Speed Data Descriptive Statistics.
Table C19. Site 9 NB Daytime (Waco FM-2113) Vehicle Speed Data Descriptive Statistics.
Data Collection
Location Description
Speed Limit (mph)
Sample Size (n)
Mean (mph)
Variance (mph2)
Standard Deviation
(mph)
85th Percentile Speed (mph)
Percent Exceeding
Speed Limit Work activity a 50 90 56.2 51.5 7.2 62 77% Work activity 40 101 41.1 26.2 5.1 47 50% No work activity 50 70 49.1 40.0 6.3 55 37% a Workers unprotected near traveled way, pavement edge drop off, narrow lanes, and traffic control device encroachment.
Table C20. Site 9 SB Daytime (Waco FM-2113) Vehicle Speed Data Descriptive Statistics.
I-35W ramp 60 130 61.4 21.4 4.6 67 55% I-35E ramp 60 133 63.7 26.1 5.1 69 71% End of work zone on I-35E 60 129 68.5 24.5 4.9 73 95%
WZSL = Work Zone Speed Limit a Data collection site in horizontal curve. The angle at which speed data were collected may have produced lower speeds than actually present.
Table C22. Site 10 SB Daytime (Hillsboro I-35) Vehicle Speed Data Descriptive Statistics.
Table E2. Northbound US-59 Daytime Vehicle Speed First “After” Data Descriptive Statistics with South Zone Speed Limit Reduction Only.
Site No.
Site Description
Speed Limit (mph)
Trt Sample
Size (n)
Mean (mph)
Variance (mph2)
Standard Deviation
(mph)
Percent Exceeding Speed
Limit 1 Free flow 70 Static 185 67.7 31.0 5.6 32% 2 South 1 zone 60 ESL 177 63.0 22.9 4.8 67% 3 South 1 zone 60 ESL 205 62.4 20.8 4.6 66% 4 South 2 zone 60 ESL 196 62.2 21.9 4.7 60% 5 South 2 zone 60 ESL 175 64.0 33.4 5.8 75% 6 South 2 zone 60 ESL 197 64.5 25.2 5.0 78% 7 South 2 zone 60 ESL 183 65.1 26.6 5.2 85% 8 South 2 zone 60 ESL 162 64.3 26.5 5.2 79% 9 Detour 60 Static 173 58.7 33.2 5.8 35%
10 Detour 60 Static 206 62.1 37.0 6.1 63% 11 North zone 70 ESL 186 64.6 26.5 5.2 10% 12 North zone 70 ESL 193 66.3 36.3 6.0 24% 13 North zone 70 ESL 166 60.5 46.9 6.9 9% 14 Entering Linden 50 Static 216 50.5 31.7 5.6 45%
No. = Number; Trt = Treatment
144
Table E3. Northbound US-59 Daytime Vehicle Speed First “After” Data Descriptive Statistics with South and North Zone Speed Limit Reductions.
Site No.
Site Description
Speed Limit (mph)
Trt Sample
Size (n)
Mean (mph)
Variance (mph2)
Standard Deviation
(mph)
Percent Exceeding Speed
Limit 1 Free flow 70 Static 2 South 1 zone 60 ESL 3 South 1 zone 60 ESL 4 South 2 zone 60 ESL 5 South 2 zone 60 ESL 6 South 2 zone 60 ESL 7 South 2 zone 60 ESL 8 South 2 zone 60 ESL 9 Detour 60 Static 192 58.8 32.9 5.7 41%
10 Detour 60 Static 201 62.0 29.0 5.4 60% 11 North zone 60 ESL 165 62.2 22.6 4.8 59% 12 North zone 60 ESL 208 64.3 29.8 5.5 74% 13 North zone 60 ESL 175 60.1 33.7 5.8 49% 14 Entering Linden 50 Static 232 50.7 23.7 4.9 51%
No. = Number; Trt = Treatment Blank spaces indicate that no data were collected.
Table E4. Northbound US-59 Daytime Vehicle Speed Second “After” Data Descriptive Statistics with Middle Zone Speed Limit Reduction Only.
Site No.
Site Description
Speed Limit (mph)
Trt Sample
Size (n)
Mean (mph)
Variance (mph2)
Standard Deviation
(mph)
Percent Exceeding Speed
Limit 15 Free flow 70 Static 131 66.2 23.1 4.8 18% 1 South 1 zone 70 ESL 130 66.2 27.2 5.2 21% 2 South 1 zone 70 ESL 131 67.2 22.5 4.7 24% 3 South 1 zone 70 ESL 124 67.3 20.0 4.5 25% 4 Middle zone 60 ESL 124 64.9 14.8 3.8 89% 5 Middle zone 60 ESL 127 65.6 24.7 5.0 85% 6 Middle zone 60 ESL 138 65.4 24.7 5.0 85% 7 Middle zone 60 ESL 126 64.2 29.9 5.5 75% 8 Middle zone 60 ESL 133 64.9 21.4 4.6 84% 9 Detour 60 Static 131 59.3 31.6 5.6 43%
10 Detour 60 Static 131 64.7 25.4 5.0 85% 11 North zone 70 ESL 128 63.8 22.0 4.7 8% 12 North zone 70 ESL 130 67.7 24.9 5.0 26% 13 North zone 70 ESL 130 60.8 25.8 5.1 4% 14 Entering Linden 50 Static 131 52.8 22.4 4.7 66%
No. = Number; Trt = Treatment
145
Table E5. Northbound US-59 Daytime Vehicle Speed Second “After” Data Descriptive Statistics with Middle and North Zone Speed Limit Reductions.
Site No.
Site Description
Speed Limit (mph)
Trt Sample
Size (n)
Mean (mph)
Variance (mph2)
Standard Deviation
(mph)
Percent Exceeding Speed
Limit 15 Free flow 70 Static 1 South 1 zone 70 ESL 2 South 1 zone 70 ESL 3 South 1 zone 70 ESL 4 Middle zone 60 ESL 5 Middle zone 60 ESL 6 Middle zone 60 ESL 7 Middle zone 60 ESL 8 Middle zone 60 ESL 9 Detour 60 Static 126 57.5 29.5 5.4 29%
10 Detour 60 Static 131 63.3 26.0 5.1 73% 11 North zone 60 ESL 132 60.9 22.1 4.7 55% 12 North zone 60 ESL 129 64.1 25.4 5.0 79% 13 North zone 60 ESL 133 58.7 28.0 5.3 37% 14 Entering Linden 50 Static 123 51.6 24.1 4.9 59%
No. = Number; Trt = Treatment Blank spaces indicate that no data were collected.
Table E6. Northbound US-59 Daytime Vehicle Speed Second “After” Data Descriptive Statistics with South and Middle Zone Speed Limit Reductions.
Site No.
Site Description
Speed Limit (mph)
Trt Sample
Size (n)
Mean (mph)
Variance (mph2)
Standard Deviation
(mph)
Percent Exceeding Speed
Limit 15 Free flow 70 Static 133 66.0 25.3 5.0 18% 1 South 1 zone 60 ESL 130 66.0 26.4 5.1 88% 2 South 1 zone 60 ESL 118 63.4 17.0 4.1 76% 3 South 1 zone 60 ESL 125 64.2 19.7 4.4 81% 4 Middle zone 60 ESL 126 62.5 23.6 4.9 60% 5 Middle zone 60 ESL 6 Middle zone 60 ESL 7 Middle zone 60 ESL 8 Middle zone 60 ESL 9 Detour 60 Static
10 Detour 60 Static 11 North zone 60/70 a ESL 12 North zone 60/70 a ESL 13 North zone 60/70 a ESL 14 Entering Linden 50 Static
No. = Number; Trt = Treatment Blank spaces indicate that no data were collected. a For a short period of time, the speed limit in the north zone was reduced.
Limit 14 Leaving Linden 50 Static 192 49.4 17.5 4.2 35% 13 Leaving Linden 50 Static 249 55.4 23.9 4.9 86% 12 North zone 60 Static 207 58.0 22.3 4.7 28% 11 North zone 60 Static 203 60.7 25.0 5.0 49% 10 North zone 60 Static 238 62.5 29.4 5.4 59% 9 Detour 60 Static 194 57.6 26.7 5.2 25% 8 South 2 zone 60 Static 196 61.1 25.8 5.1 52% 7 South 2 zone 60 Static 165 61.8 23.1 4.8 58% 6 South 2 zone 60 Static 210 62.3 22.2 4.7 66% 5 South 2 zone 60 Static 168 62.0 23.9 4.9 69% 4 South 2 zone 60 Static 221 62.7 26.8 5.2 68% 3 South 1 zone 60 Static 293 62.7 32.4 5.7 65% 2 South 1 zone 60 Static 134 63.0 21.0 4.6 70% 1 Free flow 60 Static 227 66.2 22.2 4.7 90%
No. = Number; Trt = Treatment
Table E8. Southbound US-59 Daytime Vehicle Speed First “After” Data Descriptive Statistics with South Zone Speed Limit Reduction Only.
Site No.
Site Description
Speed Limit (mph)
Trt Sample
Size (n)
Mean (mph)
Variance (mph2)
Standard Deviation
(mph)
Percent Exceeding Speed
Limit 14 Leaving Linden 50 Static 191 50.6 19.5 4.4 48% 13 North zone 70 ESL 168 58.5 31.9 5.6 1% 12 North zone 70 ESL 195 62.2 37.6 6.1 6% 11 North zone 70 ESL 178 62.4 34.1 5.8 7% 10 North zone 70 ESL 224 60.7 28.3 5.3 3% 9 Detour 60 Static 174 59.5 33.9 5.8 45% 8 South 2 zone 60 Static 155 61.6 27.9 5.3 57% 7 South 2 zone 60 Static 172 63.3 31.5 5.5 67% 6 South 2 zone 60 Static 158 64.0 40.1 6.3 72% 5 South 2 zone 60 Static 152 63.4 29.2 5.4 69% 4 South 2 zone 60 Static 183 65.2 25.7 5.1 81% 3 South 1 zone 60 ESL 191 62.1 18.3 4.3 66% 2 South 1 zone 60 ESL 166 64.1 23.8 4.9 75% 1 Free flow 70 Static 187 67.3 20.3 4.5 27%
No. = Number; Trt = Treatment
147
Table E9. Southbound US-59 Daytime Vehicle Speed First “After” Data Descriptive Statistics with South and North Zone Speed Limit Reductions.
Site No.
Site Description
Speed Limit (mph)
Trt Sample
Size (n)
Mean (mph)
Variance (mph2)
Standard Deviation
(mph)
Percent Exceeding Speed
Limit 14 Leaving Linden 50 Static 212 52.8 22.9 4.8 69% 13 North zone 60 ESL 177 57.1 23.7 4.8 25% 12 North zone 60 ESL 218 59.2 23.9 4.9 39% 11 North zone 60 ESL 196 61.2 20.2 4.5 52% 10 North zone 60 ESL 232 60.1 20.6 4.5 40% 9 Detour 60 Static 169 59.1 21.2 4.6 40% 8 South 2 zone 60 Static 7 South 2 zone 60 Static 6 South 2 zone 60 Static 5 South 2 zone 60 Static 4 South 2 zone 60 Static 3 South 1 zone 60 ESL 2 South 1 zone 60 ESL 1 Free flow 70 Static
No. = Number; Trt = Treatment Blank spaces indicate that no data were collected.
Table E10. Southbound US-59 Daytime Vehicle Speed Second “After” Data Descriptive Statistics with Middle Zone Speed Limit Reduction Only.
Site No.
Site Description
Speed Limit (mph)
Trt Sample
Size (n)
Mean (mph)
Variance (mph2)
Standard Deviation
(mph)
Percent Exceeding Speed
Limit 14 Leaving Linden 50 Static 126 50.7 18.7 4.3 50% 13 North zone 70 ESL 139 57.1 29.8 5.5 0% 12 North zone 70 ESL 132 62.6 28.1 5.3 7% 11 North zone 70 ESL 127 62.4 28.1 5.3 6% 10 North zone 70 ESL 133 63.0 26.7 5.2 7% 9 Detour 60 Static 122 60.0 26.4 5.1 49% 8 Middle zone 60 ESL 133 62.7 23.8 4.9 65% 7 Middle zone 60 ESL 124 61.6 16.1 4.0 60% 6 Middle zone 60 ESL 131 62.1 22.2 4.7 64% 5 Middle zone 60 ESL 128 62.3 15.7 4.0 66% 4 Middle zone 60 ESL 126 64.7 15.8 4.0 87% 3 South 1 zone 70 ESL 133 66.9 19.3 4.4 17% 2 South 1 zone 70 ESL 129 67.7 15.6 4.0 20% 1 South 1 zone 70 ESL 123 68.7 19.7 4.4 32%
Table E11. Southbound US-59 Daytime Vehicle Speed Second “After” Data Descriptive Statistics with Middle and North Zone Speed Limit Reductions.
Site No.
Site Description
Speed Limit (mph)
Trt Sample
Size (n)
Mean (mph)
Variance (mph2)
Standard Deviation
(mph)
Percent Exceeding Speed
Limit 14 Leaving Linden 50 Static 132 49.1 4.1 16.8 33% 13 North zone 60 ESL 134 56.2 4.1 16.8 13% 12 North zone 60 ESL 132 61.0 4.8 22.7 52% 11 North zone 60 ESL 127 60.4 4.8 22.5 54% 10 North zone 60 ESL 128 60.6 5.5 30.1 46% 9 Detour 60 Static 125 57.9 4.2 17.4 22% 8 Middle zone 60 ESL 7 Middle zone 60 ESL 6 Middle zone 60 ESL 5 Middle zone 60 ESL 4 Middle zone 60 ESL 3 South 1 zone 70 ESL 2 South 1 zone 70 ESL 1 South 1 zone 70 ESL
15 Free flow 70 Static No. = Number; Trt = Treatment Blank spaces indicate that no data were collected.
Table E12. Southbound US-59 Daytime Vehicle Speed Second “After” Data Descriptive Statistics with South and Middle Zone Speed Limit Reductions.
Site No.
Site Description
Speed Limit (mph)
Trt Sample
Size (n)
Mean (mph)
Variance (mph2)
Standard Deviation
(mph)
Percent Exceeding Speed
Limit 14 Leaving Linden 50 Static 13 North zone 60/70 a ESL 12 North zone 60/70 a ESL 11 North zone 60/70 a ESL 10 North zone 60/70 a ESL 9 Detour 60 Static 8 Middle zone 60 ESL 7 Middle zone 60 ESL 6 Middle zone 60 ESL 5 Middle zone 60 ESL 4 Middle zone 60 ESL 124 63.1 18.7 4.3 69% 3 South 1 zone 60 ESL 130 63.6 14.7 4.0 73% 2 South 1 zone 60 ESL 134 65.6 26.7 5.2 81% 1 South 1 zone 60 ESL 129 65.5 24.0 4.9 82%
15 Free flow 70 Static 131 63.8 25.1 5.0 8% No. = Number; Trt = Treatment Blank spaces indicate that no data were collected. a For a short period of time, the speed limit in the north zone was reduced.
149
Table E13. Northbound US-59 Daytime Vehicle Speed “Before” Data Descriptive Statistics by Zone.
Site Nos.
Site Description
Speed Limit (mph)
Trt Sample
Size (n)
Mean (mph)
Variance (mph2)
Standard Deviation
(mph)
Percent Exceeding Speed
Limit 1 Free flow 70 Static 201 67.2 27.4 5.2 27%
2-3 South 1 zone 60 Static 496 64.5 31.7 5.6 76% 4-7 South 2 zone 60 Static 831 64.6 30.2 5.5 76% 9 Detour 60 Static 220 59.5 33.3 5.8 41%
11-12 North zone 60 Static 395 62.7 26.6 5.2 66% Nos. = Numbers; Trt = Treatment
Table E14. Northbound US-59 Daytime Vehicle Speed First “After” Data Descriptive Statistics by Zone with South Zone Speed Limit Reduction Only.
Site Nos.
Site Description
Speed Limit (mph)
Trt Sample
Size (n)
Mean (mph)
Variance (mph2)
Standard Deviation
(mph)
Percent Exceeding Speed
Limit 1 Free flow 70 Static 185 67.7 31.0 5.6 32%
2-3 South 1 zone 60 ESL 382 62.7 21.8 4.7 66% 4-7 South 2 zone 60 ESL 751 63.9 27.7 5.3 74% 9 Detour 60 Static 173 58.7 33.2 5.8 35%
11-12 North zone 70 ESL 379 65.5 32.2 5.7 17% Nos. = Numbers; Trt = Treatment
Table E15. Northbound US-59 Daytime Vehicle Speed First “After” Data Descriptive Statistics by Zone with South and North Zone Speed Limit Reductions.
Site Nos.
Site Description
Speed Limit (mph)
Trt Sample
Size (n)
Mean (mph)
Variance (mph2)
Standard Deviation
(mph)
Percent Exceeding Speed
Limit 1 Free flow 70
2-3 South 1 zone 60 4-7 South 2 zone 60 9 Detour 60 Static 192 58.8 32.9 5.7 41%
11-12 North zone 60 ESL 373 63.4 27.7 5.3 68% Nos. = Numbers; Trt = Treatment Blank spaces indicate that no data were collected.
150
Table E16. Northbound US-59 Daytime Vehicle Speed Second “After” Data Descriptive Statistics by Zone with Middle Zone Speed Limit Reduction Only.
11-12 North zone 70 ESL 258 65.8 27.3 5.2 17% Nos. = Numbers; Trt = Treatment
Table E17. Northbound US-59 Daytime Vehicle Speed Second “After” Data Descriptive Statistics by Zone with Middle and North Zone Speed Limit Reductions.
11-12 North zone 60 ESL 261 62.5 26.3 5.2 67% Nos. = Numbers; Trt = Treatment
Table E18. Northbound US-59 Daytime Vehicle Speed Second “After” Data Descriptive Statistics by Zone with South and Middle Zone Speed Limit Reductions.
11-12 North zone 60/70 a ESL Nos. = Numbers; Trt = Treatment Blank spaces indicate that no data were collected. a For a short period of time, the speed limit in the north zone was reduced.
151
Table E19. Southbound US-59 Daytime Vehicle Speed “Before” Data Descriptive Statistics by Zone.
11-12 North zone 70 ESL 259 62.5 28.0 5.3 6% 9 Detour 60 Static 122 60.0 26.4 5.1 49%
4-7 Middle zone 60 ESL 507 62.3 18.4 4.3 65% 2-3 South 1 zone 70 ESL 262 67.3 17.5 4.2 18%
Nos. = Numbers; Trt = Treatment
Table E23. Southbound US-59 Daytime Vehicle Speed Second “After” Data Descriptive Statistics by Zone with Middle and North Zone Speed Limit Reductions.
11-12 North zone 60 ESL 259 60.7 22.6 4.8 53% 9 Detour 60 Static 125 57.9 17.4 4.2 22%
4-7 Middle zone 60 ESL 2-3 South 1 zone 70 ESL
Nos. = Numbers; Trt = Treatment Blank spaces indicate that no data were collected.
Table E24. Southbound US-59 Daytime Vehicle Speed Second “After” Data Descriptive Statistics by Zone with South and Middle Zone Speed Limit Reductions.
Site Nos.
Site Description
Speed Limit (mph)
Trt Sample
Size (n)
Mean (mph)
Variance (mph2)
Standard Deviation
(mph)
Percent Exceeding Speed
Limit 14 Free flow 50 Static
11-12 North zone 60/70 a ESL 9 Detour 60 Static 4 Middle zone 60 ESL 124 63.1 4.3 18.7 69%
2-3 South 1 zone 60 ESL 248 63.5 16.3 4.0 75% Nos. = Numbers; Trt = Treatment Blank spaces indicate that no data were collected. a For a short period of time, the speed limit in the north zone was reduced.
of treatment 157 63.8 24.3 4.9 71% a Free flow vehicle speeds were measured one to two miles upstream of the work zone. Downstream of treatment vehicle speeds were measured approximately 1000 ft downstream of the treatment.
Table F2. US-59 Vehicle Speed Data Descriptive Statistics.
Treatment Data
Collection Location a
Sample Size (n)
Mean (mph)
Variance(mph2)
Standard Deviation
(mph)
Percent Exceeding Speed
Limit Free flow 154 69.1 16.0 4.0 36%
ESL signs Downstream of treatment 154 59.7 11.8 3.4 36%
of treatment 156 60.3 14.4 3.8 46% a Free flow vehicle speeds were measured one to two miles upstream of the work zone. Downstream of treatment vehicle speeds were measured approximately 1000 ft downstream of the treatment.