Page 1
Research Group in Reservoir Simulation and Management
Study Case for Reservoir Exploitation Strategy Selection based on UNISIM-I Field
Ana Teresa Gaspar
Alberto Santos
Célio Maschio
Guilherme Avansi
João Hohendorff Filho
Denis Schiozer
Campinas, May 7, 2015
Page 2
UNISIM-I-D: Study Case for Exploitation Strategy Selection
Document: UNISIM-I-D.docx. – Data: 07/05/2015 17:21:00 Page 2 /13
UNISIM-CEPETRO-UNICAMP
Summary
1. INTRODUCTION ..................................................................................................................................... 3
2. DETERMINISTIC APPROACH ............................................................................................................ 4
2.1 DECISION VARIABLES ........................................................................................................................... 4
2.2 IMPORTANT DATE/TIMES ..................................................................................................................... 4
2.3 PREMISES ............................................................................................................................................. 4
3. PROBABILISTIC APPROACH .............................................................................................................. 7
3.1 DECISION VARIABLES AND PREMISES ................................................................................................... 7
3.2 GEOLOGIC UNCERTAINTIES .................................................................................................................. 7
3.3 ECONOMIC UNCERTAINTIES ............................................................................................................... 10
3.4 OTHER UNCERTAINTIES ..................................................................................................................... 11
4. EXPECTED RESULTS .......................................................................................................................... 11
5. REFERENCES ........................................................................................................................................ 11
6. PROVIDED FILES ................................................................................................................................. 11
7. APPENDIX-I ........................................................................................................................................... 12
7.1 WELLS COMPLETIONS (REFERENCE MODEL) ...................................................................................... 12
Page 3
UNISIM-I-D: Study Case for Exploitation Strategy Selection
Document: UNISIM-I-D.docx. – Data: 07/05/2015 17:21:00 Page 3 /13
UNISIM-CEPETRO-UNICAMP
1. Introduction
The aim of this document is to present a reservoir study case to be submitted to decision analysis
regarding exploitation strategy selection (project designated as UNISIM-I-D).
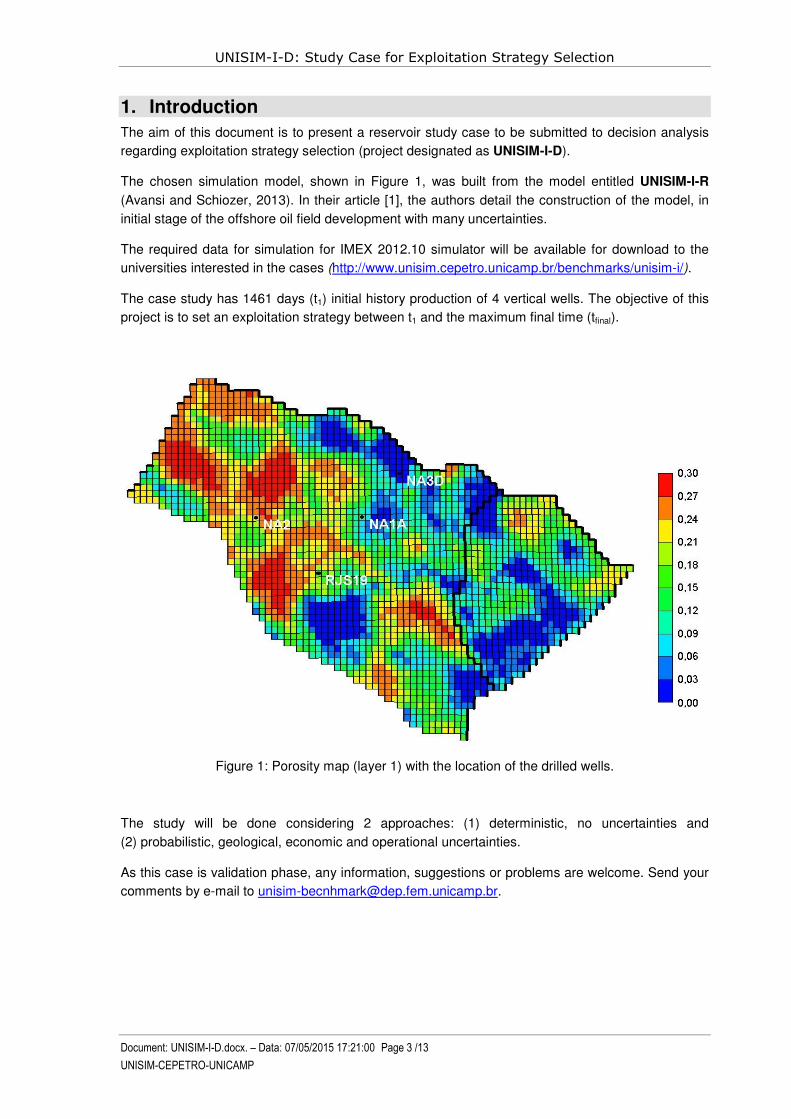
The chosen simulation model, shown in Figure 1, was built from the model entitled UNISIM-I-R
(Avansi and Schiozer, 2013). In their article [1], the authors detail the construction of the model, in
initial stage of the offshore oil field development with many uncertainties.
The required data for simulation for IMEX 2012.10 simulator will be available for download to the
universities interested in the cases (http://www.unisim.cepetro.unicamp.br/benchmarks/unisim-i/).
The case study has 1461 days (t1) initial history production of 4 vertical wells. The objective of this
project is to set an exploitation strategy between t1 and the maximum final time (tfinal).
Figure 1: Porosity map (layer 1) with the location of the drilled wells.
The study will be done considering 2 approaches: (1) deterministic, no uncertainties and
(2) probabilistic, geological, economic and operational uncertainties.
As this case is validation phase, any information, suggestions or problems are welcome. Send your
comments by e-mail to [email protected] .
Page 4
UNISIM-I-D: Study Case for Exploitation Strategy Selection
Document: UNISIM-I-D.docx. – Data: 07/05/2015 17:21:00 Page 4 /13
UNISIM-CEPETRO-UNICAMP
2. Deterministic approach
2.1 Decision variables
The decision variables considered in the decision analysis process regarding the exploitation
strategy selection are:
• Number of wells.
• Type of wells (vertical and/or horizontal conventional or intelligent).
• Wells location (i, j, k).
• Wells schedule (opening sequence of each well).
• Platform flow rates constraints on the liquid production (CpL), oil production (CpO), water
production (CpW) and water injection (CiW). Assume oil processing capacity is equal to the
liquid processing capacity in the simulation file.
Wells operational conditions must also be considered. If some types of operation with costs are
inserted in the process, for example, wells recompletion, inflow control valves (ICV) etc., these
costs must also be considered in the cash flow.
For the project to be executed similarly by all the groups, any additional cost should be
communicated by email ([email protected] ). The values and information will
be sent for all the groups working in this project.
2.2 Important Date/Times
• 05/31/2013 (t0) – 0 day:
o Simulation initial time.
o Production starting time.
• 05/31/2017 (t1) – 1461 days:
o End of history production.
o Analysis starting date (for updating cash flow).
• Between 05/31/2017 (t1) – 1461 days and 07/01/2018 – 1857 days: wells are drilled and
completed.
• 07/01/2018 – 1857 days:
o Date of incidence of investments on drilling, completion and platform/facilities.
o Starting date for the implementation of the production system.
• Dates of opening each: Dates of incidence of investments on connection (well-platform).
o Minimum interval for connection (well-platform) of each well: 30 days.
• 05/31/2043 (tfinal) – 10957 days:
o Maximum simulation final time.
o Maximum date of field abandonment.
2.3 Premises
• Possible objective-functions of the deterministic case: Net Present Value (NPV), cumulative
oil production (Np), cumulative water production (Wp) or their combination.
• Liquid production history of 4 vertical wells (NA1A, RJS19, NA3D e NA2): UNISIM-
I_HistoryData_t1.zip file. The production history contains noise.
If history wells are used in the production prediction period, just connection (well-platform) cost must be considered (see data in
o Table 3); since drilling and completion costs had already been accounted for before
analysis date (history period).
Page 5
UNISIM-I-D: Study Case for Exploitation Strategy Selection
Document: UNISIM-I-D.docx. – Data: 07/05/2015 17:21:00 Page 5 /13
UNISIM-CEPETRO-UNICAMP
• Producers and injectors characteristics:
o Vertical, horizontals.
o Conventional, intelligent.
• Horizontal wells length: free.
• Minimum spacing between wells: 500 m.
• Maximum length of vertical wells: same configuration of history wells.
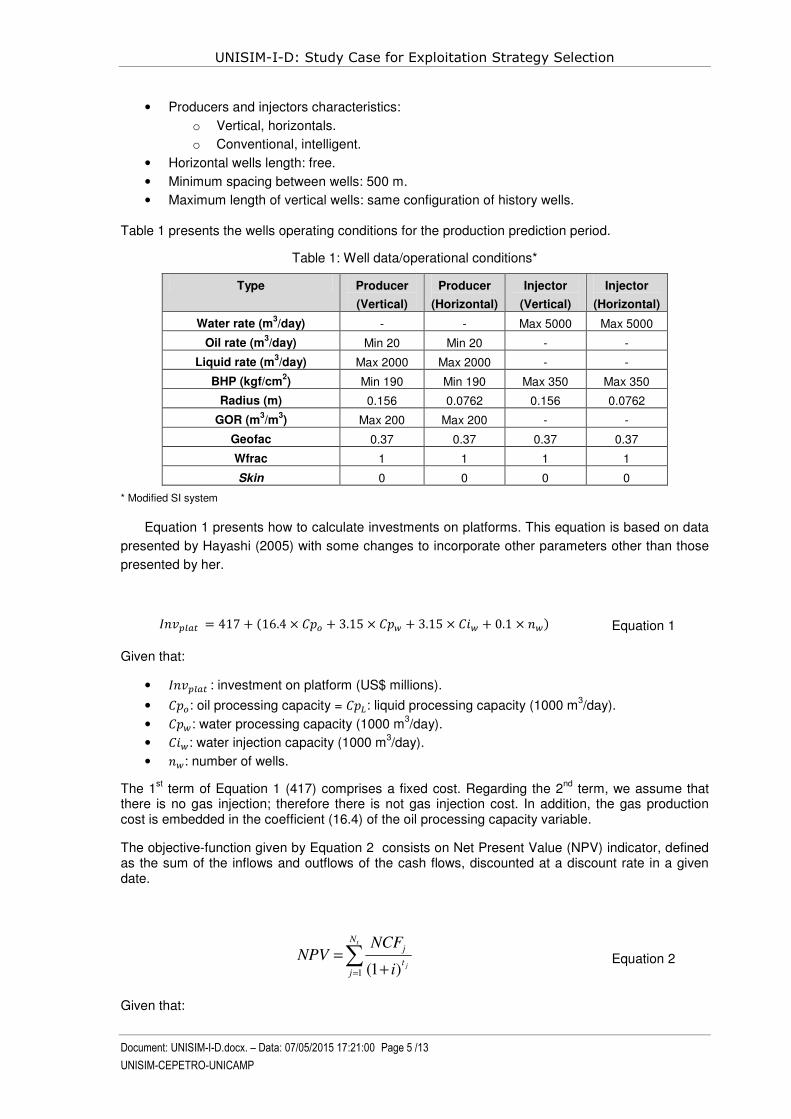
Table 1 presents the wells operating conditions for the production prediction period.
Table 1: Well data/operational conditions*
Type Producer
(Vertical)
Producer
(Horizontal)
Injector
(Vertical)
Injector
(Horizontal)
Water rate (m3/day) - - Max 5000 Max 5000
Oil rate (m3/day) Min 20 Min 20 - -
Liquid rate (m3/day) Max 2000 Max 2000 - -
BHP (kgf/cm2) Min 190 Min 190 Max 350 Max 350
Radius (m) 0.156 0.0762 0.156 0.0762
GOR (m3/m
3) Max 200 Max 200 - -
Geofac 0.37 0.37 0.37 0.37
Wfrac 1 1 1 1
Skin 0 0 0 0
* Modified SI system
Equation 1 presents how to calculate investments on platforms. This equation is based on data
presented by Hayashi (2005) with some changes to incorporate other parameters other than those
presented by her.
������� = 417 + �16.4 × ��� + 3.15 × ��� + 3.15 × ��� + 0.1 × ��� Equation 1
Given that:
• �������: investment on platform (US$ millions).
• ���: oil processing capacity = ���: liquid processing capacity (1000 m3/day).
• ���: water processing capacity (1000 m3/day).
• ���: water injection capacity (1000 m3/day).
• ��: number of wells.
The 1st term of Equation 1 (417) comprises a fixed cost. Regarding the 2
nd term, we assume that
there is no gas injection; therefore there is not gas injection cost. In addition, the gas production cost is embedded in the coefficient (16.4) of the oil processing capacity variable.
The objective-function given by Equation 2 consists on Net Present Value (NPV) indicator, defined as the sum of the inflows and outflows of the cash flows, discounted at a discount rate in a given date.
∑= +
=t
j
N
j
t
j
i
NCFNPV
1 )1(
Equation 2
Given that:
Page 6
UNISIM-I-D: Study Case for Exploitation Strategy Selection
Document: UNISIM-I-D.docx. – Data: 07/05/2015 17:21:00 Page 6 /13
UNISIM-CEPETRO-UNICAMP
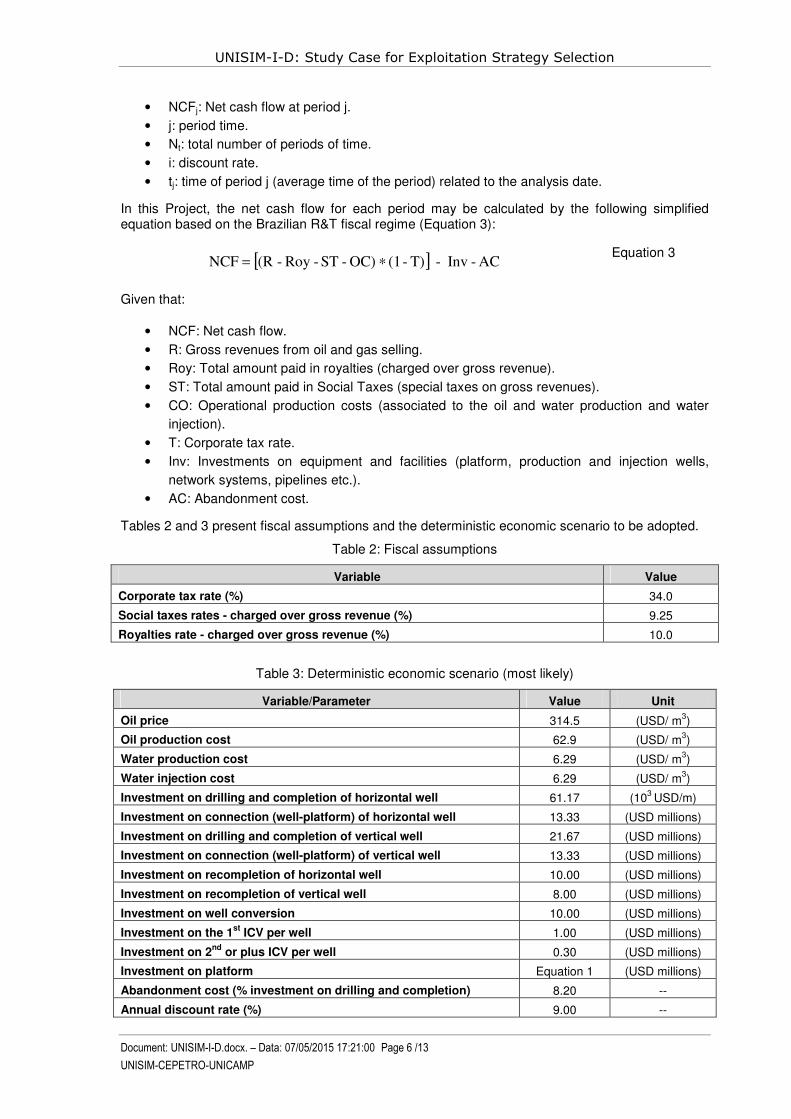
• NCFj: Net cash flow at period j.
• j: period time.
• Nt: total number of periods of time.
• i: discount rate.
• tj: time of period j (average time of the period) related to the analysis date.
In this Project, the net cash flow for each period may be calculated by the following simplified equation based on the Brazilian R&T fiscal regime (Equation 3):
[ ] AC- Inv - T) - (1 OC) -ST -Roy - (R NCF ∗= Equation 3
Given that:
• NCF: Net cash flow.
• R: Gross revenues from oil and gas selling.
• Roy: Total amount paid in royalties (charged over gross revenue).
• ST: Total amount paid in Social Taxes (special taxes on gross revenues).
• CO: Operational production costs (associated to the oil and water production and water
injection).
• T: Corporate tax rate.
• Inv: Investments on equipment and facilities (platform, production and injection wells,
network systems, pipelines etc.).
• AC: Abandonment cost.
Tables 2 and 3 present fiscal assumptions and the deterministic economic scenario to be adopted.
Table 2: Fiscal assumptions
Variable Value
Corporate tax rate (%) 34.0
Social taxes rates - charged over gross revenue (%) 9.25
Royalties rate - charged over gross revenue (%) 10.0
Table 3: Deterministic economic scenario (most likely)
Variable/Parameter Value Unit
Oil price 314.5 (USD/ m3)
Oil production cost 62.9 (USD/ m3)
Water production cost 6.29 (USD/ m3)
Water injection cost 6.29 (USD/ m3)
Investment on drilling and completion of horizontal well 61.17 (103
USD/m)
Investment on connection (well-platform) of horizontal well 13.33 (USD millions)
Investment on drilling and completion of vertical well 21.67 (USD millions)
Investment on connection (well-platform) of vertical well 13.33 (USD millions)
Investment on recompletion of horizontal well 10.00 (USD millions)
Investment on recompletion of vertical well 8.00 (USD millions)
Investment on well conversion 10.00 (USD millions)
Investment on the 1st
ICV per well 1.00 (USD millions)
Investment on 2nd
or plus ICV per well 0.30 (USD millions)
Investment on platform Equation 1 (USD millions)
Abandonment cost (% investment on drilling and completion) 8.20 --
Annual discount rate (%) 9.00 --
Page 7
UNISIM-I-D: Study Case for Exploitation Strategy Selection
Document: UNISIM-I-D.docx. – Data: 07/05/2015 17:21:00 Page 7 /13
UNISIM-CEPETRO-UNICAMP
3. Probabilistic approach
3.1 Decision variables and premises
All the decision variables described in the deterministic approach (2.1) must also be considered for
the probabilistic approach. The objective-function for this case is:
• Possible objective-functions or the probabilistic case: expected monetary value (EMV),
risk, average cumulative production etc.
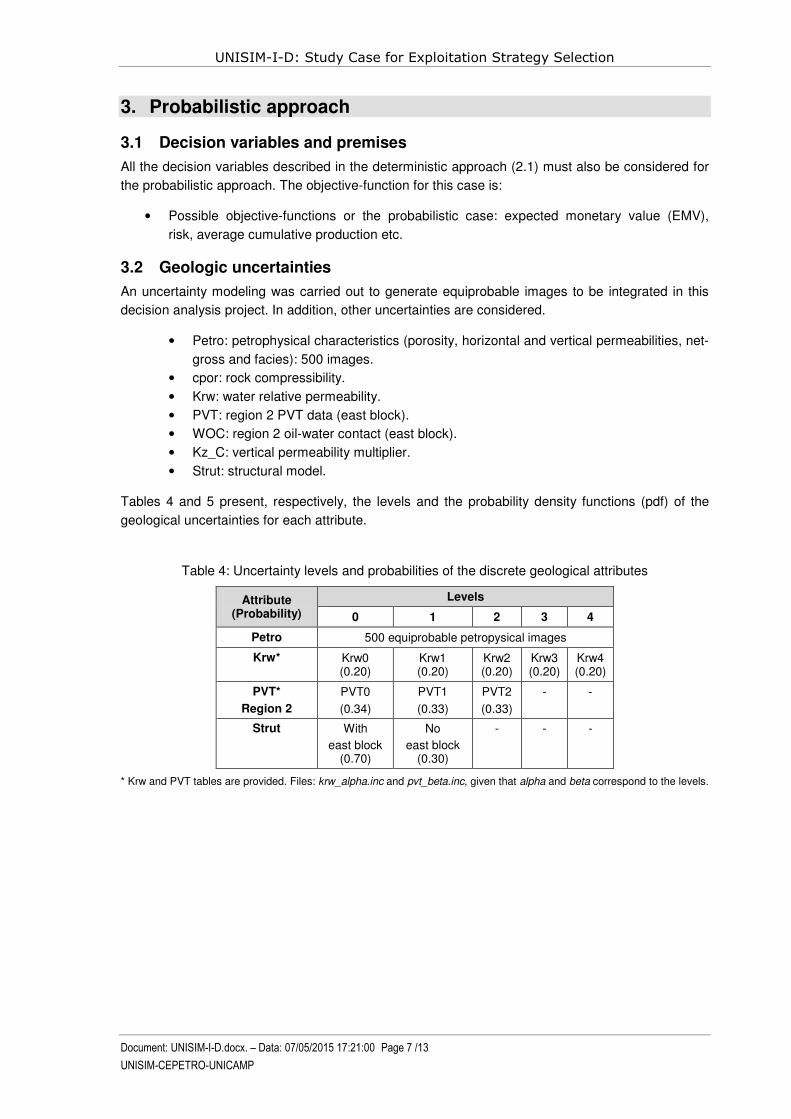
3.2 Geologic uncertainties
An uncertainty modeling was carried out to generate equiprobable images to be integrated in this
decision analysis project. In addition, other uncertainties are considered.
• Petro: petrophysical characteristics (porosity, horizontal and vertical permeabilities, net-
gross and facies): 500 images.
• cpor: rock compressibility.
• Krw: water relative permeability.
• PVT: region 2 PVT data (east block).
• WOC: region 2 oil-water contact (east block).
• Kz_C: vertical permeability multiplier.
• Strut: structural model.
Tables 4 and 5 present, respectively, the levels and the probability density functions (pdf) of the
geological uncertainties for each attribute.
Table 4: Uncertainty levels and probabilities of the discrete geological attributes
Attribute (Probability)
Levels
0 1 2 3 4
Petro 500 equiprobable petropysical images
Krw* Krw0 (0.20)
Krw1 (0.20)
Krw2 (0.20)
Krw3 (0.20)
Krw4 (0.20)
PVT*
Region 2
PVT0
(0.34)
PVT1
(0.33)
PVT2
(0.33)
- -
Strut With
east block (0.70)
No
east block (0.30)
- - -
* Krw and PVT tables are provided. Files: krw_alpha.inc and pvt_beta.inc, given that alpha and beta correspond to the levels.
Page 8
UNISIM-I-D: Study Case for Exploitation Strategy Selection
Document: UNISIM-I-D.docx. – Data: 07/05/2015 17:21:00 Page 8 /13
UNISIM-CEPETRO-UNICAMP
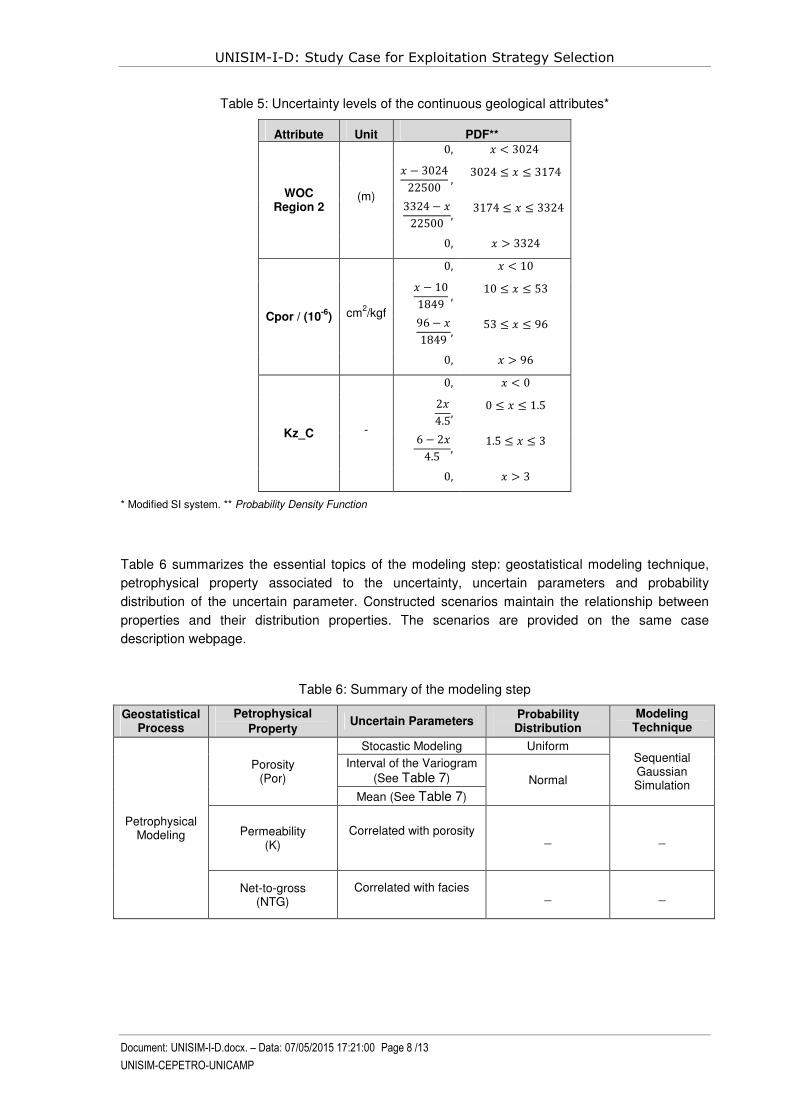
Table 5: Uncertainty levels of the continuous geological attributes*
Attribute Unit PDF**
WOC Region 2
(m)
0, � < 3024
� − 3024
22500,
3024 ≤ � ≤ 3174
3324 − �
22500, 3174 ≤ � ≤ 3324
0, � > 3324
Cpor / (10-6
) cm2/kgf
0, � < 10
� − 10
1849,
10 ≤ � ≤ 53
96 − �
1849,
53 ≤ � ≤ 96
0, � > 96
Kz_C -
0, � < 0
2�
4.5,
0 ≤ � ≤ 1.5
6 − 2�
4.5,
1.5 ≤ � ≤ 3
0, � > 3
* Modified SI system. ** Probability Density Function
Table 6 summarizes the essential topics of the modeling step: geostatistical modeling technique,
petrophysical property associated to the uncertainty, uncertain parameters and probability
distribution of the uncertain parameter. Constructed scenarios maintain the relationship between
properties and their distribution properties. The scenarios are provided on the same case
description webpage.
Table 6: Summary of the modeling step
Geostatistical Process
Petrophysical
Property Uncertain Parameters
Probability Distribution
Modeling Technique
Petrophysical Modeling
Porosity (Por)
Stocastic Modeling Uniform Sequential Gaussian Simulation
Interval of the Variogram
(See Table 7) Normal
Mean (See Table 7)
Permeability (K)
Correlated with porosity
_ _
Net-to-gross (NTG)
Correlated with facies
_ _
Page 9
UNISIM-I-D: Study Case for Exploitation Strategy Selection
Document: UNISIM-I-D.docx. – Data: 07/05/2015 17:21:00 Page 9 /13
UNISIM-CEPETRO-UNICAMP
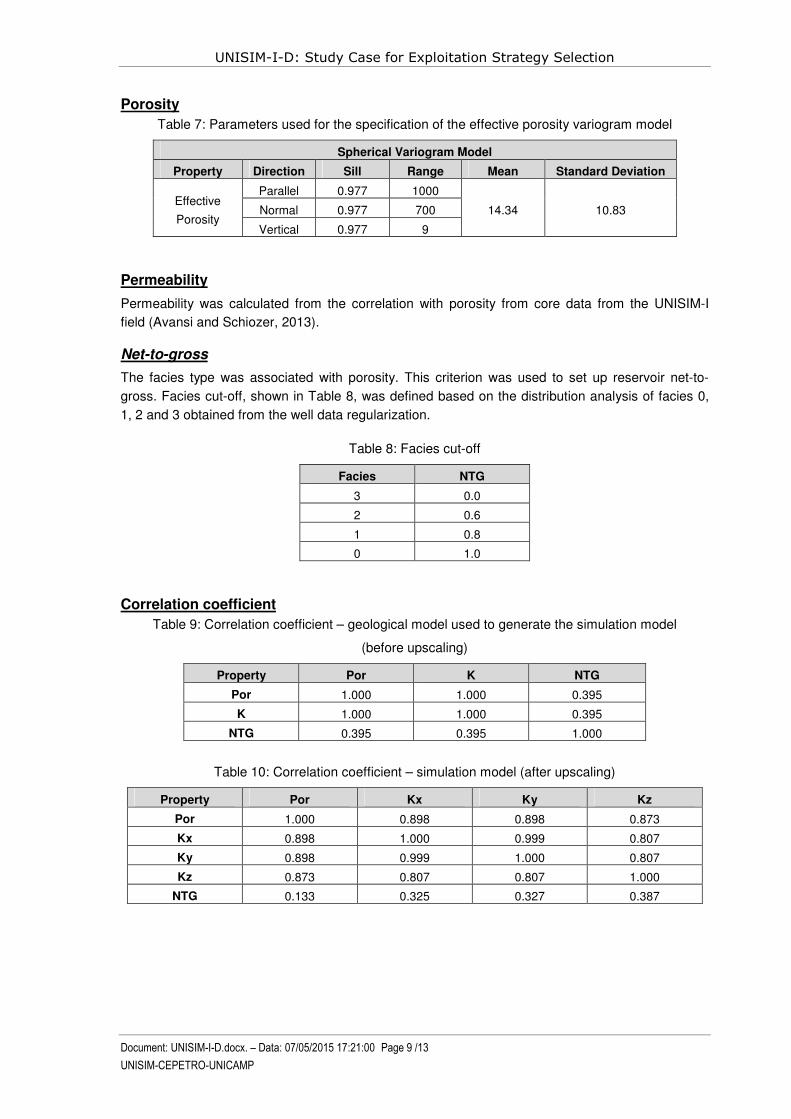
Porosity
Table 7: Parameters used for the specification of the effective porosity variogram model
Spherical Variogram Model
Property Direction Sill Range Mean Standard Deviation
Effective
Porosity
Parallel 0.977 1000
14.34 10.83 Normal 0.977 700
Vertical 0.977 9
Permeability
Permeability was calculated from the correlation with porosity from core data from the UNISIM-I
field (Avansi and Schiozer, 2013).
Net-to-gross
The facies type was associated with porosity. This criterion was used to set up reservoir net-to-
gross. Facies cut-off, shown in Table 8, was defined based on the distribution analysis of facies 0,
1, 2 and 3 obtained from the well data regularization.
Table 8: Facies cut-off
Facies NTG
3 0.0
2 0.6
1 0.8
0 1.0
Correlation coefficient
Table 9: Correlation coefficient – geological model used to generate the simulation model
(before upscaling)
Property Por K NTG
Por 1.000 1.000 0.395
K 1.000 1.000 0.395
NTG 0.395 0.395 1.000
Table 10: Correlation coefficient – simulation model (after upscaling)
Property Por Kx Ky Kz
Por 1.000 0.898 0.898 0.873
Kx 0.898 1.000 0.999 0.807
Ky 0.898 0.999 1.000 0.807
Kz 0.873 0.807 0.807 1.000
NTG 0.133 0.325 0.327 0.387
Page 10
UNISIM-I-D: Study Case for Exploitation Strategy Selection
Document: UNISIM-I-D.docx. – Data: 07/05/2015 17:21:00 Page 10 /13
UNISIM-CEPETRO-UNICAMP
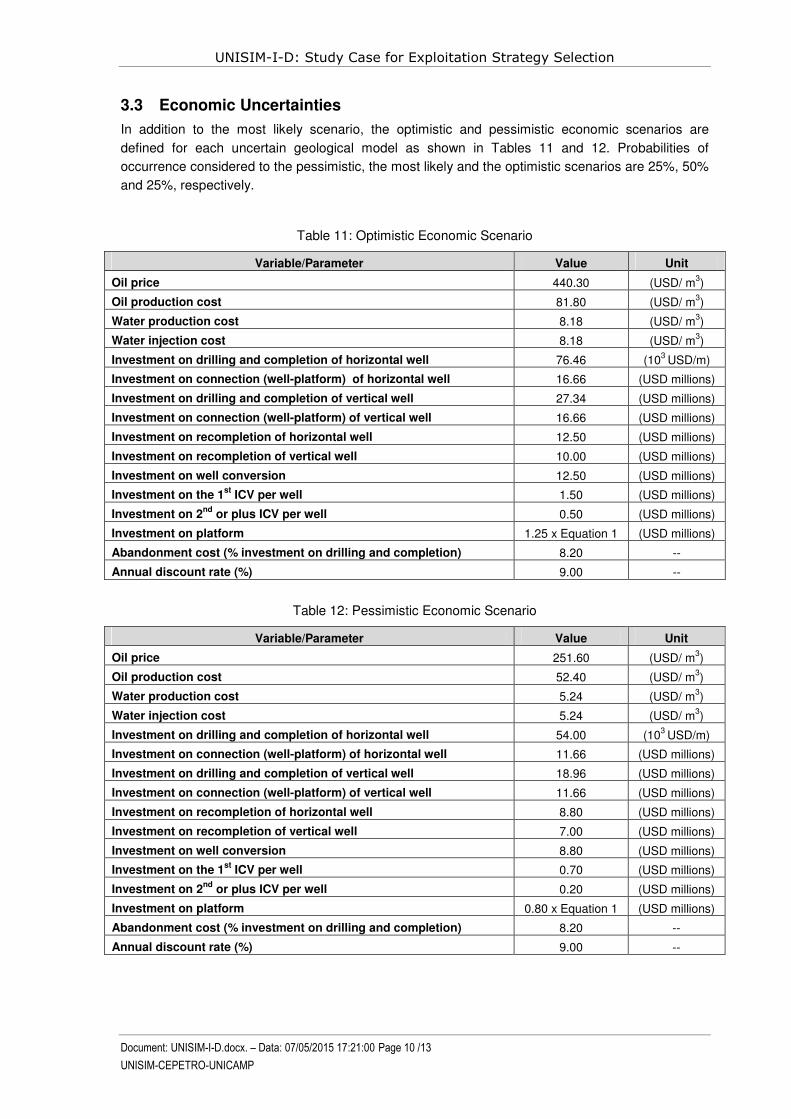
3.3 Economic Uncertainties
In addition to the most likely scenario, the optimistic and pessimistic economic scenarios are
defined for each uncertain geological model as shown in Tables 11 and 12. Probabilities of
occurrence considered to the pessimistic, the most likely and the optimistic scenarios are 25%, 50%
and 25%, respectively.
Table 11: Optimistic Economic Scenario
Variable/Parameter Value Unit
Oil price 440.30 (USD/ m3)
Oil production cost 81.80 (USD/ m3)
Water production cost 8.18 (USD/ m3)
Water injection cost 8.18 (USD/ m3)
Investment on drilling and completion of horizontal well 76.46 (103
USD/m)
Investment on connection (well-platform) of horizontal well 16.66 (USD millions)
Investment on drilling and completion of vertical well 27.34 (USD millions)
Investment on connection (well-platform) of vertical well 16.66 (USD millions)
Investment on recompletion of horizontal well 12.50 (USD millions)
Investment on recompletion of vertical well 10.00 (USD millions)
Investment on well conversion 12.50 (USD millions)
Investment on the 1st
ICV per well 1.50 (USD millions)
Investment on 2nd
or plus ICV per well 0.50 (USD millions)
Investment on platform 1.25 x Equation 1 (USD millions)
Abandonment cost (% investment on drilling and completion) 8.20 --
Annual discount rate (%) 9.00 --
Table 12: Pessimistic Economic Scenario
Variable/Parameter Value Unit
Oil price 251.60 (USD/ m3)
Oil production cost 52.40 (USD/ m3)
Water production cost 5.24 (USD/ m3)
Water injection cost 5.24 (USD/ m3)
Investment on drilling and completion of horizontal well 54.00 (103
USD/m)
Investment on connection (well-platform) of horizontal well 11.66 (USD millions)
Investment on drilling and completion of vertical well 18.96 (USD millions)
Investment on connection (well-platform) of vertical well 11.66 (USD millions)
Investment on recompletion of horizontal well 8.80 (USD millions)
Investment on recompletion of vertical well 7.00 (USD millions)
Investment on well conversion 8.80 (USD millions)
Investment on the 1st
ICV per well 0.70 (USD millions)
Investment on 2nd
or plus ICV per well 0.20 (USD millions)
Investment on platform 0.80 x Equation 1 (USD millions)
Abandonment cost (% investment on drilling and completion) 8.20 --
Annual discount rate (%) 9.00 --
Page 11
UNISIM-I-D: Study Case for Exploitation Strategy Selection
Document: UNISIM-I-D.docx. – Data: 07/05/2015 17:21:00 Page 11 /13
UNISIM-CEPETRO-UNICAMP
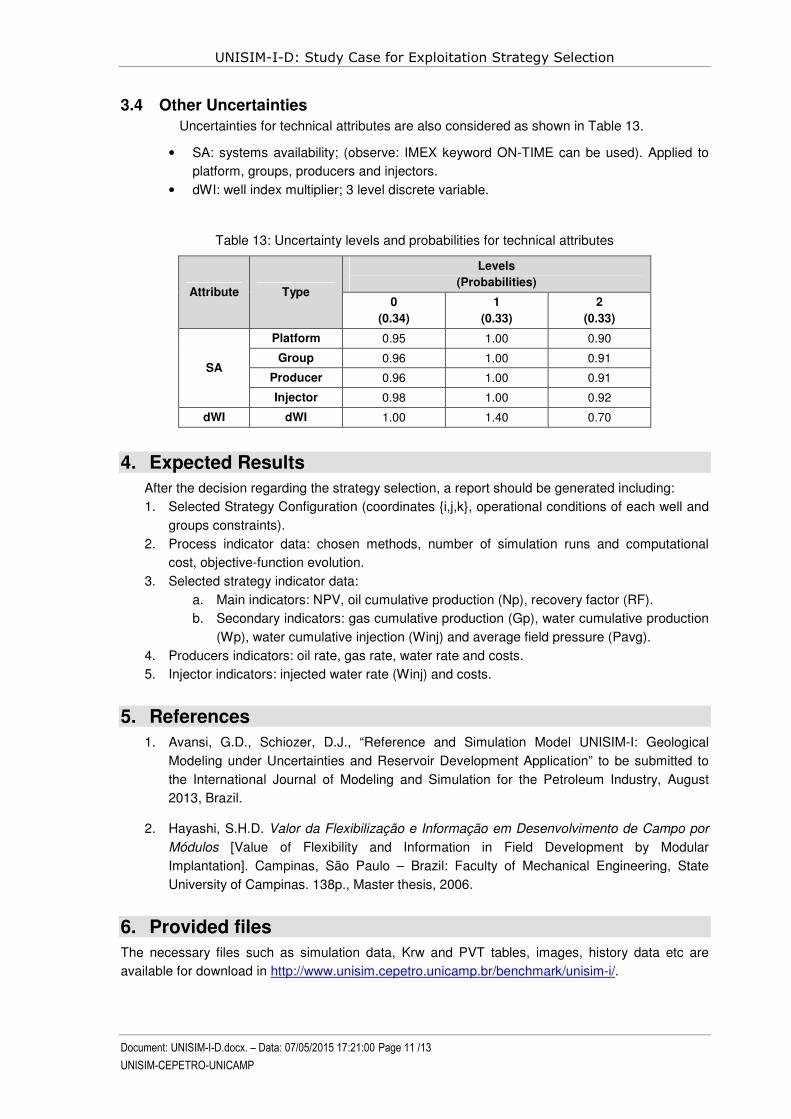
3.4 Other Uncertainties
Uncertainties for technical attributes are also considered as shown in Table 13.
• SA: systems availability; (observe: IMEX keyword ON-TIME can be used). Applied to
platform, groups, producers and injectors.
• dWI: well index multiplier; 3 level discrete variable.
Table 13: Uncertainty levels and probabilities for technical attributes
Attribute Type
Levels
(Probabilities)
0
(0.34)
1
(0.33)
2
(0.33)
SA
Platform 0.95 1.00 0.90
Group 0.96 1.00 0.91
Producer 0.96 1.00 0.91
Injector 0.98 1.00 0.92
dWI dWI 1.00 1.40 0.70
4. Expected Results
After the decision regarding the strategy selection, a report should be generated including:
1. Selected Strategy Configuration (coordinates {i,j,k}, operational conditions of each well and
groups constraints).
2. Process indicator data: chosen methods, number of simulation runs and computational
cost, objective-function evolution.
3. Selected strategy indicator data:
a. Main indicators: NPV, oil cumulative production (Np), recovery factor (RF).
b. Secondary indicators: gas cumulative production (Gp), water cumulative production
(Wp), water cumulative injection (Winj) and average field pressure (Pavg).
4. Producers indicators: oil rate, gas rate, water rate and costs.
5. Injector indicators: injected water rate (Winj) and costs.
5. References
1. Avansi, G.D., Schiozer, D.J., “Reference and Simulation Model UNISIM-I: Geological
Modeling under Uncertainties and Reservoir Development Application” to be submitted to
the International Journal of Modeling and Simulation for the Petroleum Industry, August
2013, Brazil.
2. Hayashi, S.H.D. Valor da Flexibilização e Informação em Desenvolvimento de Campo por
Módulos [Value of Flexibility and Information in Field Development by Modular
Implantation]. Campinas, São Paulo – Brazil: Faculty of Mechanical Engineering, State
University of Campinas. 138p., Master thesis, 2006.
6. Provided files
The necessary files such as simulation data, Krw and PVT tables, images, history data etc are
available for download in http://www.unisim.cepetro.unicamp.br/benchmark/unisim-i/.
Page 12
UNISIM-I-D: Study Case for Exploitation Strategy Selection
Document: UNISIM-I-D.docx. – Data: 07/05/2015 17:21:00 Page 12 /13
UNISIM-CEPETRO-UNICAMP
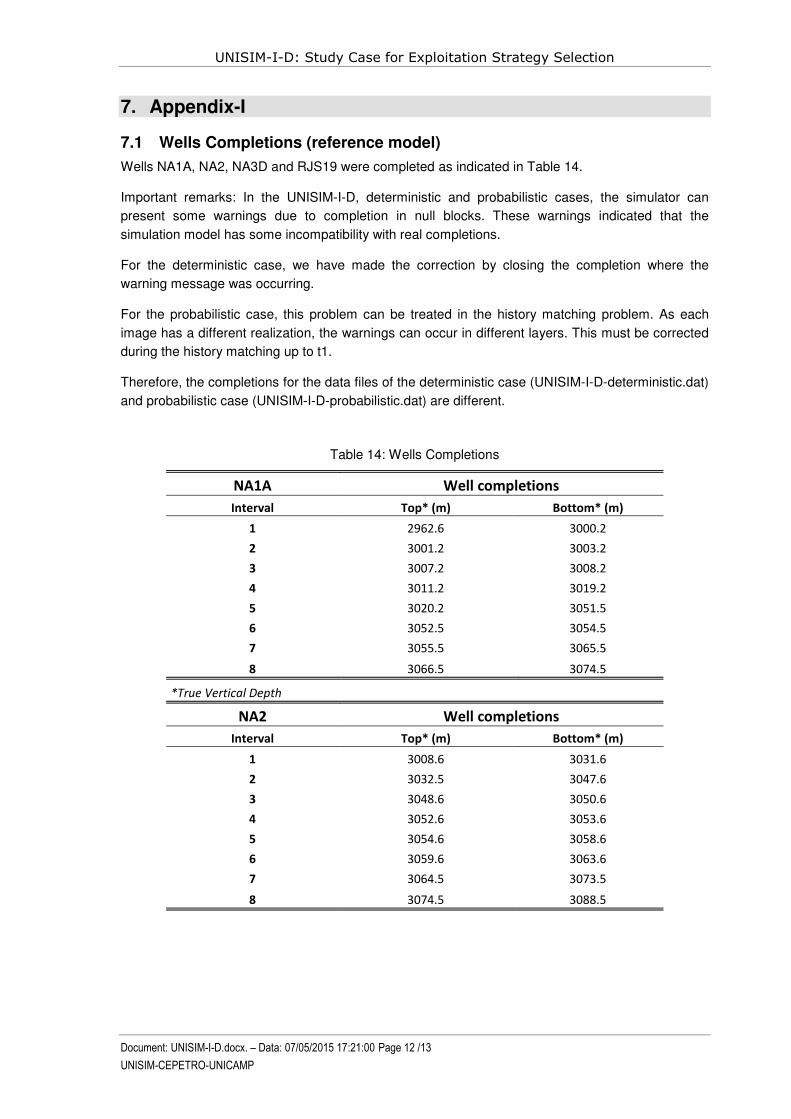
7. Appendix-I
7.1 Wells Completions (reference model)
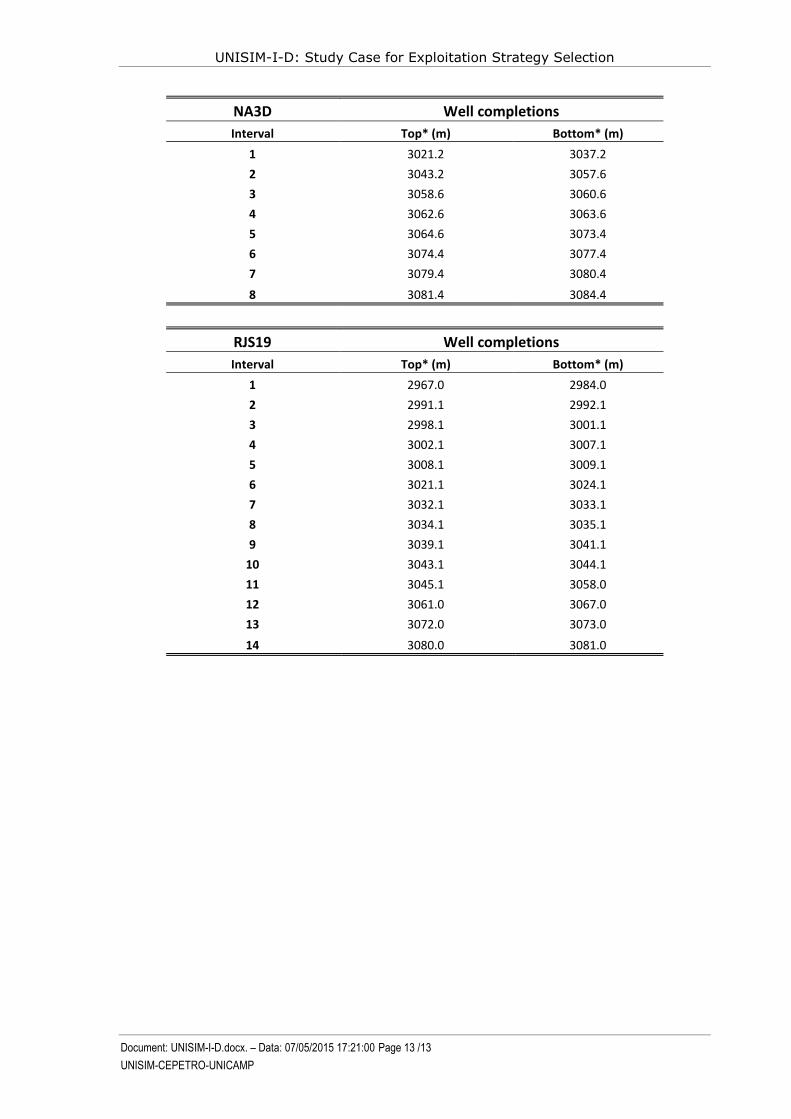
Wells NA1A, NA2, NA3D and RJS19 were completed as indicated in Table 14.
Important remarks: In the UNISIM-I-D, deterministic and probabilistic cases, the simulator can
present some warnings due to completion in null blocks. These warnings indicated that the
simulation model has some incompatibility with real completions.
For the deterministic case, we have made the correction by closing the completion where the
warning message was occurring.
For the probabilistic case, this problem can be treated in the history matching problem. As each
image has a different realization, the warnings can occur in different layers. This must be corrected
during the history matching up to t1.
Therefore, the completions for the data files of the deterministic case (UNISIM-I-D-deterministic.dat)
and probabilistic case (UNISIM-I-D-probabilistic.dat) are different.
Table 14: Wells Completions
NA1A Well completions
Interval Top* (m) Bottom* (m)
1 2962.6 3000.2
2 3001.2 3003.2
3 3007.2 3008.2
4 3011.2 3019.2
5 3020.2 3051.5
6 3052.5 3054.5
7 3055.5 3065.5
8 3066.5 3074.5
*True Vertical Depth
NA2 Well completions
Interval Top* (m) Bottom* (m)
1 3008.6 3031.6
2 3032.5 3047.6
3 3048.6 3050.6
4 3052.6 3053.6
5 3054.6 3058.6
6 3059.6 3063.6
7 3064.5 3073.5
8 3074.5 3088.5
Page 13
UNISIM-I-D: Study Case for Exploitation Strategy Selection
Document: UNISIM-I-D.docx. – Data: 07/05/2015 17:21:00 Page 13 /13
UNISIM-CEPETRO-UNICAMP
NA3D Well completions
Interval Top* (m) Bottom* (m)
1 3021.2 3037.2
2 3043.2 3057.6
3 3058.6 3060.6
4 3062.6 3063.6
5 3064.6 3073.4
6 3074.4 3077.4
7 3079.4 3080.4
8 3081.4 3084.4
RJS19 Well completions
Interval Top* (m) Bottom* (m)
1 2967.0 2984.0
2 2991.1 2992.1
3 2998.1 3001.1
4 3002.1 3007.1
5 3008.1 3009.1
6 3021.1 3024.1
7 3032.1 3033.1
8 3034.1 3035.1
9 3039.1 3041.1
10 3043.1 3044.1
11 3045.1 3058.0
12 3061.0 3067.0
13 3072.0 3073.0
14 3080.0 3081.0