The maximum temperature difference of Tianshan Road can reach 77.4°C in a year. Under such complex mechanicalenvironment, the mechanical properties of rock mass and structural planes will change significantly as the increase of freeze-thaw cycles (FTC). Consequently, the FTC has become a key factor in the instability and failure of rocky slopes along theTianshan Road. In this paper, the progressive deformation of rocky slopes and sudden failure process after critical instabilitywere studied through the FTC tests of rock mass and structural planes, discrete element method, and theoretical analysis. Theresults show that the structural planes and internal microcracks of the rock mass expand under the action of the FTC, causinga gradual decrease in the stability of the slope. The dynamic collapse of the rocky slope has a certain degree of randomnesscaused by the spatial distribution of structural planes and the interaction between the rock fragments. Due to the limitation ofthe slipping space and the tilt angle of the trailing edge of the slope, long-distance migration did not occur, and the in situaccumulation of the slope was obvious after failure. The analysis method in this paper can provide an important reference forguiding the catastrophe mechanism analysis and protection of engineering slopes in cold regions.
1. Introduction
The Tianshan Mountains are composed of more than 20parallel high-steep mountains [1]. As a result, many high-altitude areas do not melt all year round [2]. The TianshanRoad is a major traffic artery that traverses the northern,central, and southern parts of the Tianshan Mountains andconnects southern Xinjiang with northern Xinjiang. There-fore, its geographic location is very important ([3]; Figure 1).
The Tianshan Road has a total length of 537 km, most ofwhich is through the alpine mountains above 2000m, andthe geological conditions of the entire line are extremelycomplicated. It starts at Dushanzi and ends at Kuche; theeastern part is connected to the Bayinbulak grassland, andthe western part is connected to the Tangbula grassland.Specifically, it passed through Bingdaban at an altitude ofmore than 4000m three times. The Tianshan Road hasalmost all the geological disasters that can occur on theworld’s highways, such as collapses, landslides, mudslides,frozen soil, and avalanches.
The study area can be characteristic of complex litholog-ical changes, high-steep slopes, intense unloading, andmultiple cracks. Furthermore, the mechanical characteristicsof rocky slope change significantly as the increase of thefreeze-thaw cycles (FTC), which has become the dominantfactor of rocky slope failure [4]. Once the deformation andinstability of road slope occur, the operation of highwayengineering will be seriously affected. As for these mechani-cal environments, indoor rock mechanics tests [5, 6], similarmodel tests [7], numerical simulations [8, 9], in situ moni-toring [10, 11], and failure mechanisms [12–14] are usedto study the evolution trend of rock mass. However, thereare still significant gaps between the existing researchmethods and the research motivation to effectively revealthe catastrophic evolution of rocky slopes under the FTC,especially in the changing mechanical state and the collapseprocess after the critical state.
A typical rocky slope along the Tianshan Road was takenas a research object in this paper. Its progressive deforma-tion and sudden failure process were studied through the
HindawiGeofluidsVolume 2021, Article ID 6128843, 12 pageshttps://doi.org/10.1155/2021/6128843
FTC test results of rock mass and structural planes, discreteelement methods (DEM), and theoretical analysis. Theseanalysis methods can provide important references for guid-ing the evolution trend and protection of engineering slopesin cold regions.
2. Study Area
Through the comparative analysis of the high- and low-temperature climate along the Tianshan Road, it can befound that the maximum temperature difference betweenday and night can reach about 45°C. And the maximumtemperature difference in different seasons of the year canreach 77.4°C, of which the extreme maximum temperatureis 41.8°C in the Wusu section in the northern part of thestudy area, and the extreme minimum temperature is-48.1°C in the Bayinbulak area. Due to intense ultravioletradiation, the surface temperature of the rocky slope is about12°C higher than the expected temperature. Under thisextreme climate, the rocky slopes are affected by the hightemperature stress, ice cleavage force, and frost heave andthawing shrinkage [15].
In the study area, the terrain is higher in the west andlower in the east, and the altitude is between 2000m and5000m. Caused by the subduction and compression of theIndian plate to the Eurasian plate, the topography of themountain crisscross basin is formed. Meanwhile, many gla-ciers are developed in high-altitude areas along the TianshanRoad. And due to the deep cutting of the valleys, the terrainis undulating, and the natural conditions are harsh.
3. Engineering Geologic Conditions
3.1. Topography. The study area is the alpine valley of theNorth Tianshan Mountains, specifically on the southernslope of Hashelekandaban. The slope height is about25~30m, and the average slope is about 75°. This section isconvex and developed in the conglomerate. The leading edgeof the slope is the Kuitun River that is about 10~15m wideand about 80m away from the road.
3.2. Formation Lithology and Geological Structures. Thestratigraphy of the study area is relatively simple, mainly
outcropping the Quaternary and the Middle Carboniferousstrata. Among them, the Quaternary deposits are distributedabove the Kuitun River. It is a mainly fragmented conglom-erate with a particle size of 5~15 cm. The CarboniferousMiddle System belongs to the Bayingou Formation in theYilianhaergabishan district, and the lithology is sandstone.A small fault, about 1 km south of the study area, is derivedfrom a regional structure.
3.3. Earthquake and Neotectonic Movement. The study areais located near the North Tianshan seismic belt, whichspreads in the east-west direction, starting from the east ofBarkol and extending westward to the piedmont of theNorth Tianshan Mountains. The thrust-wrinkle active zonein this area is related to earthquakes. And the earthquakeoccurrence scope is distributed in an elliptical shape, withfeatures of low occurrence frequency, high intensity, andconcentrated time distribution.
3.4. Hydrogeological Conditions. The formation, occurrence,and migration of groundwater are dominated by climaticconditions, topography, stratum lithology, and geologicalstructure. Rainfall and glacier snowmelt are the main sup-plies of groundwater. Groundwater discharges to riversthrough runoff from structure zones or fracture zones. Theannual rainfall in the area ranges from 250mm to 500mm.Except for a small amount of evaporation, the rest rainfallis supplied to groundwater and rivers. Fracture water ofdetrital rocks is the main type of groundwater. Meanwhile,the tuffaceous sandstone is the main aquifer.
3.5. Climate. Through analysis of weather station data in thestudy area, the extreme cold weather in winter occurs inJanuary, with an average temperature of -9.0°C. The maxi-mum thickness of snow can reach 60~150 cm, and themaximum melting thickness of seasonally frozen soil is80 cm. The study area surfers the most severe snow damagein winter along the Tianshan Road. Meanwhile, the extremehigh-temperature weather of summer occurs in July, with anaverage temperature of 22.0°C. The annual precipitationranges from 250mm to 500mm. The spring and summerare the seasons with heavy rains, accounting for 65 to 80%of the annual precipitation.
Dus
hanz
i
Yilia
nhab
ierg
a Mou
ntai
n
Kash
i Riv
er
Awul
alei
Mou
ntai
n
Gon
gnai
si Ri
ver
Nal
ati M
ount
ain
Day
ouer
dusi
Basin
Like
tieke
Mou
ntai
n
Qiu
litag
e
Kuch
e
1000
2000
3000
4000
0 30 60 90 120 150 180 210 240 270 300 330
S
Distance (km)
Elev
atio
n/m
50 KM
N Dushanzi
Kuche
Study area
Tianshan Mountain
Figure 1: General situation of the Tianshan Road.
2 Geofluids
4. Structure and Stability Factors of theTypical Slope
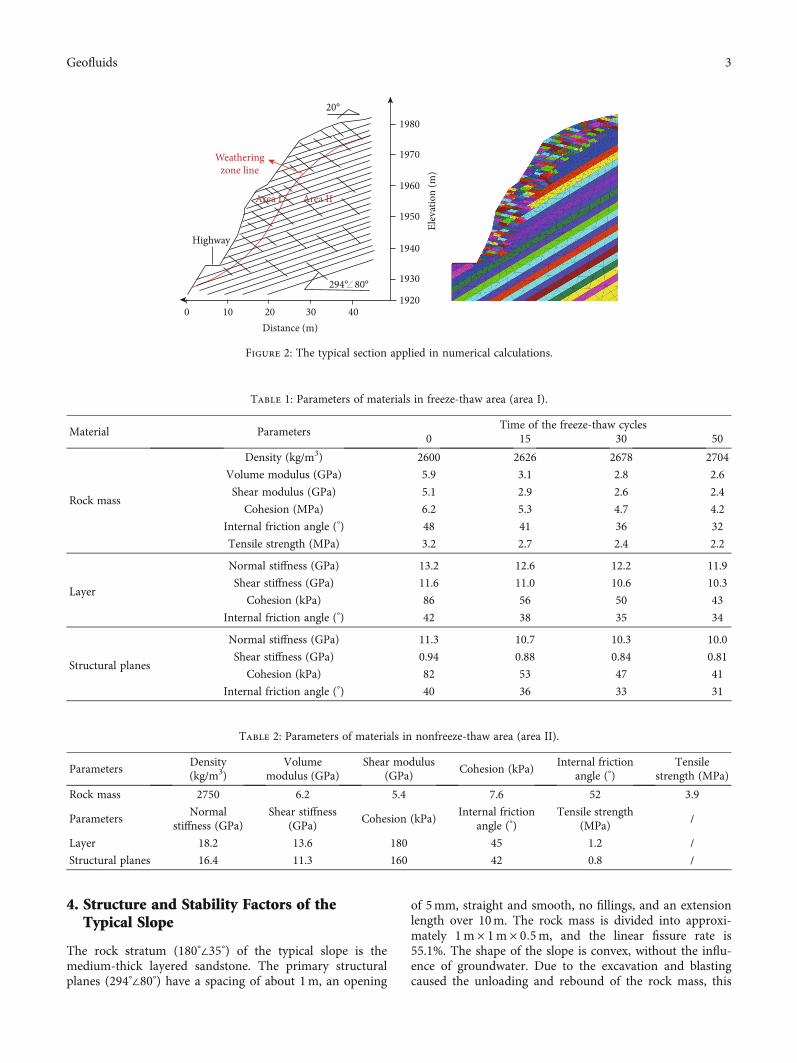
The rock stratum (180°∠35°) of the typical slope is themedium-thick layered sandstone. The primary structuralplanes (294°∠80°) have a spacing of about 1m, an opening
of 5mm, straight and smooth, no fillings, and an extensionlength over 10m. The rock mass is divided into approxi-mately 1m × 1m × 0:5m, and the linear fissure rate is55.1%. The shape of the slope is convex, without the influ-ence of groundwater. Due to the excavation and blastingcaused the unloading and rebound of the rock mass, this
Table 1: Parameters of materials in freeze-thaw area (area I).
Material ParametersTime of the freeze-thaw cycles
0 15 30 50
Rock mass
Density (kg/m3) 2600 2626 2678 2704
Volume modulus (GPa) 5.9 3.1 2.8 2.6
Shear modulus (GPa) 5.1 2.9 2.6 2.4
Cohesion (MPa) 6.2 5.3 4.7 4.2
Internal friction angle (°) 48 41 36 32
Tensile strength (MPa) 3.2 2.7 2.4 2.2
Layer
Normal stiffness (GPa) 13.2 12.6 12.2 11.9
Shear stiffness (GPa) 11.6 11.0 10.6 10.3
Cohesion (kPa) 86 56 50 43
Internal friction angle (°) 42 38 35 34
Structural planes
Normal stiffness (GPa) 11.3 10.7 10.3 10.0
Shear stiffness (GPa) 0.94 0.88 0.84 0.81
Cohesion (kPa) 82 53 47 41
Internal friction angle (°) 40 36 33 31
Table 2: Parameters of materials in nonfreeze-thaw area (area II).
ParametersDensity(kg/m3)
Volumemodulus (GPa)
Shear modulus(GPa)
Cohesion (kPa)Internal friction
angle (°)Tensile
strength (MPa)
Rock mass 2750 6.2 5.4 7.6 52 3.9
ParametersNormal
stiffness (GPa)Shear stiffness
(GPa)Cohesion (kPa)
Internal frictionangle (°)
Tensile strength(MPa)
/
Layer 18.2 13.6 180 45 1.2 /
Structural planes 16.4 11.3 160 42 0.8 /
Highway
20°
Weatheringzone line
0 10 20 30 40
1940
1960
1980
1920
1930
1950
1970
Distance (m)
Elev
atio
n (m
)
Area I Area II
80°294°
Figure 2: The typical section applied in numerical calculations.
3Geofluids
ColorScale of Max Shear Stress
3.3809E+06
1.0000E+06
1.0000E+05
1.0000E+04
1.0000E+03
1.0000E+02
1.0000E+01
1.0000E+00
1.0000E-01
1.0000E-02
1.0000E-03
1.0000E-04
1.0000E-05
1.0000E-06
1.0000E-07
1.0000E-08
6.3594E-09
(a) 0 times
ColorScale of Max Shear Stress
1.6905E+07
1.0000E+07
1.0000E+06
1.0000E+05
1.0000E+04
1.0000E+03
1.0000E+02
1.0000E+01
1.0000E+00
1.0000E-01
1.0000E-02
1.0000E-03
1.0000E-04
1.0000E-05
1.0000E-06
1.0000E-07
1.0000E-08
9.2283E-09
(b) 15 times
Figure 3: Continued.
4 Geofluids
section of the Tianshan Road has fallen blocks year-round.The weathering thickness of the slope is about 10m. Thedominant structural planes make the rock mass more frag-mented with a block-to-fragmental structure. With the com-bination of discontinuities and the free face, it is prone to
slide along the structural planes under the self-weight andexternal dynamics.
The freezing conditions are the main external forces forthe slope failure. The study area is in snowy weather fromJanuary to March. In this case, the rainfall and glacier snow
ColorScale of Max Shear Stress
1.8007E+07
1.0000E+07
1.0000E+06
1.0000E+05
1.0000E+04
1.0000E+03
1.0000E+02
1.0000E+01
1.0000E+00
1.0000E-01
1.0000E-02
1.0000E-03
1.0000E-04
1.0000E-05
1.0000E-06
1.0000E-07
1.1404E-08
(c) 30 times
ColorScale of Max Shear Stress
1.8116E+07
1.0000E+07
1.0000E+06
1.0000E+05
1.0000E+04
1.0000E+03
1.0000E+02
1.0000E+01
1.0000E+00
1.0000E-01
1.0000E-02
1.0000E-03
1.0000E-04
1.0000E-05
1.0000E-06
1.0000E-07
1.4433E-08
(d) 50 times
Figure 3: Max-shear stress distribution of the typical rocky slope.
5Geofluids
Displacement magnitude
4.4679E-03
4.2500E-03
4.0000E-03
3.7500E-03
3.5000E-03
3.2500E-03
3.0000E-03
2.7500E-03
2.5000E-03
2.2500E-03
2.0000E-03
1.7500E-03
1.5000E-03
1.2500E-03
1.0000E-03
7.5000E-04
5.0000E-04
2.5000E-04
0.0000E+00
(a) 0 times
Displacement magnitude
2.0554E-02
2.0000E-02
1.8000E-02
1.6000E-02
1.4000E-02
1.2000E-02
1.0000E-02
8.0000E-03
6.0000E-03
4.0000E-03
2.0000E-03
0.0000E+00
(b) 15 times
Figure 4: Continued.
6 Geofluids
melting make water enter the joints network of the rockyslope, which freeze into ice in winter, expand the volume,generate ice splitting force, and push the rock mass. Mean-while, the rock mass is subjected to the FTC of seasonal
reciprocation and the temperature difference between dayand night, causing the cracks to expand and the mechanicalproperties of the rock mass to reduce. Taking one year as aperiod, the deformation of the rock mass gradually increases.
Displacement magnitude
2.7285E-02
2.5000E-02
2.2500E-02
2.0000E-02
1.7500E-02
1.5000E-02
1.2500E-02
1.0000E-02
7.5000E-03
5.0000E-03
2.5000E-03
0.0000E+00
(c) 30 times
Displacement magnitude
2.8366E-02
2.7500E-02
2.5000E-02
2.2500E-02
2.0000E-02
1.7500E-02
1.5000E-02
1.2500E-02
1.0000E-02
7.5000E-03
5.0000E-03
2.5000E-03
0.0000E+00
(d) 50 times
Figure 4: Displacement distribution of the typical rocky slope.
7Geofluids
In summary, the failure mechanism of the rocky slopecan be determined to the excavation of highway makes theleading-edge to form the slipping space, and the layer ofthe down-dip slope is cut by the antidip structural planesto form dangerous rock mass. Then, under the action ofthe internal and external forces, the sliding-cracking defor-mation is generated. After instability, it slips to the free face,causing a typical sliding-type collapse.
5. Methods
Based on the field investigation, 3DEC is used to simulatethe large deformations of block systems [16, 17]. The typicalsection was divided into two areas ([3, 18]; Figure 2). Themechanical parameters of rock mass and structural planesin area I are changing with the FTC. And area II is definedas the nonfreeze-thaw-affected zone. In 3DEC, the blocksand the structural planes are set to the Mohr-Coulombmodel. The mechanical parameters of the rocks and struc-tural planes in each area are comprehensively selectedthrough field survey and indoor test results ([19]; Tables 1and 2).
After the parameters assignments of all the blocks andstructural planes, the fixed velocity boundary conditionsand load conditions are applied to the numerical model.The left, right, and bottom boundaries of the model arefixed, and the upper part of the model has a free boundary.The times of FTC are taken as the driven parameter, andthe self-weight is considered in the load process. When themaximum unbalanced force of the node approaches zeroor is relatively small compared with the total force initiallyapplied, the model is taken as a state of equilibrium.
6. Results
The analysis of 0 times, 15 times, 30 times, and 50 times ofFTC is simulated for the typical rocky slope. And the distri-
bution of max-shear stress (Figure 3) and displacement(Figure 4) is obtained.
After 15 times of the FTC, a stress concentration zoneappeared along the structural planes in the freeze-thawaffected area. With the increase of FTC, the concentrationdistribution of the max-shear stress in the freeze-thawaffected area gradually expands. After 50 times of the FTC,a slipping zone is formed and basically penetrated.
Under the action of the FTC, the maximum displacementof the slope has increased from 4.468mm to 20.554mm after15 times of the FTC. After the 50 times of the FTC, the max-imum displacement increased to 28.366mm, and the factorof safety was reduced from 2.56 to 1.64, which shows thatthe deformation of the slope will increase and the stabilityof the slope will decrease.
From the perspective of stability trend (Figure 5), thefactor of safety decreases sharply under 0~15 times of the
Figure 5: The mechanic features of the typical rocky slope under different FTC.
Balls (35496)
Monitoring point
Monitoring point 1
Monitoring point 2
Monitoring point 3
Monitoring point 4
Figure 6: A dynamic simulation model of the typical rocky slope.
8 Geofluids
Contact force chainContacts (83631)
CompressionTensionDFN Fractures (8398)Facets
(a) Step 1000
Contact force chainContacts (79863)
CompressionTension
DFN Fractures (13391)
Facets
(b) Step 5000
Contact force chainContacts (76074)
CompressionTension
DFN Fractures (19282)
Facets
(c) Step 10000
Contact force chainContacts (69120)
CompressionTension
DFN Fractures (30637)
Facets
(d) Step 20000
Contact force chainContacts (59300)
Compression
Tension
DFN Fractures (50561)
Facets
(e) Step 50000
Contact force chainContacts (55036)
CompressionTension
DFN Fractures (58042)
Facets
(f) Step 100000
Figure 7: Continued.
9Geofluids
FTC, and then the decreasing tendency tends to be gentleafter 30 times of the FTC. It can be inferred that the slidingcollapse may undergo local instability under the action of theFTC with intense weathering or unloading. Affected byexternal factors such as heavy rainfall or earthquakes, theslope may be a failure.
7. Discussions
According to the previous theoretical analysis, the criticalstate was predicted by the evolution trend [20]. The relatedmechanical parameters of the rock mass and discontinuitieswere determined by the existing test data [21]. Furthermore,
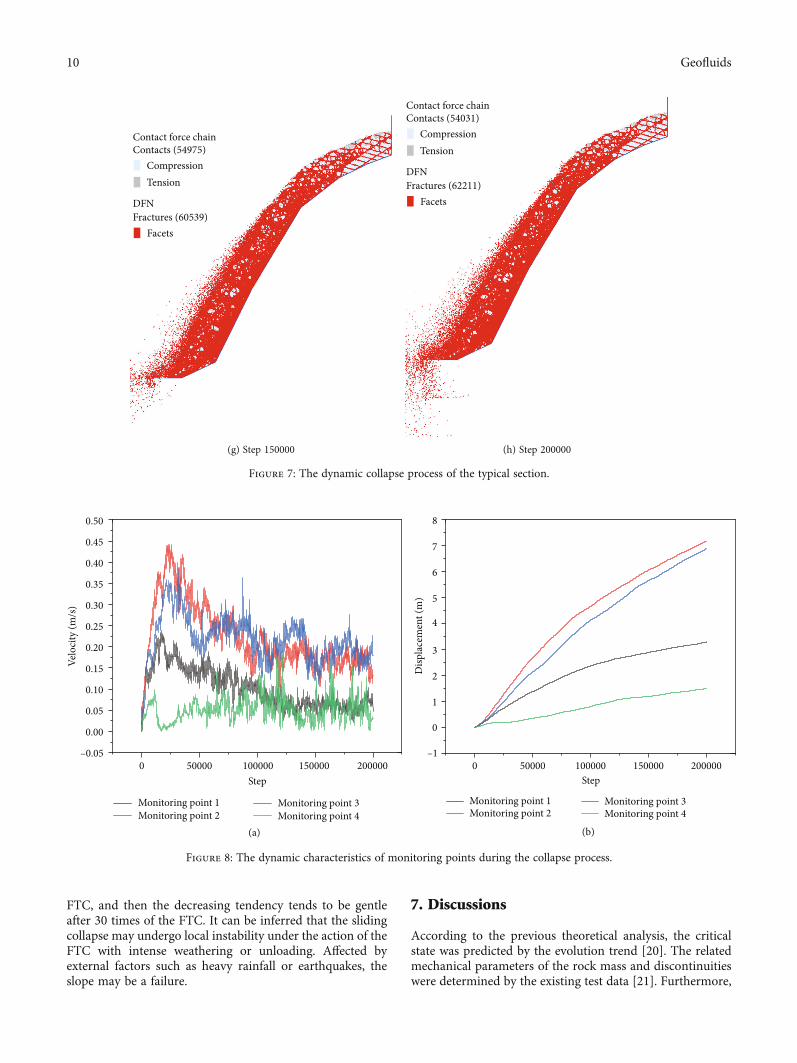
Contact force chainContacts (54975)
CompressionTension
DFN Fractures (60539)
Facets
(g) Step 150000
Contact force chainContacts (54031)
CompressionTension
DFN Fractures (62211)
Facets
(h) Step 200000
Figure 7: The dynamic collapse process of the typical section.
Step
Velo
city
(m/s
)
Monitoring point 1Monitoring point 2
Monitoring point 3Monitoring point 4
0–0.05
0.00
0.05
0.10
0.15
0.20
0.25
0.30
0.35
0.40
0.50
0.45
50000 100000 150000 200000
Disp
lace
men
t (m
)
Step
(a) (b)
Monitoring point 1Monitoring point 2
Monitoring point 3Monitoring point 4
0–1
0
1
2
3
4
5
6
7
8
50000 100000 150000 200000
Figure 8: The dynamic characteristics of monitoring points during the collapse process.
10 Geofluids
the microscopic parameters were calibrated according to themacroscopic parameters in the critical state, and the relatedmethods will not be described in detail [22, 23].
A numerical model was established based on the typicalsection involving 35496 particles (Figure 6). The bedrockwithout weathering at the trailing edge was simplified as awall to reduce the amount of calculation. Notably, this sim-plification of trailing edge may affect the simulation resultsof the slip rate of the rocky slope, but it can still effectivelyreveal the whole collapse process. Four monitoring pointswere placed on the typical section.
The dynamic collapse process of the typical section(Figure 7) led to several conclusions. As the concentrationof shear stress in rocky slope, dense cracks expand fromthe toe to the middle part along the structural planes. Thecracks increase and gradually penetrate, forming a gradualcumulative failure, which leads to further collapse of theslope under the action of gravity.
According to the dynamic characteristics of monitoringpoints (Figure 8), the displacement continues to increase,and the velocity begins to fall after reaching the peak values.Specifically, the peak values of slip velocity and the final slipdistance of monitoring point 2 in the leading edge are thelargest, while the related values of monitoring point 4 arethe smallest. This phenomenon shows that due to the spatialdistribution of multiple structural planes and the interactionbetween the rock fragments, the movement characteristics ofthe particles have a certain randomness during the failureprocess. Moreover, the sliding space at the leading edge islimited, and the sliding inclination angle of the trailing edgeis small. As a result, there is no long-distance migration, andthe in situ accumulation phenomenon of the slope is obviousafter slope failure. Even so, the sliding failure of the rockyslope would still cause great damage to Tianshan Road.
The dynamic characteristics of monitoring points areconsistent with the data monitored by the Zhenziyancollapse [24], which shows that the numerical simulationsare effective.
8. Conclusions
Driven by the times of FTC, the mechanical parameters ofthe rock mass and structural planes were reduced. And thenumerical calculations of DEM were used to reveal thedisaster-causing effect of the freezing and weathering envi-ronment in the alpine area.
Specifically, as the increase of FTC, the structural planesand internal microcracks of the rock mass would expandunder the action of frost heave force. Moreover, the physicaland mechanical properties of the rock mass on the surfaceare further deteriorated, leading to a gradual decrease inslope stability.
The dynamic collapse results show that the cracks grad-ually extend from the toe to the middle part of the rockyslope along the structural planes. The cracks continue toincrease and gradually penetrate, forming a progressivefailure, which causes further collapse of the slope under theaction of gravity. Due to the spatial distribution of multiplestructural planes and the interaction between rock frag-
ments, the movement characteristics of rock masses have acertain degree of randomness in the collapse process. Andthe sliding failure of the rocky slope will cause great damageto Tianshan Road. Therefore, it is necessary to strengthenthe monitoring of the rocky slope of Tianshan Road. In thiscase, the real-time deformation and mechanical state can beobtained, and the threat of landslide can be prevented.
Data Availability
The data used to support the findings of this study areavailable from the corresponding author upon request.
Conflicts of Interest
The authors declare that they have no conflicts of interest.
Acknowledgments
This study was supported by the National Natural ScienceFoundation of China (52008058 and 52108299).
References
[1] J. Charvet, L. S. Shu, S. Laurent-Charvet et al., “Palaeozoictectonic evolution of the Tianshan belt, NW China,” ScienceChina-Earth Sciences, vol. 54, no. 2, pp. 166–184, 2011.
[2] F. H. Chen, J. Jia, J. H. Chen et al., “A persistent Holocene wet-ting trend in arid central Asia, with wettest conditions in thelate Holocene, revealed by multi-proxy analyses of loess-paleosol sequences in Xinjiang, China,” Quaternary ScienceReviews, vol. 146, pp. 134–146, 2016.
[3] J. Q. Mu, The Rock Degradation Damage Characteristicsand the Disaster-Causing Effects under the Cyclic Freeze-Thaw Action, Chengdu University of Technology, 2013,(in Chinese).
[4] Y. Wang, B. Zhang, B. Li, and C. H. Li, “A strain-based fatiguedamage model for naturally fractured marble subjected tofreeze-thaw and uniaxial cyclic loads,” International Journalof Damage Mechanics, 2021.
[5] İ. İnce and M. Fener, “A prediction model for uniaxial com-pressive strength of deteriorated pyroclastic rocks due tofreeze-thaw cycle,” Journal of African Earth Sciences, vol. 120,pp. 134–140, 2016.
[6] D. M. Gu, H. L. Liu, X. C. Gao, D. Huang, and W. G. Zhang,“Influence of Cyclic Wettingâ–“Drying on the Shear Strengthof Limestone with a Soft Interlayer”,” Rock Mechanics andRock Engineering, vol. 54, no. 8, pp. 4369–4378, 2021.
[7] S. B. Huang, Q. S. Liu, A. P. Cheng, and Y. Z. Liu, “A statisticaldamage constitutive model under freeze-thaw and loading forrock and its engineering application,” Cold Regions Science andTechnology, vol. 145, pp. 142–150, 2018.
[8] M. Li, Y. Song, and F. Chen, “Analysis on stability of slope in atypical cold region based on thermo-mechanical coupling,”Bulgarian Chemical Communications, vol. 48, pp. 96–103,2016.
[9] J. W. Zhou, P. Cui, and M. H. Hao, “Comprehensive analysesof the initiation and entrainment processes of the 2000 Yigongcatastrophic landslide in Tibet, China,” Landslides, vol. 13,no. 1, pp. 39–54, 2016.
11Geofluids
[10] X. D. Luo, N. Jiang, X. Y. Fan, N. F. Mei, and H. Luo, “Effects offreeze-thaw on the determination and application of parame-ters of slope rock mass in cold regions,” Cold Regions Scienceand Technology, vol. 110, pp. 32–37, 2015.
[11] L. Q. Wang, Y. P. Yin, B. L. Huang, Z. H. Zhang, P. Zhao, andY. J. Wei, “A study of the treatment of a dangerous thick sub-merged rock mass in the three gorges reservoir area,” Bulletinof Engineering Geology and the Environment, vol. 79, no. 5,pp. 2579–2590, 2020.
[12] P. P. Guo, X. N. Gong, and Y. X. Wang, “Displacement andforce analyses of braced structure of deep excavation consider-ing unsymmetrical surcharge effect,” Computers and Geotech-nics, vol. 113, p. 103102, 2019.
[13] P. P. Guo, X. N. Gong, Y. X. Wang, H. Lin, and Y. L. Zhao,“Minimum cover depth estimation for underwater shield tun-nels,” Tunnelling and Underground Space Technology, vol. 115,p. 104027, 2021.
[14] Y. Wang, Y. F. Yi, C. H. Li, and J. Q. Han, “Anisotropicfracture and energy characteristics of a Tibet marble exposedto multi-level constant-amplitude (MLCA) cyclic loads: alab-scale testing,” Engineering Fracture Mechanics, vol. 244,p. 107550, 2021.
[15] M. Xu, S. C. Kang, H. Wu, and X. Yuan, “Detection of spatio-temporal variability of air temperature and precipitation basedon long-term meteorological station observations overTianshan Mountains, Central Asia,” Atmospheric Research,vol. 203, pp. 141–163, 2018.
[16] L. Q. Wang, Y. P. Yin, C. Y. Zhou, B. L. Huang, and W. P.Wang, “Damage evolution of hydraulically coupled Jian-chuandong dangerous rock mass,” Landslides, vol. 17, no. 5,pp. 1083–1090, 2020.
[17] L. Q. Wang, B. L. Huang, Z. H. Zhang, Z. W. Dai, P. Zhao, andM. J. Hu, “The analysis of slippage failure of the HuangNanBeislope under dry-wet cycles in the three gorges reservoir region,China,” Geomatics, Natural Hazards and Risk, vol. 11, no. 1,pp. 1233–1249, 2020.
[18] Y. Wang, W. K. Feng, H. J. Wang, C. H. Li, and Z. Q. Hou,“Rock bridge fracturing characteristics in granite induced byfreeze-thaw and uniaxial deformation revealed by AE moni-toring and post-test CT scanning,” Cold Regions Science andTechnology, vol. 177, p. 103115, 2020.
[19] J. Q. Mu, X. J. Pei, Y. Huang, and W. K. Min, “Experimentalresearch on mechanical characteristics of rock with cycles offreezing-thawing action,” Journal of Engineering Geology.,vol. 21, no. 1, pp. 103–108, 2013.
[20] J. J. Zhao, X. Wan, Y. B. Shi, J. B. Wei, and M. L. Lee,“Deformation behavior of mining beneath flat and slopingterrains in mountainous areas,” Geofluids, vol. 2021, 16pages, 2021.
[21] P. A. Cundall, A Computer Model for Simulating ProgressiveLarge Scale Movements in Blocky Rock Systems, Proceedingsof the symposium of the International Society for RockMechanics, Society for Rock Mechanics (ISRM), France,1971.
[22] D. O. Potyondy, “The bonded-particle model as a tool for rockmechanics research and application: current trends and futuredirections,” Geosystem Engineering, vol. 18, no. 1, pp. 1–28,2015.
[23] L. Q. Wang, Y. P. Yin, B. L. Huang, and Z. W. Dai, “Damageevolution and stability analysis of the Jianchuandong danger-ous rock mass in the three gorges reservoir area,” EngineeringGeology, vol. 265, p. 105439, 2019.
[24] K. He, C. L. Chen, and B. Li, “Case study of a rockfall inChongqing, China: movement characteristics of the initialfailure process of a tower-shaped rock mass,” Bulletin ofEngineering Geology and the Environment, vol. 78, no. 5,pp. 3295–3303, 2019.