147
AGRICULTURE AND RURAL DEVELOPMENT Study on the competitiveness of European wines FINAL REPORT WRITTEN BY COGEA S.R.L. OCTOBER 2014
AGRICULTURE AND
RURAL DEVELOPMENT
Study on the competitiveness of European wines
FINAL REPORT
WRITTEN BY COGEA S.R.L.
OCTOBER 2014
COGEA S.r.l.
Represented by Francesca Antilici
102, Via Po - 00198 Rome (Italy)
Tel.: +39.06.853.73.51
Web: www.cogeaspa.it
E-mail: [email protected]
Scientific Director of the study: Ezio Scotti
Coordinator of the study: Carlotta Valli
LEGAL NOTICE
The information and views set out in this study are those of the author(s) and do not necessarily reflect the official opinion of the Commission. The Commission does not guarantee the accuracy of the data included in this study. Neither the Commission nor any person acting on the Commission’s behalf may be held responsible for the use which may be made of the information contained therein.
More information is available on the Internet (http://www.europa.eu)
Luxembourg: Publications Office of the European Union, 2014
Catalogue number: KF-02-14-995-EN-N
ISBN: 978-92-79-40735-2
doi: 10.2762/56910
© European Union, 2014
Reproduction is authorised provided the source is acknowledged.
Printed in Italy
STUDY ON THE COMPETITIVENESS OF EUROPEAN WINES 3
TABLE OF CONTENTS
1 INTRODUCTION .................................................................................................................................. 11
2 OVERALL APPROACH TO THE STUDY ........................................................................................ 12
2.1 DEFINITION OF COMPETITIVENESS AND IMPLICATIONS FOR ANALYSIS .................... 12
2.2 IDENTIFICATION OF MAIN COMPETITORS OF EU WINES AT THE
INTERNATIONAL LEVEL ............................................................................................................. 13
2.3 PRODUCT COVERAGE ................................................................................................................. 14
2.3.1 Import markets for bottled versus bulk wine ..................................................................... 14
2.4 SELECTION OF CASE STUDY COUNTRIES .............................................................................. 15
2.5 DATA SOURCES AND LIMITS ..................................................................................................... 16
2.5.1 In-depth interviews with key economic actors .................................................................. 17
2.5.2 Official statistical sources .................................................................................................. 18
2.5.3 Market data sources ........................................................................................................... 19
2.5.4 Web-checks of online wine retailers .................................................................................. 19
2.6 METHODOLOGICAL APPROACH AND TOOLS OF ANALYSIS ............................................. 20
2.6.1 Methodological approach and tools of analysis for Theme 1 ............................................ 20
2.6.2 Methodological approach and tools of analysis for Theme 2 ............................................ 23
2.6.3 Methodological approach and tools of analysis for Theme 3 ............................................ 24
3 THE EU WINE POLICY FRAMEWORK .......................................................................................... 25
3.1 EU WINE POLICY 1962-1999 ........................................................................................................ 25
3.2 THE 1999 WINE CMO REFORM ................................................................................................... 25
3.3 THE 2008 WINE CMO REFORM ................................................................................................... 26
3.3.1 Support measures ............................................................................................................... 26
3.3.2 Regulatory measures .......................................................................................................... 27
3.3.3 Trade with third countries .................................................................................................. 28
3.3.4 Production potential ........................................................................................................... 28
3.4 HORIZONTAL MEASURES FOR THE PROVISION OF INFORMATION AND
PROMOTION ON THE INTERNAL MARKET AND IN THIRD COUNTRIES ......................... 29
3.5 THE CAP REFORM 2014-2020: WINE PROVISIONS WITHIN THE CMO ............................... 29
3.5.1 Support measures ............................................................................................................... 29
3.5.2 Production potential ........................................................................................................... 30
3.5.3 Regulatory measures .......................................................................................................... 30
4 WINE POLICIES OF EU COMPETITORS ....................................................................................... 31
4.1 USA: PUBLIC INTERVENTION IN WINE EXPORTS AND PROMOTION .............................. 31
4.1.1 California Wine Export Program ....................................................................................... 31
4.1.2 The US Import Duty and Excise Tax Drawback Scheme and its implications ................. 31
4.2 CHILE: PUBLIC INTERVENTION IN WINE EXPORTS AND PROMOTION .......................... 32
4.2.1 The Chilean Wine Cluster: An Institutional Arrangement ................................................ 32
4.3 ARGENTINA: PUBLIC INTERVENTION IN WINE EXPORTS AND PROMOTION ............... 32
4.3.1 Regulation of the wine market through concentrated grape must: the Mendoza-San
Juan Agreement ................................................................................................................. 33

STUDY ON THE COMPETITIVENESS OF EUROPEAN WINES 4
4.3.2 A public-private partnership to establish a strategic plan for the wine industry................ 33
4.4 AUSTRALIA: PUBLIC INTERVENTION IN WINE EXPORTS AND PROMOTION ................ 34
4.4.1 Wine Australia: “Directions to 2025” ................................................................................ 34
4.5 NEW ZEALAND: PUBLIC INTERVENTION IN WINE EXPORTS AND PROMOTION ......... 35
4.5.1 International Wine Promotion ........................................................................................... 35
4.5.2 Suppressing barriers to international wine trade ................................................................ 35
4.6 SOUTH AFRICA: PUBLIC INTERVENTION IN WINE EXPORTS AND PROMOTION ......... 36
4.6.1 The promotion of South African wines and reduction of trade barriers ............................ 36
5 THEME 1 – DEVELOPMENT OF THE COMPETITIVENESS OF EU WINES .......................... 37
5.1 THE LEVELS OF ANALYSIS ........................................................................................................ 37
5.2 GLOBAL COMPETITIVENESS OF EU STILL WINES WITH RESPECT TO
INTERNATIONAL TRADE ............................................................................................................ 38
5.2.1 The position of country-systems on the world export market ........................................... 38
5.2.2 Import market shares of EU wines on the most important world markets ........................ 39
5.2.3 Analytical approach to analysis of global competitiveness of EU still wines with
respect to international trade .............................................................................................. 40
5.2.4 Global competitiveness of EU still wines in the world market ......................................... 42
5.2.5 EU still wine exports: PDO and non-PDO wines .............................................................. 46
5.2.6 The export market for bottled vs. bulk wines: A change of strategy ................................. 48
5.2.7 Global competitiveness of EU still wines in the 10 most important import markets
and in 3 EU markets (case study Member States) ............................................................. 49
5.2.8 Price competitiveness ........................................................................................................ 55
5.3 GLOBAL COMPETITIVENESS OF EU STILL WINES WITH RESPECT TO DOMESTIC
CONSUMPTION .............................................................................................................................. 60
5.3.1 Domestic consumption of still wine in the case study markets ......................................... 61
5.3.2 Consumption market shares of EU wines in the case study markets ................................. 61
5.3.3 Global EU wine competitiveness with respect to domestic consumption in the case
study markets ..................................................................................................................... 62
5.3.4 Price/quality competitive positioning of EU wines compared to competitors in the
consumer markets .............................................................................................................. 65
5.3.5 Competitiveness of EU still wines in the online retail channel ......................................... 71
5.4 SYNTHESIS OF RESULTS OF ANALYSIS OF THE GLOBAL COMPETITIVENESS OF
EU STILL WINES ............................................................................................................................ 74
5.5 INFLUENCES ON THE COMPETITIVENESS OF EU WINES AND THIRD COUNTRY
WINES: THE PORTER’S DIAMOND ............................................................................................ 76
5.5.1 Factor conditions in producer countries............................................................................. 76
5.5.2 Demand conditions in consumer countries ........................................................................ 81
5.5.3 Firm strategies (structure and rivalry) ............................................................................... 84
5.5.4 Related and supporting industries ...................................................................................... 91
5.5.5 Government (Central policies of producer and consumer countries) ................................ 92
5.5.6 Chances .............................................................................................................................. 99
5.5.7 Synthesis of the results of the Porter’s Diamond ............................................................. 100
6 THEME 2 – IDENTIFICATION OF THE KEY FACTORS OF COMPETITIVENESS ............ 103
6.1 PROCEDURE AND METHODOLOGY ADOPTED FOR THE ANALYSIS ............................. 103
6.1.1 Identification of factors of competitiveness and assessment of their importance............ 103
6.1.2 Methodology used to establish cause-effect relationships among factors ....................... 105

STUDY ON THE COMPETITIVENESS OF EUROPEAN WINES 5
6.2 RESULTS OF THE ANALYSIS FOR PACKAGED WINE ......................................................... 106
6.2.1 Factors of competitiveness and their importance ............................................................ 106
6.2.2 Degree of response to factors of competitiveness of EU wines compared to NWC
and domestic wines, based on opinions of market players .............................................. 108
6.2.3 Application of structural analysis .................................................................................... 111
6.2.4 Overall results obtained with the MicMac method by country/segment combination .... 117
6.2.5 Generalisation of results by segment ............................................................................... 119
6.3 RESULTS OF THE ANALYSIS FOR BULK WINE .................................................................... 121
6.3.1 Factors of competitiveness of bulk wines and their importance ...................................... 121
6.3.2 Degree of response of EU bulk wines to factors of competitiveness compared to
competitors, based on opinions of market players ........................................................... 122
7 THEME 3 – HOW TO IMPROVE THE COMPETITIVENESS OF EUROPEAN WINES ........ 123
7.1 METHODOLOGICAL APPROACH FOR THEME 3 .................................................................. 123
7.2 EVOLUTION OF FACTOR CONDITIONS IN PRODUCER COUNTRIES ............................... 123
7.2.1 Future prospects for vineyard areas, wine production and probable impacts .................. 123
7.2.2 Future prospects relative to export propensity ................................................................. 124
7.3 EVOLUTION OF DEMAND CONDITIONS IN THE CASE STUDY COUNTRIES ................. 125
7.3.1 Population and GDP prospective growth ......................................................................... 125
7.3.2 Consumption forecasts for bottled still wine ................................................................... 126
7.3.3 Expectations about changes in consumer markets and impact on consumption .............. 129
7.3.4 Expected future developments of wine demand in the case study markets ..................... 130
7.3.5 BCG matrix based on 2018 consumption forecasts ......................................................... 131
7.4 HYPOTHESES ON THE EVOLUTION OF KEY FACTORS OF COMPETITIVENESS .......... 134
7.4.1 Perceived changes in the importance of factors of competitiveness for packaged
wines, from the current situation to 2025 ........................................................................ 134
7.4.2 The competitive position of EU bottled wine by 2025 .................................................... 135
7.4.3 Perceived changes in the importance of factors of competitiveness for bulk wine,
from the current situation to 2025 ................................................................................... 138
7.5 POSSIBLE STRATEGIC ADAPTATION OF ECONOMIC ACTORS TO CHANGES IN
THE COMPETITIVE SCENARIO AND IN THE HIERARCHY OF KEY FACTORS OF
COMPETITIVENESS .................................................................................................................... 138
7.5.1 Strategies of expansion or penetration of export markets ................................................ 138
7.5.2 Strategies of expansion for products positioned in the higher price/quality segments .... 140
7.5.3 Strategies of growth of bulk wine exports to the detriment of bottled wine exports,
adapted according to product usage function and market segment ................................. 140
7.5.4 Strategies of (further) industry concentration .................................................................. 141
7.6 CONCLUSIONS ABOUT THE IMPROVEMENT OF EU WINES COMPETITIVENESS ........ 141
7.6.1 Market access .................................................................................................................. 142
7.6.2 The decision-making process of economic actors ........................................................... 144
7.6.3 Product adaptation to markets ......................................................................................... 145

STUDY ON THE COMPETITIVENESS OF EUROPEAN WINES 6
List of tables
Tab. 1: Average CIF price of still wine in bottles imported in the most important markets for the EU, by country of origin, 2012
(€/lt) .......................................................................................................................................................................................... 59 Tab. 2: Average CIF price of still wine in bulk imported in the most important markets for the EU, bycountry of origin, 2012
(€/lt) .......................................................................................................................................................................................... 60 Tab. 3: Number of products per country market, total and by type of packaging .................................................................................. 65 Tab. 4: Brands positioning according to price (0.75lt bottles) by market and area of origin (% over total number of brands) ............. 68 Tab. 5: Composition of wine assortment by country of origin in the online stores ............................................................................... 72 Tab. 6: Still wines distribution by price segment and country of origin in online stores ....................................................................... 73 Tab. 7: Geografical indication and mention of variety (% over total still wines assortment) in online stores ....................................... 74 Tab. 8: Synthesis of results of analysis of the overall competitiveness of EU still wines relative to competitors ................................. 75 Tab. 9: IBWTI for bottled wine in volume (2012)................................................................................................................................. 80 Tab. 10: IBWTI for bulk wine in volume (2012) .................................................................................................................................. 81 Tab. 11: Number of wine brands in the case study country markets by country of origin, 2013 (% over total brands) ........................ 85 Tab. 12: Market shares of bottled still wines in volume in the case study markets (C4), by wine company and country, 2013 (%) ..... 86 Tab. 13: Market shares of the major global wine companies in the case study countries (bottled wine volume; %), 2013 ................... 87 Tab. 14: Number of brands by company: total and by wine origin, 2014 .............................................................................................. 88 Tab. 15: Number of wine brands by country of origin marketed by the major global wine companies in the case study markets -
2013 .......................................................................................................................................................................................... 90 Tab. 16: Wine companies marketing EU and non-EU wines, 2013 ....................................................................................................... 91 Tab. 17: European Commission financial support for the wine promotion measure (Financial execution 2009-2013; Financial
table 2014-2018, million Euro) ................................................................................................................................................. 91 Tab. 18: Financing of promotional initiatives by national or regional organisations in NWCs ............................................................. 92 Tab. 19: Strategic plan 2020 of Chile: Projected investment in Marketing and promotion - wineries .................................................. 92 Tab. 20: Fiscal policy and taxation in the most important country markets for EU wine exports ......................................................... 93 Tab. 21: Formation of wine market price (€/bottle) ............................................................................................................................... 94 Tab. 22: Price formation for wines of different price at origin and final price/price at origin ratio (£) ................................................. 94 Tab. 23: Free Trade Agreements with reduced or zero import duties .................................................................................................... 95 Tab. 24: Policy measures developed by the EU and NWCs with potential effects on market access and competitiveness ................... 98 Tab. 25: Structural analysis matrix ...................................................................................................................................................... 105 Tab. 26: Overview of the factors of competitiveness, classified according to their importance (total, by market segment and case
study country) ......................................................................................................................................................................... 106 Tab. 27: Total number of factors of competitiveness, both “extremely important” and “important”, by segment, by country and
overall ..................................................................................................................................................................................... 108 Tab. 28: Response of EU packaged wines to factors of competitiveness, compared with NWC wines .............................................. 108 Tab. 29: Response to factors of competitiveness of EU packaged wines vs. domestic wines ............................................................. 110 Tab. 30: General Matrix of direct relationships between factors ......................................................................................................... 112 Tab. 31: United Kingdom – General matrix of direct relationships among factors in the Top range segment .................................... 114 Tab. 32: United Kingdom (Top range) – Hierarchy of factors of competitiveness, by influence and indirect dependence ................. 117 Tab. 33: Results of MicMac analysis by country and market segment (°) ........................................................................................... 118 Tab. 34: Size of general sub-matrices by segment ............................................................................................................................... 119 Tab. 35: Overview of factors of competitiveness for bulk wines ranked by importance, by case study country and total .................. 121 Tab. 36: Response of EU bulk wines to factors of competitiveness compared with wines of competitors.......................................... 122 Tab. 37: Forecast evolution of adult population and growth rates in case study countries, 2013-2018 (Million, %) .......................... 126 Tab. 38: Consumption of bottled still wine and annual average growth rates (2000-2013 and 2013-2018 forecasts), total and by
origin – Annual average growth rates of market shares by origin (2013-2018 forecasts) ...................................................... 128 Tab. 39: Expected future developments in the case study consumer markets...................................................................................... 130 Tab. 40: Opinions about future evolution of the importance of factors of competitiveness for packaged wines (from the current
situation to 2025) .................................................................................................................................................................... 134 Tab. 41: Combination between factors that will increase in importance and factors to which EU wines respond better compared to
NWC wines ............................................................................................................................................................................. 136 Tab. 42: Combination between factors that will increase in importance and factors to which EU wines respond better compared to
domestic wines ........................................................................................................................................................................ 137 Tab. 43: Opinions about future evolution of the importance of factors of competitiveness for bulk wine (from the current situation
to 2025) ................................................................................................................................................................................... 138 Tab. 44: Percentage share of first 10 export markets in 2000 and 2012 (in volume) ........................................................................... 139
STUDY ON THE COMPETITIVENESS OF EUROPEAN WINES 7
List of figures
Fig. 1: Evolution of wine sales* and market shares of EU and competing wines in an expanding market ............................................ 22 Fig. 2: Evolution of wine sales (volume or value) and market shares of EU and competing wines in a declining market .................... 22 Fig. 3: Export market shares of main wine exporting countries in value and volume, 2012 (% over world total export) ..................... 39 Fig. 4: Import market shares of EU still wines in value and volume in the most important EU export markets, 2012 (%) ................... 40 Fig. 5: World: Total still wine export value, volumes and market shares, 2000-2012 (World 2000= 100) ........................................... 42 Fig. 6: World: Bottled still wine export value, volumes and export market shares, 2000-2012 (World 2000= 100) ............................. 43 Fig. 7: Bottled still wine export market shares of main competitors, 2000-2012 .................................................................................. 44 Fig. 8: World: Bulk still wine export value, volumes and export market shares, 2000-2012 (World 2000= 100) ................................. 45 Fig. 9: Bulk still wine export market shares of main competitors, 2000-2012 ...................................................................................... 46 Fig. 10: Map of competitiveness of EU versus non-EU exported still wines in the world market ........................................................ 46 Fig. 11: Evolution of EU still wine exports towards the rest of the world : PDO and non-PDO wines (PGI, WGI, Varietal wines),
2000-2013 ................................................................................................................................................................................. 47 Fig. 12: Cumulative exports of still wine in bottles and bulk, from EU28 (intra + extra EU) and NWC (hl), 2000-2012 ..................... 48 Fig. 13: Bottled wine export /Bulk wine export ..................................................................................................................................... 48 Fig. 14: Top 10 third-countries importers of EU bottled still wine: import values, volumes and market shares, 2000-2012 ............... 50 Fig. 15: Bottled still wine imports from main competitors, 2000-2012 ................................................................................................. 51 Fig. 16: Top 10 third-countries importers of EU still wine in bulk: import values, volumes and market shares, 2000-2012 ................ 52 Fig. 17: Bulk still wine imports from main competitors, 2000-2012 ..................................................................................................... 53 Fig. 18: Maps of competitiveness of EU versus non-EU bottled still wines in the top 10 third-country markets and in the 3
Member State markets............................................................................................................................................................... 54 Fig. 19: Maps of competitiveness of EU versus non-EU bulk still wines in the top 10 third-country markets and in the 3 Member
State markets ............................................................................................................................................................................. 54 Fig. 20: Evolution of bulk wine and grape must imports (hl) ................................................................................................................ 55 Fig. 21: Evolution of the FOB unit value of EU and NWC wines in bottles and bulk (USD/lt and Euro/lt), 2000-2012 ...................... 56 Fig. 22: EU/NWC FOB unit values ....................................................................................................................................................... 56 Fig. 23: Evolution of FOB Unit Values of still wines exported by EU Members States and main EU competitors (EUR/lt) ............... 57 Fig. 24: Average CIF price of still wine in bottles imported in the most important markets for the EU, 2012 (EUR/lt) ....................... 58 Fig. 25: Average CIF price of still wine in bulk imported in the most important markets for the EU, 2012 (EUR/lt) .......................... 60 Fig. 26: Packaged still wines consumption trends in the case study markets, 2000=100 ...................................................................... 61 Fig. 27: EU wine market shares, 2000 and 2013 (% on total still wine consumption) .......................................................................... 62 Fig. 28: All Case Study countries: still wine consumption by origin and evolution of market shares, 2000-2013 ................................ 63 Fig. 29: Consumption of still wines from main EU competitors in the group of case study country markets, 2000-2013 (hl) ............. 64 Fig. 30: Map of competitiveness of EU versus non-EU still wines with respect to consumption in the case study markets ................. 64 Fig. 31: Prices of selected brands in the case study markets (EUR/lt) ................................................................................................... 66 Fig. 32: Percentage distribution of wines in 0.75 lt bottles by price range in the case study markets .................................................... 67 Fig. 33: Percentage distribution of wines packaged in large size bottles, brick and Bag-in-box by price range in the case study
markets ...................................................................................................................................................................................... 67 Fig. 34: Price positioning of brands (0.75lt bottles) by market and country of origin (% over total number of brands for each
country of origin) ...................................................................................................................................................................... 69 Fig. 35: Percentage of EU and non-EU still wines in the product assortment of online retailers .......................................................... 72 Fig. 36: Porter’s Diamond: Variables (and their interactions) that restrict / facilitate / orientate domestic demand and wine origin
(EU/non EU) ............................................................................................................................................................................. 76 Fig. 37: Evolution of vineyard areas and total wine production, 2000-2012/13 (2000 = 100) .............................................................. 77 Fig. 38: Average annual rate of change of planted areas and wine production in the EU and in competing countries (2006-
2012/13) .................................................................................................................................................................................... 78 Fig. 39: Index of export propensity of the EU and its main competitors (average 2001-02 and 2011-12) ............................................ 79 Fig. 40: Most important country markets for EU wines in bottles and bulk: Population size in 2000 and growth rate 2000-2011
(million, %) ............................................................................................................................................................................... 82 Fig. 41: Most important country markets for EU wines in bottles and bulk: GDP per capita (in PPP) in 2000 and GDP average
annual growth rate 2000-2011 (USD, %) .................................................................................................................................. 83 Fig. 42: China – Population and GDP by province ................................................................................................................................ 84 Fig. 43: C4 of wine companies and number of brands in the examined country markets ...................................................................... 87

STUDY ON THE COMPETITIVENESS OF EUROPEAN WINES 8
Fig. 44: Exchange rates of the currencies of competitors and of consumer markets with the Euro (Euros per 1 unit of foreign
currency) (Index: 2000=100) .................................................................................................................................................. 100 Fig. 45: Porter’s Diamond: A synthesis of the results ......................................................................................................................... 101 Fig. 46: Influence-dependence space map ........................................................................................................................................... 105 Fig. 47: UK (Top range) – Direct and indirect influence-dependence maps........................................................................................ 115 Fig. 48: UK (Top range) – Displacement map and graphs representing factor hierarchy changes, from direct to indirect, for
influence (A) and dependence (B) ........................................................................................................................................... 116 Fig. 49: UK (Top range) – Indirect influence/dependence graph ........................................................................................................ 116 Fig. 50: General indirect influence/dependence graphs in the Entry Level, Medium Range and Top Range segments ...................... 119 Fig. 51: First six influential factors and first six dependent factors by segment (in decreasing order of importance) ......................... 120 Fig. 52: EU wine production for vinification, human consumption and their ratio ( 1,000 hl, %) ....................................................... 125 Fig. 53: Consumption evolution: 2000-2013 time series and forecasts for 2013-2018 (000s 9-litre cases) ........................................ 127 Fig. 54: Evolution of wine consumption in traditional markets 2000-2011 (million hl) ...................................................................... 127 Fig. 55: Representation of types of wine consumed according to consumer targets and consumption occasions .............................. 129 Fig. 56: Growth-Market Share Matrix for still wine – Case study markets* ...................................................................................... 133 Fig. 57: Evolution of wine consumption in non-tradional markets, 2005-2011 (million hl)................................................................ 140

STUDY ON THE COMPETITIVENESS OF EUROPEAN WINES 9
Abbreviations
AAGR Average Annual Growth Rate
AOC Appellation d'Origine Contrôlée
AOP Appellation d'Origine Protégée
ARS Argentine Peso
AUD Australian Dollar
AVA American Viticulture Area
BCG Boston Consulting Group
BIB Bag-In-Box
CAP Common Agricultural Policy
CIF Cost, Insurance and Freight
CMO Common Market Organisation
DOC/DOCG Denominazione d’Origine Controllata/ Denominazione d’Origine Controllata e Garantita
EAFRD European Agricultural Fund for Rural Development
EAGF European Agricultural Guarantee Fund
EC European Commission
EU European Union
FAO Food and Agriculture Organisation of the United Nations
FOB Free on Board
FTA Free Trade Agreement
GDP Gross Domestic Product
GI Geographical Indication
IBWTI Index of Bilateral Wine Trade Intensity
ICE Istituto nazionale per il Commercio Estero (Italy)
ICEX Instituto Español de Comercio Exterior (Spain)
IMF International Monetary Fund
IWSR International Wine and Spirit Research
NWC New World Countries
OECD Organisation for Economic Co-operation and Development
OIV Organisation Internationale de la Vigne et du Vin
PDO Protected Designation of Origin
PGI Protected Geographical Indication
PPP Purchasing Power Parities
RDP Rural Development Programme
TTB Alcohol and Tobacco Tax and Trade Bureau (USA)
USD United States Dollar
USDA United States Department of Agriculture (USA)
VAT Value Added Tax
v.q.p.r.d Vins de Quality Produits dans des Régions Determinées
WET Wine Equalisation Tax
WGI (wines) Without Geographical Indication
WTO World Trade Organization
WWTG World Wine Trade Group

STUDY ON THE COMPETITIVENESS OF EUROPEAN WINES 10

STUDY ON THE COMPETITIVENESS OF EUROPEAN WINES 11
1 INTRODUCTION
This report presents the results of the Study on the competitiveness of European wines.
The aim of the study is to build on the current position of European wines in the key world markets to derive
conclusions on how to further advance the policy objective of improving their competitiveness. The study
analyses the development of EU wines competitiveness and identifies the key factors of competitiveness in
the most important consumer markets where EU wines enter in direct competition with third country wines.
The study focuses on still wines and distinguishes between two business areas: bottled wine and bulk wine.
The analysis also distinguishes wines by price/quality segments and wines with Geographical Indication and
without, including varietal wines.
The study examines in detail seven case study markets: China (including Hong Kong), Japan, Russia, USA,
Denmark, Germany and the United Kingdom.
The main EU competitors considered in the study are New World Countries (NWC): Argentina, Australia,
Chile, New Zealand, South Africa and USA.
The study period is up to the horizon 2025. In order to assess past and current development of the
competitiveness of European wines, data from 2000 onwards are analysed.

STUDY ON THE COMPETITIVENESS OF EUROPEAN WINES 12
2 OVERALL APPROACH TO THE STUDY
This chapter presents the overall approach to the study based on the work carried out, comprising the
development of the theoretical framework, the definition of the empirical approach to the study (i.e.
methodologies and analytical tools), the data collection and validation.
The study develops around three Themes:
Theme 1 – Development of the competitiveness of EU wines (past and prospective)
Theme 2 – Identification of the key factors of competitiveness (both EU and non-EU wines)
Theme 3 – How to improve the competitiveness of EU wines.
In consideration of the fact that “The general aim of this study is to provide the background knowledge on
the key factors and mechanisms behind the development of the competitiveness of European wines, and to
assess how to further improve it both inside the EU market and in main third country markets vis-à-vis the
competition from wine-producing third countries”, the development of the empirical approach to the study
has required, first of all, the definition of the theoretical framework, the scope of the study and the field of
analysis:
A definition of what is meant by wine competitiveness that takes into account the overall objectives of
the study, the complexity of wine markets at the international level, the implications for the collection of
relevant data and implications for analysis in the present study;
The identification of the main competitors of EU wines on the most important world markets;
The definition of the different types of wine products on which the study must focus (i.e. product
coverage);
The identification of the most important world markets where EU wines compete with wines of other
origin (i.e. main competitors) on which to focus the analysis. In this respect, the overall analysis based
on official trade statistics covers the most important markets for EU wine exports (bottled and bulk
wine), whereas more in-depth analysis focuses on selected Case Study countries (see following §2.4).
The following sections of the present chapter illustrate these four key elements of the study.
2.1 DEFINITION OF COMPETITIVENESS AND IMPLICATIONS FOR ANALYSIS
Competitiveness is defined as the ability of a system to sustainably produce and sell goods and services on a
given market, in such a way that buyers prefer these goods to those offered by competitors.
The goal of competitiveness in a specific market is the consolidation or increase of market share while
maintaining an adequate return. In expanding markets the goal is achieved with sales growing at a higher rate
than that of the total market and of competitors, and in declining markets with sales decreasing at a lower
rate than that of the total market and of competitors. In this sense, competitiveness reflects the ability of the
system to respond to a combination of market conditions originating from intermediate market actors
(distribution) and final consumer markets.
Furthermore, the analysis of a "specific market" needs to distinguish between:
a. the overall country-market (i.e. the wine market in China, Russia, etc.) and
b. within country-markets, as different segments exist. Each market segment generates an independent
competitive system and a specific structure of success factors that differ from segment to segment. The
intensity with which firms respond to these success factors helps to define the degree of competitiveness
(and therefore the level of market share).
The distinction of different market levels means that the concept of competitiveness (and its improvement)
needs to be analysed according to two dimensions:
1. The competitiveness of wines originating from different country-systems competing on a certain market
(e.g. competitiveness of EU wines versus Australian wines on the UK market, etc.);

STUDY ON THE COMPETITIVENESS OF EUROPEAN WINES 13
2. The competitiveness of EU wine businesses (production and distribution) in comparison with the
competitiveness of non-EU wine businesses, both operating in a certain market or market segment.
In general, the first dimension cannot be separated from the second, as the result of the implementation of
strategies and operations of companies seeking to increase their competitiveness on a given market / segment
(in essence, to increase their market share) helps to determine the overall competitiveness of country-
systems. In conclusion, the growth of market share is the final expression of the objective of improving
competitiveness.
It must be taken into account that the globalisation of the wine market, together with the evolution of the
industry structure towards increasing concentration, potentially makes the analysis of the competitiveness of
EU wines relative to wines of other origin more complex. In fact, the extension of product portfolios (or
brand portfolios) by global companies (mainly Australian and American, but also European) and the
development of commercial networks that distribute both New World and EU wines are more and more
commonly used strategies. For these companies, the goal is acquiring and maintaining presence (market
share) in a specific market segment through supply of a wide range of different products and brands - all
managed by the same company. Thus, the product origin does not matter as much as the product’s ability to
enter into the strategic plan of the company (i.e. product/market positioning strategy). In this sense, the focus
is on the competitiveness of EU versus New World wine businesses rather than on the competitiveness of EU
wines relative to New World wines.
2.2 IDENTIFICATION OF MAIN COMPETITORS OF EU WINES AT THE INTERNATIONAL LEVEL
Following the definition of competitiveness, the next step has consisted in identifying the wine producing /
exporting countries whose products enter into direct competition with EU wines on the most important
markets worldwide. The main competitors of the EU on international wine markets can be thought of as
belonging to the following main groups:
New World Countries (NWC) This group counts the 8 most important wine producers worldwide (i.e.
besides EU member states): Australia, South Africa, New Zealand, Chile, Argentina, the United States,
Canada and Uruguay1 (NWC8). NWC8 are the most important wine exporting countries after the main
EU wine producers (i.e. France, Italy and Spain) and their wines represent the main competitors of EU
wines on the most important world markets.
Western Balkans wine producers comprising Serbia, Kosovo2, Bosnia-Herzegovina, Montenegro, the
former Yugoslav Republic of Macedonia (fYRoM) and Albania. The inclusion of these countries in the
analysis finds its motivation in their prospects of eventually becoming EU member states and the
strengthening of regional cooperation3. In particular, fYRoM is the leading producer/exporter of the
region (albeit predominantly exporting wine to other Western Balkan countries, in particular, Serbia and
Bosnia-Herzegovina). A steady flow of bulk wine from fYRoM is directed towards Germany, however
such exports do not represent altogether important volumes nor value.
Other wine exporting countries that are relevant for certain analysed markets. For example, the inclusion
of Caucasus wine producers/exporters in the analysis, in particular Georgia (the leading wine producer /
exporter of the region), is only relevant to Russia and finds its motivation in the embargo on Georgian
wine imports imposed by Russia in 2006 as a result of conflict between the two countries. The embargo
led Russia to import from other countries, including EU Member States. At the same time, Georgia
diverted its exports to other consuming countries since 2006. The lifting of the embargo on Georgia’s
products in the summer of 2013 could change again the composition of Russian wine imports. However,
it is argued in the literature that Georgia’s wine exports may not be able to reach pre-ban levels as the
Russian market has become more competitive since 2006, with stronger presence of local, Western
1 However, Uruguay and Canada’s exports are rather limited and/or highly specialized in specific products (e.g. Ice wine for
Canada). 2 This designation is without prejudice to positions on status, and is in line with UNSCR 1244 and the ICJ Opinion on the Kosovo
Declaration of Independence. 3 In this respect, the Central European Free Trade Agreement (CEFTA), in force since November 2007, aims to attract investments,
foster intra-regional trade and integrate the region into global trading. In this way it supplements the trade integration initiated by
the SAAs and autonomous trade measures.

STUDY ON THE COMPETITIVENESS OF EUROPEAN WINES 14
European and South American wine brands. Similarly, wine exports from former USSR countries such
as the Ukraine and the Republic of Moldova are only relevant for the Russian wine market.
In the country markets where this is relevant, the analysis also considers domestically produced wines
among the main competitors.
2.3 PRODUCT COVERAGE
The observation of statistical data has shown that the competition arena practically only concerns still wines,
as for other products (sparkling wines and liquor wines) the EU operates in a quasi-monopolistic regime
(over 90% market share) both on domestic markets and on export markets. With regard to these two types of
wine, market competition only involves EU countries.
As the aim of the study is to assess the competitiveness of EU wine products compared to products from
third countries, the study focuses on still wines intended for human consumption.
Furthermore, the analysis takes into account different product types:
Quality: wines with geographical indication (PDO and PGI European wines and similar denominations
of origin that qualify wines from third countries), wines Without Geographical Indication (WGI)
including varietal wines;
Type of packaging at retail: bottled wines and wines in larger containers such as bag-in-box, brick, etc.;
Price: price ranges based on IWSR market data (§2.5.3) and on a survey of online wine retailers (Web
checks - see §2.5.4) and price/quality segments (Entry level, Medium and Top range) used to collect the
informed opinions of key market players interviewed in the case study countries (see §2.5.1).
The issue of prices / price-based segments’ comparability across countries was carefully considered in
the analysis, in order to avoid misinterpretation. In fact, wine purchase prices in different countries (and
therefore the price range within which a particular wine falls) are influenced to varying extents by the
following factors:
- Differences in logistics costs (i.e., transportation, insurance, etc.);
- The different magnitude and methods of calculating taxes: import duties, VAT, magnitude and
system used for excise duties (whether excise duties are applied and if they are calculated ad valorem
or per litre);
- The different magnitude of profit margins to importers, distributors and retailers.
In reason of such differences, the same wine could fall into the Entry level in Germany (where no excise
duty is applied) and into the Premium segments in the United Kingdom (where excise duty is about
2£/0.75l).
Nevertheless, preliminary analysis showed that the comparability problem arises in particular for low
priced wines (ex-work price), while differences between country markets decrease for increasing ex-
work prices.
In the course of the development of the methodological approach and during data collection it was confirmed
that it is of paramount importance to clearly distinguish between the two business areas of bottled wine and
bulk wine, as described in the following section.
2.3.1 Import markets for bottled versus bulk wine
Two distinct international trade markets for wine exist in which different trade partners and market players
are involved and the key factors of competition may significantly differ:
Wine traded already bottled and labelled;
Wine traded in bulk.
In most wine importing countries both markets for imported bottled and bulk wine exist. Bottled wine is
clearly identifiable in terms of its origin, winemaker, brand, etc. whereas bulk wine is a commodity that can
be used in different ways and marketed differently, depending on the import market.

STUDY ON THE COMPETITIVENESS OF EUROPEAN WINES 15
Import of bulk wine has different market implications depending on its destination and use. For example,
wine can be imported in bulk for cost-saving purposes and then labelled by the original producer or by food
retail chains (retailer labels). In other cases though, bulk wine imports are used by local wine makers for
blending with domestic wines. Since the resulting products are labelled and marketed as domestic wines,
such imported wines lose their original name and character. In some country markets, however, both cases
can be found.
For these reasons, it is important for the analysis to distinguish between wines traded in bottles and in bulk.
2.4 SELECTION OF CASE STUDY COUNTRIES
The execution of the present study required the choice of key consumer markets (EU and non-EU) on which
to focus analysis. Besides the five markets which we were explicitely invited to examine (i.e. USA, Russia
and China - including Hong Kong, outside the EU; UK and Germany, within the EU), we have analysed
Denmark and Japan as additional case studies.
Besides the sheer size of each country market in terms of total wine consumption, the choice of case study
markets was based on two specific criteria to assess their relevance as key consumer markets:
Intensity of competition, measured in terms of changes in market share of EU wines on the most
important import markets over the last decade.
Demand trends, measured in terms of percentage change in total wine imports over time to assess
whether consumer demand is on the increase, stable or declining (i.e. to identify markets with growth
potential).
These two criteria were then complemented by other available information, such as the results of the recent
“Evaluation of Common Agricultural Policy measures applied to the wine sector” (2012)4.
The choice of Japan and Denmark was also justified by further considerations developed during data
collection:
The Japanese market presents a somewhat dual structure, as it emerges from review of the literature and
interviews with key market players. On the one hand, this market is sensitive to quality wines for which
image and prestige are very important attributes. Quality wines at the top of the price range are mainly
consumed at restaurants and purchased as gifts. The “gift culture” appears to be quite important in this
country, as the Japanese exchange presents in many occasions. According to interviews, premium and
luxury wines are often used as presents and for this scope French wines are perceived as the most
prestigious, followed by other Old World wines. On the other hand, as wine consumption has become
more widespread across geographical areas and social classes and increased at home in accompaniment
to meals, the market for Entry level and Medium range wines has developed. In these markets (lower
price/quality) NWC wines are very competitive.
Although not a wine producer, Denmark has developed a dynamic wine export business, taking up a
role as an important wine trading centre or simply a transit platform for imported wine, both in bulk and
bottled. The EU holds a dominant share of the Danish market for imported bottled wine, whereas NWC
wines hold a slightly larger share of the bulk import market. Bulk imports comprise wine actually
marketed in bulk and directed to packaging facilities (mostly to be packaged into Bag-in-Box - BIB) and
wine already packaged in Bag-in-Box (therefore, in containers >2lt). The wine bottling industry is well
developed in Denmark (e.g. Globus Wine is one of the largest BIB filling facilities in Northern Europe).
The bottling industry serves both foreign producers selling wine in BIB to supermarket chains, and the
same supermarket chains that import bulk wine directly. The near totality of re-exports of bottled wine
and BIB is directed towards Germany and Scandinavia (within the EU, Sweden and Finland; and
Norway).
A consideration was initially made on whether, depending on market size and structure (i.e. demand more or
less concentrated and more or less homogeneous in different geographical areas), it would be more
4 See Chapter 7.3 of the Final Report of the “Evaluation of CAP measures applied of the wine sector” (COGEA - October 2012).

STUDY ON THE COMPETITIVENESS OF EUROPEAN WINES 16
appropriate to concentrate the analysis on representative regional markets in the largest case study countries
(USA, China and Russia), as undifferentiated analysis over entire countries may be less significant.
Initial analysis of (a) characteristics of different markets at sub-national level and related wine consumption
trends, (b) strategic location of most important import/trading companies and main entry points for imported
wine and (c) identification/first contact with key market agents in important regional markets, whom we later
interviewed (wine importers; distributors; Off-trade; On-trade), led to identify the geographical areas of
interest:
USA - East-coast states: New York, New Jersey, Massachussets, Maryland, Connecticut, Pennsylvania
and Florida; Other areas: states of Illinois, Ohio, Michigan and Texas.
US demand for imported wine is mainly concentrated in the East-coast states and less in the Central and
Mid-west states. Overall, East-coast states from Maine down to Florida account for over 50% of the
total. On the West-coast, California is the largest wine market in absolute terms, with however a smaller
share of imported wine, as consumer preference is rather orientated towards California wines. In all
main US markets, wine consumption is significantly concentrated in the largest metropolitan areas. In
this respect, besides East and West-coasts, wine consumption has reached appreciable levels and could
potentially further develop in Illinois (Chicago) and, among the Sunbelt states, in Texas;
China - Eastern regions of Jiangsu, Shanghai, Zhejiang and Fujian; South-eastern province of
Guangdong; North-eastern provinces of Liaoning, Hebei and Shandong; Beijing and Hong Kong.
China's demand for imported wine is concentrated in regions where per capita income is high and
distribution networks are better developed. In particular, the largest wine markets are found in the
Eastern regions concentrating about 50% of total wine sales, in the South-eastern province of
Guangdong (bordering Hong Kong) and in the North-eastern provinces.
Russia - districts of Moscow and St. Petersburg, exploring also a couple of smaller districts (Rostov,
Nizhny Novgorod, or Yekaterinburg).
Demand for imported wine is very much concentrated in the districts of Moscow and St. Petersburg,
accounting together for approximately 85% of total national wine consumption. Overall growth of wine
consumption together with the development of distribution channels should foster a more homogeneous
geographical distribution of wines, reaching also other smaller urban centres.
Interviews with key economic actors operating in the wine sector were used to collect information about
possible regional market differences (current and prospective) with respect to preferences for different types
of wines of different origin.
However, no significant regional market differences emerged for the US market. It appears from the
interviews that, in terms of wine origin, the range of wines distributed is very similar across the examined
States (i.e. European wines, NWC wines and domestic wines reach pretty much all regional markets), then
there are broad regional differences in preferences for EU wines versus domestic wines (mainly from
California) versus wines of other origin. These broad differences have been reported in the US case study
monograph. What probably changes more significantly is the distribution at State level of different brands
besides those controlled by the “big players” (e.g. Gallo, The Wine Group, Constellation, etc.).
Similarly, interviews in China and Russia did not identify any specific regional market differences. The main
differences concern urban versus rural areas and the largest metropolitan areas versus smaller-size cities and
appear to be overall related to the degree of development of the wine market in these countries and to the
structure of distribution channels/networks for imported wines.
2.5 DATA SOURCES AND LIMITS
This part of the report is dedicated to illustrate the data sources used to collect all quantitative and qualitative
information that constitutes the basis for analysis of the three proposed study Themes. Data were collected
from a variety of sources:
primary data collected through in-depth interviews with key economic actors of wine supply chains in
the seven case study countries;
official statistics (international, EU, national). With respect to trade statistics: Comtrade and Comext;
commercial databases specific for the wine market in the selected case study countries;

STUDY ON THE COMPETITIVENESS OF EUROPEAN WINES 17
on-line wine data (wine types, brands, prices, etc.) collected through Web checks in the seven case study
countries.
published market reports from different sources, commercial and non-commercial: national/international
wine councils and other bodies, national trade offices, market intelligence, etc.;
scientific literature (studies, reports) and policy documents (international, EU, national and regional, if
available);
The following sections describe in further detail these sources and the type of data collected.
2.5.1 In-depth interviews with key economic actors
Primary information from key economic actors operating in the wine market of the case study countries was
collected through in-depth interviews. Interviews have been carried out using guidelines designed to record:
Spontaneous opinions of key economic agents on a range of topics all related to past, current and future
competitiveness of wine products and their suppliers on the examined import markets;
“Quantitative” judgments (e.g. scores, ranking) on the basis of a concise questionnaire concerning 1) the
factors of competitiveness characterising EU and non-EU wines and 2) the factors of competitiveness
characterising wine suppliers, and their order of importance in specific markets/segments.
Furthermore, interviewees were asked to express their opinions and judgments distinguishing between
different market segments. In order to simplify as much as possible the market segmentation, we considered
the following broad three segments:
Entry level (bottom end of the market, low price/quality wines);
Medium range (medium price/quality level);
Top range (top end of the market, luxury wines, high price/quality level).
These broad definitions were given to the interviewees, who were then asked to confirm whether such a
segmentation scheme applies to the market they operate in.
Separate guidelines were designed to collect information about wine imported already packaged and wine
imported in bulk.
The information, views and opinions collected through the in-depth interviews with key economic actors
have been reported in case study monographs and represent key information used for analysis.
2.5.1.1 Key economic actors
Given the focus of the study (i.e. the ability of EU wines to reach consumers in different segments in the key
markets in comparison to wines from third countries, and thereby generate value added for the EU wine
sector), the analysis is centred on the final stages of the supply chain (trade and distribution, both wholesale
and retail). This seems appropriate given that in the wine sector the "global value chain" is more and more a
"marketing driven chain".
Therefore, the data collection focused on the economic actors who have (direct or indirect) relationships with
the end market, whose interrelationships (of interests and behaviours) drive strategic decisions concerning
the products to offer to the consumer, namely EU wines versus NWC wines and wines of other origin.
In each case study country market the interviewed economic agents carry out one or more of the following
activities:
Wine production
Import of packaged wines
Import of bulk wine
Bottling/labelling of imported bulk wine
Wine trade
Wine wholesale distribution
Wine brokerage

STUDY ON THE COMPETITIVENESS OF EUROPEAN WINES 18
Retail sale (food retail chains, specialist wine stores/chains)
On-trade sale (restaurants, wine bars, etc.)
Online sale
A total of 72 interviews were carried out across the seven case study countries (China/Hong Kong, Japan,
Russia, USA, Denmark, Germany and the United Kingdom).
2.5.1.2 Limits of in-depth interviews
Information gathered through interviews suffers from the limitation of representing the opinions of
interviewed individuals. Again in relation to interviews, we encountered difficulties in finding information
about uses and destination of wine imported in bulk. None of the stakeholders (with the exception of Russia
and, partly, Japan) wanted to provide information about this part of the industry. It is clear that parties
involved in import and use of bulk wine in some countries prefer not to make it official that part of the wine
labelled as "Made in X", is actually made from or blended with imported wine of, sometimes, uncertain
quality.
The somewhat incomplete information about the market for imported bulk wine represents a limit for the
analysis.
2.5.2 Official statistical sources
Different statistical sources were used to collect international trade data. Trade statistics from two main
official sources have been used:
COMEXT database (Eurostat) for data on extra- and intra-EU trade of wine products on the basis of the
combined 8-digit HS for code 2204 for the years 2000-2013. In essence, COMEXT data are used to
analyse wine imports and transfers of EU member States, and EU wine exports towards the main third
country markets;
COMTRADE database (UN) for data on international wine trade statistics on the basis of the combined
6-digit HS for code 2204 for the years 2000-2012. This database is used to analyse wine imports into
third country markets by provenance.
National, EU and international statistical sources (i.e. FAO, OIV) have been consulted for data concerning
vineyard areas and wine production in the EU and in NWC, and wine consumption in EU and extra-EU
markets.
2.5.2.1 LImits of statistical data from official statistics
With reference to wine production, the available statistical data do not allow to distinguish the domestic
production of still wines from the total domestic production. Moreover, it is not possible to distinguish the
part of domestic production made from home-grown grapes and that obtained from wine and/or grape must
imported in bulk. Again concerning production data, different sources (national statistics, FAO, OIV, etc.)
provide different data, questioning the reliability of wine production statistics overall.
United Kingdom
With respect to UK wine exports to Hong Kong, the ratio of export values to export volumes (Comext data)
generates abnormal average unit values. The same occurs when using Comtrade data for wine imports from
the UK into Hong Kong. This leads to rule out a statistical error at the source, but it is not possible to
establish with certainty the reasons for such occurrence.
Japan
Comtrade data of wine volumes imported into Japan for 2000 appear to be incorrect (for all wines of
different origin the average price is always $ 2.53/litre for bottled wine and $ 1.03/litre for bulk). Therefore,
we have estimated the volume of imports (according to country of origin) by dividing import values recorded
in 2000 by the average unit value in 2001 (assuming, therefore, that the average CIF price has not changed
between 2000 and 2001).

STUDY ON THE COMPETITIVENESS OF EUROPEAN WINES 19
2.5.3 Market data sources
In addition, statistical analysis is applied at country level to market data from a commercial source that
regularly produces wine industry, trade and consumption information. The source identified as the most
relevant for the aim of the present study is the IWSR – International Wine and Spirit Research.
The Domestic Database for still wines has been acquired from the IWSR for all seven case study countries
and Hong Kong, in addition. The data are based on store-checks and annual interviews with a sample of
experts among importers, distributors, producers and retailers. This database includes the following
information:
Wine consumption data (in volume) for the years 2000 to 2013 subdivided in “local wines” and
“imported wines”. For imported wines, the country of origin is indicated. For all wines the information
included covers Brand name, Brand line, Brand owner, Distributor (the latter however is not available
for every single brand);
Wine price data (in local currency for each country) for the years 1998 to 2013 again subdivided in
“local wines” and “imported wines”. For imported wines, the country of origin is indicated. In addition
to the information above (Brand name, Owner, etc.) the size of the bottle/package is provided. Price data
are collected through store-checks, therefore they do not cover wines sold in the On-trade sector;
Still wine forecasts (volumes) 2013 to 2018.
Market data have been used for analysis of the competitiveness of EU still wines within Theme 1. Wine
forecast data were used in the analysis of Theme 3.
2.5.3.1 Limits of market data
IWSR data on wine consumption are sub-divided into local and imported wines, then imported wine data are
further sub-divided according to country of origin. However, consumption data only includes packaged
wines. Therefore, the data relative to consumption of domestic wine (i.e. “local”) actually includes wine
and/or grape must imported in bulk for blending with wine made from domestic grapes.
Furthermore, IWSR consumption data are limited to volumes, they do not include values. This represents a
limit for the analysis (i.e. competitiveness of EU relative to non-EU wines) that can be carried out based on
these data.
2.5.4 Web-checks of online wine retailers
The survey of the wine offer from the various websites of online wine retailers allows to estimate the current
position of EU wines relative to the competing products in different price segments, in principle correlated to
quality positioning.
We completed 7 Web-checks, one for each case study country. The Web-checks have targeted large national
or international food retail chains as well as specialist online wine retailers with wide international still wine
selection and good geographical coverage of national markets.
The following online wine retailers have been surveyed:
Edeka (Germany);
Tesco (United Kingdom);
Everwines (China);
Salling/Dansk Supermarked (Denmark);
Wine.com (USA);
Enoteca (Japan);
Wine Butik (Russia).
A range of information has been collected through the Web-checks, including all detail provided by the
online retailer:
Type of wine (Red, Rosé, White);
Information about Geographical Indication (PDO, PGI), as provided by the retailer;

STUDY ON THE COMPETITIVENESS OF EUROPEAN WINES 20
Variety (variety indicated on the label);
Informationon on varietal/s, as provided by the online retailer;
Wine region / Area of production, as indicated by the online retailer;
Country of origin (EU and third countries);
Type of packaging (bottles, BIB, etc.);
Size of packaging;
Price per piece;
Brand / Label (name of the wine as indicated by the retailer);
Producer’s name.
It should be noted that the survey includes the information that is explicitly presented by the online retailer
for each product, which is, therefore, considered to be important for the purpose of communication to the
consumer.
Price data have been transformed in order to make them homogeneous across countries. In particular:
Prices expressed in national currency per item (of different size) have been transformed into price per
litre;
Prices per litre in national currencies have been converted into Euro using the official exchange rate at
the time of the Web-check (April 2014).
2.6 METHODOLOGICAL APPROACH AND TOOLS OF ANALYSIS
The aim of this section of the report is to provide the overall methodological approach and the main
analytical tools applied in the different parts of the analysis developed to study Themes 1 and 2.
Specific methods and analytical tools applied to different parts of the analysis are then detailed at the
beginning of the corresponding sections where analysis and results for Theme 1 (Ch.5) and Theme 2 (Ch.6)
are presented. This approach is aimed at making the reading and the understanding of the analysis/results less
cumbersome and more straightforward for the reader.
2.6.1 Methodological approach and tools of analysis for Theme 1
The analytical approach chosen to assess the competitiveness of EU wines and its developments (Theme 1)
entails two main levels of analysis (illustrated in the two following sections):
The first level of analysis aims to assess the global competitive position of EU still wines compared to
non-EU still wines (i.e. main competitors) over time, regardless of the factors determining it;
The second level of analysis aims to explore the environmental factors (and their interactions) that
contribute to influence the behaviour and, therefore, also the competitive position of market players and
the competitiveness of their products on the market.
2.6.1.1 Methodology for the assessment of the global competitive position of EU still wines
At this first level, the analysis centres on the following aspects:
1. Assessment of the global competitiveness of EU wines with respect to international trade:
At world level, based on EU still wine exports in bottles and in bulk of the EU and the EU’s main
competitors on the world market, including wine transfers within the EU;
For the top ten countries main importers of EU still wines (respectively, the ten most important
importers of EU still wine in bottles and the ten most important importers of EU still wine in bulk).
This part of the analysis is based on trade statistics (Comtrade and Comext).
2. Assessment of price competitiveness of EU wines relative to competitors in international trade (CIF or
FOB). The analysis is based on "implicit prices" calculated as ratios between value and volume of

STUDY ON THE COMPETITIVENESS OF EUROPEAN WINES 21
imported (CIF) or exported (FOB) wines (again based on the official trade statistics: Comtrade and
Comext).
3. Assessment of the competitiveness of EU still wines compared to competitors in the context of domestic
consumption, thus taking into account also "locally produced” wines (where applicable). The analysis
was conducted considering packaged wines destined to the final consumer in the seven case study
countries. This part of the analysis is based on IWSR market data.
4. Price/quality competitive positioning of EU wines compared to competitors in the consumer market of
the seven case study countries. This part of the analysis is based on IWSR market data.
5. Assessment of the competitiveness of EU still wines in the online retail channel. This part of the
analysis is based on the data collected through Web-checks of online wine retailers in the case study
markets and focuses on product assortment, price segmentation and other factors, such as Geographical
Indication and mention of grape variety.
The following sub-section provides the rationale for the methodology chosen to assess the global
competitiveness of EU wines with respect to international trade (point 1. above).
2.6.1.1.1 Methodology for the assessment of global competitiveness of EU compared to non-EU wines
The assessment of the global competitiveness of EU wines compared to non-EU wines on the world market
as a whole and in the 10 most important export markets distinguishes between still wines traded already
packaged (package <2lt) and wines traded in bulk (package >2lt). Analysis is based on:
Level and evolution of the value and volume of world exports and imports by the 10 most important
markets5 of EU wines compared to wines from non-EU countries;
Level and evolution of the market shares (in value and volume terms) of European wines compared to
wines from non-EU countries.
The need to use two elements for the analysis (and not only market shares) derives from the fact that
variation in market share is an effective and sufficient indicator only in cases when demand for imported
wines is stable over time. Indeed, in these cases the sale of one additional unit of product by a competitor
must be equal to at least an equivalent loss of sales by the competitors. The main objective is to increase
market share (resulting from erosion or acquisition of market share from competitors) and market
competition becomes more aggressive.
In country markets where demand for imported wines is growing, sales are driven by market growth and all
players are winners. In such market conditions, competitors mainly aim at increasing their sales volumes and
only secondarily at increasing market share (i.e. sales growth is greater than demand growth).
Thus, in expanding markets the variation in market share may not be an effective and / or sufficient indicator
to establish the level of competitiveness of European wines. The graphs in Fig. 1 provide an example to
illustrate this concept.
5 In both cases, the trade flow is from EU and non-EU towards the world market in the first piece of analysis and towards the 10 most
important wine import markets (respectively, for bottled and bulk wine) in the second.

STUDY ON THE COMPETITIVENESS OF EUROPEAN WINES 22
Fig. 1: Evolution of wine sales* and market shares of EU and competing wines in an expanding market
Evolution of wine imports Evolution of import market shares
*In volume or in value
In a growing market, the entry of a new competitor or its progressive growth can lead to an erosion of
European wines’ market share. However, as shown in Fig. 1, if European wine sales increase more than the
sales of competing wines (at the end of the period Δ EU > Δ Others), European wines remain competitive in
spite of the loss of part of their market share. In other words, the market growth is mainly attributable to the
growth of European wine sales, even if their relative market share is lowered. In this case, the strategy of
(European) wine businesses is to "follow" the market trend (i.e. sales growth) rather than pursuing a market
share growth strategy.
By contrast, in the case of country markets where demand for imported wines is decreasing (i.e. all players
are losers), the main objective is to lose less sales compared to competitors (which means, if it occurs, an
increase in market share). However, even if sales of one competitor (e.g. the EU) decrease more than sales of
another competitor, the market share of the former could still grow. Therefore, in the case of declining
markets, the competitiveness of European wines may deteriorate in spite of growth of their market share (see
Fig. 2).
Fig. 2: Evolution of wine sales (volume or value) and market shares of EU and competing wines in a declining market
Evolution of wine imports Evolution of import market shares
The steps of analysis based on the above considerations are illustrated in detail in §5.2.3, right before the
analysis of Theme 1 is applied and the results presented and discussed.
2.6.1.2 Methodology to assess the factors influencing the competitiveness of EU and third-country wines: The Porter’s Diamond approach
At this second level, the analysis aims to explore the context variables (and their interactions) that contribute
to influence the behaviour and, therefore, the competitive position of market players in the various target
markets. These are all variables that restrict or prompt or guide domestic demand and choice of wine by
origin. According to the general theoretical model of competitiveness proposed by Michael Porter (Porter's
Diamond – see also §5.5), here adapted to the specific object of the study, the influencing variables can be
thought of as belonging to the following groups:
0
50
100
150
200
250
TOT
EU
Others
∆ EU = 96.
∆ Oth = 36
∆EU > ∆ Others
0
10
20
30
40
50
60
70
80
90
100
TOT
EU
Others
∆ EU = - 5.5
∆ Oth = 10.9
0
50
100
150
200
250
20
00
20
01
20
02
20
03
20
04
20
05
20
06
20
07
20
08
20
09
20
10
20
11
20
12
TOT
EU
Others
Δ EU = -90
Δ OTH = -30
0.0
10.0
20.0
30.0
40.0
50.0
60.0
70.0
80.0
90.0
100.0
20
00
20
01
20
02
20
03
20
04
20
05
20
06
20
07
20
08
20
09
20
10
20
11
20
12
EU
Others
Δ EU = 8.2%
Δ OTH = - 8.2%

STUDY ON THE COMPETITIVENESS OF EUROPEAN WINES 23
Factor conditions in producer countries in the analysis include the evolution of vineyard areas and wine
production as well as variables related to country-systems propensity to export (through the Index of
Export Propensity) and the intensity with which they trade internationally (through the Index of
Bilateral Wine Trade Intensity);
Demand conditions in consumer countries include analysis of demographic and economic conditions
such as population size and growth rates in the case study country markets and per capita GDP level and
growth rates;
Firm strategies (structure and rivalry) includes variables pertaining to wine firms’ conduct within the
competitive systems they operate in and the influence of their conduct on market structure. The analysis
is based on 2013 IWSR market data and focuses on the levels of concentration and product portfolio
strategies of wine businesses in the country markets of interest;
Related and supporting industries entail the presence or absence of financial conditions or related
industries able to influence firms’ competitiveness. The analysis focuses on private-public funding
available for the financing of promotional activities of EU producers and of its main competitors.
Technology improvements in wine packaging are also examined, in particular the introduction of the
Flexitank for transportation of wine in bulk.
“Government” factors essentially are the central policies of producer and consumer countries. The
analysis considers three aspects that are particularly relevant with regard to wines competitiveness on
the international arena: a) policies of taxation of alcoholic beverages in consumer countries (for still
wines); b) bilateral trade agreements between producing and consuming countries to facilitate market
access; c) institutional strategic policies of producer countries to improve the performance of supply
chains, market access and wine competitiveness.
Chance refers to events, usually beyond the power of firms, that change the political, economic or
climate conditions. The analysis here focuses on the evolution of exchange rates.
2.6.2 Methodological approach and tools of analysis for Theme 2
The focus of Theme 2 is the identification of the key factors of competitiveness for EU wines (relative to the
main competitors) from all competitive factors relating to the various product / market combinations. Indeed,
the goal is to focus the analysis on the essential factors in order to gain in relevance, keeping in mind that
this exercise is subsequently functional to the formulation of hypotheses for the construction of future
scenarios.
This implies the need to reduce the complexity of the system in cases when a large number of factors emerge
from the analysis. From a methodological point of view, this involves implementing a method that allows to
identify the cause-effect relationships among the identified factors of competitiveness, and then to rank in
order of importance the (relatively few) key factors that explain the system effectively.
The analysis was carried out for the case study countries (China, Japan, Russia, USA, Denmark, Germany,
UK), separately for packaged wines and for bulk wines, in two distinct phases:
1- The first phase, based on information collected directly from key market players and from the literature,
aims at identifying the factors of competitiveness and defining their current importance in establishing a
competitive advantage.
2- The second phase, based on “structural analysis”6, aims at identifying direct and indirect cause-effect
relationships among factors identified in the first phase, therefore establishing which are the key factors
able to generate competitive advantage.
Structural analysis was carried out through application of the MicMac method7. The methodological
approach is described in detail in §6.1. For wine in bulk, the extremely limited number of identified
competitive factors prevented the use of this analytical tool.
6 In other words, analysis of the structure of relations among the factors that characterise the system under study. 7 The Micmac Forecasting method (Matrice d’Impacts Croisés-Multiplication Appliquée à un Classement) was created by Michel
Godet.
STUDY ON THE COMPETITIVENESS OF EUROPEAN WINES 24
2.6.3 Methodological approach and tools of analysis for Theme 3
The analytical approach to Theme 3 is essentially qualitative as it aims at formulating a set of hypotheses
about the likely future evolution of the factors influencing the competitiveness of European wines (resulting
from the analysis of Theme 1) and of the key factors of competitiveness (resulting from the analysis of
Theme 2). The formulation of hypotheses relative to future trends and changes is based on:
analysis of the IWSR 2013-2018 market forecast data for still wine in volume in the case study
countries;
informed opinions of key economic players interviewed in the case study countries;
analysis of the available literature.
The last step of the study, i.e. the formulation of prospects to 2025 emerges from critical analysis of the
available information and from logical inferences about related causes and effects. Further detail is provided
in §7.1.

STUDY ON THE COMPETITIVENESS OF EUROPEAN WINES 25
3 THE EU WINE POLICY FRAMEWORK
3.1 EU WINE POLICY 1962-1999
The common market organisation (CMO) for the wine sector was established in 1962. The CMO was based
on instruments aimed at obtaining adequate information about production potential (cadastre, annual
declaration of must and wine produced quantities, forecast balance sheet) as well as on quality policy for
wines produced in specified regions.
Regulation (EC) No 816/1970 completed the 1962 CMO with: price and intervention regime (private
storage, distillation), a regime for trade with third countries (Common Customs Tariff, tax compensation and
export refunds), rules concerning production and control of planting development as well as rules concerning
oenological practices and processes. Alongside, Regulation (EC) No 817/70 laid down specific provisions
for quality wines produced in specified regions (v.q.p.r.d).
The ban on planting new vineyards appeared in 1976 with Regulation (EC) No 1162/76 aimed at adjusting
wine-growing potential to market requirements. This temporary ban was then extended by subsequent
regulations until 2015.
The following CMO Regulation (EC) No 337/1979 and Regulation (EC) No 822/1987 introduced various
amendments without however changing the intervention logic.
3.2 THE 1999 WINE CMO REFORM
In 1999, Regulation (EC) No 1493/1999 introduced major changes by removing the price regime and
simplifying distillation measures. Among the intermediate objectives (recital 7 of Regulation (EC) No
1493/1999) the following may be mentioned:
maintain a better balance between supply and demand on the Community market;
provide producers with the opportunity to exploit expanding markets;
enable the sector to become more competitive;
support the wine market.
To achieve these objectives, the CMO was based on rules concerning production potential, market
mechanisms, oenological practices and processes, designations, presentation and protection of products and
trade with third countries.
In addition to these provisions, the regulation included the establishment of a classification of authorized
wine grape varieties, of a wine inventory and vineyard register.
Production potential
Three measures concerning production potential aimed to achieve a better market equilibrium:
The temporary prohibition of planting of vines until 31 July 2010, unless derogation was granted;
Premium for the permanent abandonment of vine-growing;
Restructuring and conversion of vineyards.
Market mechanisms
The three forms of intervention (aid for private storage, distillation system and aid for specific uses) were
aimed to maintain market equilibrium. Four types of distillation were supported:
Compulsory distillation of by-products of wine-making
Distillation of wine from dual-purpose grapes (wine and table).
Distillation for the production of potable alcohol.
Crisis distillation in case of exceptional market disturbance.

STUDY ON THE COMPETITIVENESS OF EUROPEAN WINES 26
Oenological practices and processes - Description, designation, presentation and protection of certain
products
These measures aimed to protect the health and the interests of consumers; to protect the interests of
producers; to promote the adequate functioning of the internal market and the development of quality
products.
The rules regarding description, designation, presentation and protection of certain products established:
Compulsory particulars and those authorized under certain conditions;
Provisions governing the protection and control of certain terms and the use of geographical indications
and traditional specific terms;
measures governing the labelling of imported products.
Quality wines produced in specified regions
Measures regarding the production and control of quality wines (v.q.p.r.d) aimed to contribute to improving
market conditions and thereby increase market opportunities.
Trade with third countries
The rules governing trade with third countries aimed to stabilise the Community market. It provided for a
system of import duties and export refunds based on the agreements reached in the Uruguay Round
negotiations.
3.3 THE 2008 WINE CMO REFORM
The 2008 reform of the wine CMO is part of the 2003 CAP reform introduced by Regulation (EC) No
1782/2003.
Regulation (EC) No 479/2008 (included in 2009 into the Single CMO Regulation (EC) No 1234/2007)
substantially altered the 1999 wine CMO by establishing a national aid programme, a three-year grubbing-
up scheme, by redesigning the system of designations for quality wines and extending planting rights to
2015/2018. Intervention measures became optional (as integrated into national programmes) or were
suppressed (private storage aid, certain aids for the use of grape must and for distillation, and export
refunds).
Oenological practices, quality policy and trade with third countries were reformed with the aim of
harmonising the existing horizontal regulations, in particular the PDO / PGI system in force since 1992 for
other agricultural and food products (EU quality policy).
Among the objectives of the 2008 wine CMO (Recital 5 of Regulation (EC) No 479/2008) the following
should be mentioned as particularly relevant for the present study:
strengthen the competitiveness of wine producers in the European Union;
establish the reputation of EU quality wines as the best wines in the world;
recover old markets and win new ones within the EU and worldwide.
The reformed wine CMO included four provisions: support measures (national programmes), regulatory
measures, trade with third countries and rules concerning production potential. These are illustrated in the
following sub-sections.
3.3.1 Support measures
Support measures consisted of the aid programmes established by each Member State. The objective of these
measures was to strengthen competitiveness. Member States could choose the measures financed by their aid
programme within 11 possible instruments:
6 new measures:
- Single payment scheme, according to Regulation (EC) No 1782/2003 (art. 9);
- Promotion on third country markets (art.10). The objective was to improve the competitiveness of

STUDY ON THE COMPETITIVENESS OF EUROPEAN WINES 27
European wines (PDO, PGI and varietal wines) on the concerned markets;
- Investment aid (art.15): Material or immaterial investments in processing facilities, wineries and wine
marketing;
- Green harvesting (art.12), with the objective of restoring balance between demand and supply;
- Mutual funds (art.13): The objective was to allow producers to hedge against market fluctuations;
- Crop insurance (art.14): This measure aimed to safeguard farmers' incomes against natural disasters.
2 measures extended from the 1999 CMO:
- Restructuring and conversion of vineyards (art.11), to increase wine competitiveness;
- By-product distillation (art.16).
3 transitional measures were maintained until 31 July 2012 to mitigate the effects of the end of
traditional market measures:
- Potable alcohol distillation (art.17);
- Crisis distillation (art.18);
- Use of concentrated grape must and rectified concentrated must to increase the alcoholic strength of
products (art.19).
Application of the measure for “Promotion on third country markets”
Promotion on third-country markets is aimed at increasing the competitiveness of EU wines on third country markets.
This measure only applies to PDO / PGI wines and to varietal wines (wines with an indication of the grape variety).
Five types of promotional activities can be financed:
- public relations, promotional or advertisement actions, in particular highlighting the advantages of products from the
Union, especially in terms of quality, food safety or environmental friendliness;
- participation at events, fairs or exhibitions of international importance;
- information campaigns, in particular on the Union's systems for designations of origin, geographical indications and
organic production;
- studies of new markets, necessary for the expansion of market outlets;
- studies to evaluate the results of the information and promotion actions.
The support granted by the EU must not exceed 50% of the eligible expenditure, but it may be supplemented by
national support. In such cases, the action must be in line with the rules on State aid. The legislation establishes
eligibility conditions, the main ones can be summarised as the following:
- the products covered by the measure must have export opportunities or market outlets in the targeted third countries
and display high added value;
- the beneficiaries must have enough capacity and resources to face the specific constraints of trade with the third
countries concerned and to ensure that the measure is implemented as effectively as possible;
- the beneficiaries may be private companies as well as professional organisations, producer organisations, inter-branch
organisations or (where a Member State so decides) public bodies;
- preference is given to micro, small and medium-sized enterprises within the meaning of Commission
Recommendation 2003/361/EC.
3.3.2 Regulatory measures
Regulatory measures consist of five tools: General rules; Oenological practices and restrictions; Designations
of origin, geographical indications and traditional terms; Labelling and presentation; Producer and inter-
branch organisations.
Concerning designations of origin, geographical indications and traditional terms, the objective of the 2008
reform was to bring together v.q.p.r.d. labelled wines under the PDO label and table wines with geographical
indication (GI) under the PGI label.
Similarly to trademarks, Geographical Indications (GIs) are intellectual property instruments. They represent
an income creation opportunity depending on price formation systems in markets characterised by
monopolistic competition. Control over these labels allows to develop or exploit competitive advantage to be
achieved through product differentiation.

STUDY ON THE COMPETITIVENESS OF EUROPEAN WINES 28
Traditional terms provide the consumer with information on the characteristics and quality of wines
complementing the information provided by the designation of origin and geographical indication. These
may include methods of production, aging, quality, colour, place or a particular event linked to the history of
the product.
Regarding labelling, the 2008 reform sought a simplification and a single framework for all types of wines.
Wines without GI can bear the mention of grape variety and vintage year, thus Reg. (EC) No 479/2008
created the category of "varietal wines".
3.3.3 Trade with third countries
The 2008 wine reform removed export refunds provided for in the framework of Regulation (EC)
1493/1999. The other measures were maintained.
In the absence of any different provisions (such as additional duties under safeguard measures), the rates of
duty in the Common Customs Tariff are applied to wine products and the application of the Common
Customs Tariff depends on their entry price. Moreover, the wine CMO foresees the option to require import
and export licenses, safeguard measures, the possibility of suspending inward and outward processing
arrangements, tariff quotas and additional import duties for certain products.
The Common Customs Tariff is 32 €/hl for wines under codes NC 2204 10 (sparkling wine) and 2204 21
(other wine and grape must whose fermentation has been prevented or arrested by the addition of alcohol).
Bilateral agreements were signed by the EU with trade partners on the mutual recognition of protected
designations of origin (GIs) and sometimes of authorized oenological practices and processes (Australia in
1994 and renewed in 2008; South Africa in 2002; Chile in 2002; Swiss Confederation in 2002; USA in 2006
updated in 2011; Mexico in 1997; Singapore in 2012).
In addition, interim agreements on trade and accompanying measures have been established between the EU
and Serbia (2010), Bosnia and Herzegovina (2008), the Republic of Montenegro (2007), Albania (2006), the
former Yugoslav Republic of Macedonia (2001). These agreements establish preferential zero-duty tariff
within quotas and the rules of reciprocal protection of designations of origin:
Zero-duty concessions for imports into the Community: 16,000 hl respectively for Bosnia-Herzegovina
and Montenegro, 7,000 hl for Albania, 300,000 hl for the former Yugoslav Republic of Macedonia,
63,000 hl for Serbia (53,000 hl quality sparkling wines and other wines <2lt; 10,000 hl wines >2lt).
The EU benefits from duty-free quotas for up to 6,000 hl imports into Bosnia and Herzegovina, 1,000 hl
into the Republic of Montenegro, 10,000 hl into Albania, 3,000 hl into the former Yugoslav Republic of
Macedonia (increased by 300 hl per year) and 25,000 hl into Serbia.
Finally, Regulation (EC) No 2793/1999 opened a duty-free quota of 335,000 hl of still wine and 45,000 hl of
sparkling wine in favour of South Africa.
Under a Free Trade Agreement with the EU, entered into force in 2003, Chile’s tariffs on most EU wines
were phased out over a 5 year period, as well as Chile’s use of protected EU geographical terms such as
Champagne, Burgundy and Bordeaux.
3.3.4 Production potential
The rules regarding production potential were maintained on a transitional basis in order to limit the potential
effects of their removal. In particular:
The transitional planting right regime established the extension of planting rights until 31st December
2015. Member States may decide to maintain the prohibition on their territory or parts of their territory
until 31st December 2018;
A grubbing-up scheme was introduced until the end of the 2010/2011 campaign.

STUDY ON THE COMPETITIVENESS OF EUROPEAN WINES 29
3.4 HORIZONTAL MEASURES FOR THE PROVISION OF INFORMATION AND PROMOTION ON THE INTERNAL MARKET AND IN THIRD COUNTRIES
In addition to the measure for “Promotion on third country markets” introduced with the 2008 wine CMO
reform, Council Regulation (EC) No 3/2008 establishes the rules for the provision of information and the
implementation of institutional promotion actions for agricultural products on the internal market and in third
countries. This horizontal regulation concerns several sectors, including the wine sector.
Compared to the CMO measure for “Promotion on third country markets” that allows to promote (under
certain conditions) individual or collective wine brands, Reg. (EC) No 3/2008 only allows collective
information actions to consumers concerning product quality and variety. Given the institutional nature of
such promotion policy, actions implemented within the framework of Reg. (EC) No 3/2008 can be used in a
complementary way to promotion / advertising directly implemented by enterprises8.
On November 21st, 2013 the Commission presented the legislative proposal for a better targeted information
and promotion policy aimed at developing and opening up new markets for agricultural products within the
EU and in third countries, and to increase consumer awareness of products quality (COM(2013) 812 final).
The new regulation will enter into force on December 1st, 2015. Compared to current policy, the proposal
entails a gradual but significant increase of the budget allocated to information provision and promotion
measures for agricultural products (from €61.5 million in the 2013 budget to €200 million in 2020).
As the Union's promotion measures relating to wine are well covered by the aid programmes available to the
wine sector under the CAP, the eligibility of wine under the new horizontal promotion policy is proposed
only for wine when associated with another agricultural or food product. With regard to both spirits and
wine, measures targeting the internal market shall be limited to informing consumers of the European quality
schemes relating to geographical indications.
3.5 THE CAP REFORM 2014-2020: WINE PROVISIONS WITHIN THE CMO
The December 2013 reform of the wine provisions within the CMO is part of the wider reform of the CAP
for the period 2014-2020. The new norms are contained in Regulation EC No1308/2013 of the European
Parliament and the Council establishing a common organisation of the markets in agricultural products and
repealing Regulation (EC) No 1234/2007.
The regulatory framework of the 2008 reform is maintained, but some substantial changes were introduced
for wine relating to support measures and production potential. In addition, some clarifications were included
for regulatory measures concerning designations of origin and geographical indications.
3.5.1 Support measures
Eight support measures for financing (art.39-54) remain, due to the abolition of the single payment scheme9
and the introduction of the new measure “innovation in the wine sector”. In addition, some modifications or
extensions were introduced for measures already in place. Briefly:
The measure for Promotion (art.45) is extended to information and promotional activities within the
Member States. However, in contrast with the activities allowed for promotion on third country markets,
the measure aims at "informing consumers about the responsible consumption of wine and about the
Union systems covering designations of origin and geographical indications”10
;
The measure Restructuring and conversion of vineyards (Art.46 ) is amended in its objectives through
the introduction of “improvements to vineyard management techniques, in particular the introduction of
8 According to analysis carried out within the Evaluation of Common Agricultural Policy measures applied to the wine sector
(2012), expenditure for promotion / information for the wine sector within the framework of Reg. (EC) No 3/2008 has been very
limited.. 9 The 2014-2020 CAP reform provides for a system of direct payments to replace, from 1st January 2015, the single farm payment. 10 In essence, this implies a clear differentiation in the terms of intervention in relation to the target market. Therefore, the effects of
the extension of the Promotion measure on the competitiveness of European wines on the EU market will depend on the types of
actions that it will be possible to accomplish within the EU, according to what will be established by the corresponding regulation
for the implementation of the reform.

STUDY ON THE COMPETITIVENESS OF EUROPEAN WINES 30
advanced systems of sustainable production”. The change may therefore entail the provision of strategic
support to increasing wine competitiveness, by focusing on the factors that determine purchase
decisions of consumers who are particularly sensitive to the essential characteristics of the product,
production processes and their mention on the label;
The introduction of a new “Innovation in the wine sector” measure (art.51): “Support may be granted
for tangible or intangible investments aimed at the development of new products, processes and
technologies concerning the products referred to in Part II of Annex VII. The support shall be intended
to increase the marketability and competitiveness of Union grapevine products and may include an
element of knowledge transfer”.
3.5.2 Production potential
The total ban on the planting of new vineyards is abolished: the transitional planting rights will be replaced,
from 2016 to 2030, by a new system of authorizations for vine planting (Articles 61-70), for which “Member
States shall make available each year authorisations for new plantings corresponding to 1% of the total area
actually planted with vines in their territory, as measured on 31 July of the previous year”.
Planting rights granted to producers in accordance with Regulation (EC) No 1234/2007 before 31 December
2015, which have not been used by those producers and are still valid by that date, may be converted into
authorisations as from 1 January 2016. Such conversion shall take place upon a request to be submitted by
those producers before 31 December 2015. Member States may decide to allow producers to submit requests
to convert rights into authorisations until 31 December 2020.
Thus, the essential elements of change introduced by Reg. (EC) No 1308/2013 can be summarized as:
The principle that the European vineyard cannot grow in an uncontrolled manner is confirmed;
The reform introduces the possibility of giving flexibility to the production potential, in order to
facilitate the adjustment of supply to market trends;
Planting rights are abolished, which represented personal transferable securities against payment. As a
replacement, personal authorizations are granted free of charge, which are no longer transferable to the
market.
3.5.3 Regulatory measures
With regard to designations of origin and geographical indications, art. 93 introduced two clarifications to
the completion of the corresponding article 118b in Reg. (EC) 1234/2007, specifically:
For PDO, the requirement that "the production must take place in the geographical area” and “shall
cover all the operations involved, from the harvesting of the grapes to the completion of the wine-
making processes, with the exception of any post-production processes” means that post-production
activities such as, for example, bottling, can be done outside of that geographical area.
For PGI, “the maximum 15% share of grapes which may originate outside the demarcated area shall
originate from the Member State or third country in which the demarcated area is situated”.

STUDY ON THE COMPETITIVENESS OF EUROPEAN WINES 31
4 WINE POLICIES OF EU COMPETITORS
The purpose of this section is to give account of public policies developed in NWC in support of domestic
wine and, in particular, policy measures aimed at facilitating or directly supporting trade towards export
markets. It is assumed that such policies, similarly to EU wine policy measures, have an impact on the
competitiveness of individual NWC wine products on international markets. For this purpose, the main wine
policy interventions in USA (California), Argentina, Chile, Australia, New Zealand and South Africa are
illustrated in the following sections.
Detailed data regarding support to promotional activities in the EU and non-EU competitors are directly
illustrated in the analysis of Theme 1.
4.1 USA: PUBLIC INTERVENTION IN WINE EXPORTS AND PROMOTION
4.1.1 California Wine Export Program
In 1984, the US Congress passed the Wine Equity and Export Act in order to reduce and suppress barriers to
trade in wine “on a basis which assures substantially equivalent competitive opportunities for all wine
moving to international trade”. A few months later, the Wine Institute (California) established the California
Wine Export Program, aimed at protecting the interests of the industry in international trade and participation
in international trade fairs to expand market opportunities for California wines.
The Wine Institute represents about 1,000 wineries and affiliated businesses in California. Members of the
Institute account to 95% of Californian wine production and include some of the major wineries. The
Institute counts an office in Canada and a network of 16 representatives managing programs in 25 countries.
The purpose of the representatives is to assist domestic wineries to promote their wines in foreign countries
and to provide critical information about target markets.
The Wine Institute is responsible for administrating the USDA’s Market Access Program (MAP) for
Californian wine exports. The MAP is the largest market development program of the USDA’s Foreign
Agricultural Service. According to the USDA, as one of the main beneficiaries of the Market Access
Program, the Wine Institute received $US 49,423,105 over the last seventeen years (1996-2012). Among the
institutional arrangements, the Wine Institute cooperates closely with the office of the US Trade
Representative and with other governmental agencies (USDA, TTB, etc.) to suppress trade barriers and to
negotiate free trade agreements (FTA).
In 2010, the US President announced a National Export Initiative in order to renew and revitalize US
exports. This initiative involves export promotion, increasing the availability of export financing, and finding
new opportunities for US wine companies.
4.1.2 The US Import Duty and Excise Tax Drawback Scheme and its implications
The “drawback” scheme allows for refunds, total or partial, of paid duties and taxes when an imported good
is re-exported. The scheme dates back to 1789, but it was only applied to wine (non-sparkling wine of 14%
alcohol or less) about a decade ago. The rationale of the program is to stimulate trade or manufacturing, thus
encouraging domestic value added. It allows American companies to compete in foreign markets without the
handicap of including taxes and duties in the costs.
The scheme allows for a refund up to 99% on duties and excise taxes paid on imported goods, including
wine. The main purpose of this program is to facilitate imports of products that later will be re-exported
(Sumner et al., 2011, 2012). “Interchangeable” wines (i.e. same colour and within 50% of the import price)
must be exported under the same conditions as they were imported within a period of three years11
.
Research by Sumner et al. (2012) indicates that for bottled wines, the drawback is usually worth less than
10% of the import value for bottled wine, whereas it is often close to 50% of the import value for bulk wine.
Thus, the scheme has little interest for bottled imports, but it can be of great interest for bulk wine
11 Wine exported to Mexico or Canada is not eligible as a match for imports in applying for drawback of paid duties and excise tax.
STUDY ON THE COMPETITIVENESS OF EUROPEAN WINES 32
importers12
, who may benefit from a significant net price advantage with respect to competitors. As reported
by Sumner et al. (2012), drawbacks on bulk wine have increased from 13 million litres to 121 million litres
between 2005 and 2010 (in this latter year, drawbacks were claimed on about two-thirds of the total import
volume of wine in bulk). Findings also show that when exports considerably exceed imports, the drawback
scheme is analogous to an import subsidy. Wines imported into the US through the free trade agreements
with Australia and Chile are of particular interest for this program, as the worth of the drawback increases
with reduced import tariffs.
Reasearch results also demonstrate that when imports and exports are in balance the program stimulates both
imports and exports. Furthermore, the drawback scheme allows countering the impact of the low American
dollar exchange rate value on demand for foreign bulk wine (Rabobank, 2012).
Wineries with significant export volumes can receive a rebate on the cost of imported bulk wines that
maintains the attractiveness as a source of supply. Further, firms producing and trading wines find this
program easy to implement (Sumner et al., 2011).
4.2 CHILE: PUBLIC INTERVENTION IN WINE EXPORTS AND PROMOTION
4.2.1 The Chilean Wine Cluster: An Institutional Arrangement
The Chilean wine industry is organized as a ‘cluster’. Clusters are “geographic concentrations of
interconnected companies and institutions in a particular field” (Porter, 1998, p.78) and are based on trust,
the leadership of the main (wine) firms, the ability to solve collective action problems, and the availability of
efficient intermediaries (e.g. grape and wine brokers, distributors, etc.). The Chilean cluster is based on
vertical and horizontal relationships and complementarities between buyers, suppliers and other stakeholders
aiming at the long-term survival and development of the industry.
In the case of the Chilean wine industry, the leading firms are joint members of a national association of
wine producers accounting for over 95% of Chilean wine production. The industry is highly concentrated,
with the top four wineries - Concha y Toro, Santa Rita, San Pedro and Santa Carolina - accounting for over
84% of wine sales in the domestic market. The industry is organized as a public-private partnership with the
major public agencies providing support to the wine cluster either at regional, national or international level.
Wines of Chile (WoC) is an industry body in charge of promotion activities. WoC established a strategic
plan for the industry – Strategic Plan 2020 – with the goal to achieve $US 3 billion dollars in export sales by
the year 2020, i.e. corresponding to an average annual growth of about +9.9%.
The economic agency Corfo provides financing for product, process, and organization innovation in the
different areas of a cluster. This agency has representative offices in the Chilean regions but also a dedicated
branch to attract foreign investors (nurseries, cellars, wineries, etc.) to invest in different areas of the
industry, particularly where the industry is less competitive.
At a broader level, Prochile is the government’s promotion agency with 15 regional offices and
representatives in over 55 foreign locations. The main activities of Prochile involve the expansion of Chilean
export basis by engaging new companies in export activities. It also provides support for companies facing
competitiveness problems.
Further, the development of Chilean exports at the international level is ensured through reduction or
elimination of trade barriers. Over the years, the Chilean government signed many bilateral and multilateral
agreements, including a free-trade agreement with the European Union.
4.3 ARGENTINA: PUBLIC INTERVENTION IN WINE EXPORTS AND PROMOTION
Argentina has a long tradition as a wine producer and exporter. Intervention of Argentinian public authorities
in vine and wine policies operates at different levels, as described in the following paragraphs.
12 Also due to the fact that to be cost-ecffective the drawback claim should be made for relatively large volumes, which are more
likely for wine traded in bulk than in bottles. Furthermore, importers of bottled wine may not have interest in re-exporting, nor the
connections to export markets.

STUDY ON THE COMPETITIVENESS OF EUROPEAN WINES 33
4.3.1 Regulation of the wine market through concentrated grape must: the Mendoza-San Juan Agreement
Argentina is one of the world’s most important grape must producers and exporters. In 1994, the regional
governments of Mendoza and San Juan established the “Mendoza-San Juan Agreement” which included the
two main wine producing provinces. The agreement’s main goal was to foster the diversification of the
national grape and wine industry, either in terms of products (basic wines, quality wines, musts) and markets
(domestic and international). The agreement uses grape must as a way to achieve a balance in wine stocks
(i.e. avoid surpluses) and to promote wine exports.
At the same time, the Mendoza law (law 616/94) established a regional fund – Fondo Vitivinicola Mendoza
– to promote the wine industry and exports. The Fondo Vitivinicola Mendoza is a public-private organisation
financed through a mandatory levy of approximately 0.01 $/kg of processed grapes, starting from the 1995
harvest. However, for that year, the law exempted the companies who processed at least 20% of their total
grapes in must. Each year the percentage of grapes processed into must is adjusted and decided through a
common agreement between Mendoza and San Juan governments. Thus, the regional governments
introduced a regulatory system to balance prices in the wine market and to diversify grape processing. This
means that the Fondo plays a key role in the regulation of wine prices in the market. The funds collected
through the mandatory levy are used to promote exports of wines, musts, fresh grapes and consumption of
wine-related products.
This agreement considerably encouraged grape must production, mainly targeted to export markets
(approximately 80% of Argentinian grape must is exported). This policy measure benefitted from the price
increase on the international grape must market. In 2012, the Rioja government joined this agreement
looking to diversify regional grape production.
One of the main consequences of this new regulatory system is the provision of measures to avoid generating
“wine lakes”, impacting particularly the low-end of the wine quality range.
4.3.2 A public-private partnership to establish a strategic plan for the wine industry
A second area of public intervention is the joint participation in a strategic plan for the Argentinian wine
industry. In 2003, the Corporacion Vitivinicola Argentina was established to manage and coordinate the
implementation of the Strategic Plan for the Wine Industry to 2020 (PEVI 2020). The plan includes all wine
supply chain stakeholders, regional and national governments, and R&D institutes.
The main goal of the strategic plan is to position the Argentinian wine industry at the forefront of the
international wine market by 2020. More precisely, it seeks to achieve total wine sales of approximately $US
2 billion, to reach 10% of world wine exports and to increase consumer awareness of Argentinean wine. The
overall system is financed based on a mandatory levy applied to all members of the National Institute of
Viticulture (INV). The levy is calculated on the basis of processed wine or must volume (litres).
The plan includes three main strategic goals:
1) Position Argentinian wines in export markets, particularly in the Northern Hemisphere. This goal is
implemented through the Wines of Argentina body that is responsible for communication actions and
generic promotion in different locations across the world. These activities are financed both by members
(wineries) and public organisations in charge of promotion. The annual budget of Wines of Argentina is
estimated at $US 4 million (Gennari et al., 2010);
2) Expand the presence of Argentinian wines in Latin American markets and boost sales on the domestic
wine market;
3) Provide support to small and medium producers to integrate them in the wine chain. The aim is to
upgrade organisational, technological and production processes through investments in machinery,
inputs and technical assistance. Within this plan, an agreement with the InterAmerican Development
Bank was established to finance the integration of small and medium wine grapes producers. The bank
provided $US 50 million to support the project (Gennari et al., 2010).

STUDY ON THE COMPETITIVENESS OF EUROPEAN WINES 34
4.4 AUSTRALIA: PUBLIC INTERVENTION IN WINE EXPORTS AND PROMOTION
The Australian Wine Export Council and the Grape and Wine Research and Development Corporation
(GWRDC) were established in 1991 in support to the wine industry expansion at that time. Through the
Federal Department of Agriculture, Fisheries & Forestry (DAFF), the Australian government, collects
national grape and wine levies that it distributes to the GWRDC for R&D and to the Wine Australia
Corporation for promotion. The DAFF collects three types of levies: a) A wine grapes levy from the wineries
(AUD 5–9.20/tonne); b) a grape research levy charged to all producers; and c) a wine export charge equal to
0.2% of wine export value (reduced rate for FOB sales over AUD 20m). The latter is entirely allocated to
Wine Australia Corporation to promote Australian wines internationally.
Wine Australia Corporation, formerly Australian Wine and Brandy Corporation (AWBC) (1980), is the
government authority in charge of ensuring law compliance (i.e. controlling exports of Australian wine,
auditing both wine producers and exporters), and promoting Australian wine globally. The agency is
responsible for marketing, market development and for information and regulatory issues. Its leading role
includes quality and integrity (export licenses and permits on the basis of inspections); knowledge and
information services, and market development (international visits program, generic promotion of Australian
wine, country specific market programs, Wine Australia Export Partnership, etc.). The institution is financed
by a statutory levy and charges fees for the services provided. Wine Australia also cooperates with other
partners including Tourism Australia and Austrade for implementing programs to raise awareness of wine
quality and diversity.
At the international level, the Australian government works with the Australian Trade Commission
(Austrade) to improve market access and trade conditions for Australian wine exporters. In December 2008,
the Australian government established an agreement with the European Union on wine trade regarding
recognition of oenological practices, labeling requirements and protection of GIs. The agreement entered into
force on 1st September 2010.
Austrade's Export Market Development Grants (EMDG) scheme supports a wide range of Australian
industry sectors including the wine sector. The scheme aims at encouraging small and medium sized
Australian businesses to develop export markets through funding of up to 50% of eligible export promotion
expenses (for the year 2013/2014 this is for expenses above AUD 5,000 provided that the total expenses are
at least AUD15,000). In addition to the export scheme, the Australian government provides a number of
grants to growers and wine makers to help maintain a competitive edge in the expanding market.
Some governments in the main producing regions (Barossa Valley, Riverina/Hunter Valley in New South
Wales) established partnerships with the industry in order the reinforce the competitiveness of the wine
industry in the domestic and international markets. For example, recently the South Australian Government
established a partnership with the South Australian Wine Industry for the period 2010-2015 to strengthen
South Australian wines’ market position. The partnership entails continuous work and coordination with
Wine Australia to promote the region’s wines.
4.4.1 Wine Australia: “Directions to 2025”
In recognition that the factors driving expansion of Australian wine sales on foreign markets in the 1980s and
1990s (mostly UK, US and Canada) were no longer successful, since the mid 1990s the governmental
agency Wine Australia has been working consistently towards the identification of new sustainable market
opportunities through assessment of the wine industry performance on export markets (and on the domestic
market) and through market intelligence.
“Strategy 2025” published in 1996 and the following “Directions to 2025” published in 2007 are Australia’s
blueprints for improving the competitiveness of Australian wine on international markets in terms of sales
growth to ensure adequate sustainable returns to grape-growers and wine-makers. “Directions to 2025”
focuses in particular on developing strategies to upgrade Australian wines/brands from lower to higher
price/quality segments on international markets through re-positioning “by raising awareness and expectation
of an Australian wine story founded on an international reputation for regionally distinct and fine wine
production.” “Directions to 2025” also refocuses efforts on the domestic market “to encourage more
Australians to drink better wine more frequently while still observing sensible and moderate consumption
patterns”.

STUDY ON THE COMPETITIVENESS OF EUROPEAN WINES 35
4.5 NEW ZEALAND: PUBLIC INTERVENTION IN WINE EXPORTS AND PROMOTION
The success of New Zealand on the international wine market is relatively recent. The wine industry has
considerably developed over the last few years with a strong expansion of vine plantings and exports.
Exports were negligible until the mid-1990s and in 1998 they accounted for approximately 40% of wine
consumption in the country. In 2004, for the first time the industry exported more wine than it imported.
The need for coordination and planning in the industry gave rise to the Wine Institute of New Zealand in
1976. The role of the Wine Institute, a self-regulated body, is to promote and represent the national and
international interests of the wine industry. In 1976, the government established a funding sheme for The
Wine Institute through the Wine Makers Levy Act, which set a statutory basis for collection of levies from
the wine industry. The purpose of the funding was to support the Institute to promote (export, trade fairs,
etc.), develop and improve grape growing and the winemaking industry. Every winemaker is required to pay
a membership fee as well as an annual levy indexed to the quantity of wine sold each year.
A second important national organization in the industry is the Grape Growers Council (GGC), established
in 1968. The GGC is governed on a regional basis and not on an output basis like The Wine Institute. The
organization is funded through a compulsory levy based on grape sales (Commodity Levies Act, 1990). In
March 2002, The Wine Institute jointly with the Grape Growers Council created a unified organisation –
New Zealand Winegrowers (NZW) - to address the collective issues facing the wine industry at the national
and international level. The organisation is funded by contributions from both institutions. Currently, NZW
ensures the management, protection and generic promotion of the ‘New Zealand Wine’ brand. NZW is
funded mainly through collection of compulsory levies under the Commodities Levy Act. The Act constrains
the activities that may be funded by the levy – a key prohibition is on commercial activities (PwC, 2011).
4.5.1 International Wine Promotion
Together with the US, New Zealand is one of the NWC investing the most in collective promotion of its
wines on international markets (i.e. in € per case, see also §5.5.4). According to industry sources,
expenditure in collective promotion did not vary considerably over the last few years. Differently from most
European countries, collective promotion of New Zealand wines is undertaken at the national level and not at
the regional level.
According to Brodie et al. (2008), positioning “under the generic ‘New Zealand Wine’ brand has allowed
New Zealand wines to achieve average price premiums of 10-20%” in international markets when compared
to other international competitors “and even higher (as much as 48% above the industry average) in the UK”.
Activities have focused on public relations, promotion and fostering relationships with trade representatives,
media, and consumers. NZW concentrates its international market development efforts on China, North
America and some countries in Continental Europe. In 2007, NZW re-launched a new generic branding
strategy – “New Zealand Wines: Pure Discovery” - focusing on the commitment to quality and excitement
found in New Zealand wines and promoting as well the new industry agenda towards innovation and
diversification (Brodie et al., 2008).
To sustain export expansion, the Wine Institute has undertaken coordination activities of “generic export
promotions”. Another important issue on the agenda of the Wine Institute is the introduction of more
rigorous production and labelling standards for local and imported products, and related enforcement
procedures.
4.5.2 Suppressing barriers to international wine trade
Another area of public intervention is the reduction of tariff and non-tariff barriers to international wine trade
and improving access to foreign markets. To this extent, New Zealand Trade and Enterprise, the economic
development and trade promotion agency, has recently signed free trade agreements (FTAs) with China
(1998) and Taiwan (2013). The FTA with Australia also plays an important role in fostering wine exports
between the two countries. Under this FTA, any product containing more than 50 percent Australian content
is eligible to enter New Zealand duty free (Kenny, 2009, p. 165).
New Zealand Winegrowers also partnered with New Zealand Trade and Enterprise “to build and launch the
New Zealand Wine brand in development markets” (NZWG, 2012). Both institutions “are in the process of

STUDY ON THE COMPETITIVENESS OF EUROPEAN WINES 36
developing and delivering an integrated marketing and communications program in some of the major
growth markets – notably China, Germany, Netherlands, and Sweden” (NZWG, 2012).
4.6 SOUTH AFRICA: PUBLIC INTERVENTION IN WINE EXPORTS AND PROMOTION
The South African wine industry has faced considerable changes over the last few years going from
deregulation in the 1990s to integration in international value chains.
The Wine & Spirits Board is a statutory body responsible to administer the Wine of Origin Scheme (1973)
and for control functions regarding cultivars, vintages, Estate Brandy, and Integrated Production of Wine
Schemes (IPW). The Board is appointed by the Minister of Agriculture and funded by the industry.
In 1999, the South African Wine Industry Trust (SAWIT) was established to promote the transformation of
the South African wine industry and to boost wine exports. In order to fulfill its mission, SAWIT established
the following three bodies: BUSCO (wine industry Business Support Company), DEVCO (wine industry
Development Support Company focused on social transformation) and WIECO (Wine Education Fund).
The main purpose of BUSCO is to transform the South African wine industry from a production-driven to a
market-driven industry. BUSCO pursues four main objectives: development of capabilities in research and
development (R&D) and technological transfer; support to generic export promotion; be an active
stakeholder in the liquor industry task group; management of voluntary surplus removal.
In 1999, WineTech developed “Vision 2020”, an essential strategic plan for the wine industry attempting to
legitimize and explain how to build an innovative and market-driven industry.
Wine industry statutory measures comply with the terms of the Marketing of Agricultural Products Act
(1996). SAWIT, WineTech, and WoSA are responsible for the implementation of the statutory measures.
The Marketing Agricultural Products Act stipulates that a statutory levy may not exceed 5 percent of the
price realized for a specific agricultural product at the first point of sale. In April 2013, the proposed
statutory levies ranged between 0.87% for grapes and 3.36% for bulk wine. Generally, measures are
implemented for a four-year term. Promotion on export markets absorbes the largest share of funds from
levies (in 2013, 38m Rands – about 51% of total levies).
4.6.1 The promotion of South African wines and reduction of trade barriers
Wines of South Africa (WoSA) is a non-profit non-governmental agency. The agency was established in
1999 and is responsible for generic marketing, contributing to the development of ‘Brand South Africa’. It
represents more than 500 South African wine exporters and promotes wines in the domestic and international
markets as well as wine tourism. The agency is recognised by the South African government as Export
Council and as such it participates in the dialogue between the wine industry and the government. WoSA is
funded through a per litre levy on exported wine.
The Department of Trade and Industry is responsible for the establishment of relevant free trade agreements
with key partners in order to improve trade and investment conditions. According to industry sources, the
Department spends approximately 1 million Rands per year for the development of the wine industry. In
2002, the EU and South Africa signed an “Agreement on wines and spirits”, as part of a broader “Trade,
Development and Cooperation Agreement”, under which the EU provided a duty-free quota for imports of
South African wine that increases by 5% each year from 2002 until 2011.
Recently, the South African government opposed the increasing claims of international bulk wine buyers,
asking South African wine exporters to shift their exports from packaged to bulk wines. The government
claims that this strategy would lead to considerable job losses in the industry (domestic bottlers, glass
makers, etc.) and could eventually damage the country’s image and ‘Brand South Africa’. According to the
estimates of WoSA, for every 100 000 hl shifted from packaged to bulk wine exports the industry would lose
107 jobs (WoSA, 2010). However, in 2012 South African exports of still wines in bulk accounted for 63% of
total still wine exports (against 41% in 2010) (OIV, 2013).

STUDY ON THE COMPETITIVENESS OF EUROPEAN WINES 37
5 THEME 1 – DEVELOPMENT OF THE COMPETITIVENESS OF EU WINES
5.1 THE LEVELS OF ANALYSIS
The analysis of the competitiveness of EU wines was conducted on two levels:
1. The first level aims to assess the overall competitive position of EU still wines compared to still wines of
competitors (non-EU countries) over time, regardless of the factors determining it. In this context, a first
examined aspect concerns the competitiveness with respect to international trade. The analysis aims at
evaluating the competitiveness of EU wines relative to demand for imported wine in the different country
markets, regardless of which use is made of it and its destination (e.g. satisfaction of domestic demand,
industrial blending / bottling and subsequent re-export, etc.)
Therefore, this first level of analysis does not take into account the role played by “local” wine in the
considered country markets, which is made either from locally grown grapes, or from wine imported in
bulk and/or grape must and then "nationalised", or through a mix of the two.
This analysis was carried out distinguishing between two business areas:
wine imported (exported) in containers <2lt already branded, destined to the consumer market (on-
trade, off-trade and online channels);
wine imported (exported) in bulk (containers >2lt), mostly destined (with some exceptions13
) to the
intermediate market (blenders, bottlers). Bulk wine imports have different uses/destinations,
depending on the market:
- wine shipped from the place of production to the place of consumption to be bottled and labeled
with the producer's name/brand (for example, in the UK);
- wine shipped from the place of production to the place of consumption to be bottled and labeled
with the name of the retailer (for example, in Germany and Denmark);
- wine shipped from the place of production to be blended with domestic wine and then sold to the
consumer market of the same country, under the brand of the local producer (for example, this
occurs in Russia, China and Japan);
- a mix of the first two cases (i.e. UK) or of all three cases above (i.e. USA).
A further aspect of analysis at this first level concerns the competitiveness of EU wine compared to wines
of competitors in the context of domestic consumption. The analysis was conducted considering wines
packaged for the final consumer (on-trade and off-trade) in the case study countries14
. Thus, this piece of
analysis aims at evaluating the competitiveness of EU wine at the level of domestic final demand of the
considered countries, taking into account also "locally produced” wines (where applicable). In this case,
the analysis concerns domestic sales of bottled wines that bear a label indicating the origin. This includes
wines imported in bulk, blended/bottled locally and marketed with an indication of the origin, but it
excludes imported bulk wine that is bottled without specifying the origin.
This analysis presents some limitations, related to the data collection system. Specifically:
wines imported in bulk that are blended with wines made from locally grown grapes are included in
“local” wines. Therefore, the role of imported wine consumption in the countries considered is
systematically underestimated (but it is not possible to determine the extent of underestimation).
Wine imported from country X is not necessarily actually produced in country X (in the sense that, it
may have been bottled in country X, but imported in bulk from country Y).
13 In actual facts, part of the wine imports under code NC 220429 is not wine in bulk, but wine packaged in containers >2 liters (Bag
in box, large size bottles, etc..) at the origin. This inevitably leads to analytical inaccuracies that at present cannot be solved. In this
regard, the recent decision of the World Customs Organization Sub-Committee for the revision of the Harmonized System (HS)
seems appropriate, in that it has agreed to the OIV proposal whereby wine in containers between 2 and 10 litres will no longer be
considered as “bulk” in terms of customs nomenclature. This will prevent the current analytical errors. 14 China/Hong Kong, Russia, USA, Japan, Denmark, Germany and United Kingdom.

STUDY ON THE COMPETITIVENESS OF EUROPEAN WINES 38
2. At the second level, analysis aims to explore the factors (and their interactions) that potentially influence
the competitive position of EU wines and, in particular, those factors that restrict or trigger or guide
domestic demand and choice of wine origin.
This analysis is based on an adaptation of the analytical-interpretative model of competitiveness
suggested by M. Porter (Porter's Diamond) to the specific object of the study.
5.2 GLOBAL COMPETITIVENESS OF EU STILL WINES WITH RESPECT TO INTERNATIONAL TRADE
The analysis of the global competitiveness of the EU still wines with respect to international trade (first level
of analysis) was carried out:
Worldwide on the basis of EU still wine exports (in bottles and bulk) to the world market (including
transfers within the EU, to take into account also the competitiveness of EU wine on the internal
market) and exports of competitors to the world market;
For the top 10 countries importing EU still wines (respectively, in bottles and bulk), namely:
- For bottled wine: Australia, Brazil, Canada, China (including Hong Kong e Macao), Japan, Norway,
Russia, Singapore, Switzerland and USA. These 10 countries account for 88.2% of total exports of
EU bottled wine to third countries in value and 80.7% in volume (in 2012);
- For bulk wine: Angola, Canada, China, Côte-d'Ivoire, Japan, Morocco, Norway, Russia, Switzerland
and USA. These 10 countries represent 89.3% of total exports of EU bulk wine to third countries in
value and 90.4% in volume (in 2012).
For both bottled and bulk wine, the analysis also includes the three EU case study Member States markets
(Denmark, Germany, United Kingdom).
In order to put into context the analysis that follows, we first provide an overview of wine trade at world-
wide level to represent:
the position of the different country-systems with respect to world total exports (including intra-EU
wine transfers). For the EU, the analysis considers individual exporting Member States (over total intra-
and extra-EU markets, in volume and value15
);
the position of EU wines on the most important import markets (in terms of market share, volume and
value).
This analysis uses 2012 wine trade data (source: Comtrade).
5.2.1 The position of country-systems on the world export market
The maps of Fig. 3 show the position of the different country-systems (EU Member States and main non-EU
competitors) in terms of export market share calculated on total world exports in value (on the x-axis) and
volume (on the y-axis)16
, respectively for the bottled wine market, for the wine market in bulk and for the
total still wine market (bottled + bulk).
15 Data in value, sourced from Comtrade, are espressed in USD. 16 Comtrade data for Argentina relative to export volumes (litres) resulted to be incorrect. Therefore, they have been corrected by
applying an average Kg/Lt conversion index to data in kilograms.

STUDY ON THE COMPETITIVENESS OF EUROPEAN WINES 39
Fig. 3: Export market shares of main wine exporting countries in value and volume, 2012 (% over world total export)
Export market shares for bottled wine Export market shares for bulk wine
Export market shares for total still wine
Source: based on Comtrade data
EU Member States hold the largest export market shares worldwide, specifically:
France is the world leader in value and Italy in volume on the export market for bottled wine;
Spain is the world leader (both in value and volume) on the export market for bulk wine;
Overall (bottled + bulk), France is the world leader in value and Spain in volume terms.
Again from the comparison of individual country-systems, the main non-EU competitors have far smaller
market shares compared to the three main producing Member States. The main competitors (Chile and
Australia), have an export market share equal to a quarter of that of France in value and to a third of that of
Spain in volume.
We observe that in terms of relationship between export values and volumes:
For France, New Zealand, Australia (although less) and the US value market shares are larger than
volume market shares (therefore, these countries achieve, on average, a higher FOB unit value). In
particular, New Zealand and France seem to play their competitiveness on high quality wines, both in
bottles and bulk;
Conversely, Italy and Spain have lower market shares in value than in volume (and thus achieve, on
average, a lower FOB unit value). Spain, in particular, seems to play its competitiveness on the low
range wines, both bottled and bulk.
5.2.2 Import market shares of EU wines on the most important world markets
The maps in Fig. 4 show the position of EU wines compared to non-EU wines in terms of import market
shares in the top ten markets of interest at world level, respectively for still wines imported in bottles and
wines imported in bulk. Again, market shares are calculated on values and volumes.
France
Italy
Spain
Aus
Chile
USAGer
New Z
Port Arg
UKS Africa
OTH
0,0
5,0
10,0
15,0
20,0
25,0
30,0
0,0 5,0 10,0 15,0 20,0 25,0 30,0
Ex
op
rt M
ark
et
Sh
are i
n V
olu
me
Export Market Share in value
Spain
Italy
Aus
FranceChileS Africa
USAArg
New ZGerPort
UK
OTH
0,0
5,0
10,0
15,0
20,0
25,0
30,0
0,0 5,0 10,0 15,0 20,0 25,0 30,0
Ex
op
rt M
ark
et
Sh
are i
n V
olu
me
Export Market Share in value
France
ItalySpain
AusChile
USAGer
New Z
ArgPort
S Africa
UK
OTH
0,0
5,0
10,0
15,0
20,0
25,0
30,0
0,0 5,0 10,0 15,0 20,0 25,0 30,0
Ex
op
rt M
ark
et
Sh
are i
n V
olu
me
Export Market Share in value

STUDY ON THE COMPETITIVENESS OF EUROPEAN WINES 40
Fig. 4: Import market shares of EU still wines in value and volume in the most important EU export markets, 2012 (%)
Import market shares for bottled wine Import market shares for bulk wine
Source: based on Comtrade data
In 2012, all EU wines considered together represented about 70% of the world import market in value and a
little more in volume for bottled wines, and about 55% in value and 60% in volume for wine in bulk.
Import market shares of EU wines differ widely across the top 10 import markets plus the markets of the
three case study Member States (UK, Germany and Denmark), ranging from:
a maximum of about 90% (Switzerland, Germany) to a minimum of 25% (Australia) for bottled wines;
a maximum of 100% (Morocco, Angola) to a minimum of 10-12% (United Kingdom) for bulk wine.
In order to provide an interpretation of this variability, we considered the EU wine importing countries in
three groups (see maps above). Based on country-market characteristics it is possible to make assumptions
regarding some factors playing for or against the size of import market share of EU wines:
On the positive side, the factors playing for a larger market share of EU wines are assumed to be:
The market proximity, compared to EU main competitors: Switzerland and Norway (in addition, of
course, to Germany and Denmark within the EU);
The historical relations of importing countries with some Member States (e.g. former colonies such as
Angola and Côte-d'Ivoire);
The existence of characteristics of (some) wine producing Member States that have an impact on the
image of EU wines in import markets (symbolic aspects of the products: culture, history) or that play a
carry-over effect (cuisines, etc.): Russia, Japan and China;
On the negative side, the factors playing against a larger market share of EU wines are assumed to be:
The distance from markets relative to competitors: Australia, Brazil, Singapore;
The existence of economic, political and linguistic ties between supplier countries and consumer
countries, very often through global wine companies17
: UK, USA, Australia.
5.2.3 Analytical approach to analysis of global competitiveness of EU still wines with respect to international trade
The first part of the analysis focuses on the evolution of the global competitiveness of EU wines compared to
non-EU wines on the world market as a whole and in the 10 most important wine import markets,
distinguishing between still wines traded already packaged (<2lt) and wines traded in bulk (>2lt). With
reference to the methodological approach previously illustrated (in §2.6.1.1), the analysis is based on:
Level and evolution of the value and volume of world exports and of imports by the 10 most important
markets for EU wines compared to wines from third countries;
17 Refer to §5.5.3.3 (market shares of global wine companies in the case study countries).
Rus
Ger
Bra
Den
UKJap
USA
Aus
Nor
Can
Chi
Swi
Sing
World
20
30
40
50
60
70
80
90
100
20 30 40 50 60 70 80 90 100
EU
im
po
rt
Ma
rk
et
Sh
are in
vo
lum
e
EU import Market Share in value
MorAng
Rus
Ger
Cd'I
Can
USA
Chi
UK
Swi
Jap
Den
Nor
World
0
10
20
30
40
50
60
70
80
90
100
0 10 20 30 40 50 60 70 80 90 100
EU
im
po
rt
Ma
rk
et
Sh
are in
vo
lum
e
EU import Market Share in value

STUDY ON THE COMPETITIVENESS OF EUROPEAN WINES 41
Level and evolution of the market shares (in value and volume terms) of European wines compared to
wines from third countries.
The following methodology was applied to analyse wine export/import data:
a) To make the data comparable across different countries, at worldwide level and for each country
market, total exports/imports of bottled and bulk wine (both in value and volume) were set equal to 100
at the initial year (2000). Exports/imports from EU and non-EU countries (which make up total
exports/imports) were calculated in proportion to their weight over the total. In addition, each year
exports/imports from EU and non-EU countries (2001 through to 2012; 2013 for EU) were compared to
total imports in 2000.
b) First, we calculated the difference (positive or negative) between EU and non-EU exports (or imports)
in each year of the interval (2000-2012 for non EU countries; 2000-2013 for EU countries). Then, we
calculated the variation (positive or negative) of these differences in each year tn (Δ Exports (or
Imports) (EU-Others)tn), ∀ n → 2001, ..., 2012) from the initial year t2000. Therefore, such variation,
defined as Export (or Import) Variation can be calculated for each year as follows:
Export Variationtn = (Δ Exports (EU-Others)tn) - Δ Exports (EU-Others)t2000,
Import Variationtn = (Δ Imports (EU-Others)tn) - Δ Imports (EU-Others)t2000,
where the Export Variation / Import Variation for 2000 = 0.
c) Similarly, we calculated the difference (positive or negative) between wine export (or import) market
shares of EU and non-EU countries in each year of the interval (2000-2012 for non EU countries; 2000-
2013 for EU countries). Then, we calculated the variation (positive or negative) of these differences in
each year tn (Δ Market Share (EU -Others)tn), ∀ n → 2001, ...,2012) from the initial year t2000.
Therefore, such variation (defined as Market Share Variation) can be calculated for each year as
follows:
Market Share Variationtn = (Δ Market Share (EU-Others)tn) - Δ Market Share (EU-Others)t2000),
where the Market Share Variation for 2000 = 0.
d) Afterwards, we estimated the log-linear regression coefficient for export, import and market share
Variations over the considered years 2000-2012 (2013 for EU countries).
e) Finally, for the world market and each import country market we constructed a map in which:
- the x-axis shows the slope (positive or negative) of the log-linear regression line of the Export
Variation ( or Import Variation);
- the y-axis shows the slope (positive or negative) of the log-linear regression line of the Market Share
Variation.
The combinations of Export - Market Share Variations and Import - Market Share Variations generate, for
each piece of analysis, four quadrants:
In the first quadrant both regression coefficients are positive: the competitiveness of European wines
improves considerably over the considered years;
In the third quadrant both coefficients are negative: the competitiveness of European wine significantly
decreases during the period;
In the second quadrant the coefficient for exports/imports is positive, whereas the market share
coefficient is negative: the competitiveness of European wines improves only slightly, signalling that
risks are present for the future;
In the fourth quadrant, the coefficient for exports/imports is negative, whereas the market share
coefficient is positive: the competitiveness of European wine slightly decreases (however, the analysis
shows that this does not occur in any of the considered cases).

STUDY ON THE COMPETITIVENESS OF EUROPEAN WINES 42
5.2.4 Global competitiveness of EU still wines in the world market
The analysis of the competitive position of EU still wines in the world market was carried out with respect to
total world still wine exports, including also intra-EU trade (i.e. EU wine transfers towards each Member
State). This choice is motivated by the need to consider international trade (exports in this case) as a whole
including also the EU market, for both EU Member States and third countries.
The analysis was conducted for total still wines and separately for packaged and bulk wines.
World exports of still wine have seen remarkable growth, more or less constant throughout the examined
time interval: +8.3% on average per year in value and +4.3% in volume. Within such overall evolution, the
analysis of the competitive position of EU wines shows that:
The growth rate of total exports (value) from the EU is lower than the growth rate of exports from the
rest of the world (+7.6% on average per year and +9.9% per year, respectively). However, a lower
growth rate applied to a much higher initial value leads to a larger growth of EU exports’ value
resulting, therefore, into a positive evolution of the Export Variation indicator;
On the other hand, the growth rate of EU export volumes (3.3% per year) compared to the growth rate
of exports from the rest of the world (+6.5% per year) leads to a substantial stability of the Export
Variation (slightly negative until 2010 and more stable afterwards);
Despite growth of the Export Variation in value terms, the market share of EU wines over total world
exports has declined between 2000-2005 and stabilised afterwards. In spite of a decrease, the EU market
share remains large (about 68% in 2012, compared with 74% in 2000). The substantial stability of the
Export Variation in terms of volume has a somewhat larger effect on the evolution of the EU market
share (in volume): from 75.2% in 2000 to 65.9% in 2012 (in this case too, the market share decreases
until 2007 and subsequently stabilises). Therefore, the Market Share Variation indicator shows a
negative trend in both cases, less pronounced for export value and more evident for export volume (see
Fig. 5).
Fig. 5: World: Total still wine export value, volumes and market shares, 2000-2012 (World 2000= 100)
Total wine: Export value Total wine: Export Value Market Share
Competitiveness in
slight decline
Competitiveness in
slight growth
Competitiveness in
strong growth
Competitiveness in
strong decline
0
0 >0
>0
<0
Reg
r. co
eff
icie
nt
ΔM
ark
et S
ha
re
Regr. coefficient Δ Import
y = 18,832ln(x) - 12,019-50
-
50
100
150
200
250
300
20
00
20
01
20
02
20
03
20
04
20
05
20
06
20
07
20
08
20
09
20
10
20
11
20
12
Δ(EU-Oth)tn -
Δ(EU-Oth)t0
EU 28
OTHERS
Worldy = -5,243ln(x) + 0,8617
-20
-10
-
10
20
30
40
50
60
70
80
20
00
20
01
20
02
20
03
20
04
20
05
20
06
20
07
20
08
20
09
20
10
20
11
20
12
Δ(EU-Oth)tn -Δ(EU-Oth)t0
EU 27
OTHERS

STUDY ON THE COMPETITIVENESS OF EUROPEAN WINES 43
Total wine: Export volume Total wine: Export Volume Market Share
Source: based on Comtrade data
5.2.4.1 Global competitiveness of EU packaged still wines
World exports of still wine in bottles have grown by around 8% on average per year in value and by 3.2% in
volume. In this context, the competitive position of EU wines is a little better than that observed for wines in
total. In particular:
The growth rate of exports’ value of bottled wines from the EU is in this case lower than the growth rate
of exports from the rest of the world (+7.6% and +8.9% on average per year, respectively). However, the
lower growth rate applied to a much higher initial value leads to larger growth in the value of exports
from the EU and, therefore, to a positive evolution of the Export Variation;
The situation is different with respect to export volumes: the growth of EU exports (+3.1% on average
per year) is only slightly lower than the growth rate of exports from the rest of the world (+3.3%).
Furthermore, two sub-intervals can be observed: the first, from 2000 to 2006, characterised by slow
growth of EU exports and faster increase for exports of all competitors; from 2007 onwards, EU exports
see an acceleration compared to a slight decrease of exports for the competitors. The resulting evolution
of the Export Variation is from slightly negative until 2009 to positive in the following years;
Despite the growth of the Export Variation in value terms, the market share of EU bottled wine exports
slightly declines between 2000 to 2005 and essentially stabilises afterwards (see Fig. 6). Similarly to
what observed for total wine exports, the EU market share remains rather high (just over 70% in the last
years of the period, compared to 73% in 2000). On the other hand, the Export Variation in volumes has
more mixed effects on the evolution of EU wines market share (in volume), which decreased from
71.7% to 62.5% until 2005, before gradually recovering in subsequent years to reach 70.9% in 2012 (i.e.
only slightly less than the market share in 2000). In the face of these trends, the Market Share Variation
presents (in both value and volume terms), a negative evolution in the early years of the period, but a
recovery in subsequent years, more noticeable in the case of export volumes.
Fig. 6: World: Bottled still wine export value, volumes and export market shares, 2000-2012 (World 2000= 100)
Bottled wine: Export value Bottled wine: Export Value Market Share
y = -0,384ln(x) - 4,9457-40
-20
-
20
40
60
80
100
120
140
160
180
20
00
20
01
20
02
20
03
20
04
20
05
20
06
20
07
20
08
20
09
20
10
20
11
20
12
Δ(EU-Oth)tn -
Δ(EU-Oth)t0
EU 28
OTHERS
Worldy = -8,491ln(x) - 0,633
-40
-20
-
20
40
60
80
100
20
00
20
01
20
02
20
03
20
04
20
05
20
06
20
07
20
08
20
09
20
10
20
11
20
12
Δ(EU-Oth)tn -Δ(EU-Oth)t0
EU 27
OTHERS
y = 22,019ln(x) - 14,101-50
-
50
100
150
200
250
300
2000
2001
2002
2003
2004
2005
2006
2007
2008
2009
2010
2011
2012
Δ(EU-Oth)tn -
Δ(EU-Oth)t0
EU 28
OTHERS
World y = -3,309ln(x) - 0,36-20
-10
-
10
20
30
40
50
60
70
80
20
00
20
01
20
02
20
03
20
04
20
05
20
06
20
07
20
08
20
09
20
10
20
11
20
12
Δ(EU-Oth)tn -Δ(EU-Oth)t0
EU 27
OTHERS

STUDY ON THE COMPETITIVENESS OF EUROPEAN WINES 44
Bottled wine: Export volume Bottled wine: Export Volume Market Share
Source: based on Comtrade data
The following underlying trends to changes in the global competitiveness of EU bottled still wine exports
can be observed:
The recovery of competitiveness of EU wine exported in bottles on the world market is due to an
improvement of the competitiveness of wines exported mainly from Italy and Spain (in volume), which
however appears to be significantly reduced by a loss of competitiveness of exports from France (not
only in terms of volume, but also in value);
It is worth observing that the growth of the export market share of Spanish wines (in volume), which is
however not matched by an equal improvement in value terms, starts in 2010, following the
implementation of the CMO wine reform. Therefore, the increase in export volumes hides a significant
decrease in the average price18
.
As far as the EU competitors are concerned, the overall trend is the result of opposing developments (see
Fig. 7). Growth is mainly due to exports of Chile that significantly increases its market share (especially
in volume), whereas the turnaround in 2006-2007 is almost exclusively due to loss of market share by
Australia and to a lesser extent by South Africa.
Fig. 7: Bottled still wine export market shares of main competitors, 2000-2012
Bottled still wine: value Bottled still wine: volume
Source: based on Comtrade data
5.2.4.2 Global competitiveness of EU bulk still wines
A somewhat different situation arises in the case of still wines exported in bulk as shown in graphs of Fig 8
below.
World exports have witnessed very important growth: 10.6% on average per year and 6.1%, respectively in
value and volume. Within this expansion, the analysis of the competitive position of EU wines shows some
critical elements. In particular:
18 Cf. §5.2.8 (price competitiveness)
y = 4,3276ln(x) - 8,3535-40
-20
-
20
40
60
80
100
120
140
160
180
20
00
20
01
20
02
20
03
20
04
20
05
20
06
20
07
20
08
20
09
20
10
20
11
20
12
Δ(EU-Oth)tn -
Δ(EU-Oth)t0
EU 28
OTHERS
Worldy = -2,794ln(x) - 5,3514
-30
-20
-10
-
10
20
30
40
50
60
70
80
20
00
20
01
20
02
20
03
20
04
20
05
20
06
20
07
20
08
20
09
20
10
20
11
20
12
Δ(EU-Oth)tn -Δ(EU-Oth)t0
EU 27
OTHERS
-
5,0
10,0
15,0
20,0
25,0
30,0
35,0
40,0
20
00
20
01
20
02
20
03
20
04
20
05
20
06
20
07
20
08
20
09
20
10
20
11
20
12
France
Italy
Spain
Argentina
Australia
Chile
New Zealand
South Africa
USA
-
5,0
10,0
15,0
20,0
25,0
30,0
20
00
20
01
20
02
20
03
20
04
20
05
20
06
20
07
20
08
20
09
20
10
20
11
20
12
France
Italy
Spain
Argentina
Australia
Chile
New Zealand
South Africa
USA

STUDY ON THE COMPETITIVENESS OF EUROPEAN WINES 45
The growth rate of the value of exports from the EU is much lower than the growth rate of exports from
the rest of the world (+7.5% on average per year and +16.5% per year, respectively). In this case,
however, despite a larger initial value for the EU, the growth differential between the EU and the rest of
the world leads to a progressive negative evolution of the Export Variation.
A similar evolution is observed for export volumes: the growth rate of EU exports (+3.4% on average
per year) is much lower than the growth rate from the rest of the world (+12.4%). Again, the result is a
progressive negative evolution of the Export Variation.
The decline of the Export Variation in value and in volume has remarkable effects on the market share
of EU bulk wines, which plunges from 77.4% in 2000 to 53.2% in 2012 in value, and from 88.1% to
58.5% in volume. Therefore, the Market Share Variation presents an evolution strongly negative in both
cases over the entire time interval.
Fig. 8: World: Bulk still wine export value, volumes and export market shares, 2000-2012 (World 2000= 100)
Bulk wine: Export value Bulk wine: Export Value Market Share
Bulk wine: Export volume Bulk wine: Export Volume Market Share
Source: based on Comtrade data
The following trends underlie the observed changes in the global competitiveness of EU exports of still wine
in bulk (see Fig. 9):
The loss of competitiveness of EU wines is due in this case to the sharp drop in market share of wine
exports from France (both value and volume). Italian and Spanish wines seem to perform a little better.
In the case of Spanish wines, we observe an improvement in their market share.
However, the market share of Italian and Spanish wines shows extremely large fluctuations that mirror
one another. One possible interpretation of this occurrence is that both these wines serve more or less
the same usage function in the same markets (particularly the markets of EU Member States) with high
degree of substitutability between the two. Fluctuations are an effect of the respective market
conditions.
With regard to EU competitors, the overall trend is just the sum of individual country trends: all
countries have witnessed a market share increase, although more significant for Australia and Chile and
less important for South Africa.
y = -6,726ln(x) + 4,6792
-100
-50
-
50
100
150
200
250
300
350
20
00
20
01
20
02
20
03
20
04
20
05
20
06
20
07
20
08
20
09
20
10
20
11
20
12
Δ(EU-Oth)tn -
Δ(EU-Oth)t0
EU 28
OTHERS
Worldy = -18,88ln(x) + 8,903
-60
-40
-20
-
20
40
60
80
100
20
00
20
01
20
02
20
03
20
04
20
05
20
06
20
07
20
08
20
09
20
10
20
11
20
12
Δ(EU-Oth)tn -Δ(EU-Oth)t0
EU 27
OTHERS
y = -8,435ln(x) + 0,878
-50
-
50
100
150
200
2000
2001
2002
2003
2004
2005
2006
2007
2008
2009
2010
2011
2012
Δ(EU-Oth)tn -
Δ(EU-Oth)t0
EU 28
OTHERS
Worldy = -18,26ln(x) + 8,3121
-60
-40
-20
-
20
40
60
80
100
20
00
20
01
20
02
20
03
20
04
20
05
20
06
20
07
20
08
20
09
20
10
20
11
20
12
Δ(EU-Oth)tn -Δ(EU-Oth)t0
EU 27
OTHERS

STUDY ON THE COMPETITIVENESS OF EUROPEAN WINES 46
Fig. 9: Bulk still wine export market shares of main competitors, 2000-2012
Bulk still wine: value Bulk still wine: volume
Source: based on Comtrade data
5.2.4.3 Global competitiveness of EU still wines in the world market: Synthesis of results
The map of competitiveness of EU wines (Fig. 10) compared to exported wines of other origin shows that,
overall, EU wines improve their competitiveness on the world market in value terms (they are positioned in
the second quadrant of the map below), while maintaining their position in volume terms, despite the overall
loss of market shares (in value and volume). However, this result is due to two opposite trends:
The relatively good performance of EU bottled wines (both volumes and values are positioned in the II
quadrant), with a slight increase of competitiveness, provides some assurance about the likelihood of
maintaining their competitive position in the future, although some risks may be present for the future
given the slight loss of market shares.
The decidedly negative performance of EU bulk wine exports (both values and volumes are shown in
the third quadrant), with a significant decrease of competitiveness (in particular, market shares) raises
doubts as to the possibility of future recovery of their competitive position.
Fig. 10: Map of competitiveness of EU versus non-EU exported still wines in the world market
Source: Cogea (based on Comtrade data)
5.2.5 EU still wine exports: PDO and non-PDO wines
In this further analysis we have disaggregated EU still wine export data (bottles and bulk) into the PDO
(v.q.p.r.d until 2009) and non-PDO (table wines until 2009) wine categories:
PDO and non-PDO for the whole interval;
PDO, PGI, wines without geographical indication (WGI) and varietal wines from 2010 onwards.
For this analysis we have used Comext data as they allow for the required disaggregation (compared to the
Comtrade database), albeit limited to EU exports towards the rest of the world.
-
5,0
10,0
15,0
20,0
25,0
30,0
20
00
20
01
20
02
20
03
20
04
20
05
20
06
20
07
20
08
20
09
20
10
20
11
20
12
France
Italy
Spain
Argentina
Australia
Chile
New Zealand
South Africa
USA
-
5,0
10,0
15,0
20,0
25,0
30,0
35,0
40,0
45,0
20
00
20
01
20
02
20
03
20
04
20
05
20
06
20
07
20
08
20
09
20
10
20
11
20
12
France
Italy
Spain
Argentina
Australia
Chile
South Africa
USA
Total V
Bottles V
Bulk V
Total Q
Bottles Q
Bulk Q
-25
-20
-15
-10
-5
0
5
10
-10 -5 0 5 10 15 20 25
Reg
r. C
oeff
. M
ark
et
Sh
are v
aria
tio
n
Regr. Coeff. Export variation

STUDY ON THE COMPETITIVENESS OF EUROPEAN WINES 47
The graphs in Fig. 11 show the evolution of the EU27 exports towards third countries (i.e. intra-Union
transfers are excluded from this analysis).
Fig. 11: Evolution of EU still wine exports towards the rest of the world : PDO and non-PDO wines (PGI, WGI, Varietal
wines), 2000-2013
Bottled wine: Export value (1,000 Euros) Bottled wine: Volume (hl)
Bulk wine: Export value (1,000 Euros) Bulk wine: Volume (hl)
Source: Comext data
The following observations emerge from the analysis:
With regard to bottled wine, the same volumes of PDO and non-PDO wines are exported to third
countries, however we observe a striking difference (and with the gap widening over time) in terms of
export values.
Over the last four years of the considered interval (i.e. after the implementation of the 2008 wine CMO
reform and the introduction of new wine categories: PGI, varietal wines) we observe that:
- PGI wines account for a very large proportion of non-PDO wines (approximately 70% in value and
55% in volume on average between 2010-2013);
- Only a very small proportion of wines WGI is represented by varietal wines (about 19% of the total
value and 9% of volume on average between 2010-2013).
Bulk export volumes of PDO wines represent a small part of total exports: about 33% in value over the
entire period and 16% in volume (with a tendency to decrease).
Over the last four years of the examined interval we observe that:
- Most non-PDO wines are wines WGI (about 79% in value and 89% in volume on average between
2010-2013);
- Varietal wines represent only a limited share of wines WGI (about 17% of the total value and 9-
10% of volume on average between 2010-2013).
Therefore, we can draw the following conclusions regarding the evolution over the last four years:
“Quality wines” represent approximately 92% (in value) and 77% (in volume) of exports of EU bottled
wine towards third countries. This percentage is substantially stable over the considered years;
0
500.000
1.000.000
1.500.000
2.000.000
2.500.000
3.000.000
3.500.000
4.000.000
4.500.000
5.000.000
20
00
20
01
20
02
20
03
20
04
20
05
20
06
20
07
20
08
20
09
20
10
20
11
20
12
20
13
PDO < 2l
Not PDO < 2l
PGI < 2l
Varietals < 2l
WGI < 2l
0
1.000.000
2.000.000
3.000.000
4.000.000
5.000.000
6.000.000
7.000.000
8.000.000
20
00
20
01
20
02
20
03
20
04
20
05
20
06
20
07
20
08
20
09
20
10
20
11
20
12
20
13
PDO < 2l
Not PDO < 2l
PGI < 2l
Varietals < 2l
WGI < 2l
0
50.000
100.000
150.000
200.000
250.000
300.000
20
00
20
01
20
02
20
03
20
04
20
05
20
06
20
07
20
08
20
09
20
10
20
11
20
12
20
13
PDO > 2l
Not PDO > 2l
PGI > 2l
Varietals >2l
WGI > 2l
0
500.000
1.000.000
1.500.000
2.000.000
2.500.000
3.000.000
3.500.000
4.000.000
4.500.000
5.000.000
20
00
20
01
20
02
20
03
20
04
20
05
20
06
20
07
20
08
20
09
20
10
20
11
20
12
20
13
PDO > 2l
Not PDO > 2l
PGI > 2l
Varietals >2l
WGI > 2l

STUDY ON THE COMPETITIVENESS OF EUROPEAN WINES 48
By contrast, “quality wines” only represent 43% (in value) and 22% (in volume) of exports in bulk
(with a slight increase over the period). It is thus confirmed that EU exports of wine in bulk consisted
mainly of wines intended for markets not very demanding in terms of quality;
Finally, the new category of varietal wines seems to arouse only little interest on the part of European
producers19
and plays a very marginal role: only 1.4% of total exports of wine bottles in value and 2.1%
in volume; 9.6% of total exports of wine in bulk in value and 7.1% in volume.
China, USA and Canada are the main destination markets of the majority of varietal wine exports (42%
of varietal wine in bottles and 75% in bulk).
5.2.6 The export market for bottled vs. bulk wines: A change of strategy
The different evolution of the competitive position of the EU in the two business areas of bottled and bulk
wine, together with what emerges from the analysis of export trends of different product types (PDO, PGI,
etc.) calls for a more in-depth examination and leads, at the same time, to some further considerations.
Fig. 12 and Fig. 13 show the cumulative size of export volumes of bottled and bulk wine, respectively from
the European Union (intra + extra-EU) and from the group of NWC (the scales of the graphs are identical to
ease comparison).
Fig. 12: Cumulative exports of still wine in bottles and bulk, from EU28 (intra + extra EU) and NWC (hl), 2000-2012
EU28
NWC
Source: based on Comtrade data
Fig. 13: Bottled wine export /Bulk wine export
EU28 and NWC Most important NWC
Source: based on Comtrade data
The analysis leads to the following observations and considerations:
As previously seen, total EU exports started growing (with some fluctuations) from 2007 onwards.
Conversely, after a rapid growth until 2007, NWC exports remain stable in the following years.
The composition of EU wine exports remained essentially constant throughout the period (the observed
fluctuations around the flat trend of the bottled /bulk wine export ratio are quite small).
19 This, despite being eligible for the “Promotion on third country markets” measure under current EU regulation.
-
10,000,000
20,000,000
30,000,000
40,000,000
50,000,000
60,000,000
70,000,000
20
00
20
01
20
02
20
03
20
04
20
05
20
06
20
07
20
08
20
09
20
10
20
11
20
12
Bulk
Bottles
-
10,000,000
20,000,000
30,000,000
40,000,000
50,000,000
60,000,000
70,000,000
20
00
20
01
20
02
20
03
20
04
20
05
20
06
20
07
20
08
20
09
20
10
20
11
20
12
Bulk
Bottles
0,00
0,50
1,00
1,50
2,00
2,50
3,00
3,50
4,00
4,50
20
00
20
01
20
02
20
03
20
04
20
05
20
06
20
07
20
08
20
09
20
10
20
11
20
12
EU 28
NWC 8
0,0
1,0
2,0
3,0
4,0
5,0
6,0
7,0
8,0
20
00
20
01
20
02
20
03
20
04
20
05
20
06
20
07
20
08
20
09
20
10
20
11
20
12
Australia
Chile
South Africa
USA

STUDY ON THE COMPETITIVENESS OF EUROPEAN WINES 49
By contrast, the evolution of NWC exports shows a deterioration of the relationship between bottled and
bulk exports, highlighting a change in business/logistics strategy around 2007, when the stability of total
exports results from growth of exports in bulk and a reversal in the trend of bottled wine exports. In
other words, since 2007 a strategy of gradual substitution of bottled wine with bulk wine exports is in
place.
The main actors of this change of strategy (also influenced by technological innovation - see box below)
are Australia, the United States and South Africa. Chile, on the other hand, seems to follow a more
similar strategy to that adopted by the EU, keeping the bottled/bulk relationship more or less constant
over time.
At present, a possible change of strategy by the EU (similar to what observed in the above NWC
countries) does not seem feasible, since the majority of exports consist of PDO and PGI wines to be
marketed in bottles partly because of constraints posed to bottling outside the production area in the
PDO/PGI production protocols by producers’ organisations (as well as in reason of the image of such
products). Therefore, bulk exports are mainly wines WGI.
Given the cost advantages inherent in marketing/transporting wine in bulk rather than in bottles (see box
below), EU quality wines suffer a competitive disadvantage.
The role of technology in the bulk wine market
Technological development has completely changed the competitive structure of wine trade. In particular, the
introduction of the Flexitank (big bag-in-box with a capacity of 16.000 to 24.000 litres) has replaced steel containers.
The result is that quality does not deteriorate (i.e. no wine oxidation, better preservation of organoleptic
characteristics). In this way it is possible to transfer wine in flexitanks from the areas of production and bottle it in
the areas of consumption, with significant cut of freight costs. In this way, then, bulk wine is no longer only intended
for mixing with local wines, but to be bottled at destination with a brand of origin.
According to the literature, such change has both positive and negative effects.
Positive effects:
Cost reduction: this system allows to transport wine in a standard 24,000 litres container, instead of 9,900 litres
of bottled wine, for which shipping costs are $0.16/lt and $0.34/lt, respectively. This explains the decision of
large wine businesses to bottle wines more cheaply at destination.
Reduction of environmental effects: glass represents most of the weight of a wine bottle. In a standard shipping,
13,200 bottles (9,900 litres) weigh as much as 25,000 litres of bulk wine, which is about the capacity of a
flexitank. Therefore, the "carbon footprint" is reduced by about half for a litre of wine in bulk compared to a
litre of wine in the bottle.
Negative effects:
Increase in unemployment: in all producing countries for the loss of activity of the bottling industry (but,
conversely, increase in consumer countries). In South Africa, the non-profit association Wines Of South Africa
(WOSA) has estimated a loss of 107 units every 10 thousand litres of wine exported in bulk, due also to
reduction of bottling operations.
Consequences for the glass industry: in 2012, Owens-Illinois, the world's largest manufacturer of bottles, closed
down 3 of their 12 kilns in Australia; again in 2012, Amcor of Melbourne has seen a 34% decline in orders and
Penrice Soda Holdings stopped producing soda ash, which is necessary in glass production.
5.2.7 Global competitiveness of EU still wines in the 10 most important import markets and in 3 EU markets (case study Member States)
This chapter analyses EU still wines’ competitive position on the 10 most important third country markets in
terms of imports of EU wines in bottles20
and in bulk21
, respectively (i.e. two distinct groups of countries).
20 The first ten importers of EU bottled wine are Australia, Brazil, Canada, China (including Hong Kong and Macao), Japan, Norway,
Russia, Singapore, Switzerland and USA. 21 The first ten importers of EU wine in bulk are Angola, Canada, China, Côte-d'Ivoire, Japan, Morocco, Norway, Russia,
Switzerland and USA.
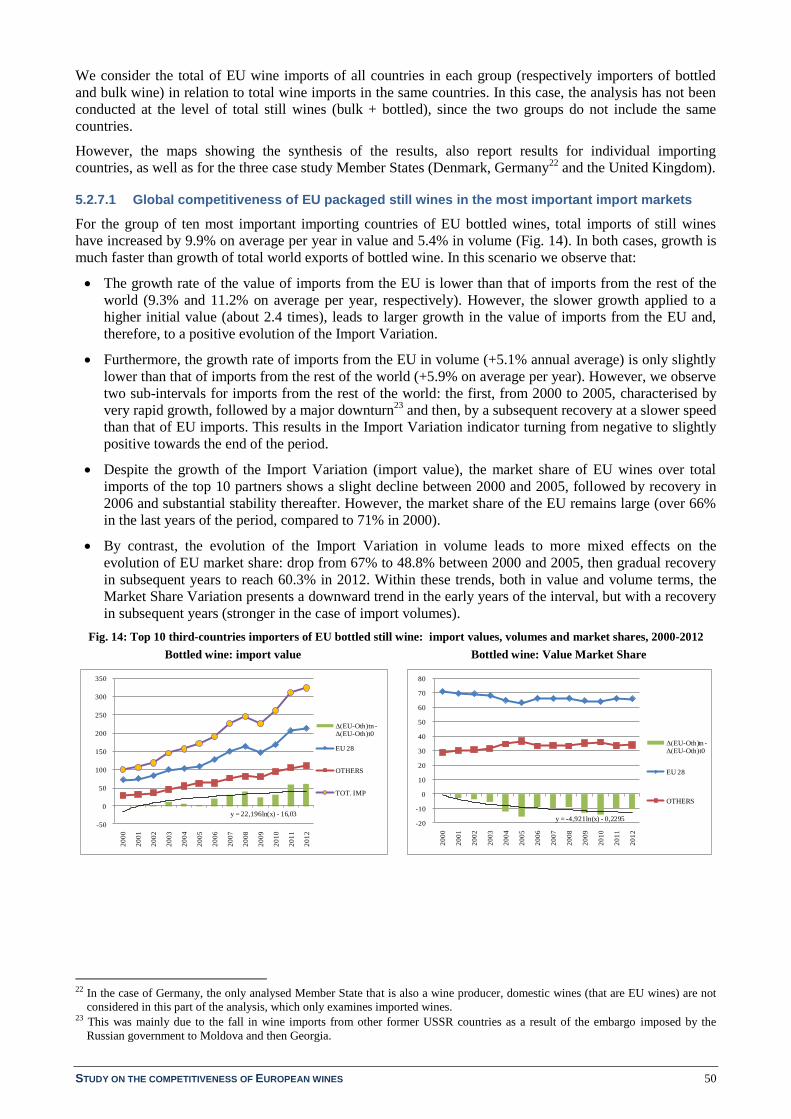
STUDY ON THE COMPETITIVENESS OF EUROPEAN WINES 50
We consider the total of EU wine imports of all countries in each group (respectively importers of bottled
and bulk wine) in relation to total wine imports in the same countries. In this case, the analysis has not been
conducted at the level of total still wines (bulk + bottled), since the two groups do not include the same
countries.
However, the maps showing the synthesis of the results, also report results for individual importing
countries, as well as for the three case study Member States (Denmark, Germany22
and the United Kingdom).
5.2.7.1 Global competitiveness of EU packaged still wines in the most important import markets
For the group of ten most important importing countries of EU bottled wines, total imports of still wines
have increased by 9.9% on average per year in value and 5.4% in volume (Fig. 14). In both cases, growth is
much faster than growth of total world exports of bottled wine. In this scenario we observe that:
The growth rate of the value of imports from the EU is lower than that of imports from the rest of the
world (9.3% and 11.2% on average per year, respectively). However, the slower growth applied to a
higher initial value (about 2.4 times), leads to larger growth in the value of imports from the EU and,
therefore, to a positive evolution of the Import Variation.
Furthermore, the growth rate of imports from the EU in volume (+5.1% annual average) is only slightly
lower than that of imports from the rest of the world (+5.9% on average per year). However, we observe
two sub-intervals for imports from the rest of the world: the first, from 2000 to 2005, characterised by
very rapid growth, followed by a major downturn23
and then, by a subsequent recovery at a slower speed
than that of EU imports. This results in the Import Variation indicator turning from negative to slightly
positive towards the end of the period.
Despite the growth of the Import Variation (import value), the market share of EU wines over total
imports of the top 10 partners shows a slight decline between 2000 and 2005, followed by recovery in
2006 and substantial stability thereafter. However, the market share of the EU remains large (over 66%
in the last years of the period, compared to 71% in 2000).
By contrast, the evolution of the Import Variation in volume leads to more mixed effects on the
evolution of EU market share: drop from 67% to 48.8% between 2000 and 2005, then gradual recovery
in subsequent years to reach 60.3% in 2012. Within these trends, both in value and volume terms, the
Market Share Variation presents a downward trend in the early years of the interval, but with a recovery
in subsequent years (stronger in the case of import volumes).
Fig. 14: Top 10 third-countries importers of EU bottled still wine: import values, volumes and market shares, 2000-2012
Bottled wine: import value Bottled wine: Value Market Share
22 In the case of Germany, the only analysed Member State that is also a wine producer, domestic wines (that are EU wines) are not
considered in this part of the analysis, which only examines imported wines. 23 This was mainly due to the fall in wine imports from other former USSR countries as a result of the embargo imposed by the
Russian government to Moldova and then Georgia.
y = 22,196ln(x) - 16,03
-50
0
50
100
150
200
250
300
350
20
00
20
01
20
02
20
03
20
04
20
05
20
06
20
07
20
08
20
09
20
10
20
11
20
12
Δ(EU-Oth)tn -Δ(EU-Oth)t0
EU 28
OTHERS
TOT. IMP
y = -4,921ln(x) - 0,2295-20
-10
0
10
20
30
40
50
60
70
80
20
00
20
01
20
02
20
03
20
04
20
05
20
06
20
07
20
08
20
09
20
10
20
11
20
12
Δ(EU-Oth)tn -Δ(EU-Oth)t0
EU 28
OTHERS

STUDY ON THE COMPETITIVENESS OF EUROPEAN WINES 51
Bottled wine: import volume Bottled wine: Volume Market Share
Source: based on Comtrade data
The following underlying trends to changes in the global competitiveness of EU bottled still wine imports
can be observed (see Fig. 15):
Growth of imports from the EU in value was mainly due to wines from France and secondarily, from
Italy, with a more modest role played by Spain;
A similar pattern is observed for import volumes, with Italy this time playing a more important role than
France, although imports from France increase more vigorously over the last years of the interval. In
volume terms, Spanish wines see considerable expansion (again from 2010 onwards, after
implementation of the CMO reform), not matched by an equal expansion of import values (resulting
thus into a significant decrease of the average unit value);
As for all other competitors, the overall trend appears negatively affected by the downturn of Australian
wine imports in 2007 and the collapse of Russian imports from the former Soviet republics (especially
in volume). By contrast, Chilean and Argentinean wines enjoy the largest growth (especially in
volume).
Fig. 15: Bottled still wine imports from main competitors, 2000-2012
Imports in value Imports in volume
Source: based on Comtrade data
5.2.7.2 Global competitiveness of EU still wines in bulk in the most important import markets
A somewhat different situation arises in the case of still wines imported in bulk (see Fig. 16). Across all ten
most important import markets for EU wines, total still wine imports have witnessed significant growth: by
12.3% per year in value and 10.9% in volume.
Within this overall trend, the results of the analysis show that:
The growth rate of the value of EU exports is much lower than the growth rate of exports from the rest
of the world (respectively, 8.4% and 17.3% on average per year). This growth differential, although
applied to a larger initial value for the EU (about 2.1 times), leads to a gradually negative evolution of
the Import Variation, with a dramatic low point in the last considered year.
y = 0,9766ln(x) - 15,444-50,0
0,0
50,0
100,0
150,0
200,0
250,0
20
00
20
01
20
02
20
03
20
04
20
05
20
06
20
07
20
08
20
09
20
10
20
11
20
12
Δ(EU-Oth)tn -Δ(EU-Oth)t0
EU 28
OTHERS
TOT. IMP
y = -5,269ln(x) - 10,346
-60
-40
-20
0
20
40
60
80
20
00
20
01
20
02
20
03
20
04
20
05
20
06
20
07
20
08
20
09
20
10
20
11
20
12
Δ(EU-Oth)tn -Δ(EU-Oth)t0
EU 28
OTHERS
-
20
40
60
80
100
120
20
00
20
01
20
02
20
03
20
04
20
05
20
06
20
07
20
08
20
09
20
10
20
11
20
12
France
Italy
Spain
Argentina
Australia
Chile
New Zealand
USA
Others Ex USSR
-
5
10
15
20
25
30
35
40
45
50
20
00
20
01
20
02
20
03
20
04
20
05
20
06
20
07
20
08
20
09
20
10
20
11
20
12
France
Italy
Spain
Argentina
Australia
Chile
New Zealand
USA
Others Ex USSR

STUDY ON THE COMPETITIVENESS OF EUROPEAN WINES 52
A similar pattern is observed for export volumes: growth of EU exports (7.2% on average per year) is
again much slower than growth of exports from the rest of the world (+15.2% per year). Again, the
result is a downward evolution of the Import Variation.
The decrease of the Import Variation in value and volume has an extreme effect on the market share of
EU wines, which plunges from 67.7% in 2000 to 39.5% in 2012 in value and from 67.6% to 39.4% in
volume. EU competitors reach 50% of the market share (critical threshold) in 2007 in volume and in
2009 in value. Therefore, the Market Share Variation presents a dramatic decrease over the whole
period.
Fig. 16: Top 10 third-countries importers of EU still wine in bulk: import values, volumes and market shares, 2000-2012
Bulk wine: Import value Bulk wine: Value Market Share
Bulk wine: Import volume Bulk wine: Volume Market Share
Source: based on Comtrade data
The following trends underlying the changes in the global competitiveness of bulk wine imports from the EU
can be observed (Fig. 17):
The evolution of imports from the EU in value is due to exponential growth of still wine imports from
Spain (albeit with a collapse in 2012, which generates an overall fall in imports from the EU in the same
year), and more modest import increases from Italy and Portugal24
. On the other hand, imports in bulk
from France fluctuate around an average value only slightly increasing25
.
The same pattern is more or less reproduced for imports in volume, with an even greater role played by
Spain (who became a leader in all 10 examined country markets in 2010) and a reversal of positions
between France and Italy starting in 2009.
With regard to the other competitors, all major producing countries have contributed to the overall
growth of the group26
. However, the most important contribution is given by the tremendous growth of
imports from Chile and Australia (in volume terms, but especially in value terms). In 2012 Chile
became the absolute leader for all 10 countries with respect to value of imports. In addition, we observe
a remarkable growth of wines imported from Argentina starting from 2009-2010.
24 Portugal accounts for the near totality of Angola’s wine imports. 25 Spain and Portugal are the only Member States increasing their market share, whereas Italy and, in particular, France witness a
dramatic reduction of their market share. 26 All main competitors increase their market share, with the only ecception of the USA.
y = -23,25ln(x) + 20,168
-200
-100
0
100
200
300
400
500
20
00
20
01
20
02
20
03
20
04
20
05
20
06
20
07
20
08
20
09
20
10
20
11
20
12
Δ(EU-Oth)tn -Δ(EU-Oth)t0
EU 28
OTHERS
TOT. IMP
y = -19,3ln(x) + 14,431
-60
-40
-20
0
20
40
60
80
20
00
20
01
20
02
20
03
20
04
20
05
20
06
20
07
20
08
20
09
20
10
20
11
20
12
Δ(EU-Oth)tn -Δ(EU-Oth)t0
EU 28
OTHERS
y = -25,9ln(x) + 12,146
-150,0
-100,0
-50,0
0,0
50,0
100,0
150,0
200,0
250,0
300,0
350,0
20
00
20
01
20
02
20
03
20
04
20
05
20
06
20
07
20
08
20
09
20
10
20
11
20
12
Δ(EU-Oth)tn -Δ(EU-Oth)t0
EU 28
OTHERS
TOT. IMP
y = -20,51ln(x) + 7,1911
-80
-60
-40
-20
0
20
40
60
80
20
00
20
01
20
02
20
03
20
04
20
05
20
06
20
07
20
08
20
09
20
10
20
11
20
12
Δ(EU-Oth)tn -Δ(EU-Oth)t0
EU 28
OTHERS

STUDY ON THE COMPETITIVENESS OF EUROPEAN WINES 53
Fig. 17: Bulk still wine imports from main competitors, 2000-2012
Imports in value Imports in volume
Source: based on Comtrade data
5.2.7.3 Global competitiveness of EU still wines in the most important import markets: Synthesis of results
The maps of competitiveness of European wines, bottled and in bulk (respectively, in value and volume) on
the most important import markets worldwide are presented in Fig. 18 and Fig. 19.
As well as the overall competitive position of EU wines in the top 10 markets (considered together), the
maps also show the competitive position of EU wines in individual country markets, including the three
Member States examined as case studies (Denmark, Germany, United Kingdom).
With regard to the overall competitive position of EU wines (i.e. considering the top 10 country markets as
an aggregate), the results are very similar to those obtained in the analysis of the competitive position of the
EU in global exports (Cf. §5.2.4):
EU wines slightly improved their position in the market for bottled wine, both in value and volume,
compared to the group of competitors (both are positioned in the second quadrant, but very close to the
line between second and third quadrant), despite the overall loss of market shares;
The competitive position of EU wines on the bulk wine market significantly deteriorated, both in value
and volume (positioned in the third quadrant in both cases, however not very far from the line between
second and third quadrant) and very severely in what concerns market shares.
In both cases, the overall result is the consequence of very heterogeneous individual situations (i.e. each
country of the two groups of top 10 trade partners respectively for bottled and bulk wine). This heterogeneity
is further confirmed by the results of analysis carried out on the three MS markets (Germany, Denmark and
UK).
With respect to bottled wines (Fig. 18), the analysis of the competitive position of the EU on individual
markets shows that:
EU wines greatly improved their competitive position (both in value and volume) on the import markets
of Russia and China, but also Switzerland and Norway and, among the EU markets, the United
Kingdom (i.e. first quadrant of the map);
EU bottled wines also improved their competitive position on the import markets of the US (in terms of
value and volume), and Japan and Singapore albeit to a lesser extent (only in value terms in these two
markets, whereas EU wines position slightly deteriorates with respect to volumes), although some risks
may be present for the future in these markets;
A marked deterioration of EU wines position occurs in the import markets of Australia and Brazil (lying
in the third quadrant, both values and volumes). This raises questions about the realistic possibility of
future recovery in these markets;
A slight decline was also recorded on the import markets of Canada and Denmark (but only in volume,
whereas EU wines appear to maintain their position in value terms). For these two countries, the future
recovery of competitiveness is potentially feasible.
The competitive position of EU bottled wines on the German market is substantially preserved (both in
value and volume).
-
10
20
30
40
50
60
70
80
20
00
20
01
20
02
20
03
20
04
20
05
20
06
20
07
20
08
20
09
20
10
20
11
20
12
France
Italy
Portugal
Spain
Argentina
Australia
Chile
New Zealand
South Africa
USA
Others Ex USSR-
10
20
30
40
50
60
70
80
90
100
20
00
20
01
20
02
20
03
20
04
20
05
20
06
20
07
20
08
20
09
20
10
20
11
20
12
France
Italy
Portugal
Spain
Argentina
Australia
Chile
South Africa
USA
Others Ex USSR

STUDY ON THE COMPETITIVENESS OF EUROPEAN WINES 54
Fig. 18: Maps of competitiveness of EU versus non-EU bottled still wines in the top 10 third-country markets and in the 3
Member State markets
Bottled still wine in value Bottled still wine in volume
Source: Cogea (based on Comtrade data for third countries and Comext data for EU countries)
However, some aspects contribute to mitigate this scenario, in particular a more reasoned analysis of the
evolution of the Import Variation and the Market Share Variation indicators. We refer, in particular to:
the Russian import market (in volume), where the important increase of both indicators is the effect of a
structural break coinciding with the embargo imposed between 2005 and 2006 to products from
Moldova (main trade partner of Russia before that date). In fact, after the sudden growth of wine
imports from the EU in 2006 (i.e. substitution effect), Russian imported volumes largely stabilised,
including imports from the EU. Therefore, Russia's position on the map should be reconsidered;
imports of the United States, where "average" results mask a significant upturn in the last years of the
interval (both in value and volume), which have contributed to moving the position of EU wines on the
second quadrant, very close to the first quadrant.
The analysis of the competitive position of the EU bulk wine (Fig. 19) on individual markets shows that:
EU wines greatly improved their competitive position (both in value and volume) on the import markets
of Russia and Norway (lying in the first quadrant), and to a lesser extent Angola, Germany, and Côte-
d'Ivoire (as shown by positioning in the second quadrant).
A marked deterioration is observed on the import market of the United States, but also in China and the
United Kingdom (all in the third quadrant). A deterioration, although to a lesser extent, is also recorded
on the Danish and Japanese markets.
In other countries (Canada and Switzerland) the competitive position of EU wines has only very slightly
worsened.
Fig. 19: Maps of competitiveness of EU versus non-EU bulk still wines in the top 10 third-country markets and in the 3
Member State markets
Bulk still wine in value Bulk still wine in volume
Source: Cogea (based on Comtrade data for third countries and Comext data for EU Member States)
First 10
Aus
Bra
Can
Nor
Sing
Swi
US
Jap
Rus
ChiGer
Den
UK
-40
-30
-20
-10
0
10
20
30
40
50
60
-400 -200 0 200 400 600 800
Reg
r. C
oeff
. M
ark
et
Sh
are v
aria
tio
n
Regr. coeff. Import variation
First 10
Aus
BraCan
Nor
Sing
Swi
USJap
Rus
ChiGer
Den
UK
-60
-40
-20
0
20
40
60
80
-200 -100 0 100 200 300
Reg
r. co
eff
. Ma
rk
et
Sh
are v
aria
tio
n
Coeff. regr. Import variation
First 10
CanCd'I
Nor
Swi Ang
US
Jap
Rus
Chi
Ger
DenUK
-50
-40
-30
-20
-10
0
10
20
30
40
-400 -300 -200 -100 0 100 200
Reg
r. co
eff
. Ma
rk
et
Sh
are v
aria
tio
n
Regr. coeff. Import variation
First 10
Can
Cd'I
NorSwi
Ang
US
Jap
Rus
Chi
Ger
Den
UK
-50
-40
-30
-20
-10
0
10
20
30
40
50
-600 -400 -200 0 200
Reg
r. co
eff
. Ma
rk
et
Sh
are v
aria
tio
n
Coeff. regr. Import variation
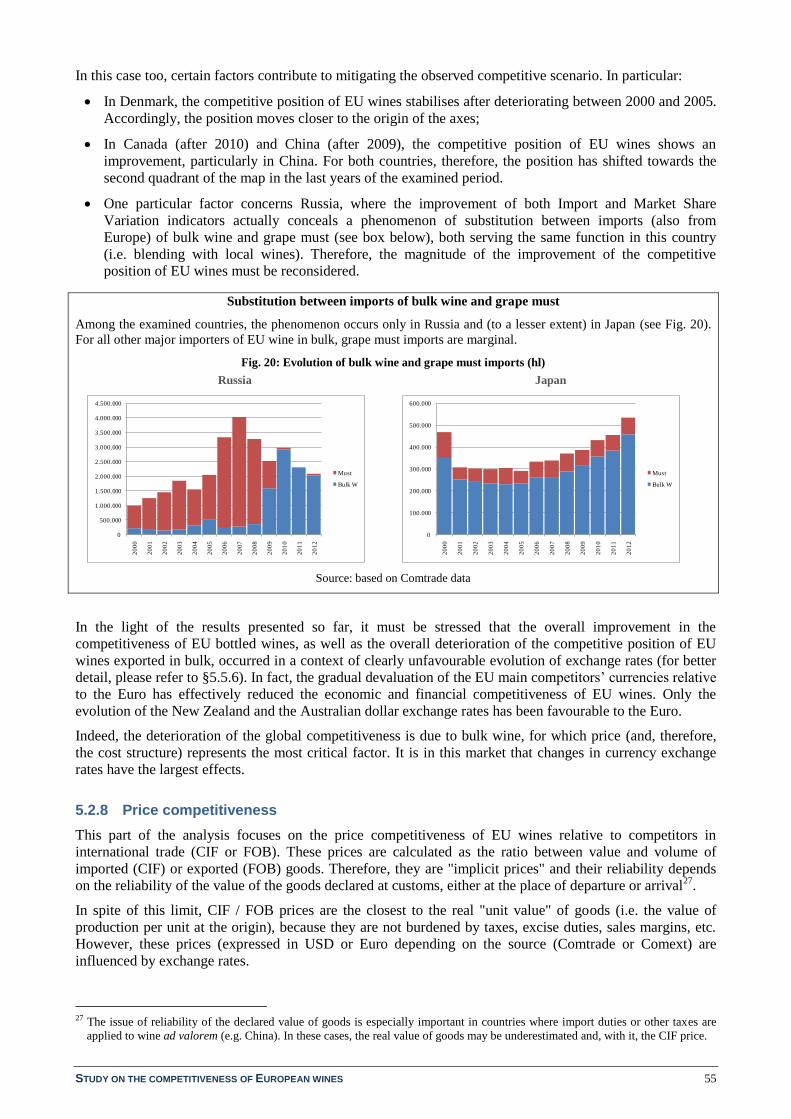
STUDY ON THE COMPETITIVENESS OF EUROPEAN WINES 55
In this case too, certain factors contribute to mitigating the observed competitive scenario. In particular:
In Denmark, the competitive position of EU wines stabilises after deteriorating between 2000 and 2005.
Accordingly, the position moves closer to the origin of the axes;
In Canada (after 2010) and China (after 2009), the competitive position of EU wines shows an
improvement, particularly in China. For both countries, therefore, the position has shifted towards the
second quadrant of the map in the last years of the examined period.
One particular factor concerns Russia, where the improvement of both Import and Market Share
Variation indicators actually conceals a phenomenon of substitution between imports (also from
Europe) of bulk wine and grape must (see box below), both serving the same function in this country
(i.e. blending with local wines). Therefore, the magnitude of the improvement of the competitive
position of EU wines must be reconsidered.
Substitution between imports of bulk wine and grape must
Among the examined countries, the phenomenon occurs only in Russia and (to a lesser extent) in Japan (see Fig. 20).
For all other major importers of EU wine in bulk, grape must imports are marginal.
Fig. 20: Evolution of bulk wine and grape must imports (hl)
Russia Japan
Source: based on Comtrade data
In the light of the results presented so far, it must be stressed that the overall improvement in the
competitiveness of EU bottled wines, as well as the overall deterioration of the competitive position of EU
wines exported in bulk, occurred in a context of clearly unfavourable evolution of exchange rates (for better
detail, please refer to §5.5.6). In fact, the gradual devaluation of the EU main competitors’ currencies relative
to the Euro has effectively reduced the economic and financial competitiveness of EU wines. Only the
evolution of the New Zealand and the Australian dollar exchange rates has been favourable to the Euro.
Indeed, the deterioration of the global competitiveness is due to bulk wine, for which price (and, therefore,
the cost structure) represents the most critical factor. It is in this market that changes in currency exchange
rates have the largest effects.
5.2.8 Price competitiveness
This part of the analysis focuses on the price competitiveness of EU wines relative to competitors in
international trade (CIF or FOB). These prices are calculated as the ratio between value and volume of
imported (CIF) or exported (FOB) goods. Therefore, they are "implicit prices" and their reliability depends
on the reliability of the value of the goods declared at customs, either at the place of departure or arrival27
.
In spite of this limit, CIF / FOB prices are the closest to the real "unit value" of goods (i.e. the value of
production per unit at the origin), because they are not burdened by taxes, excise duties, sales margins, etc.
However, these prices (expressed in USD or Euro depending on the source (Comtrade or Comext) are
influenced by exchange rates.
27 The issue of reliability of the declared value of goods is especially important in countries where import duties or other taxes are
applied to wine ad valorem (e.g. China). In these cases, the real value of goods may be underestimated and, with it, the CIF price.
0
500.000
1.000.000
1.500.000
2.000.000
2.500.000
3.000.000
3.500.000
4.000.000
4.500.000
20
00
20
01
20
02
20
03
20
04
20
05
20
06
20
07
20
08
20
09
20
10
20
11
20
12
Must
Bulk W
0
100.000
200.000
300.000
400.000
500.000
600.000
20
00
20
01
20
02
20
03
20
04
20
05
20
06
20
07
20
08
20
09
20
10
20
11
20
12
Must
Bulk W

STUDY ON THE COMPETITIVENESS OF EUROPEAN WINES 56
5.2.8.1 Evolution of FOB prices
Graphs in Fig. 21 show the evolution of average FOB prices of EU wines and wines from the group of
NWC, in bottles and in bulk. In order to appreciate the role played by exchange rates, prices are expressed in
USD and in Euro.
Fig. 22 shows the evolution of the relationship between EU and NWC wine FOB prices.
Fig. 21: Evolution of the FOB unit value of EU and NWC wines in bottles and bulk (USD/lt and Euro/lt), 2000-2012
USD/lt Euro/lt
Source: Comtrade for third countries; Comext for EU Member States
Fig. 22: EU/NWC FOB unit values
Source: Comtrade for third countries; Comext for EU Member States
Examination of the evolution of prices and their relationship shows that the ratio between EU and NWC
prices is always greater than 1 for bottled wines (except for the last year of the interval), and less than 1 for
bulk wine in almost all years, with the exception of 2003, 2007 and 2009.
If we want to hypothesise a relationship between price and quality, we must therefore conclude that, on
average, EU wines traded in bottles should be of higher quality compared to NWC wines (although NWC
caught up, evening out the average price towards the end of the period), whereas EU wines traded in bulk
should be (again on average) of lower quality.
In addition, the analysis of price trends highlights the presence of two sub-periods:
The first, from 2000 to 2009, shows widening of the gap between EU and NWC prices. This results in
an increase (on average) in the price ratio, which appears to be more stable for bottled wine than for
bulk wine;
The second, from 2009 to 2012 shows a sharp reversal of the previous trend, which is particularly
evident for bottled wines (but also for wines in bulk, albeit in a less pronounced manner).
The turnaround observed in the last four years appears to be strongly related to the change in business
strategy implemented by some NWC companies (i.e. gradual replacement of wine exported in bottles with
wine exported in bulk - see §5.2.6). The effect of this strategy change on average FOB prices is twofold:
Increase in the average price of bottled wines: part of average quality wine (and average price)
previously exported in bottles is exported in bulk, while the wines of better quality and stronger image
(and hence higher price) continue to be exported in bottles. This results in an increase of the average
FOB price of wine (of better quality) in bottles;
-
0,5
1,0
1,5
2,0
2,5
3,0
3,5
4,0
4,5
5,0
20
00
20
01
20
02
20
03
20
04
20
05
20
06
20
07
20
08
20
09
20
10
20
11
20
12
EU bottled
NWC Bottled
EU Bulk
NWC Bulk
-
0,5
1,0
1,5
2,0
2,5
3,0
3,5
20
00
20
01
20
02
20
03
20
04
20
05
20
06
20
07
20
08
20
09
20
10
20
11
20
12
EU bottled
NWC bottled
EU bulk
NWC bulk
0,00
0,20
0,40
0,60
0,80
1,00
1,20
1,40
20
00
20
01
20
02
20
03
20
04
20
05
20
06
20
07
20
08
20
09
20
10
20
11
20
12
Total wine
Bottles
Bulk

STUDY ON THE COMPETITIVENESS OF EUROPEAN WINES 57
Increase in the average price of wines in bulk: part of the average quality wine (and average price),
previously exported in bottles, is added to the wine of lesser quality (and lower price) previously
exported in bulk. The result is an improvement in the average quality and, therefore, in the average
price.
These two effects become even more obvious moving from the aggregate level of analysis to individual
countries.
Fig. 23 illustrates the changes in FOB prices (in Euros), respectively for the main EU and NWC wine
exporters (the same price scale is used for the two groups of countries in order to facilitate comparison).
Fig. 23: Evolution of FOB Unit Values of still wines exported by EU Members States and main EU competitors (EUR/lt)
Bottled EU Bottled NWC
Bulk EU Bulk NWC
Source: Comtrade for third countries; Comext for EU Member States
With regard to NWC, a trend reversal for bottled wine is evident in the countries that have progressively
substituted bottled wine with bulk exports (Australia, USA, New Zealand and South Africa). By contrast, the
evolution of FOB prices for countries that have not adopted the same strategy (e.g. Chile), does not present
discontinuities.
Observation of the graphs in Fig. 23 provides some further insights, in particular:
In both markets (bottled and bulk wine), New Zealand wines achieve the highest (on average) FOB
prices in absolute terms, although they are affected by wide fluctuations (which testify to the
responsiveness of price to changes in production28
). French wines consistently achieve the second
highest prices, and constantly increasing (increase that, among other possible causes, may well be due to
decreasing market shares of French exports on total exports - see §5.2.4.2).
FOB prices of Spanish bulk wine, and more so of bottled wine, are the lowest ever (in the last years,
even lower than Argentine wine prices). Moreover, in sharp contrast to FOB prices of all other
examined countries (EU and NWC), the price of Spanish bottled wines shows a sharp decline
28 For example, in 2008-2009 the price decrease is due to excess supply (see §5.5.1.1 on evolution of vineyard areas and
production).
1,0
1,5
2,0
2,5
3,0
3,5
4,0
4,5
5,0
5,5
20
00
20
01
20
02
20
03
20
04
20
05
20
06
20
07
20
08
20
09
20
10
20
11
20
12
France
Italy
Spain
1,0
1,5
2,0
2,5
3,0
3,5
4,0
4,5
5,0
5,5
20
00
20
01
20
02
20
03
20
04
20
05
20
06
20
07
20
08
20
09
20
10
20
11
20
12
Argentina
Australia
Chile
New Zealand
South Africa
USA
-
0,5
1,0
1,5
2,0
2,5
3,0
3,5
20
00
20
01
20
02
20
03
20
04
20
05
20
06
20
07
20
08
20
09
20
10
20
11
20
12
France
Italy
Portugal
Spain
-
0,5
1,0
1,5
2,0
2,5
3,0
3,5
20
00
20
01
20
02
20
03
20
04
20
05
20
06
20
07
20
08
20
09
20
10
20
11
20
12
Argentina
Australia
Chile
New Zealand
South Africa
USA
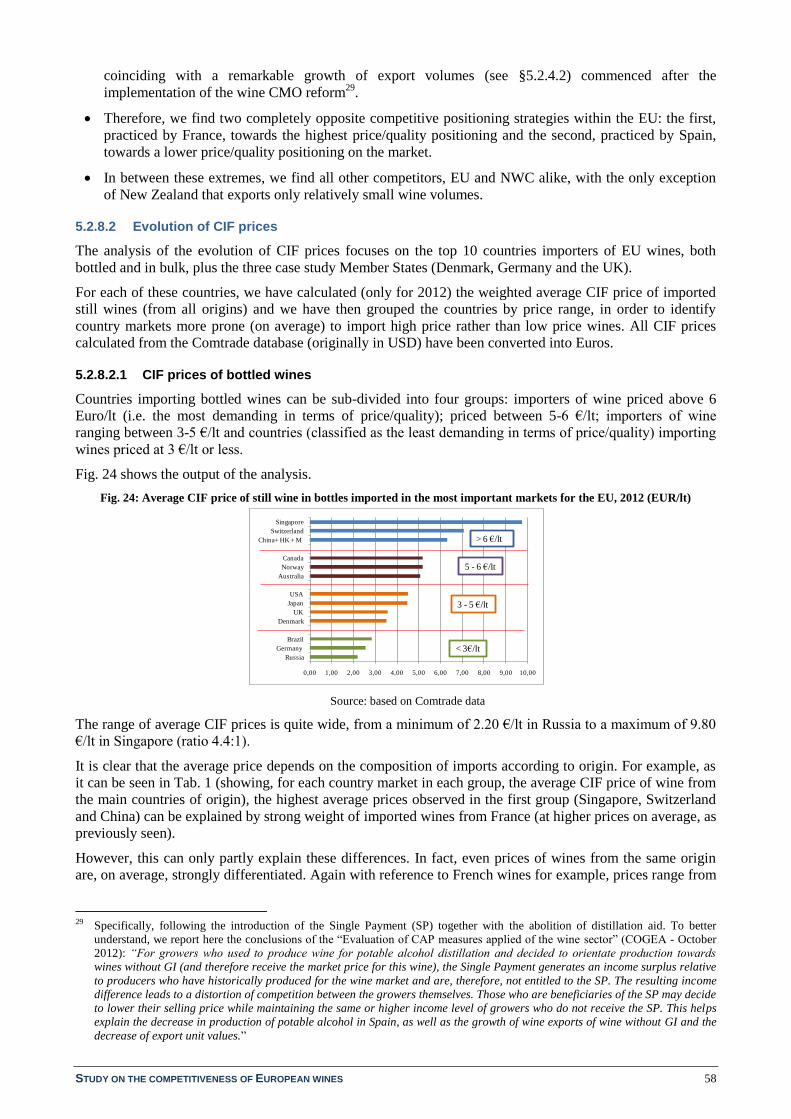
STUDY ON THE COMPETITIVENESS OF EUROPEAN WINES 58
coinciding with a remarkable growth of export volumes (see §5.2.4.2) commenced after the
implementation of the wine CMO reform29
.
Therefore, we find two completely opposite competitive positioning strategies within the EU: the first,
practiced by France, towards the highest price/quality positioning and the second, practiced by Spain,
towards a lower price/quality positioning on the market.
In between these extremes, we find all other competitors, EU and NWC alike, with the only exception
of New Zealand that exports only relatively small wine volumes.
5.2.8.2 Evolution of CIF prices
The analysis of the evolution of CIF prices focuses on the top 10 countries importers of EU wines, both
bottled and in bulk, plus the three case study Member States (Denmark, Germany and the UK).
For each of these countries, we have calculated (only for 2012) the weighted average CIF price of imported
still wines (from all origins) and we have then grouped the countries by price range, in order to identify
country markets more prone (on average) to import high price rather than low price wines. All CIF prices
calculated from the Comtrade database (originally in USD) have been converted into Euros.
5.2.8.2.1 CIF prices of bottled wines
Countries importing bottled wines can be sub-divided into four groups: importers of wine priced above 6
Euro/lt (i.e. the most demanding in terms of price/quality); priced between 5-6 €/lt; importers of wine
ranging between 3-5 €/lt and countries (classified as the least demanding in terms of price/quality) importing
wines priced at 3 €/lt or less.
Fig. 24 shows the output of the analysis.
Fig. 24: Average CIF price of still wine in bottles imported in the most important markets for the EU, 2012 (EUR/lt)
Source: based on Comtrade data
The range of average CIF prices is quite wide, from a minimum of 2.20 €/lt in Russia to a maximum of 9.80
€/lt in Singapore (ratio 4.4:1).
It is clear that the average price depends on the composition of imports according to origin. For example, as
it can be seen in Tab. 1 (showing, for each country market in each group, the average CIF price of wine from
the main countries of origin), the highest average prices observed in the first group (Singapore, Switzerland
and China) can be explained by strong weight of imported wines from France (at higher prices on average, as
previously seen).
However, this can only partly explain these differences. In fact, even prices of wines from the same origin
are, on average, strongly differentiated. Again with reference to French wines for example, prices range from
29 Specifically, following the introduction of the Single Payment (SP) together with the abolition of distillation aid. To better
understand, we report here the conclusions of the “Evaluation of CAP measures applied of the wine sector” (COGEA - October
2012): “For growers who used to produce wine for potable alcohol distillation and decided to orientate production towards
wines without GI (and therefore receive the market price for this wine), the Single Payment generates an income surplus relative
to producers who have historically produced for the wine market and are, therefore, not entitled to the SP. The resulting income
difference leads to a distortion of competition between the growers themselves. Those who are beneficiaries of the SP may decide
to lower their selling price while maintaining the same or higher income level of growers who do not receive the SP. This helps
explain the decrease in production of potable alcohol in Spain, as well as the growth of wine exports of wine without GI and the
decrease of export unit values.”
0,00 1,00 2,00 3,00 4,00 5,00 6,00 7,00 8,00 9,00 10,00
Russia
Germany
Brazil
Denmark
UK
Japan
USA
Australia
Norway
Canada
China+ HK + M
Switzerland
Singapore
< 3€/lt
3 - 5 €/lt
5 - 6 €/lt
> 6 €/lt
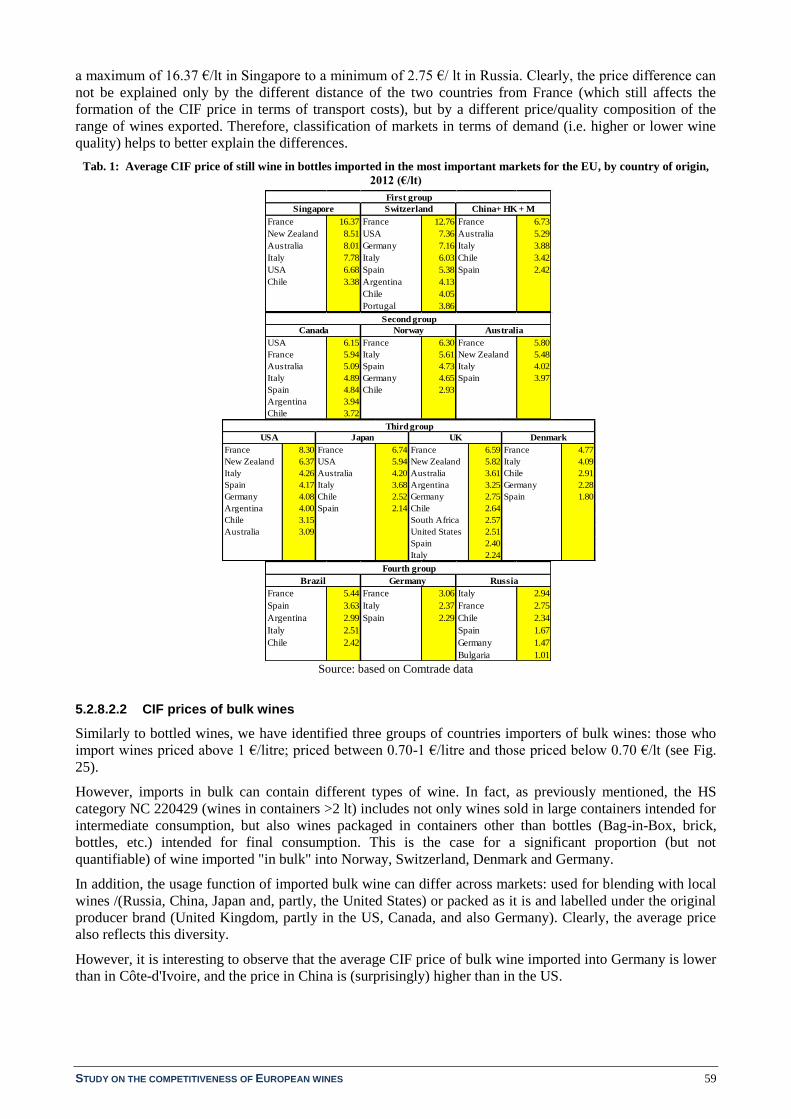
STUDY ON THE COMPETITIVENESS OF EUROPEAN WINES 59
a maximum of 16.37 €/lt in Singapore to a minimum of 2.75 €/ lt in Russia. Clearly, the price difference can
not be explained only by the different distance of the two countries from France (which still affects the
formation of the CIF price in terms of transport costs), but by a different price/quality composition of the
range of wines exported. Therefore, classification of markets in terms of demand (i.e. higher or lower wine
quality) helps to better explain the differences.
Tab. 1: Average CIF price of still wine in bottles imported in the most important markets for the EU, by country of origin,
2012 (€/lt)
Source: based on Comtrade data
5.2.8.2.2 CIF prices of bulk wines
Similarly to bottled wines, we have identified three groups of countries importers of bulk wines: those who
import wines priced above 1 €/litre; priced between 0.70-1 €/litre and those priced below 0.70 €/lt (see Fig.
25).
However, imports in bulk can contain different types of wine. In fact, as previously mentioned, the HS
category NC 220429 (wines in containers >2 lt) includes not only wines sold in large containers intended for
intermediate consumption, but also wines packaged in containers other than bottles (Bag-in-Box, brick,
bottles, etc.) intended for final consumption. This is the case for a significant proportion (but not
quantifiable) of wine imported "in bulk" into Norway, Switzerland, Denmark and Germany.
In addition, the usage function of imported bulk wine can differ across markets: used for blending with local
wines /(Russia, China, Japan and, partly, the United States) or packed as it is and labelled under the original
producer brand (United Kingdom, partly in the US, Canada, and also Germany). Clearly, the average price
also reflects this diversity.
However, it is interesting to observe that the average CIF price of bulk wine imported into Germany is lower
than in Côte-d'Ivoire, and the price in China is (surprisingly) higher than in the US.
France 16.37 France 12.76 France 6.73
New Zealand 8.51 USA 7.36 Australia 5.29
Australia 8.01 Germany 7.16 Italy 3.88
Italy 7.78 Italy 6.03 Chile 3.42
USA 6.68 Spain 5.38 Spain 2.42
Chile 3.38 Argentina 4.13
Chile 4.05
Portugal 3.86
First group
Singapore Switzerland China+ HK + M
USA 6.15 France 6.30 France 5.80
France 5.94 Italy 5.61 New Zealand 5.48
Australia 5.09 Spain 4.73 Italy 4.02
Italy 4.89 Germany 4.65 Spain 3.97
Spain 4.84 Chile 2.93
Argentina 3.94
Chile 3.72
Second group
Canada Norway Australia
France 8.30 France 6.74 France 6.59 France 4.77
New Zealand 6.37 USA 5.94 New Zealand 5.82 Italy 4.09
Italy 4.26 Australia 4.20 Australia 3.61 Chile 2.91
Spain 4.17 Italy 3.68 Argentina 3.25 Germany 2.28
Germany 4.08 Chile 2.52 Germany 2.75 Spain 1.80
Argentina 4.00 Spain 2.14 Chile 2.64
Chile 3.15 South Africa 2.57
Australia 3.09 United States 2.51
Spain 2.40
Italy 2.24
Third group
USA Japan UK Denmark
France 5.44 France 3.06 Italy 2.94
Spain 3.63 Italy 2.37 France 2.75
Argentina 2.99 Spain 2.29 Chile 2.34
Italy 2.51 Spain 1.67
Chile 2.42 Germany 1.47
Bulgaria 1.01
Fourth group
Brazil Germany Russia
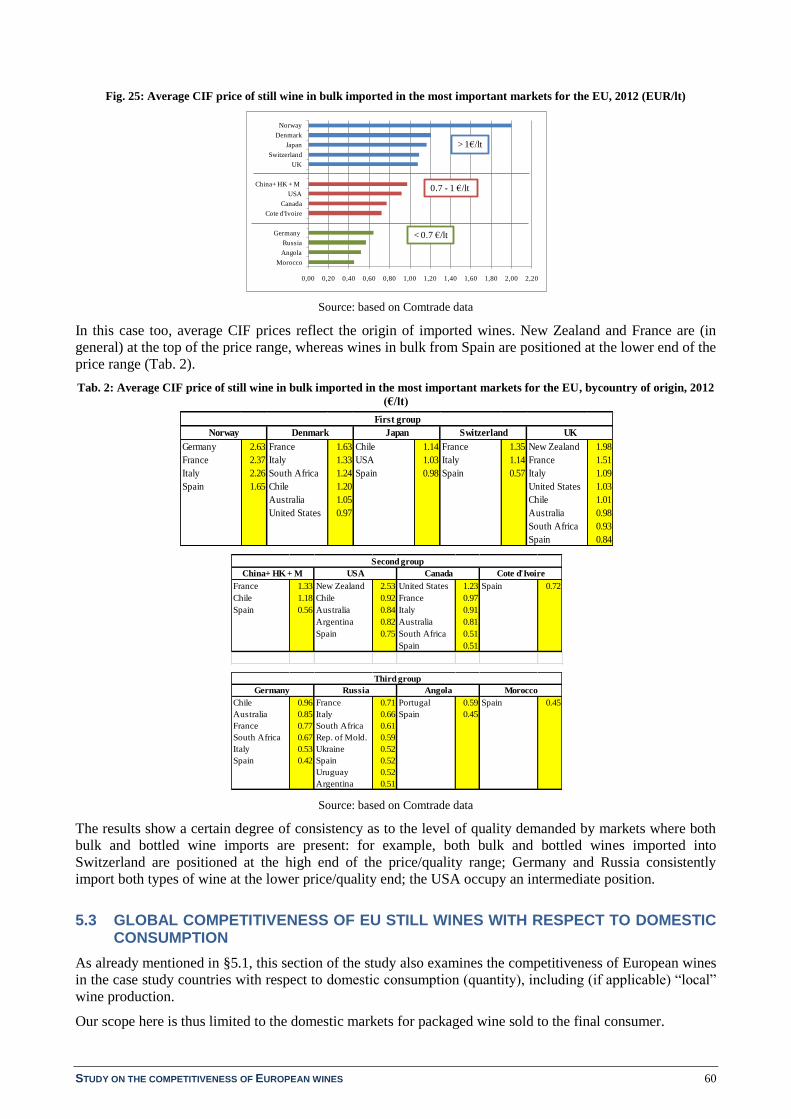
STUDY ON THE COMPETITIVENESS OF EUROPEAN WINES 60
Fig. 25: Average CIF price of still wine in bulk imported in the most important markets for the EU, 2012 (EUR/lt)
Source: based on Comtrade data
In this case too, average CIF prices reflect the origin of imported wines. New Zealand and France are (in
general) at the top of the price range, whereas wines in bulk from Spain are positioned at the lower end of the
price range (Tab. 2).
Tab. 2: Average CIF price of still wine in bulk imported in the most important markets for the EU, bycountry of origin, 2012
(€/lt)
Source: based on Comtrade data
The results show a certain degree of consistency as to the level of quality demanded by markets where both
bulk and bottled wine imports are present: for example, both bulk and bottled wines imported into
Switzerland are positioned at the high end of the price/quality range; Germany and Russia consistently
import both types of wine at the lower price/quality end; the USA occupy an intermediate position.
5.3 GLOBAL COMPETITIVENESS OF EU STILL WINES WITH RESPECT TO DOMESTIC CONSUMPTION
As already mentioned in §5.1, this section of the study also examines the competitiveness of European wines
in the case study countries with respect to domestic consumption (quantity), including (if applicable) “local”
wine production.
Our scope here is thus limited to the domestic markets for packaged wine sold to the final consumer.
0,00 0,20 0,40 0,60 0,80 1,00 1,20 1,40 1,60 1,80 2,00 2,20
Morocco
Angola
Russia
Germany
Cote d'Ivoire
Canada
USA
China+ HK + M
UK
Switzerland
Japan
Denmark
Norway
> 1€/lt
0.7 - 1 €/lt
< 0.7 €/lt
Germany 2.63 France 1.63 Chile 1.14 France 1.35 New Zealand 1.98
France 2.37 Italy 1.33 USA 1.03 Italy 1.14 France 1.51
Italy 2.26 South Africa 1.24 Spain 0.98 Spain 0.57 Italy 1.09
Spain 1.65 Chile 1.20 United States 1.03
Australia 1.05 Chile 1.01
United States 0.97 Australia 0.98
South Africa 0.93
Spain 0.84
First group
Norway Denmark Japan Switzerland UK
France 1.33 New Zealand 2.53 United States 1.23 Spain 0.72
Chile 1.18 Chile 0.92 France 0.97
Spain 0.56 Australia 0.84 Italy 0.91
Argentina 0.82 Australia 0.81
Spain 0.75 South Africa 0.51
Spain 0.51
Second group
China+ HK + M USA Canada Cote d'Ivoire
Chile 0.96 France 0.71 Portugal 0.59 Spain 0.45
Australia 0.85 Italy 0.66 Spain 0.45
France 0.77 South Africa 0.61
South Africa 0.67 Rep. of Mold. 0.59
Italy 0.53 Ukraine 0.52
Spain 0.42 Spain 0.52
Uruguay 0.52
Argentina 0.51
Germany Russia Angola Morocco
Third group

STUDY ON THE COMPETITIVENESS OF EUROPEAN WINES 61
The analysis in this part of the study is based on IWSR data relative to consumption of packaged wines by
country of origin and “domestic” wine in the case study country markets (China+Hong Kong, Russia, Japan,
United States among non-EU countries; Denmark, Germany and United Kingdom among EU Member
States).
IWSR data refer solely to consumption in terms of volume (data on value are not available).
Once again, it is necessary to stress that “domestic” wine is not necessarily made with local grapes.
Production is often the result of blending wines made from local grapes and wines imported in bulk (thus,
also imported from other EU countries), or wines that are imported in bulk, then bottled locally and marketed
under the bottler’s or distributor’s name (e.g. large-scale retail chains) without indication of the wine origin.
Therefore, the importance of European wines (but also wines of other origin) in the domestic consumption of
the examined countries is systematically underestimated.
With regard to Germany and the UK, data on consumption of “local” wine have been considered together
with “EU import” data (as these too are EU wines).
5.3.1 Domestic consumption of still wine in the case study markets
Before illustrating the results of the analysis, and with a view to put the results into context, it is necessary to
show domestic consumption trends in the analysed countries (Fig. 26). For all countries, the consumption
level for the year 2000 was set at 100.
Fig. 26: Packaged still wines consumption trends in the case study markets, 2000=100
Source: IWSR
Domestic consumption trends show:
remarkable growth in wine consumption in China (and Hong Kong), mostly satisfied by an equally
remarkable growth of Chinese “domestic” production;
large growth of consumption in Russia between 2005 and 2007-08, followed by substantial stability;
steady growth of consumption in the United States;
substantially stable consumption in Germany and Denmark;
decline in consumption in the UK since 2008 and recovery of consumption in Japan, after a period of
decline, again since 2008.
5.3.2 Consumption market shares of EU wines in the case study markets
The map in Fig. 27 shows the market shares of EU wines in 2000 and 2013 (including wines of all price
ranges and all packaging types).
Country markets position above the diagonal indicates an increase in the market share between the two years,
and vice versa, positioning below the diagonal indicates a loss of market share in 2013 compared to 2000.
50
100
150
200
250
300
350
400
450
500
20
00
20
01
20
02
20
03
20
04
20
05
20
06
20
07
20
08
20
09
20
10
20
11
20
12
20
13
Hong Kong
China
50
75
100
125
150
175
200
20
00
20
01
20
02
20
03
20
04
20
05
20
06
20
07
20
08
20
09
20
10
20
11
20
12
20
13
USA
UK
Russia
Japan
Germany
Denmark

STUDY ON THE COMPETITIVENESS OF EUROPEAN WINES 62
Fig. 27: EU wine market shares, 2000 and 2013 (% on total still wine consumption)
Source: Cogea (based on IWSR data)
The map shows three groups of countries:
In the lower part of the map a group of countries (China, Russia and United States) where domestic
consumption is mostly met by “local” wine production, and the part of consumption satisfied by imports
(including EU imports) is generally modest. In greater detail, “local” production satisfies:
- 99.1% of domestic consumption in 2000, down to 81.2% in 2013, in China;
- 75.6% in 2000, down to 57% in 2013, in Russia;
- 80.1% in 2000, down to 74.7% in 2013, in the US.
At the other extreme we find Germany, where (partly due to consumption of domestic wines) EU wines
satisfy the near totality of domestic demand (93.2% in 2000, down to 89.2% in 2013).
In the centre we find the group of countries that produce little or no wine at all.
Between 2000 and 2013 there was a rise in the market share of EU wines for domestic consumption in China
and Russia, with an equivalent fall in Hong Kong, UK and, most of all, Denmark.
In the other countries (USA, Japan and Germany), the situation remained more stable (very slight
improvement or deterioration).
5.3.3 Global EU wine competitiveness with respect to domestic consumption in the case study markets
To assess the competitiveness of EU wines in the consumer markets of the case study countries, we applied
the same methodology used to analyse competitiveness in export and import markets. In this case, the
indicators (calculated in the same way) are defined as “EU consumption variation” and “EU consumption
market share variation”.
The presence of “local” production in some of the examined country markets required to modify the
approach. Specifically, in addition to consumption of wines imported from the EU and from the other
international competitors, the graphs in Fig. 28 also include consumption of domestic wine. The “EU
consumption variation” and “EU consumption market share variation” indicators were obtained by
comparing EU wines with all other wines (local + imported from non-EU countries).
The two graphs in Fig. 28 show the aggregate result for all case study markets considered together.
Total consumption of still wines grew on average by +3.1% per year in volume. Within this growth, we
observe that:
The rate of growth in consumption of wines imported from the EU (1.1% per year on average) is lower
than that of wine imported from the rest of the world (4.9% per year on average) and lower than
consumption of “local” wines (4.7%). These growth rate differences, applied to very similar initial
consumption volumes (EU wines on the one hand and local + imports from non-EU countries, on the
other) lead to a gradual decrease in Consumption Variation.
Chi US
Rus
Jap UKHKDen
Ger
Total
0
10
20
30
40
50
60
70
80
90
100
0 10 20 30 40 50 60 70 80 90 100
EU
co
nsi
mp
tio
n m
ark
et
sha
re 2
01
3
(%)
EU consumption market share 2000 (%)
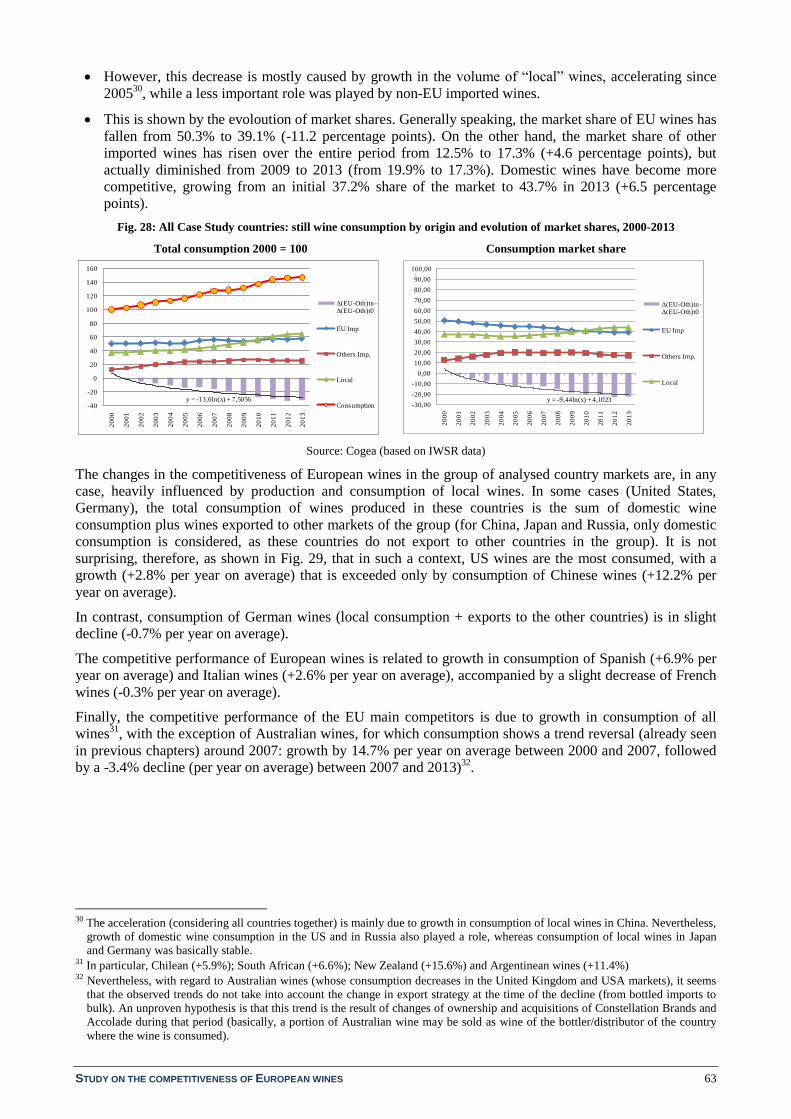
STUDY ON THE COMPETITIVENESS OF EUROPEAN WINES 63
However, this decrease is mostly caused by growth in the volume of “local” wines, accelerating since
200530
, while a less important role was played by non-EU imported wines.
This is shown by the evoloution of market shares. Generally speaking, the market share of EU wines has
fallen from 50.3% to 39.1% (-11.2 percentage points). On the other hand, the market share of other
imported wines has risen over the entire period from 12.5% to 17.3% (+4.6 percentage points), but
actually diminished from 2009 to 2013 (from 19.9% to 17.3%). Domestic wines have become more
competitive, growing from an initial 37.2% share of the market to 43.7% in 2013 (+6.5 percentage
points).
Fig. 28: All Case Study countries: still wine consumption by origin and evolution of market shares, 2000-2013
Total consumption 2000 = 100 Consumption market share
Source: Cogea (based on IWSR data)
The changes in the competitiveness of European wines in the group of analysed country markets are, in any
case, heavily influenced by production and consumption of local wines. In some cases (United States,
Germany), the total consumption of wines produced in these countries is the sum of domestic wine
consumption plus wines exported to other markets of the group (for China, Japan and Russia, only domestic
consumption is considered, as these countries do not export to other countries in the group). It is not
surprising, therefore, as shown in Fig. 29, that in such a context, US wines are the most consumed, with a
growth (+2.8% per year on average) that is exceeded only by consumption of Chinese wines (+12.2% per
year on average).
In contrast, consumption of German wines (local consumption + exports to the other countries) is in slight
decline (-0.7% per year on average).
The competitive performance of European wines is related to growth in consumption of Spanish (+6.9% per
year on average) and Italian wines (+2.6% per year on average), accompanied by a slight decrease of French
wines (-0.3% per year on average).
Finally, the competitive performance of the EU main competitors is due to growth in consumption of all
wines31
, with the exception of Australian wines, for which consumption shows a trend reversal (already seen
in previous chapters) around 2007: growth by 14.7% per year on average between 2000 and 2007, followed
by a -3.4% decline (per year on average) between 2007 and 2013)32
.
30 The acceleration (considering all countries together) is mainly due to growth in consumption of local wines in China. Nevertheless,
growth of domestic wine consumption in the US and in Russia also played a role, whereas consumption of local wines in Japan
and Germany was basically stable. 31 In particular, Chilean (+5.9%); South African (+6.6%); New Zealand (+15.6%) and Argentinean wines (+11.4%) 32 Nevertheless, with regard to Australian wines (whose consumption decreases in the United Kingdom and USA markets), it seems
that the observed trends do not take into account the change in export strategy at the time of the decline (from bottled imports to
bulk). An unproven hypothesis is that this trend is the result of changes of ownership and acquisitions of Constellation Brands and
Accolade during that period (basically, a portion of Australian wine may be sold as wine of the bottler/distributor of the country
where the wine is consumed).
y = -13,6ln(x) + 7,5056-40
-20
0
20
40
60
80
100
120
140
160
20
00
20
01
20
02
20
03
20
04
20
05
20
06
20
07
20
08
20
09
20
10
20
11
20
12
20
13
Δ(EU-Oth)tn -Δ(EU-Oth)t0
EU Imp
Others Imp.
Local
Consumptiony = -9,44ln(x) + 4,1023
-30,00
-20,00
-10,00
0,00
10,00
20,00
30,00
40,00
50,00
60,00
70,00
80,00
90,00
100,00
20
00
20
01
20
02
20
03
20
04
20
05
20
06
20
07
20
08
20
09
20
10
20
11
20
12
20
13
Δ(EU-Oth)tn -Δ(EU-Oth)t0
EU Imp
Others Imp.
Local

STUDY ON THE COMPETITIVENESS OF EUROPEAN WINES 64
Fig. 29: Consumption of still wines from main EU competitors in the group of case study country markets, 2000-2013 (hl)
Wine consumption of case study countries that are wine
producers
Wine consumption of main EU Member States
Consumption of wines from countries that are main EU competitors
Source: IWSR
5.3.3.1 Synthesis of the results
Fig. 30 shows the competitive position of European wines in the case study consumer markets, overall and
by individual market.
The results show that, over the considered years, EU wines find themselves in a rather critical situation with
competitiveness having decreased significantly. With the exception of Russia (where the wine embargo
imposed to Moldova between 2005 and 2007 generated a sizeable advantage for EU wines), in all other
countries the competitive position of EU wines worsened, only slightly in China, USA, Germany and Japan
(the first two with slightly positive developments in market share) and more significantly in Denmark, Hong
Kong and the UK.
Fig. 30: Map of competitiveness of EU versus non-EU still wines with respect to consumption in the case study markets
Source: Cogea (based on IWSR data)
Nevertheless, in this case too some aspects tend to mitigate this scenario. A more detailed analysis of
Consumption variation and Market Share variation trends shows indeed that:
with regard to Russia (as already reported in §5.2.7.3) the big improvement in the competitive position
of EU wines was obtained between 2005 and 2007 and stability afterwards. Therefore, in the last years
0
50000
100000
150000
200000
250000
300000
20
00
20
01
20
02
20
03
20
04
20
05
20
06
20
07
20
08
20
09
20
10
20
11
20
12
20
13
US
Chinese
Russian
German
Japanese
0
50000
100000
150000
200000
250000
300000
20
00
20
01
20
02
20
03
20
04
20
05
20
06
20
07
20
08
20
09
20
10
20
11
20
12
20
13
French
Italian
Spanish
0
50000
100000
150000
200000
250000
300000
20
00
20
01
20
02
20
03
20
04
20
05
20
06
20
07
20
08
20
09
20
10
20
11
20
12
20
13
Argentinian
Australian
Chilean
New Zealand
South African
Chi
Den
Ger
HK
Jap
Rus
UK
US
Total
-40,00
-30,00
-20,00
-10,00
0,00
10,00
20,00
30,00
-120 -100 -80 -60 -40 -20 0 20
Reg
r. C
oeff
. M
ark
et
Sh
are v
aria
tio
n
Regr. coeff. consumption variation

STUDY ON THE COMPETITIVENESS OF EUROPEAN WINES 65
of the interval, the position of EU wines on the map with respect to the Russian market ought to move
towards the origin of the axes (i.e. indicating reached stability).
With regard to Denmark, Hong Kong and the United Kingdom, the loss of competitiveness of European
wines occurred quite quickly between 2000 and 2008-2009. Subsequently, the competitiveness
improved substantially in all three countries in a similar way. Therefore, in the last years of the
considered interval, the position of EU wines in these three countries ought to move towards the origin
of the axes.
5.3.4 Price/quality competitive positioning of EU wines compared to competitors in the consumer markets
This section of the study aims to assess the competitiveness of price/quality positioning of EU wines in
comparison with wines of all other competitors (local and non-EU countries) in the same consumer markets
(i.e. case study countries). The analysis is based on IWSR consumer price data (see survey method in the box
below).
IWSR methodology for price data collection
Price data are collected through store checks conducted in each of the countries surveyed by the IWSR. Prices are
usually collected in the largest supermarkets. In big consumer countries, they are collected in 3 to 5 stores, mostly from
super- or hyper-markets, and if need be, from specialist stores. In smaller consumer countries, prices are likely to be
collected in 1 or 2 stores.
The IWSR tries to visit the same stores each year to provide some degree of consistency. The provided prices reflect the
lowest non-promotional price found for a brand. No pricing information is available for the on-trade sector - due to the
very wide range of prices, as well as the problems of collecting them.
Prices are published in local currencies and for the typical wine bottle size used in the country of interest. In all cases,
unless otherwise specified, this is 75cl.
It should be noted that consumer prices are subject to significant differences depending on fiscal policy and
taxation applied by different country markets (see §5.5.6). These differences have been highlighted through
specific price analysis for the same brands in the different country markets. The results of this preliminary
analysis help the interpretation of results of subsequent analysis; therefore, they are shown first.
The analysis is carried out in subsequent steps:
a. Prices recorded for each country (and in total) were grouped into five ranges for bottled wine (0.75lt)
and four ranges for wines sold in other containers (large bottles, bag-in-box, bricks).
b. The distribution of products across the price ranges was examined.
c. Finally, the frequency of wine products from different countries of origin within each price range was
calculated.
With regard to the number of products, we considered all brands present in the country markets between
2010 and 2013, in order to have a broader database than that available for one year only. We calculated the
average price for brands appearing in two or more years in the same country market.
The database was thus constructed as shown in Tab. 3:
Tab. 3: Number of products per country market, total and by type of packaging
Source: IWSR
Total Bottles 0,75 lt Others packages
China 592 589 3
Denmark 431 377 54
Germany 885 801 84
Hong Kong 356 351 5
Japan 293 278 15
Russia 713 631 82
United Kingdom 659 630 29
United States 1,613 1,472 141
Total 5,542 5,129 413

STUDY ON THE COMPETITIVENESS OF EUROPEAN WINES 66
5.3.4.1 Brand prices in the case study markets
From the IWSR database we identified the same brands and types of wine present in all case study markets
and sold through retail channels. Consumer prices vary greatly from country to country, in general ranging
from the highest prices in China to the lowest in Germany.
The price hierarchy is not always the same, though (Fig. 31). It is evident that price variation depends to a
large extent on the application of taxes and duties (high in China, only VAT in Germany), but also on
different pricing choices of importers/distributors in different countries (choices influenced by numerous
factors – see in following §6.2.5).
Accordingly, segmentation by price range is only possible for individual countries (price ranges are not
comparable across markets) and it is not appropriate to aggregate results at “total average” level.
Fig. 31: Prices of selected brands in the case study markets (EUR/lt)
Source: based on IWSR data
5.3.4.2 Price segmentation of wine products
As previously mentioned, the first part of the analysis consisted in calculating product frequencies by price
range. All prices were converted into Euro/litre.
With regard to 0.75 lt bottles, we considered the following price ranges:
With regard to wines sold in other larger containers (from 1.5lt to 5lt) the following ranges were considered:
The graphs below show the distribution of products (of all origins) by price range for still wines sold in
0.75lt bottles (Fig. 32) and in other types of container (Fig. 33), by country/market.
0,0
10,0
20,0
30,0
40,0
50,0
60,0
70,0
80,0
Ch
i
US
A
Jap
Den
UK
Ger
Ch
i
Jap
Ru
s
Den
UK
Ger
Ch
i
H-K
US
A
Ru
s
Den
UK
Ger
Ch
i
US
A
Ru
s
Den
Ger
Ch
i
H-K
US
A
Jap
Ru
s
Den
UK
Ger
Cloudy Bay Concha y Toro Sunrise Faustino VII Frascati Yellowtail
Comm. Premium Super Premium Ultra Premium
≤ 4.99 €/lt 5.00 - 9.99 €/lt 10.00 - 14.99 €/lt 15.00-49.99 €/lt 50.00 €/lt and more
Entry Level
Medium Range
Top Range
less than 3 €/lt
from 3 to 4.9 € /lt
from 5 to 9.9 €/lt
10 €/lt and more

STUDY ON THE COMPETITIVENESS OF EUROPEAN WINES 67
Fig. 32: Percentage distribution of wines in 0.75 lt bottles by price range in the case study markets
Source: based on IWSR data
Fig. 33: Percentage distribution of wines packaged in large size bottles, brick and Bag-in-box by price range in the case study
markets
Source: based on IWSR data
Bearing in mind the existence of different taxation systems in the examined countries, observation of the
distribution of products by price range leads to the following remarks:
With regard to packaging type, price differences are considerable. For 0.75 lt bottles, 93% of wines are
priced above 5 €/lt, while for other types of packaging, over 60% of products are positioned in the
ranges below 5 Euro/lt (with 30% below 3 Euro/litre). No product packaged in large size container
exceeds 15 Euro/litre. This provides confirmation, therefore, that packaging types other than 0.75 lt
bottles play a role in differentiating wines positioning according to price/quality.
With regard to differences between country markets in the price positioning of bottled wines, two
extremes can be observed: on the one end we find China, where over 70% of products are positioned in
the higher price ranges (Ultra Premium + Top Range); on the other end is Germany, where the largest
number of products are positioned in the lower price ranges (65% at Entry level + Commercial
Premium; over 26% in the Entry level range alone).
With regard to differences between country markets in the price positioning of wines in larger size
containers, we find the United Kingdom on one extreme, with 93% of products positioned in the ranges
above 5 Euro/lt and again Germany on the other end, where over 96% of products are positioned below
5 Euro/litre33
.
33 In Germany about 60% of wines are purchased in Hard Discount stores. In addition to very low taxation, this helps explain such
low consumer price of wines in this country.
0 10 20 30 40 50 60 70 80 90 100
China
Hong Kong
Russia
Japan
United States
Denmark
Germany
United Kingdom
Entry Level
Comm. Premium
Super Premium
Ultra Premium
Top Range
0 10 20 30 40 50 60 70 80 90 100
Denmark
Germany
Japan
Russia
United Kingdom
United States
less than 3 €/lt
from 3 to 4.9 € /lt
from 5 to 9.9 €/lt
10 €/lt and more
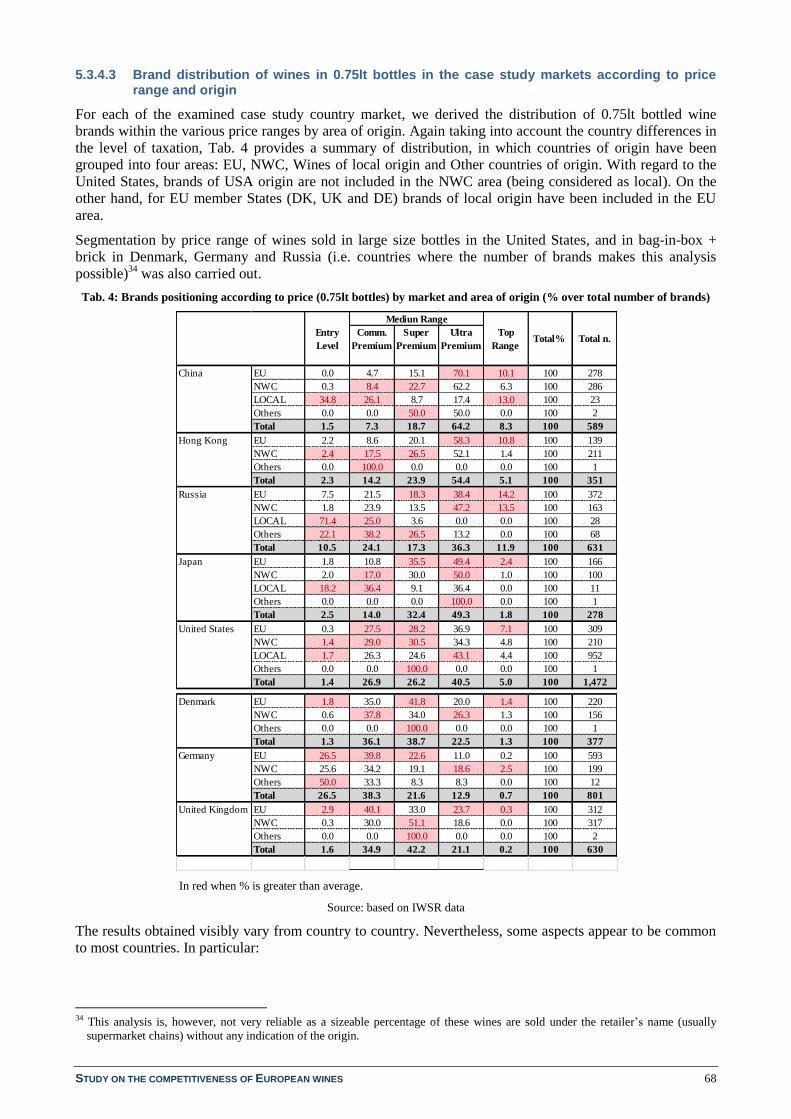
STUDY ON THE COMPETITIVENESS OF EUROPEAN WINES 68
5.3.4.3 Brand distribution of wines in 0.75lt bottles in the case study markets according to price range and origin
For each of the examined case study country market, we derived the distribution of 0.75lt bottled wine
brands within the various price ranges by area of origin. Again taking into account the country differences in
the level of taxation, Tab. 4 provides a summary of distribution, in which countries of origin have been
grouped into four areas: EU, NWC, Wines of local origin and Other countries of origin. With regard to the
United States, brands of USA origin are not included in the NWC area (being considered as local). On the
other hand, for EU member States (DK, UK and DE) brands of local origin have been included in the EU
area.
Segmentation by price range of wines sold in large size bottles in the United States, and in bag-in-box +
brick in Denmark, Germany and Russia (i.e. countries where the number of brands makes this analysis
possible)34
was also carried out.
Tab. 4: Brands positioning according to price (0.75lt bottles) by market and area of origin (% over total number of brands)
In red when % is greater than average.
Source: based on IWSR data
The results obtained visibly vary from country to country. Nevertheless, some aspects appear to be common
to most countries. In particular:
34 This analysis is, however, not very reliable as a sizeable percentage of these wines are sold under the retailer’s name (usually
supermarket chains) without any indication of the origin.
Comm.
Premium
Super
Premium
Ultra
Premium
China EU 0.0 4.7 15.1 70.1 10.1 100 278
NWC 0.3 8.4 22.7 62.2 6.3 100 286
LOCAL 34.8 26.1 8.7 17.4 13.0 100 23
Others 0.0 0.0 50.0 50.0 0.0 100 2
Total 1.5 7.3 18.7 64.2 8.3 100 589
Hong Kong EU 2.2 8.6 20.1 58.3 10.8 100 139
NWC 2.4 17.5 26.5 52.1 1.4 100 211
Others 0.0 100.0 0.0 0.0 0.0 100 1
Total 2.3 14.2 23.9 54.4 5.1 100 351
Russia EU 7.5 21.5 18.3 38.4 14.2 100 372
NWC 1.8 23.9 13.5 47.2 13.5 100 163
LOCAL 71.4 25.0 3.6 0.0 0.0 100 28
Others 22.1 38.2 26.5 13.2 0.0 100 68
Total 10.5 24.1 17.3 36.3 11.9 100 631
Japan EU 1.8 10.8 35.5 49.4 2.4 100 166
NWC 2.0 17.0 30.0 50.0 1.0 100 100
LOCAL 18.2 36.4 9.1 36.4 0.0 100 11
Others 0.0 0.0 0.0 100.0 0.0 100 1
Total 2.5 14.0 32.4 49.3 1.8 100 278
United States EU 0.3 27.5 28.2 36.9 7.1 100 309
NWC 1.4 29.0 30.5 34.3 4.8 100 210
LOCAL 1.7 26.3 24.6 43.1 4.4 100 952
Others 0.0 0.0 100.0 0.0 0.0 100 1
Total 1.4 26.9 26.2 40.5 5.0 100 1,472
Denmark EU 1.8 35.0 41.8 20.0 1.4 100 220
NWC 0.6 37.8 34.0 26.3 1.3 100 156
Others 0.0 0.0 100.0 0.0 0.0 100 1
Total 1.3 36.1 38.7 22.5 1.3 100 377
Germany EU 26.5 39.8 22.6 11.0 0.2 100 593
NWC 25.6 34.2 19.1 18.6 2.5 100 199
Others 50.0 33.3 8.3 8.3 0.0 100 12
Total 26.5 38.3 21.6 12.9 0.7 100 801
United Kingdom EU 2.9 40.1 33.0 23.7 0.3 100 312
NWC 0.3 30.0 51.1 18.6 0.0 100 317
Others 0.0 0.0 100.0 0.0 0.0 100 2
Total 1.6 34.9 42.2 21.1 0.2 100 630
Total% Total n.Entry
Level
Top
Range
Mediun Range
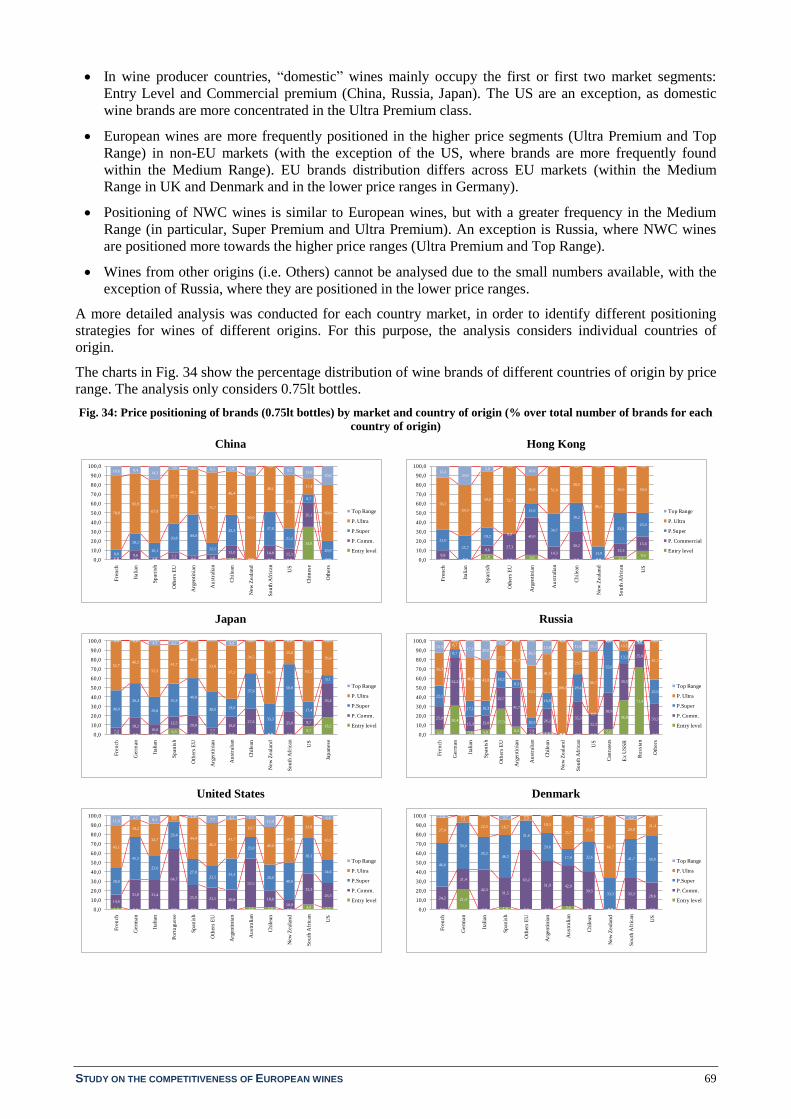
STUDY ON THE COMPETITIVENESS OF EUROPEAN WINES 69
In wine producer countries, “domestic” wines mainly occupy the first or first two market segments:
Entry Level and Commercial premium (China, Russia, Japan). The US are an exception, as domestic
wine brands are more concentrated in the Ultra Premium class.
European wines are more frequently positioned in the higher price segments (Ultra Premium and Top
Range) in non-EU markets (with the exception of the US, where brands are more frequently found
within the Medium Range). EU brands distribution differs across EU markets (within the Medium
Range in UK and Denmark and in the lower price ranges in Germany).
Positioning of NWC wines is similar to European wines, but with a greater frequency in the Medium
Range (in particular, Super Premium and Ultra Premium). An exception is Russia, where NWC wines
are positioned more towards the higher price ranges (Ultra Premium and Top Range).
Wines from other origins (i.e. Others) cannot be analysed due to the small numbers available, with the
exception of Russia, where they are positioned in the lower price ranges.
A more detailed analysis was conducted for each country market, in order to identify different positioning
strategies for wines of different origins. For this purpose, the analysis considers individual countries of
origin.
The charts in Fig. 34 show the percentage distribution of wine brands of different countries of origin by price
range. The analysis only considers 0.75lt bottles.
Fig. 34: Price positioning of brands (0.75lt bottles) by market and country of origin (% over total number of brands for each
country of origin)
China Hong Kong
Japan Russia
United States Denmark
0,0 0,0 0,0 0,0 0,0 0,0 1,4 0,0 0,0 0,0
34,8
0,01,89,6
1,87,7
3,7 5,6
13,0
0,0
14,8 12,1
26,1
0,0
8,8
18,1
16,1
30,844,4
12,1
33,3
0,0
37,0
21,2
8,7
20,0
78,8
63,9
67,9
57,7
48,1
75,7
46,4
90,0
48,1
57,6
17,4
60,0
10,6 8,414,3
3,8 3,7 6,5 5,810,0
0,09,1
13,020,0
0,0
10,0
20,0
30,0
40,0
50,0
60,0
70,0
80,0
90,0
100,0
Fre
nch
Ital
ian
Sp
an
ish
Oth
ers
EU
Arg
enti
nia
n
Au
stra
lian
Ch
ilea
n
New
Zea
lan
d
So
uth
Afr
ican
US
Ch
ines
e
Oth
ers
Top Range
P. Ultra
P.Super
P. Comm.
Entry level
0,0 0,05,8
0,05,0
0,0 0,0 0,0 3,39,49,8
0,0
9,627,3
40,0
14,3
30,2
0,0
13,3
15,622,0
25,7
19,20,0
15,0
34,7
30,2
13,9
33,325,0
56,1
54,3
59,6 72,7
30,0 51,0
39,5
86,1
50,0 50,0
12,220,0
5,80,0
10,0
0,0 0,0 0,0 0,0 0,0
0,0
10,0
20,0
30,0
40,0
50,0
60,0
70,0
80,0
90,0
100,0
Fre
nch
Ital
ian
Sp
anis
h
Oth
ers
EU
Arg
en
tin
ian
Au
str
ali
an
Ch
ilea
n
New
Zea
lan
d
So
uth
Afr
ican
US
Top Range
P. Ultra
P.Super
P. Commercial
Entry level
0,0 0,0 0,06,3
0,0 0,0 0,0 0,0 0,0 0,08,7
18,2
7,3
18,210,6
12,520,0
7,7
19,027,6
0,0
25,0 8,7
36,4
40,0
36,4
29,8
35,440,0
38,5 19,0
37,9
33,3
50,0
17,4
9,1
52,745,5
55,3
41,7
40,0
53,8
57,1
34,5
66,7
25,0
65,2
36,4
0,0 0,04,3 4,2
0,04,8
0,0 0,0 0,0 0,0 0,0
0,0
10,0
20,0
30,0
40,0
50,0
60,0
70,0
80,0
90,0
100,0
Fre
nch
Ger
man
Ital
ian
Sp
an
ish
Oth
ers
EU
Arg
enti
nia
n
Au
str
ali
an
Ch
ilea
n
New
Zea
lan
d
So
uth
Afr
ican
US
Jap
anes
e
Top Range
P. Ultra
P.Super
P. Comm.
Entry level5,1
30,4
3,6 5,0
27,3
8,30,0 1,5 0,0 0,0 0,0
5,6
36,8
71,4
0,0
25,0
52,2
15,3 15,0
22,7
41,7
7,9
26,2
0,0
35,3
22,2
38,9
39,5
25,0
33,3
22,1
8,7
17,1 16,3
18,2
8,3
10,5
16,9
0,0
29,4
0,0
55,6
13,2
3,6
25,0
35,3
8,7
46,8 43,8
27,341,7
55,3
41,5
100,0
23,5
66,7
0,0
10,5
0,0
41,7
12,5
0,0
17,1 20,0
4,50,0
26,3
13,8
0,0
11,8 11,1
0,0 0,0 0,0 0,0
0,0
10,0
20,0
30,0
40,0
50,0
60,0
70,0
80,0
90,0
100,0
Fre
nch
Ger
man
Ital
ian
Sp
an
ish
Oth
ers
EU
Arg
enti
nia
n
Au
stra
lian
Ch
ilea
n
New
Zea
lan
d
So
uth
Afr
ican
US
Cau
casu
s
Ex
US
SR
Ru
ssia
n
Oth
ers
Top Range
P. Ultra
P.Super
P. Comm.
Entry level
1,2 0,0 0,0 0,0 0,0 0,0 0,0 1,6 2,0 0,04,8 1,7
14,6
31,8 31,4
64,7
25,9 23,1 20,8
52,5
18,0
10,0
33,3
26,3
28,0
45,5
25,6
29,4
27,8
23,133,3
23,0
28,040,0
38,1
24,6
45,1
18,2
34,7
5,9
44,4
46,2
41,7
19,7
40,0
50,0
23,8
43,1
11,04,5 8,3
0,0 1,97,7 4,2 3,3
12,0
0,0 0,04,4
0,0
10,0
20,0
30,0
40,0
50,0
60,0
70,0
80,0
90,0
100,0
Fre
nch
Ger
man
Ital
ian
Po
rtu
gues
e
Sp
anis
h
Oth
ers
EU
Arg
en
tin
ian
Au
stra
lian
Ch
ilea
n
New
Zea
lan
d
So
uth
Afr
ican
US
Top Range
P. Ultra
P.Super
P. Comm.
Entry level
0,0
21,4
0,0 1,9 0,0 0,0 3,6 0,0 0,0 0,0 0,0
24,2
21,4
42,331,5
63,2
51,9 42,9
39,5
0,0
33,328,6
46,8
50,0
35,246,3
31,6
29,6
17,9 32,6
33,3
41,7 50,0
27,4
7,1
22,5 16,7
5,3
18,5
35,725,6
66,7
20,821,4
1,6 0,0 0,0 3,7 0,0 0,0 0,0 2,3 0,04,2
0,0
0,0
10,0
20,0
30,0
40,0
50,0
60,0
70,0
80,0
90,0
100,0
Fre
nch
Ger
man
Ital
ian
Sp
anis
h
Oth
ers
EU
Arg
enti
nia
n
Au
stra
lian
Ch
ilea
n
New
Zea
lan
d
So
uth
Afr
ican
US
Top Range
P. Ultra
P.Super
P. Comm.
Entry level
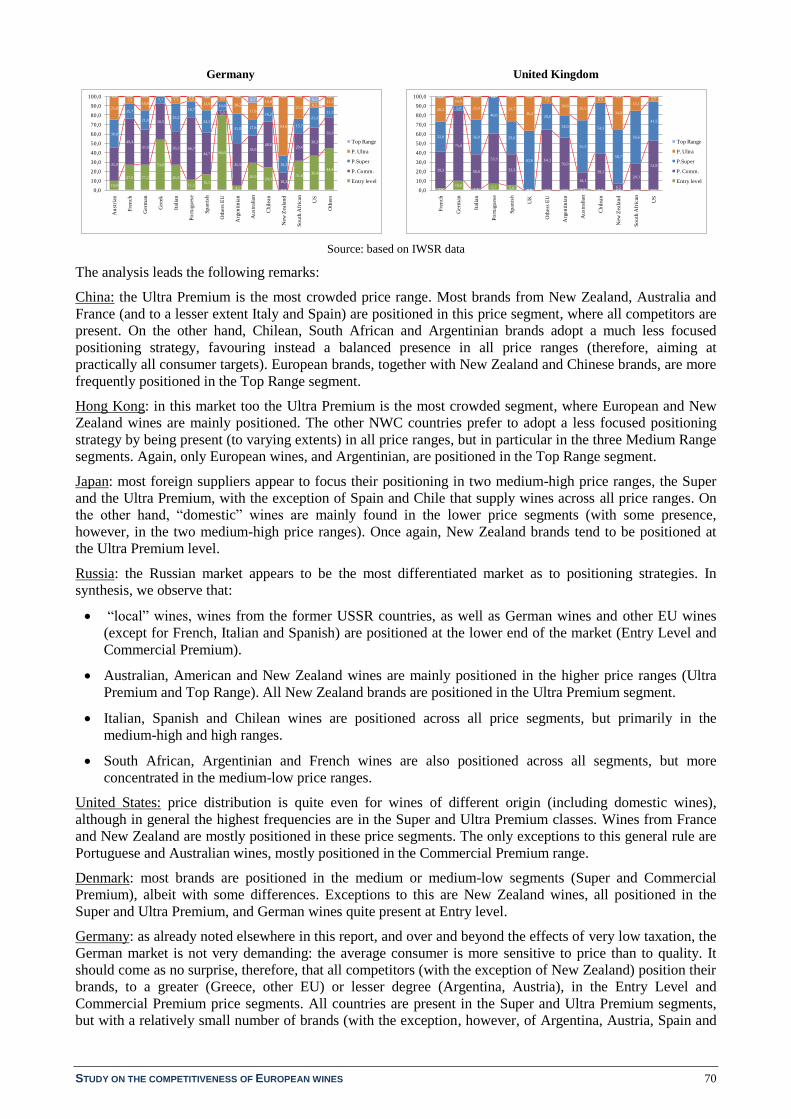
STUDY ON THE COMPETITIVENESS OF EUROPEAN WINES 70
Germany United Kingdom
Source: based on IWSR data
The analysis leads the following remarks:
China: the Ultra Premium is the most crowded price range. Most brands from New Zealand, Australia and
France (and to a lesser extent Italy and Spain) are positioned in this price segment, where all competitors are
present. On the other hand, Chilean, South African and Argentinian brands adopt a much less focused
positioning strategy, favouring instead a balanced presence in all price ranges (therefore, aiming at
practically all consumer targets). European brands, together with New Zealand and Chinese brands, are more
frequently positioned in the Top Range segment.
Hong Kong: in this market too the Ultra Premium is the most crowded segment, where European and New
Zealand wines are mainly positioned. The other NWC countries prefer to adopt a less focused positioning
strategy by being present (to varying extents) in all price ranges, but in particular in the three Medium Range
segments. Again, only European wines, and Argentinian, are positioned in the Top Range segment.
Japan: most foreign suppliers appear to focus their positioning in two medium-high price ranges, the Super
and the Ultra Premium, with the exception of Spain and Chile that supply wines across all price ranges. On
the other hand, “domestic” wines are mainly found in the lower price segments (with some presence,
however, in the two medium-high price ranges). Once again, New Zealand brands tend to be positioned at
the Ultra Premium level.
Russia: the Russian market appears to be the most differentiated market as to positioning strategies. In
synthesis, we observe that:
“local” wines, wines from the former USSR countries, as well as German wines and other EU wines
(except for French, Italian and Spanish) are positioned at the lower end of the market (Entry Level and
Commercial Premium).
Australian, American and New Zealand wines are mainly positioned in the higher price ranges (Ultra
Premium and Top Range). All New Zealand brands are positioned in the Ultra Premium segment.
Italian, Spanish and Chilean wines are positioned across all price segments, but primarily in the
medium-high and high ranges.
South African, Argentinian and French wines are also positioned across all segments, but more
concentrated in the medium-low price ranges.
United States: price distribution is quite even for wines of different origin (including domestic wines),
although in general the highest frequencies are in the Super and Ultra Premium classes. Wines from France
and New Zealand are mostly positioned in these price segments. The only exceptions to this general rule are
Portuguese and Australian wines, mostly positioned in the Commercial Premium range.
Denmark: most brands are positioned in the medium or medium-low segments (Super and Commercial
Premium), albeit with some differences. Exceptions to this are New Zealand wines, all positioned in the
Super and Ultra Premium, and German wines quite present at Entry level.
Germany: as already noted elsewhere in this report, and over and beyond the effects of very low taxation, the
German market is not very demanding: the average consumer is more sensitive to price than to quality. It
should come as no surprise, therefore, that all competitors (with the exception of New Zealand) position their
brands, to a greater (Greece, other EU) or lesser degree (Argentina, Austria), in the Entry Level and
Commercial Premium price segments. All countries are present in the Super and Ultra Premium segments,
but with a relatively small number of brands (with the exception, however, of Argentina, Austria, Spain and
10,0
27,0 27,2
53,8
26,8
11,116,5
80,0
4,5
28,924,3
0,0
31,436,4
44,4
35,0
49,4
37,0
38,5
36,3 66,7
44,7
5,0
45,5
28,9
48,6
18,2
29,4
30,3
33,330,0
15,7
21,0
7,7
29,2
16,7
24,3
10,0
31,8 17,8
16,2
18,2
15,7
21,2
11,125,0
7,914,8
7,7 5,6
13,6
5,0
18,2
17,8
10,8
63,6
23,56,1
11,1
0,0 0,0 0,0 0,0 0,0 1,0 0,0 0,06,7
0,0 0,0 0,06,1
0,0
0,0
10,0
20,0
30,0
40,0
50,0
60,0
70,0
80,0
90,0
100,0
Au
str
ian
Fre
nch
Ger
man
Gre
ek
Ital
ian
Po
rtu
gues
e
Sp
anis
h
Oth
ers
EU
Arg
enti
nia
n
Au
stra
lian
Ch
ilea
n
New
Zea
lan
d
So
uth
Afr
ican
US
Oth
ers
Top Range
P. Ultra
P.Super
P. Comm.
Entry level
1,610,0
1,56,7 5,0
0,0 0,0 0,0 1,1 0,0 0,0 0,0 0,0
39,3
75,0
36,8
53,3
33,3
0,0
64,356,0
18,1
39,1
6,5
28,3
52,8
32,0
5,0
36,8
40,0
35,0
63,6
28,6
24,0
55,3
54,3
58,7
56,6
41,5
26,2
10,0
25,0
0,0
26,736,4
7,1
20,025,5
6,5
34,8
15,15,7
0,8 0,0 0,0 0,0 0,0 0,0 0,0 0,0 0,0 0,0 0,0 0,0 0,0
0,0
10,0
20,0
30,0
40,0
50,0
60,0
70,0
80,0
90,0
100,0
Fre
nch
Ger
man
Ital
ian
Po
rtu
gues
e
Sp
an
ish
UK
Oth
ers
EU
Arg
en
tin
ian
Au
str
ali
an
Ch
ilea
n
New
Zea
lan
d
So
uth
Afr
ican
US
Top Range
P. Ultra
P.Super
P. Comm.
Entry level

STUDY ON THE COMPETITIVENESS OF EUROPEAN WINES 71
Italy). Finally, the Top Range segment counts a negligible number of wines, exclusively from Australia and
the US.
United Kingdom: wine brands from Germany, Portugal, Argentina and United States (and from other
European countries excluding France, Italy and Spain) are positioned in the medium-low (Commercial
Premium) and/or low (Entry Level) segments. On the other hand, wines from New Zealand, Australia and
South Africa are positioned in the medium-high market segments (Super and Ultra Premium). The brands of
the main European wine producers (France, Italy and Spain) have adopted a more balanced strategy, being
mainly present in the medium range segments. Finally, the Top Range segment is basically absent in the UK
market (only one French brand).
To conclude, it appears appropriate to mention two significant cases:
The first is that of French wines: it appears that the positioning strategy for these wines varies
significantly from market to market (positioning in the high price ranges in China and Hong Kong,
medium or medium-low ranges in Russia, Denmark and Germany).
The second relates to New Zealand wines: in all cases these wines are positioned in the Super and Ultra
Premium segments, with the only exception of Germany, where they are in the Commercial Premium.
5.3.5 Competitiveness of EU still wines in the online retail channel
This part of the analysis is based on wine market data collected through a survey of online retailers in the
case study countries (Web checks – see §2.5.4)
To evaluate the results of this survey, we have to take into account that product assortments vary quite
significantly across the examined online stores: from a minimum of 225 still wines in the Chinese Everwines
store, to a maximum of over 3,700 wines in the case of the American Wine.com. The range width affects
brand positioning in the market: more orientated to a specific consumer target in the first case (Everwines)
and more "generalist" in the second case (Wine.com).
However, the online sales channel generally is orientated to a target of consumers in the middle/middle-
upper socio-economic classes, relatively demanding in terms of quality and more likely to seek "cultural” or
"symbolic” values associated with the product.
It is not surprising, therefore, that the survey results present important differences, compared to the results
obtained from other data sources, in particular the IWSR.
However, although web check results are not statistically representative, they do represent the orientation of
market players operating in a relatively innovative distribution channel, which is growing in most case study
countries according to what indicated by the interviews35
.
5.3.5.1 Still wine assortment by country of origin in the online stores
Notwithstanding the differences in the size of product assortment across the surveyed online retailers, Fig. 35
shows the composition of the assortment according to wine origin, from the EU and from the rest of the
world.
In all cases, European wines exceed 50% of the product assortment, with the only obvious exceptions of the
American and the British Web-stores. In the Japanese Enoteca, the Russian Wine Butik and the German
Edeka, European wines represents over 80% of the assortment.
35 See case study monographs.

STUDY ON THE COMPETITIVENESS OF EUROPEAN WINES 72
Fig. 35: Percentage of EU and non-EU still wines in the product assortment of online retailers
Source: Web check
Further detail is provided in the following table.
Tab. 5: Composition of wine assortment by country of origin in the online stores
In red shares >10%
Source: Web-checks
The results presented in Tab. 5 show that:
In terms of wine assortment by country of origin, the Danish Salling offers the smallest (wine from 9
countries, of which 3 are European), while the Russian Wine Butik sells wines from 23 countries
altogether, 9 of which are European);
French and Italian wines are those most represented, in all cases exceeding 10% of the total assortment:
62% of wines sold by Enoteca are French, and 30% of wines sold by Wine Butik are Italian;
0% 10% 20% 30% 40% 50% 60% 70% 80% 90% 100%
Edeka (DE)
Tesco(UK)
Everwines (CN)
Salling (DK)
Enoteca(JP)
Wine Butik(RU)
Wine.com(USA)
EU Total
Non EU Total
Unknown
Edeka
(DE)
Tesco
(UK)
Everwines
(CN)
Salling
(DK)
Enoteca
(JP)
Wine Butik
(RU)
Wine.com
(USA)
EU Austria 2.7 3.5 0.1
Bulgaria 0.2
Croatia
France 10.8 17.4 20.4 36.8 62.9 34.5 19.3
Germany 41.3 2.3 1.2 1.0 0.8 0.7
Greece 0.2 0.2 0.1
Hungary 0.3 0.4 0.3 0.0
Italy 13.3 12.2 16.5 21.2 17.5 30.9 12.7
Portugal 0.6 1.1 0.4 1.5 0.3
Romania 0.1
Spain 11.7 8.5 13.7 9.9 2.2 9.9 6.1
United Kingdom 1.5
EU Total 80.4 43.6 52.5 67.8 83.7 81.7 39.4
Non EU Argentina 2.1 2.6 2.4 0.2 1.7 2.0 4.0
Australia 3.9 20.3 18.0 10.7 1.6 2.8 6.7
Canada 0.1
Caucasus 0.0
Chile 4.2 8.0 7.1 5.1 4.4 4.4 4.8
China 4.7
Israel 0.2 0.5 0.2
Japan 1.0 0.2
Lebanon 0.1
Mexico 0.5
New Zealand 1.2 3.9 1.2 6.1 1.7 1.5 1.8
Russia 0.3
South Africa 3.9 9.4 3.5 5.0 0.5 2.6 1.5
Switzerland 0.6 0.1
United States 3.6 10.1 8.6 5.0 5.5 2.5 42.2
Uruguay 2.0
West Balkans 0.3
Non EU Total 19.6 54.5 47.5 32.2 16.3 18.2 60.6
Unknown 2.0
Total % 100.0 100.0 100.0 100.0 100.0 100.0 100.0
Total N. 332 615 225 457 1,876 1,794 3,764

STUDY ON THE COMPETITIVENESS OF EUROPEAN WINES 73
Australian wines account for over 10% of the assortment in three stores only (Tesco, Everwines and
Salling), while American wines are (obviously) better represented in the US online store (over 42%),
but also in Tesco (10%).
5.3.5.2 Price segmentation in the online wine stores
Bottled wine prices collected through Web checks were transformed into Euro/litre and grouped by segment,
using the same criteria adopted in §5.3.4.2.
Table 6 shows the results of the analysis.
Tab. 6: Still wines distribution by price segment and country of origin in online stores
In red shares> 40%
Source: Web-checks
The analysis of the results, keeping in mind that prices are affected by the tax regimes applied in different
countries, shows that:
The distribution of wines by price segment is completely different from the distribution of market prices
sourced from IWSR. This confirms what was said previously about online stores being more up-market;
There is a substantial difference between the the German and British retail chains online stores (Tesco
and Edeka) and the other Web stores that only specialise in online sales.
Wines sold online by Tesco and Edeka are mostly positioned in the lower price ranges (from Entry level
to Super premium, in a way quite similar to what found for the UK and Germany in the analysis of
IWSR data). Wines sold by the more wine-specialised online stores are mostly positioned at the higher
price ranges (Ultra Premium and Top Range).
Therefore, online stores that are unrelated to the major retail chains are more likely to target higher
socio-economic classes. The Chinese Everwines represents an extreme case in this sense, with virtually
no wine positioned at the low and medium price ranges (but also with the smallest product assortment).
In all cases, European wines are the most represented in the Top Range, with a maximum of 65% in the
case of Enoteca. Again Tesco and Edeka are exceptions, as they have virtually no wines positioned in
the Top range segment;
In all cases, wines from the rest of the world are the most represented in the Super Premium and Ultra
Premium ranges.
Origin Entry levelCommercial
Premium
Super
premium
Ultra
premiumTop Range Total n.
EU 1.2% 31.7% 40.9% 26.2% 0.0% 252
Non EU 0.0% 26.0% 46.3% 27.6% 0.0% 315
Unknown 0.0% 45.5% 45.5% 9.1% 0.0% 11
Total n. 3 167 254 154 0.0% 578
EU 4.9% 71.2% 16.5% 6.4% 1.1% 267
Non EU 16.9% 40.1% 30.8% 12.3% 0.0% 65
Total n. 24 216 64 25 3 332
EU 0.0% 0.0% 0.7% 50.7% 48.5% 134
Non EU 0.0% 0.8% 5.8% 51.2% 42.1% 121
Total n. 0 1 8 130 116 255
EU 0.0% 0.1% 1.7% 32.8% 65.4% 1570
Non EU 0.0% 0.0% 6.9% 65.4% 27.8% 306
Total 0 2 47 715 1112 1876
EU 0.0% 1.6% 11.0% 50.6% 36.8% 310
Non EU 0.0% 2.7% 21.8% 57.1% 18.4% 147
Total 0 9 66 241 141 457
EU 0.0% 2.2% 13.6% 50.1% 34.0% 1482
Non EU 0.0% 2.7% 18.3% 57.7% 21.3% 2282
Total 0 94 620 2060 990 3764
EU 0.1% 0.3% 2.3% 39.4% 58.0% 1565
Non EU 0.3% 0.9% 7.4% 60.7% 30.8% 351
Total 2 7 62 829 1016 1916
Wine.com
(USA)
Wine Butik
(Russia)
Tesco
(UK)
Edeka
(Germany)
Everwines
(China)
Enoteca
(Japan)
Salling
(Denmark)
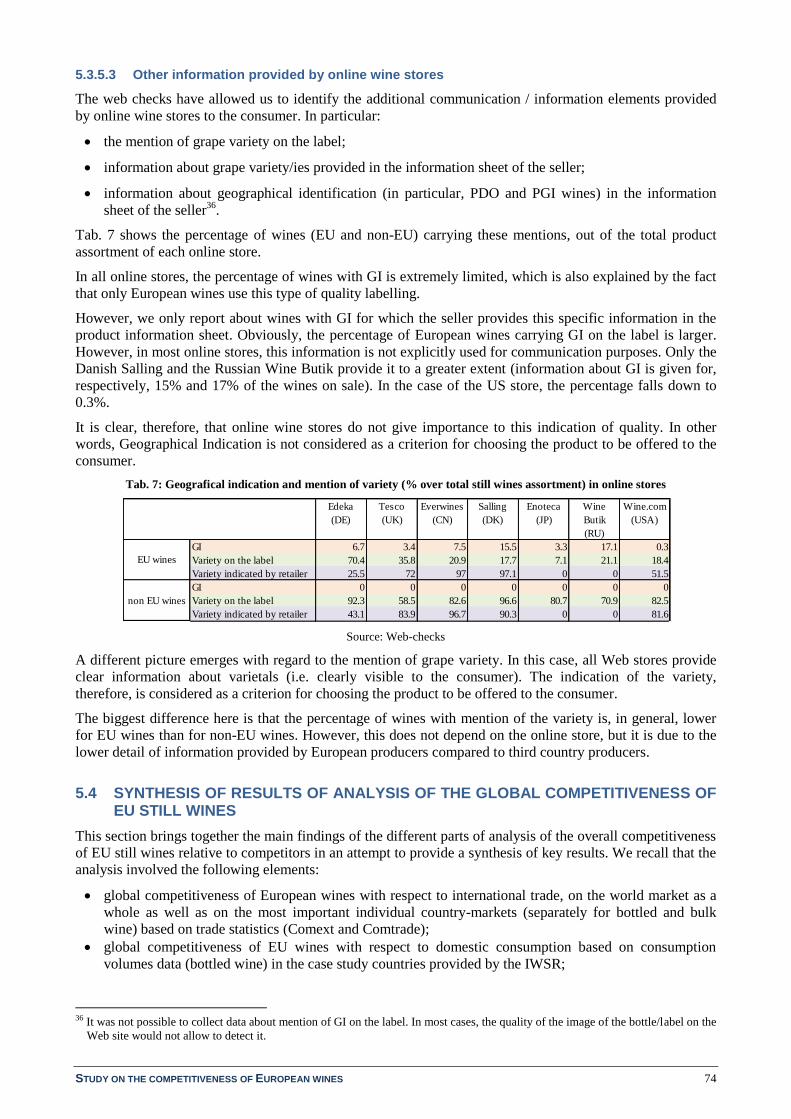
STUDY ON THE COMPETITIVENESS OF EUROPEAN WINES 74
5.3.5.3 Other information provided by online wine stores
The web checks have allowed us to identify the additional communication / information elements provided
by online wine stores to the consumer. In particular:
the mention of grape variety on the label;
information about grape variety/ies provided in the information sheet of the seller;
information about geographical identification (in particular, PDO and PGI wines) in the information
sheet of the seller36
.
Tab. 7 shows the percentage of wines (EU and non-EU) carrying these mentions, out of the total product
assortment of each online store.
In all online stores, the percentage of wines with GI is extremely limited, which is also explained by the fact
that only European wines use this type of quality labelling.
However, we only report about wines with GI for which the seller provides this specific information in the
product information sheet. Obviously, the percentage of European wines carrying GI on the label is larger.
However, in most online stores, this information is not explicitly used for communication purposes. Only the
Danish Salling and the Russian Wine Butik provide it to a greater extent (information about GI is given for,
respectively, 15% and 17% of the wines on sale). In the case of the US store, the percentage falls down to
0.3%.
It is clear, therefore, that online wine stores do not give importance to this indication of quality. In other
words, Geographical Indication is not considered as a criterion for choosing the product to be offered to the
consumer.
Tab. 7: Geografical indication and mention of variety (% over total still wines assortment) in online stores
Source: Web-checks
A different picture emerges with regard to the mention of grape variety. In this case, all Web stores provide
clear information about varietals (i.e. clearly visible to the consumer). The indication of the variety,
therefore, is considered as a criterion for choosing the product to be offered to the consumer.
The biggest difference here is that the percentage of wines with mention of the variety is, in general, lower
for EU wines than for non-EU wines. However, this does not depend on the online store, but it is due to the
lower detail of information provided by European producers compared to third country producers.
5.4 SYNTHESIS OF RESULTS OF ANALYSIS OF THE GLOBAL COMPETITIVENESS OF EU STILL WINES
This section brings together the main findings of the different parts of analysis of the overall competitiveness
of EU still wines relative to competitors in an attempt to provide a synthesis of key results. We recall that the
analysis involved the following elements:
global competitiveness of European wines with respect to international trade, on the world market as a
whole as well as on the most important individual country-markets (separately for bottled and bulk
wine) based on trade statistics (Comext and Comtrade);
global competitiveness of EU wines with respect to domestic consumption based on consumption
volumes data (bottled wine) in the case study countries provided by the IWSR;
36 It was not possible to collect data about mention of GI on the label. In most cases, the quality of the image of the bottle/label on the
Web site would not allow to detect it.
Edeka
(DE)
Tesco
(UK)
Everwines
(CN)
Salling
(DK)
Enoteca
(JP)
Wine
Butik
(RU)
Wine.com
(USA)
GI 6.7 3.4 7.5 15.5 3.3 17.1 0.3
Variety on the label 70.4 35.8 20.9 17.7 7.1 21.1 18.4
Variety indicated by retailer 25.5 72 97 97.1 0 0 51.5
GI 0 0 0 0 0 0 0
Variety on the label 92.3 58.5 82.6 96.6 80.7 70.9 82.5
Variety indicated by retailer 43.1 83.9 96.7 90.3 0 0 81.6
EU wines
non EU wines

STUDY ON THE COMPETITIVENESS OF EUROPEAN WINES 75
price competitiveness (FOB and CIF implicit prices based on trade values and volumes) as well as the
price/quality positioning of EU wines compared to main competitors (based on IWSR store-check data
relative to price of wines sold by retail chains);
competitiveness of European wines in the online retail channel based on Web check data.
Table 8 below provides a synthetic judgment for each examined dimension of competitiveness.
Tab. 8: Synthesis of results of analysis of the overall competitiveness of EU still wines relative to competitors
“+” means competitive advantage for EU wines; “-“ means competitive disadvantage for EU wines
Source: Cogea
Global competitiveness of EU still wines with respect to international trade
Between 2000 and 2012/2013 EU wines improved their overall competitive position in the world market in
value terms, while maintaining it in volume terms, despite an overall loss of market shares (in value and
volume). This result is, however, generated by opposite trends: enhanced competitive performance of bottled
wines (both in value and volume terms) versus worsened performance of bulk wine exports. Such trends
occurred in a context of unfavourable exchange rates for Europe: gradual devaluation of main competitors’
currencies relative to the Euro. As price is a crucial factor for bulk wine trade, exchange rates have had a
relatively larger impact on the competitive performance of bulk wines compared to bottled wines.
EU still wines mostly lost market share to main competitors on the world market between 2000-2005/06.
Afterwards, the EU market share stabilised around 68% in value and 65% in volume. From 2007 EU total
wine exports increased, whereas NWC exports grew until 2007 and stabilised in subsequent years. The
analysis shows that from 2007 onwards, a strategy change takes place with gradual substitution of bottled
wine with bulk wine exports by some NWC: Australia, USA, South Africa and New Zealand.
Global competitiveness of EU still wines with respect to domestic consumption
The results of this part of the analysis suggest that the competitive position of EU still wines worsened in all
considered countries, except Russia37
. The deterioration of the EU competitive position relative to
competitors is only slight in China, the US, Germany and Japan, and more significant in Denmark, Hong
Kong and the UK. However, in the latter markets, the competitive position of EU wines improves again after
2008/09.
The apparent contradiction with the results of the previous analysis is caused by use of different types of
data: in the first case, trade statistics for bottled and bulk wine; in the second case, market data relative to
consumed volumes of bottled wine, which, however, include “local” wines that may contain wine imported
in bulk from other countries.
Price/quality competitive positioning of EU still wines
EU price/NWC price is >1 for bottled wine and <1 for bulk wine in nearly all considered years (2000-2012),
suggesting that EU bottled wines are better quality than the competitors’ (but with NWC almost evening out
towards the end of the period) and, vice versa, wines exported in bulk are of lower quality.
New Zealand and France record the highest prices (both bottled and bulk); Spain records one of the lowest
price, remarkably decreasing in the case of bottled wine exports in the years following the wine CMO
reform. Thus, within the EU different price/quality positioning strategies are implemented.
37 We recall, however, that in this market EU wines gained competitive advantage between 2005 and 2007 in reason of the embargo
imposed by Russia on Moldova.
Bottles Bulk
Global competitiveness of EU wines in the world market + -
Global competitiveness in the 10 most important import markets + -
Price/quality competitive position of EU wines + -
Global competitiveness of EU wines with respect to domestic consumption - n.a.
Competitiveness of EU wines in the online retail channel + n.a.
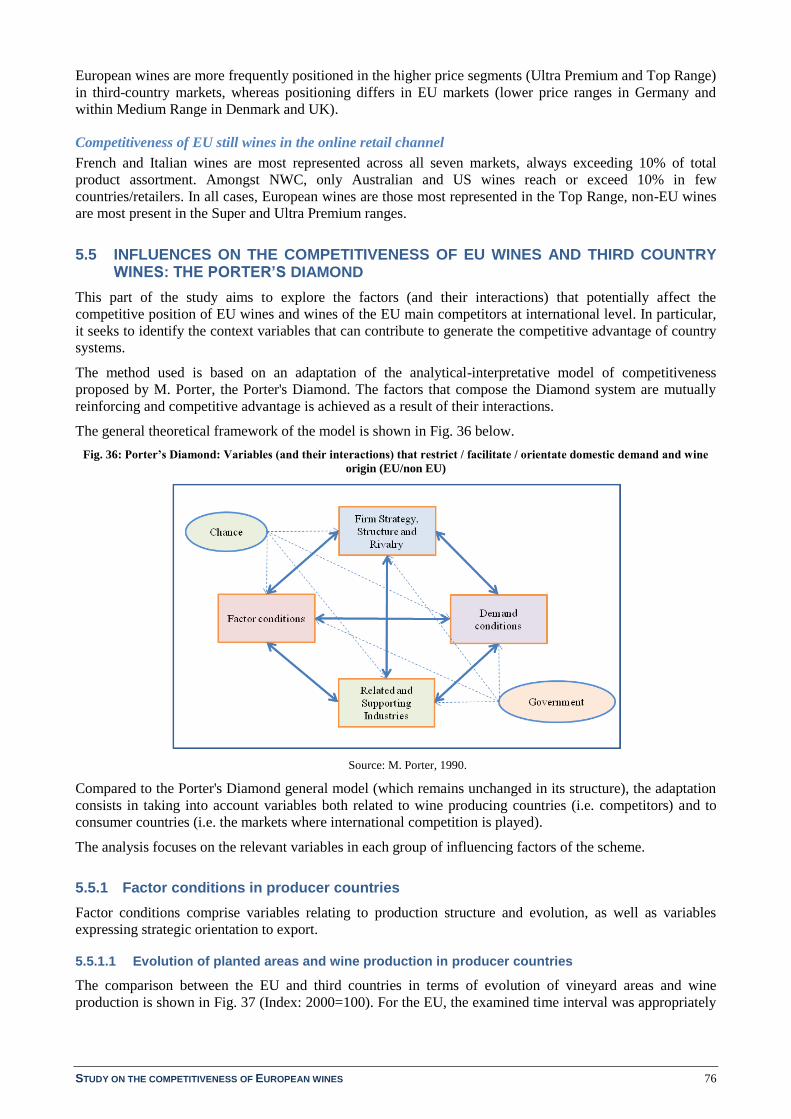
STUDY ON THE COMPETITIVENESS OF EUROPEAN WINES 76
European wines are more frequently positioned in the higher price segments (Ultra Premium and Top Range)
in third-country markets, whereas positioning differs in EU markets (lower price ranges in Germany and
within Medium Range in Denmark and UK).
Competitiveness of EU still wines in the online retail channel
French and Italian wines are most represented across all seven markets, always exceeding 10% of total
product assortment. Amongst NWC, only Australian and US wines reach or exceed 10% in few
countries/retailers. In all cases, European wines are those most represented in the Top Range, non-EU wines
are most present in the Super and Ultra Premium ranges.
5.5 INFLUENCES ON THE COMPETITIVENESS OF EU WINES AND THIRD COUNTRY WINES: THE PORTER’S DIAMOND
This part of the study aims to explore the factors (and their interactions) that potentially affect the
competitive position of EU wines and wines of the EU main competitors at international level. In particular,
it seeks to identify the context variables that can contribute to generate the competitive advantage of country
systems.
The method used is based on an adaptation of the analytical-interpretative model of competitiveness
proposed by M. Porter, the Porter's Diamond. The factors that compose the Diamond system are mutually
reinforcing and competitive advantage is achieved as a result of their interactions.
The general theoretical framework of the model is shown in Fig. 36 below.
Fig. 36: Porter’s Diamond: Variables (and their interactions) that restrict / facilitate / orientate domestic demand and wine
origin (EU/non EU)
Source: M. Porter, 1990.
Compared to the Porter's Diamond general model (which remains unchanged in its structure), the adaptation
consists in taking into account variables both related to wine producing countries (i.e. competitors) and to
consumer countries (i.e. the markets where international competition is played).
The analysis focuses on the relevant variables in each group of influencing factors of the scheme.
5.5.1 Factor conditions in producer countries
Factor conditions comprise variables relating to production structure and evolution, as well as variables
expressing strategic orientation to export.
5.5.1.1 Evolution of planted areas and wine production in producer countries
The comparison between the EU and third countries in terms of evolution of vineyard areas and wine
production is shown in Fig. 37 (Index: 2000=100). For the EU, the examined time interval was appropriately

STUDY ON THE COMPETITIVENESS OF EUROPEAN WINES 77
divided into sub-periods to show the successive enlargements of the EU (to 25 and then to 27 Member
States). The analysis also considers China and Brazil among wine producers.
Fig. 37: Evolution of vineyard areas and total wine production, 2000-2012/13 (2000 = 100)
Evolution of vineyard areas in 9 third countries Evolution of wine production in 9 third countries
Evolution of vineyard areas in the EU and 9 third countries Evolution of wine production in the EU and 9 third
countries
Sources : national statistics, FAO, Communications of Members states and DG Agri C.3 for EU
The following considerations emerge from analysis of the trends:
Despite enlargement to new wine producing MS, both planted area and wine production of the EU
decrease. From 2006 onwards (EU 27) planted area decreases at a rate of -2.1% on average per year
(from 3.64 to 3.21 million ha) and production by -1.4% (from179 to 171 million hl). The less important
decrease in wine production compared to vineyard areas is due to exceptional production in 201338
).
The reduction of planted areas is also strongly affected by the implementation of the grubbing-up
scheme (between 2008 and 2011, about 73% of the decrease in the EU planted area is due to the
implementation of this measure)39
;
In the group of 9 main competitors considered together (Argentina, New Zealand, Canada, Chile, USA,
South Africa, Australia, China, Brazil), vineyard area and wine production have been steadily growing
at a rate of, respectively, 2.34% (from 1.51 to 1.71 million ha) and 3.07% (from 77.7 to 92.8 million hl)
since 2006;
Therefore, the gap existing between the EU and the 9 competitors (both planted areas and production) at
the beginning of the period has progressively reduced over time;
Among EU competitors, New Zealand and China are the most dynamic (New Zealand has more than
tripled areas and quadrupled production);
Chile appears less dynamic in terms of surface growth, but more in terms of wine production (i.e.
considerable growth of yields per hectare);
38 In 2013, the remarkable growth of the EU wine production is mainly due to Spain (from 34 to 50 million hl between 2012 and
2013), also as a result of the restructuring of vineyards (irrigation, transformation of planting systems) implemented thanks to the
wine CMO funds. 39 About 160,000 ha over a total decrease of 219,000 ha (see the “Evaluation of Common Agricultural Policy measures applied to the
wine sector” – COGEA, October 2012).
50
100
150
200
250
300
350
400
20
00
20
01
20
02
20
03
20
04
20
05
20
06
20
07
20
08
20
09
20
10
20
11
20
12
Argentina
New Zealand
Canada
Chile
United States
South Africa
Australia
China
Brazil
0,0
50,0
100,0
150,0
200,0
250,0
300,0
350,0
400,0
450,0
20
00
20
01
20
02
20
03
20
04
20
05
20
06
20
07
20
08
20
09
20
10
20
11
20
12
20
13
Argentina
New Zealand
Canada
Chile
United States
South Africa
Australia
China
Brazil
90,0
95,0
100,0
105,0
110,0
115,0
120,0
125,0
130,0
135,0
140,0
20
00
20
01
20
02
20
03
20
04
20
05
20
06
20
07
20
08
20
09
20
10
20
11
20
12
Tot 9 competitors
EU
EU 27EU 25
EU 15
80,0
90,0
100,0
110,0
120,0
130,0
140,0
150,0
20
00
20
01
20
02
20
03
20
04
20
05
20
06
20
07
20
08
20
09
20
10
20
11
20
12
20
13
Tot 9 competitors
EU

STUDY ON THE COMPETITIVENESS OF EUROPEAN WINES 78
In contrast, the United States maintains virtually unchanged the planted area existing in 2000, while
increasing production by about 20% (2013).
In order to assess the relative position of individual EU competitors and of the EU27 (thus including
Romania and Bulgaria, considerable wine producers), we compared (Fig. 38) the average annual rates of
change of planted areas and production since 2006 (2006-2012 for planted areas, 2006-2013 for wine
production).
Fig. 38: Average annual rate of change of planted areas and wine production in the EU and in competing countries (2006-
2012/13)
Sources: National statistics, FAO, Communications of Members States and DG Agri C.3 for EU
The results on the map above show that:
Only the EU 27 and Australia witness a reduction in both planted area and production, however, to a
much lesser extent in Australia and almost exclusively due to adverse climate conditions, while in the
EU as a result of policy changes (i.e. wine CMO reform: grubbing-up and vineyard restructuring);
South Africa decreases planted areas, but increases production (strong increase in yields). Conversely,
in Argentina the planted surface increases, but production decreases;
All other countries witness an increase of both areas and production, more (China, New Zealand) or less
(USA, Brazil) importantly. In general, the rise in production is higher than the increase of planted areas
(showing growth of productivity). This occurs, in particular, in China and in Chile (not in Brazil though,
where production of the new vineyards is probably not yet fully operational) 40
.
On the basis of these results, the following considerations can be made for the future:
From a structural and production perspective, it is likely that in the near future the EU will face pressure
from its competitors considered altogether. The growth rates of planted areas, yields per hectare and
thus wine production are likely to lead to better satisfaction of domestic demand (China, Brazil) and/or
to further erosion of EU market shares (New Zealand, Chile and South Africa);
Assuming that current trends are maintained, in the future the EU may face less competitive pressure
from Argentina41
and Australia42
. However, in the case of Argentina, the decline in yields per hectare
could be a sign of quality improvement. If this were the case, the competitiveness of Argentinean wines
could shift more towards Medium and Top Range wine segments.
40 However, part of wine production in China and (to a lesser extent) in the U.S. is obtained from wine imported in bulk and blended
with wine made from local grapes. 41 This occurs in spite of favourable exchange rates (see §5.5.6). 42 Accentuated by possible persistence of unfavourable exchange rates.
Argentina
New Zealand
Canada
Chile
USASouth Africa
Australia
China
Brazil
Tot 9 comp
EU 27
-4
-2
0
2
4
6
8
10
12
14
16
-4 -2 0 2 4 6 8
Vo
lum
e o
f p
ro
du
cti
on
: A
AG
R 2
0016
-13
Vineyard area: AAGR 2006-12

STUDY ON THE COMPETITIVENESS OF EUROPEAN WINES 79
5.5.1.2 Index of export propensity
This indicator highlights the existence of an export-oriented production strategy (high value of the index)
rather than a strategy aimed primarily (or exclusively) to service the domestic market (low value of the
index), for which exports represent a marginal activity. Typically, high and increasing propensity to export is
associated with aggressive market penetration (and therefore strong competitive power).
The index of propensity to export is calculated as the percentage ratio between total exports of wine in
volume (CN code 2204) in year t and total wine production in year t-1.
IPExp = (Expt /Prodt-1 ) * 100
Fig. 39 shows the values of the index calculated as two-year averages for 2001-02 e 2011-12 (average over
two years was used to eliminate fluctuations).
Fig. 39: Index of export propensity of the EU and its main competitors (average 2001-02 and 2011-12)
Sources: National statistics, DG Agri C.3 for EU, Comtrade, Comext
The obtained results allow the following observations:
New Zealand, Chile, Australia and, to a lesser extent, South Africa43
have a very high propensity to
export, which grew significantly over the considered time period. In these countries, therefore, the
growth of production is not geared to satisfy domestic demand, but almost exclusively geared to export;
China and Brazil lie at the other extreme, where almost all production is aimed at satisfying domestic
demand;
The European Union and the United States find their position in between these two extremes: i.e.
production is largely aimed for the domestic market and exports basically are a residual. For these areas,
therefore, the international market, although important, is not vital to the survival of the wine industry,
and the propensity to export is linked to the evolution of domestic demand. In addition, for these two
competitors, growth of export propensity is absolutely modest (and taking into account, for the EU, the
enlargement from 15 to 27 Member States).
On the basis of these results, the following considerations can be made for the future:
New Zealand, Chile, and South Africa (although the latter to a lesser extent) appear to have developed
an aggressive competitive strategy, with increase in export propensity linked to growth of planted areas
and, even more so, of production. In essence, for these countries, the international market has strategic
(or vital) value and therefore all possible competitive levers are put into action. It is likely that the
propensity to export of these countries (and thus their aggressive strategies) will grow further;
Australia appears to be less aggressive, as the high export propensity may decrease in the future due to
reduction of planted areas (and production), as well as the persistence of unfavourable exchange rates;
The EU and the US are the least aggressive in their export strategies, as the export market for these wine
producers is important, but not vital. However, there are differences between the two: while in the US
domestic consumption is still growing (and therefore, exports are likely to remain less important), in the
EU domestic consumption (as well as production) is in decline despite the enlargement.
43 In South Africa, however, a dramatic increase in the propensity to export between 2000 and 2007 (from 24% to 70%) was
subsequently followed by gradual reduction (from 70% to 49%).
0,0 10,0 20,0 30,0 40,0 50,0 60,0 70,0 80,0 90,0
China
Brazil
EU 15-27
USA
Argentina
South Africa
Canada
Australia
Chile
New Zealand
Aver. 2011-12
Aver. 2001-02
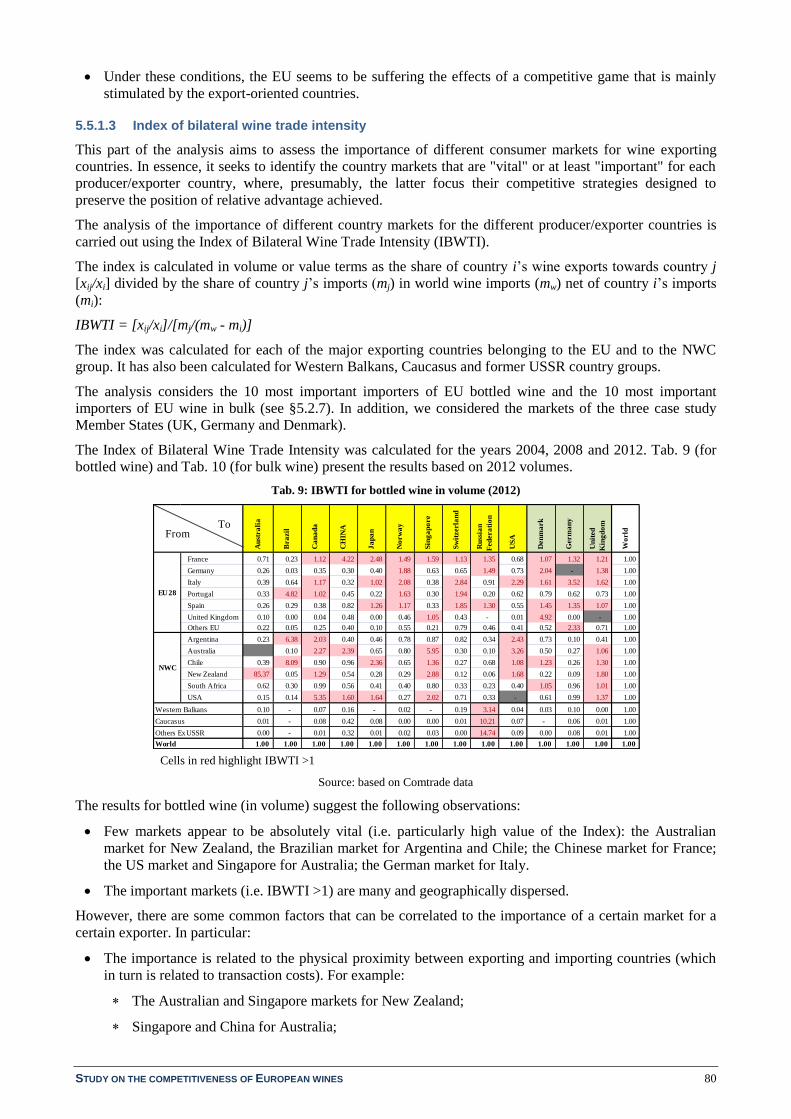
STUDY ON THE COMPETITIVENESS OF EUROPEAN WINES 80
Under these conditions, the EU seems to be suffering the effects of a competitive game that is mainly
stimulated by the export-oriented countries.
5.5.1.3 Index of bilateral wine trade intensity
This part of the analysis aims to assess the importance of different consumer markets for wine exporting
countries. In essence, it seeks to identify the country markets that are "vital" or at least "important" for each
producer/exporter country, where, presumably, the latter focus their competitive strategies designed to
preserve the position of relative advantage achieved.
The analysis of the importance of different country markets for the different producer/exporter countries is
carried out using the Index of Bilateral Wine Trade Intensity (IBWTI).
The index is calculated in volume or value terms as the share of country i’s wine exports towards country j
[xij/xi] divided by the share of country j’s imports (mj) in world wine imports (mw) net of country i’s imports
(mi):
IBWTI = [xij/xi]/[mj/(mw - mi)]
The index was calculated for each of the major exporting countries belonging to the EU and to the NWC
group. It has also been calculated for Western Balkans, Caucasus and former USSR country groups.
The analysis considers the 10 most important importers of EU bottled wine and the 10 most important
importers of EU wine in bulk (see §5.2.7). In addition, we considered the markets of the three case study
Member States (UK, Germany and Denmark).
The Index of Bilateral Wine Trade Intensity was calculated for the years 2004, 2008 and 2012. Tab. 9 (for
bottled wine) and Tab. 10 (for bulk wine) present the results based on 2012 volumes.
Tab. 9: IBWTI for bottled wine in volume (2012)
Cells in red highlight IBWTI >1
Source: based on Comtrade data
The results for bottled wine (in volume) suggest the following observations:
Few markets appear to be absolutely vital (i.e. particularly high value of the Index): the Australian
market for New Zealand, the Brazilian market for Argentina and Chile; the Chinese market for France;
the US market and Singapore for Australia; the German market for Italy.
The important markets (i.e. IBWTI >1) are many and geographically dispersed.
However, there are some common factors that can be correlated to the importance of a certain market for a
certain exporter. In particular:
The importance is related to the physical proximity between exporting and importing countries (which
in turn is related to transaction costs). For example:
The Australian and Singapore markets for New Zealand;
Singapore and China for Australia;
Au
stra
lia
Bra
zil
Ca
na
da
CH
INA
Ja
pa
n
No
rw
ay
Sin
ga
po
re
Sw
itzerla
nd
Ru
ssia
n
Fed
era
tio
n
US
A
Den
ma
rk
Germ
an
y
Un
ited
Kin
gd
om
Wo
rld
France 0.71 0.23 1.12 4.22 2.48 1.49 1.59 1.13 1.35 0.68 1.07 1.32 1.21 1.00
Germany 0.26 0.03 0.35 0.30 0.40 1.88 0.63 0.65 1.49 0.73 2.04 - 1.38 1.00
Italy 0.39 0.64 1.17 0.32 1.02 2.08 0.38 2.84 0.91 2.29 1.61 3.52 1.62 1.00
Portugal 0.33 4.82 1.02 0.45 0.22 1.63 0.30 1.94 0.20 0.62 0.79 0.62 0.73 1.00
Spain 0.26 0.29 0.38 0.82 1.26 1.17 0.33 1.85 1.30 0.55 1.45 1.35 1.07 1.00
United Kingdom 0.10 0.00 0.04 0.48 0.00 0.46 1.05 0.43 - 0.01 4.92 0.00 - 1.00
Others EU 0.22 0.05 0.25 0.40 0.10 0.55 0.21 0.79 0.46 0.41 0.52 2.33 0.71 1.00
Argentina 0.23 6.38 2.03 0.40 0.46 0.78 0.87 0.82 0.34 2.43 0.73 0.10 0.41 1.00
Australia 0.10 2.27 2.39 0.65 0.80 5.95 0.30 0.10 3.26 0.50 0.27 1.06 1.00
Chile 0.39 8.09 0.90 0.96 2.36 0.65 1.36 0.27 0.68 1.08 1.23 0.26 1.30 1.00
New Zealand 85.37 0.05 1.29 0.54 0.28 0.29 2.88 0.12 0.06 1.68 0.22 0.09 1.80 1.00
South Africa 0.62 0.30 0.99 0.56 0.41 0.40 0.80 0.33 0.23 0.40 1.05 0.96 1.01 1.00
USA 0.15 0.14 5.35 1.60 1.64 0.27 2.02 0.71 0.33 - 0.61 0.99 1.37 1.00
0.10 - 0.07 0.16 - 0.02 - 0.19 3.14 0.04 0.03 0.10 0.00 1.00
0.01 - 0.08 0.42 0.08 0.00 0.00 0.01 10.21 0.07 - 0.06 0.01 1.00
0.00 - 0.01 0.32 0.01 0.02 0.03 0.00 14.74 0.09 0.00 0.08 0.01 1.00
1.00 1.00 1.00 1.00 1.00 1.00 1.00 1.00 1.00 1.00 1.00 1.00 1.00 1.00
EU 28
NWC
Western Balkans
Others Ex USSR
World
Caucasus
ToFrom
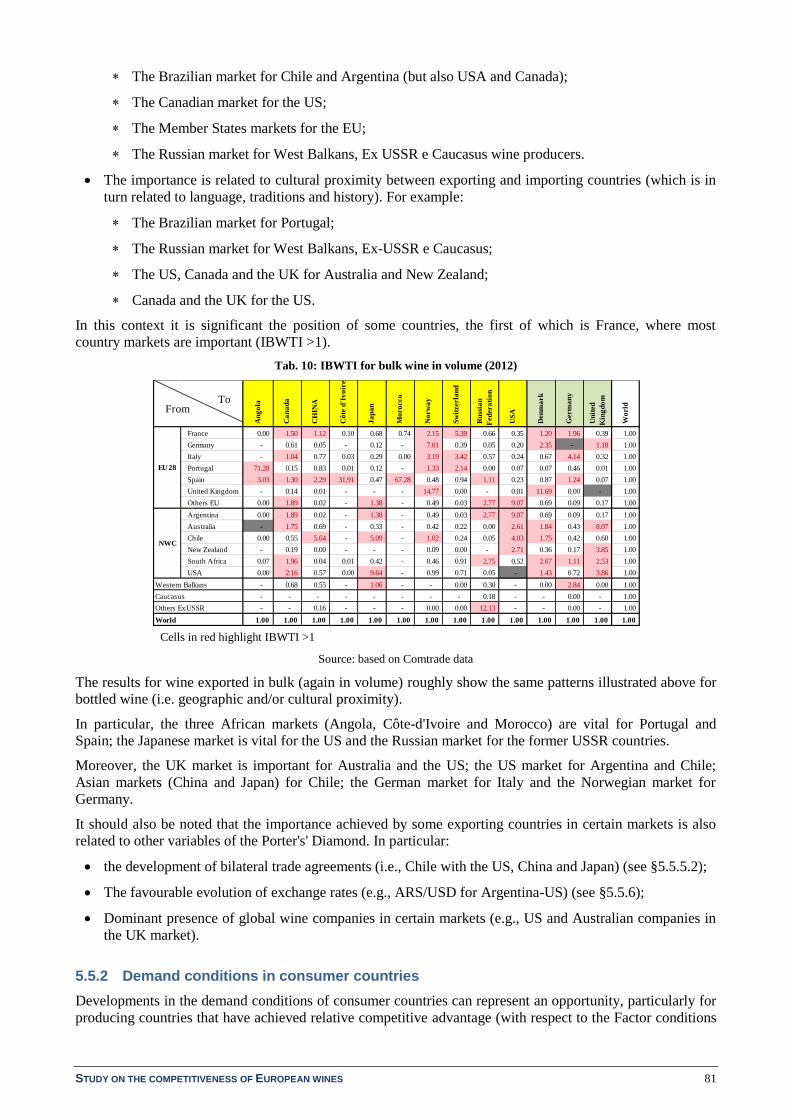
STUDY ON THE COMPETITIVENESS OF EUROPEAN WINES 81
The Brazilian market for Chile and Argentina (but also USA and Canada);
The Canadian market for the US;
The Member States markets for the EU;
The Russian market for West Balkans, Ex USSR e Caucasus wine producers.
The importance is related to cultural proximity between exporting and importing countries (which is in
turn related to language, traditions and history). For example:
The Brazilian market for Portugal;
The Russian market for West Balkans, Ex-USSR e Caucasus;
The US, Canada and the UK for Australia and New Zealand;
Canada and the UK for the US.
In this context it is significant the position of some countries, the first of which is France, where most
country markets are important (IBWTI >1).
Tab. 10: IBWTI for bulk wine in volume (2012)
Cells in red highlight IBWTI >1
Source: based on Comtrade data
The results for wine exported in bulk (again in volume) roughly show the same patterns illustrated above for
bottled wine (i.e. geographic and/or cultural proximity).
In particular, the three African markets (Angola, Côte-d'Ivoire and Morocco) are vital for Portugal and
Spain; the Japanese market is vital for the US and the Russian market for the former USSR countries.
Moreover, the UK market is important for Australia and the US; the US market for Argentina and Chile;
Asian markets (China and Japan) for Chile; the German market for Italy and the Norwegian market for
Germany.
It should also be noted that the importance achieved by some exporting countries in certain markets is also
related to other variables of the Porter's' Diamond. In particular:
the development of bilateral trade agreements (i.e., Chile with the US, China and Japan) (see §5.5.5.2);
The favourable evolution of exchange rates (e.g., ARS/USD for Argentina-US) (see §5.5.6);
Dominant presence of global wine companies in certain markets (e.g., US and Australian companies in
the UK market).
5.5.2 Demand conditions in consumer countries
Developments in the demand conditions of consumer countries can represent an opportunity, particularly for
producing countries that have achieved relative competitive advantage (with respect to the Factor conditions
An
go
la
Ca
na
da
CH
INA
Cô
te d
'Iv
oir
e
Ja
pa
n
Mo
ro
cco
No
rw
ay
Sw
itzerla
nd
Ru
ssia
n
Fed
era
tio
n
US
A
Den
ma
rk
Germ
an
y
Un
ited
Kin
gd
om
Wo
rld
France 0.00 1.50 1.12 0.10 0.68 0.74 2.15 5.39 0.66 0.35 1.20 1.96 0.39 1.00
Germany - 0.61 0.05 - 0.12 - 7.01 0.39 0.05 0.20 2.35 - 1.18 1.00
Italy - 1.04 0.77 0.03 0.29 0.00 3.19 3.42 0.57 0.24 0.67 4.14 0.32 1.00
Portugal 71.28 0.15 0.83 0.01 0.12 - 1.33 2.14 0.00 0.07 0.07 0.46 0.01 1.00
Spain 3.03 1.30 2.29 31.91 0.47 67.28 0.48 0.94 1.11 0.23 0.87 1.24 0.07 1.00
United Kingdom - 0.14 0.01 - - - 14.77 0.00 - 0.01 11.69 0.00 - 1.00
Others EU 0.00 1.89 0.02 - 1.38 - 0.49 0.03 2.77 9.07 0.69 0.09 0.17 1.00
Argentina 0.00 1.89 0.02 - 1.38 - 0.49 0.03 2.77 9.07 0.69 0.09 0.17 1.00
Australia - 1.75 0.69 - 0.33 - 0.42 0.22 0.00 2.61 1.84 0.43 8.07 1.00
Chile 0.00 0.55 5.64 - 5.09 - 1.02 0.24 0.05 4.03 1.75 0.42 0.60 1.00
New Zealand - 0.19 0.00 - - - 0.09 0.00 - 2.71 0.36 0.17 3.85 1.00
South Africa 0.07 1.96 0.04 0.01 0.42 - 0.46 0.91 2.75 0.52 2.67 1.11 2.53 1.00
USA 0.00 2.16 0.57 0.00 9.64 - 0.99 0.71 0.05 - 1.43 0.72 3.86 1.00
- 0.68 0.55 - 1.06 - - 0.00 0.30 - 0.00 2.84 0.00 1.00
- - - - - - - - 0.18 - - 0.00 - 1.00
- - 0.16 - - - 0.00 0.00 12.13 - - 0.00 - 1.00
1.00 1.00 1.00 1.00 1.00 1.00 1.00 1.00 1.00 1.00 1.00 1.00 1.00 1.00
Caucasus
Others Ex USSR
World
EU 28
NWC
Western Balkans
ToFrom
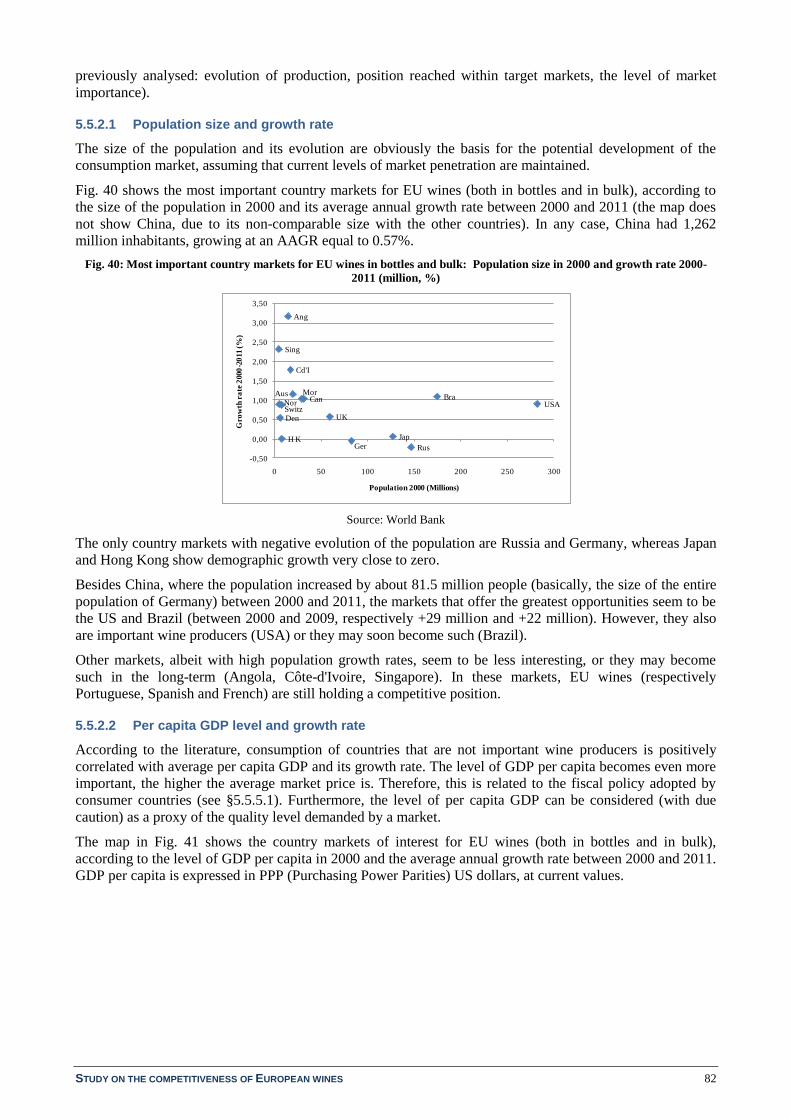
STUDY ON THE COMPETITIVENESS OF EUROPEAN WINES 82
previously analysed: evolution of production, position reached within target markets, the level of market
importance).
5.5.2.1 Population size and growth rate
The size of the population and its evolution are obviously the basis for the potential development of the
consumption market, assuming that current levels of market penetration are maintained.
Fig. 40 shows the most important country markets for EU wines (both in bottles and in bulk), according to
the size of the population in 2000 and its average annual growth rate between 2000 and 2011 (the map does
not show China, due to its non-comparable size with the other countries). In any case, China had 1,262
million inhabitants, growing at an AAGR equal to 0.57%.
Fig. 40: Most important country markets for EU wines in bottles and bulk: Population size in 2000 and growth rate 2000-
2011 (million, %)
Source: World Bank
The only country markets with negative evolution of the population are Russia and Germany, whereas Japan
and Hong Kong show demographic growth very close to zero.
Besides China, where the population increased by about 81.5 million people (basically, the size of the entire
population of Germany) between 2000 and 2011, the markets that offer the greatest opportunities seem to be
the US and Brazil (between 2000 and 2009, respectively +29 million and +22 million). However, they also
are important wine producers (USA) or they may soon become such (Brazil).
Other markets, albeit with high population growth rates, seem to be less interesting, or they may become
such in the long-term (Angola, Côte-d'Ivoire, Singapore). In these markets, EU wines (respectively
Portuguese, Spanish and French) are still holding a competitive position.
5.5.2.2 Per capita GDP level and growth rate
According to the literature, consumption of countries that are not important wine producers is positively
correlated with average per capita GDP and its growth rate. The level of GDP per capita becomes even more
important, the higher the average market price is. Therefore, this is related to the fiscal policy adopted by
consumer countries (see §5.5.5.1). Furthermore, the level of per capita GDP can be considered (with due
caution) as a proxy of the quality level demanded by a market.
The map in Fig. 41 shows the country markets of interest for EU wines (both in bottles and in bulk),
according to the level of GDP per capita in 2000 and the average annual growth rate between 2000 and 2011.
GDP per capita is expressed in PPP (Purchasing Power Parities) US dollars, at current values.
USABra
Rus
Jap
Ger
UK
CanMorAus
Cd'I
Ang
SwitzDen
Nor
Sing
H K
-0,50
0,00
0,50
1,00
1,50
2,00
2,50
3,00
3,50
0 50 100 150 200 250 300
Gro
wth
ra
te 2
000
-20
11 (
%)
Population 2000 (Millions)
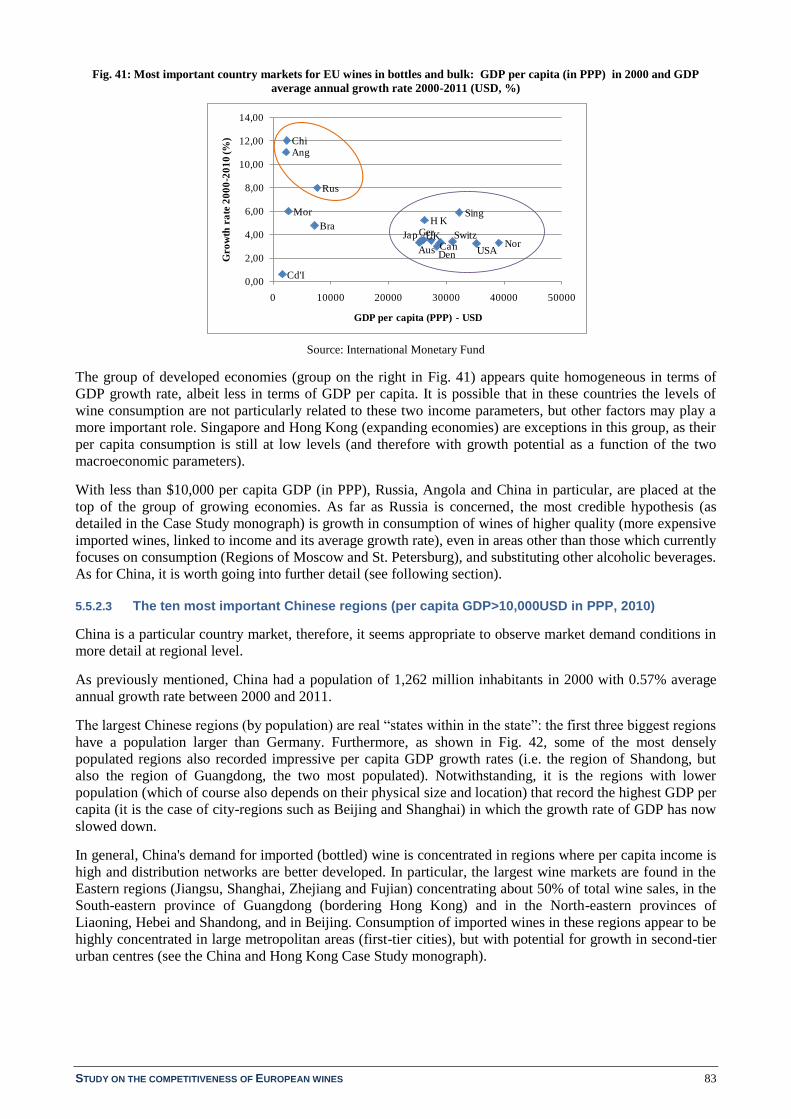
STUDY ON THE COMPETITIVENESS OF EUROPEAN WINES 83
Fig. 41: Most important country markets for EU wines in bottles and bulk: GDP per capita (in PPP) in 2000 and GDP
average annual growth rate 2000-2011 (USD, %)
Source: International Monetary Fund
The group of developed economies (group on the right in Fig. 41) appears quite homogeneous in terms of
GDP growth rate, albeit less in terms of GDP per capita. It is possible that in these countries the levels of
wine consumption are not particularly related to these two income parameters, but other factors may play a
more important role. Singapore and Hong Kong (expanding economies) are exceptions in this group, as their
per capita consumption is still at low levels (and therefore with growth potential as a function of the two
macroeconomic parameters).
With less than $10,000 per capita GDP (in PPP), Russia, Angola and China in particular, are placed at the
top of the group of growing economies. As far as Russia is concerned, the most credible hypothesis (as
detailed in the Case Study monograph) is growth in consumption of wines of higher quality (more expensive
imported wines, linked to income and its average growth rate), even in areas other than those which currently
focuses on consumption (Regions of Moscow and St. Petersburg), and substituting other alcoholic beverages.
As for China, it is worth going into further detail (see following section).
5.5.2.3 The ten most important Chinese regions (per capita GDP>10,000USD in PPP, 2010)
China is a particular country market, therefore, it seems appropriate to observe market demand conditions in
more detail at regional level.
As previously mentioned, China had a population of 1,262 million inhabitants in 2000 with 0.57% average
annual growth rate between 2000 and 2011.
The largest Chinese regions (by population) are real “states within in the state”: the first three biggest regions
have a population larger than Germany. Furthermore, as shown in Fig. 42, some of the most densely
populated regions also recorded impressive per capita GDP growth rates (i.e. the region of Shandong, but
also the region of Guangdong, the two most populated). Notwithstanding, it is the regions with lower
population (which of course also depends on their physical size and location) that record the highest GDP per
capita (it is the case of city-regions such as Beijing and Shanghai) in which the growth rate of GDP has now
slowed down.
In general, China's demand for imported (bottled) wine is concentrated in regions where per capita income is
high and distribution networks are better developed. In particular, the largest wine markets are found in the
Eastern regions (Jiangsu, Shanghai, Zhejiang and Fujian) concentrating about 50% of total wine sales, in the
South-eastern province of Guangdong (bordering Hong Kong) and in the North-eastern provinces of
Liaoning, Hebei and Shandong, and in Beijing. Consumption of imported wines in these regions appear to be
highly concentrated in large metropolitan areas (first-tier cities), but with potential for growth in second-tier
urban centres (see the China and Hong Kong Case Study monograph).
Chi
Rus
Sing
JapBra
Can NorSwitz
Den
GerUK
USA
Ang
Cd'I
MorH K
Aus
0,00
2,00
4,00
6,00
8,00
10,00
12,00
14,00
0 10000 20000 30000 40000 50000
Gro
wth
ra
te 2
00
0-2
01
0 (%
)
GDP per capita (PPP) - USD
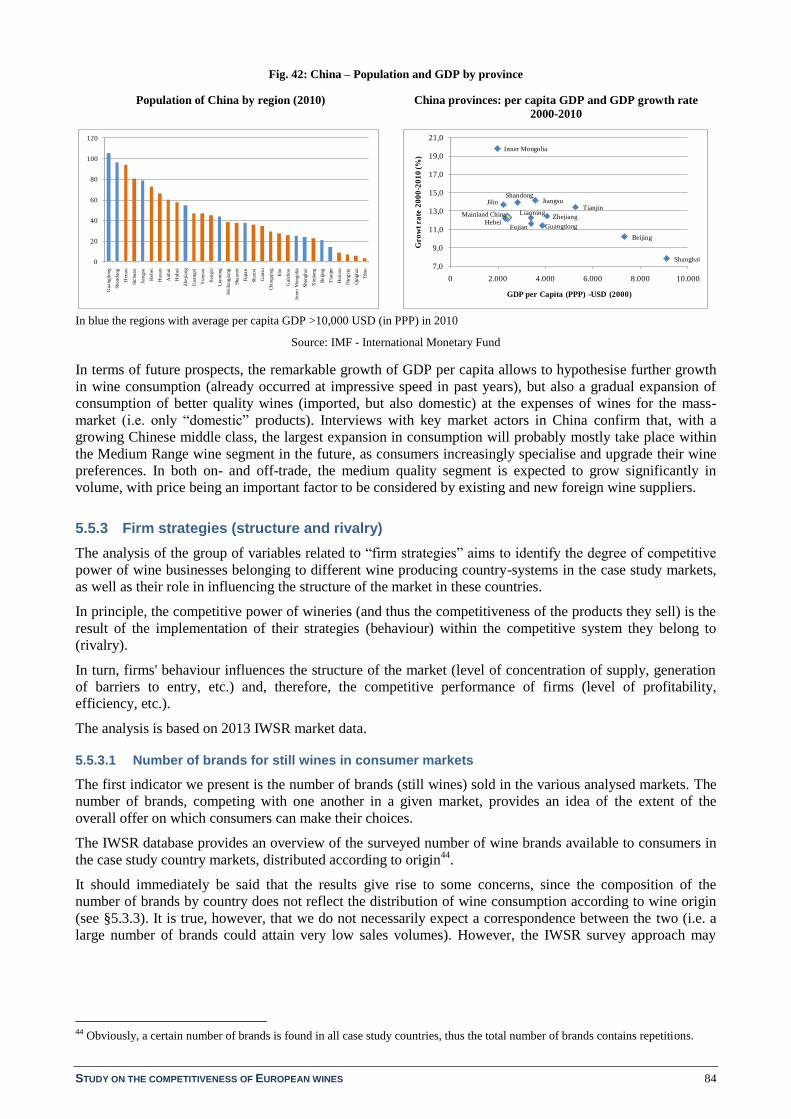
STUDY ON THE COMPETITIVENESS OF EUROPEAN WINES 84
Fig. 42: China – Population and GDP by province
Population of China by region (2010) China provinces: per capita GDP and GDP growth rate
2000-2010
In blue the regions with average per capita GDP >10,000 USD (in PPP) in 2010
Source: IMF - International Monetary Fund
In terms of future prospects, the remarkable growth of GDP per capita allows to hypothesise further growth
in wine consumption (already occurred at impressive speed in past years), but also a gradual expansion of
consumption of better quality wines (imported, but also domestic) at the expenses of wines for the mass-
market (i.e. only “domestic” products). Interviews with key market actors in China confirm that, with a
growing Chinese middle class, the largest expansion in consumption will probably mostly take place within
the Medium Range wine segment in the future, as consumers increasingly specialise and upgrade their wine
preferences. In both on- and off-trade, the medium quality segment is expected to grow significantly in
volume, with price being an important factor to be considered by existing and new foreign wine suppliers.
5.5.3 Firm strategies (structure and rivalry)
The analysis of the group of variables related to “firm strategies” aims to identify the degree of competitive
power of wine businesses belonging to different wine producing country-systems in the case study markets,
as well as their role in influencing the structure of the market in these countries.
In principle, the competitive power of wineries (and thus the competitiveness of the products they sell) is the
result of the implementation of their strategies (behaviour) within the competitive system they belong to
(rivalry).
In turn, firms' behaviour influences the structure of the market (level of concentration of supply, generation
of barriers to entry, etc.) and, therefore, the competitive performance of firms (level of profitability,
efficiency, etc.).
The analysis is based on 2013 IWSR market data.
5.5.3.1 Number of brands for still wines in consumer markets
The first indicator we present is the number of brands (still wines) sold in the various analysed markets. The
number of brands, competing with one another in a given market, provides an idea of the extent of the
overall offer on which consumers can make their choices.
The IWSR database provides an overview of the surveyed number of wine brands available to consumers in
the case study country markets, distributed according to origin44
.
It should immediately be said that the results give rise to some concerns, since the composition of the
number of brands by country does not reflect the distribution of wine consumption according to wine origin
(see §5.3.3). It is true, however, that we do not necessarily expect a correspondence between the two (i.e. a
large number of brands could attain very low sales volumes). However, the IWSR survey approach may
44 Obviously, a certain number of brands is found in all case study countries, thus the total number of brands contains repetitions.
0
20
40
60
80
100
120
Gua
ng
do
ng
Shandong
Hen
an
Sic
hu
an
Jiangsu
Heb
ei
Hu
na
n
Anh
ui
Hu
bei
Zh
eji
an
g
Guangxi
Yu
nn
an
Jia
ng
xi
Lia
onin
g
Heil
on
gji
an
g
Sh
aa
nx
i
Fujian
Shanxi
Gan
su
Cho
ng
qin
g
Jilin
Gu
izh
ou
Inner
Mongolia
Sha
ng
ha
i
Xin
jian
g
Beij
ing
Tia
njin
Ha
ina
n
Nin
gx
ia
Qin
gha
i
Tib
et
Mainland China
Shanghai
Beijing
TianjinJiangsu
Zhejiang
Inner Mongolia
Guangdong
Liaoning
Shandong
Fujian
Jilin
Hebei
7,0
9,0
11,0
13,0
15,0
17,0
19,0
21,0
0 2.000 4.000 6.000 8.000 10.000
Gro
wt
ra
te 2
00
0-2
01
0 (%
)
GDP per Capita (PPP) -USD (2000)

STUDY ON THE COMPETITIVENESS OF EUROPEAN WINES 85
produce distortions in the sample relative to the reference population45
. Given the concerns, we believe that
the results of the analysis should be taken with due caution.
Tab. 11 shows the percentage of wine brands in each case study market over the total number of brands, by
country of origin. All countries of origin are grouped according to three three areas: EU, NWC and other
countries.
Tab. 11: Number of wine brands in the case study country markets by country of origin, 2013 (% over total brands)
Source: IWSR
From the observation of Tab. 11 the following considerations emerge:
In all case study countries, with the sole exception of Japan, the percentage of NWC wine brands is
higher (and in some cases, much higher) than that of EU wines. As mentioned, this first result raises
concerns about the IWSR survey system;
South American wines from Chile and Argentina play a decisive role (large number of wine brands
from these two countries). The role played by other NWC brands is more limited, with the (obvious)
exception of American wine brands on the US market;
Chilean wine brands are relatively more numerous in absolute terms in five of the eight considered
markets (China, Denmark, Germany, Hong Kong and Russia). Regardless of their market share, then,
45 The percentage of NWC wine brands over the total per country appears to be very high, especially in countries where NWC’s
market share is minimal (e.g. Germany).
Ch
ina
Den
ma
rk
Germ
an
y
Ho
ng
Ko
ng
Ja
pa
n
Ru
ssia
UK
US
A
To
tal
Austrian 0.0 0.0 0.9 0.0 0.4 0.0 0.5 0.0 0.3
Bulgarian 0.3 0.5 1.3 0.0 0.0 0.5 0.3 0.0 0.3
Cypriot 0.0 0.0 0.0 0.0 0.0 0.0 0.2 0.0 0.0
French 17.6 7.7 10.7 14.9 22.9 11.0 12.7 5.4 13.5
German 1.5 1.6 6.3 1.1 4.5 0.0 1.9 2.1 2.5
Greek 0.3 0.5 3.6 0.0 0.2 0.0 0.5 0.6 0.6
Hungarian 0.0 0.0 1.3 0.0 0.2 0.0 1.2 0.0 0.4
Italian 5.9 6.0 11.2 6.7 14.2 4.8 14.5 10.3 10.3
Portuguese 0.9 2.7 0.9 0.4 2.6 1.4 2.6 1.7 1.8
Romanian 0.3 0.0 1.3 0.0 0.0 0.0 0.3 0.4 0.3
Spanish 6.5 10.9 8.9 6.3 13.8 4.8 11.1 3.8 8.6
Slovenian 0.0 0.0 0.0 0.0 0.0 0.0 0.0 0.2 0.0
Argentinian 18.2 18.0 13.4 15.7 7.9 13.4 8.0 11.5 12.1
Australian 11.4 9.3 1.3 11.9 6.7 8.1 10.6 5.4 8.2
Canadian 0.3 0.0 0.0 0.0 0.0 0.0 0.3 0.4 0.2
Chilean 22.6 24.6 21.9 22.8 12.3 23.9 12.2 8.4 16.3
New Zealand 3.8 1.6 1.3 7.8 2.2 7.2 5.1 2.9 3.9
South African 5.0 8.7 9.8 5.2 4.7 6.7 9.8 5.2 6.7
US 4.1 7.7 3.6 6.3 5.9 8.1 6.6 41.2 12.1
Brazilian 0.0 0.0 0.0 0.0 0.0 0.0 0.2 0.0 0.0
Chinese 1.2 0.0 0.0 0.7 0.0 0.0 0.0 0.0 0.2
Georgian 0.0 0.0 0.0 0.0 0.0 1.0 0.2 0.0 0.1
International 0.0 0.0 1.3 0.0 0.0 0.0 0.3 0.0 0.2
Israel 0.0 0.0 0.0 0.0 0.0 1.4 0.0 0.0 0.1
Indian 0.0 0.0 0.0 0.0 0.2 0.0 0.2 0.0 0.1
Japanese 0.0 0.0 0.0 0.0 1.2 0.0 0.0 0.0 0.2
Lebanese 0.0 0.0 0.4 0.0 0.0 0.0 0.3 0.4 0.2
Mexican 0.0 0.0 0.0 0.0 0.4 0.0 0.0 0.0 0.1
Moldovan 0.0 0.0 0.0 0.0 0.0 1.0 0.2 0.0 0.1
Montenegrin 0.3 0.0 0.4 0.0 0.0 0.5 0.2 0.0 0.1
Moroccan 0.0 0.0 0.0 0.0 0.0 0.0 0.2 0.0 0.0
Russian 0.0 0.0 0.0 0.0 0.0 3.8 0.0 0.0 0.3
Serbian 0.0 0.0 0.4 0.0 0.0 0.0 0.0 0.0 0.0
Swiss 0.0 0.0 0.0 0.0 0.2 0.0 0.0 0.0 0.0
Thai 0.0 0.0 0.0 0.0 0.0 0.0 0.2 0.0 0.0
Tunisian 0.0 0.0 0.4 0.0 0.0 0.0 0.0 0.0 0.0
Ukrainian 0.0 0.0 0.0 0.0 0.0 2.4 0.0 0.0 0.2
Total EU 33.1 30.1 46.4 29.5 58.7 22.5 46.0 24.5 38.6
Total NWC 65.4 69.9 51.3 69.8 39.7 67.5 52.6 75.1 59.6
Total Others 1.5 0.0 2.2 0.7 1.6 10.0 1.4 0.4 1.8
TOTAL % 100.0 100.0 100.0 100.0 100.0 100.0 100.0 100.0 100.0
TOTAL n. 341 183 226 268 496 209 577 478 2778

STUDY ON THE COMPETITIVENESS OF EUROPEAN WINES 86
and considering the available information as reliable, Chilean wines appear to have an important brand
presence in most markets, potentially capable of influencing consumer preferences;
With regard to EU wines, the number of brands is higher for France and Italy, one or the other
depending on the country market (French brands in China, Hong Kong, Japan and Russia; Italian brands
in Germany, UK and USA). French brands are more numerous in Japan, while Italian brands on the UK
market. Finally, again among European brands, Spanish wine brands are relatively more numerous in
Denmark;
Wine brands of other countries represent a very marginal percentage, with a sole exception for Russia
where domestic and Ukranian wine brands are not negligible. We also note the low number of Chinese
brands on the Chinese market, in spite of the fact that most wine consumed in this country is "local."
5.5.3.2 Concentration of wine companies in the case study consumer markets
IWSR data report total sales of still wines for each wine company (as the sum of sales volume of each
controlled brand). This allows to calculate the market share of each wine-company and then the degree of
concentration expressed by the C4 indicator (i.e. market share of the top four companies).
Tab. 12 shows the C4 value for each case study market in 2013. The market share of each of the top four
wine companies is also reported, as well as the country where they are based.
Tab. 12: Market shares of bottled still wines in volume in the case study markets (C4), by wine company and country, 2013
(%)
Source: based on IWSR data
The results of the analysis highlight:
The existence of two extreme situations: Russia on the one hand, with the lowest concentration (C4 =
5.3%); and the US on the other, with the highest C4 (49.2%);
In three countries (China, Germany, USA), the first four leading companies are domestic wine
companies;
In all case study countries that are wine producers (China, Germany, Japan, Russia, USA), the market
leader is a local wine company (but not necessarily producing all wine from local grapes);
In six countries, at least one company among the top four is a global wine market player (Denmark,
Hong Kong, Japan; Russia, United Kingdom and USA). Moreover, it is interesting to note that in Hong
Kong all top four leading companies are “big players”, while in China none is;
Among “big players”, the Chilean Concha y Toro appears with greatest frequency among the top four
wine companies (in Denmark, Japan, Russia and the United Kingdom);
With the exception of Germany, EU wine businesses (i.e. French) appear among the top four in two
countries only (Denmark and Hong Kong).
Leaders MS Origin Leaders MS Origin
Changyu 8.83 China Kirin 10.64 Japan/international
Hebei Winery 8.20 China Beam Suntory 7.20 Japan/international
Dynasty 1.77 China Concha y Toro 3.26 Chile/ International
Dragon Seal Wine Co 1.70 China The Wine Group 2.97 USA
C4 20.51 C4 24.07
Concha y Toro 3.07 Chile/ International MMVZ 2.05 Russia
Winecorp 2.92 South Africa Concha y Toro 1.17 Chile/ International
Accolade 2.76 Australia/ International Inkerman 1.06 Ukraina
Val D'Orbieu 1.78 France Magnit 1.05 Russia
C4 10.53 C4 5.32
Peter Mertes 3.97 Germany/ International Accolade 6.37 Australia/ International
Rheinberg 2.35 Germany Constellation 5.21 USA/international
ZGM 2.17 Germany Concha y Toro 4.80 Chile/ International
Andreas Oster 1.74 Germany Diageo 4.33 USA/international
C4 10.23 C4 20.71
Treasury 6.19 Australia E & J Gallo 19.08 USA/international
E & J Gallo 4.41 USA/international The Wine Group 13.76 USA
Constellation 3.14 USA/international Constellation 11.62 USA/international
Baron de Rothschild 1.61 France/ International Trinchero 4.73 USA
C4 15.34 C4 49.19
China
Denmark
Germany
Hong Kong
Japan
Russia
UK
USA

STUDY ON THE COMPETITIVENESS OF EUROPEAN WINES 87
Overall, EU wine companies appear to have limited total market power.
Contrary to what might be expected, there is not an inverse relationship between the level of C4 and the number of
brands. The most significant case is observed for the US (Fig. 43).
An explanation of this phenomenon is that (as it will be discussed later), the major companies have a (more or less)
wide brand portfolio.
Fig. 43: C4 of wine companies and number of brands in the examined country markets
Source: analysis of IWSR data
5.5.3.3 Market shares of the “big players” in consumer countries
Beyond the four market leaders (C4), it is useful to broaden the analysis to the market power of all big
players in order to interpret the competition dynamics in each examined market. In particular, it is interesting
to examine the strategic orientation of such players across the different country markets.
Tab. 13 shows the market share of the major global players, of which six European and six non-European
companies, in the case study countries.
Tab. 13: Market shares of the major global wine companies in the case study countries (bottled wine volume; %), 2013
In red market shares >2%
In the UK, the market share of Pernod Ricard is prevalently from Australian wines (Jakob's Creek) and New Zealand wines.
The market share of Diageo is prevalently accounted for by California wines (Blossom Hill).
Source: based on IWSR data
The following observations are based on the obtained results:
The United States, United Kingdom and Hong Kong are the markets in which the presence of wines
produced and / or marketed by global companies, especially American and Australian, is stronger. In the
US, the market share of such big companies exceeds 50%, followed at a distance by Japan and
Denmark.
China
Denmark Germany
Hong Kong
Japan
Russia
UK
USA
0,0
10,0
20,0
30,0
40,0
50,0
60,0
0 100 200 300 400 500 600 700
C4
(%
)
n. brands
China Denmark Germany Hong Kong Japan Russia UK USA
Costellation (USA) 0.03 0.85 0.06 3.14 0.30 0.41 5.21 11.62
E&J Gallo (USA) 0.47 0.23 0.40 4.41 2.76 0.27 3.02 19.08
Treasury Wine Estates (Australia) 0.13 1.55 0.02 6.19 0.33 0.01 4.12 3.86
The Wine Group (USA) 1.60 2.97 0.07 0.15 13.76
Accolade (Australia) 0.09 2.76 0.03 0.90 0.59 0.04 6.37 0.23
Concha y Toro (Chile) 0.29 3.07 0.13 1.55 3.26 1.17 4.80 1.66
Pernod Ricard (France) 0.13 0.52 0.05 1.23 0.26 0.06 2.36 0.55
Diageo (UK) 0.01 0.00 0.01 0.15 0.00 4.33 1.15
LVMH (France) 0.01 0.00 0.57 0.10 0.00 0.04 0.10
Torres (Spain) 0.03 0.60 0.08 0.15 0.15 0.00 0.29 0.03
Baron de Rothschild (France) 0.16 0.29 0.17 1.61 0.42 0.15 0.15 0.10
Freixenet Group (Spain) 0.06 0.00 0.37 1.41 0.05 0.07
1.35 9.87 0.95 21.35 11.28 2.18 30.83 52.13Tot 12

STUDY ON THE COMPETITIVENESS OF EUROPEAN WINES 88
By contrast, in Germany, China and Russia the market share of global players is almost insignificant.
European wine companies hold marginal market shares in all markets, the only exception being Diageo
and Pernod Ricard in the UK market. However, the significant shares of this market are due to new
world wines.
Therefore, as already outlined in §5.2.2 (Theme 1), the markets studied seem to belong to two quite distinct
groups. The first group concentrates presence and market power of the big players. The markets of the
"Anglosphere"46
, where supplier-market relationships are favoured by the existence of established economic,
cultural and linguistic ties, belong in this group. The United Kingdom is, of course, the main target market of
this group.
The second group represents the rest of the world, where such relationships do not exist, or exist only
indirectly (e.g. Denmark47
).
All this has an impact in terms of international competition: being an enterprise of and/or marketing wines
from one of the "Anglosphere" countries may represent a competitive advantage in accessing certain
markets.
5.5.3.4 Product portfolio strategies of global wine players
The fact that, as seen in the previous chapter, global players control large market shares in some markets
does not mean that these are solely derived from sale of wines from the same country of origin of the
company.
Tab. 14 shows the total number of brands and origin of the wines controlled by the same companies already
examined in the previous chapter.
Tab. 14: Number of brands by company: total and by wine origin, 2014
1) In April 2011, 99% of Fosters Group shareholders agreed to split Fosters Group business into separate brewing
and wine companies. The scheme of arrangement for the demerger of Treasury Wine Estates from Foster's Group
was implemented 20 May 2011.
2) In January 2011 Constellation Brands Inc divested 80% of Constellation Wines Australia along with its sister
company, Constellation Europe, to the Australian private equity company, CHAMP. On June 2011 Constellation
Wines Australia and Constellation Europe were jointly renamed Accolade Wines.
Fonte: Companies Web Sites
46 The Merriam-Webster dictionary defines the Anglosphere as "the countries of the world in which the English language and cultural
values predominate". 47 The IBWTI (see §5.5.1.3), shows that the Danish market is key for UK wine exports. As the UK is not a wine producer country,
these clearly are re-exports, most probably including wines/brands from the product portfolios of the big players operating in this
country.
US
A
Ca
na
da
Au
stra
lia
New
Zeela
nd
So
uth
Afr
ica
So
uth
Am
eric
a
Ch
ina
Ind
ia
Eu
ro
pe
Oth
ers
TO
TA
L
%
EU/Tot
Costellation (USA) 28 59 3 11 4 7 112 6.3
E&J Gallo (USA) 38 4 2 1 4 10 59 16.9
Treasury Wine Estates (1) (Australia) 12 2 2 52 3.8
The Wine Group (USA) 12 2 2 1 17 5.9
Accolade (2) (Australia) 7 1 16 7 3 1 2 37 5.4
Concha y Toro (Chile) 1 10 11 0.0
98 60 4 23 0 0 22 0 288 7.6
Pernod -Ricard (France) 1 2 4 1 6 6 2 22 27.3
Diageo (UK) 11 1 1 13 7.7
LVMH (France) 2 2 1 4 1 1 9 20 45.0
Torres (Spain) 1 11 26 38 68.4
Baron de Rothschild (France) 1 4 7 12 58.3
Freixenet Group (Spain) 1 1 2 17 1 21 81.0
17 0 5 5 2 27 1 1 66 3 126 52.4
TOTAL 115 60 6 50 1 1 88 3 414 21.3
36
86
Total non EU big players
Total EU big players
81

STUDY ON THE COMPETITIVENESS OF EUROPEAN WINES 89
As shown in Tab. 14:
All companies (European and non-European) have European brands in their portfolios, with the only
exception of the Chilean Concha y Toro;
Overall, the percentage of European brands on the total number of brands is just over 21%;
European brands account for almost 8% of the total number of brands of the six non-European wine
companies. However, about 17% of the brands controlled by the American E&J Gallo are European;
European brands represent only about 52% of the total number of brands of the six European wine
companies, down to 8% for the British Diageo.
The results, therefore, show that all the major global wine companies develop a portfolio that includes brands
from all main production areas of the world, although the incidence of an area rather than another is a
function of the company’s headquarters (greater relative weight of US wine brands for US companies,
greater relative weight of Australian wine brands for Australian companies, etc.)
This strategy allows the big players (non-European and European) to facilitate their access to distribution48
,
and cater, to various extents, to the different target markets. The consequence is that the composition of
consumption of wines by country of origin in the various markets is also the result of this strategy. In
principle, the impact is more significant where the share of the market controlled by the big players is large.
However, most companies do not exploit the power generated by the width of their product portfolios in the
same way everywhere. It seems that, depending on the market, they adopt different strategies for selection of
brands to be offered to the consumer, most likely in agreement with importers / distributors49
.
Next, we extracted from the IWSR database50
the number of brands (different countries of origin) of the
product portfolios of the big players in the various markets (see Tab. 15).
48 As it will be pointed out later in §6.2.1, the width of the range on offer is one of the key factors of competitiveness for wine firms. 49 It will be shown later in the analysis of Theme 2 (§6.2.3 - MicMac) that ability to closely interact with importers/distributors
represents a key factor of competitiveness for wine firms. 50 Once again, keeping in mind the concerns expressed with regard to the IWSR survey approach (§5.5.3.1).
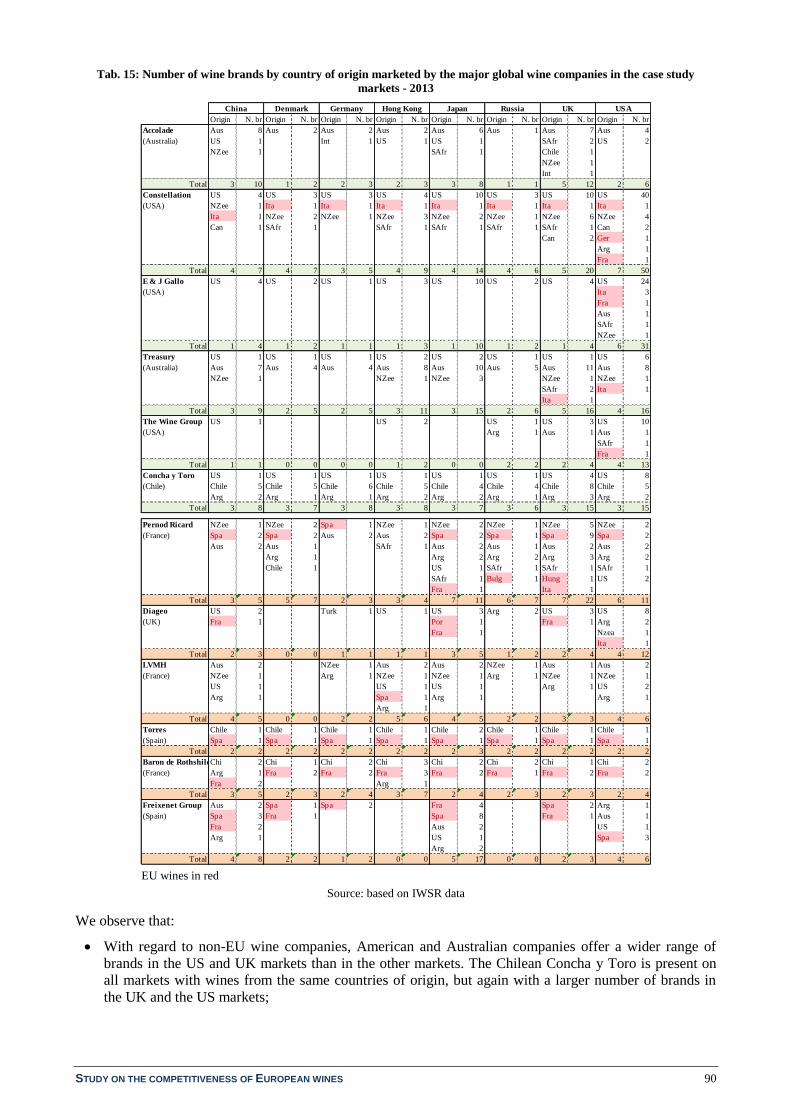
STUDY ON THE COMPETITIVENESS OF EUROPEAN WINES 90
Tab. 15: Number of wine brands by country of origin marketed by the major global wine companies in the case study
markets - 2013
EU wines in red
Source: based on IWSR data
We observe that:
With regard to non-EU wine companies, American and Australian companies offer a wider range of
brands in the US and UK markets than in the other markets. The Chilean Concha y Toro is present on
all markets with wines from the same countries of origin, but again with a larger number of brands in
the UK and the US markets;
Origin N. br Origin N. br Origin N. br Origin N. br Origin N. br Origin N. br Origin N. br Origin N. br
Accolade Aus 8 Aus 2 Aus 2 Aus 2 Aus 6 Aus 1 Aus 7 Aus 4
(Australia) US 1 Int 1 US 1 US 1 SAfr 2 US 2
NZee 1 SAfr 1 Chile 1
NZee 1
Int 1
Total 3 10 1 2 2 3 2 3 3 8 1 1 5 12 2 6
Constellation US 4 US 3 US 3 US 4 US 10 US 3 US 10 US 40
(USA) NZee 1 Ita 1 Ita 1 Ita 1 Ita 1 Ita 1 Ita 1 Ita 1
Ita 1 NZee 2 NZee 1 NZee 3 NZee 2 NZee 1 NZee 6 NZee 4
Can 1 SAfr 1 SAfr 1 SAfr 1 SAfr 1 SAfr 1 Can 2
Can 2 Ger 1
Arg 1
Fra 1
Total 4 7 4 7 3 5 4 9 4 14 4 6 5 20 7 50
E & J Gallo US 4 US 2 US 1 US 3 US 10 US 2 US 4 US 24
(USA) Ita 3
Fra 1
Aus 1
SAfr 1
NZee 1
Total 1 4 1 2 1 1 1 3 1 10 1 2 1 4 6 31
Treasury US 1 US 1 US 1 US 2 US 2 US 1 US 1 US 6
(Australia) Aus 7 Aus 4 Aus 4 Aus 8 Aus 10 Aus 5 Aus 11 Aus 8
NZee 1 NZee 1 NZee 3 NZee 1 NZee 1
SAfr 2 Ita 1
Ita 1
Total 3 9 2 5 2 5 3 11 3 15 2 6 5 16 4 16
The Wine Group US 1 US 2 US 1 US 3 US 10
(USA) Arg 1 Aus 1 Aus 1
SAfr 1
Fra 1
Total 1 1 0 0 0 0 1 2 0 0 2 2 2 4 4 13
Concha y Toro US 1 US 1 US 1 US 1 US 1 US 1 US 4 US 8
(Chile) Chile 5 Chile 5 Chile 6 Chile 5 Chile 4 Chile 4 Chile 8 Chile 5
Arg 2 Arg 1 Arg 1 Arg 2 Arg 2 Arg 1 Arg 3 Arg 2
Total 3 8 3 7 3 8 3 8 3 7 3 6 3 15 3 15
Pernod Ricard NZee 1 NZee 2 Spa 1 NZee 1 NZee 2 NZee 1 NZee 5 NZee 2
(France) Spa 2 Spa 2 Aus 2 Aus 2 Spa 2 Spa 1 Spa 9 Spa 2
Aus 2 Aus 1 SAfr 1 Aus 2 Aus 1 Aus 2 Aus 2
Arg 1 Arg 2 Arg 2 Arg 3 Arg 2
Chile 1 US 1 SAfr 1 SAfr 1 SAfr 1
SAfr 1 Bulg 1 Hung 1 US 2
Fra 1 Ita 1
Total 3 5 5 7 2 3 3 4 7 11 6 7 7 22 6 11
Diageo US 2 Turk 1 US 1 US 3 Arg 2 US 3 US 8
(UK) Fra 1 Por 1 Fra 1 Arg 2
Fra 1 Nzea 1
Ita 1
Total 2 3 0 0 1 1 1 1 3 5 1 2 2 4 4 12
LVMH Aus 2 NZee 1 Aus 2 Aus 2 NZee 1 Aus 1 Aus 2
(France) NZee 1 Arg 1 NZee 1 NZee 1 Arg 1 NZee 1 NZee 1
US 1 US 1 US 1 Arg 1 US 2
Arg 1 Spa 1 Arg 1 Arg 1
Arg 1
Total 4 5 0 0 2 2 5 6 4 5 2 2 3 3 4 6
Torres Chile 1 Chile 1 Chile 1 Chile 1 Chile 2 Chile 1 Chile 1 Chile 1
(Spain) Spa 1 Spa 1 Spa 1 Spa 1 Spa 1 Spa 1 Spa 1 Spa 1
Total 2 2 2 2 2 2 2 2 2 3 2 2 2 2 2 2
Baron de RothshildChi 2 Chi 1 Chi 2 Chi 3 Chi 2 Chi 2 Chi 1 Chi 2
(France) Arg 1 Fra 2 Fra 2 Fra 3 Fra 2 Fra 1 Fra 2 Fra 2
Fra 2 Arg 1
Total 3 5 2 3 2 4 3 7 2 4 2 3 2 3 2 4
Freixenet Group Aus 2 Spa 1 Spa 2 Fra 4 Spa 2 Arg 1
(Spain) Spa 3 Fra 1 Spa 8 Fra 1 Aus 1
Fra 2 Aus 2 US 1
Arg 1 US 1 Spa 3
Arg 2
Total 4 8 2 2 1 2 0 0 5 17 0 0 2 3 4 6
UK USAChina Denmark Germany Hong Kong Japan Russia

STUDY ON THE COMPETITIVENESS OF EUROPEAN WINES 91
Among European wine businesses, Pernod-Ricard supplies a very wide variety of brands in terms of
country of origin in most consumer markets, with the largest number of brands in the UK market. Other
companies such as Torres and Baron de Rotschilds are present in practically the same way in all (or
most) examined markets.
Finally, it is important to note that the strategy of expansion of product portfolio composition is no longer a
prerogative of big players alone, but it is now implemented by smaller size wine companies.
Overall, IWSR data show that, in 2013, 37 companies (out of a total of 879, including the big players) has a
product portfolio comprising wines from both EU and non-EU countries (Tab. 16).
Tab. 16: Wine companies marketing EU and non-EU wines, 2013
Source: IWSR
5.5.4 Related and supporting industries
With regard to this group of factors, we adapted the Porter's Diamond framework to focus on public co-
financing programmes for promotional activities. This aspect is obviously inter-related to the "Government"
group of influencing factors (see next section). However, we have placed them in this particular group of
influences since it is financial support to businesses at variable rates of public/private co-financing.
This part of the analysis also considers the effects of recent technological developments in wine bulk
packaging and transportation on supporting industries, in wine producer as well as in consumer countries.
5.5.4.1 Co-financing programmes for wine companies in producer countries for promotion on consumer markets
The analysis aims to verify the existence and extent of co-financed programmes for promotional activities in
the EU and its main competitors.
In the EU these activities are funded under the "Promotion on third-country markets" measure witin the wine
CMO reformed in 2008, and the co-financing rate is 50%. Tab. 17 shows the budget used for this measure
for the 2009-2013 period and the budget planned for 2014-2018. In addition, for the years 2009-2013 we
have estimated the average budget for a 12-bottle case (9 litres) of exported wine.
Tab. 17: European Commission financial support for the wine promotion measure (Financial execution 2009-2013; Financial
table 2014-2018, million Euro)
Source: EC-DG Agri, Comext
With regard to the EU main competitors, Tab. 18 summarises the financing of promotional activities in 2009,
including the rate of co-financing, where applicable.
Accolade Langguth
Altia LVMH
Baron de Rothschild Michel Rolland
Beam Suntory Off-Piste Wines
Bibendum Wines Pernod Ricard
Binderer St. Ursula Peter Mertes
Boisset PLB
Boutinot Racke
Castel Remy Cointreau
Codorniu Ridge Winery
Constellation Sogrape
Diageo The Wine Group
E & J Gallo Thierry's
Franco Espanolas Torres
Freixenet Treasury
Grands Chais De France United Wineries
Itoyokaido Waverley Wines & Spirits
Jebsen 10 International
Kirin
2009 2010 2011 2012 2013 2014 2015 2016 2017 2018
Total budget 35.18 87.2 111.65 142.52 145.43 227.22 231.72 232.72 234.59 234.59
Euro/ Case (estimate) 0.20 0.39 0.46 0.59 0.66 n.a. n.a. n.a. n.a. n.a.
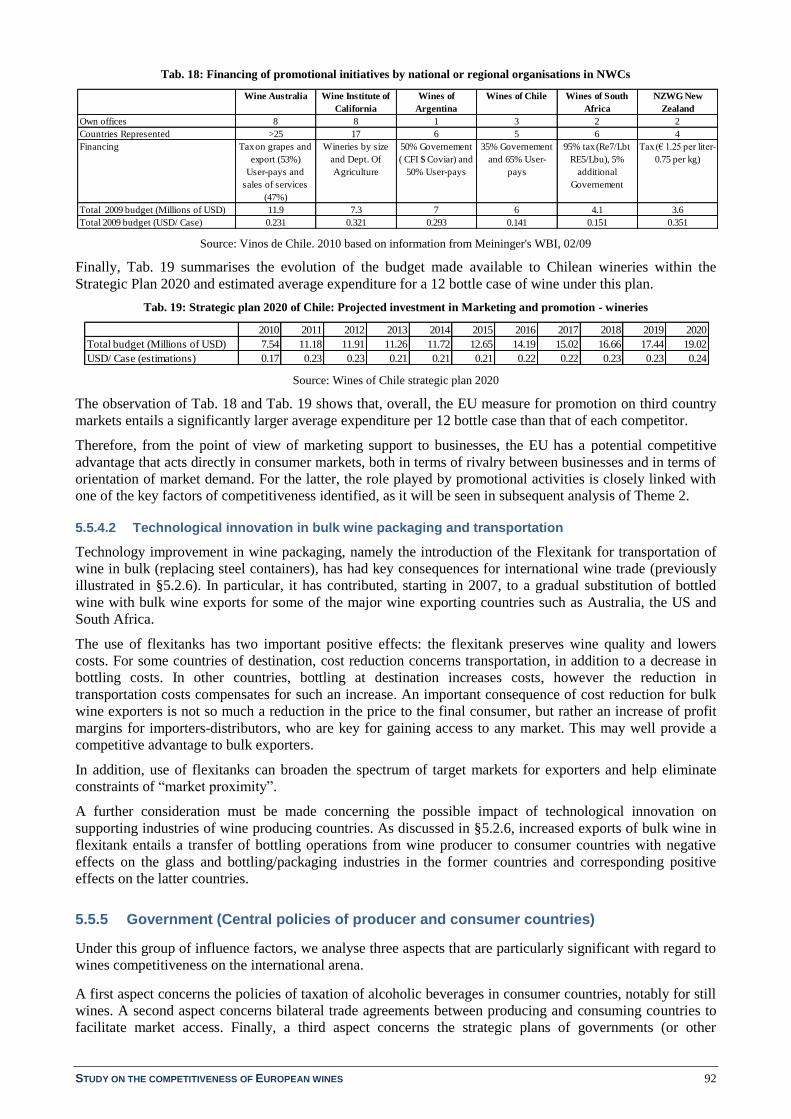
STUDY ON THE COMPETITIVENESS OF EUROPEAN WINES 92
Tab. 18: Financing of promotional initiatives by national or regional organisations in NWCs
Source: Vinos de Chile. 2010 based on information from Meininger's WBI, 02/09
Finally, Tab. 19 summarises the evolution of the budget made available to Chilean wineries within the
Strategic Plan 2020 and estimated average expenditure for a 12 bottle case of wine under this plan.
Tab. 19: Strategic plan 2020 of Chile: Projected investment in Marketing and promotion - wineries
Source: Wines of Chile strategic plan 2020
The observation of Tab. 18 and Tab. 19 shows that, overall, the EU measure for promotion on third country
markets entails a significantly larger average expenditure per 12 bottle case than that of each competitor.
Therefore, from the point of view of marketing support to businesses, the EU has a potential competitive
advantage that acts directly in consumer markets, both in terms of rivalry between businesses and in terms of
orientation of market demand. For the latter, the role played by promotional activities is closely linked with
one of the key factors of competitiveness identified, as it will be seen in subsequent analysis of Theme 2.
5.5.4.2 Technological innovation in bulk wine packaging and transportation
Technology improvement in wine packaging, namely the introduction of the Flexitank for transportation of
wine in bulk (replacing steel containers), has had key consequences for international wine trade (previously
illustrated in §5.2.6). In particular, it has contributed, starting in 2007, to a gradual substitution of bottled
wine with bulk wine exports for some of the major wine exporting countries such as Australia, the US and
South Africa.
The use of flexitanks has two important positive effects: the flexitank preserves wine quality and lowers
costs. For some countries of destination, cost reduction concerns transportation, in addition to a decrease in
bottling costs. In other countries, bottling at destination increases costs, however the reduction in
transportation costs compensates for such an increase. An important consequence of cost reduction for bulk
wine exporters is not so much a reduction in the price to the final consumer, but rather an increase of profit
margins for importers-distributors, who are key for gaining access to any market. This may well provide a
competitive advantage to bulk exporters.
In addition, use of flexitanks can broaden the spectrum of target markets for exporters and help eliminate
constraints of “market proximity”.
A further consideration must be made concerning the possible impact of technological innovation on
supporting industries of wine producing countries. As discussed in §5.2.6, increased exports of bulk wine in
flexitank entails a transfer of bottling operations from wine producer to consumer countries with negative
effects on the glass and bottling/packaging industries in the former countries and corresponding positive
effects on the latter countries.
5.5.5 Government (Central policies of producer and consumer countries)
Under this group of influence factors, we analyse three aspects that are particularly significant with regard to
wines competitiveness on the international arena.
A first aspect concerns the policies of taxation of alcoholic beverages in consumer countries, notably for still
wines. A second aspect concerns bilateral trade agreements between producing and consuming countries to
facilitate market access. Finally, a third aspect concerns the strategic plans of governments (or other
Wine Australia Wine Institute of
California
Wines of
Argentina
Wines of Chile Wines of South
Africa
NZWG New
Zealand
Own offices 8 8 1 3 2 2
Countries Represented >25 17 6 5 6 4
Financing Tax on grapes and
export (53%)
User-pays and
sales of services
(47%)
Wineries by size
and Dept. Of
Agriculture
50% Governement
( CFI $ Coviar) and
50% User-pays
35% Governement
and 65% User-
pays
95% tax (Re7/Lbt
RE5/Lbu), 5%
additional
Governement
Tax (€ 1.25 per liter-
0.75 per kg)
Total 2009 budget (Millions of USD) 11.9 7.3 7 6 4.1 3.6
Total 2009 budget (USD/ Case) 0.231 0.321 0.293 0.141 0.151 0.351
2010 2011 2012 2013 2014 2015 2016 2017 2018 2019 2020
Total budget (Millions of USD) 7.54 11.18 11.91 11.26 11.72 12.65 14.19 15.02 16.66 17.44 19.02
USD/ Case (estimations) 0.17 0.23 0.23 0.21 0.21 0.21 0.22 0.22 0.23 0.23 0.24

STUDY ON THE COMPETITIVENESS OF EUROPEAN WINES 93
institutions) of producing countries, aimed at improving the efficiency of the supply chain and the
competitiveness of wine products (including a range of policies).
5.5.5.1 Tax regimes in consumer countries
Tab. 20 summarises the tax system applied to wine in the main EU wine import countries, including the three
case study Member States.
All monetary values, originally expressed in national currencies, are converted into Euros using the average
exchange rate for the year 2013.
Tax regimes are quite differentiated across the examined countries. The reasons for such differences range
from protectionism of domestic wine and/or other locally produced alcoholic drinks (beer, spirits, etc.) to
prevention of alcoholism, or again environmental reasons (taxation on recycling). Tab. 20 shows import
duties and other fees for imported wines and consumer taxes currently applied across countries.
Tab. 20: Fiscal policy and taxation in the most important country markets for EU wine exports
Source: ICEX, ICE, Sud de France Développement, OECD and other national sources
The observation of Tab. 20 shows the following main differences across countries:
Import duty
Customs
clearance tax
/ Harbour
Maintenance
Fees
Merchandise
Processing
Fees
VAT Excise duty Tax on packaging Note
Bottled wine 14% 0 17% 10%
Bulk wine 20% 0 17% 10%
Honk Kong Bottled wine 0% 0 0% 0%
JapanBottled still wine
(2 lt or less)
15% (or 0.96 €/lt,
whichever is lower
with a minimum of
0.52 €/lt)
0 8% 0.617 €/lt
Bottled still wine
(2 lt to 150 lt)
15% (or 0.96 €/lt,
whichever is lower
with a minimum of
0.52 €/lt)
0 8% 0.617 €/lt
Bulk wine (> 150) 0,35 €/lt 0 8% 0.617 €/lt
Bottled still wine 18.1% on CIF (^)
0,15 % on
customs value
(*)
18% 0.16 €/lt (°)
Mosts and bulk
wine5% on CIF (^)
0,15 % on
customs value
(*)
18% 0.16 €/lt (°)
Bottled still winefrom 0.033 €/lt to
0.169 €/lt (°)0.125% AV
0.21% on FOB
min 18.8 €;
max 365 €
From 0
to 9.45%
(^)
FET: Still wine <
14% : 0.16 €
bottle 0.75 lt (=)
SET: from 0.04
€/lt to 0.50 €/lt (^)
Bulk wine 0.063 €/lt 0.125% AV
10% vol : 5.29 €/lt
11% vol: 5.86 €/lt
12% vol: 6.34 €/lt
13% vol: 6.90 €/lt
10% vol : 5.82€/lt Bottles : 0.67 €
11% vol: 6.40 €/lt Bag.in-Box. 1.30 €
12% vol: 6.98 €/lt
13% vol: 7.56 €/lt
10% vol : 5.58 €/lt
11% vol: 6.14 €/lt
12% vol: 6.70 €/lt
13% vol: 7.26 €/lt
Canada Still wine <
13.7% vol0.0137 €/lt 0.453 €/lt Average exchange rate 2013 CAD/€ 0.7258
40 to 60 cl: 0,00 €
60 to 110 cl.: 0,21 €
110 to 160 cl.: 0,32€
>160 cl.: 0,43€
Germany Still wine 19% 0
UKStill wines 5.5-
15% vol20% 3.14 €/lt
S pecial Tax (excise) based on “The Alcoholic
Liquor Duties Act” of 1979
Average exchange rate 2013 £/€ 1.177503
WET: 29% AV
(°)
DenmarkStill wines 6-15%
vol25% 0.824 €/lt
(°) WET is calculated on the taxable value of
sales, imports and applications to own use.
Generally applies to the last wholesale sale
Average exchange rate 2013 AUD/€ 0.7258
Australia Still wines > 1.15
% vol5% AV 10%
NorwayStill wines 4.75-
22% vol25% Average exchange rate 2013 NOK€ 0.1280949
United States
(°) Customs duties apply according to the
nomenclature of the product
(^) State excise taxes and Sales taxes on wine
vary according to the State
(=) Federal Excise Tax ax for still wines
varies according to alcohol content.
Average exchange rate 2013 $/€ 0.75294
Singapore Still wine 0 7% Average exchange rate 2013 SGD/€ 1.177503
China
Total tax = ((Import duty+ VAT + Exise
duty + (Import Duty*VAT))/(1-Excise
Duty)
Russia
(^) in 2013. (*) 0,10% in Rubles and 0,5% in
foreign currency. (°) 0.16 €/lt in 2013, 0.19
€/lt in 2014; 0.21 €/lt in 2015
Average exchange rate 2013 R/€ 0.02362

STUDY ON THE COMPETITIVENESS OF EUROPEAN WINES 94
Import duties: Hong Kong and Singapore do not apply any import duties; In addition, low duties are
applied by the USA, Canada and Australia; in contrast, very high tariffs are applied in Russia, Japan and
China. With regard to types of wine, Russia, USA and Japan apply a lower import duty to bulk wine
compared to bottled wine. The opposite is observed for China.
Excise duty is particularly high in Singapore, Norway, Australia and the UK (but also in Denmark) and
is calculated on sales value (not as a percentage). In contrast, no excise duty is applied in Hong Kong
and in Germany.
VAT: Denmark and Norway apply the highest Value Added Tax, in contrast to Japan, USA and
Singapore, where VAT is relatively low. Hong Kong does not apply this tax at all.
In theory, the level of taxation applied in the examined countries should not generate competitive advantages
for different types of wine and different origin, it should only have an effect on the size of demand at
aggregate level51
. As an example, Tab. 21 shows the consumer price of the same wine in different country
markets. The important price differences observed influence demand in terms of targets (socioeconomic
groups) and sale volumes (as a result of the first effect).
Tab. 21: Formation of wine market price (€/bottle)
Source: Based on ICEX, 2012, 2013.
In reality, the situation is more complex, with different tax systems de facto generating competitive
advantage for certain types of wine.
In countries (such as the UK) where the Excise Duty is not in line with the value of production, but is applied
to volume unit, it is not worth buying low-priced wines: the incidence of the excise duty on the consumer
price is exaggerated compared to high price/quality wines52
. Therefore, in these countries, wines of low
price/ quality are virtually absent from the market. As a result, this severely limits the access to the market
for wines originating from countries/regions53
specialized in the production of wines for the mass market54
.
A concrete example provided in Tab. 22 for the UK helps to clarify this concept.
Tab. 22: Price formation for wines of different price at origin and final price/price at origin ratio (£)
Source: Bibendum, 2014
5.5.5.2 Multilateral and bilateral trade agreements between producer and consumer countries
This part of the analysis aims to assess whether a relationship exists between wine import trends and free
trade agreements (FTA) of the top importers of bottled wine at global level (including the country markets
analysed as case studies) with the most important exporters (EU, NWC, Western Balkans and Caucasus).
51 In general, taxation represents an obstacle for market demand growth, especially in the low income segments of the population.
However, for the high-income segments that are sensitive to the “status” content of wines, the opposite may be true. In Russia, for
example, the elasticity of demand to price is positive for Top Range wines. Paradoxically then, wine demand grows with
increasing consumer prices (i.e. Veblen effect. See Russia Case Study monograph). 52 In other words, the consumer would spend a disproportionate amount in taxes for low quality wines compared to high quality
wines, which would make purchase irrational. 53 For example, low price/quality wines of Italy (Sicily, Apulia), Spain (Castilla-La Mancha) and France (Languedoc-Roussillon). 54 In this respect, we can recall the differences between the UK market and the German market previously mentioned.
Ex-works price 2.00 2.00 2.00 2.00
Trasportation cost 1.10 0.50 0.18 0.20
CIF price 3.10 2.50 2.18 2.20
Price + Customs duties 14% 3.53 20% 3.00 0% 2.18 0% 2.20
Price + Excise duties 10% 3.89 0.40 € 3.40 2.42 € 4.60 0% 2.20
Price + VAT 17% 4.55 18% 3.98 20% 5.38 19% 2.57
Price + Importer's margin 25% 5.69 80% 7.16 10% 6.73 10% 3.22
Price + Retailer's margin 50% 8.53 40% 10.02 32% 10.09 32% 4.83
China Russia United Kingdom Germany
Consumer
cost per
bottle
Retailer
margin
Excise duty VAT Packaging Logistics Money for
wine
Consumer cost
/Money for
wine
5.0 1.09 2.05 0.83 0.36 0.20 0.47 10.64
7.5 2.03 2.05 1.25 0.36 0.20 1.61 4.66
10.0 2.85 2.05 1.67 0.36 0.20 2.87 3.48
20.0 6.89 2.05 3.33 0.36 0.20 7.17 2.79

STUDY ON THE COMPETITIVENESS OF EUROPEAN WINES 95
A summary of existing FTAs (bi- and multi-lateral) including wine is presented in Tab. 23.
Tab. 23: Free Trade Agreements with reduced or zero import duties
Sources: EU - DG Trade (Market Access Database), WTO and National Governmental Trade Departments
EU China Russia USA Japan Canada Switzerland Norway Australia Singapore Brazil
• • *•
1999
(customs
duty
8.5CHF/100
kg gross
weight)
Since 1994
Norway is
part of EEA
(duty free)°°
X •
Argentina •1991 (duty
free)^
Australia •
2004 (tariff
phasing-out
over 11
years)
2014
(immediate
tariff
phasing-out
for bulk,
gradual for
bottles)
2003
(immediate
tariff
abolition on
all goods)
Chile
2002 (tariff
phasing-out
over 4 years
except
denominatio
ns protected
by EU)
2006 (tariff
phasing-out
over 10
years to
2015)
2004 (tariff
phasing-out
over 11
years)
2007 (tariff
phasing out
over 12
years)
1997 (tariff
phasing out -
duty free by
2003)
2004 (wine is
not included
in FTA)°°
2004 (wine
enters duty
free)°°
2009
(Chilean
wines face
5% import
tariff. Tariff
to be
eliminated
by 2015)
1996 (duty
free)^^
New Zealand
2008 (wines
enter duty
free since
2013)
•
1983 (duty
free since
1990)
2001
(immediate
tariff
abolition on
all goods)
South Africa 1999 (duty
free quota)
2008
(immediate
duty-free
access)°°°
2008
(immediate
duty-free
access)°°°
USA •1994
(NAFTA)
2004 (US
wines face
5% import
tariff)
2004 (duty
free)•
Bosnia-
Herzegovina
2008 (duty
free quota)X°° X°°
FYROM2001 (duty
free quota)
2002 (MFN
duty rate
minus 17.50
CHF/100 kg
gross for still
wine)°°
2002 (Duty
free)°°
Montenegro2007 (duty
free quota)
2012 (duty
free for still
wines)°°
2012 (duty
free)°°
Serbia2010(duty
free quota)
2000 (only
1% customs
record
keeping tariff
for still wine)
2010 (duty
free for still
wines)°°
2011 (duty
free)°°
Armenia X
Georgia X
1994
(Embargo
imposed in
2006, lifted in
2013)
Moldova X°
1993 (Ban on
wine imports
in Sept 2013)
Ukraine X
2012 (0.3 or
0.4 €/litre for
still wines; 7
years
phasing-
out)°°
2012 (duty
free)°°
* MFN at 0% except for Icewine and 4-5 other wines
• Negotiations for FTA between China and Australia are ongoing
• Negotiations for FTA between USA and EU are ongoing (Transatlantic Trade and Investment Partnership - TTIP)
• Negotiations for FTA between Japan and EU are ongoing
• Negotiations for FTA between Canada and EU are ongoing (Comprehensive Economic and Trade Agreement - CETA)
• Negotiations for FTA between NZ and Russia-Belorus and Kazakhstan started in 2010, then halted in Feb 2014 because of Ukraine-Crimea crisis
• Negotiations for FTA between EU and MERCOSUR are ongoing (Argentina, Brazil)
• Agreement on Trade and Economic Cooperation was signed between USA and Brazil in 2011
° FTA with Moldova including wines will become effective at beginning of 2015
°° FTA through EFTA (often added bilateral agreement on food products)
°°° Bilateral FTA with Southern African Customs Union (SACU)
^ Mercosur
^^ Agreement of Chile with Mercosur
X FTA signed but not yet applied
NW
CC
au
ca
sus
Fo
rm
er S
ov
iet
Rep
ub
lics
Ma
in m
ark
et
co
mp
eti
tors
Main wine consumer markets
West
ern
Ba
lka
ns
European Union

STUDY ON THE COMPETITIVENESS OF EUROPEAN WINES 96
Horizontal analysis of Tab. 23 shows Chile as the producer country that has developed more bilateral
agreements with wine consumer countries (in practice, with all considered countries, except Russia and
Singapore). Vertical analysis of Tab. 23 highlights the European Union as the consumer “country” that has
developed more bilateral agreements with wine producing countries.
Within existing trade agreements, a distinction needs to be made between those specific to wine (or wine and
spirits), such as between the EU and the US (2006) and the EU-Australia (2009) and those that include a
number of sectors (agricultural or/and non-agricultural) or cover not only goods, but also services and
investments, such as China-Chile and China-New Zealand FTAs. For the latter types, it can be argued that
rules for wine may acquire or lose importance (in relative terms) depending on the economic importance of
other sectors covered by the agreements, as trade-offs between different types of traded goods (or services)
are likely to occur.
Distinction should also be made between trade agreements specifically aimed at tariff reduction and those
specific for or including mutual recognition of Geographical Indications (GIs), oenological practices,
protection of traditional terms and labelling. Since 1994, the EU has developed various specific agreements
for protection of GIs for wines and spirits (see also §3.3.3) with other key producing countries, beginning
with Australia (wine 1994, renewed 2008), Chile (wine and spirits, 2002), South Africa (wine and spirits,
2002), Canada (wine and spirits, 2003) and the USA (wine, 2006; updated 2011). The primary purpose of
these agreements was to provide for the mutual recognition of specific GIs as well as phase-out the use of
specific wine and spirit terms of European origin, which had acquired ‘generic’ status in the partner
countries, in particular Canada and the USA.
At the international level, GIs are legally provided for by the WTO Agreement on Trade Related Aspects of
Intellectual Property Rights (TRIPS), which defines GIs as “indications which identify a good as originating
in the territory of a Member, or a region or locality in that territory, where a given quality, reputation or other
characteristic of the good is essentially attributable to its geographical origin”55
and establishes a two-tier
system for their protection (art.22 provides a basic level of protection for all GIs, while art.23 provides an
enhanced level of protection specifically for wines and spirits). This protection system has been under
negotiation within the WTO’s Doha Development Agenda (DDA).
The EU has also asked for the inclusion of an annex to the TRIPS Agreement establishing a multilateral
system of registration of GIs56
. However, such initiative has not made much progress due to opposition, in
particular, from the USA, Australia, Chile, New Zealand, Argentina, Canada and Japan57
. Until the TRIPS
agreement will not offer adequate protection for European GIs, the EU is seeking this objective through
different types of bilateral agreements58
. These include stand-alone agreements for wine and spirits (e.g. EU
with Australia, Canada, the US59
, etc.) and as part of agreements for trade in agricultural products (e.g., EU
with Switzerland); agreements with countries involved in the EU enlargement (e.g. Western Balkans and
Turkey) finalised at aligning their GI systems to the acquis; GI specific agreements with neighbouring
countries (e.g. Moldova, Ukraine, Georgia); through negotiation of FTAs with key trading partners as part of
the Global Europe Strategy launched in 200660
; and also through commitments to GI cooperation in
Economic Partnership Agreement (EPA) negotiations with African and Caribbean Countries (ACP).
5.5.5.2.1 Effects of bilateral trade agreements on wine trade
For each of the 13 most important wine import markets, we have considered imports of bottled and bulk
wine between 2000 and 2012 (source: Comtrade) from the EU and the other main exporters with whom a
55 “Protection of Geographical Indications” of the Agreement on Trade-Related Aspects of Intellectual Property Rights (TRIPS
Agreement), http://www.wto.org/english/docs_e/legal_e/27-trips_03_e.htm 56World Trade Organisation, Geographical Indications, Communication from the European Communities, 14 June 2005,
http://www.wto.org/english/tratop_e/trips_e/gi_background_e.htm (last negotiations on the multilateral register were held in 2011). 57 They submitted a Joint Proposal on the register suggesting a mere GI database. 58 DG AGRI Working Document on international protection of GIs: objectives, outcomes and challenges, 25 June 2012. 59 However, the 2006 EU-US wine agreement provides for mutual protection of “names of origin” but not specifically of GIs. 60 European Commission, Communication from the Commission to the Council, the European Parliament, the European Economic
and Social Committee and the Committee of the Region, Global Europe: Competing in the World. A Contribution to the EU’s
Growth and Jobs Strategy, COM(2006) 567, Brussels, 4 October 2006.

STUDY ON THE COMPETITIVENESS OF EUROPEAN WINES 97
trade agreement is in place. The analysis of import trends, in the light of the existing trade agreements that
include import tariff reduction or elimination, leads to the following observations61
:
In general, the analysis does not reveal obvious structural breaks or “jumps” in imports that can be
connected to the implementation of trade agreements;
However, in a few cases a more pronounced growth of imports starting after implementation of an
agreement (growth that is also maintained in the following years, therefore not a market effect of some
sort) suggests that trade agreements may have had an impact, as it would be expected. In most of such
cases, imports increase appears to be gradual, probably moving in parallel with phasing-out of import
tariffs. It is however difficult to know whether other market occurrences and/or policies may have
played a simultaneous role. In synthesis, we observe that in:
- Singapore: FTAs with New Zealand, USA and Australia have probably had some effect in boosting
imports of bottled wine from these countries. In particular, Australian wine imports reach the same
import levels of EU wines in 2004 and only after 2008 EU wines recover their market leadership;
- Japan and China: FTAs with Chile has probably had an effect on bottled wine imports, as shown by
more pronounced growth starting in the year right after implementation of the agreements (2006 for
China and 2007 for Japan). In Japan, the impact is even stronger on bulk wine imports, with Chile
overtaking the EU in 2008 and maintaining leadership in this market in subsequent years. We
should not forget, though, that both markets show greater preference for European wines and
Chinese imports of bottled wines from the EU grow at a much faster pace than imports from Chile
and New Zealand (the only other country with which China has a bilateral agreement for wine
since 2008);
- USA: a marked increase in bulk wine imports from Australia is observed in 2005 and 2006, right
after a bilateral agreement was signed between these two countries (however, imports of bottled
wine stabilise from 2005 onwards after consistent growth in the 5 previous years, suggesting that
there was at least partial substitution of bottled wine with bulk). An even larger leap upwards is
observed between 2008 and 2009 in bulk imports from both Australia and Chile. Notwithstanding a
possible impact of FTAs, this sudden leap in US bulk imports from the two countries is likely to be
related to other factors, as US bulk exports (mainly towards the UK and Italy) also considerably
increase over the same time interval.
On the three EU markets (Denmark, Germany and the UK), FTAs of the EU with Chile and South
Africa may have had some impact on bulk wine imports. Bulk imports from South Africa, in particular,
grow quite consistently especially in the UK (but also in Denmark), however this is also an effect of
substitution of bottled imports with bulk imports from this country.
As for impact of trade agreements specific for the protection of GIs between the EU and its main trade
partners on wine imports from the EU, we have examined the share of of PDO and PGI wine imports over
total still wine imports from the EU in three major markets: the US, Canada and Australia, between 2000 and
2013 (source: Comext).
Overall, the results do not suggest a significant impact of such trade agreements in boosting imports of
PDO/PGI wines into the US and Canada. In fact, the share of PDO/PGI wines over total wine imports from
the EU decreases for the US (64% on average in 2000-2002; 58% on average in 2011-2013) and remains
fairly stable for Canada (60% in 2000-2002; 62% on average in 2011-2013). On the other hand, and
notwithstanding year-on-year fluctuations, the share of European GI wines over total EU wines imported into
Australia increases from 52% (on average 2000-2002) to 59% (average 2011-2013). This increase occurred
in the years after 2008.
5.5.5.3 Support policies and regulatory measures in the EU and in NWC
The aim of this part of the analysis is to provide a synthesis of governmental (or other institutional) strategic
policies to improve the performance of supply chains, market access and wine competitiveness.
61 In the cases where FTAs are in place since the 1990s or earlier, it is impossibile to discern a relationship between import flows
(which we consider from 2000 onwards) and trade agreements.

STUDY ON THE COMPETITIVENESS OF EUROPEAN WINES 98
As previously illustrated, the 2008 wine CMO reform has introduced measures specifically aimed at
improving competitiveness of EU wines on foreign markets (in particular, the measure "Promotion on third
country markets"). However, the EU is not alone in the adoption of policies targeted to assist domestic wine
industries promote their wines on international markets and develop export markets so as to improve their
competitiveness62
. In particular during the last decade, the EU’s main competitors have developed specific
policies to support wine marketing, market access and export initiatives.
Tab. 24: Policy measures developed by the EU and NWCs with potential effects on market access and competitiveness
Sources: EU-DG Agri, E-Bacchus, National legislation for NWC and various literature
From a vertical reading of Tab. 24, it is clear that the EU has developed measures in virtually all policy areas
and more than its competitors. A horizontal examination of Tab. 24 suggests that the most popular measures
are those geared to directly support exports through promotional activities (benefitting from public funding
or co-funding, see previous §5.5.4), participation of industry in international trade fairs and similar.
Therefore, all wine producers (EU and non-EU) compete on a par in this respect.
Some NWCs have also developed national wine brands or other initiatives such as international Wine
Awards, used to promote and, thus, increase awareness of national wine products through generic
advertising. Examples are the cases of New Zealand (“New Zealand Wine” brand), South Africa (“Brand
South Africa”) and Argentina (annual “Argentina Wine Awards” organised by Wines of Argentina).
A wine's origin is a key part of its identity, as it implies something about its style and quality. Many names of
origin are used on wine labels worldwide. Some of these indicate only the wine's origin, while others
combine origin, style and quality.
Examples of the first type include 696 US wines under geographical indication (most of which linked to an
American Viticultural Area AVA), Australia's 78 wines under GI (Geographical Indication) and South
Africa's 153 wines with geographical indication (Wine of Origin scheme) (source: DG Agri E-Bacchus).
Examples of the second type are found mostly in Europe (i.e. PDO and PGI). Similarly to trademarks,
Geographical Indications (GIs) are intellectual property instruments. However, in spite of these being
covered by the WTO Agreement on Trade Related Aspects of Intellectual Property Rights (TRIPS), legal
recognition of GIs outside Europe often requires the existence of a bilateral agreement between the EU and
importing countries, as previously illustrated in §5.5.5.2.
In terms of the potential impact of this type of policy measure on EU wines access to and competitiveness on
export markets, PDO and PGI can be considered, per se, as an asset for the image of European wines on
foreign markets, in particular for wines positioned at the top end of the price/quality range. However,
restrictions sometimes imposed by producers’ organisations or PDO/PGI consortia in the production
protocols, such as prohibition of bottling the wine outside the geographical production area (e.g. Rioja) may
produce negative effects in terms of hindering market access to certain European GI wines (e.g. the Spanish
wine Rioja, cannot be exported in bulk (i.e. at competitive prices) to be bottled directly at destination, thus
risking loss of market share to similar wines from non-EU competitors, as illustrated in the analysis of
Theme 3 – see §6.3.2). It should be mentioned, however, that for particular market segments (i.e. Top Range
wine consumers with higher interest in and knowledge of high quality wines), PDO wines bottled outside
their terroir may lose in image.
62 See Chapters 3 and 4.
EU USA Chile Argentina AustraliaNew
Zealand
South
Africa
Wine export/promotion programmes х х х х х х х
Duties and tax refunds х
Support to generic advertising (country brands) х х х х
Support to R&D and innovation х х х х
Control of production potential х
Oenological practices, labelling rules х х
Geographical indications, designations of origin х х х х

STUDY ON THE COMPETITIVENESS OF EUROPEAN WINES 99
Similarly, restrictions adopted in some Member States for the use of grape varietals in labelling (e.g. Italy)
may play against foreign market development in countries where the mention of grape variety is considered
as a factor of competitiveness (e.g. USA and UK).
In terms of oenological practices and labelling requirements, the EU has always had overall more stringent
rules than its competitors (possibly, with the only exception of the US that have a similarly developed
system). This can constitute a negative factor for the development of the competitiveness of European wines
on international markets (i.e. higher production costs). In some cases, however, mutual recognition of
oenological practices and labelling requirements between the EU and its trade partners is in place within
trade agreements (see §3.3.3).
Between 1998-1999 the most important non-EU wine producers created the World Wine Trade Group
(WWTG) as “an informal group of government representatives with a mutual interest in facilitating the
international trade in wine and avoiding the application of obstacles to international trade in wine” and in
participating in networking and information sharing to provide better access to international wine markets.
The founding members of the WWTG are: Argentina, Australia, Canada, Chile, New Zealand, South Africa,
and the United States. The Republic of Georgia acceded to the WWTG Agreements in 2010. Brazil was also
a founding member, regularly attending WWTG meetings. Other countries have also participated in the
meetings on a less regular basis: China, Mexico, Paraguay and Uruguay.
Within the WWTG, Australia, Canada, Chile, New Zealand and the US have signed an Agreement on
Mutual Acceptance of Oenological Practices (entered into force in December 2002). The same countries with
the addition of Argentina have also signed an Agreement on Requirements for Wine Labelling, entered into
force in July 2010.
Control of production potential is only implemented by the EU (through restructuring of vineyards and
restrictions on planting rights63
). Given the overall expansion of vineyard areas and wine production in third
countries that are the EU’s main competitors in world markets (see §5.5.1.1), it could be argued that there is
a risk that these measures create a constraint to further export market development for European wines.
Finally, one interesting measure is the Drawback scheme implemented by the US, as described in §4.1.2.
This scheme allows for refunds, total or partial, of paid duties and taxes when an imported good is re-
exported, thus allowing American companies to compete in foreign markets without the handicap of
including taxes and duties in the costs. According to a recent study, under specific market conditions, the
drawback scheme is believed to stimulate imports and exports of wine in bulk (Sumner et al., 2011 and
2012). The evidence provided by the analysis of import-export trends observed for US wine in bulk suggests
that the drawback scheme may indeed represent a competitive factor for the US.
5.5.6 Chances
“Chances” group influences that cannot be foreseen, such as adverse climatic events that impact on
production level or quality, sudden political or policy changes, economic downturns, etc.
A good example is the embargo recently imposed by Russia to EU foods as a response to Euro-American
restrictions following Russia-Ukraine political tensions. Unforeseen events also occurred at different times in
China, such as:
Retaliation against European wines following imposition of a EU tax on Chinese solar panels, and
investigation on subsidies to the European wine sector (antidumping);
Measures taken against public officials lavish spending has affected the top end of the wine market:
grand crus volumes have plummeted and prices have collapsed (source: IWSR).
Another example of “chance” factors is the Danish government decision to increase excise duty on wine,
while lowering it on beer.
With regard to this group of influencing factors, we analyse the evolution of the relationships between
exchange rates of the various competitors currencies with the Euro. In previous sections we have seen the
63 Transitional planting rights will be replaced, from 2016 to 2030, by a new system of authorizations for vine planting (Articles 61-
70 of Reg. EC No 1308/2013).
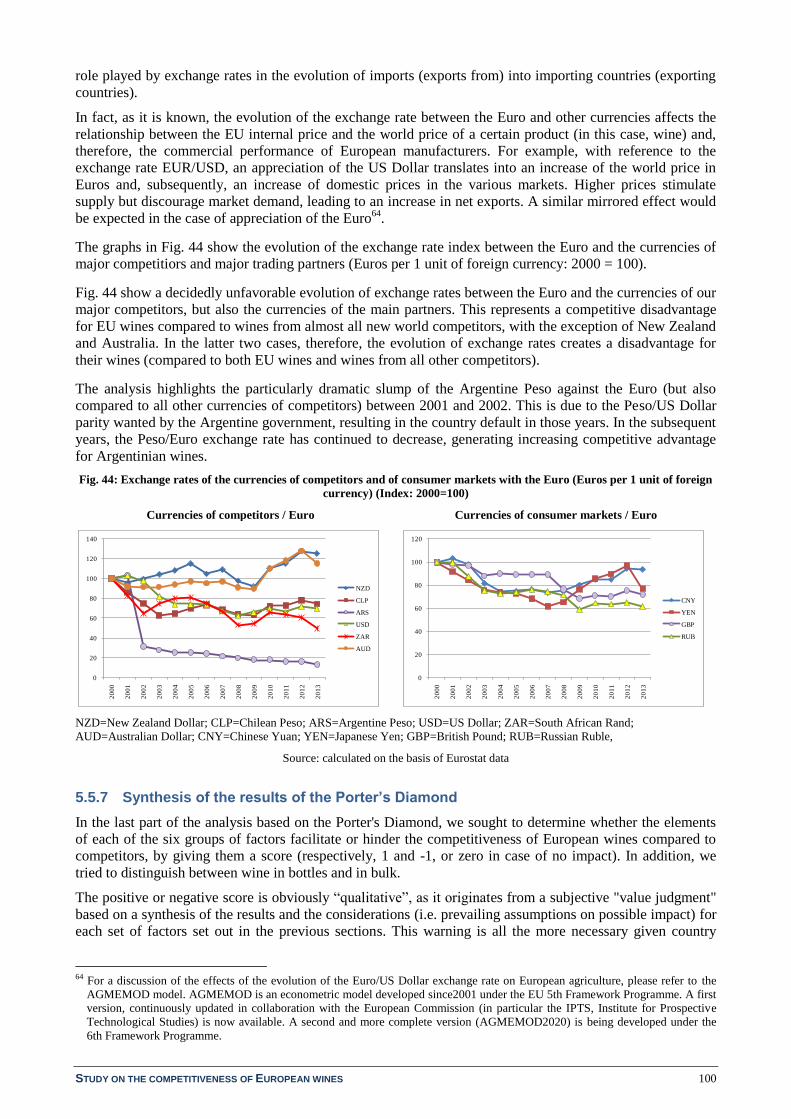
STUDY ON THE COMPETITIVENESS OF EUROPEAN WINES 100
role played by exchange rates in the evolution of imports (exports from) into importing countries (exporting
countries).
In fact, as it is known, the evolution of the exchange rate between the Euro and other currencies affects the
relationship between the EU internal price and the world price of a certain product (in this case, wine) and,
therefore, the commercial performance of European manufacturers. For example, with reference to the
exchange rate EUR/USD, an appreciation of the US Dollar translates into an increase of the world price in
Euros and, subsequently, an increase of domestic prices in the various markets. Higher prices stimulate
supply but discourage market demand, leading to an increase in net exports. A similar mirrored effect would
be expected in the case of appreciation of the Euro64
.
The graphs in Fig. 44 show the evolution of the exchange rate index between the Euro and the currencies of
major competitiors and major trading partners (Euros per 1 unit of foreign currency: 2000 = 100).
Fig. 44 show a decidedly unfavorable evolution of exchange rates between the Euro and the currencies of our
major competitors, but also the currencies of the main partners. This represents a competitive disadvantage
for EU wines compared to wines from almost all new world competitors, with the exception of New Zealand
and Australia. In the latter two cases, therefore, the evolution of exchange rates creates a disadvantage for
their wines (compared to both EU wines and wines from all other competitors).
The analysis highlights the particularly dramatic slump of the Argentine Peso against the Euro (but also
compared to all other currencies of competitors) between 2001 and 2002. This is due to the Peso/US Dollar
parity wanted by the Argentine government, resulting in the country default in those years. In the subsequent
years, the Peso/Euro exchange rate has continued to decrease, generating increasing competitive advantage
for Argentinian wines.
Fig. 44: Exchange rates of the currencies of competitors and of consumer markets with the Euro (Euros per 1 unit of foreign
currency) (Index: 2000=100)
Currencies of competitors / Euro Currencies of consumer markets / Euro
NZD=New Zealand Dollar; CLP=Chilean Peso; ARS=Argentine Peso; USD=US Dollar; ZAR=South African Rand;
AUD=Australian Dollar; CNY=Chinese Yuan; YEN=Japanese Yen; GBP=British Pound; RUB=Russian Ruble,
Source: calculated on the basis of Eurostat data
5.5.7 Synthesis of the results of the Porter’s Diamond
In the last part of the analysis based on the Porter's Diamond, we sought to determine whether the elements
of each of the six groups of factors facilitate or hinder the competitiveness of European wines compared to
competitors, by giving them a score (respectively, 1 and -1, or zero in case of no impact). In addition, we
tried to distinguish between wine in bottles and in bulk.
The positive or negative score is obviously “qualitative”, as it originates from a subjective "value judgment"
based on a synthesis of the results and the considerations (i.e. prevailing assumptions on possible impact) for
each set of factors set out in the previous sections. This warning is all the more necessary given country
64 For a discussion of the effects of the evolution of the Euro/US Dollar exchange rate on European agriculture, please refer to the
AGMEMOD model. AGMEMOD is an econometric model developed since2001 under the EU 5th Framework Programme. A first
version, continuously updated in collaboration with the European Commission (in particular the IPTS, Institute for Prospective
Technological Studies) is now available. A second and more complete version (AGMEMOD2020) is being developed under the
6th Framework Programme.
0
20
40
60
80
100
120
140
20
00
20
01
20
02
20
03
20
04
20
05
20
06
20
07
20
08
20
09
20
10
20
11
20
12
20
13
NZD
CLP
ARS
USD
ZAR
AUD
0
20
40
60
80
100
120
20
00
20
01
20
02
20
03
20
04
20
05
20
06
20
07
20
08
20
09
20
10
20
11
20
12
20
13
CNY
YEN
GBP
RUB
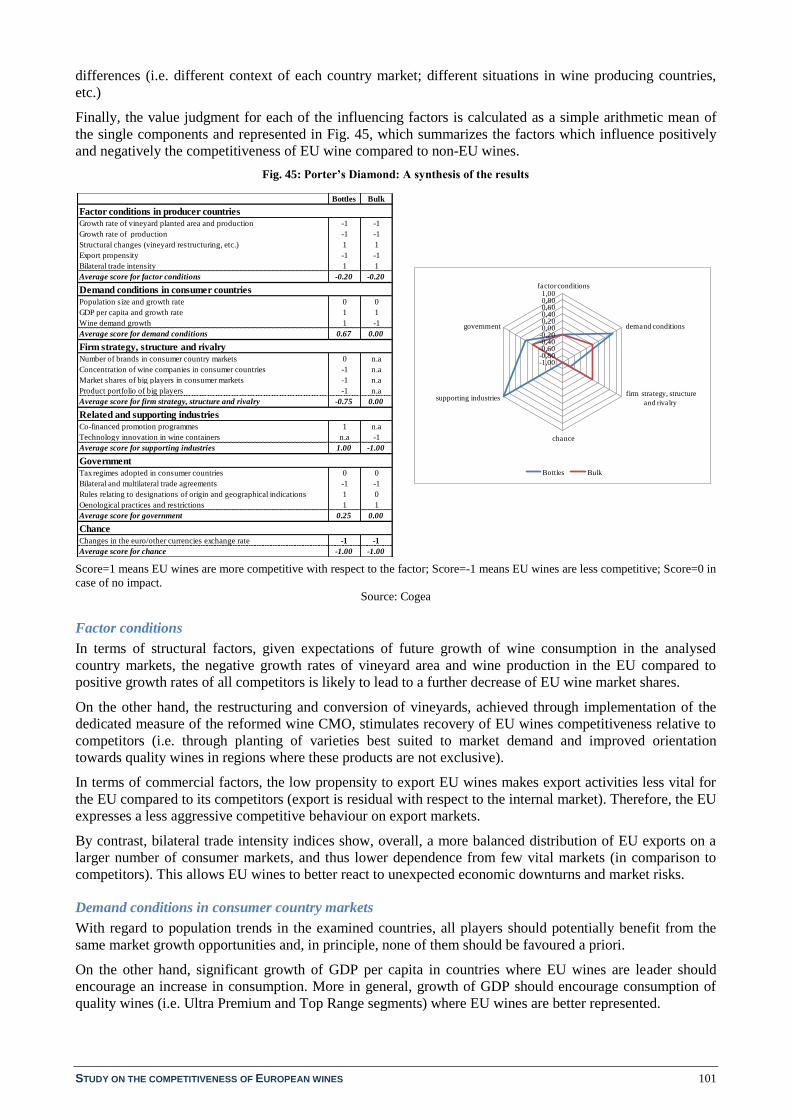
STUDY ON THE COMPETITIVENESS OF EUROPEAN WINES 101
differences (i.e. different context of each country market; different situations in wine producing countries,
etc.)
Finally, the value judgment for each of the influencing factors is calculated as a simple arithmetic mean of
the single components and represented in Fig. 45, which summarizes the factors which influence positively
and negatively the competitiveness of EU wine compared to non-EU wines.
Fig. 45: Porter’s Diamond: A synthesis of the results
Score=1 means EU wines are more competitive with respect to the factor; Score=-1 means EU wines are less competitive; Score=0 in
case of no impact.
Source: Cogea
Factor conditions
In terms of structural factors, given expectations of future growth of wine consumption in the analysed
country markets, the negative growth rates of vineyard area and wine production in the EU compared to
positive growth rates of all competitors is likely to lead to a further decrease of EU wine market shares.
On the other hand, the restructuring and conversion of vineyards, achieved through implementation of the
dedicated measure of the reformed wine CMO, stimulates recovery of EU wines competitiveness relative to
competitors (i.e. through planting of varieties best suited to market demand and improved orientation
towards quality wines in regions where these products are not exclusive).
In terms of commercial factors, the low propensity to export EU wines makes export activities less vital for
the EU compared to its competitors (export is residual with respect to the internal market). Therefore, the EU
expresses a less aggressive competitive behaviour on export markets.
By contrast, bilateral trade intensity indices show, overall, a more balanced distribution of EU exports on a
larger number of consumer markets, and thus lower dependence from few vital markets (in comparison to
competitors). This allows EU wines to better react to unexpected economic downturns and market risks.
Demand conditions in consumer country markets
With regard to population trends in the examined countries, all players should potentially benefit from the
same market growth opportunities and, in principle, none of them should be favoured a priori.
On the other hand, significant growth of GDP per capita in countries where EU wines are leader should
encourage an increase in consumption. More in general, growth of GDP should encourage consumption of
quality wines (i.e. Ultra Premium and Top Range segments) where EU wines are better represented.
Bottles Bulk
Growth rate of vineyard planted area and production -1 -1
Growth rate of production -1 -1
Structural changes (vineyard restructuring, etc.) 1 1
Export propensity -1 -1
Bilateral trade intensity 1 1
Average score for factor conditions -0.20 -0.20
Population size and growth rate 0 0
GDP per capita and growth rate 1 1
Wine demand growth 1 -1
Average score for demand conditions 0.67 0.00
Number of brands in consumer country markets 0 n.a
Concentration of wine companies in consumer countries -1 n.a
Market shares of big players in consumer markets -1 n.a
Product portfolio of big players -1 n.a
Average score for firm strategy, structure and rivalry -0.75 0.00
Co-financed promotion programmes 1 n.a
Technology innovation in wine containers n.a -1
Average score for supporting industries 1.00 -1.00
Tax regimes adopted in consumer countries 0 0
Bilateral and multilateral trade agreements -1 -1
Rules relating to designations of origin and geographical indications 1 0
Oenological practices and restrictions 1 1
Average score for government 0.25 0.00
Changes in the euro/other currencies exchange rate -1 -1
Average score for chance -1.00 -1.00
Chance
Factor conditions in producer countries
Demand conditions in consumer countries
Government
Firm strategy, structure and rivalry
Related and supporting industries
-1,00-0,80-0,60-0,40-0,200,000,200,400,600,801,00
factor conditions
demand conditions
firm strategy, structure
and rivalry
chance
supporting industries
government
Bottles Bulk

STUDY ON THE COMPETITIVENESS OF EUROPEAN WINES 102
The observed evolution of demand is beneficial for both wines in bottle and for wine in bulk. However,
changes in the transport system adopted by some New World wine exporters amount to competitive
disadvantage for EU wines in bulk and to an advantage for EU wines traded in bottles.
Firm strategy, structure and rivalry (bottled wines)
All factors related to firm strategies on key consumer markets suggest that EU wines are less competitive
compared to competitors. Specifically:
The lower percentage of European brands in the analysed consumer markets translates into lower
influence of European wines on consumer preferences (i.e. less choice compared to competitors).
In terms of market concentration, European major wine companies (i.e. French) do not appear in the top
four market leaders in most markets, except for two Member States (Germany, Denmark) and Hong
Kong. Therefore, EU companies hold more limited market power compared to competitors.
Compared to competitors, European wine businesses hold marginal market shares in all markets. Such
market shares are in any case attained through marketing of non-EU wine brands.
European wine companies have a percentage of non-EU wines in their product portfolios much larger
than the percentage of EU wines in the portfolios of non-European companies.
Related and supporting industries
EU wines appear to have an advantage over competitors due to larger investments in promotion programmes
(i.e. bottled wines) under the “Promotion on third-country markets” measure of the reformed wine CMO.
The use of new technology for transportation of wine in bulk (i.e. flexitank) by certain NWC leads to
competitive disadvantage for EU wines. However, this is due to self-imposed constraints by PDO and PGI
wine producers to bottling outside the production area.
Government
The different tax regimes applied in consumer countries have a greater or lesser influence on consumer
demand, but they apply in the same way to wines of different origin. Therefore, they do not generate
competitive advantage or disadvantage to EU wines compared to competitors, except for very few cases in
which Excise Duty is calculated on sales value, as it is in the UK.
On the other hand, bilateral trade agreements that lower or abolish tariffs can generate considerable
competitive advantage to country-systems. Some countries (Chile, in particular) have consistently developed
agreements with a number of wine importing partners. Compared to these countries, the EU finds itself in a
position of competitive disadvantage.
Overall, EU wines are in a position of advantage over individual competitors with respect to regulatory
measures. In particular, measures such denominations of origin and geographical indications increase the
competitiveness of European wines (at least on the EU market). In addition, the alignment of EU oenological
practices with the recommendations of the OIV (less restrictive than those historically applied by the EU)
can improve the competitiveness of European wines in market segments where competitors have strong
presence.
Chance
With regard to exchange rates between the Euro and other currencies, their evolution over time has generated
competitive disadvantage for European wines relative to most competitors.

STUDY ON THE COMPETITIVENESS OF EUROPEAN WINES 103
6 THEME 2 – IDENTIFICATION OF THE KEY FACTORS OF COMPETITIVENESS
This part of the analysis aims at identifying and analysing the key factors of competitiveness within the
system. By “within the system” we refer to all factors linked to product characteristics, as well as to the
behaviour of wine suppliers.
6.1 PROCEDURE AND METHODOLOGY ADOPTED FOR THE ANALYSIS
The analysis was carried out only for case study countries (China, Japan, Russia, USA, Denmark, Germany,
UK), separately for packaged wines (for final consumers) and for bulk wines (mainly for intermediate
consumption).
The analysis comprises two distinct phases:
1- The first phase, based on information collected directly from key market players and from the literature,
aims at identifying the factors of competitiveness and defining their current importance in establishing a
competitive advantage. The analysis seeks to discover:
a. The way in which EU wines currently respond to such factors, compared to wines from NWC and (if
applicable) to domestic wines;
b. A projection of the current importance of competitive factors to 2025 (to assess whether they will be
more or less important compared with the current situation).
2- The second phase, based on structural analysis, aims at identifying direct and indirect cause-effect
relationships among factors identified in the first phase (therefore establishing the key factors that
generate competitive advantage, so-called levers, as well as passive key factors, i.e. factors depending
on the activation of other factors).
6.1.1 Identification of factors of competitiveness and assessment of their importance
Survey of factors: the survey was carried out using three methods:
1- By administering a short questionnaire to interviewed key market actors, in which a series of possible
factors of competitiveness were suggested. For each of the two business areas (packaged and bulk
wines) the questionnaire contained two tables: the first was related to company behaviour, while the
second was related to the product. For packaged wines, in the second table, we asked interviewees to
express an opinion with respect to three market segments: Entry Level (EL), Medium Range (MR) and
Top Range (TR)65
, in order to identify any differences in the hierarchical structure of importance of the
factors of competitiveness. The questionnaire was used to collect informed opinions about the following
issues:
the importance of proposed factors of competitiveness on the basis of an evaluation scale: Extremely
important (3); Important (2); Not very important (1), Not a competitive factor (0);
the current competitiveness of EU wines compared to NWC and domestic wines. In this case, and
only for the proposed factors, interviewees were asked to express their opinion on the basis of an
evaluation scale: Better (B); Worse (W); Same (S); Do not know, do not answer (N);
the change of factors importance from the present situation to that expected in 2025. In this case too,
and only for the proposed factors on which they had expressed an evaluation of importance,
interviewees were asked to express their expectations on the basis of an evaluation scale: More
important (+); Equally important (=); Less important (-).
2- By means of in-depth interviews. In this case, interviewees were asked to express spontaneous opinions
regarding packaged wines, by answering the following questions:
65 We recall that such segmentation does not represent actual price ranges, but espresses a judgment/opinion relative to price/quality
levels (see §2.3).
STUDY ON THE COMPETITIVENESS OF EUROPEAN WINES 104
What are the most important criteria adopted by importers/distributors/buyers to select and decide
which wines and which brands to import and distribute?
What are the most important factors that companies must meet to distribute to: i) The on-trade
business; ii) Specialist wine stores/chains; iii) Food retail chains?
Given the segmentation of the consumer market in the Entry Level, Medium Range and Top Range,
what are the most important factors that a wine must possess to be successful in each segment?
In this case too, in relation to product factors, interviewees were asked to give their views for each of
the three market segments.
3- By analysing the available literature concerning the wine market in the case study countries.
Aggregation of factors of competitiveness: in particular for packaged wines, in addition to factors proposed
in the questionnaire to interviewees, we obtained a rather long list of factors (for both company behaviour
and product), in some cases expressed with only slight differences between them. Therefore, surveyed
factors were classified on the basis of “conceptual assonance” in order to reduce their number and avoid
useless repetitions.
With regard to packaged wine, the aggregation exercise allowed us to identify 41 factors of competitiveness.
Subsequently, we aggregated the factors into five groups that represent the areas in which competitiveness is
determined:
factors related to bargaining power and access to distribution channels
factors related to product
factors related to brand
factors related to marketing service
factors related to positioning.
Awarding of a “score” to non-suggested factors: in order to define the importance of the factors of
competitiveness in case study countries and within market segments, we had to award a “score” to
“classified” factors spontaneously mentioned by interviewees and those found in the literature (product- or
behaviour-related). Based on experience that spontaneous answers indicate the most important factors, we
assigned a value of 3 (Extremely important) to these answers, unless the interviewees gave a different
indication.
Furthermore, in the case of packaged wines, the judgement made by interviewees on factors related to the
behaviour of suppliers (for both proposed factors and those spontaneously suggested) was considered the
same for all three market segments (unless different indications were provided by interviewees).
Scores of factors of competitiveness indicated in analytical tables: in the analytical tables (presented in §6.2),
overall scores for each factor represent an average of the scores given by individual interviewees or based on
their spontaneous statements. Average values thus calculated were then rounded to the nearest figure (e.g.
≤1.49=1; between 1.5-2.49=2; ≥2.5=3).
Limitations of the analysis: due to the limited number of interviews, the results are not statistically
significant and merely represent a synthesis of individual opinions. Furthermore, the awarding of scores to
spontaneously reported factors and to those mentioned in the literature is, to some extent, inevitably
arbitrary.
With regard to opinions expressed differentiating between the proposed market segments, we should bear in
mind that the concept of Entry Level, Medium Range and Top Range segments may vary in the different
market/country contexts. Therefore, the results should also be contextualised and the overall score values for
all seven surveyed countries should be treated with caution.

STUDY ON THE COMPETITIVENESS OF EUROPEAN WINES 105
6.1.2 Methodology used to establish cause-effect relationships among factors
In the second phase, we used structural analysis and applied the MicMac method. This method was only used
for packaged wines66
. It comprises the following steps:
Step 1: description of the direct relations between the factors defined in the preliminary phase. Direct
relationships can be represented in a matrix (Tab. 25). In this matrix, the total of the connections in a row
indicates the importance of the influence of a factor on the whole system, whereas the total in a column
indicates the degree of dependence of a factor. The entries in the matrix are qualitative: 0 if there is no direct
relation between factors I and J, and 1 in the opposite case. Alternatively, it is possible to express the
intensity of the relationships on a scale (e.g. 0 = null, 1 = weak, 2 = medium, 3 = strong).
Tab. 25: Structural analysis matrix
Step 2: The values of row and column sums are then transferred onto an Influence-dependence map, where
the x-axis shows the dependence and the y-axis shows the influence (Fig. 46).
Fig. 46: Influence-dependence space map
Sector 1 groups factors with high influence on other factors and low dependence from other factors.
These are termed “levers” as they influence the analysed system more than they are influenced by it;
Sector 2 includes factors that have strong influence on the system and, at the same time, are also
strongly influenced by other factors. This means that intervention on such critical factors will be passed
on to other factors within the system (i.e. the initial impact is spread and amplified);
Sector 3 groups so called passive factors with low influence and high dependence. These factors are
influenced by the analysed system more than they appear to influence the system;
Sector 4 includes so called buffering or “lazy” factors: they are independent factors (whatever their
objective importance), with no influence or dependence relationship with other factors.
Step 3: application of the MicMac method. This method, applied through a specific software, calculates the
indirect relationships between the factors. Indirect relationships of the second, third ... nth degree are
calculated through matrix multiplication (exponentiation of the Matrix to M2, M
3, ... M
n). From each
exponentiation a new hierarchy of factors is obtained. The matrix becomes stable after a number of
iterations. Therefore, the method makes it possible to prioritise the factors on the basis of their influence or
their dependence, and taking into account their inter-relationships. This hierarchy of indirect factors allows
us to identify factors that, thanks also to their indirect action, play a major role, which the direct ranking did
not allow us to detect.
66 For wine in bulk, the extremely limited number of competitive factors prevented the application of this analytical tool.
Effect:
of
onFact 1 Fact … Fact i Fact j … Fact n Σ
Fact 1
Fact …
Fact i aij L
Fact j aji
…
Fact n
Σ C
1- Levers
(active factors)2- Critical
Dynamic factors)
4- Buffering
(lazy factors)3-Passive factors
Dependence
Infl
uen
ce
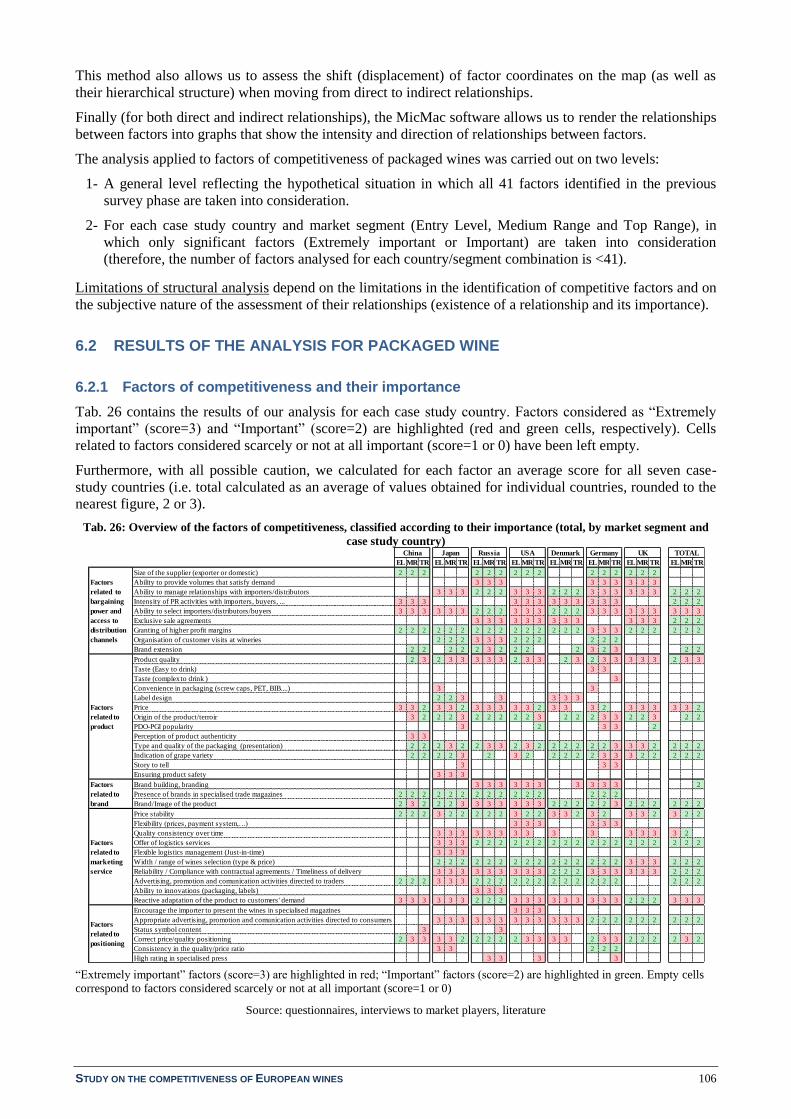
STUDY ON THE COMPETITIVENESS OF EUROPEAN WINES 106
This method also allows us to assess the shift (displacement) of factor coordinates on the map (as well as
their hierarchical structure) when moving from direct to indirect relationships.
Finally (for both direct and indirect relationships), the MicMac software allows us to render the relationships
between factors into graphs that show the intensity and direction of relationships between factors.
The analysis applied to factors of competitiveness of packaged wines was carried out on two levels:
1- A general level reflecting the hypothetical situation in which all 41 factors identified in the previous
survey phase are taken into consideration.
2- For each case study country and market segment (Entry Level, Medium Range and Top Range), in
which only significant factors (Extremely important or Important) are taken into consideration
(therefore, the number of factors analysed for each country/segment combination is <41).
Limitations of structural analysis depend on the limitations in the identification of competitive factors and on
the subjective nature of the assessment of their relationships (existence of a relationship and its importance).
6.2 RESULTS OF THE ANALYSIS FOR PACKAGED WINE
6.2.1 Factors of competitiveness and their importance
Tab. 26 contains the results of our analysis for each case study country. Factors considered as “Extremely
important” (score=3) and “Important” (score=2) are highlighted (red and green cells, respectively). Cells
related to factors considered scarcely or not at all important (score=1 or 0) have been left empty.
Furthermore, with all possible caution, we calculated for each factor an average score for all seven case-
study countries (i.e. total calculated as an average of values obtained for individual countries, rounded to the
nearest figure, 2 or 3).
Tab. 26: Overview of the factors of competitiveness, classified according to their importance (total, by market segment and
case study country)
“Extremely important” factors (score=3) are highlighted in red; “Important” factors (score=2) are highlighted in green. Empty cells
correspond to factors considered scarcely or not at all important (score=1 or 0)
Source: questionnaires, interviews to market players, literature
EL MR TR EL MR TR EL MR TR EL MR TR EL MR TR EL MR TR EL MR TR EL MR TR
Size of the supplier (exporter or domestic) 2 2 2 2 2 2 2 2 2 2 2 2 2 2 2
Ability to provide volumes that satisfy demand 3 3 3 3 3 3 3 3 3
Ability to manage relationships with importers/distributors 3 3 3 2 2 2 3 3 3 2 2 2 3 3 3 3 3 3 2 2 2
Intensity of PR activities with importers, buyers, ... 3 3 3 3 3 3 3 3 3 3 3 3 2 2 2
Ability to select importers/distributors/buyers 3 3 3 3 3 3 2 2 2 3 3 3 2 2 2 3 3 3 3 3 3 3 3 3
Exclusive sale agreements 3 3 3 3 3 3 3 3 3 3 3 3 2 2 2
Granting of higher profit margins 2 2 2 2 2 2 2 2 2 2 2 2 2 2 2 3 3 3 2 2 2 2 2 2
Organisation of customer visits at wineries 2 2 2 3 3 3 2 2 2 2 2 2
Brand extension 2 2 2 2 2 3 2 2 2 2 3 2 3 2 2
Product quality 2 3 2 3 3 3 3 3 2 3 3 2 3 2 3 3 3 3 3 2 3 3
Taste (Easy to drink) 3 3
Taste (complex to drink ) 3
Convenience in packaging (screw caps, PET, BIB....) 3 3
Label design 2 2 3 3 3 3 3
Price 3 3 2 3 3 2 3 3 3 3 3 2 3 3 3 2 3 3 3 3 3 2
Origin of the product/terroir 3 2 2 2 3 2 2 2 2 2 3 2 2 2 3 3 2 2 3 2 2
PDO-PGI popularity 3 2 3 3 2
Perception of product authenticity 3 3
Type and quality of the packaging (presentation) 2 2 2 3 2 2 3 3 2 3 2 2 2 2 2 2 3 3 3 2 2 2 2
Indication of grape variety 2 2 2 2 3 2 3 2 2 2 2 2 3 3 3 2 2 2 2 2
Story to tell 3 3 3
Ensuring product safety 3 3 3
Brand building, branding 3 3 3 3 3 3 3 3 3 3 2
Presence of brands in specialised trade magazines 2 2 2 2 2 2 2 2 2 2 2 2 2 2 2
Brand/Image of the product 2 3 2 2 2 3 3 3 3 3 3 3 2 2 2 2 2 3 2 2 2 2 2 2
Price stability 2 2 2 3 2 2 2 2 2 3 2 2 3 3 2 3 2 3 3 2 3 2 2
Flexibility (prices, payment system,…) 3 3 3 3 3 3
Quality consistency over time 3 3 3 3 3 3 3 3 3 3 3 3 3 3 2
Offer of logistics services 3 3 3 2 2 2 2 2 2 2 2 2 2 2 2 2 2 2 2 2 2
Flexible logistics management (Just-in-time) 3 3 3
Width / range of wines selection (type & price) 2 2 2 2 2 2 2 2 2 2 2 2 2 2 2 3 3 3 2 2 2
Reliability / Compliance with contractual agreements / Timeliness of delivery 3 3 3 3 3 3 3 3 3 2 2 2 3 3 3 3 3 3 2 2 2
Advertising, promotion and comunication activities directed to traders 2 2 2 3 3 3 2 2 2 2 2 2 2 2 2 2 2 2 2 2 2
Ability to innovations (packaging, labels) 3 3 3
Reactive adaptation of the product to customers' demand 3 3 3 3 3 3 2 2 2 3 3 3 3 3 3 3 3 3 2 2 2 3 3 3
Encourage the importer to present the wines in specialised magazines 3 3 3
Appropriate advertising, promotion and comunication activities directed to consumers 3 3 3 3 3 3 3 3 3 3 3 3 2 2 2 2 2 2 2 2 2
Status symbol content 3 3
Correct price/quality positioning 2 3 3 3 3 2 2 2 2 2 3 3 3 3 2 3 3 2 2 2 2 3 2
Consistency in the quality/price ratio 3 3 2 2 2
High rating in specialised press 3 3 3 3
Factors
related to
marketing
service
Factors
related to
positioning
TOTAL
Factors
related to
bargaining
power and
access to
distribution
channels
Factors
related to
product
Factors
related to
brand
UKGermanyChina Japan Russia USA Denmark
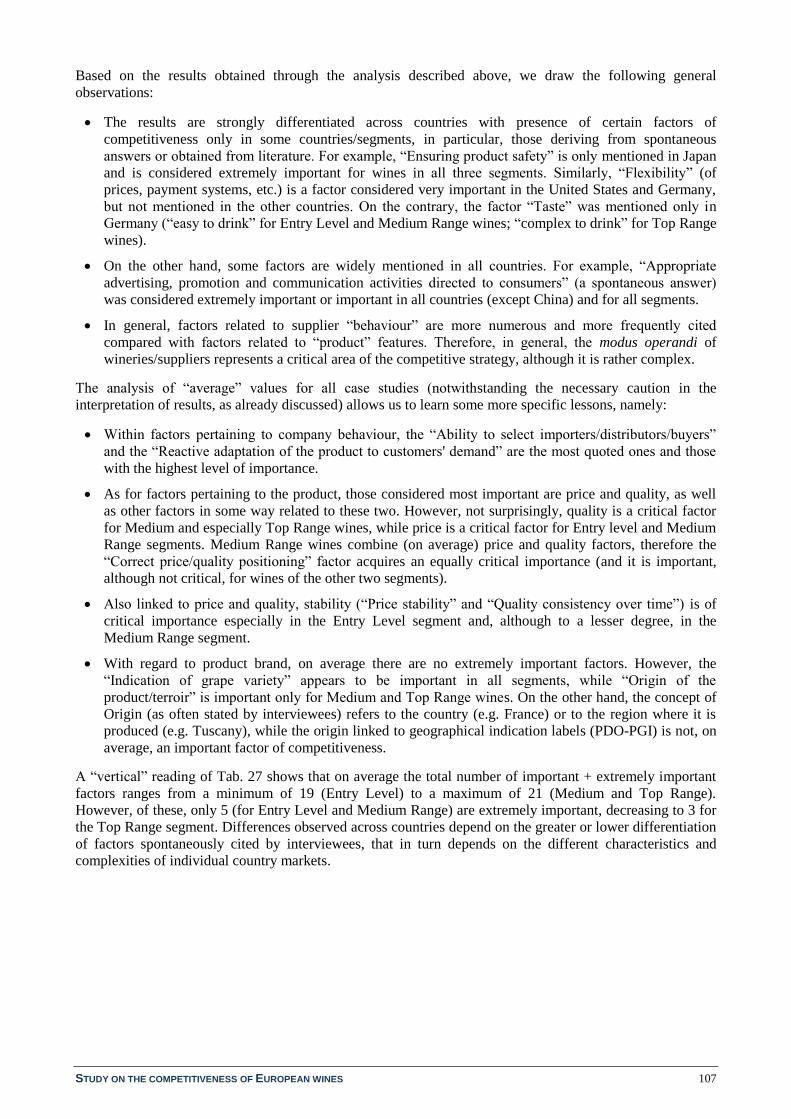
STUDY ON THE COMPETITIVENESS OF EUROPEAN WINES 107
Based on the results obtained through the analysis described above, we draw the following general
observations:
The results are strongly differentiated across countries with presence of certain factors of
competitiveness only in some countries/segments, in particular, those deriving from spontaneous
answers or obtained from literature. For example, “Ensuring product safety” is only mentioned in Japan
and is considered extremely important for wines in all three segments. Similarly, “Flexibility” (of
prices, payment systems, etc.) is a factor considered very important in the United States and Germany,
but not mentioned in the other countries. On the contrary, the factor “Taste” was mentioned only in
Germany (“easy to drink” for Entry Level and Medium Range wines; “complex to drink” for Top Range
wines).
On the other hand, some factors are widely mentioned in all countries. For example, “Appropriate
advertising, promotion and communication activities directed to consumers” (a spontaneous answer)
was considered extremely important or important in all countries (except China) and for all segments.
In general, factors related to supplier “behaviour” are more numerous and more frequently cited
compared with factors related to “product” features. Therefore, in general, the modus operandi of
wineries/suppliers represents a critical area of the competitive strategy, although it is rather complex.
The analysis of “average” values for all case studies (notwithstanding the necessary caution in the
interpretation of results, as already discussed) allows us to learn some more specific lessons, namely:
Within factors pertaining to company behaviour, the “Ability to select importers/distributors/buyers”
and the “Reactive adaptation of the product to customers' demand” are the most quoted ones and those
with the highest level of importance.
As for factors pertaining to the product, those considered most important are price and quality, as well
as other factors in some way related to these two. However, not surprisingly, quality is a critical factor
for Medium and especially Top Range wines, while price is a critical factor for Entry level and Medium
Range segments. Medium Range wines combine (on average) price and quality factors, therefore the
“Correct price/quality positioning” factor acquires an equally critical importance (and it is important,
although not critical, for wines of the other two segments).
Also linked to price and quality, stability (“Price stability” and “Quality consistency over time”) is of
critical importance especially in the Entry Level segment and, although to a lesser degree, in the
Medium Range segment.
With regard to product brand, on average there are no extremely important factors. However, the
“Indication of grape variety” appears to be important in all segments, while “Origin of the
product/terroir” is important only for Medium and Top Range wines. On the other hand, the concept of
Origin (as often stated by interviewees) refers to the country (e.g. France) or to the region where it is
produced (e.g. Tuscany), while the origin linked to geographical indication labels (PDO-PGI) is not, on
average, an important factor of competitiveness.
A “vertical” reading of Tab. 27 shows that on average the total number of important + extremely important
factors ranges from a minimum of 19 (Entry Level) to a maximum of 21 (Medium and Top Range).
However, of these, only 5 (for Entry Level and Medium Range) are extremely important, decreasing to 3 for
the Top Range segment. Differences observed across countries depend on the greater or lower differentiation
of factors spontaneously cited by interviewees, that in turn depends on the different characteristics and
complexities of individual country markets.

STUDY ON THE COMPETITIVENESS OF EUROPEAN WINES 108
Tab. 27: Total number of factors of competitiveness, both “extremely important” and “important”, by segment, by country
and overall
EL=Entry Level; MR=Medium Range; TR=Top Range.
EI = Extremely important; I = Important.
Source: questionnaires, interviews with market players, literature
6.2.2 Degree of response to factors of competitiveness of EU wines compared to NWC and domestic wines, based on opinions of market players
As already mentioned in the methodology, this analysis was carried out only for the factors of
competitiveness proposed through the questionnaire during interviews to market players.
In the tables presenting the results (Tab. 28 and Tab. 29), cells highlighted in red refer to factors of
competitiveness that were previously considered Extremely important (score=3), cells highlighted in green
refer to factors considered as Important (score=2). Empty cells identify factors considered scarcely or not at
all important (score=0 or 1) (see also analysis in the previous section).
The results of the comparison between EU and NWC wines are presented in the following table.
Tab. 28: Response of EU packaged wines to factors of competitiveness, compared with NWC wines
B=Better response of EU wines; W=Worse response; S=Same response
“Extremely important” factors (score=3) are highlighted in red; “Important” factors (score=2) are highlighted in green. Empty cells
correspond to factors considered scarcely or not at all important (score=1 or 0)
Source: questionnaires administered to market players
EL MR TR EL MR TR EL MR TR EL MR TR EL MR TR EL MR TR EL MR TR EL MR TR
Total 4 5 5 4 5 5 8 8 8 8 8 7 5 5 5 8 8 8 6 6 6 5 6 6
EI 2 2 2 2 2 2 3 4 3 4 4 4 2 2 2 3 3 4 3 3 3 1 1 1
I 2 3 3 2 3 3 5 4 5 4 4 3 3 3 3 5 5 4 3 3 3 4 5 5
Total 1 5 5 8 7 9 4 5 5 5 5 5 3 6 4 7 8 7 5 5 6 4 5 5
EI 1 2 2 3 4 7 2 2 4 2 3 2 2 1 2 3 6 7 3 3 2 1 2 1
I 0 3 3 5 3 2 2 3 1 3 2 3 1 5 2 4 2 0 2 2 4 3 3 4
Total 1 2 2 2 2 2 3 3 3 2 2 2 0 1 2 3 3 3 1 1 1 1 1 2
EI 0 1 0 0 0 1 2 1 1 2 2 2 0 0 1 1 1 1 0 0 0 0 0 0
I 1 1 2 2 2 1 1 2 2 0 0 0 0 1 1 2 2 2 1 1 1 1 1 2
Total 3 3 2 8 8 8 8 8 8 7 7 6 7 6 6 8 7 6 6 6 6 7 7 6
EI 1 1 1 7 6 6 3 3 3 5 4 3 2 1 1 5 3 3 3 3 2 3 1 1
I 2 2 1 1 2 2 5 5 5 2 3 3 5 5 5 3 4 3 3 3 4 3 1 1
Total 0 1 2 3 3 2 2 3 4 3 3 4 2 2 1 3 3 4 2 2 2 2 2 2
EI 0 1 2 3 3 1 1 2 3 1 2 3 2 1 1 0 1 1 0 0 0 0 1 0
I 0 0 0 0 0 1 1 1 1 2 1 1 0 1 0 3 2 3 2 2 2 2 1 2
Total 9 16 16 25 25 26 25 27 28 25 25 24 17 20 18 29 29 28 20 20 21 19 21 21
EI 4 7 7 15 15 17 11 12 14 14 15 14 8 5 7 12 14 16 9 9 7 5 5 3
I 5 9 9 10 10 9 14 15 14 11 10 10 9 15 11 17 15 12 11 11 14 14 16 18
UK TOTALChina Japan Russia USA Denmark
Factors related to product
Factors related to brand
Factors related to marketing
service
Factors related to positioning
Germany
Total factors
Factors related to bargaining
power and access to
distribution channels
EL MRTR EL MRTR EL MRTR EL MRTR EL MRTR EL MRTR EL MRTR EL MRTR
Size of the supplier (exporting or domestic company) B B B B B B S S S W W W
Ability to manage relationships with importers/distributors B B B B B B B B B S S S B B B S S S B B B
Ability to select importers/distributors/buyers B B B B B B B B B S S S W W W B B B B B B
Granting of higher profit margins B B B W W W S S S S S S S S S W W W S S S
Organisation of customer visits at wineries W W W B B B B B B B B B
Brand extension W B B B B B B B W S W W B S B
Product quality B B B B B B B B B B B W B W B W S B B B B B
Price W W S B B B W W B W B B S W B B S S W S W B B
Origin of the product/terroir B B W B B B B B B B B B B B W B B B B B B
Type and quality of the packaging (presentation) W W W B B B B B W B B S S W W W W W B B S B B
Indication of grape variety B W W B B B W B S S S W W W S S S S B S
Presence of brands in specialised trade magazines B B B W W W S S S S S S
Brand/Image of the product B B B B B B B B B B B B W B W B B B W S B B B B
Price stability B B W S B B S W B W W W S B S B W B B B W B B
Offer of logistics services B B B W W W B B B W W W B B B B B B B B B
Width / range of wines selection B B B B B B W W W S S S S S S W W W B B B
Reliability / Compliance with contractual agreements / Timeliness of delivery B B B W W W B B B S S S B B B W W W B B B
Advertising, promotion and comunication activities directed to traders B B B B B B S S S S S S W W W B B B
Reactive adaptation of the product to customers' demand B B B B B B S S S S S S B B B S S S B B B
Appropriate advertising, promotion and comunication activities directed to consumers B B B B B B W W W S S S W W W S S S B B B
Correct price/quality positioning S B B B B B S B B W W B B W B S B S S W S B B
4 9 9 19 20 20 20 21 20 21 21 19 15 17 17 21 21 19 17 17 17 16 18 18
2 6 5 14 19 19 13 15 16 10 12 12 1 3 3 10 7 9 4 6 7 10 16 16
1 2 3 4 1 1 5 6 4 7 5 3 3 4 3 7 8 6 6 5 5 2 0 0
TotalChina Japan Russia USA Denmark Germany
Factors related to
bargaining power
and access to
distribution
channels
UK
Factors related to
product
Factors related to
brand
Factors related to
marketing service
Factors related to
positioning
Total Factors
Total Better
Total Worse

STUDY ON THE COMPETITIVENESS OF EUROPEAN WINES 109
Total average results (always using the greatest caution) suggest that EU wines (and the behaviour of EU
suppliers) respond better to extremely important factors of competitiveness in all market segments, except
for price and its stability in the Entry Level segment. Furthermore, again on average, EU wines also appear
to respond better to all factors of competitiveness (extremely important + important), with the only exception
of few factors for which there is no difference between response of EU and NWC wines.
This general result derives from rather diversified opinions expressed at individual country level.
With regard to “Extremely important” factors of competitiveness, the response for EU wines (and supplier
behaviour) was considered clearly better than competitors’ in Japan (for almost all factors and segments),
while in other countries, although EU wines generally appear to be winners, results are less clear-cut.
However, the analysis does not identify any factors for which EU wines show a strength or a weakness
across all segments or all countries.
For some “Extremely important” factors, EU wines (and supplier behaviours) are never worse than their
competitors (in some cases they are equal): these are, in particular, the “Ability to manage relationships with
importers/distributors” and “Brand/Image of the product”.
With regard to most important factors of competitiveness considered jointly (Extremely important +
Important), the opinions of market players appear to be quite encouraging: in all countries and segments, the
number of factors for which EU wines (and supplier behaviour) response is better, is higher than the number
for which the response is worse. The only exceptions are Denmark (where for most factors the response is to
be considered the same), and the UK, in particular for the Entry Level segment.
With regard to market segments, results show that, in general, EU wines response improves moving from the
Entry Level to the Top Range segment (in the latter case, the Better/Total ratio is indeed highest in all
countries, with the only exception of China). On the contrary, worse response of EU wines (and EU
suppliers) is always found in the Entry Level segment, with the only exception of Germany.
With regard to factors for which the response of EU wines appears to be worse than the competitors’, the
situation is quite diversified across the examined markets. The most frequent factors are the following:
“Granting of higher profit margins” (in Russia and UK); “Price” (mainly in the Entry level and Medium
Range segments of China, USA, Russia, Denmark and UK); “Type and quality of packaging” (in some
segments, but not always the same ones, in a large number of countries); “Indication of grape variety” (in
particular, but not only, in the Entry Level segment); “Reliability / Compliance with contractual agreements /
Timeliness of delivery” (in Russia and the UK); “Width / range of wines selection” (in USA and the UK);
“Appropriate advertising, promotion and communication activities directed to consumers” (in USA and
Germany); “Offer of logistics services” (in Denmark and Germany) and “Reactive adaptation of the products
to customers’ demand” (USA and UK).
In any case, “Price” and “Type and quality of the packaging” seem to represent the main weaknesses of EU
wines (in both cases, the Worse/Total ratio reaches 40%), followed by “Indication of grape variety”
(Worse/Total = 35%).
As far as the comparison between EU and domestic wines is concerned, the analysis was carried out only for
China, Russia, USA and Germany (countries with significant wine production). Results are summarised in
Tab. 29.
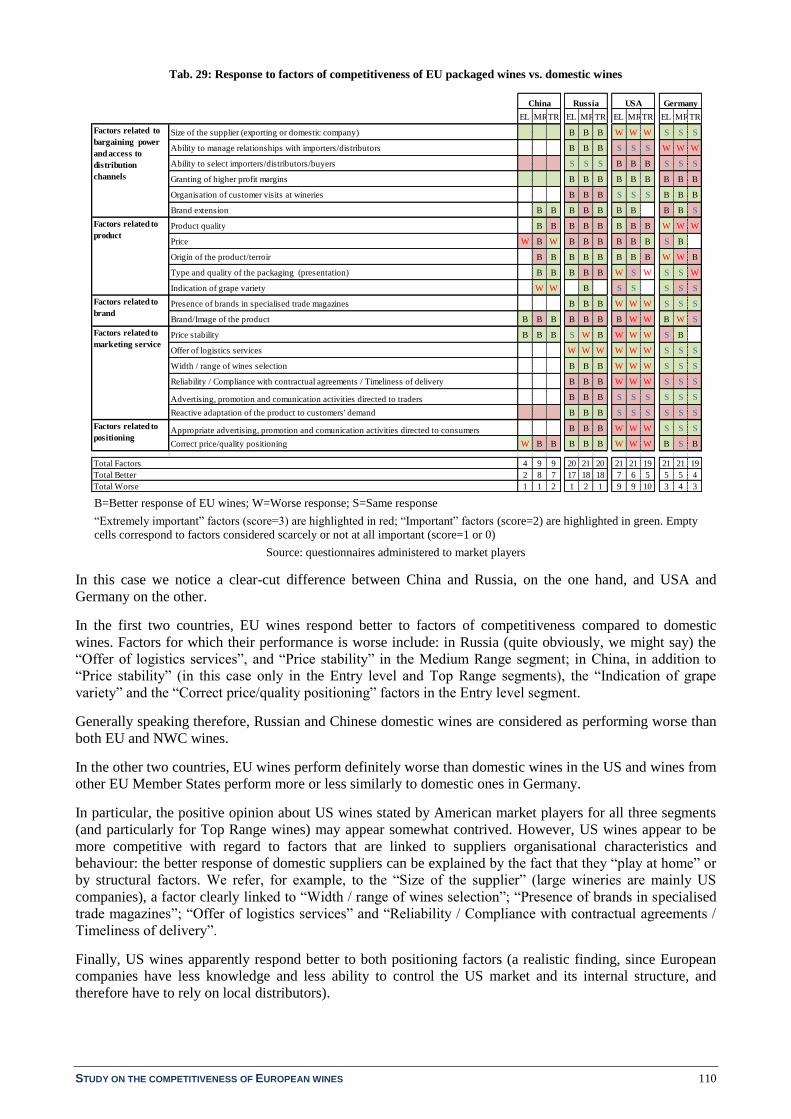
STUDY ON THE COMPETITIVENESS OF EUROPEAN WINES 110
Tab. 29: Response to factors of competitiveness of EU packaged wines vs. domestic wines
B=Better response of EU wines; W=Worse response; S=Same response
“Extremely important” factors (score=3) are highlighted in red; “Important” factors (score=2) are highlighted in green. Empty
cells correspond to factors considered scarcely or not at all important (score=1 or 0)
Source: questionnaires administered to market players
In this case we notice a clear-cut difference between China and Russia, on the one hand, and USA and
Germany on the other.
In the first two countries, EU wines respond better to factors of competitiveness compared to domestic
wines. Factors for which their performance is worse include: in Russia (quite obviously, we might say) the
“Offer of logistics services”, and “Price stability” in the Medium Range segment; in China, in addition to
“Price stability” (in this case only in the Entry level and Top Range segments), the “Indication of grape
variety” and the “Correct price/quality positioning” factors in the Entry level segment.
Generally speaking therefore, Russian and Chinese domestic wines are considered as performing worse than
both EU and NWC wines.
In the other two countries, EU wines perform definitely worse than domestic wines in the US and wines from
other EU Member States perform more or less similarly to domestic ones in Germany.
In particular, the positive opinion about US wines stated by American market players for all three segments
(and particularly for Top Range wines) may appear somewhat contrived. However, US wines appear to be
more competitive with regard to factors that are linked to suppliers organisational characteristics and
behaviour: the better response of domestic suppliers can be explained by the fact that they “play at home” or
by structural factors. We refer, for example, to the “Size of the supplier” (large wineries are mainly US
companies), a factor clearly linked to “Width / range of wines selection”; “Presence of brands in specialised
trade magazines”; “Offer of logistics services” and “Reliability / Compliance with contractual agreements /
Timeliness of delivery”.
Finally, US wines apparently respond better to both positioning factors (a realistic finding, since European
companies have less knowledge and less ability to control the US market and its internal structure, and
therefore have to rely on local distributors).
EL MRTR EL MRTR EL MRTR EL MRTR
Size of the supplier (exporting or domestic company) B B B W W W S S S
Ability to manage relationships with importers/distributors B B B S S S W W W
Ability to select importers/distributors/buyers S S S B B B S S S
Granting of higher profit margins B B B B B B B B B
Organisation of customer visits at wineries B B B S S S B B B
Brand extension B B B B B B B B B S
Product quality B B B B B B B B W W W
Price W B W B B B B B B S B
Origin of the product/terroir B B B B B B B B W W B
Type and quality of the packaging (presentation) B B B B B W S W S S W
Indication of grape variety W W B S S S S S
Presence of brands in specialised trade magazines B B B W W W S S S
Brand/Image of the product B B B B B B B W W B W S
Price stability B B B S W B W W W S B
Offer of logistics services W W W W W W S S S
Width / range of wines selection B B B W W W S S S
Reliability / Compliance with contractual agreements / Timeliness of delivery B B B W W W S S S
Advertising, promotion and comunication activities directed to traders B B B S S S S S S
Reactive adaptation of the product to customers' demand B B B S S S S S S
Appropriate advertising, promotion and comunication activities directed to consumers B B B W W W S S S
Correct price/quality positioning W B B B B B W W W B S B
4 9 9 20 21 20 21 21 19 21 21 19
2 8 7 17 18 18 7 6 5 5 5 4
1 1 2 1 2 1 9 9 10 3 4 3
USA
Factors related to
bargaining power
and access to
distribution
channels
Factors related to
product
Factors related to
brand
Factors related to
marketing service
Total Factors
Total Better
Total Worse
China
Factors related to
positioning
GermanyRussia

STUDY ON THE COMPETITIVENESS OF EUROPEAN WINES 111
On the other hand, European wines apparently respond better, compared with local wines, to “Product
quality” and “Price” factors, as well as to “Origin of the product/terroir”, all three linked to the product.
With regard to Germany, wines from other Member States apparently respond less well to “Product quality”
and “Origin of the product/terroir” factors (in the latter case, only for the Entry level and Medium level
segments). This seems to be due to the fact that all German wines are PDO or PGI. Furthermore, wine
suppliers from other Member States seem to have less “Ability to manage relationships with the customers”.
On the other hand, wines (or we should say wineries) from other Member States seem to have a competitive
advantage in “Granting of higher profit margins” and for the “Organisation of customer visits at wineries”.
6.2.3 Application of structural analysis
As previously mentioned, structural analysis and the application of the MicMac method was carried out for
the factors of competitiveness identified and summarised in Tab. 26.
We followed the procedure described below.
First, we built a general square matrix (General Matrix - GM) including the 41x41 identified factors of
competitiveness and the direct relationships among factors (with values ranging from 1 to 3 based on the
intensity of influence in the case of a direct relationship; 0 when there is no direct relationship. See the
methodology illustrated in §6.1.2). We obtained the GM shown in Tab. 30.

STUDY ON THE COMPETITIVENESS OF EUROPEAN WINES 112
Tab. 30: General Matrix of direct relationships between factors
3=“Extremely important” factor; =2 “Important” factor; 1=”Scarcely important” factor; 0= Not at all important factor. Source: Cogea
Siz
e o
f th
e su
pp
lier
(ex
po
rtin
g o
r d
om
esti
c co
mp
any
)
Ab
ilit
y t
o p
rov
ide
vo
lum
es t
hat
sat
isfy
dem
and
Ab
ilit
y t
o m
anag
e re
lati
on
ship
s w
ith
im
po
rter
s/d
istr
ibu
tors
Inte
nsi
ty o
f P
R a
ctiv
itie
s w
ith
im
po
rter
s, b
uy
ers,
...
Ab
ilit
y t
o s
elec
t im
po
rter
s/d
istr
ibu
tors
/bu
yer
s
Ex
clu
siv
e sa
le a
gre
emen
ts
Gra
nti
ng
of
hig
her
pro
fit
mar
gin
s
Org
anis
atio
n o
f cu
sto
mer
vis
its
at w
iner
ies
Bra
nd
ex
ten
sio
n
Pro
du
ct q
ual
ity
Tas
te (
Eas
y t
o d
rin
k)
Tas
te (
com
ple
xit
y t
o d
rin
k )
Co
nv
enie
nce
in
pac
kag
ing
(sc
rew
sap
s, P
ET
, B
IB..
..)
Lab
el d
esig
n
Pri
ce
Ori
gin
of
the
pro
du
ct/t
erro
ir
PD
O-P
GI
po
pu
lari
ty
Per
cep
tio
n o
f p
rod
uct
au
then
tici
ty
Ty
pe
and
qu
alit
y o
f th
e p
ack
agin
g
(pre
sen
tati
on
)
Ind
icat
ion
of
gra
pe
var
iety
Sto
ry t
o t
ell
En
suri
ng
pro
du
ct s
afet
y
Bra
nd
bu
ild
ing
, b
ran
din
g
(fo
r M
ediu
m a
nd
To
p R
ang
e).
Pre
sen
ce o
f b
ran
ds
in s
pec
iali
sed
tra
de
mag
azin
es
Bra
nd
/Im
age
of
the
pro
du
ct
Pri
ce s
tab
ilit
y
Fle
xib
ilit
y (
pri
ces,
pay
men
t sy
stem
,…)
Qu
alit
y c
on
sist
ency
ov
er t
ime
Off
er o
f lo
gis
tics
ser
vic
es
Fle
xib
le l
og
isti
cs m
anag
emen
t (J
ust
-in
-tim
e)
Wid
th /
ran
ge
of
win
es s
elec
tio
n (
typ
e &
pri
ce)
Rel
iab
ilit
y /
Co
mp
lian
ce w
ith
co
ntr
actu
al a
gre
emen
ts /
Tim
elin
ess
of
del
iver
y
Ad
ver
tisi
ng
, p
rom
oti
on
an
d c
om
un
icat
ion
act
ivit
ies
dir
ecte
d t
o t
rad
ers
Ab
ilit
y t
o i
nn
ov
atio
ns
(pac
kag
ing
, la
bel
s)
Rea
ctiv
e ad
apta
tio
n o
f th
e p
rod
uct
to
cu
sto
mer
s' d
eman
d
En
cou
rag
e th
e im
po
rter
to
pre
sen
t th
e w
ines
in
sp
ecia
lise
d m
agaz
ines
Ap
pro
pri
ate
adv
erti
sin
g,
pro
mo
tio
n a
nd
co
mu
nic
atio
n a
ctiv
itie
s d
irec
ted
to
co
nsu
mer
s
Sta
tus
sym
bo
l co
nte
nt
Co
rrec
t p
rice
/qu
alit
y p
osi
tio
nin
g
Co
nsi
sten
cy i
n t
he
qu
alit
y/p
rice
rat
io
Hig
h r
atin
g i
n s
pec
iali
sed
pre
ss
A1 A2 A3 A4 A5 A6 A7 A8 A9 B1 B2 B3 B4 B5 B6 B7 B8 B9 B10 B11 B12 B13 C1 C2 C3 D1 D2 D3 D4 D5 D6 D7 D8 D9 D10 E1 E2 E3 E4 E5 E6
Size of the supplier (exporting or domestic company) A1 0 2 0 0 0 0 2 3 3 0 0 0 1 0 2 0 0 0 0 0 0 0 2 0 0 1 1 1 1 1 2 1 1 0 1 1 0 0 0 0 0 26
Ability to provide volumes that satisfy demand A2 0 0 0 0 0 1 0 0 0 0 0 0 0 0 2 0 0 0 0 0 0 0 0 0 0 1 1 0 0 0 0 0 0 0 1 0 0 0 1 0 0 7
Ability to manage relationships with importers/distributors A3 0 0 0 2 1 2 0 2 0 0 0 0 0 1 1 0 0 0 2 0 0 0 1 0 0 1 2 1 0 0 0 3 2 2 2 2 3 0 3 2 0 35
Intensity of PR activities with importers, buyers, ... A4 0 0 2 0 0 0 0 3 0 0 0 0 0 0 0 0 0 0 2 0 0 0 1 0 0 0 0 0 0 0 0 1 2 2 3 2 2 0 3 1 0 24
Ability to select importers/distributors/buyers A5 0 0 0 1 0 1 0 0 0 0 0 0 0 0 2 0 0 0 0 0 0 0 1 0 0 0 0 0 0 0 0 0 2 0 0 2 2 0 2 0 0 13
Exclusive sale agreements A6 0 0 0 0 0 0 0 0 0 0 0 0 0 0 1 0 0 0 0 0 0 0 1 0 0 0 0 0 0 0 0 0 1 0 0 2 2 0 2 1 0 10
Granting of higher profit margins A7 0 0 0 0 0 1 0 0 0 0 0 0 0 0 2 0 0 0 0 0 0 0 0 0 0 0 0 0 0 0 0 0 0 0 0 1 1 0 0 0 0 5
Organisation of customer visits at wineries A8 0 0 0 0 0 0 0 0 0 0 0 0 0 0 0 0 0 0 0 0 0 2 2 0 1 0 0 0 0 0 0 1 0 0 0 1 1 0 0 0 0 8
Brand extension A9 0 0 1 0 0 1 3 0 0 0 0 0 0 0 1 0 0 0 0 0 0 0 2 0 1 1 0 0 0 0 3 0 2 0 0 0 2 0 0 0 0 17
Product quality B1 0 0 0 0 0 0 0 0 0 0 0 0 0 0 3 0 0 0 0 0 0 0 3 3 3 0 0 0 0 0 0 0 0 0 0 0 0 3 2 2 2 21
Taste (Easy to drink) B2 0 0 0 0 0 0 0 0 0 3 0 0 0 0 2 0 0 0 0 0 0 0 1 0 2 0 0 0 0 0 0 0 0 0 0 0 1 0 0 0 0 9
Taste (complex to drink ) B3 0 0 0 0 0 0 0 0 0 3 0 0 0 0 2 0 0 0 0 0 0 0 1 0 2 0 0 0 0 0 0 0 0 0 0 0 1 0 0 0 1 10
Convenience in packaging (screw caps, PET, BIB....) B4 0 0 0 0 0 0 0 0 0 1 0 0 0 0 2 0 0 0 2 0 0 0 0 0 1 0 0 0 0 0 0 0 0 0 0 0 1 0 0 0 0 7
Label design B5 0 0 0 0 0 0 0 0 0 1 0 0 0 0 0 0 0 0 3 0 0 0 1 0 1 0 0 0 0 0 0 0 0 0 0 0 1 0 0 0 0 7
Price B6 0 0 0 0 0 0 0 0 0 0 0 0 0 0 0 0 0 0 0 0 0 0 1 0 0 0 0 0 0 0 0 0 0 0 0 0 2 3 0 2 0 8
Origin of the product/terroir B7 0 0 0 0 0 0 0 0 0 2 2 2 0 0 2 0 3 3 0 0 3 0 0 0 2 0 0 1 0 0 0 0 0 0 0 0 1 2 0 1 1 25
PDO-PGI popularity B8 0 0 0 0 0 0 0 0 0 2 2 2 0 0 2 3 0 3 0 0 3 0 2 1 2 0 0 1 0 0 0 0 0 0 0 0 1 2 0 1 1 28
Perception of product authenticity B9 0 0 0 0 0 0 0 0 0 1 0 0 0 0 1 0 0 0 0 0 0 0 1 0 1 0 0 0 0 0 0 0 0 0 0 0 1 1 0 1 0 7
Type and quality of the packaging (presentation) B10 0 0 0 0 0 0 0 0 0 2 0 0 0 0 2 0 0 0 0 0 0 0 1 0 3 0 0 0 0 0 0 0 0 0 0 0 1 2 0 0 1 12
Indication of grape variety B11 0 0 0 0 0 0 0 0 0 1 3 1 0 0 1 0 0 2 0 0 0 0 1 1 1 0 0 1 0 0 0 0 0 0 1 0 1 0 0 3 0 17
Story to tell B12 0 0 0 0 0 0 0 0 0 0 0 0 0 0 2 0 0 0 0 0 0 0 2 0 2 0 0 0 0 0 0 0 0 0 0 0 1 2 0 0 0 9
Ensuring product safety B13 0 0 0 0 0 0 0 0 0 1 0 0 0 0 0 0 0 0 0 0 0 0 1 0 1 0 0 0 0 0 0 1 0 0 0 0 0 0 0 0 0 4
Brand building, branding (for Medium and Top Range). C1 0 0 0 0 0 0 0 0 0 1 0 0 0 1 1 0 0 0 0 0 0 0 0 2 3 0 0 0 0 0 0 0 3 0 0 1 2 2 3 0 1 20
Presence of brands in specialised trade magazines C2 0 0 0 0 0 0 0 0 0 0 0 0 0 0 2 0 0 0 0 0 0 0 0 0 2 0 0 0 0 0 0 0 0 0 0 0 0 3 0 0 2 9
Brand/Image of the product C3 0 0 0 0 0 0 0 0 0 0 0 0 0 0 3 0 0 0 0 0 0 0 0 2 0 0 0 0 0 0 0 0 0 0 0 2 2 3 2 0 3 17
Price stability D1 0 0 0 0 0 0 1 0 0 0 0 0 0 0 1 0 0 0 0 0 0 0 0 0 0 0 0 0 0 0 0 0 0 0 0 0 0 0 1 3 0 6
Flexibility (prices, payment system,…) D2 0 0 0 0 0 0 1 0 0 0 0 0 0 0 1 0 0 0 0 0 0 0 0 0 0 0 0 0 0 0 0 0 0 0 0 0 0 0 0 0 0 2
Quality consistency over time D3 0 0 0 0 0 0 0 0 0 0 0 0 0 0 1 0 0 0 0 0 0 0 0 0 0 2 0 0 0 0 0 0 0 0 0 0 0 0 1 3 0 7
Offer of logistics services D4 0 1 0 0 0 0 0 0 0 1 0 0 0 0 1 0 0 0 0 0 0 0 0 0 0 1 0 1 0 2 0 0 0 0 0 0 0 0 0 0 0 7
Flexible logistics management (Just-in-time) D5 0 2 0 0 0 0 2 0 0 0 0 0 0 0 1 0 0 0 0 0 0 0 0 0 0 1 1 0 0 0 0 2 0 0 0 0 0 0 0 1 0 10
Width / range of wines selection (type & price) D6 0 1 0 0 0 1 0 0 0 0 0 0 0 0 1 0 0 0 0 0 0 0 0 0 1 1 0 0 0 0 0 0 0 0 2 0 0 0 1 0 0 8
Reliability / Compliance with contractual agreements / T imeliness of delivery D7 0 1 1 0 0 0 1 0 0 0 0 0 0 0 1 0 0 0 0 0 0 0 1 0 0 1 1 0 0 0 0 0 0 0 0 0 0 0 0 0 0 7
Advertising, promotion and comunication activities directed to traders D8 0 0 0 1 0 0 0 1 0 0 0 0 0 0 1 0 0 0 0 0 0 0 0 0 0 0 0 0 0 0 0 0 0 0 1 2 1 0 1 0 0 8
Ability to innovations (packaging, labels) D9 0 0 0 0 0 0 0 0 0 1 0 0 2 2 0 0 0 0 2 0 0 1 1 0 1 0 0 0 0 0 0 0 0 0 2 0 0 0 1 0 0 13
Reactive adaptation of the product to customers' demand D10 0 0 0 0 0 0 0 0 0 1 0 0 1 1 1 0 0 0 1 0 0 1 0 0 1 0 0 0 0 1 0 0 0 0 0 0 0 0 1 0 0 9
Encourage the importer to present the wines in specialised magazines E1 0 0 0 0 0 0 0 0 0 0 0 0 0 0 0 0 0 0 0 0 0 0 0 2 1 0 0 0 0 0 0 0 0 0 0 0 1 1 2 0 1 8
Appropriate advertising, promotion and comunication activities directed to consumers E2 0 0 0 0 0 0 0 0 0 0 0 0 0 0 2 0 0 0 0 0 0 0 0 1 2 0 0 0 0 0 0 0 0 0 0 0 0 1 3 0 0 9
Status symbol content E3 0 0 0 0 0 0 0 0 0 0 0 0 0 0 3 0 0 0 0 0 0 0 0 0 0 0 0 0 0 0 0 0 0 0 0 1 0 0 3 0 0 7
Correct price/quality positioning E4 0 0 0 0 0 0 0 0 0 0 0 0 0 0 0 0 0 0 0 0 0 0 0 0 0 0 0 0 0 0 0 0 0 0 0 0 1 0 0 2 0 3
Consistency in the quality/price ratio E5 0 0 0 0 0 0 0 0 0 0 0 0 0 0 1 0 0 0 0 0 0 0 0 0 2 0 0 0 0 0 0 0 0 0 0 0 2 0 0 0 0 5
High rating in specialised press E6 0 0 0 0 0 0 0 0 0 0 0 0 0 0 2 0 0 0 0 0 0 0 0 0 0 0 0 0 0 0 0 0 0 0 0 1 2 3 3 0 0 11
0 7 4 4 1 7 10 9 3 21 7 5 4 5 53 3 3 8 12 0 6 4 27 12 36 10 6 6 1 4 5 9 13 4 13 18 36 28 35 23 13Total
To
tal

STUDY ON THE COMPETITIVENESS OF EUROPEAN WINES 113
From the General Matrix we constructed 21 sub-matrices pertaining to the three market segments in the
seven case-study countries. Such sub-matrices were obtained by progressively eliminating factors that in the
base table did not obtain a score of 2 or 3 (i.e. we eliminated all scarcely or not at all important factors for
each segment/country combination).
Furthermore, in order to reach a more general overview with respect to country/segment combinations, also
allowing for a synthetic representation of relationships among factors, we built other three sub-matrices for
each segment taken into consideration, but including all the countries together. These are general matrices by
segment, representing a situation that is completely theoretical, but allowing us to obtain a clearer
understanding of all possible relationships among factors.
Thirdly, we applied the MicMac method to each of the 21 country/segment sub-matrices, as well as to the
three general sub-matrices by segment, in order to establish a global effect (direct relationships + indirect
relationships among factors and relative hierarchy of importance).
Here we illustrate the overall results derived from the individual 24 analyses.
First of all, in order to better understand the construction and meaning of the analysis that was carried out, it
is necessary to illustrate an example of the analytical procedure we followed. The example below (Tab.31)
concerns Top Range segment wines in the United Kingdom.

STUDY ON THE COMPETITIVENESS OF EUROPEAN WINES 114
Tab. 31: United Kingdom – General matrix of direct relationships among factors in the Top range segment
3=“Extremely important” factor; =2 “Important” factor; 1=”Scarcely important” factor; 0= Not at all important factor. Source: Cogea
Siz
e o
f th
e su
pp
lier
(ex
po
rtin
g o
r d
om
esti
c co
mp
any
)
Ab
ilit
y t
o p
rov
ide
vo
lum
es t
hat
sat
isfy
dem
and
Ab
ilit
y t
o m
anag
e re
lati
on
ship
s w
ith
im
po
rter
s/d
istr
ibu
tors
Ab
ilit
y t
o s
elec
t im
po
rter
s/d
istr
ibu
tors
/bu
yer
s
Ex
clu
siv
e sa
le a
gre
emen
ts
Gra
nti
ng
of
hig
her
pro
fit
mar
gin
s
Pro
du
ct q
ual
ity
Pri
ce
Ori
gin
of
the
pro
du
ct/t
erro
ir
PD
O-P
GI
po
pu
lari
ty
Ty
pe
and
qu
alit
y o
f th
e p
ack
agin
g
(pre
sen
tati
on
)
Ind
icat
ion
of
gra
pe
var
iety
Bra
nd
/Im
age
of
the
pro
du
ct
Pri
ce s
tab
ilit
y
Qu
alit
y c
on
sist
ency
ov
er t
ime
Off
er o
f lo
gis
tics
ser
vic
es
Wid
th /
ran
ge
of
win
es s
elec
tio
n (
typ
e &
pri
ce)
Rel
iab
ilit
y /
Co
mp
lian
ce w
ith
co
ntr
actu
al a
gre
emen
ts /
Tim
elin
ess
of
del
iver
y
Rea
ctiv
e ad
apta
tio
n o
f th
e p
rod
uct
to
cu
sto
mer
s' d
eman
d
Ap
pro
pri
ate
adv
erti
sin
g,
pro
mo
tio
n a
nd
co
mu
nic
atio
n a
ctiv
itie
s d
irec
ted
to
co
nsu
mer
s
Co
rrec
t p
rice
/qu
alit
y p
osi
tio
nin
g
A1 A2 A3 A5 A6 A7 B1 B6 B7 B8 B10 B11 C3 D1 D3 D4 D6 D7 D10 E2 E4
Size of the supplier A1 0 2 0 0 0 2 0 2 0 0 0 0 0 1 1 1 2 1 1 0 0 13
Ability to provide volumes that satisfy demand A2 0 0 0 0 1 0 0 2 0 0 0 0 0 1 0 0 0 0 1 0 1 6
Ability to manage relationships with importers/distributors A3 0 0 0 1 2 0 0 1 0 0 2 0 0 1 1 0 0 3 2 3 3 19
Ability to select importers/distributors/buyers A5 0 0 0 0 1 0 0 2 0 0 0 0 0 0 0 0 0 0 0 2 2 7
Exclusive sale agreements A6 0 0 0 0 0 0 0 1 0 0 0 0 0 0 0 0 0 0 0 2 2 5
Granting of higher profit margins A7 0 0 0 0 1 0 0 2 0 0 0 0 0 0 0 0 0 0 0 1 0 4
Product quality B1 0 0 0 0 0 0 0 3 0 0 0 0 3 0 0 0 0 0 0 0 2 8
Price B6 0 0 0 0 0 0 0 0 0 0 0 0 0 0 0 0 0 0 0 2 0 2
Origin of the product/terroir B7 0 0 0 0 0 0 2 2 0 3 0 0 2 0 1 0 0 0 0 1 0 11
PDO-PGI popularity B8 0 0 0 0 0 0 2 2 3 0 0 0 2 0 1 0 0 0 0 1 0 11
Type and quality of the packaging (presentation) B10 0 0 0 0 0 0 2 2 0 0 0 0 3 0 0 0 0 0 0 1 0 8
Indication of grape variety B11 0 0 0 0 0 0 1 1 0 0 0 0 1 0 1 0 0 0 1 1 0 6
Brand/Image of the product C3 0 0 0 0 0 0 0 3 0 0 0 0 0 0 0 0 0 0 0 2 2 7
Price stability D1 0 0 0 0 0 1 0 1 0 0 0 0 0 0 0 0 0 0 0 0 1 3
Quality consistency over time D3 0 0 0 0 0 0 0 1 0 0 0 0 0 2 0 0 0 0 0 0 1 4
Offer of logistics services D4 0 1 0 0 0 0 1 1 0 0 0 0 0 1 1 0 0 0 0 0 0 5
Width / range of wines selection (type & price) D6 0 1 0 0 1 0 0 1 0 0 0 0 1 1 0 0 0 0 2 0 1 8
Reliability / Compliance with contractual agreements / T imeliness of delivery D7 0 1 1 0 0 1 0 1 0 0 0 0 0 1 0 0 0 0 0 0 0 5
Reactive adaptation of the product to customers' demand D10 0 0 0 0 0 0 1 1 0 0 1 0 1 0 0 0 0 0 0 0 1 5
Appropriate advertising, promotion and comunication activities directed to consumers E2 0 0 0 0 0 0 0 2 0 0 0 0 2 0 0 0 0 0 0 0 3 7
Correct price/quality positioning E4 0 0 0 0 0 0 0 0 0 0 0 0 0 0 0 0 0 0 0 1 0 1
0 5 1 1 6 4 9 31 3 3 3 0 15 8 6 1 2 4 7 17 19
To
tal
Total

STUDY ON THE COMPETITIVENESS OF EUROPEAN WINES 115
In this particular case we have a 21x21 matrix with 308 null values (absence of direct relationships between
factors), 52 cells with a value of 1, 28 cells with a value of 2 and 12 with a value of 3. From the pairs of
values obtained for each factor (Row Sum and Column Sum) we created the Direct influence/dependence
map. By applying the MicMac (matrix multiplication) method we then obtained the Indirect
influence/dependence map, in this case after 6 iterations to reach stability. The two maps are shown in Fig.
47.
Fig. 47: UK (Top range) – Direct and indirect influence-dependence maps
Source: Cogea
The results presented in the two maps of Fig. 47 lead to the following observations:
In the first and third quadrants there is a limited number of factors representing, respectively, lever
factors (i.e. those with a stronger influence) and passive factors (i.e. those subject to stronger
dependence). In the second quadrant no factors are found, while the highest concentration of factors can
be found in the fourth quadrant. This does not imply scarce importance of these factors, but only that
they have limited interaction (i.e. scarce influence on others and/or scarce dependence from others).
The shift from direct relationships to indirect relationships among factors (after applying the matrix
multiplication) generates a rather important change. The most significant aspect is a “polarisation” of
the factors, shown by their shift towards the horizontal and vertical axes of the map (the factors lose part
of their dependence or influence). This means that the number of significant factors (in terms of
influence, but also of dependence) is rather small. This result, revealed by the Displacement map below,
applies to nearly all the 21 analyses that were carried out.
Following the displacement, the hierarchy of the degrees of influence and dependence of factors
changes radically from direct to indirect (in some country/segment combinations the change is also very
large). The hierarchical changes are summarised in graphs A and B of Fig. 48. In this particular case, for
example, factors B7 (Origin of the product/terroir) and B8 (PDO-PGI popularity) show the largest
influence, while factors A3 (Ability to manage relationships with importers/distributors) and A1 (Size
of the supplier) lose in importance. Higher importance is also gained by factors D7 (Reliability /
Compliance with contractual agreements / Timeliness of delivery), moving from the 15th to the 6
th
position, whereas B1 (Product quality) loses importance, shifting from the 5th to the 9
th position.
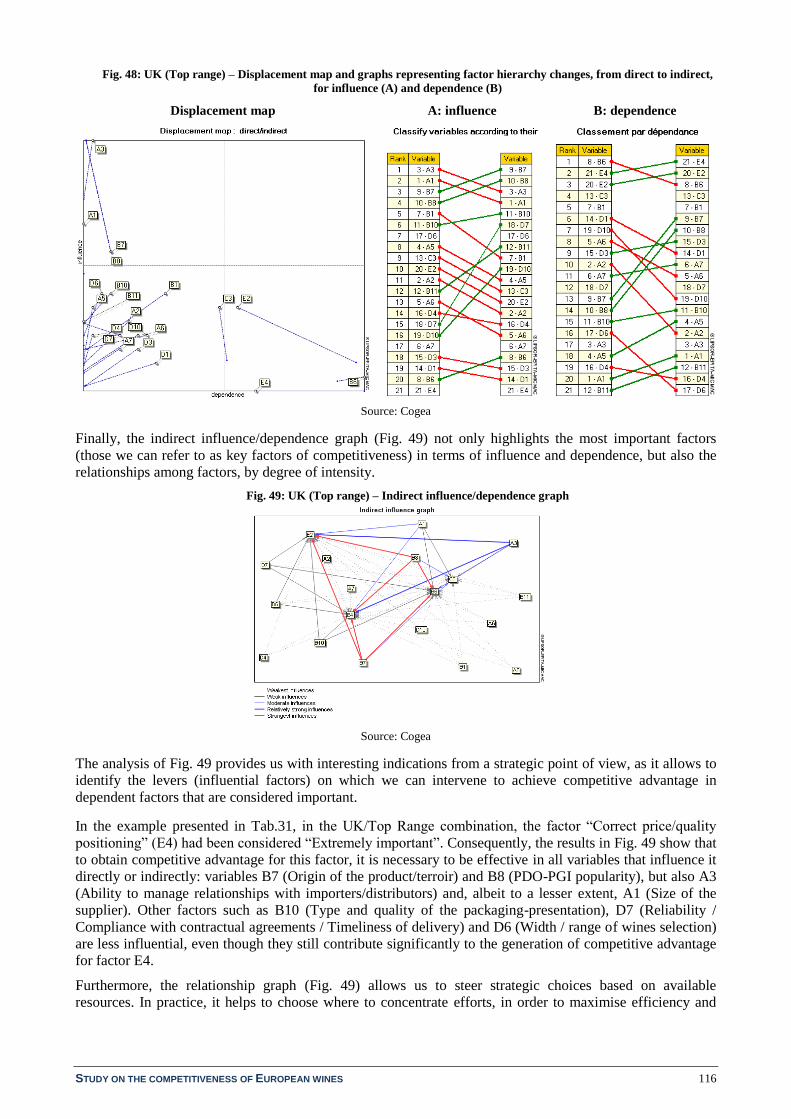
STUDY ON THE COMPETITIVENESS OF EUROPEAN WINES 116
Fig. 48: UK (Top range) – Displacement map and graphs representing factor hierarchy changes, from direct to indirect,
for influence (A) and dependence (B)
Displacement map A: influence B: dependence
Source: Cogea
Finally, the indirect influence/dependence graph (Fig. 49) not only highlights the most important factors
(those we can refer to as key factors of competitiveness) in terms of influence and dependence, but also the
relationships among factors, by degree of intensity.
Fig. 49: UK (Top range) – Indirect influence/dependence graph
Source: Cogea
The analysis of Fig. 49 provides us with interesting indications from a strategic point of view, as it allows to
identify the levers (influential factors) on which we can intervene to achieve competitive advantage in
dependent factors that are considered important.
In the example presented in Tab.31, in the UK/Top Range combination, the factor “Correct price/quality
positioning” (E4) had been considered “Extremely important”. Consequently, the results in Fig. 49 show that
to obtain competitive advantage for this factor, it is necessary to be effective in all variables that influence it
directly or indirectly: variables B7 (Origin of the product/terroir) and B8 (PDO-PGI popularity), but also A3
(Ability to manage relationships with importers/distributors) and, albeit to a lesser extent, A1 (Size of the
supplier). Other factors such as B10 (Type and quality of the packaging-presentation), D7 (Reliability /
Compliance with contractual agreements / Timeliness of delivery) and D6 (Width / range of wines selection)
are less influential, even though they still contribute significantly to the generation of competitive advantage
for factor E4.
Furthermore, the relationship graph (Fig. 49) allows us to steer strategic choices based on available
resources. In practice, it helps to choose where to concentrate efforts, in order to maximise efficiency and

STUDY ON THE COMPETITIVENESS OF EUROPEAN WINES 117
effectiveness (namely on lever factors that have the greatest number of direct and indirect relationships with
other factors of competitiveness that are considered important).
Based on the hierarchical ranking of factors (i.e. the values obtained from matrix multiplication) it is
therefore possible to define key factors of competitiveness, classified by importance (in Tab. 32, cell borders
are colour-coded based on class of importance – see also Tab.33).
Tab. 32: United Kingdom (Top range) – Hierarchy of factors of competitiveness, by influence and indirect dependence
Source: Cogea
This same procedure was applied to obtain the overall results by country and segment.
6.2.4 Overall results obtained with the MicMac method by country/segment combination
Tab. 33 contains a synthetic representation of the results obtained by applying the MicMac method to all
three market segments for each case-study country. Furthermore, the method was applied to the “Total” (i.e.
a synthesis of results for the seven case study countries together).
Label Indirect
influence
Label Indirect
dependence
B7 1694 E4 2911
B8 1694 E2 2829
A3 1310 B6 2635
A1 825 C3 1488
B10 502 B1 37
D7 500 B7 26
D6 423 B8 26
B11 360 D3 18
B1 332 D1 13
D10 331 A7 5
A5 277 A6 3
C3 261 D7 1
E2 249 D10 1
A2 242 B10 1
D4 231 A5 0
A6 194 A2 0
A7 180 A3 0
B6 128 A1 0
D3 98 B11 0
D1 95 D4 0
E4 64 D6 0
Very strong influence Very strong dependence
Relatively strong influence Relatively strong dependence
Moderate influence Moderate influence

STUDY ON THE COMPETITIVENESS OF EUROPEAN WINES 118
Tab. 33: Results of MicMac analysis by country and market segment (°)
(°) Cells marked with * indicate factors that are both more or less equally influential and dependent: these are therefore Dynamic Factors. Source: Cogea
EL MR TR EL MR TR EL MR TR EL MR TR EL MR TR EL MR TR EL MR TR EL MR TR
Size of the supplier (exporting or domestic company) A1
Ability to provide volumes that satisfy demand A2
Ability to manage relationships with importers/distributors A3
Intensity of PR activities with importers, buyers, ... A4
Ability to select importers/distributors/buyers A5
Exclusive sale agreements A6
Granting of higher profit margins A7
Organisation of customer visits at wineries A8
Brand extension A9
Product quality B1
Taste (Easy to drink) B2
Taste (complexity to drink ) B3
Convenience in packaging (screw saps, PET, BIB....) B4
Label design B5
Price B6
Origin of the product/terroir B7
PDO-PGI popularity B8
Perception of product authenticity B9
Type and quality of the packaging (presentation) B10
Indication of grape variety B11
Story to tell B12
Ensuring product safety B13
Brand building, branding C1 * * *
Presence of brands in specialised trade magazines C2 *
Brand/Image of the product C3 *
Price stability D1
Flexibility (prices, payment system,…) D2
Quality consistency over time D3
Offer of logistics services D4
Flexible logistics management (Just-in-time) D5
Width / range of wines selection (type & price) D6
Reliability / Compliance with contractual agreements / Timeliness of delivery D7
Advertising, promotion and comunication activities directed to traders D8 * *
Ability to innovations (packaging, labels) D9
Reactive adaptation of the product to customers' demand D10
Encourage the importer to present the wines in specialised magazines E1
Appropriate advertising, promotion and comunication activities directed to consumers E2
Status symbol content E3
Correct price/quality positioning E4
Consistency in the quality/price ratio E5
High rating in specialised press E6
Very strong influence Very strong dependence
Relatively strong influence Relatively strong dependence
Moderate influence Moderate influence
Factors related
to positioning
TotalChina UK
Factors related
to bargaining
power and
access to
distribution
channels
Factors related
to product
Factors related
to brand
Factors related
to marketing
service
Japan Russia USA Denmark Germany

STUDY ON THE COMPETITIVENESS OF EUROPEAN WINES 119
As already mentioned above, there is only a small number of factors that are both significant and frequent in
all country/segment combinations:
With regard to dependence, these are “Price” (B6); “Appropriate advertising, promotion and
communication activities directed to consumers” (E2); “Correct price/quality positioning” (E4).
Furthermore, a fourth factor that is frequent, but with a lower degree of dependence, is “Brand/Image of
the product” (C3).
With regard to influence, the most important factor in absolute terms is the “Ability to manage
relationships with importers/distributors (A3)” followed by “Intensity of PR activities with importers,
buyers, etc.” (A4) and by the “Ability to select importers/distributors/buyers” (A5). Other factors that
are frequent, albeit with a lower degree of influence, are “Product quality” (B1), “Brand extension” (A9)
and “Type and quality of the packaging (presentation)” (B10). Furthermore, “Origin of the
product/terroir” (B7) is a more or less important factor mainly in the Top Range segment.
It should also be noted that in some country/segment combinations the factors “Brand building, branding”
(C1) and “Advertising, promotion and communication activities directed to traders” (D8) are at the same
time influential and dependent and should therefore be considered as Dynamic Factors.
6.2.5 Generalisation of results by segment
As previously mentioned, in the final stage of the analysis we applied the same method to the three general
sub-matrices (all case-study countries together) by segment, in order to have a synthetic overview also with
regard to relationships among factors. These sub-matrices, which reflect a totally theoretical situation, have a
much larger size than those pertaining to the individual country/segment combinations (Tab. 34).
Tab. 34: Size of general sub-matrices by segment
EL=Entry Level; MR=Medium Range; TR=Top Range
The influence/dependence maps obtained by applying the MicMac method to these sub-matrices are shown
in Fig. 50.
Fig. 50: General indirect influence/dependence graphs in the Entry Level, Medium Range and Top Range segments
Entry Level Medium Range
EL MR TR
35x35 38x38 39x39

STUDY ON THE COMPETITIVENESS OF EUROPEAN WINES 120
Top Range
Source: Cogea
Finally, starting from the ranking of importance and from relationships among factors, for each segment we
focused on the first six factors that show an influence on the first six dependent factors (in both cases, the
factors are listed in Fig. 51 in decreasing order of importance).
Fig. 51: First six influential factors and first six dependent factors by segment (in decreasing order of importance)
Source: Cogea
Observations:
Most of the major influencing factors are linked to behaviour (in particular Factors related to bargaining
power and access to distribution channels – group A);
However, when moving upwards from one segment to another, from Entry level to Top range, some of
the behavioural factors are replaced by product-related factors (B8, B7 and B1 in the Top Range);
In a similar way, many dependent factors are related to behaviour, for instance “Appropriate
advertising, promotion and communication” (E2), “Correct product positioning” (E4), “Providing
consistent price/quality” (E5). The most important product-related dependent factors for all three
segments are few: “Price” (B6), “Brand / Image of the product” (C3) and “Status symbol content” (E3).
A3 Ability to manage relationships with importers/distributors B6 Price
A4 Intensity of PR activities with importers, buyers, etc. E2 Appropriate advertising, promotion, communication to consumers
A1 Size of the supplier (exporter or domestic company) E4 Correct price/quality positioning
A9 Brand extension C3 Brand / Image of the product
D9 Ability to innovate (packaging, labels, etc.) E5 Consistency in the quality/price ratio
A5 Ability to select importers/distributors/buyers C2 Presence of brand(s) in specialised magazines
A3 Ability to manage relationships with importers/distributors E4 Correct price/quality positioning
B8 PDO-PGI popularity E2 Appropriate advertising, promotion, communication to consumers
A4 Intensity of PR activities with importers, buyers, etc. B6 Price
B7 Origin of the product/terroir C3 Brand / Image of the product
A1 Size of the supplier (exporter or domestic company) E5 Consistency in the quality/price ratio
A9 Brand extension E6 High rating in specialised press
B8 PDO-PGI popularity E4 Correct price/quality positioning
A3 Ability to manage relationships with importers/distributors B6 Price
B7 Origin of the product/terroir E3 Status symbol content
A4 Intensity of PR activities with importers, buyers, etc. E2 Appropriate advertising, promotion, communication to consumers
A1 Size of the supplier (exporter or domestic company) C3 Brand / Image of the product
B1 Product quality E5 Consistency in the quality/price ratio
Entry Level
Medium Range
Top Range
Influence Dependence

STUDY ON THE COMPETITIVENESS OF EUROPEAN WINES 121
6.3 RESULTS OF THE ANALYSIS FOR BULK WINE
With regard to bulk wine, very few market players agreed to be interviewed and to fill in the questionnaires.
Furthermore, the answers of those who agreed to do the interview were quite poor, vague and incomplete.
We were not able to understand the reasons for such reticence. Probably, it can be explained by the fact that
wines imported in bulk are “nationalised” through blending with local wines by importers-bottlers (who
would not be willing to admit that wines marketed as domestic product are in fact totally or partially
produced in other countries). However, in addition to this, our impression is that the industry is not at all
transparent.
Due to these considerations, results reported below should be viewed with great caution.
The method used to collect and process information and to prepare the tables is the same already used for
packaged wines.
6.3.1 Factors of competitiveness of bulk wines and their importance
Notwithstanding the above-mentioned limitations, the answers we obtained all focus on a very limited
number of factors (Tab. 35). There is almost general consensus on the fact that competition in the bulk
market is based on two key factors:
The first, linked to the product, is price;
The second, linked to the structure of suppliers, is the size of supply volumes (i.e. the operating size of
suppliers).
Tab. 35: Overview of factors of competitiveness for bulk wines ranked by importance, by case study country and total
“Extremely important” factors (score=3) are highlighted in red; “Important” factors (score=2) are highlighted in green.
Empty cells correspond to factors considered scarcely or not at all important (score=1 or 0)
Source: questionnaires, interviews with market players
Overall, the other factors play a less important role. Among these, the most often mentioned factors are price
stability and a correct price/quality positioning (therefore all factors are in some way related to price).
It should be noted that in the interviews, some market players operating in the UK maintained that there is no
significant difference between factors of competitiveness for bulk wines and packaged wines. The reason is
that in the UK most suppliers are the same, and imported bulk wines are packaged “as they are” under the
brand of the supplier or retail chain label.
CN JP RU USA DK DE UK Total
Product quality 2 3 3
Price 3 3 3 3 2 3 3
Price stability 3 2 3 3 2
Origin of the product/terroir 2
Correct price/quality positioning 3 3 3 3 2 3
Large supply volumes 3 3 3 3 2 3 3
Ability to manage relationships with importers/distributors 3 2 2 2 2
Reactive adaptation of the product to customers' demand 2 2 2 2 2
Offer of logistics services 3 2 2 2
Reliability / Compliance with contractual agreements / Timeliness of delivery 3 2 3 2 2 2
Organisation of customer visits at wineries 3
Consistent quality over time 3 3
Stability of supplies 3 3 2
Fa
cto
rs r
ela
ted
to
the
pro
du
ct
Fa
cto
rs r
ela
ted
to
th
e ex
po
rtin
g
com
pa
ny
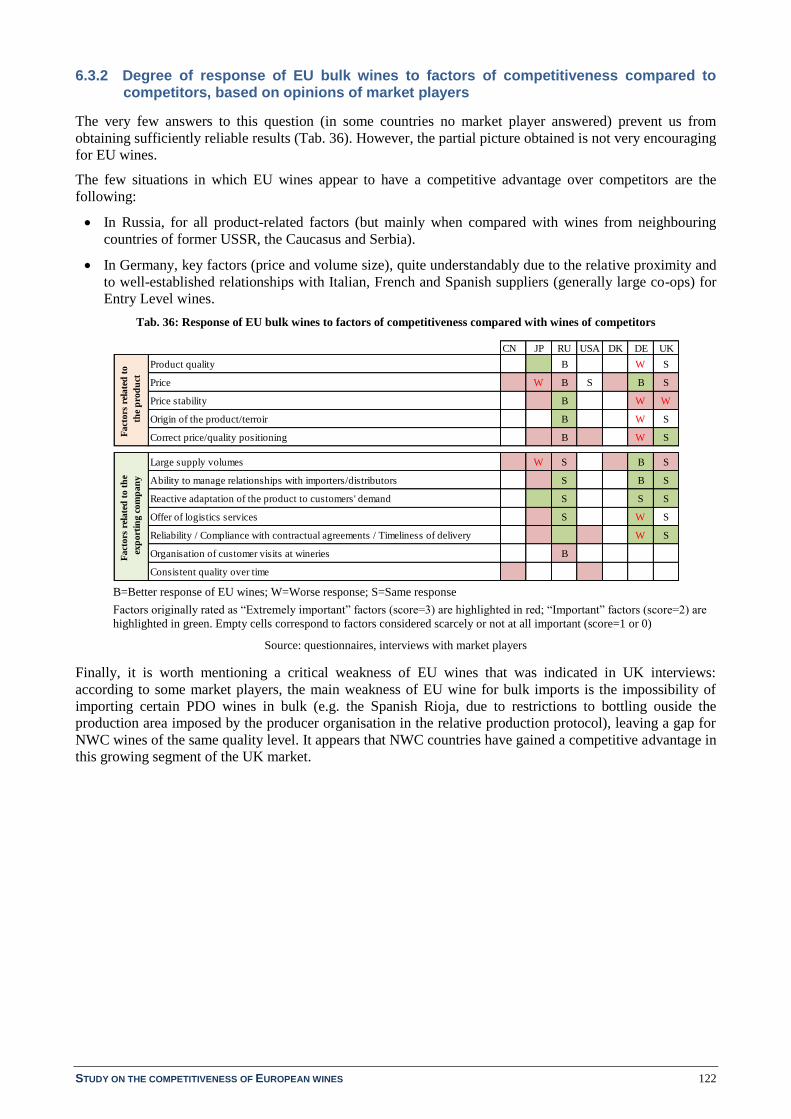
STUDY ON THE COMPETITIVENESS OF EUROPEAN WINES 122
6.3.2 Degree of response of EU bulk wines to factors of competitiveness compared to competitors, based on opinions of market players
The very few answers to this question (in some countries no market player answered) prevent us from
obtaining sufficiently reliable results (Tab. 36). However, the partial picture obtained is not very encouraging
for EU wines.
The few situations in which EU wines appear to have a competitive advantage over competitors are the
following:
In Russia, for all product-related factors (but mainly when compared with wines from neighbouring
countries of former USSR, the Caucasus and Serbia).
In Germany, key factors (price and volume size), quite understandably due to the relative proximity and
to well-established relationships with Italian, French and Spanish suppliers (generally large co-ops) for
Entry Level wines.
Tab. 36: Response of EU bulk wines to factors of competitiveness compared with wines of competitors
B=Better response of EU wines; W=Worse response; S=Same response
Factors originally rated as “Extremely important” factors (score=3) are highlighted in red; “Important” factors (score=2) are
highlighted in green. Empty cells correspond to factors considered scarcely or not at all important (score=1 or 0)
Source: questionnaires, interviews with market players
Finally, it is worth mentioning a critical weakness of EU wines that was indicated in UK interviews:
according to some market players, the main weakness of EU wine for bulk imports is the impossibility of
importing certain PDO wines in bulk (e.g. the Spanish Rioja, due to restrictions to bottling ouside the
production area imposed by the producer organisation in the relative production protocol), leaving a gap for
NWC wines of the same quality level. It appears that NWC countries have gained a competitive advantage in
this growing segment of the UK market.
CN JP RU USA DK DE UK
Product quality B W S
Price W B S B S
Price stability B W W
Origin of the product/terroir B W S
Correct price/quality positioning B W S
Large supply volumes W S B S
Ability to manage relationships with importers/distributors S B S
Reactive adaptation of the product to customers' demand S S S
Offer of logistics services S W S
Reliability / Compliance with contractual agreements / Timeliness of delivery W S
Organisation of customer visits at wineries B
Consistent quality over time
Fa
ctors
rel
ate
d t
o t
he
exp
ort
ing
com
pan
y
Fact
ors
rel
ate
d t
o
the
pro
du
ct

STUDY ON THE COMPETITIVENESS OF EUROPEAN WINES 123
7 THEME 3 – HOW TO IMPROVE THE COMPETITIVENESS OF EUROPEAN WINES
7.1 METHODOLOGICAL APPROACH FOR THEME 3
Theme 3 requires analysis (mostly “qualitative”) to be developed through the formulation of hypotheses
about the most probable evolution (from the current situation to the horizon 2025) of the external factors
influencing the competitiveness of European wines (emerging from the analysis of Theme 1) and of the key
factors of competitiveness (resulting from the analysis of Theme 2).
The definition of the competitive outlook for 2025 results from the combined analysis of:
a. expected trends of certain factors of the Porter's Diamond, in particular, Factor conditions and Demand
conditions;
b. the likely changes in the competition dynamics characterising the most important country markets;
c. expected changes in the hierarchy of the identified key factors of competitiveness;
d. the possible adaptation strategies developed by economic actors to changes occurred in the competitive
arena and in the hierarchy of key factors of competitiveness.
The formulation of hypotheses relative to future trends and changes listed above mainly arise from:
analysis of the IWSR 2013-2018 forecasts for still wine and outlook reports for the case study countries;
the informed opinions of key economic players interviewed in the case study countries;
analysis of the available literature.
The formulation of prospects to 2025 results from a combined critical analysis of the available information
and from logical inferences about related causes and effects.
7.2 EVOLUTION OF FACTOR CONDITIONS IN PRODUCER COUNTRIES
7.2.1 Future prospects for vineyard areas, wine production and probable impacts
A simple extrapolation of the trend of the surface (and production) to 2025 provides a disconcerting picture:
Continuation of the current growth rate could bring the vineyard area of all nine EU main competitors67
(see §5.5.1.1) from the current 1.77 to 2.19 million hectares (+23.9%), mainly owing to the huge
potential of China. Given the current growth trend of yields per hectare, wine production could rise by
an even higher percentage.
67 Argentina, New Zealand, Canada, Chile, USA, South Africa, Australia, China, Brazil.
Competition prospectsto 2025
Underlying trends of P's Diamond variables and competition dynamics in
country-marketsHypotheses on
economic actors' adaptation strategies to changes in Key factors
and in the context
Hypotheses on evolution of Key-factors of competitiveness

STUDY ON THE COMPETITIVENESS OF EUROPEAN WINES 124
By contrast, the downward trend of the EU vineyard area, offset (only partly?) by authorisations for new
planting (up to a maximum of 1%) would lead to substantial stability of surfaces, if not to a decrease68
.
The gap between the EU’s area under vine and that of its nine main competitors, currently amounting to
about 1.57 million hectares, would drop to 1.15 million hectares (-422 thousand hectares).
In reality (at least according to some interviews), this scenario is likely to be more or less dramatic
depending on the occurrence of certain opposed events:
The first is the likely slowdown in growth of planted areas in some NWC (South Africa, New Zealand)
or downturn in others (Australia), who seem to suffer to some extent from more difficult international
market conditions and show problems in placing their production on the market (i.e. growing stocks).
Environmental problems seem to add to market difficulties, in particular climate change, and the
resulting irrigation difficulties which would prevent new planting. This could contribute to mitigating
the scenario for European wines described above.
The second is the likely acceleration in growth of planted areas in countries that more recently appeared
on the wine scene, such as Brazil and India69
. This could contribute to aggravate the scenario.
In a situation where growth of wine production in China will serve to satisfy part of domestic market demand
especially, but not exclusively, at the expenses of wine imported in bulk for blending, we can expect an
increase of instability of the international market for wine in bulk (e.g. greater difficulty in placing bulk wine
on the international market, pressure on prices). The intensification of competition in the international bulk
market is expected to reflect also on the market for bottled wine.
7.2.2 Future prospects relative to export propensity
It is reasonable to expect that for countries already strongly export-oriended, the growth of surfaces and
production will further increase export propensity, and with it, their aggressive competitive behaviour. For
such countries, this will translate into the need to increase market opportunities, both through a strategy of
expansion of their “market-portfolio” and through greater complexity of their competitive strategies.
All actions aimed at facilitating access to (new) markets and / or at establishing the conditions to attain
competitive advantage (such as preferential trade agreements with consumer countries) are an essential part
of this strategy.
In this scenario, Australia and, even more so, Chile appear to be the most aggressive competitors. For Chile,
exports are vital to the national economy (high propensity), thus private companies and governmental
institutions work in synergy to apply a coherent set of policies: structural (surfaces and production), trade
(bilateral agreements for import tariff reduction), promotion (increase of funds made available).
In this context of increasingly aggressive behaviour of competitors, stability (or decrease) of the EU's
production potential (despite new planting authorisation rules) may represent a limit for growth (or even for
preservation) of its wine shares in international markets.
Given this constraint, the export propensity of the EU to the horizon 2025 will also depend on what happens
on the internal market. We can make two hypotheses:
If the ratio between consumption and production will increase or remain stable (considering also recent
EU enlargements), the EU export propensity will decrease (therefore wine export volumes on third
country markets will stabilize at lower levels than the current ones).
Based on currently available data, the combination of decreasing wine consumption (i.e. human
consumption) in the producing Member States with increasing consumption in all other Member States
(also related to EU enlargement) leads to a substantially stable level of consumption in the last two
68 According to views of some sector representatives, authorisation for new planting at maximum of 1% will not allow to compensate
for the downward trend of vineyard areas. According to such views, the production potential of the EU is thus likely to decrease
further. 69 In India, the vineyard area has grown from 40,000 ha to 120,000 ha between 2000 and 2012 (+8.3% average per year) in India and
from 59,900 ha to 82,600 ha in Brazil. Overall, India and Brazil have (already in 2012) a surface greater than that of Australia and
slightly lower than that of Chile. In 2025 (extrapolation of the trend) India and Brazil together could reach 290,000 ha (i.e. an area
second only to that of the United States and of China, among EU competitors).

STUDY ON THE COMPETITIVENESS OF EUROPEAN WINES 125
years in the EU27 (see Fig.52). Given the downward trend of EU wine production (i.e. for vinification),
the ratio between consumption and production increases (from about 72% to 82% on the interpolation
curve). This translates into diminishing wine volumes potentially available for export.
Fig. 52: EU wine production for vinification, human consumption and their ratio ( 1,000 hl, %)
Source: based on DG AGRI data
If the Consumption/production ratio decreases, an increase in the propensity to export may be expected
(and therefore a increase in export volumes) driven by the difference between supply and demand on the
domestic market. This hypothesis is suggested by DG Agri projections (2012)70
.
In this second case, however, the possibility of translating the potential in competitive strength will
depend on the strategic measures implemented to counteract the increased aggressiveness of
competitors.
7.3 EVOLUTION OF DEMAND CONDITIONS IN THE CASE STUDY COUNTRIES
7.3.1 Population and GDP prospective growth
Linking consumption forecasts to the evolution of the population (population growth rate) and to economic
development (GDP growth rate) requires some caution, since the evolution of consumption depends to
varying degrees on a number of other factors and their joint effects.
First of all, changes in the cultural environment can influence consumption. The evolution of the
cultural environment (new consumption occasions, adoption of foreign consumption models, fashion
factors, etc.) influences the consumption behaviour of current and potential consumers, thus also the
diffusion rate of the product (which has an impact on average per capita consumption);
Second, consumption can be “driven” by governments through taxation policy aimed at discouraging
alcohol abuse (thus shifting consumption from high to lower alcohol content beverages), or aimed at
protecting domestic industries that produce other alcoholic beverages that are wine substitutes.
However, since these factors are not easily foreseeable, in country markets where wine is past the
introduction stage of its life cycle, demographic changes together with economic development allow to make
an informed guess about the likely evolution (increase or decrease) in consumption. For the case study
country markets, we examined the 2013-2018 forecast data published by various official sources concerning
evolution of the adult population and GDP growth rates (Tab. 37).
.
70 EC – DG Agri. Medium term projections for the world wine market 2012-2020 - Meeting of the High Level Group on Wine
Planting Rights, July 6, 2012. However, these projections were obtained using total production (not production for vinification)
and total apparent consumption (not human consumption).
y = 4,5956ln(x) + 71,655
60,0
65,0
70,0
75,0
80,0
85,0
90,0
100.000
110.000
120.000
130.000
140.000
150.000
160.000
170.000
180.000
190.000
200.000
20
00
/01
20
01
/02
20
02
/03
20
03
/04
20
04
/05
20
05
/06
20
06
/07
20
07
/08
20
08
/09
20
09
/10
20
10
/11
Prod for vinif.
Human Cons
% Cons/prod
EU 15 EU 25 EU 27
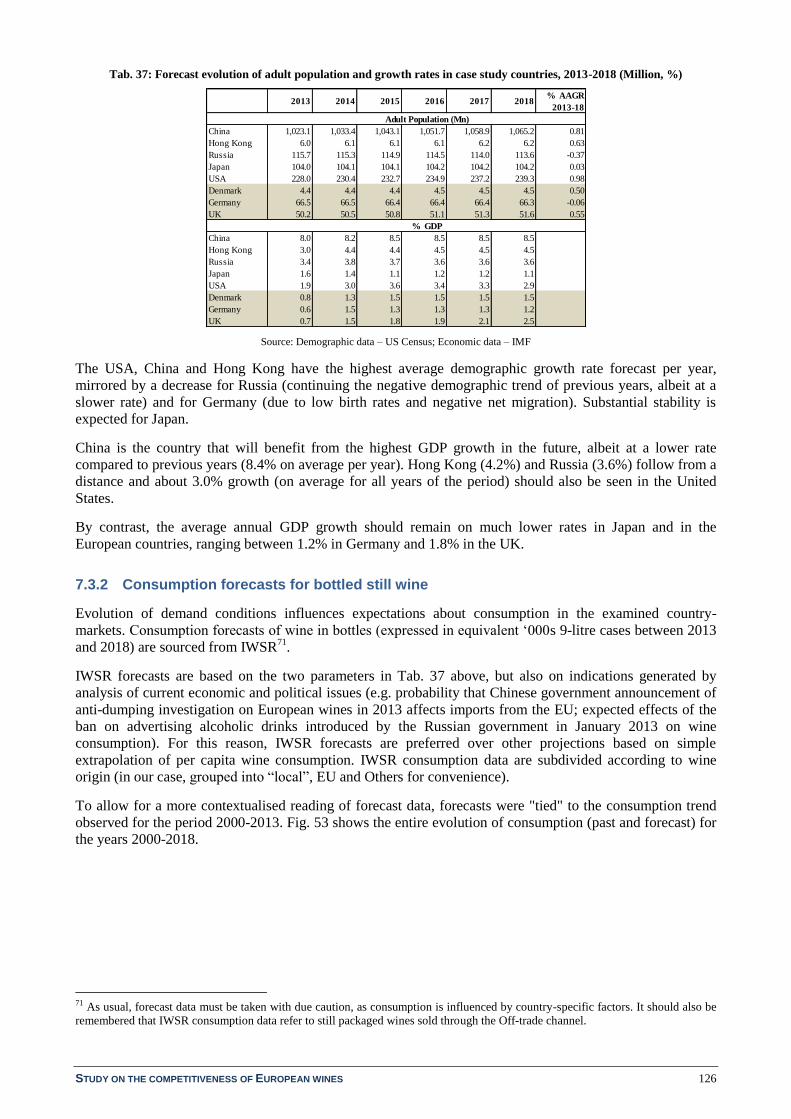
STUDY ON THE COMPETITIVENESS OF EUROPEAN WINES 126
Tab. 37: Forecast evolution of adult population and growth rates in case study countries, 2013-2018 (Million, %)
Source: Demographic data – US Census; Economic data – IMF
The USA, China and Hong Kong have the highest average demographic growth rate forecast per year,
mirrored by a decrease for Russia (continuing the negative demographic trend of previous years, albeit at a
slower rate) and for Germany (due to low birth rates and negative net migration). Substantial stability is
expected for Japan.
China is the country that will benefit from the highest GDP growth in the future, albeit at a lower rate
compared to previous years (8.4% on average per year). Hong Kong (4.2%) and Russia (3.6%) follow from a
distance and about 3.0% growth (on average for all years of the period) should also be seen in the United
States.
By contrast, the average annual GDP growth should remain on much lower rates in Japan and in the
European countries, ranging between 1.2% in Germany and 1.8% in the UK.
7.3.2 Consumption forecasts for bottled still wine
Evolution of demand conditions influences expectations about consumption in the examined country-
markets. Consumption forecasts of wine in bottles (expressed in equivalent ‘000s 9-litre cases between 2013
and 2018) are sourced from IWSR71
.
IWSR forecasts are based on the two parameters in Tab. 37 above, but also on indications generated by
analysis of current economic and political issues (e.g. probability that Chinese government announcement of
anti-dumping investigation on European wines in 2013 affects imports from the EU; expected effects of the
ban on advertising alcoholic drinks introduced by the Russian government in January 2013 on wine
consumption). For this reason, IWSR forecasts are preferred over other projections based on simple
extrapolation of per capita wine consumption. IWSR consumption data are subdivided according to wine
origin (in our case, grouped into “local”, EU and Others for convenience).
To allow for a more contextualised reading of forecast data, forecasts were "tied" to the consumption trend
observed for the period 2000-2013. Fig. 53 shows the entire evolution of consumption (past and forecast) for
the years 2000-2018.
71 As usual, forecast data must be taken with due caution, as consumption is influenced by country-specific factors. It should also be
remembered that IWSR consumption data refer to still packaged wines sold through the Off-trade channel.
2013 2014 2015 2016 2017 2018% AAGR
2013-18
China 1,023.1 1,033.4 1,043.1 1,051.7 1,058.9 1,065.2 0.81
Hong Kong 6.0 6.1 6.1 6.1 6.2 6.2 0.63
Russia 115.7 115.3 114.9 114.5 114.0 113.6 -0.37
Japan 104.0 104.1 104.1 104.2 104.2 104.2 0.03
USA 228.0 230.4 232.7 234.9 237.2 239.3 0.98
Denmark 4.4 4.4 4.4 4.5 4.5 4.5 0.50
Germany 66.5 66.5 66.4 66.4 66.4 66.3 -0.06
UK 50.2 50.5 50.8 51.1 51.3 51.6 0.55
China 8.0 8.2 8.5 8.5 8.5 8.5
Hong Kong 3.0 4.4 4.4 4.5 4.5 4.5
Russia 3.4 3.8 3.7 3.6 3.6 3.6
Japan 1.6 1.4 1.1 1.2 1.2 1.1
USA 1.9 3.0 3.6 3.4 3.3 2.9
Denmark 0.8 1.3 1.5 1.5 1.5 1.5
Germany 0.6 1.5 1.3 1.3 1.3 1.2
UK 0.7 1.5 1.8 1.9 2.1 2.5
Adult Population (Mn)
% GDP

STUDY ON THE COMPETITIVENESS OF EUROPEAN WINES 127
Fig. 53: Consumption evolution: 2000-2013 time series and forecasts for 2013-2018 (000s 9-litre cases)
Source: IWSR
Moreover, other sources were taken into consideration for the analysis of wine consumption trends, as
reported in the box below.
Evolution of wine consumption in traditional markets: Other data sources
The evolution of consumption (source: IWSR) is substantially confirmed by other sources. As an example, OIV data of
total wine consumption (of which still wines represent the largest share) from 2000 to 2011 approximately confirm the
same trends (Fig. 54). In particular, OIV data confirm the significant growth of consumption in China and in the
United States, and the trend break for Russia in 2007-2008, from strongly positive between 2000 and 2007 to slightly
negative afterwards, until 2011.
Fig. 54: Evolution of wine consumption in traditional markets 2000-2011 (million hl)
Source: OIV
To complete the analysis, Tab. 38 reports consumption figures for 2000, 2013 and projections to 2018
(bottled still wine), as well as annual average growth rates of consumption, in total and by origin, for the
years 2000-2013 and for the 2013-2018 forecast interval.
0
50000
100000
150000
200000
250000
300000
350000
400000
20
00
20
01
20
02
20
03
20
04
20
05
20
06
20
07
20
08
20
09
20
10
20
11
20
12
20
13
20
14
20
15
20
16
20
17
20
18
UK
USA
Russia
Japan
HK
Germ
Denm
China
0
5.000
10.000
15.000
20.000
25.000
30.000
20
00
20
01
20
02
20
03
20
04
20
05
20
06
20
07
20
08
20
09
20
10
20
11
UK
USA
Russia
Japan
Hong Kong
Germ
Denm
China

STUDY ON THE COMPETITIVENESS OF EUROPEAN WINES 128
Tab. 38: Consumption of bottled still wine and annual average growth rates (2000-2013 and 2013-2018 forecasts), total and
by origin – Annual average growth rates of market shares by origin (2013-2018 forecasts)
Negative values in red
Source: Cogea, based on IWSR data
Some important aspects emerge from the analysis:
In all studied country-markets forecasts for 2013-2018 are positive, although growth rates vary
considerably, ranging from a minimum of 0.02% in Denmark to a maximum of over 7% per year for
China. Looking ahead, China and the US emerge as the most dynamic markets and, therefore,
potentially more attractive;
In all countries, except for the USA and Germany, growth rates suffer a slowdown compared to the
previous period, very strong in Hong Kong and China, almost insignificant in Denmark and in Japan;
In all country-markets, EU wines show positive growth rates, with the exception of Denmark and Japan
(showing, however, very small negative change rates).
In addition, the distinction of wine consumption by origin shows that:
Consumption growth in the USA and Japan is mainly sustained by “local” wine production (which
means that growth is satisfied in large part by wine imported in bulk)72
followed by European wines in
the US and wines of other origin in Japan.
Consumption growth in China is also mainly satisfied by “local” production, but European wine imports
show the highest growth rate (suggesting that they should, therefore, increase their market share). In
contrast with the two previous countries, growth of domestic wine production should mainly be driven
by increase of vineyard areas.
Consumption growth in Germany and Hong Kong is expected to be mainly satisfied by European wines,
in volume terms.
72 The total US vineyard area is expected to remain stable and wine grape production should only grow thanks to increased
productivity (higher yields).
2000 2013 2018 2000-13 2013-18 Δ
Total Consumption 36,109 166,307 234,849 13.91 7.03 -6.88 0.00
Others 142 10,022 14,129 37.12 6.89 -30.23 -0.13
EU 192 21,285 37,720 42.99 11.26 -31.73 3.96
Chinese 35,775 135,000 183,000 12.21 6.27 -5.94 -0.70
Total Consumption 16,800 17,190 17,178 0.16 0.02 -0.14 0.00
Others 2,810 8,065 8,495 8.47 1.04 -7.43 1.02
EU 13,990 9,125 8,683 -4.00 -0.92 3.08 -0.94
Total Consumption 224,552 235,511 241,471 0.24 0.56 0.32 0.00
Others 15,301 25,352 24,350 3.05 -1.07 -4.12 -1.62
EU 209,252 210,159 217,121 0.43 0.76 0.33 0.19
Total Consumption 991 3,585 4,222 11.86 3.82 -8.04 0.00
Others 389 1,870 2,177 14.26 2.76 -11.50 -1.02
EU 597 1,685 2,045 9.55 5.03 -4.52 1.16
Chinese 5 30 55 14.10 12.89 -1.21 8.73
Total Consumption 27,316 34,317 34,247 1.27 1.03 -0.24 0.00
Others 3,769 9,033 8,696 6.60 1.57 -5.03 0.53
EU 12,142 14,484 13,651 0.63 -0.07 -0.70 -1.08
Japanese 11,406 10,800 11,900 -0.80 1.96 2.76 0.92
Total Consumption 36,100 65,055 65,924 5.18 0.27 -4.91 0.00
Others 7,657 9,922 10,666 11.20 1.46 -9.74 1.19
EU 1,143 18,033 18,758 22.97 0.79 -22.18 0.52
Russian 27,300 37,100 36,500 2.67 -0.33 -3.00 -0.59
Total Consumption 100,308 121,686 126,096 1.50 0.47 -1.03 0.00
Others 37,700 65,688 68,831 3.90 0.65 -3.25 0.18
EU 62,608 55,998 57,265 -0.80 0.25 1.05 -0.22
Total Consumption 210,098 318,165 373,390 3.11 3.25 0.14 0.00
Others 13,851 34,804 37,743 6.49 1.59 -4.90 -1.60
EU 27,967 45,581 53,197 3.37 3.14 -0.23 -0.11
US 168,280 237,780 282,450 2.65 3.50 0.85 0.25
Market
Share:
% AAGR
2013-18
United States
China
Denmark
Germany
United Kingdom
Hong Kong
Japan
Russia
Consumption 000s 9 litre cases % AAGR Consumption

STUDY ON THE COMPETITIVENESS OF EUROPEAN WINES 129
The weak consumption growth in Russia is supported by both EU wines and wines of other origin, at
the expenses of a decrease in “local” production (therefore, probably also by a decrease in bulk wine
imports). However, EU wine consumption is expected to grow at a lower rate compared to wines of
other origin.
The expected recovery in consumption in the UK (after marked decrease between 2009 and 2013) is
mainly supported by wines from other origins (which should, therefore, increase their market share).
The substantial stability of consumption in Denmark will see substitution of European wines with wines
from other origin.
In synthesis, all observed trends may be expected to lead to:
a. Tendency towards increasing EU wines market share in China, Germany, Hong Kong and Russia,
although wines of other origin are expected to grow at a slightly higher rate than EU wines in Russia;
b. Tendency towards decreasing EU wines market share in Denmark, Japan, UK and USA.
7.3.3 Expectations about changes in consumer markets and impact on consumption
Besides the increase in consumption (i.e. quantity), it is also necessary to assess in which segments
consumption is likely to develop in the future (i.e. towards which wine quality). In addition to the growth of
GDP per capita73
, this will be linked to both evolution of the different consumer targets and to growth of the
various functions / occasions of wine consumption. The combination of consumer targets and consumption
occasions helps to define the direction in which the segments will develop. To illustrate this concept, the map
in Fig. 55 shows two consumer targets (Expert and affluent consumers; New consumers) and two functions /
occasions of consumption (Consumption as an aperitif/in social occasions/purchased as gift; Daily
consumption as meal accompaniment). For each of the four quadrants generated by the combination of these
factors, the types of products mainly consumed can be represented.
Fig. 55: Representation of types of wine consumed according to consumer targets and consumption occasions
Source: Cogea
Thus, the direction of development of the factors may indicate which segments may be expanding. For
example:
if the number of expert and affluent consumers who mainly drink wine in social occasions increases,
demand growth will interest more wines in the Top range and Ultra premium (including PDO-PGI in
Europe, but also regional wines with GI of other competitors);
73 Correlation exists between growth of GDP per capita and consumption of wines in the higehr price/quality ranges.
Expert and affluent consumers
New consumers
Co
nsu
mp
tio
n a
s ap
eri
tif
/ S
ocia
l o
ccasi
on
s /
Pu
rch
ase
as
gif
t
Ev
ery
day
co
nsu
mp
tio
n a
s m
eal
acco
mp
an
imen
t
> consumption of Top/Ultra
premium PDO-PGI wines
> consumption of Super
premium PDO-PGI wines
> consumption of wines easy
to drink / varietal wines
> consumption of Entry
level/Commercial premium,
varietals and non GI wines

STUDY ON THE COMPETITIVENESS OF EUROPEAN WINES 130
on the contrary, if the number of new consumers (low-income) who mainly consume wine at home in
accompaniment to a meal increases, demand growth will be more geared towards Entry level and
Commercial premium wines, probably in BiB and/or other convenience packaging.
In addition, all consumer profiles in between the two extremes represented by the map will behave
differently according to consumption occasions, which of course are not mutually exclusive but can coexist.
It is not possible to determine what the future market directions will be. However, it is very likely that, in all
countries, growth can affect all segments, as a combined effect of higher penetration rates and income
growth, but also because of changing habits / lifestyles / consumption occasions74
. At individual country
level, wine demand is likely to be more complex and more sophisticated than at present.
Finally, it may be interesting to develop market opportunities (currently ignored or not adequately explored)
expressed by potential consumer targets who, for personal ethical reasons (religion, sports), health (diabetes,
pregnant women) or for specific situations (driving) can not consume alcoholic beverages, but would
welcome the opportunity to enjoy wine. Existing technology (i.e. partial or total wine de-alcoholisation)
already allows to meet this target potential.
7.3.4 Expected future developments of wine demand in the case study markets
The information collected through interviews with key market agents in the case study countries is
summarized in Tab.39 to show the main developments in consumer markets and wine demand expected in
the near future.
Tab. 39: Expected future developments in the case study consumer markets
Expected developments in consumer
markets
Expected developments in
product demand
Expected developments in
sales channels
CHINA
Still high growth rate of wine consumption,
but slightly slowing down
Growth of middle classes
Consumers becoming better informed and
more experienced
Consumption increase in third and fourth-
tier cities
Growth mostly expected
within Medium Range wines
Trading-up from lower to
higher price/quality wines
Premium wines (Commercial,
Super and Ultra Premium)
expected to increase market
share
Growth of wine
consumption On-trade
Growth of Off-trade sales
JAPAN
Moderate future growth, mainly driven by
consumption at home
Persisting price sensitivity
Low interest in wine for younger
generations
Expansion of wine’s “reach” to larger
segments of population (i.e. penetration
increase)
Growth mostly expected at
Entry Level, partly for
Medium Range wines
Growth of Off-trade sales
Growth of online sales
RUSSIA
Fairly stable wine consumption overall
Slow growth expected, but depends on
growth of middle classes, political stability
and better information to consumers
Expected increase of wine consumption
outside two main cities
Expected increase of
consumption of imported
wine to detriment of
“domestic” wine
No acidic wines, preference
for taste of tannins
Development of wine sales
On-trade and Off-trade
outside two main cities (due
to enhancement of
distribution network)
USA
Wine market growth driven by fast
population growth
Wine consumption expected to grow
especially in younger generations
(Millennial)
Lifestyle developments affect positively
wine consumption (better knowledge, wine
Trading-up from lower to
higher price/quality wines
Market for higher priced
wines expected to develop
further
Overall, better future
prospects for red wine
Growth of wine
consumption On-trade
Growth of online sales
74 For example, in Japan, partly as a result of the economic crisis, wine consumption at home is increasing, even as an
accompaniment to meals.
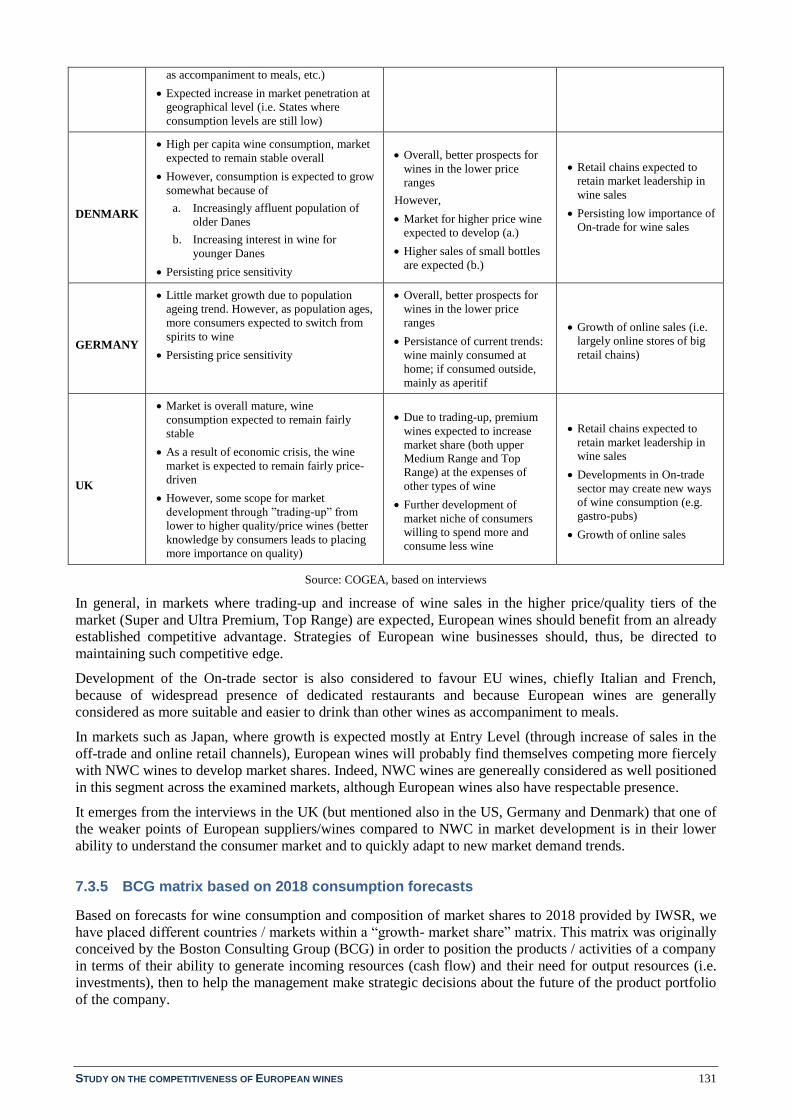
STUDY ON THE COMPETITIVENESS OF EUROPEAN WINES 131
as accompaniment to meals, etc.)
Expected increase in market penetration at
geographical level (i.e. States where
consumption levels are still low)
DENMARK
High per capita wine consumption, market
expected to remain stable overall
However, consumption is expected to grow
somewhat because of
a. Increasingly affluent population of
older Danes
b. Increasing interest in wine for
younger Danes
Persisting price sensitivity
Overall, better prospects for
wines in the lower price
ranges
However,
Market for higher price wine
expected to develop (a.)
Higher sales of small bottles
are expected (b.)
Retail chains expected to
retain market leadership in
wine sales
Persisting low importance of
On-trade for wine sales
GERMANY
Little market growth due to population
ageing trend. However, as population ages,
more consumers expected to switch from
spirits to wine
Persisting price sensitivity
Overall, better prospects for
wines in the lower price
ranges
Persistance of current trends:
wine mainly consumed at
home; if consumed outside,
mainly as aperitif
Growth of online sales (i.e.
largely online stores of big
retail chains)
UK
Market is overall mature, wine
consumption expected to remain fairly
stable
As a result of economic crisis, the wine
market is expected to remain fairly price-
driven
However, some scope for market
development through ”trading-up” from
lower to higher quality/price wines (better
knowledge by consumers leads to placing
more importance on quality)
Due to trading-up, premium
wines expected to increase
market share (both upper
Medium Range and Top
Range) at the expenses of
other types of wine
Further development of
market niche of consumers
willing to spend more and
consume less wine
Retail chains expected to
retain market leadership in
wine sales
Developments in On-trade
sector may create new ways
of wine consumption (e.g.
gastro-pubs)
Growth of online sales
Source: COGEA, based on interviews
In general, in markets where trading-up and increase of wine sales in the higher price/quality tiers of the
market (Super and Ultra Premium, Top Range) are expected, European wines should benefit from an already
established competitive advantage. Strategies of European wine businesses should, thus, be directed to
maintaining such competitive edge.
Development of the On-trade sector is also considered to favour EU wines, chiefly Italian and French,
because of widespread presence of dedicated restaurants and because European wines are generally
considered as more suitable and easier to drink than other wines as accompaniment to meals.
In markets such as Japan, where growth is expected mostly at Entry Level (through increase of sales in the
off-trade and online retail channels), European wines will probably find themselves competing more fiercely
with NWC wines to develop market shares. Indeed, NWC wines are genereally considered as well positioned
in this segment across the examined markets, although European wines also have respectable presence.
It emerges from the interviews in the UK (but mentioned also in the US, Germany and Denmark) that one of
the weaker points of European suppliers/wines compared to NWC in market development is in their lower
ability to understand the consumer market and to quickly adapt to new market demand trends.
7.3.5 BCG matrix based on 2018 consumption forecasts
Based on forecasts for wine consumption and composition of market shares to 2018 provided by IWSR, we
have placed different countries / markets within a “growth- market share” matrix. This matrix was originally
conceived by the Boston Consulting Group (BCG) in order to position the products / activities of a company
in terms of their ability to generate incoming resources (cash flow) and their need for output resources (i.e.
investments), then to help the management make strategic decisions about the future of the product portfolio
of the company.

STUDY ON THE COMPETITIVENESS OF EUROPEAN WINES 132
Through a suitable adaptation, the matrix can give useful indications at macro level, in particular for the
identification of countries / markets on which it might be more interesting (for both public and private
stakeholders in Europe) to focus and to direct economic resources available to the horizon 2025 (hence, from
a strategic viewpoint).
The matrix uses two classification parameters (see Fig. 56):
Growth rate of the still wine market in different countries (the vertical axis). This is a measure of market
attractiveness. The boundary (horizontal dividing line) between low and high attractiveness was set to
1% per year between 2013 and 2018 (i.e. <1%: low attractiveness; >1% high attractiveness).
Relative Market Share of European wines in 2018 (the horizontal axis). It measures the competitive
strength of European wines compared to its competitors. The Relative Market Share is calculated as the
ratio between the Market share of European wines and the market share of all wines from all other
origins (imported or “local”). A logarithmic scale base-10 is used. The boundary (vertical dividing line)
between low and high competitive strength has been set equal to 1 annual average (i.e. from 0.1 to 1.0
low competitive strength; 1 to 10, high competitive strength).
The combination of these two parameters identifies 4 categories. For each combination it is possible to make
recommendations about strategic behaviour.
The four quadrants in the BCG matrix (Fig. 56), adequately adapted to a macro level of analysis, represent:
Question Mark: The term indicates that European wine is in an attractive market (i.e. attractive for all competitors),
but does not possess a significant competitive strength. Therefore, there is uncertainty about the possibility of
increasing its market share, achievable only through use of higher financial resources than those invested by
competitors (Question Mark products generate a weak cash in-flow and require significant resources in output). The
recommended behaviour is to develop investments with the aim to progressively move towards the Star box.
Star: The term indicates that European wine is strongly competitive in highly attractive markets, able to generate the
highest Return on Investments (ROI). Star products require continuous investments (high need for cash) to maintain or
further develop the advantage competitive position. The recommended behaviour is to invest to maintain achieved
positions until the product moves to a later stages of the life cycle of (ie, up to market maturity).
Cash Cow: The term indicates that European wine is in the markets characterised by low growth (and therefore less
attractive to potential new entrants), but highly competitive. This position generates high cash flow (through little
investments, mainly as defensive strategy) that potentially allow to finance investments in Question Mark countries.
The recommended behaviour is to continue to exploit the market (i.e. gain without investing a lot).
Dog: The term indicates that European wine has low competitive strength in a market characterised by low growth.
Thus, it is possible to generate just enough revenue to reach budget balance, or even incur in losses. A country
decision to enter this quadrant makes it necessary to evaluate the following alternatives: reduce investment and / or try
to revitalize the market segments potentially sensitive to offered products.

STUDY ON THE COMPETITIVENESS OF EUROPEAN WINES 133
Fig. 56: Growth-Market Share Matrix for still wine – Case study markets*
* The size of each country circle represents the relative size of the consumer market.
Source: Cogea, based on IWSR data
The results of this exercise highlight the following:
a. The existence of a group of countries (China, USA and Japan) that by 2018 should be positioned in the
“Question Mark” box. These markets are characterised by expanding consumption and where an
important role is played by “local” products, whose market share could be eroded through adequate
aggressive strategy (i.e. adequate investments to maximize response to key factors of competitiveness
specific to each individual country-market). In these markets, strategies such as developing
communication and advertising to traders and to consumers, Public Relation activities with importers
and distributors, organisation of visits to wineries by clients and granting of higher profit margins to
distributors/retailers should be considered. In principle, these markets should be given priority when
making investment decisions.
b. The position of Hong Kong (not a wine producer) in between “Question mark” and “Star”. It seems
advisable for EU wines (companies) to insist on an aggressive strategy (thus, invest heavily) in order to
move to the “Star” quadrant in view of 2025. This also in reason of the role played by Hong Kong as an
international hub in Asia.
c. The existence of a group of countries (Germany and Denmark) that by 2018 should be positioned in the
“Cash-cow” box. These are markets characterised by limited development potential, but dominated (in
particular Germany) by EU wines, including German wines. Although these markets can be defined as
unattractive, it is highly likely that some EU competitors will try to penetrate these markets further
(such as Australia and Chile, that need to broaden their market-portfolios). So, ultimately, it is
recommended that EU wines (companies) implement a strategy of consolidation of the positions
achieved and defense from the likely aggressiveness of competitors (for example, through actions aimed
at strengthening customer loyalty).
d. The position of Russia (wine producer country) in the “Dog” quadrant. The expected stagnation of wine
consumption and low competitiveness of EU wines generate doubts about the strategic opportunity to
allocate resources to this market. However, the low market share of European wines refers to the entire
wine market (all segments included). Therefore, focusing on and revitalising market segments expected
to be less interested by domestic wines in the future (i.e. Top Range and Ultra Premium) would seem as
the most appropriate strategy to maintain presence in this market.
Question Mark Star
Dog Cash Cow
Relative market share
Ma
rk
et
gro
wth
High
Low
Low High
USA
DE
CN
UK
JP
RU
DK
HK

STUDY ON THE COMPETITIVENESS OF EUROPEAN WINES 134
e. Finally, the position of the United Kingdom between “Cash Cow” and “Dog”. As this country is not a
significant wine producer, European wine presence is most threatened by wines of the competitors, and
this very important market could eventually lose interest in the future (in case EU wines should further
decrease their competitive strength). It would be necessary, therefore, for European wine companies to
implement a strategy to move the position of this market in the “Cash Cow” quadrant (where the UK
was, in fact, before the erosion of market shares by the NWCs). The strategic objective would,
therefore, be to recover market share, to be achieved through the adoption of the same strategies that
have helped NWC wines to achieve success on this market (transport in flexitank, bottling on site and
granting of higher margins75
to retail chains).
7.4 HYPOTHESES ON THE EVOLUTION OF KEY FACTORS OF COMPETITIVENESS
7.4.1 Perceived changes in the importance of factors of competitiveness for packaged wines, from the current situation to 2025
The factors of competitiveness and their hierarchy according to importance have been previously analysed
(§6.2). In particular, the current importance of a number of factors of competitiveness was assessed through
administration of a short questionnaire to key market players interviewed in the case study countries. The
same interviewees were also asked to evaluate whether the importance of the suggested factors would
increase, decrease or remain stable by 2025 (i.e. relative to the importance attributed at present).
In Tab. 40, cells highlighted in red refer to factors of competitiveness that are currently considered
Extremely important (score=3). In our prospective analysis we also took into consideration the factors of
competitiveness that were considered scarcely or not at all important at present (as we could not rule out that
what is a scarcely or not at all important today might become important or extremely important in the future).
Tab. 40: Opinions about future evolution of the importance of factors of competitiveness for packaged wines (from the
current situation to 2025)
“+” More important in the future; “-“ Less important in the future; “=” Equally important in the future
Factors originally rated as “Extremely important” factors (score=3) are highlighted in red; “Important” factors (score=2) are
highlighted in green. Empty cells correspond to factors considered scarcely or not at all important (score=1 or 0)
Influence factors highlighted in yellow; Dependence factors in blue.
Source: questionnaire administered to market players
Tab. 40 shows two extremes, Japan on the one hand, where all factors are predicted to grow in importance,
and Denmark on the other, where only a very small number of factors are expected to increase their
75 “Granting of higher profit margins” is a factor of competitiveness expected to become more important in the future (outlook to
2025) by key market players interviewed in the case study countries, with the only exception of China and Denmark.
EL MR TR EL MR TR EL MR TR EL MR TR EL MR TR EL MR TR EL MR TR EL MR TR
Size of the supplier (exporting or domestic company) + + + + + + = = = = = = + + + = = = + + +
Ability to manage relationships with importers/distributors - - - + + + + + + + + + = = = + + + + + + + + +
Ability to select importers/distributors/buyers = = = + + + + + + + + + = = = + + + + + + + + +
Granting of higher profit margins - - - + + + + + + + + + = = = + + + + + + + + +
Organisation of customer visits at wineries + + + + + + + + + + + + = = = + + + + + + + + +
Brand extension - + + + + + + + + = = = + + = + + + + + = + + +
Product quality + + + + + + + + + = = = = + + + = + + + + + + +
Price + + - + + + + + + + + + = = = + + + + + + + + +
Origin of the product/terroir + + + + + + + + + = = = = + = + + + + + + + + +
Type and quality of the packaging (presentation) + + + + + + + + + + + + + = = + + + + + + + + +
Indication of grape variety + = = + + + + + = + = = = = = + + + + = - + + +
Presence of brands in specialised trade magazines = = = + + + + + + + + + = = = + + + + + + + + +
Brand/Image of the product + + + + + + + + + + + + + = = + + + + = = + + +
Price stability + + + + + + + + + = = = + + = + + + + + + + + +
Offer of logistics services = = = + + + = = = + + + = = = + + + + + + + + +
Width / range of wines selection = = = + + + + + + = = = = = = + + + + + + + + +
Reliability / Compliance with contractual agreements / Timeliness of delivery + + + + + + + + + + + + = = = + + + + + + + + +
Advertising, promotion and comunication activities directed to traders = = = + + + + + + - - - = = = + + + - - - + + +
Reactive adaptation of the product to customers' demand + + + + + + + + + + + + = = = + + + + + + + + +
Appropriate advertising, promotion and comunication activities directed to consumers = = = + + + + + + - - - = = = + + + = = = + + +
Correct price/quality positioning + + = + + + = + + + + + + + = + + + + + = + + +
Factors related
to positioning
UK Total
Factors related
to bargaining
power and
access to
distribution
channels
Factors related
to product
Factors related
to brand
Factors related
to marketing
service
China Japan Russia USA Denmark Germany

STUDY ON THE COMPETITIVENESS OF EUROPEAN WINES 135
importance in the future, while all other factors will remain the same. Furthermore, in all countries (to
varying extents) predictions indicate a further importance increase for factors that have already been
considered (by the same market players) to be extremely important at present.
We feel that these opinions, probably slightly exaggerated, are generated by the expectation that competition
will intensify in the near future. Therefore, in a situation that is perceived as more turbulent, factors
contributing to generate a competitive advantage tend to raise their overall importance (i.e., the bar is set
higher and higher).
On the other hand, there are very few factors for which a decrease in importance is expected. In particular,
“Advertising, promotion and communication activities directed to traders” in USA and UK; “Appropriate
advertising, promotion and communication activities directed to consumers” in USA; “Ability to manage
relationships with importers/distributors” and “Granting of higher profit margins” in China.
Finally, it is interesting to observe that in some cases forecasts are different for the various market segments.
For example:
In the UK, the importance of “Indication of grape variety” is expected to increase for the Entry Level
segment, remain the same for the Medium Range and decrease for the Top range. In the same way, in
USA it is likely to increase for Entry Level and remain the same in the other two segments.
In Denmark, the importance of “Origin of the product/terroir” is expected to increase for Medium Range
wines and to remain the same in the other segments.
In China, the importance of “Price” is expected to increase in the Entry Level and Medium Range
segments, while it is expected to decrease for wines in the Top Range.
It seems reasonable to expect that further increase in the importance of most factors of competitiveness will
be reflected on the importance of Influence factors and Dependence factors (respectively, in yellow and in
blue in Tab. 40) identified through application of the MicMac method (see §6.2.3) but, most likely, not on
their impact hierarchy.
Therefore, the analysis suggests that the main results (previously discussed) should be confirmed also for the
future:
Most of the major Influence factors are linked to behaviour (in particular factors related to bargaining
power and access to distribution channels);
However, when moving upwards from one segment to the next, from Entry level to Top range, some of
the behavioural factors are replaced by product-related factors;
In a similar way, many Dependence factors are related to behaviour (in particular factors related to
positioning and factors related to brand), except one key factor relating to the product (i.e. price).
We recall that the factors for which an opinion was asked about their likely future importance were given to
interviewees in the questionnaire (a total of 21 factors), while those used in the MicMac structural analysis
(to assess the current situation only) were 41 in total, including both the suggested ones and those
spontaneously mentioned by respondents in the interviews.
One of these spontaneously mentioned factors (i.e. product-related) is “PDO-PGI popularity”. This is a key
Influence factor, in particular for Top range wines, but also for Medium range wines, that complements the
key Influence factor “Origin of the product / terroir”.
7.4.2 The competitive position of EU bottled wine by 2025
In order to identify the possible future competitive position of EU wines (and wineries) with respect to NWC
and domestic wines in the case study countries, we developed a combination for each factor of
competitiveness, between the current leading position of EU wines (i.e. best response to factors of
competitiveness compared with NWC and domestic wines) and the factors for which market players forecast
an increase in importance by 2025 (in practice, this was done by combining the results in Tables 28 and 29
with the results presented in Table 40: the future advantage position, indicated with “§” in Tab. 41 and Tab.
42) is given by the combination of “B” (i.e. Better response of EU wines to a factor of competitiveness) and
“+”(i.e. factors considered to become more important in the future).

STUDY ON THE COMPETITIVENESS OF EUROPEAN WINES 136
The underlying hypothesis is that, ceteris paribus, in a situation in which there is an increase in importance
of a competitive factor, the market players that already have this competitive advantage will have greater
potential of maintaining or increasing it.
This is equivalent to identify expected future strengths and weaknesses of European wines relative to main
competitors in the examined markets. At this stage of the analysis, it becomes all the more important to
identify the areas in which European wines are expected to underperform compared to competitors, as these
“weak” areas are the ones on which to focus strategic countermeasures. The present analysis centres, in
particular, on the identified key factors of competitiveness, either characterised as Influence or Dependence
factors (respectively, in yellow and in blue in Tab. 41 and Tab. 42).
Tab. 41: Combination between factors that will increase in importance and factors to which EU wines respond better
compared to NWC wines
“§” factors for which EU wines are expected to have competitive advantage in the future
Factors originally rated as “Extremely important” factors (score=3) are highlighted in red; “Important” factors (score=2) are
highlighted in green. Empty cells correspond to factors considered scarcely or not at all important (score=1 or 0)
Influence factors highlighted in yellow; Dependence factors in blue.
Source: questionnaires administered to market players
The results presented in Tab. 41 show that, compared with NWC wines, EU wines (wineries) could maintain
(or increase) a significant overall competitive advantage in Japan76
and Russia, but also in Germany and the
US. On the other hand, the smaller number of factors to which European wines are expected to respond
better than competitors in Denmark, China and the UK suggest a more uncertain future position, even if the
factors involved for the former group of markets and for the latter are different.
With respect to factors related to characteristics and behaviour of suppliers, EU suppliers main strengths
(compared to NWC) across most examined markets can be identified in their “ability to establish and
manage relationships with importers and distributors” (both Influence factors), in particular in Japan, Russia,
USA, Germany and UK.
Conversely, EU wines main weaknesses (compared to NWC) expected to persist in the future in most
examined markets are relative to “size of the supplier” in all countries but Russia, “brand extension”77
in
Denmark, UK and US (also in China and Germany, but only for Entry level and Medium range wines).
76 Results for Japan do not appear to confirm forecasts (to 2018) presented in Tab.38, however IWSR data, on which forecasts are
based, only consider packaged wines sold through Off-trade channels. 77 Development of new products using an existing brand name. A company using brand extension aims to leverage its existing
customer base and brand loyalty to increase its profits with a new product offering.
EL MR TR EL MR TR EL MR TR EL MR TR EL MR TR EL MR TR EL MR TR
Size of the supplier (exporting or domestic company) § § §
Ability to manage relationships with importers/distributors § § § § § § § § § § § §
Ability to select importers/distributors/buyers § § § § § § § § § § § §
Granting of higher profit margins § § §
Organisation of customer visits at wineries § § § § § § § § §
Brand extension § § § § § § §
Product quality § § § § § § § § § § §
Price § § § § § § §
Origin of the product/terroir § § § § § § § § § § § § §
Type and quality of the packaging (presentation) § § § § § § § § §
Indication of grape variety § § §
Presence of brands in specialised trade magazines § § §
Brand/Image of the product § § § § § § § § § § § § § § §
Price stability § § § § § § § § § §
Offer of logistics services § § § § § § § § § § § §
Width / range of wines selection § § § § § §
Reliability / Compliance with contractual agreements / Timeliness of delivery § § § § § § § § §
Advertising, promotion and comunication activities directed to traders § § § § § §
Reactive adaptation of the product to customers' demand § § § § § § § § §
Appropriate advertising, promotion and comunication activities directed to consumers § § § § § §
Correct price/quality positioning § § § § § § § § § §
Denmark Germany UK
Factors related
to positioning
China Japan Russia USA
Factors related
to bargaining
power and
access to
distribution
channels
Factors related
to product
Factors related
to brand
Factors related
to marketing
service

STUDY ON THE COMPETITIVENESS OF EUROPEAN WINES 137
With respect to factors related to products, brands and positioning, EU wines’ main strengths (compared to
NWC wines) expected to be maintained in the future across most markets, in particular in the Top and
Medium Range segments, concern “product quality”, “origin of the product/terroir” (both Influence factors)
and “product/brand image” (Dependence factor).
Conversely, at Entry level, the main weaknesses of European wines (compared to NWC wines) expected to
persist are “price” (Dependence factor) (i.e. in general, NWC wines are perceived to offer better value for
money in China, Russia, the US, Denmark and the UK) and “price stability” (Japan, US and Denmark).
In markets such as China, Denmark, Germany and UK, “appropriate advertising, communication and
promotion to consumers” (Dependence factor) also appear as a weak strategic area for EU wines.
Tab. 42: Combination between factors that will increase in importance and factors to which EU wines respond better
compared to domestic wines
“§” factors for which EU wines are expected to have competitive advantage in the future
Factors originally rated as “Extremely important” factors (score=3) are highlighted in red; “Important” factors (score=2) are
highlighted in green. Empty cells correspond to factors considered scarcely or not at all important (score=1 or 0)
Influence factors highlighted in yellow; Dependence factors in blue.
Source: questionnaires administered to market players
Results regarding the prospective competitive position of EU wines relative to domestic wines (Tab.42) in
the case study countries that are wine producers appear to be quite clear-cut, showing that competitive
advantage of EU wines is expected be maintained in Russia and to an extent in China, but mainly for wines
in the Medium and Top Ranges.
The situation appears to be less certain on the US and German markets, as most factors of competitiveness
considered as important (relating to both product and supplier behaviour) seem to represent weak points for
European wines78
compared to domestic wines.
With respect to suppliers structure and behaviour, the main weaknesses of European bottled wines (i.e. other
European wines in the case of Germany) in most markets (compared to domestic products) can be identified
in respect of their “ability to select importers/distributors and “manage relationships with
importers/distributors” (both key Influence factors) and in terms of the “size of suppliers”. With regard to
factors related to positioning, “appropriate communication directed to consumers” (key Dependence factor)
78 In the case of Germany, by « European wines » we intend « other European wines » besides domestic wines.
EL MRTR EL MRTR EL MRTR EL MRTR
Size of the supplier (exporting or domestic company) § § §
Ability to manage relationships with importers/distributors § § §
Ability to select importers/distributors/buyers § § §
Granting of higher profit margins § § § § § § § § §
Organisation of customer visits at wineries § § § § § §
Brand extension § § § § § § §
Product quality § § § § §
Price § § § § § § § §
Origin of the product/terroir § § § § § §
Type and quality of the packaging (presentation) § § § § §
Indication of grape variety §
Presence of brands in specialised trade magazines § § §
Brand/Image of the product § § § § § § § §
Price stability § § § § §
Offer of logistics services
Width / range of wines selection § § §
Reliability / Compliance with contractual agreements / Timeliness of delivery § § §
Advertising, promotion and comunication activities directed to traders § § §
Reactive adaptation of the product to customers' demand § § §
Appropriate advertising, promotion and comunication activities directed to consumers § § §
Correct price/quality positioning § § § § §
Factors related
to bargaining
power and
access to
distribution
channels
Factors related
to product
Factors related
to brand
Factors related
to marketing
service
Factors related
to positioning
China Russia USA Germany

STUDY ON THE COMPETITIVENESS OF EUROPEAN WINES 138
also appears as a weakness for EU wines compared to domestic products in the US and China, and for other
European wines in the case of Germany.
With respect to product factors, the main weaknesses of EU wines in the US and other European wines in
Germany, compared to domestic wines, are found “product quality” (especially in the Medium and Top
Range segments) and “origin of the product/terroir” (both Influence factors)79
.
7.4.3 Perceived changes in the importance of factors of competitiveness for bulk wine, from the current situation to 2025
In the case of bulk wines too, we asked market players to express their opinion on the possible variation of
importance of factors of competitiveness, from present to the horizon 2025 (Tab.43).
Tab. 43: Opinions about future evolution of the importance of factors of competitiveness for bulk wine (from the current
situation to 2025)
“+” More important in the future; “-“ Less important in the future; “=” Equally important in the future
Factors originally rated as “Extremely important” factors (score=3) are highlighted in red; “Important” factors (score=2) are
highlighted in green. Empty cells correspond to factors considered scarcely or not at all important (score=1 or 0)
Source: questionnaires, interviews with market players
Compared with the current situation, there seems to be a certain agreement on the greater importance that
product quality will have in the future. This seems to be linked to increasing consumer demand for quality,
especially for Entry level wines (for whom imported bulk wines are mainly intended). Furthermore, the price
factor might acquire even greater importance, due to expected increase in competition in this segment (in
turn, due also to the appearance on the market of new players such as China, India and Brazil).
7.5 POSSIBLE STRATEGIC ADAPTATION OF ECONOMIC ACTORS TO CHANGES IN THE COMPETITIVE SCENARIO AND IN THE HIERARCHY OF KEY FACTORS OF COMPETITIVENESS
What will happen between now and 2025 will be also the result of contrasting strategies (i.e. moves and
countermoves) of the main wine producer countries.
In the medium to long term it is likely that the following competitive strategies will develop, which are
described in the next four sections.
7.5.1 Strategies of expansion or penetration of export markets
With regard to penetration of export markets, the evidence resulting from the analysis of historical data gives
some indication of the strategies that the various competitors are likely to implement in the future.
79 An explanation of the possible reasons was provided in §6.2.2. The interviews suggests that such responses may, at least partly, be
due to national pride. However, US wines appear to be more competitive with respect to suppliers characteristics and behaviour:
the better response of domestic suppliers can be explained by the fact that they “play at home” or by structural factors.
CN JP RU USA DK DE UK
Product quality + + + + +
Price + + + +
Price stability + = +
Origin of the product/terroir - = = =
Correct price/quality positioning + = + +
Large supply volumes + = =
Ability to manage relationships with importers/distributors + = +
Reactive adaptation of the product to customers' demand + = +
Offer of logistics services + = =
Reliability / Compliance with contractual agreements / Timeliness of delivery + = +
Organisation of customer visits at wineries = + -
Consistent quality over time +
Fa
cto
rs r
ela
ted
to
the
pro
du
ct
Fa
cto
rs r
ela
ted
to
th
e
exp
ort
ing
co
mp
an
y

STUDY ON THE COMPETITIVENESS OF EUROPEAN WINES 139
To this end, Tab. 44 shows, for each of the main competitors, the share of exports (in volume) accounted for
by the top 10 country-markets in 2000 and in 2012, respectively for wine in bottles and in bulk. A negative
difference between 2000 and 2012 suggests the adoption of a strategy of expansion into new markets. By
contrast, a positive difference highlights a strategy more focused on a smaller number of markets.
Tab. 44: Percentage share of first 10 export markets in 2000 and 2012 (in volume)
Sources: Comtrade, Comext
In the wine in bottles, all competitors have adopted strategies of expansion of their market portfolios, albeit
in a differentiated manner. Among considered competitors, Argentina and South Africa have implemented
this strategy to the largest extent. At the other extreme, New Zealand and the European Union have adopted
a more "conservative" strategy80
. It is interesting to note the position of Chile, starting from an already lower
level of market concentration, it has progressed further in its market expansion strategy.
On the contrary, for wine in bulk, all competitors have increased their focus on a smaller number of export
markets81
. Argentina, Australia and Chile have pursued this strategy to the largest extent, mainly as a result
of demand growth in the United States (for all three exporters) and in the UK (for Australia). Other
competitors (including the EU) show less important changes in their market concentration strategies.
The issue is to be able to assess whether these strategies will continue in the future.
On the basis of the analysis presented in the previous chapters, it is likely that in the medium term, the
United Kingdom and the United States will continue to be the markets with the greatest potential for
producing countries of the “anglosphere” (i.e. Australia, South Africa, New Zealand), for wine in bulk.
However, in the long term the ties may weaken, as signals of fatigue are already perceived in both markets
(in particular for Australia82
).
For Australia (but also for Chile and Argentina), interest to expand exports towards less traditional or
completely new markets should, therefore, grow in the future. Indeed, at least for Australia and Chile, such
strategic direction is mentioned in recent policy documents (export expansion towards Germany, the
Netherlands, Denmark, Japan, Singapore, Norway, Switzerland, South Korea, etc.)83
.
Therefore, on the horizon to 2025, we can expect an increase in the intensity of competition in markets
where presence of EU wines is currently quite strong (notably, the nearby markets), at least by Chilean and
Australian wines.
Regarding non-traditional markets, according to OIV data (see Fig.57), Algeria, Ghana, Kenya, Mexico,
Mozambique, Philippines, Saudi Arabia, South Korea show interesting wine consumption growth figures.
For these eight non-traditional export markets, consumption has seen a total increase from 1.23 million hl to
approximately 2 million hl between 2005 and 2011 (+7.4% on average per year).
80 However, we must take into account that each EU Member State is a potential export market for competitors (i.e. the EU
comprises some of the largest importers in the world, such as the UK), while for the EU only exports to third countries are
considered here. 81 New Zealand represents the only exception with an extremely small variation), which is also related to very high levels of market
concentration both in 2000 and in 2012 (i.e. the first 10 markets concentrate the near totality of NZ bulk exports). 82 Especially if the unfavourable exchange rate of the Australian Dollar to the US Dollar and the British Pound were to persist. 83 For Australia through the "Directions to 2025" plan and for Chile through the “Wines of Chile strategic plan 2020 - International
market”.
2000 2012 % point diff 2000 2012 % point diff
Argentina 87.4 76.0 -11.4 85.1 97.4 12.3
Australia 93.4 88.8 -4.6 89.8 97.8 8.0
Chile 77.0 69.8 -7.2 84.4 90.8 6.4
New Zealand 95.4 94.1 -1.3 99.9 99.8 -0.1
South Africa 89.3 75.7 -13.6 86.1 86.5 0.4
USA 84.9 79.8 -5.1 93.0 95.0 2.0
EU27* 82.9 80.7 -2.2 89.1 90.4 1.3
*Extra-EU markets only
Still wine exported in bottles Still wine exported in bulk

STUDY ON THE COMPETITIVENESS OF EUROPEAN WINES 140
Fig. 57: Evolution of wine consumption in non-tradional markets, 2005-2011 (million hl)
Source: OIV
7.5.2 Strategies of expansion for products positioned in the higher price/quality segments
Some NWC84
have developed strategic plans with the aim of extending their product positioning to the Ultra
premium and Top Range segments, more traditionally led by European wines85
.
This occurs with a two-fold objective of (i) counteracting the loss of market share in volume terms and (ii)
avoid possible competition from new entrants that are more likely to position their products at the lower and
middle segments of the market.
It is very likely that growth in the upper end of the wine market can only be achieved by responding
appropriately to the key factors of competitiveness in the corresponding segments. In particular, this could be
attained by focusing on Geographical Indications and by associating attributes that express the region of
origin and the specific product image. In perspective, then, some NWC will move towards the European
model of competition, and their higher range wines will come into direct competition with EU wines. United
States and Australia seem to have already started on this path86
.
7.5.3 Strategies of growth of bulk wine exports to the detriment of bottled wine exports, adapted according to product usage function and market segment
Export strategies for wine in bulk (and, therefore, the relationship between bulk and bottled wine exports)
will probably be differentiated depending on usage function and target market segments. In particular:
Imported wine for blending with local wines and/or packaging in BIB under retailer label (in the Entry
level / Commercial premium segments). In this case, international demand trends shall be guided by two
contrasting variables. The first is the development of local production (ie wine from local grapes)
through progressive quantity and quality improvement (for example in China and Russia, with partial
replacement of wine imports). The second is growth in the number of new consumers (usually not very
demanding) and in everyday wine consumption as an accompaniment to meals (e.g. Japan, with growth
prospects for “domestic” wines at Entry level). The balance between these two variables leads to
expectation of moderate market growth for the future, but with improving quality level. The expected
increase of turbulence and competitive conflict in the wine market will require businesses to explore the
possible economies of scale. This could represent an advantage for large size cooperatives (particularly
in Europe) and/or the big private companies, whereas opportunities to operate on international markets
should gradually decrease for smaller size businesses.
84 We refer to the above mentioned strategic plans for the future developed by Australia and Chile. 85 Other NWC, such as New Zealand, already adopt such a strategy. 86 This, for example, is the strategy envisaged by the plan "Directions to 2025" of Australia, through 110 Geographical Indications
and in the United States through the AVA (American Viticulture Areas), which are areas with specific geographical characteristics,
decided by the government. In 2012, 206 AVA were recorded.
-
200
400
600
800
1.000
1.200
1.400
1.600
1.800
2.000
2005 2006 2007 2008 2009 2010 2011
South Korea
Saudi Arabia
Philippines
Mozambique
Mexico
Kenya
Ghana
Algeria

STUDY ON THE COMPETITIVENESS OF EUROPEAN WINES 141
Imported wine for bottling in the consumer market under producer brand, positioned at the Super and
(partly) at Ultra premium segments. The diffusion of flexitank for bulk wine transportation should
consolidate, in the future, the tendency towards bottling wine imported in bulk near the place of
consumption, thus expanding the number of markets. In addition to other benefits (maintain quality,
reducing environmental impact87
), the cost reduction related to this form of transport88
will allow
wineries to increase their competitiveness, not so much on the final price (to the consumer), but rather
through granting of larger margins to the off-trade. In fact, the expected increase in market turbulence
will increase the importance of factors related to market access. In view of further concentration of
distribution, and consequent growth of distributors’ bargaining power, achieving larger margins is a
decisive factor in choosing the wines to distribute89
.
Imported wine for bottling in the consumer market under producer brand, positioned (partly) at the Ultra
premium and Top range segments. For wines of this segment, market activity is already limited, and the
prospects are even worse. In fact, the loss of image of a product not bottled at the origin, because the
product is intended for a target of affluent consumers and connoisseurs, makes businesses desist. On the
other hand, if expectations concerning the growth of the “connoisseur” consumer market were met, we
could hypothesise a rise in exports of bottled wines positioned in these segments.
7.5.4 Strategies of (further) industry concentration
It is likely that the process of Mergers & Acquisitions and alliances between large companies and medium-
sized enterprises in the sector will continue, even if (perhaps) in a more complex way than in the past. This
process of external growth responds to the factor of competitiveness “size of operations”, whose importance
may be expected to increase in some countries, in parallel with the increase of the concentration of
importers/distributors. In addition, an increase in the number of “big players” can be foreseen, due to new
players entering world markets. This hypothesis is supported by observation of recent acquisition of new-
and old-world brands by Chinese and Russian companies.
In this scenario, European businesses could find themselves at a further disadvantage compared to the
current situation (already not very favourable, at least in the markets of the “anglosphere”). In fact, it is
conceivable that organisational forms of aggregation of European supply (similar to those used by the big
American and Australian companies) would hardly emerge spontaneously (i.e. without external prompting).
7.6 CONCLUSIONS ABOUT THE IMPROVEMENT OF EU WINES COMPETITIVENESS
This last part of the study aims at assessing the main problem-areas and at providing suggestions for the
improvement of the competitive position of European wines. Problem-areas and related suggestions emerge
directly from the conclusions drawn as to the current competitive scenario and the likely developments to the
horizon 2025 and, indirectly, through logical inference of the authors of the study.
87 By 2025 all economic sectors should adapt to the norms for reduction of environmental impact, in particular with regard to CO2
emissions. It is therefore likely that the amount of CO2 produced in the processing of one litre of wine will have to be stated on the
label. 88 We observe that in some countries of destination (with lower wages compared to exporting countries), the reduction in transport
costs would be added to the cost reduction in bottling (for example, export by flexitank to China would reduce transport costs and
also bottling costs), but not in other countries with the same level of labour costs. However, in these countries the reduction in
transport costs is greater than the increase in costs of bottling. 89 We previously noted the growing importance foreseen for the factor of competitiveness “Granting of higher profit margins”.
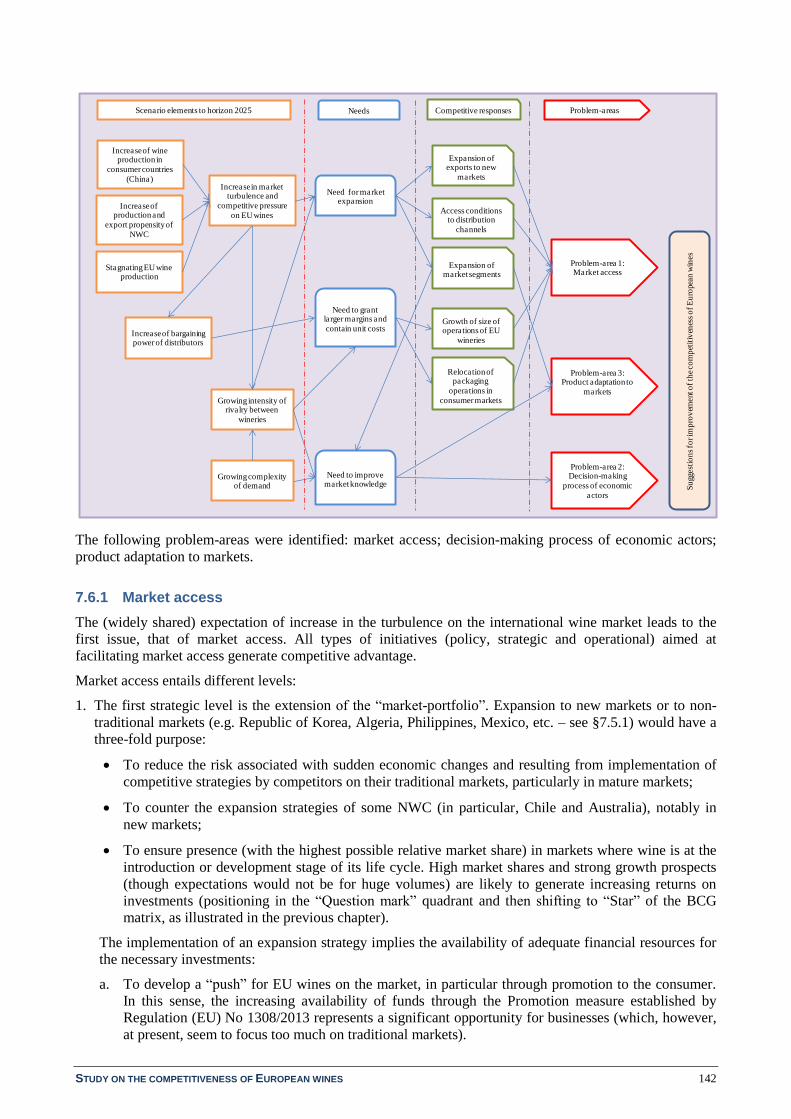
STUDY ON THE COMPETITIVENESS OF EUROPEAN WINES 142
The following problem-areas were identified: market access; decision-making process of economic actors;
product adaptation to markets.
7.6.1 Market access
The (widely shared) expectation of increase in the turbulence on the international wine market leads to the
first issue, that of market access. All types of initiatives (policy, strategic and operational) aimed at
facilitating market access generate competitive advantage.
Market access entails different levels:
1. The first strategic level is the extension of the “market-portfolio”. Expansion to new markets or to non-
traditional markets (e.g. Republic of Korea, Algeria, Philippines, Mexico, etc. – see §7.5.1) would have a
three-fold purpose:
To reduce the risk associated with sudden economic changes and resulting from implementation of
competitive strategies by competitors on their traditional markets, particularly in mature markets;
To counter the expansion strategies of some NWC (in particular, Chile and Australia), notably in
new markets;
To ensure presence (with the highest possible relative market share) in markets where wine is at the
introduction or development stage of its life cycle. High market shares and strong growth prospects
(though expectations would not be for huge volumes) are likely to generate increasing returns on
investments (positioning in the “Question mark” quadrant and then shifting to “Star” of the BCG
matrix, as illustrated in the previous chapter).
The implementation of an expansion strategy implies the availability of adequate financial resources for
the necessary investments:
a. To develop a “push” for EU wines on the market, in particular through promotion to the consumer.
In this sense, the increasing availability of funds through the Promotion measure established by
Regulation (EU) No 1308/2013 represents a significant opportunity for businesses (which, however,
at present, seem to focus too much on traditional markets).
Increasein market turbulence and
competitive pressure
on EUwines
Growth of size of operations of EU
wineries
Expansion of market segments
Expansion ofexports to new
markets
Need for market expansion
Increaseof wine production in
consumer countries
(China)
Increase of production and
export propensity of
NWC
Problem-area 1: Market access
Problem-area 2: Decision-making
process of economic
actors
Problem-area 3: Product adaptation to
markets
Growing complexity of demand
Growing intensity of rivalry between
wineries
Need to improve market knowledge
Increaseof bargaining power of distributors
Need to grant larger margins and
contain unit costs
Relocation of packaging
operations in
consumer markets
Stagnating EU wine production
Access conditions to distribution
channels
Su
ggest
ion
s fo
r im
pro
vem
ent o
f th
e co
mp
etit
iven
ess
of
Eu
ropea
n w
ines
Scenario elements to horizon 2025 Needs Competitive responses Problem-areas

STUDY ON THE COMPETITIVENESS OF EUROPEAN WINES 143
b. To generate structural adjustments in wineries, which are necessary to achieve greater integration
into the international market.
Therefore, it would be desirable:
to encourage more EU businesses to use the funds of the Promotion measure of the wine CMO for
penetration of non-traditional markets such as Republic of Korea, Algeria, Philippines and Mexico
(for example, through a modulation of the rate of co-financing or other incentives);
to give priority to the use of RDP measures (EAFRD) and the investment measures of the wine
CMO (EAGF) for structural and organizational adaptation of export-oriented wineries, through
adequate definition of the selection criteria (scores) for businesses to access funding.
However, a policy of expansion probably involves changing two, partly cultural, aspects. The first
concerns the rather “inward” vision of European production, by which wine exports remain marginal
relative to the internal market. The second is due to the constraints posed to production potential90
,
which, in principle, clash with the objective of increasing penetration of European wines on third country
markets.
2. The second level is political-institutional and concerns the signing of bilateral preferential trade
agreements with third consumer countries, also (but not only) with a view to expanding the market
portfolio. In this respect, as highlighted in §5.5.5.2, the EU seems to be lagging behind compared to some
competitors (Chile, in particular), who show a more dynamic behaviour. In the hypothesis that exchange
rates between the Euro and other currencies will remain at current levels, and in view of an increase in
market turbulence, this delay translates into a potentially increasing competitive disadvantage for EU
wines. Therefore:
It would be desirable to speed up / start up bilateral agreements between the EU and partner countries
concerning (also) wine. The partners should not only be the traditional ones with which agreements still
are not in place (e.g. China, Russia) or negotiations are currently ongoing (e.g. Japan, USA), but also
other non-traditional markets (e.g. Philippines). In this sense, it would be desirable for a stronger link
between institutional and economic partners, in order to achieve coherence between public and private
initiatives (in essence, creation of a system).
3. The third level is access to distribution channels, and therefore it regards influencial key factors of
competitiveness for which action may be to some extent stimulated by the public authority91
. We have
identified “Intensity of PR activities with importers, buyers, etc.” and “Size of the supplier”. We recall
that, considered together, these two key factors of competitiveness influence (directly or indirectly) other
important factors, specifically:
Appropriate advertising, promotion and comunication activities directed to consumers;
Correct price/quality positioning;
Price.
In addition, they also have some influence (direct or indirect) on the following dependent factors:
Brand / Image of the product;
Encourage the importer to present the wines in specialised magazines;
Consistency in the price/quality ratio.
90 We have information of strongly export-oriented wineries who, given the constraints to production potential, covered the gap
between demand (fast-growing) and supply (constrained) through partial relocation of agricultural production in North African
countries. 91 Here we do not consider, among the key factors for market access (identified in Theme 2), those that depend only on the degree of
responsiveness of firms, which we could only address by recommending adjustments in their individual behaviours.

STUDY ON THE COMPETITIVENESS OF EUROPEAN WINES 144
With regard to the first key factor (i.e. Intensity of PR activities with importers, buyers, etc.), in principle
Public Relations may be included among the activities allowed under the Promotion measure, which then
becomes functional to create the conditions for a more effective response to this key factor of
competitiveness.
However, it would be desirable to encourage, through appropriate adaptation of the selection criteria
(scores), the submission of promotional plans that include incoming activities (i.e. organisation of
customer visits at wineries), deemed as important, in particular, in Russia, Japan, USA and Germany.
Concerning the “Size of the supplier”, the small size of European businesses represents a not easily
overcome constraint in the short- to medium-term. In order to overcome barriers to market access and
negative effects on other key factors, the possibility of solving the structural size problem through an
organizational solution could be explored, so as to allow organized groups of small businesses to implement
appropriate marketing strategies (in terms of effectiveness and efficiency of invested resources). Therefore:
It would be desirable to develop public initiatives to facilitate the establishment of aggregate business
forms and an organised system of collaborative marketing, able to overcome the ‘size’ barrier, allowing
at the same time to reach a critical mass in terms of number of products and of wider / deeper product
portfolio as demanded by distributors/retailers (in particular, the Off-trade). This would be desirable for
all case study markets, but especially the UK and USA.
4. The fourth level regards wine businesses cost structure and the possibility to grant higher margins to
distributors. This directly leads to the possibility (in some markets, and only for wines positioned in the
Super and Ultra premium segments) to transfer wine in flexitank and to relocate bottling operations in the
consumption markets. The adoption of bulk transportation in flexitank could help European companies
extend trade beyond nearby markets, therefore implement strategies for expansion in new markets.
However, this possibility implies overcoming the resistance to change (embedded in the culture) that
characterises the conservative structure of organisations managing PDO-PGI labels. This resistance,
which already is an element of competitive disadvantage at present, will hinder EU wines competitiveness
even more in the future, especially wines positioned in the segments mentioned above. In addition, wine
transfer in flexitank would require a change in the logistics and operational organisation of EU suppliers
in export countries, in order to relocate bottling activities. Therefore:
There is a need to overcome the self-imposed constraints of many production protocols of European
PDO and PGI wines (i.e. obligation to bottle wines within the production area), at least for wines other
than those in the Top range.
In addition, ways should be found to encourage technological adaptation, as well as the organisation of
logistics in the country of arrival, required to relocate bottling operations. For this purpose, the
possibility of extending the scope of the investment measures provided for in the wine CMO could be
considered, acknowledging, however, that this would generate complex problems of implementation
under current EU rules.
7.6.2 The decision-making process of economic actors
The analysis suggests that in the future wine demand will probably be more complex and sophisticated than
at present in the various country-markets, and that increased market turbulence will lead to more intense
rivalry between producers of wines of different origins. The ability of European wine businesses to react and
adapt to changes in the competitive environment foreseeable to the horizon 2025 also entails an improvement
of the conditions that facilitate the decision-making process of the actors.
This is needed, in particular, to better respond to key factors of competitiveness related to positioning and
communication (specifically, “Correct price/quality positioning” and “Appropriate advertising, promotion
and communication activities directed to consumers” in each segment).
STUDY ON THE COMPETITIVENESS OF EUROPEAN WINES 145
In this respect, the improvement of the level of knowledge of market developments and of the competitive
environment that can encourage “Reactive adaptation of the product to customers’ demand” is a critical
aspect. This gives rise to two needs:
Improved knowledge of the various consumer target profiles and of consumer behaviours as a function
of “local culture” and of their evolution (i.e. changes in lifestyles, emulation of consumption patterns
other than local traditional ones, etc.)
Improved knowledge of competitors’ behaviour, in order to identify their moves (attack strategies) and
countermoves (defence strategies), both direct and indirect, implemented to achieve competitive
advantage.
Therefore:
It would be appropriate to develop a market intelligence system able to convey to European businesses
along the supply chain adequate information about changes occurring in the markets and in the
behaviour of competitors.
However, wine businesses should develop the ability to translate this information into business decisions.
This may be most effectively achieved through the improvement of skills relating to effective use of business
tools92
. Therefore:
It would be appropriate to encourage the implementation of training activities in export business
targeted to the industry, for example within Measure 1 - Knowledge transfer and information actions of
2014-2020 RDPs, through the involvement of already existing local organisations (e.g., chambers of
commerce, chambers of agriculture, etc.)
7.6.3 Product adaptation to markets
This problem-area leads directly to the issue of strategic decisions concerning the product on the different
markets. In turn, this involves different and politically sensitive aspects, which can be explained as follows.
A first strategic aspect concerns the identification of the market segments that should be developed (e.g.
global niche of excellence, premium wines, wines for the mass-market) and which labels are more effective
for marketing to the consumer (in particular, on foreign markets). Specifically:
a. Regarding European PDO/PGI wines, the analysis has highlighted low level of knowledge, but above all
lack of use of these labels by distributors/retailers for communication. One important reason is the
generation of confusion: European GI wines appear on foreign markets with a multitude of acronyms
depending on the language of the Member State of origin (AOP, DOP, PGI, etc.) In addition, the
confusion for non-expert consumers (but not only) further increases due to the co-existence of new
definitions and relative acronyms (i.e. PDO/PGI) with the old ones (DOC-DOCG wines in Italy, AOC
in France, etc.). Finally, a further critical point is the preservation of the difference between terroir
(PDO wines) and territoire (PGI wines). Although the difference is clear in the regulations, it is not as
clear for non-expert consumers, thus generating confusion. It is, therefore, no coincidence that major
retail chains (in third countries, but also in Member States who are not wine producers) do not place
much value on these labels, choosing instead the geographical origin (i.e. the country and the region of
production) as a factor of communication/information/orientation of consumers’ purchase decisions. In
essence, the very articulated regulations concerning GI labels seem to be in place more to meet the
needs of producers oriented to the internal market (i.e. the market of wine producer countries) rather
than to satisfy the information needs of consumers in non-producer countries (who demand more
simplified information, especially concerning premium wines).
Finally, it is important to remember that the market development strategies adopted by some of the most
aggressive EU competitors aim to add value to the geographical indication of their wines, in the sense
desired by retail chains (i.e. indication of the production region). Therefore:
92 Wine exports involve a wide range of actors: wholesalers, exporters, co-operatives but also farmers who are also wine makers, who
may not necessarily have developed these skills.

STUDY ON THE COMPETITIVENESS OF EUROPEAN WINES 146
With regard to PDO and PGI labels of wines positioned in the Top range and Ultra premium segments
(intended for a more experienced consumer target), it would be appropriate to combine the acronyms
used by different Member States in a single acronym to be used worldwide, associated with a
mandatory logo (as developed for the organic sector). For these wines it would be appropriate to
continue with information and promotion activities, as “PDO-PGI popularity” emerges from the
analysis as a key factor of competitiveness for wines in the higher price/quality ranges.
With regard to wines that enter the Commercial and Super premium segments, for which the “Origin of
the product” is more important than PDO-PGI labels (consumers who may not be very experienced, but
are sensitive to the history, culture and image of the country of origin), it would be appropriate to
introduce into EU regulations the indication of the country/region of origin (for example, an umbrella
brand covering wines of a member country - e.g. Italy - or region - e.g. Tuscany).
It would thus be appropriate to extend the financing of activities envisaged by the Promotion measure
of the wine CMO to this type of wines.
b. With regard to European varietal wines, the analysis shows that they have not been successful. The
incidence of these wines on total EU exports is marginal and exports did not pick up over time. It seems
clear, therefore, that this is not a strategy for which European producers show much interest, and that it
is not favoured by the governments of the producing Member States. However, this lack of success may
be partly due to the restrictions adopted in some Member States on eligible varieties, which may play
against foreign market development in countries where the mention of grape variety is considered as a
factor of competitiveness (e.g. USA and UK).
c. With regard to wines in the lower price/quality ranges, the analysis has shown the existence of foreign
markets (e.g. Angola, Côte d'Ivoire) and EU markets (e.g. Germany) that demand large volumes of wine
in these segments. While these wines do not enjoy an image of prestige, low margins applied to large
volumes are economically attractive for European companies, in particular for large cooperatives. On
the other hand, the experience of other (industrial) sectors teaches us that a great production power
(such as the EU) produces goods to cover all market segments, whereas focusing on specialist segments
is a strategy typically adopted by small producer countries (such as, for example, New Zealand).
Therefore:
Taking into account the increasing complexity of segmentation expected in the future, it does not seem
prudent to focus only on high quality wines (PDO-PGI), neglecting wines in the lower ranges for
everyday consumption by lower-income families.
The adaptation of wine products to market demand also entails exploring the possibility to develop products
for which there is demand potential (still not met) expressed by certain target segments, but a developed
market does not yet exist. This could be, for example, the demand for wines with low or zero alcohol content
by particular target groups who currently are excluded from wine consumption (drivers, consumers with
health problems, pregnant women, etc.) However, as for all innovative products on the market, it would be
necessary to have in place a definite regulatory framework. Therefore:
Considering the demand potential for low or zero alcohol wines, it would be beneficial to ensure a clear
legal framework for such products.
A third more operational aspect concerns the adaptation of product presentation to meet local preferences
(“Type and quality of the packaging” is a key factor of competitiveness growing in importance everywhere).
Suggestions for this aspect could result from better knowledge of individual markets (therefore, through the
development of a market intelligence system), but also through intensification of “PR activities with
importers, buyers, etc.”. However, implementation would depend on the ability of wine companies to
develop and manage innovations demanded by the market. Therefore:
It would be desirable to encourage the investments needed to develop and implement the innovations
demanded by different markets. For this purpose, it may be beneficial to use RDP measures (EAFRD)
and the investment measures of the wine CMO (EAGF), through appropriate definition of selection
criteria (scores).

doi: 10.2762/56910


