i STUDY ON USAGE OF CHRYSOTILE FIBER IN CEMENT ROOFING SHEETS Prepared by Archt. Chameera Udawattha & Eng.Damruwan Bibilegedara Supervised by – Prof.Asoka Perera Prof. S.M.A Nanyakkara Porf. Rangika Halwatura
Transcript
i
STUDY ON
USAGE OF
CHRYSOTILE
FIBER IN CEMENT
ROOFING SHEETS
Prepared by Archt. Chameera Udawattha &
Eng.Damruwan Bibilegedara
Supervised by – Prof.Asoka Perera
Prof. S.M.A Nanyakkara
Porf. Rangika Halwatura
ii
Executive summary The Sri Lankan government has announced to banned Asbestos roofing sheets. And they have
introduced an alternative instead to use as roofing materials similar to asbestos but made of fiber
cement. This study was conducted to understand the quality difference of alternative fiber cement
roofing materials introduced by the government. The study was conducted to compare the
engineering properties of both different roofing materials. In this study, the quality checking and
standard tastings were carried out to understand the strength durability etc. variation between
those two materials. In addition, the main types of roofing applications are the roofing sheets and
ceiling sheets. Both have different quality aspects and standards. Therefore, both different roofing
sheets were taken into consideration separately and checked the engineering properties
separately.
The study was directed at the University of Moratuwa under the supervision of Prof. Asoka Perera,
Prof.S.M.A Nanayakkara, and Prof.Rangika Umesh Halwatura. The study was carried on by
Archt.Chameera Udawattha and Eng.Damrunwa Biblegedara. The study was conducted at the
materials testing lab and the structural testing lab. In addition to strength, the chemical studies
were done in the chemical lab and the material resistant to acid was done in the environmental
lab. The study was conducted after following series of standards testing defined and developed by
the ISO in order to confirm the quality of both types of roofing sheets. The usage and the technical
aspects of both produced were compared according to the ISO standard such as ISO 8336 Fibre-
cement flat sheets, Product specification and test methods and ISO 10904 Fibre-cement
corrugated sheets and fittings for roofing and cladding. Sri Lankan standards are covering both and
the results were used to analyze the technical aspects of these produced to the conformity of SLS
standards by using results obtained by the total study.
The study suggests that the fiber cement roofing sheets cannot replace the quality requirement
for roofing sheets. Instead, the engineering properties of the fiber cement roofing sheets are lower
than the chrysotile asbestos roofing sheets. The study suggests that existing fiber cement roofing
sheets are far below the required quality of roofing sheets. In addition to quality testing, the total
life-cycle cost was studied, because the Lifecycle cost comparison will give a better idea of the use
of the low-quality material as roofing materials. The results show that the fiber cement roofing
cement should be replaced frequently and the total life-cycle cost is comparatively higher than
chrysotile asbestos roofing sheets.
iii
CONTENTS
Executive summary ................................................................................................................................. ii
compared with non-fibre-reinforced cement-based materials. The advantage of fibre
reinforcement is that they bridge the matrix cracks and transfer the loads after cracking has
started. This post cracking toughness allows more intensive use of cellulose in building. Cellulosic
fibres also provide adequate strength, stiffness and bonding capacity to cement based matrices
for substantial enhancement of their flexural strength, toughness and impact resistance (Ardanuy,
et al., 2015). In addition to the relatively high strength and toughness, Cellulose fibre is readily
available and provides desired longevity, fire resistance and life cycle economy (Soroushian, et al.,
2012).
Cellulose fibre is known to be an eco-friendly thermal insulation material which offers good
thermal properties and has a low embodied energy. However due to lack of expertise in its
application and properties, cellulose is not widely used in insulation compared to more traditional
insulation materials (Hurtado, et al., 2016). According to the thermal performance, the roofing
sheets reinforced with vegetable fibre are said to be acceptable as substitutes for asbestos-cement
sheets (Roma, et al., 2008). In a climate similar to Southern USA, the cellulose reinforced fibre
composite has a good and satisfactory performance for periods more than 18 years, if installed in
8
a correct manner and maintained subsequently. However, cellulose has less need for maintenance
than other materials because of its high inherent durability (Cooke, 2000).
Cellulose has been in use in the paper industry for many years, but only little evidence is recorded
for disease in relatively high exposure. But this can be due to the limited epidemiological studies
undertaken in the past. Although some surveys have shown that cellulose has the potential to
produce respirable fibres, the extent of fibrillation is not established (Harrison, et al., 1999).
Similarly the study undertaken by Cullen et al (2002) to determine the toxicity of the cellulose
shows that respirable cellulose fibre was less toxic in vitro than the mineral fibres crocidolite.
However, in the in vivo tests, high exposure to cellulose fibres produces harmful effects including
tumours. Only few of the samples studied contained mesothelioma whereas the others had
sarcomas which are not normally observed with mineral fibres. So the ability of cellulose to cause
pulmonary carcinomas following inhalation is still not clear and further studies on long term
inhalation is required.
P-aramid:
P-aramid fibres have been used as a substitute for chrysotile asbestos, mainly in brake linings and
gaskets (Warheit, et al., 1997). Aramid fibres were the first organic fibres with high tensile strength
and modulus to be used as reinforcement in composites. They have better mechanical properties
than synthetic fibres, steel and glass and also they are able to maintain these properties and high
temperature due to their high heat resistant ability. Densities of aramid fibre range from 1.35-
1.45g/cm3 according to its properties (Jassal & Ghosh, 2002).
Studies done on rats to compare the pulmonary effects made by chrysotile asbestos and para-
aramid fibres showed that inhaled para-aramid fibres were bio degradable in the rats’ lungs
whereas the long chrysotile asbestos fibres retained (Warheit, et al., 1996, 1997).
Researches are going on to find more substitute fibres for asbestos apart from the above
mentioned three fibres(PVA,Cellulose and p-aramid). Some of those are ;
Alternatives:
Under this study alternatives are defined as the products which provide the same purpose of
asbestos, mainly roofing. A roofing material is considered to be good if it is adequate to withstand
the loads within its life span. This depends on the material properties such as tensile strength,
density and material composition (Obam & Taku, 2015). Other than asbestos, clay tiles, concrete
tiles, Zn/Al sheet and Reinforced Concrete deck are currently used in the Sri Lankan Building
Industry (Perera & Fernando, 2002).
Clay Tiles:
Clay tiles are known to be the most visually attractive and distinctive traditional roofing material
due to their availability in various shapes, textures, colours, profiles and patterns. In early days
clay tiles were made by hand and later by machine extrusion of natural clay, glazed with colour
and fired in high temperature kilns (Costa & Mauroof, 2005).
Clay roofing tiles are widely used as exterior building components and their durability which is the
ability to withstand adverse climatic conditions is one of the most key requirements to be
considered in the structural design of modern buildings. The service time period of the clay based
components are heavily reduced due to the frost action and salt crystallisation .During the
9
temperature drop below 0oC, the water in the clay tiles freeze and the density difference between
the ice and water creates an internal pressure. This leads to micro cracks in the clay tiles
(Raimondo, et al., 2009).
Perera & Fernando (2002) in their comparison between roofing materials concluded that tiles have
low water tightness due to their high water absorption rate and improper interlocking in side and
ends. They also added due to the high probability of getting damaged, clay tiles are less durable
when compared to other materials. In contrast to this, Costa & Mauroof(2005) said that clay tiles
are preferred due to their durability and they generally have life expectancy for about 100 years.
By nature, clay is a not a good conductor of heat, so using clay tiles will not only save money from
the energy cost but also will reduce the internal temperature. This makes it an ideal material for
the roof (Costa & Mauroof, 2005).A study was done recently by Srimanna & Attalage (2016) to
identify the thermal performance of the roofing materials which are widely used in Sri Lanka. The
results showed that out of clay tile, asbestos and steel roofing; clay tile has the best thermal
performance, whereas steel roofing has the worst. Compared to clay tile roofing, asbestos roofing
and steel roofing can have a higher ceiling temperature by 4 ◦C, 6 ◦C respectively.
Based on the study done by Kuruppuarachchia, et al (2007), it can be concluded that clay based
roof tile manufacturing is more environmentally friendly in both traditional and modern methods
than cement and asbestos fibre roofing sheets in impact categories such as respirable inorganics,
climate change, eco toxicity, acidification and fossil fuels.
Metal Corrugated Sheets:
In the building industry, with the continuous search for better alternative roofing materials, metal
roofing is gaining lead in the last decade, driven by long-term economic benefits and sustainability.
Some other reasons for the preference of metal roof over conventional asphalt based roofing in
residential and commercial buildings are longevity, good looks, availability in vivid colours and
patterns, wind and fire resistance, better leak protection, lower maintenance costs and
recyclability . (Anugula, et al., 2012).
In the construction industry, to promote resource conservation and reduce maintenance work,
construction materials should be highly durable. In the case of metal, mainly organic composite
coated steel sheets, corrosion is the main concern. So, these sheets should have basic properties
such as corrosion resistance and formability (the property that suppresses the peeling and scoring
of metal coatings during roll forming). In addition to these properties, pre-painted steel sheets
should have an excellent surface appearance which is free from cracks and other damage even
after forming. As the Zn coated steel sheets have a limit in the increase of corrosion resistance,
the usage of Zn-Al alloy coated steel sheets which is more corrosion resistant is increasing.
(Yamashita, et al., 2002).
Generally, metal roofing sheets (zinc, aluminium, galvanized sheets etc.) expand due to air
temperature change and the heat from the sun. Aluminium, one of the widely used metals for
roofing sheets, is soft, malleable, ductile, and light weighted with a dull-silvery colour which is
caused by the Aluminium oxide that forms quickly due to the exposure to air. Aluminium oxide has
a higher melting point than pure aluminium. Due to this protective oxide layer, aluminium sheet
is durable and has excellent corrosion resistance. Aluminium has about one-third of the density of
steel or copper. The tensile strength of aluminium in its pure state and alloy state is about 49MPa
and 400 MPa respectively (Obam & Taku, 2015).
10
PVC Sheets:
PVC roofing systems were introduced to the market in the late 1950s and early 1960s. The initial
system had unreinforced PVC sheets which were held in place by ballast and were attached at the
perimeters and field flashing locations. In late 1970s, the PVC roofing system gained demand and
in early 1980s, marketing of reinforced PVC sheets that were also placed by ballast started. Later
in the 1980s it was found out that aged PVC sheets fail when they experience a high impact load
during hail storms (Koontz, 1997).
A study done to evaluate the life time of PVC roofing membranes showed that roofing systems
which had an average life time of 20 years were performing well without any leakages. As the roofs
examined were the oldest, it was not possible to predict their remaining life time. However, by
considering the age and the condition of the roofs analysed, it was suggested that reinforced PVC
roof membrane system could perform in excess of 20 to 30 years in various climates throughout
Europe and North America if properly installed and maintained (Beer, et al., 2005).
PVC in similar to asbestos ceiling sheet has low density, low thermal conductivity and high thermal
resistivity which was favourable when compared to other thermal insulators. PVC ceiling with its
physical appearance, strength, chemical resistance, fire resistance, maintenance-free and freedom
from toxicity, odour, and taste may be a better material for thermal design application (Onyeaju,
et al., 2012).
The initial method to evaluate the test results of the asbestos sheets are the test with the main
sheets and confirm the quality of asbestos sheets and come up with a proper standard for the
asbestos sheets.
And following standard tests were being carried out in order to confirm the standard of existing
crystallite asbestos sheets and fibre cement roofing sheet products.
11
Criteria of Conformity 1. When tested, only one defective sheet is acceptable in the sample.
2. The test results should conform their specific standard conditions listed below in the table
SLS:9:Part 1:2001
SLS:9:Part 2:2001
ISO 8336:2009 ISO 10904:2011
Asbestos Flat Sheets
Asbestos Corrugated Sheets
Non- Asbestos Fibre Cement Flat Sheets
Non-Asbestos Fibre Cement Corrugated Sheets
Bending Strength (Loading Parallel to Asbestos Fibres of the sheet)
≥ 13MPa Category C; But depending on class varies; Assuming Class 4 ≥ 16 MPa
Varies according to category and class; Check Table 4 of the standard
Bending Strength (Loading perpendicular to Asbestos fibres of the sheet)
≥ 16MPa
Breaking Load ≥ 5kN/m Varies according to category and class; Check Table 3 of the standard
Density ≥ 1200 kg/m3
≥ 1200 kg/m3 ≥ Manufacturer’s specification
≥ Manufacturer’s specification
Water Absorption ≤ 28% of dry mass
≤ 28% of dry mass
- -
Water Tightness/water permeability
- Trace of moisture may appear; But no droplets
Trace of moisture may appear; But no droplets
Trace of moisture may appear; But no droplets
Resistance to Acidified Water
≤ 1.15 kg/m2
≤ 1.15 kg/m2 - -
Moisture Movement ≤ 0.07% -
Freeze-Thaw performance ≥ 0.7
Heat-Rain Performance No visible cracks, delamination or other defects should be present to a degree that would affect performance
Warm Water performance ≥ 0.8 ≥ 0.7
Soak-Dry Performance ≥ 0.75 ≥ 0.7
Resistance to mould growth
≤ 1
Resistance to nail head pull through
≥ 400N
12
Tested standards 1. SLS Standards 2. ISO 8336:2009 3. ISO 10904:2011
13
SLS Standards
Lists of tests need to be done 1) Dimension Measurement
a) Corrugated Sheets
b) Flat Sheets
2) Testing of Bending Strength
a) (Flat sheet)
b) Corrugated Sheets
3) Testing for Density
a) Corrugated Sheets
b) Flat Sheets
4) Testing for water absorption
a) Corrugated Sheets
b) Flat Sheets
5) Testing of Water tightness
i) Corrugated Sheets
6) Testing for Resistance to Acidified Water
a) Corrugated Sheets
i) Acetic acid 5% (m/m) solution
ii) Sodium Hydroxide; 0.5M standard volumetric solution
iii) Thymol blue solution (dissolve 0.04g of Thymol blue in 100 ml of 95 % (v/v) ethanol)
b) Flat Sheets
i) Acetic acid 5% (m/m) solution
ii) Sodium Hydroxide; 0.5M standard volumetric solution
iii) Thymol blue solution (dissolve 0.04g of Thymol blue in 100 ml of 95 % (v/v) ethanol)
14
Dimensional measurement and geometrical testing procedure General
This annex gives the details of the measuring apparatus and measuring procedure which are to be
used for the determination of compliance with the requirements of this International Standard.
Figure 1: Corrugated Sheets dimensions
Principle Sample sheets, selected from batches of sheets, are measured to determine their compliance with
the length, width and thickness requirements of this International Standard.
Apparatus The apparatus shall include the following items.
• Inspection surface, smooth, flat, rigid, of standard quality, having dimensions appropriate to the size of the sheets being measured.
• Two metal rules shall be fixed at right angles along adjacent edges of the inspection surface. The straightness of each metal rule shall be at least 0,3 mm/m and the right angle shall be accurate to at least 0,1 % (less than 1 mm deviation from normal per metre of length) or 0,001 rad.
• Alternatively a portable square of at least 1 000 mm in each direction shall be used. The same requirements for straightness and angularity apply.
Rules, short, metal, capable of being read to an accuracy of 0,5 mm.
Measuring tape, metal, of sufficient length to measure the length of a sheet to an accuracy of 1 mm.
Dial gauge, reading to at least 0,1 mm, with flat parallel metal jaws between 10 mm and 15 mm in
diameter.
15
Measuring procedure
Measurement of length and width GENERAL
Avoid taking the measurement over a local deformation which could be considered as a visual defect.
Smooth any rough areas.
Take each dimensional reading to the nearest 1 mm.
Measure each dimension three times on each sheet, i.e. one in the middle and one at about 50 mm
from either end.
Measurement of Sheets
For large-sized sheets make three thickness measurements, with a dial gauge, along one side of the
sheet taking each reading to an accuracy of 0, 1 mm, as indicated in Figure 3. Report the individual
results and calculate the arithmetic mean and difference between extreme values.
For small-sized sheets, make two measurements with a dial gauge on each sheet, approximately 20
mm from the edge in the middle of two adjacent sides.
Report the individual results and calculate the arithmetic mean and difference between extreme
values.
Figure 2: Measurement of thickness on large-sized non-textured sheets
Figure 3: Measurement of thickness of large textured sheets
Measurement of edge straightness For large-sized sheets measure on all four edges the greatest distance between the edge of the sheet
and a string or wire stretched from one corner to the adjacent corner with a steel rule.
16
Record the measured value.
TEST RESULTS: RECORD THE MEASURED VALUE
MEASUREMENT OF LENGTH AND WIDTH OF ASBESTOS CORRUGATED SHEETS
Dimensions 1.0 Minimum Width 109.5cm 2.0 Maximum Width 109.5cm 3.0 Minimum Length 249.5cm 4.0 Maximum Length 249.7cm 5.0 Average Width 109.5cm 6.0 Average Length 249.6cm
MEASUREMENT OF LENGTH AND WIDTH OF CEMENT FIBER CORRUGATED SHEETS
Dimensions 1.0 Minimum Width 94.0cm 2.0 Maximum Width 94.0cm 3.0 Minimum Length 179.0cm 4.0 Maximum Length 179.1cm 5.0 Average Width 94.0cm 6.0 Average Length 134.6cm
MEASUREMENT OF LENGTH AND WIDTH OF ASBESTOS FLAT SHEETS
Dimensions 1.0 Minimum Length/Width 122cm 2.0 Maximum Length/Width 122cm 3.0 Average Length/Width 122cm
MEASUREMENT OF LENGTH AND WIDTH OF CEMENT FIBER FLAT SHEETS
Dimensions 1.0 Minimum Length/Width 122cm 2.0 Maximum Length/Width 122cm 3.0 Average Length/Width 122cm
MEASUREMENT OF THICKNESS OF ASBESTOS CORRUGATED SHEETS
Thickness 1.0 Minimum Thickness 6.2mm 2.0 Maximum Thickness 6.3mm 3.0 Average Thickness 6.25mm
MEASUREMENT OF THICKNESS OF CEMENT FIBER CORRUGATED SHEETS
Thickness
1.0 Minimum Thickness 2.9 mm
2.0 Maximum Thickness 3.96 mm
3.0 Average Thickness 3.14mm
17
Measurement of sheet square ness Place two adjacent corners of the sheet in succession between the arms of the square keeping one
edge against the full length of the large arm and the other in contact with the small arm at least one
point.
In this position measure to the nearest 0,5 mm the greatest distance of the sheet edge from the small
arm of the square. Record the measured value.
TEST RESULTS FOR OUT OF SQUARENESS
CRYSTALLITE ASBESTOS CORRUGATED SHEETS
Sample 1 Sample 2 Sample 3 Average
A 11.1 11.25 10.98 11.11
B 8.74 8.56 8.93 8.743333
FIBER CEMENT CORRUGATED SHEETS
Sample 1 Sample 2 Sample 3 Average
A 17.92 16.17 18.36 17.48333
B 21.1 17.46 16.53 18.36333
18
Testing of Bending Strength General
This annex gives a method for determining the modulus of rupture for fiber-cement sheets.
Principle
A specimen is cut from a sample sheet and subjected to a flexural bending load until failure occurs,
the failure load and specimen thickness are recorded. This test is repeated on the specimen with
the bending mode at right angles to the initial test. The average modulus of rupture for the
material is calculated from the test results.
Bending testing machine, which shall apply a load at a constant rate of deflection with an error of
accuracy and an error of repeatability of 3 % comprising: two parallel horizontal supports, one
fixed and the second free to move to permit alignment with the specimen. The upper face of each
support shall be rounded and shall have a radius between 3 mm and 25 mm (see Figure D.1).
A loading bar having the same edge radius as the supports, located parallel to and equidistant
from the supports. The loading bar is attached to the loading mechanism through a flexible
connection.
The lengths of the supports and loading bar shall be greater than the width of the test specimen.
Micrometer, reading to an accuracy of at least 0,05 mm, with flat parallel metal jaws between 10
mm and 15 mm in diameter.
Dimensions in millimeters
Figure 4: Bending test configuration
Specimen preparation
Prepare specimens to conform with the dimensional requirements of the referring standard (see
7.3.1) and condition samples prior to testing as appropriate for the sheet category (see Table 11).
a 3 mm to 25 mm.
19
Test procedure
a) Arrange the supports to be at the appropriate spacing for the specimen.
NOTE this is normally 200 mm between bar centres, but can be altered according to the specimen characteristics (see Figure 4).
b) Measure the thickness of the sheet along the imaginary line of breakage (see Figure D.2).
Measure smooth sheets at two points. For textured sheets, measure the thickness of the
sheet by calculating the water displacement. Alternative methods for determination of
average thickness of textured product may be used provided that they can be proven, on
average, to yield a thickness measurement within plus or minus 2% of that determined from
the volume measurement by water displacement.
c) Arrange the specimen with the under face against the supports and the loading bar on the
upper face equidistant between and parallel with the supports.
d) Load the specimen such that the breakage occurs within 10 s and 30 s. A constant rate of
deflection is preferred; if this cannot be achieved a constant rate of loading is acceptable.
Record load at break.
e) For square specimens, re-assemble the broken pieces and submit the specimen to a
second bending test with the line of load application at right angles to that of the first test.
Record load at break.
NOTE where rectangular specimens are being used, the strengths in two directions are
obtained by testing each of the appropriate specimens (see Figure D.2).
a) Square specimens b) Rectangular
specimens
Figure 5 : testing breaking load of different size samples
20
Calculation of modulus of rupture value
The MOR, in mega pascals, for each breaking load direction is given by Equation (D.1):
Equation 1
where
F is the breaking load, in newton; ls is the span between the centre-lines of the supports, in millimetres; b is the width of the test piece, in millimetres; e is the thickness, in millimetres.
The MOR, in megapascals, for each breaking load direction is given by Equation (D.1):
for non-textured sheets, it is the arithmetic mean of two measurements for each breaking load
direction, for face textured sheets, it is calculated from the volume measured by water
displacement.
The MOR of the sheet(s) shall be the arithmetic mean of the five (ten) values (two values in each
direction).
For initial type tests, to determine product class where production variance is unknown, an
estimate of the mean MOR at the 95 % confidence level shall be determined. This shall be done by
taking one square sample or two rectangular samples from a minimum of ten individual sheets,
and carrying out the following procedure:
a) For each sheet calculate MORi as the average of MOR along and MOR across for the ith
sheet;
b) Calculate the mean, Ri, and the standard deviation, s, of the combined average MORi
values;
c) Calculate the mean, Rcl, of the MORi values at the 95 % confidence level using Equation
(D.2):
d) Determine the product class by comparing the Rcl value with the category and minimum
class requirement in Table 7 (Rcl W Table 7 value).
21
TEST RESULTS :RECORDED BENDING STRENGTH FLAT SHEETS /
Modulus of rupture (bending strength) of Crystallite Flat Sheets
Breaking Load LS B E MOR
Sample 1A 447.1N 200.0mm 250.0mm 4.9mm 22.62
Sample 1B 298.8N 200.0mm 250.0mm 4.6mm 16.87
Sample 2A 349.7N 200.0mm 250.0mm 5.3mm 14.94
Sample 2B 654.0N 200.0mm 250.0mm 5.0mm 31.90
Sample 3A 224.4N 200.0mm 250.0mm 4.1mm 15.94
Sample 3B 350.6N 200.0mm 250.0mm 3.7mm 30.40
Sample 4A 229.2N 200.0mm 250.0mm 4.3mm 14.88
Sample 4B 428.0N 200.0mm 250.0mm 4.3mm 27.78
Sample 5A 236.7N 200.0mm 250.0mm 4.6mm 13.54
Sample 5B 407.9N 200.0mm 250.0mm 4.8mm 21.25
Sample 6A 197.8N 200.0mm 250.0mm 4.0mm 14.69
Sample 6B 352.9N 200.0mm 250.0mm 4.4mm 21.48
Sample 7A 240.2N 200.0mm 250.0mm 4.7mm 13.11
Sample 7B 376.9N 200.0mm 250.0mm 4.8mm 19.47
Sample 8A 217.6N 200.0mm 250.0mm 4.5mm 13.07
Sample 8B 437.1N 200.0mm 250.0mm 4.6mm 24.90
Final results of Breaking load
Strong side Average 431.8125 200 250 4.5625mm 24.975
Weak side Average 249.3 200 250 4.5125 14.63
22
Modulus of rupture (bending strength) of Cement Fiber Flat Sheets
Breaking Load LS B E MOR
Sample 1A 117.5N 200.0mm 250.0mm 3.1mm 14.76
Sample 1B 75.8N 200.0mm 250.0mm 3.12 9.35
Sample 2A 121.1N 200.0mm 250.0mm 3.2mm 14.55
Sample 2B 71.0N 200.0mm 250.0mm 3.12 8.76
Sample 3A 122.3N 200.0mm 250.0mm 3.2mm 14.70
Sample 3B 76.8N 200.0mm 250.0mm 3.12 9.47
Sample 4A 122.2N 200.0mm 250.0mm 3.2mm 14.50
Sample 4B 74.2N 200.0mm 250.0mm 3.18 8.80
Sample 5A 120.3N 200.0mm 250.0mm 3.12 14.83
Sample 5B 70.7N 200.0mm 250.0mm 3.29 7.87
Sample 6A 119.6N 200.0mm 250.0mm 3.19 14.10
Sample 6B 70.7N 200.0mm 250.0mm 3.13 8.66
Sample 7A 119.7N 200.0mm 250.0mm 3.04 15.54
Sample 7B 75.6N 200.0mm 250.0mm 3.08 9.57
Sample 8A 122.6N 200.0mm 250.0mm 3.19 14.46
Sample 8B 72.6N 200.0mm 250.0mm 3.18 8.62
Final results of Breaking load
Strong side Average 120.7N 200.0mm 250.0mm 3.1mm 14.68
Weak side Average 73.4N 200.0mm 250.0mm 3.2mm 8.89
23
TEST RESULTS: RECORDED BENDING STRENGTH CORRUGATED SHEET THREE PITCHES SAMPLE
Modulus of rupture (bending strength) of Crystallite Corrugated Sheets
Breaking Load LS B E MOR
Sample 1 508N 290mm 400mm 4.9mm 22.62
Sample 2 396N 290mm 400mm 4.6mm 16.87
Sample 3 424N 290mm 400mm 5.3mm 14.94
Sample 4 424N 290mm 400mm 5.0mm 31.90
Sample 5 368N 290mm 400mm 4.1mm 15.94
Sample 6 536N 290mm 400mm 3.7mm 30.40
Sample 7 536N 290mm 400mm 4.3mm 14.88
Sample 8 564N 290mm 400mm 4.3mm 27.78
Sample 9 620N 290mm 400mm 4.6mm 13.54
Sample 10 620N 290mm 400mm 4.8mm 21.25
24
Testing for determination of the apparent density General
This annex gives the test method for determination of the apparent density (see 3.4) of fibre-cement
sheets. This is the average density of the material and its pores.
Principle
The volume of a saturated specimen is determined by immersion in water. The specimen’s oven dry
weight is then measured. The apparent density is determined by calculation from the measured
values.
Apparatus
Oven, ventilated, capable of achieving a temperature of (100 5) °C with a full load of specimens.
Balance, accurate to within 0,1 % of the specimen mass, equipped to determine both the immersed
mass and the non-immersed mass of the specimen.
Test procedure
a) Immerse specimen in water. Specimens having a thickness u 20 mm shall be immersed for at least
24 h.
b) Specimens having a thickness 20 mm shall be immersed for at least 48 h.
c) Take saturated specimen, remove excess water from surfaces and then determine the volume of the water displaced, V, by the saturated specimen when placed into a water bath. Record this
value.
d) Remove specimen from water bath and place it into a ventilated oven which is maintained at a
temperature of (100 5) °C until constant mass, m, is reached. (i.e. mass gain in any 24 h period does not exceed 0,1 % of specimen weight). Record this value.
Calculation of apparent density
The apparent density, d, in grams per cubic centimeter, is given by Equation (E.1):
m
d (E.1)
V
where m is the mass of the specimen
after drying;
V is the volume of the specimen, in cubic centimeters.
25
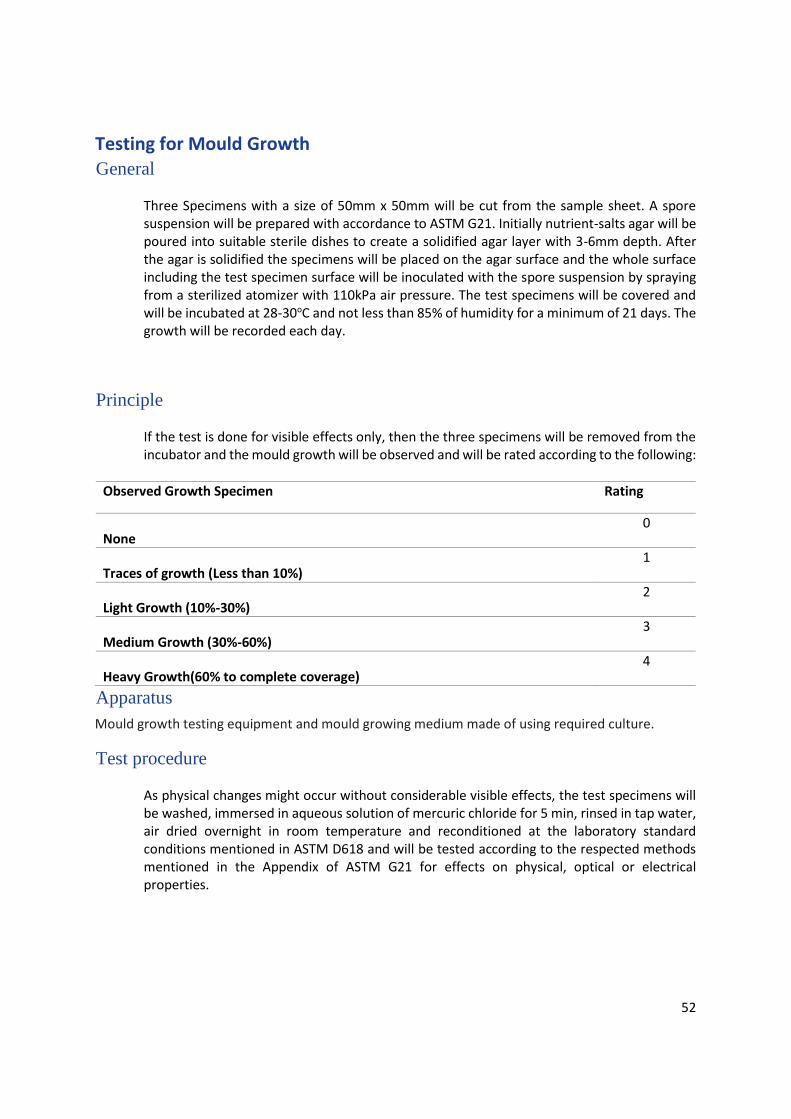
Testing for Mould Growth General
Three Specimens with a size of 50mm x 50mm will be cut from the sample sheet. A spore suspension will be prepared with accordance to ASTM G21. Initially nutrient-salts agar will be poured into suitable sterile dishes to create a solidified agar layer with 3-6mm depth. After the agar is solidified the specimens will be placed on the agar surface and the whole surface including the test specimen surface will be inoculated with the spore suspension by spraying from a sterilized atomizer with 110kPa air pressure. The test specimens will be covered and will be incubated at 28-30oC and not less than 85% of humidity for a minimum of 21 days. The growth will be recorded each day.
Principle
If the test is done for visible effects only, then the three specimens will be removed from the incubator and the mould growth will be observed and will be rated according to the following:
Observed Growth Specimen Rating
None 0
Traces of growth (Less than 10%) 1
Light Growth (10%-30%) 2
Medium Growth (30%-60%) 3
Heavy Growth(60% to complete coverage) 4
Apparatus
Mould growth testing equipment and mould growing medium made of using required culture.
Test procedure
As physical changes might occur without considerable visible effects, the test specimens will be washed, immersed in aqueous solution of mercuric chloride for 5 min, rinsed in tap water, air dried overnight in room temperature and reconditioned at the laboratory standard conditions mentioned in ASTM D618 and will be tested according to the respected methods mentioned in the Appendix of ASTM G21 for effects on physical, optical or electrical properties.
26
TEST RESULTS APPARENT DENSITY
Crystallite sheets
Asbestos Mould Growth Rate
Required standard Test Summery
Sample 1 5% 10% Pass Traces of growth (Less than 10%)
Sample 2 3% 10% Pass Traces of growth (Less than 10%)
Sample 3 2% 10% Pass Traces of growth (Less than 10%)
Average Pass Traces of growth (Less than 10%)
Cement fibre sheet material
Fiber Cement Mould Growth Rate
Required standard Test Summery
Sample 1 45% 10% Fail Medium Growth (30%-60%)
Sample 2 68% 10% Fail Medium Growth (30%-60%)
Sample 3 80% 10%
Fail Heavy Growth(60% to complete
coverage)
Average Fail Medium Growth (30%-60%)
TESTING MOULD GROWTH
27
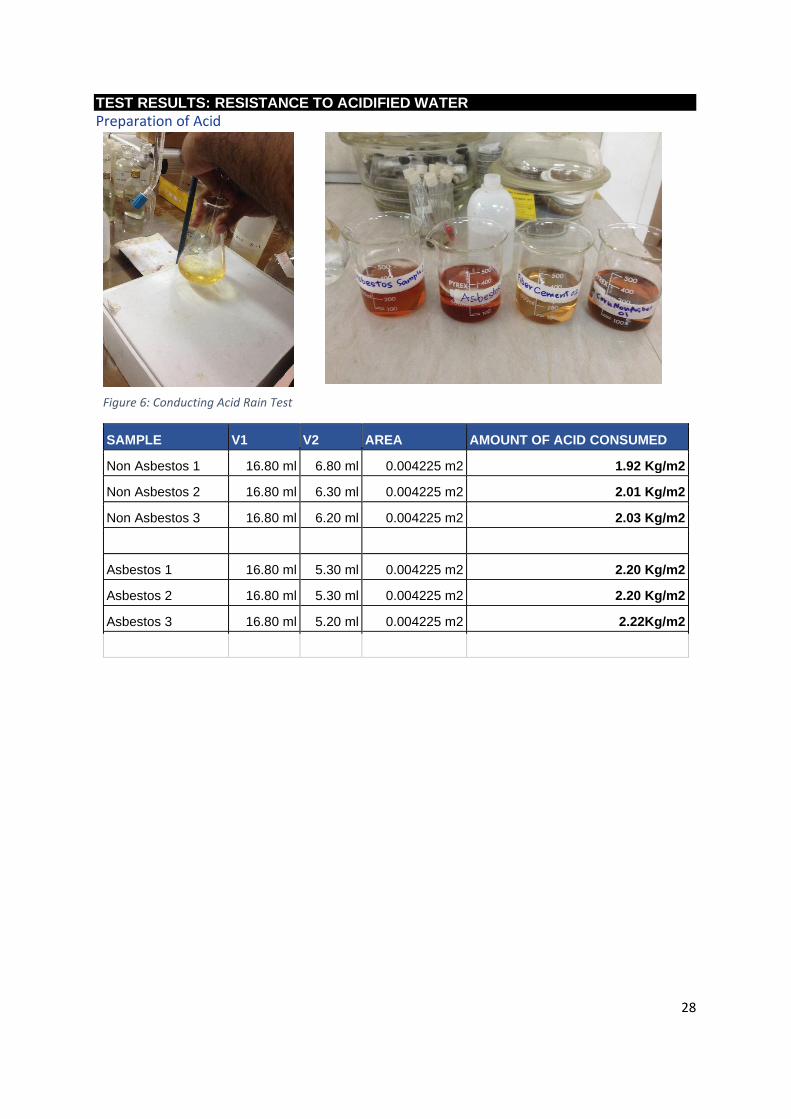
Testing for Resistance to Acidified Water (Flat and Corrugated Sheets) The following reagents will be used for this test.
i. Acetic acid 5% (m/m) solution
ii. Sodium Hydroxide; 0.5M standard volumetric solution
iii. Thymol blue solution (dissolve 0.04g of thymol blue in 100 ml of 95 % (v/v)
ethanol)
Initially two specimens with the dimensions of 65mm x 65mm will be cut from each of the sheets
from the sample. To determine the concentration of the acetic acid solution, 10 drops of thymol
blue solution will be added to 10ml solution of the acetic acid solution and will be diluted to 100ml
while stirring. The solution will be titrated with the sodium hydroxide solution until the colour
changes from yellow to blue which corresponds to a modification of the pH 8.0-9.5. The volume
of the sodium hydroxide solution used for the titration will be recorded in ml (V1).
After determining the concentration of the acetic acid, the test specimen will be fully submerged
in 270 ml of 5% acetic acid solution at a temperature of 27oC ± 3 for 24 hours. Separate vessels
and solution will be used to test each specimen. After 24 hours, the specimen will be removed and
10 drops of thymol blue solution will be added to 10ml of the solution and will be diluted to 100
ml. Again the solution will be titrated with sodium hydroxide and the volume required will be
recorded in ml (V2). The amount of acetic acid used per m2 of area of the specimen will be
calculated from the following formula:
Amount of acid used in kg/m2 = 𝟎.𝟎𝟑𝟎 𝑿 𝟐𝟕𝟎 (𝑽𝟏−𝑽𝟐)
𝟏𝟎𝟒𝑿 𝑨𝒓𝒆𝒂 (𝒎𝟐)
28
TEST RESULTS: RESISTANCE TO ACIDIFIED WATER
Preparation of Acid
Figure 6: Conducting Acid Rain Test
SAMPLE V1 V2 AREA AMOUNT OF ACID CONSUMED
Non Asbestos 1 16.80 ml 6.80 ml 0.004225 m2 1.92 Kg/m2
Non Asbestos 2 16.80 ml 6.30 ml 0.004225 m2 2.01 Kg/m2
Non Asbestos 3 16.80 ml 6.20 ml 0.004225 m2 2.03 Kg/m2
Asbestos 1 16.80 ml 5.30 ml 0.004225 m2 2.20 Kg/m2
Asbestos 2 16.80 ml 5.30 ml 0.004225 m2 2.20 Kg/m2
Asbestos 3 16.80 ml 5.20 ml 0.004225 m2 2.22Kg/m2
29
ISO 8336:2009 International Standards
Lists of tests need to be done 1) Dimensional conformity
a) Textured fibre Cement sheet
i) Length and width
ii) Thickness
iii) Straightness of edges
b) Asbestos Flat Sheets
i) Length and width
ii) Thickness
iii) Straightness of edges
2) Modulus of rupture (Bending strength)
a) Fibre Cement
b) Asbestos Flat Sheets
3) Moisture Movement
a) Fibre Cement
b) Asbestos Flat Sheets
4) Water permeability
a) Fibre Cement
b) Asbestos Flat Sheets
5) Freeze-thaw performance
a) Fibre Cement
b) Asbestos Flat Sheets
6) Heat-rain performance
a) Fibre Cement
b) Asbestos Flat Sheets
7) Warm water performance
a) Fibre Cement
b) Asbestos Flat Sheets
8) Soak-dry performance
a) Fibre Cement
b) Asbestos Flat Sheets
9) Resistance to mould
a) Fibre Cement
b) Asbestos Flat Sheets
10) Resistance to nail head pull-through
a) Fibre Cement
b) Asbestos Flat Sheets
30
Dimensional measurement and geometrical testing procedure General
This annex gives the details of the measuring apparatus and measuring procedure which are to be
used for the determination of compliance with the requirements of this International Standard.
Figure 7: Flat Sheets dimensions
Principle Sample sheets, selected from batches of sheets, are measured to determine their compliance with
the length, width and thickness requirements of this International Standard.
Apparatus The apparatus shall include the following items.
• Inspection surface, smooth, flat, rigid, of standard quality, having dimensions appropriate to the size of the sheets being measured.
• Two metal rules shall be fixed at right angles along adjacent edges of the inspection surface. The straightness of each metal rule shall be at least 0,3 mm/m and the right angle shall be accurate to at least 0,1 % (less than 1 mm deviation from normal per metre of length) or 0,001 rad.
• Alternatively, a portable square of at least 1 000 mm in each direction shall be used. The same requirements for straightness and angularity apply.
31
Rules, short, metal, capable of being read to an accuracy of 0,5 mm.
Measuring tape, metal, of sufficient length to measure the length of a sheet to an accuracy of 1 mm.
Dial gauge, reading to at least 0,1 mm, with flat parallel metal jaws between 10 mm and 15 mm in
diameter.
Measuring procedure
Measurement of length and width
General Avoid taking the measurement over a local deformation which could be considered as a visual defect.
Smooth any rough areas.
Take each dimensional reading to the nearest 1 mm.
Measure each dimension three times on each sheet, i.e. one in the middle and one at about 50 mm
from either end.
Measurement of Sheets
For large-sized sheets make three thickness measurements, with a dial gauge, along one side of the
sheet taking each reading to an accuracy of 0, 1 mm, as indicated in Figure 3. Report the individual
results and calculate the arithmetic mean and difference between extreme values.
For small-sized sheets, make two measurements with a dial gauge on each sheet, approximately 20
mm from the edge in the middle of two adjacent sides.
Report the individual results and calculate the arithmetic mean and difference between extreme
values.
Figure 8: Measurement of thickness on large-sized non-textured sheets
32
Figure 9: Measurement of thickness of large textured sheets
Measurement of edge straightness For large-sized sheets measure on all four edges the greatest distance between the edge of the sheet
and a string or wire stretched from one corner to the adjacent corner with a steel rule.
Record the measured value.
TEST RESULTS: RECORD THE MEASURED VALUE
Figure 10: Preparing full sheets for taking dimensions.
MEASUREMENT OF LENGTH AND WIDTH OF ASBESTOS FLAT SHEETS
Dimensions 1.0 Minimum Length/Width 122cm 2.0 Maximum Length/Width 122cm 3.0 Average Length/Width 122cm
MEASUREMENT OF LENGTH AND WIDTH OF CEMENT FIBER FLAT SHEETS
Dimensions 1.0 Minimum Length/Width 122cm 2.0 Maximum Length/Width 122cm 3.0 Average Length/Width 122cm
MEASUREMENT OF THICKNESS OF ASBESTOS FLAT SHEETS
Thickness 1.0 Minimum Thickness 4.6mm 2.0 Maximum Thickness 5.6mm 3.0 Average Thickness 5.0mm
MEASUREMENT OF THICKNESS OF CEMENT FIBER FLAT SHEETS
Thickness
1.0 Minimum Thickness 2.9 mm
2.0 Maximum Thickness 3.96 mm
3.0 Average Thickness 3.14mm
33
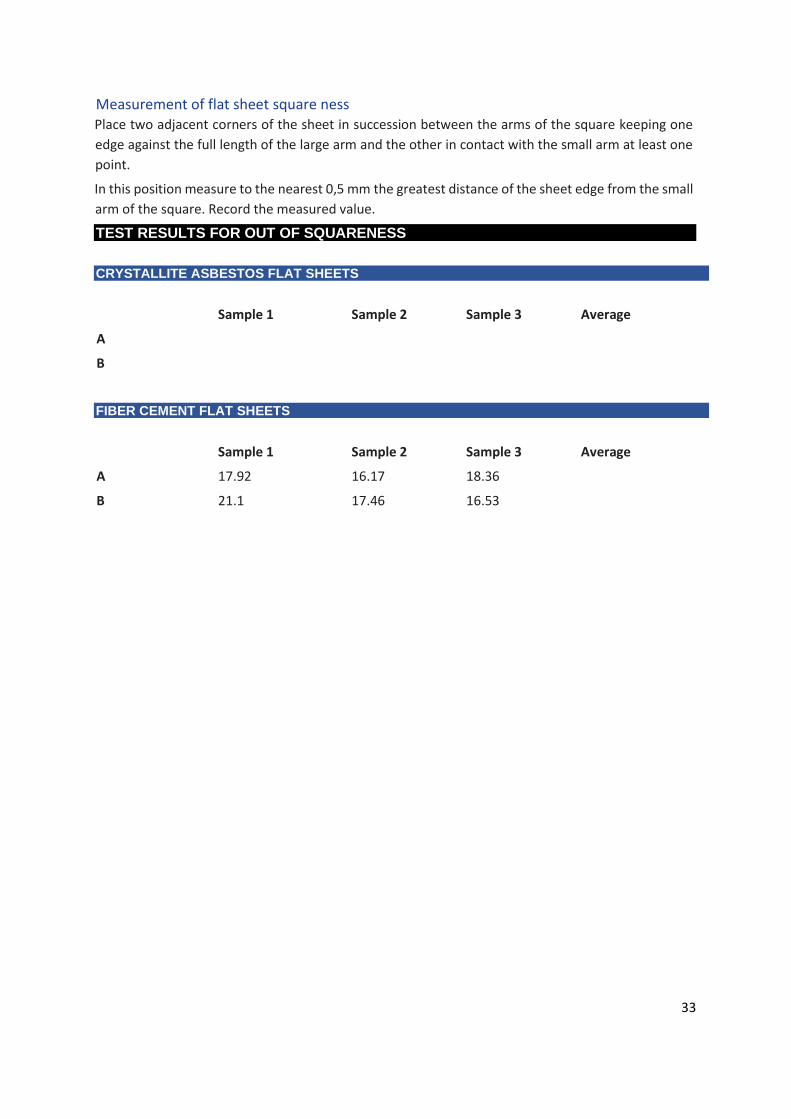
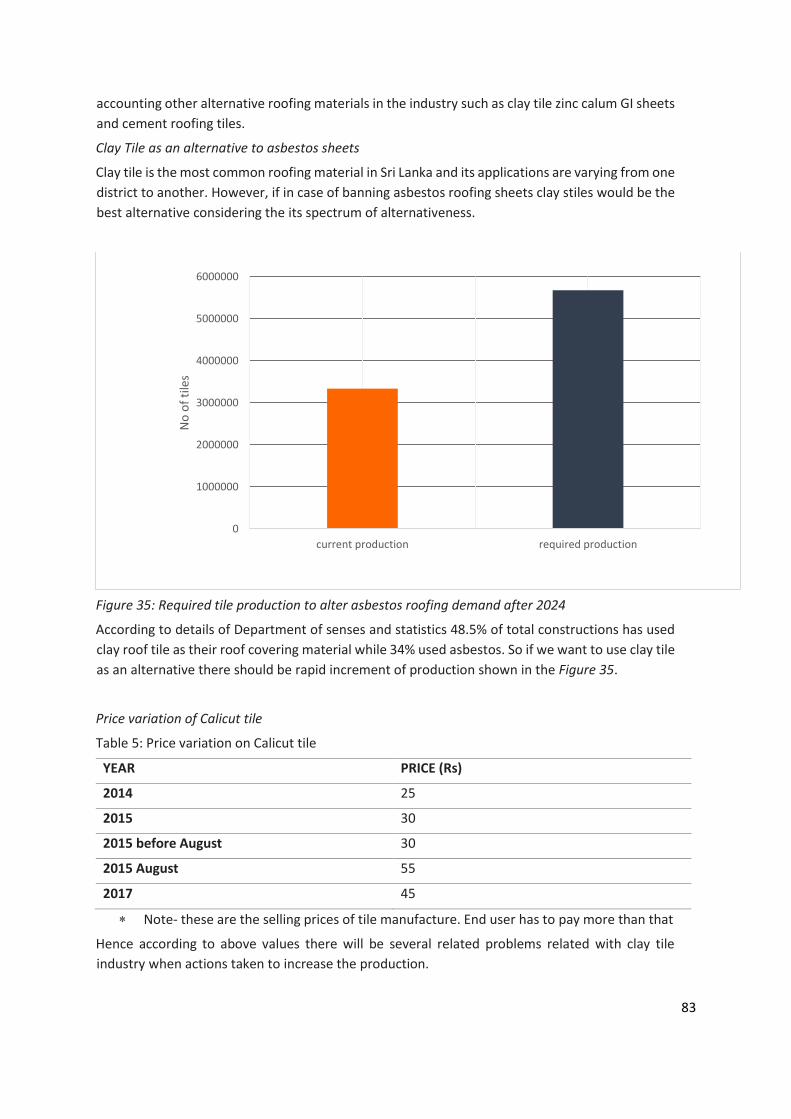
Measurement of flat sheet square ness Place two adjacent corners of the sheet in succession between the arms of the square keeping one
edge against the full length of the large arm and the other in contact with the small arm at least one
point.
In this position measure to the nearest 0,5 mm the greatest distance of the sheet edge from the small
arm of the square. Record the measured value.
TEST RESULTS FOR OUT OF SQUARENESS
CRYSTALLITE ASBESTOS FLAT SHEETS
Sample 1 Sample 2 Sample 3 Average
A
B
FIBER CEMENT FLAT SHEETS
Sample 1 Sample 2 Sample 3 Average
A 17.92 16.17 18.36
B 21.1 17.46 16.53
34
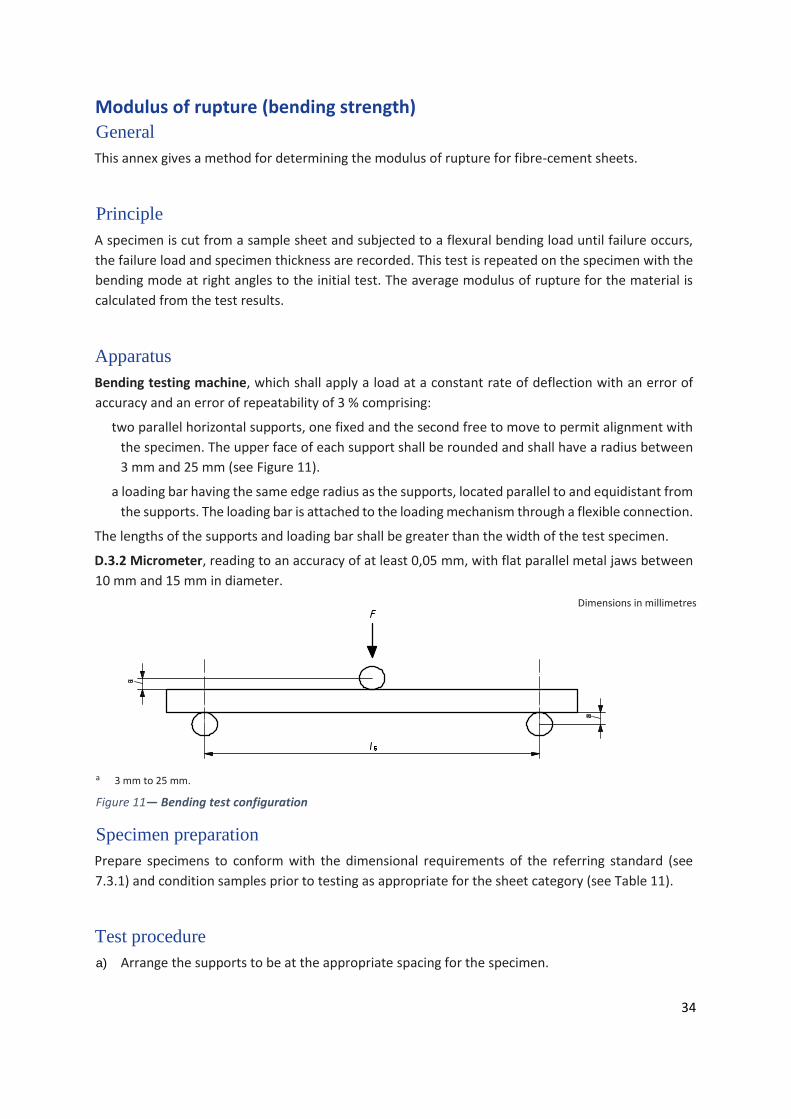
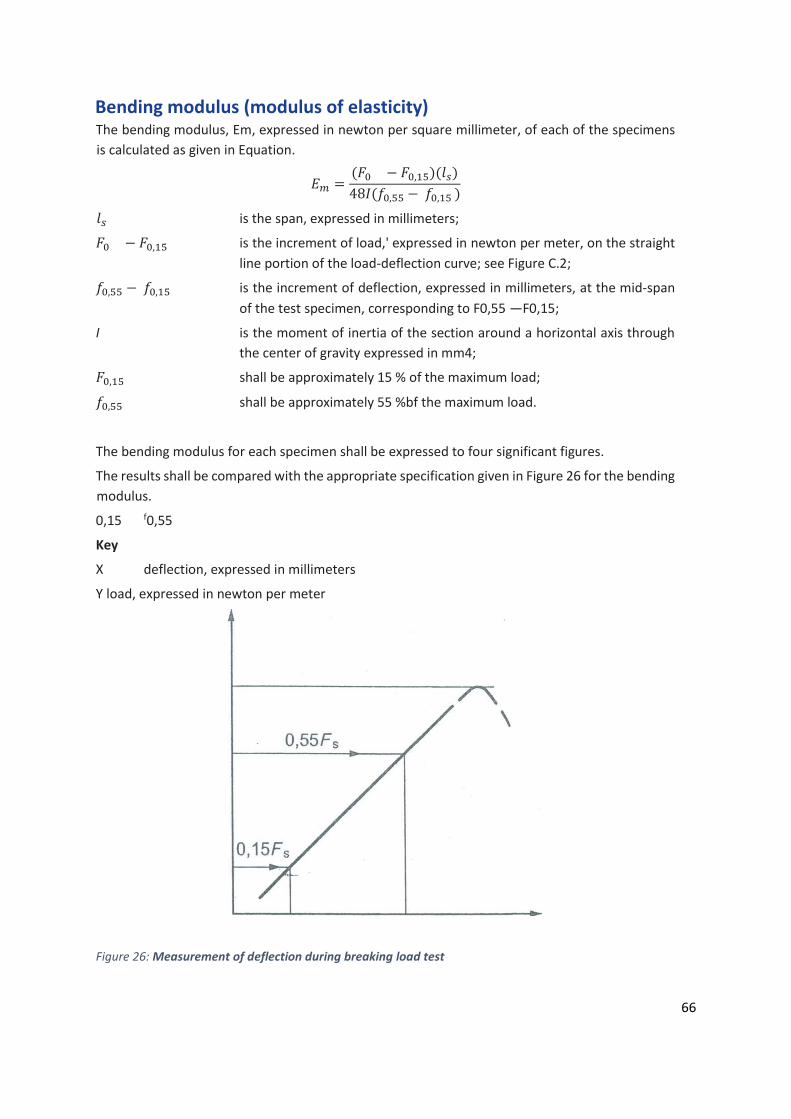
Modulus of rupture (bending strength) General
This annex gives a method for determining the modulus of rupture for fibre-cement sheets.
Principle
A specimen is cut from a sample sheet and subjected to a flexural bending load until failure occurs,
the failure load and specimen thickness are recorded. This test is repeated on the specimen with the
bending mode at right angles to the initial test. The average modulus of rupture for the material is
calculated from the test results.
Apparatus
Bending testing machine, which shall apply a load at a constant rate of deflection with an error of
accuracy and an error of repeatability of 3 % comprising:
two parallel horizontal supports, one fixed and the second free to move to permit alignment with
the specimen. The upper face of each support shall be rounded and shall have a radius between
3 mm and 25 mm (see Figure 11).
a loading bar having the same edge radius as the supports, located parallel to and equidistant from
the supports. The loading bar is attached to the loading mechanism through a flexible connection.
The lengths of the supports and loading bar shall be greater than the width of the test specimen.
D.3.2 Micrometer, reading to an accuracy of at least 0,05 mm, with flat parallel metal jaws between
10 mm and 15 mm in diameter.
Dimensions in millimetres
Figure 11— Bending test configuration
Specimen preparation
Prepare specimens to conform with the dimensional requirements of the referring standard (see
7.3.1) and condition samples prior to testing as appropriate for the sheet category (see Table 11).
Test procedure
a) Arrange the supports to be at the appropriate spacing for the specimen.
a 3 mm to 25 mm.
35
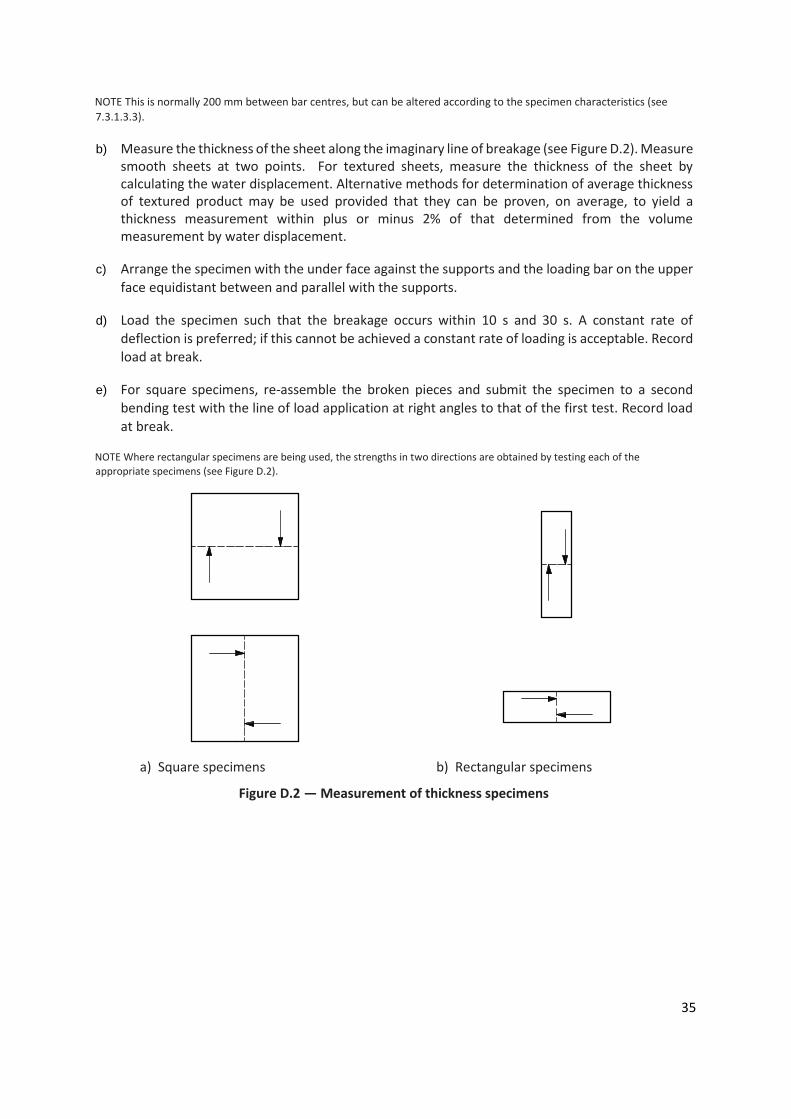
NOTE This is normally 200 mm between bar centres, but can be altered according to the specimen characteristics (see
7.3.1.3.3).
b) Measure the thickness of the sheet along the imaginary line of breakage (see Figure D.2). Measure smooth sheets at two points. For textured sheets, measure the thickness of the sheet by calculating the water displacement. Alternative methods for determination of average thickness of textured product may be used provided that they can be proven, on average, to yield a thickness measurement within plus or minus 2% of that determined from the volume measurement by water displacement.
c) Arrange the specimen with the under face against the supports and the loading bar on the upper
face equidistant between and parallel with the supports.
d) Load the specimen such that the breakage occurs within 10 s and 30 s. A constant rate of deflection is preferred; if this cannot be achieved a constant rate of loading is acceptable. Record load at break.
e) For square specimens, re-assemble the broken pieces and submit the specimen to a second
bending test with the line of load application at right angles to that of the first test. Record load
at break.
NOTE Where rectangular specimens are being used, the strengths in two directions are obtained by testing each of the
appropriate specimens (see Figure D.2).
a) Square specimens b) Rectangular specimens
Figure D.2 — Measurement of thickness specimens
36
Calculation of modulus of rupture value
The MOR, in mega pascals, for each breaking load direction is given by Equation (D.1):
MOR = 3Fls (D.1)
MOR
2be2
where
F is the breaking load, in newtons;
ls is the span between the centre-lines of the supports, in millimetres;
b is the width of the test piece, in millimetres;
e is the thickness, in millimetres.
for non-textured sheets, it is the arithmetic mean of two measurements for each breaking load
direction, for face textured sheets, it is calculated from the volume measured by water
displacement. The MOR of the sheet(s) shall be the arithmetic mean of the five (ten) values (two
values in each direction).
For initial type tests, to determine product class where production variance is unknown, an estimate
of the mean MOR at the 95 % confidence level shall be determined. This shall be done by taking one
square sample or two rectangular samples from a minimum of ten individual sheets, and carrying out
the following procedure:
e) For each sheet calculate MORi as the average of MOR along and MOR across for the ith sheet;
f) Calculate the mean, Ri, and the standard deviation, s, of the combined average MORi values;
g) Calculate the mean, Rcl, of the MORi values at the 95 % confidence level using Equation (D.2):
Rcl Ri 0,58s (D.2)
(See ISO 2602.)
h) Determine the product class by comparing the Rcl value with the category and minimum class
requirement in Table 7 (Rcl W Table 7 value).
37
TEST RESULTS: RECORDED BENDING STRENGTH OF FIBER CEMENT FLAT SHEETS
Figure 12: Recording Bending strength of flat sheets
MODULUS OF RUPTURE (BENDING STRENGTH) OF CHRYSTALITE FLAT SHEETS
Breaking Load LS B E MOR
Sample 1A 447.1N 200.0mm 250.0mm 4.9mm 22.62
Sample 1B 298.8N 200.0mm 250.0mm 4.6mm 16.87
Sample 2A 349.7N 200.0mm 250.0mm 5.3mm 14.94
Sample 2B 654.0N 200.0mm 250.0mm 5.0mm 31.90
Sample 3A 224.4N 200.0mm 250.0mm 4.1mm 15.94
Sample 3B 350.6N 200.0mm 250.0mm 3.7mm 30.40
Sample 4A 229.2N 200.0mm 250.0mm 4.3mm 14.88
Sample 4B 428.0N 200.0mm 250.0mm 4.3mm 27.78
Sample 5A 236.7N 200.0mm 250.0mm 4.6mm 13.54
Sample 5B 407.9N 200.0mm 250.0mm 4.8mm 21.25
Sample 6A 197.8N 200.0mm 250.0mm 4.0mm 14.69
Sample 6B 352.9N 200.0mm 250.0mm 4.4mm 21.48
Sample 7A 240.2N 200.0mm 250.0mm 4.7mm 13.11
Sample 7B 376.9N 200.0mm 250.0mm 4.8mm 19.47
Sample 8A 217.6N 200.0mm 250.0mm 4.5mm 13.07
Sample 8B 437.1N 200.0mm 250.0mm 4.6mm 24.90
FINAL RESULTS OF BREAKING LOAD
Strong side Average 431.8125 200 250 4.5625mm 24.975
Weak side Average 249.3 200 250 4.5125 14.63
38
39
TEST RESULTS: RECORDED BENDING STRENGTH OF CHRYSTALITE FLAT SHEETS
Figure 13: Recording Bending strength of flat sheets
MODULUS OF RUPTURE (BENDING STRENGTH) OF CEMENT FIBER FLAT SHEETS Breaking Load LS B E MOR
Sample 1A 117.5N 200.0mm 250.0mm 3.1mm 14.76
Sample 1B 75.8N 200.0mm 250.0mm 3.12 9.35
Sample 2A 121.1N 200.0mm 250.0mm 3.2mm 14.55
Sample 2B 71.0N 200.0mm 250.0mm 3.12 8.76
Sample 3A 122.3N 200.0mm 250.0mm 3.2mm 14.70
Sample 3B 76.8N 200.0mm 250.0mm 3.12 9.47
Sample 4A 122.2N 200.0mm 250.0mm 3.2mm 14.50
Sample 4B 74.2N 200.0mm 250.0mm 3.18 8.80
Sample 5A 120.3N 200.0mm 250.0mm 3.12 14.83
Sample 5B 70.7N 200.0mm 250.0mm 3.29 7.87
Sample 6A 119.6N 200.0mm 250.0mm 3.19 14.10
Sample 6B 70.7N 200.0mm 250.0mm 3.13 8.66
Sample 7A 119.7N 200.0mm 250.0mm 3.04 15.54
Sample 7B 75.6N 200.0mm 250.0mm 3.08 9.57
Sample 8A 122.6N 200.0mm 250.0mm 3.19 14.46
Sample 8B 72.6N 200.0mm 250.0mm 3.18 8.62
FINAL RESULTS OF BREAKING LOAD
Strong side Average 120.7N 200.0mm 250.0mm 3.1mm 14.68
Weak side Average 73.4N 200.0mm 250.0mm 3.2mm 8.89
40
Density of fiber-cement sheets General
This annex gives the test method for determination of the apparent density (see 3.4) of fibre-cement
sheets. This is the average density of the material and its pores.
Principle
The volume of a saturated specimen is determined by immersion in water. The specimen’s oven dry
weight is then measured. The apparent density is determined by calculation from the measured
values.
Apparatus
Oven, ventilated, capable of achieving a temperature of (100 5) °C with a full load of specimens.
Balance, accurate to within 0,1 % of the specimen mass, equipped to determine both the immersed
mass and the non-immersed mass of the specimen.
Test procedure
e) Immerse specimen in water. Specimens having a thickness u 20 mm shall be immersed for at least
24 h.
f) Specimens having a thickness 20 mm shall be immersed for at least 48 h.
g) Take saturated specimen, remove excess water from surfaces and then determine the volume of the water displaced, V, by the saturated specimen when placed into a water bath. Record this
value.
h) Remove specimen from water bath and place it into a ventilated oven which is maintained at a
temperature of (100 5) °C until constant mass, m, is reached. (i.e. mass gain in any 24 h period does not exceed 0,1 % of specimen weight). Record this value.
Calculation of apparent density
The apparent density, d, in grams per cubic centimeter, is given by Equation (E.1):
m
d (E.1)
V
where m is the mass of the specimen
after drying;
V is the volume of the specimen, in cubic centimetres.
41
TEST RESULTS – DENSITY
Figure 14: Recording density of flat sheets
DENSITY CHRYSTALITE FLAT SHEETS Asbestos Water Displacement Dry Weight Density
Sample 1 0.0002698m3 0.4480Kg 1660.61 Kg/m3
Sample 2 0.0002580m3 0.4142Kg 1605.26 Kg/m3
Sample 3 0.0002673m3 0.4354Kg 1628.95 Kg/m3
Sample 4 0.0002807m3 0.4655Kg 1658.33 Kg/m3
Sample 5 0.0002529m3 0.4140Kg 1636.84 Kg/m3
Sample 6 0.0002991m3 0.4705Kg 1573.26 Kg/m3
Sample 7 0.0002703m3 0.4317Kg 1597.37 Kg/m3
Sample 8 0.0003676m3 0.6159Kg 1675.68 Kg/m3
Sample 9 0.0003609m3 0.5746Kg 1592.31 Kg/m3
Sample 10 0.0003251m3 0.5381Kg 1655.26 Kg/m3
Average 1628.39 Kg/m3
DENSITY FIBER CEMENT FLAT SHEETS Fiber cement Water Displacement Dry Weight Density
Sample 1 0.0002320m3 0.2772Kg 1194.97 Kg/m3
Sample 2 0.0002530m3 0.2747Kg 1085.69 Kg/m3
Sample 3 0.0002408m3 0.2776Kg 1152.78 Kg/m3
Sample 4 0.0002031m3 0.2732Kg 1345.15 Kg/m3
Sample 5 0.0002387m3 0.2741Kg 1148.25 Kg/m3
Sample 6 0.0001926m3 0.2774Kg 1439.96 Kg/m3
Sample 7 0.0002068m3 0.2836Kg 1371.27 Kg/m3
Sample 8 0.0001824m3 0.2828Kg 1550.52 Kg/m3
Sample 9 0.0001969m3 0.2843Kg 1444.22 Kg/m3
Sample 10 0.0001654m3 0.2729Kg 1649.46 Kg/m3
Average 1338.23 Kg/m3
42
Moisture movement characteristic of fibre-cement sheets General
This annex gives the details of the apparatus and test procedure required to determine the
moisture movement characteristic of fibre-cement sheets.
Principle
The lengths of sheet specimens, conditioned in air at the prescribed temperature and relative
humidity, are measured when a steady weight condition is achieved. The specimens are then
exposed to a higher relative humidity until a second steady weight condition is reached. The
change in length which occurs is measured.
Apparatus
Conditioning chamber, ventilated, capable of maintaining a temperature of (23, +2)°C at relative
humidifies of either (30 +2) % or (90, +5) % with a full load of specimens. F.3.2 Balance, accurate
to within 0,1 % of the specimen mass.
Measuring device, metal, of sufficient length to measure the length of the specimen to an accuracy
of 0,02 mm.
Specimen preparation
Prepare specimens to conform with the dimensional requirements of the referring standard (see
7.3.3.3) and condition samples prior to testing
Test procedure
a) Remove specimens from conditioning chamber and measure their lengths and weights and record values.
b) Replace specimens in conditioning chamber, increase humidity to (90, +5) % maintaining temperature at (23, + 2) °C.
c) When specimens have reached a steady state condition (i.e. weight gain or loss in any 24 h period
does not exceed 0,1 % of specimen mass) reweigh specimens and measure their lengths. Record
values.
Calculation of results
The linear, Lm, expressed as a percentage, due to a change in the moisture is calculated from
Equation (F.1):
% (𝐿90 𝐿30 ) 100
𝐿30
where
L90 is the measured specimen length at 90 % relative humidity; L30 is the measured specimen
length at 30 % relative humidity.
43
Water permeability of fibre-cement sheets General
This annex gives details of the test procedure and apparatus required to determine that sheets of
fibre cement comply with the water permeability requirements of this International Standard (see
5.6.5).
Principle
A specified depth of water is applied to the upper face of a horizontally positioned sheet specimen for
a prescribed period of time. Visual examination of the test specimen determines compliance with
standard requirements.
Apparatus
G.3.1 Frame, sealed on top of the sheet specimen.
For small-sized sheets, the frame shall be 50 mm less than the length and width of the sheet. For
large-sized sheets, the frame dimensions shall be 600 mm 500 mm. A narrow frame of the same
length shall be used for narrow sheets.
Test procedure
a) Place and seal the frame to the top face of the sheet and position so that sheet face is horizontal.
b) Fill the frame with water to a height of 20 mm above the sheet face.
c) Place the specimen in ambient laboratory conditions so that the underside of the sheet can be viewed without moving the specimen during the test.
d) After 24 h examine the under face for the presence of water drops. Report the visual condition of the specimen.
Figure 15: Checking water permeability
TEST RESULTS – WATER PERMEABILITY TEST
44
• No water droplets were examined after 24 hours
Soak-dry evaluation test of fibre-cement sheets General
This annex gives the details of the apparatus and test procedure required to perform the soak-dry
evaluation test for fibre-cement sheets.
Principle
Paired fibre-cement sheet specimens are taken from sample sheets. One of each specimen pair is
subjected to a number of test cycles comprising a period of immersion in warm water and drying
in an oven. A comparison of the bending strengths of the specimens exposed to soak-dry test
cycling to the unexposed specimens is made.
Apparatus
Oven, ventilated, capable of maintaining a temperature of (60±3) °C at a relative humidity of less
than 20 % with a full load of specimens.
Water bath, with water at ambient temperature (5 °C).
The water in the water bath should be saturated with soluble salts derived from the fibre-cement
sheets. Test equipment, for determining the bending strength.
Test procedure
a) Divide the sheet specimen pairs (see 7.3.7.2) to form two sets of 10 specimens each. b) Condition one set of 10 specimens to the appropriate sheet category type test conditioning
requirements specified in Table 11. Following the conditioning period, determine the bending strengths of these specimens in accordance with the test method given in Annex D. Record the results.
c) Immerse the second set of 10 specimens in the water bath and commence the soak-dry test cycle.
d) A soak-dry test cycle shall consist of a. immersion in water at ambient temperature (5 °C) for 18 h,
b. drying in a ventilated oven at (60±3) °C and a relative humidity of less than 20 % for
6 h. The 20 % humidity shall be achieved for at least 3 h prior to the conclusion of the
drying period. c. If necessary, an interval of up to 72 h between cycles is allowed. During this interval,
specimens shall be stored in immersed conditions. e) Repeat step c) for the prescribed number of soak-dry cycles appropriate for the category of
sheet being tested. f) The value of the ratio, RL, of the lower estimate mean values of the modulus of ruptures for
the exposed and unexposed specimens, shall be determined for category A sheets after 50 soak-dry cycles and for categories B and C sheets after 25 soak-dry cycles.
g) When step d) has been completed, condition the immersed specimens to the appropriate sheet category type test conditioning requirements specified in Table 11, then determine the
bending strengths of these specimens in accordance with the test method given in Annex D. Record the results.
45
Calculation of results
For each pair of specimens i (i 1 to 10), calculate the individual ratio, MORi, as given in Equation
(K.1):
𝑀𝑂𝑅𝑖 =𝑀𝑂𝑅𝑓𝑖
𝑀𝑂𝑅𝑓𝑐𝑖 𝑥 100
where
• MORfi is the modulus of rupture of the ith specimen after the soak dry cycles;
• MORfci is the modulus of rupture of the ith reference specimen (from the first batch).
Calculate the average, R, and standard deviation, s, of the individual ratio, MORi.
Calculate the lower estimation, RL, of the mean of the ratios at 95 % confidence level (see ISO 2602)
as given in Equation (K.2):
RL R 0,58s
46
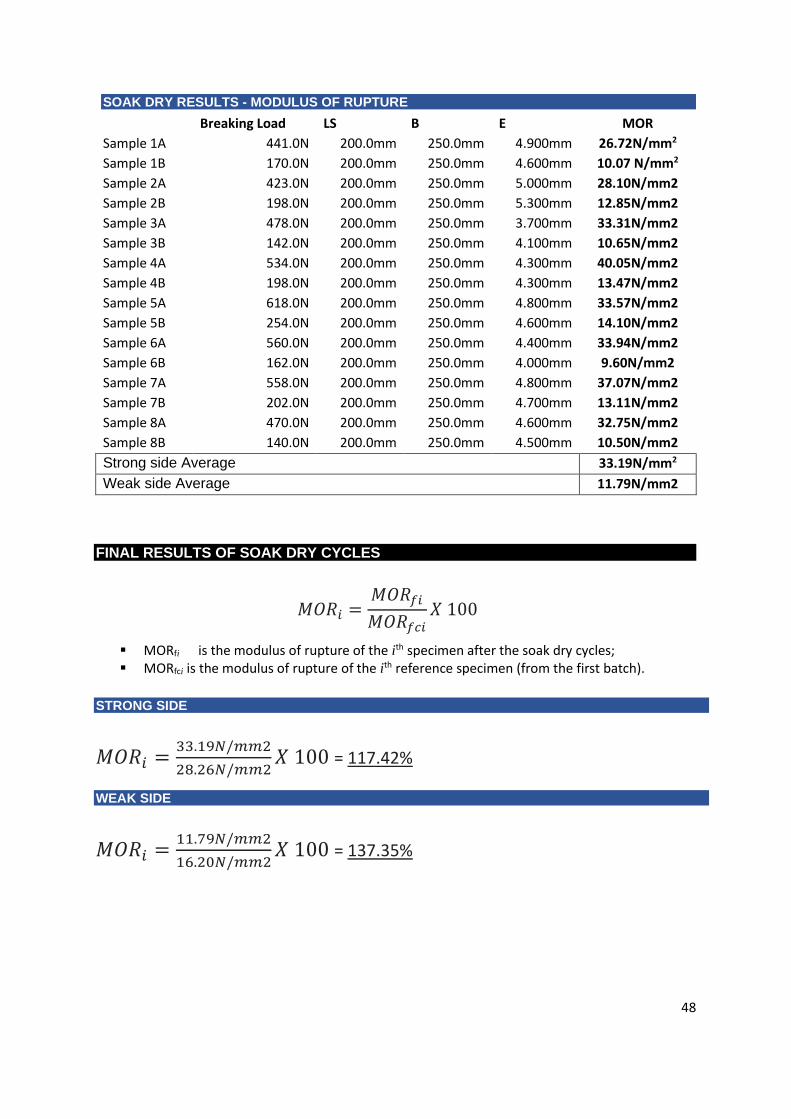
TEST RESULTS – SOAK DRY CYCLES
Figure 16: Recording Bending strength of flat sheets
MODULUS OF RUPTURE (BENDING STRENGTH) OF CHRYSTALITE ASBESTOS SHEETS (REF)
Breaking Load
LS B E MOR
Sample 1A 447.1 200 250 4.450mm 27.09N/mm2
Sample 1B 298.8 200 250 4.500mm 17.71N/mm2
Sample 2A 654 200 250 4.250mm 43.45N/mm2
Sample 2B 349.7 200 250 4.300mm 22.70N/mm2
Sample 3A 350.6 200 250 4.150mm 24.43N/mm2
Sample 3B 224.4 200 250 4.000mm 16.83N/mm2
Sample 4A 428 200 250 4.000mm 32.10N/mm2
Sample 4B 229.2 200 250 4.200mm 15.59N/mm2
Sample 5A 407.9 200 250 4.700mm 22.16N/mm2
Sample 5B 236.7 200 250 4.650mm 13.14N/mm2
Sample 6A 352.9 200 250 4.450mm 21.39N/mm2
Sample 6B 197.8 200 250 4.500mm 11.72N/mm2
Sample 7A 376.9 200 250 4.250mm 25.04N/mm2
Sample 7B 240.2 200 250 4.300mm 15.59N/mm2
Sample 8A 437.1 200 250 4.150mm 30.46N/mm2
Sample 8B 217.6 200 250 4.000mm 16.32N/mm2
Strong side Average 28.26N/mm2
Weak side Average 16.20N/mm2
47
48
SOAK DRY RESULTS - MODULUS OF RUPTURE Breaking Load LS B E MOR
▪ MORfi is the modulus of rupture of the ith specimen after the soak dry cycles; ▪ MORfci is the modulus of rupture of the ith reference specimen (from the first batch).
STRONG SIDE
𝑀𝑂𝑅𝑖 =33.19𝑁/𝑚𝑚2
28.26𝑁/𝑚𝑚2𝑋 100 = 117.42%
WEAK SIDE
𝑀𝑂𝑅𝑖 =11.79𝑁/𝑚𝑚2
16.20𝑁/𝑚𝑚2𝑋 100 = 137.35%
49
Test method for the evaluation of heat-rain performance of fibre-
cement sheets
General
This annex gives the details of the apparatus and test procedure required to evaluate the heat-rain
performance of fibre-cement sheets.
Principle
Sample sheets are fixed to a framing system to simulate a typical sheet installation system. One side
of the test assembly is subjected to a number of test cycles comprising a water spray and radiant
heating. A visual assessment of the sheet performance is made.
Apparatus
Framing system, to which sheets can be fixed in a vertical position.
Spacing of framing members and type of material used shall be specified by the manufacturer
(see Clause I.4).
Water spray system, capable of completely wetting the sheet faces, having a water flow rate of
approximately 1 l/m2/min.
Device, capable of heating and uniformly maintaining the surface of the test elements conforming to
the following:
a) The heating device shall be controlled via a black body sensor positioned in the central area of the test rig where the maximum temperature is expected.
b) The temperature at the sensor location shall be maintained at (60 3) °C and this temperature shall be reached within 15 min of the commencement of heating.
c) The difference between the black body temperature in the centre of the rig and the edges of the rig shall not exceed 15 °C.
Control system, capable of providing test cycles complying with Table I.1.
Framing and fixing requirements
Frame requirements
The frame construction shall include at least one joint in the central region and allow for standard size
sheet fixing.
The frame shall provide a minimum area of 3,5 m2 and a maximum area of 12 m2, shall allow vertical
orientation of the sheets and shall allow for the installation of at least two sheets.
Specimen requirements
Where the sheet specimen is greater than 1,8 m2, two sheets may be used.
50
Where the sheet specimen is not greater than 1,8 m2, there shall be sufficient sheets to cover an area
of at least 3,5 m2.
NOTE If the combined area of the specimens is 12 m2, the sheet length can be reduced to provide a test area of not more than 12
m2.
Test procedure
a) Assemble the test rig in accordance with the manufacturer’s recommendations.
b) Subject the assembled frame to the water spray and drying cycle given in Table I.1.
Table 1— Heat-rain cycle
Cycles Duration
Water spray
Pause
Radiant heat
Pause
2 h 50 min 5 min
5 min to 10 min
2 h 50 min 5 min
5 min to 10 min
Total cycle 5 h 55 min 15 min
c) Repeat step b) for the prescribed number of cycles appropriate to the category of sheet.
Assemblies made with category A sheets shall be tested for 50 heat-rain cycles. Assemblies made with category B sheets shall be tested for 25 heat-rain cycles.
d) Visually inspect the test assembly and record its condition.
51
TEST RESULTS – SOAK DRY CYCLES
Figure 17: Heat Rain test
MODULUS OF RUPTURE (BENDING STRENGTH) OF CHRYSTALITE ASBESTOS SHEETS (REF)
Three Specimens with a size of 50mm x 50mm will be cut from the sample sheet. A spore suspension will be prepared with accordance to ASTM G21. Initially nutrient-salts agar will be poured into suitable sterile dishes to create a solidified agar layer with 3-6mm depth. After the agar is solidified the specimens will be placed on the agar surface and the whole surface including the test specimen surface will be inoculated with the spore suspension by spraying from a sterilized atomizer with 110kPa air pressure. The test specimens will be covered and will be incubated at 28-30oC and not less than 85% of humidity for a minimum of 21 days. The growth will be recorded each day.
Principle
If the test is done for visible effects only, then the three specimens will be removed from the incubator and the mould growth will be observed and will be rated according to the following:
Observed Growth Specimen Rating
None 0
Traces of growth (Less than 10%) 1
Light Growth (10%-30%) 2
Medium Growth (30%-60%) 3
Heavy Growth(60% to complete coverage) 4
Apparatus
Mould growth testing equipment and mould growing medium made of using required culture.
Test procedure
As physical changes might occur without considerable visible effects, the test specimens will be washed, immersed in aqueous solution of mercuric chloride for 5 min, rinsed in tap water, air dried overnight in room temperature and reconditioned at the laboratory standard conditions mentioned in ASTM D618 and will be tested according to the respected methods mentioned in the Appendix of ASTM G21 for effects on physical, optical or electrical properties.
53
TEST RESULTS APPARENT DENSITY
Crystallite sheets
Asbestos Mould Growth Rate
Required standard Test Summery
Sample 1 5% 10% Pass Traces of growth (Less than 10%)
Sample 2 3% 10% Pass Traces of growth (Less than 10%)
Sample 3 2% 10% Pass Traces of growth (Less than 10%)
Average Pass Traces of growth (Less than 10%)
Cement fibre sheet material
Fiber Cement Mould Growth Rate
Required standard Test Summery
Sample 1 45% 10% Fail Medium Growth (30%-60%)
Sample 2 68% 10% Fail Medium Growth (30%-60%)
Sample 3 80% 10%
Fail Heavy Growth(60% to complete
coverage)
Average Fail Medium Growth (30%-60%)
TESTING MOULD GROWTH
54
Nail Head Pull through test A specimen with a size of 76mm x 152mm will be cut from the sample and a common wire nails
with 2.8mm diameter will be driven through the board at right angles. Test machine will be
assembled in a way as showed in figure 9 of the ASTM D1037.The top pair of angles of the
specimen holding will be replaced with a 152mm length of 152 by 57 mm American Standard
Channel. The web of the channel will have a 76mm diameter opening. The edge of this will support
the specimen during the test. The specimen holding fixture will be centered and attached to the
lower platen of the testing machine.
The specimen will be inserted in the fixture and with the point of the nail (2.8mm diameter) up.
The pointed end of the nail will be gripped with a tension grip which is attached to the upper platen
of the testing machine with a universal joint/toggle linkage, to provide automatic aligning. Loads
will be applied to the specimen throughout the test at a uniform rate of 1.5mm/min, by a
separation of the platens of the testing machine. The maximum load required to pull the nail
through the board will be recorded. (ASTM- Part 22 D1037: 1981)
TEST RESULTS – NAIL HEAD PULL THROUGH TEST
Figure 18: NAIL HEAD PULL THROUGH TEST
TEST RESULTS - NAIL HEAD PULL THROUGH TEST Asbestos Breaking Load (Kg) Breaking Load (N) Results
Lists of tests need to be done 1) Dimensional and geometrical testing procedures
a) Length and width
b) Measurement of the thickness of sheets
c) Measurement of out-of-squareness of sheets
d) Measurement of length and width for fittings
e) Measurement of thickness for fittings
2) Breaking load and the bending modulus of sheets
a) Fibre Cement
b) Asbestos Flat Sheets
3) Bending moment of a sheet
a) Fibre Cement
b) Asbestos Flat Sheets
4) Determine the apparent density
a) Fibre Cement
b) Asbestos Flat Sheets
5) Determine the water permeability of a sheet
a) Fibre Cement
b) Asbestos Flat Sheets
6) Freeze-thaw performance of sheets and fittings
a) Fibre Cement
b) Asbestos Flat Sheets
7) Soak-dry performance of long and short sheets
a) Fibre Cement
b) Asbestos Flat Sheets
56
Consignment and inspection sampling General
This annex gives details of a system for inspecting and sampling a, consignment of finished
products (see 6.4), that may, by agreement between the manufacturer and the purchaser, be
included in a tender or product order.
NOTE Compliance with 6.4 is not a requirement of this International Standard
Sampling
When specified, the acceptance sampling shall be made on lot(s) of the consignment in accordance
with the test programme of the relevant product standard, unless there is a special agreement.
Table 6, therefore, specifies which characteristics are tested.
Details related to the application of this sampling sub clause shall be agreed between the
manufacturer and purchaser.
After agreement on the sampling procedure, sampling shall be carried out in the presence of both
parties, from lot(s) that are being delivered to the purchaser. If the inspection lot(s) are not yet
formed, the manufacturer should present to the purchaser the stock(s) from which the inspection
lot(s) can be selected and marked. Unless otherwise agreed between manufacturer and purchaser,
the maximum and minimum inspection lots shall be as follows:
• sheets of length less than 1,5 m: minimum 400 sheets and maximum 8 000 sheets;
• sheets of length 1,5 m and greater : minimum 200 sheets and maximum 3 000 sheets;
• fittings: minimum 200 fittings and maximum 400 fittings.
Testing
The tests shall be made in the laboratory of the manufacturer or by an independent laboratory
selected by mutual agreement between the manufacturer and the purchaser. In case of dispute,
the tests shall be performed in the presence of both parties.
Non-destructive tests
When non-destructive tests are performed and the result of the sampling inspection does not
meet the acceptance requirements of this International Standard, the tests shall be required on
each item of the consignment. The units of the consignment that do not meet the requirements when
tested individually may be refused and disposed of, unless otherwise agreed between manufacturer
and purchaser.
57
Dimensional and geometrical testing procedures
General
The annex 'gives the details of the measuring apparatus and procedures that can be used for
carrying out dimensional and geometrical measurements and the determination of compliance
with the requirements of this International Standard.
Principle
Profiled sheets are measured to determine compliance with the requirements of this International
Standard for pitch, height of corrugation, length, width, thickness, out-of-squareness and height
of edges.
Fittings are measured to determine compliance with the requirements of this International
Standard for length, width and thickness.
• Measurement of pitch and height of corrugation for sheets
Apparatus
• Surface, smooth, flat, with dimensions appropriate to the dimensions of the sheets.
• Bars, cylindrical, steel, 200 mm long, with. Conical points fitted at the axis on one end and with a diameter large enough to touch the flanks of the corrugations of the sheet.
• Micrometre, with a hemispherical head accurate to 0, 1 mm Ruler metal, graduated, accurate to 0, 6 mm.
• Procedure for measuring the pitch, a Lay the sheets flat and square on the surface (see Figure ensuring that the valley of every corrugation is in contact with it.
Figure 19:Measurement of the length and width
At one end of the sheet, lay the cylindrical bars in each valley of the corrugations, with the conical
point extending slightly over the end of the sheet (see Figure 19).
Measure with the ruler, to the nearest 0,5 mm, the distance between consecutive conical points.
Any other method of measurement with the same accuracy may be used.
Each measurement of the pitch shall be compared to the specification given (Figure 19). .
58
Figure 20: Measurement of the height of corrugations and thickness
Measurement of length and width of sheets
Apparatus
• Surface, smooth, flat, with dimension appropriate to the dimensions of the sheets.
• Ruler, graduated in millimetres.
• Calliper blocks, two, rectangular.
Procedure
Lay the sheet flat and square on the surface (see Figure B.1), ensuring that the valley of every
corrugation is in contact with it.
To measure the length, take three measurements, one in the middle and one approximately 50 mm
from each side, or further to avoid mirrored corners; see Figure B.1.
To measure the width of sheets longer than 0,9 m, take three measurements, one in the middle
and one approximately 50 mm from each end, or further if necessary to avoid mired corners. For
sheets of nominal length equal to or shorter than 0,9 m, take two measurements approximately
50 mm from each end; see Figure B.1.
Read each measurement to the nearest millimeter. Calculate the arithmetic average of the length
and width and compare them with the specifications given.
Measurement of the thickness of sheets
Apparatus
• Micrometre, with hemi-cylindrical plates (see Figure 21), accurate to 0,05 mm.
Figure 21: Hemi-cylindrical plate for measurement of thickness(Dimensions in millimeters)
59
Procedure
Take six measurements, to the nearest 0,1 mm, approximately 15 mm in from the end of each
sheet as follows.
• For sheets of type a, take the measurements in three valleys and three crowns of the corrugation, as shown in Figure 22.
• For sheets of type B, take the measurements on six sides of the corrugations, as shown in Figure B.3 b).
Each individual measurement shall be compared with the appropriate minimum thickness specified, and the
arithmetic average of the six measurements made on one sheet shall be compared with the specifications
given.
Measurement of out- of- squareness of sheets
Surface, smooth, flat, with dimensions appropriate to the dimensions of the sheet.
Ruler, graduated, metal, accurate to 0, 5 mm.
Frame, rectangular, with two corrugated ends and two straight sides or any other appropriate
Device to check the squareness of ends with respect to corrugations, with an accuracy of 1 mm.
Procedure
Lay the sheet flat and square on the surface, ensuring that the valley of every corrugation is in
contact with it. Measure the out-of-squareness at each end, as indicated in Figure 22, for example.
Compare the results, expressed in millimeters, with the specification given.
Figure 22: Measuring out of squareness
60
TEST RESULTS - MEASUREMENT OF OUT- OF- SQUARENESS OF SHEETS
Figure 23: Recording Bending strength of flat sheets
Crystallite asbestos Fiber cement roofing sheet
Sample 1 A 11.1mm Sample 1 A 17.92mm
Sample 1 A1 8.74mm Sample 1 A1 21.1mm
Sample 1 A2 9.87mm Sample 1 A2 17.46mm
Average 9.90mm Average 18.82mm
61
Measurement of the height of edges for sheets
Apparatus • Surface, smooth, flat, with dimensions appropriate to the dimensions of the sheet. • Device, for measuring the height, hom, of the ascending corrugation.
• Device, for measuring the height, hod, of the descending corrugation.
Procedure Lay the sheet flat and square on the surface, ensuring that the valley of every corrugation is in
contact with it. Use the measuring devices to measure, to an accuracy of .1 mm, the height of both edges,
as in Figure 3. Compare the results, expressed in millimeters, at any point on the edges of the sheet with
the specification.
62
Measurement of length and width for fittings
Apparatus The apparatus is the same as for sheets.
Procedure For each dimension, take two measurements (one at each end). Read each measurement to the
nearest millimeter. Calculate the arithmetic average for each dimension and compare with the
specification given in 5.3.6.
Measurement of thickness for fittings
Apparatus
The apparatus is the same as for sheets.
Procedure Make the measurements
• On three crowns and three valleys on the corrugated parts, at approximately 15 mm from the edge, and on two distinct points on the flat part, at approximately 15 mm from the edge.
Calculate the average of the six measurements made on the corrugated part, and the average of
the two measurements made on the flat part. Compare these two averages with the specification
given in 5.3.6.
63
Breaking load and the bending modulus of sheets
This annex gives a method of test for measuring the breaking load and calculating the 'bending
modulus of fiber-cement profiled sheets, and the procedures used for the • determination of
compliance with the requirements of this International Standard.
Principle
A profiled sheet or a specimen cut from a sheet is supported at two longitudinal ends and
subjected at mid-span to a flexural bending load until failure occurs (three-point bending). The
load/deflection relationship, as well as the failure load, is recorded.
Measurement of breaking load
Apparatus
• Bending test machine, with a constant rate of deflection when applying the load (where this facility is not available, a constant rate of loading is acceptable), with an error of accuracy and an error of repeatability less than or equal to 3 %; see
• This machine is comprised of the following: ▪ two parallel supports (one fixed), set in the same horizontal plane and longer than the
sample width; the upper surface of each support shall be flat and 50 mm wide; the distance between the supports shall be set to give a clear span of 1,1 m,
▪ a rigid, flat loading beam, 230 mm wide, of the same length as the supports and, parallel and equidistant from them; it shall be attached to the mechanism by means of a flexible joint;
▪ three strips of felt or soft material approximately 10 mm thick.
Dimensions in millimeters
Key A strips of felt of soft material a 15 1 100 mm.
Figure 24: Breaking load test
64
Procedure
For sheets having a height of corrugation greater than 80 mm, increase the span to at least 15
times the height of the corrugation.
For sheets shorter than 1,2 m, reduce the clear span to a minimum of 700 mm or 12 times the
height of the corrugations, whichever is greater, and reduce the width of the loading beam by the
ratio of this clear span to 1,1 m.
Place the specimen on the supports (the upper face in compression), which are at right angles to
the corrugations. After interposition of strips of felt or soft material, load the specimen at mid-
span using the flat beam, distributing evenly the load applied on its centre.
Measure the deflection, expressed in millimeters, at mid-span (below the loading head) to an
accuracy of 0,1 mm, and plot these values against the corresponding loads. If the deflection is
determined by incremental readings, use at least six pairs of readings.
The rate of loading shall be such that the rupture occurs between 10 s and 45 s after the start of
its application. Record the load at rupture, i.e. maximum load, F.
Calculation of breaking load per metre of width
The breaking load per meter of width, Fs, expressed in newton per meter, is given by Equation
(C.1):
𝐹𝑠 =𝐹
𝑏𝑋103
where
F: is the load at rupture, expressed in newton;
b: is the dimension of the specimen parallel to the supports, expressed in millimeters.
When a span length, /s, other than 1100 mm is used, the breaking load, F5, per meter width for
comparison with Table 3 is as given in
Equation: 𝐹𝑠 =𝐹
𝑏.
𝑙𝑠
1100𝑚𝑚𝑋103
where is ls the clear span between the supports, expressed in millimeters.
The results shall be compared with the appropriate specification given in Table 3 for the breaking
load.
65
TEST RESULTS BREAKING LOAD PER METER OF WIDTH
Figure 25: Recording Bending strength of flat sheets
CHRYSTALITE ASBESTOS ROOFING SHEET BRTEAKING LOAD PER METER OF WIDTH Sample Name F b ls Fs
Sample 1 3212N 1095 2397 6391.72N/mm2
Sample 2 2988N 1095 2397 5945.95N/mm2
Sample 3 3268N 1095 2397 6503.16N/mm2
Sample 4 3156N 1095 2397 6280.28N/mm2
Sample 5 3268N 1095 2397 6503.16N/mm2
Sample 6 2988N 1095 2397 5945.95N/mm2
Sample 7 3100N 1095 2397 6168.83N/mm2
Sample 8 3212N 1095 2397 6391.72N/mm2
Sample 9 3044N 1095 2397 6057.39N/mm2
Sample 10 3326N 1095 2397 6618.58N/mm2
Average 3156N 1095 2397 6280.67N/mm2
FIBER CEMENT ROOFING SHEET BRTEAKING LOAD PER METER OF WIDTH Sample Name F b ls Fs
Sample 1 1644N 940 1700 2702.67N/mm2
Sample 2 1784N 940 1700 2932.84N/mm2
Sample 3 1700N 940 1700 2794.74N/mm2
Sample 4 1616N 940 1700 2656.63N/mm2
Sample 5 1672N 940 1700 2748.70N/mm2
Sample 6 1700N 940 1700 2794.74N/mm2
Sample 7 1588N 940 1700 2610.60N/mm2
Sample 8 1532N 940 1700 2518.53N/mm2
Sample 9 1756N 940 1700 2886.81N/mm2
Sample 10 1616N 940 1700 2656.63N/mm2
Average 3156N 1095 2397 3304.77N/mm2
66
Bending modulus (modulus of elasticity) The bending modulus, Em, expressed in newton per square millimeter, of each of the specimens
is calculated as given in Equation.
𝐸𝑚 =(𝐹0 − 𝐹0,15)(𝑙𝑠)
48𝐼(𝑓0,55 − 𝑓0,15 )
𝑙𝑠 is the span, expressed in millimeters;
𝐹0 − 𝐹0,15 is the increment of load,' expressed in newton per meter, on the straight
line portion of the load-deflection curve; see Figure C.2;
𝑓0,55 − 𝑓0,15 is the increment of deflection, expressed in millimeters, at the mid-span
of the test specimen, corresponding to F0,55 —F0,15;
I is the moment of inertia of the section around a horizontal axis through
the center of gravity expressed in mm4;
𝐹0,15 shall be approximately 15 % of the maximum load;
𝑓0,55 shall be approximately 55 %bf the maximum load.
The bending modulus for each specimen shall be expressed to four significant figures.
The results shall be compared with the appropriate specification given in Figure 26 for the bending
modulus.
0,15 f0,55
Key
X deflection, expressed in millimeters
Y load, expressed in newton per meter
Figure 26: Measurement of deflection during breaking load test
This annex gives a method of test for measure in the bending Moment of fibre-cement profited
sheets and the procedures used for the determination of compliance with the requirements of
this International Standard.
Principle
A specimen cut from a profiled sheet is supported at two ends and subjected at mid-span to a
flexural bending load until failure occurs (three-point bending).
Measurement of bending moment
Apparatus
• Bending test machine, with a constant rate of deflection when applying the load (where this facility is not available, a constant rate of loading is acceptable) and with an error of accuracy and an error of repeatability less than or equal to 3 %.
This machine is comprised of the following:
• two parallel supports (one liked), set in the same horizontal plane and longer than the sample width; the face of each support shall be rounded to a radius of 3 mm to 25 mm;
• Either a loading bar for sheets, or a rigid loading beam of suitable width for sheets, longer than the sample length, parallel to the supporting and located at the same distance of each of them; it shall be attached to the mechanism by means of a flexible joint;
• strip of felt or soft material approximately 10 mm thick, longer than the sample length and wider than the loading bar or the rigid beam. '
Procedure Place the specimens on the supports (the upper face in compression) and, after interposition of
strips of felt or soft material, load in middle at the top of corrugation, using the loading bar or the
rigid beam, depending on the type.
Adjust the rate of loading such that the rupture occurs between 10 s and 30 s after the start of its
application.
Record the load at rupture, F.
Calculation of bending moment per meter length The bending moment, M, at rupture per meter length, expressed in newton-meters per meter, is
given by Equation (D.1) for sheets of constant thickness [see Figure 2 a)] and by Equation (D.2) for
sheets of variable thickness [see Figure 2 b)]:
𝑀 =𝐹
6𝑋
𝑙𝑠
𝑏
where
F is the load at rupture, expressed in newton; b is the width of the specimen, expressed in millimeters; ls is the span, expressed in millimeters;
69
TEST RESULTS BENDING MOMENT OF A SHEET
Figure 27: Recording Bending strength of flat sheets
70
CHRYSTALITE ASBESTOS ROOFING SHEET BENDING MOMENT
F b ls M
Sample 1 450N 400 290 54N
Sample 2 338N 400 290 41N
Sample 3 366N 400 290 44N
Sample 4 366N 400 290 44N
Sample 5 310N 400 290 37N
Sample 6 478N 400 290 58N
Sample 7 478N 400 290 58N
Sample 8 506N 400 290 61N
Sample 9 562N 400 290 68N
Sample 10 562N 400 290 68N
Average 442N 400 290 53N
FIBER CEMENT ROOFING SHEET BENDING MOMENT
F b ls M
Sample 1 114N 400 255 12N
Sample 2 86N 400 255 9N
Sample 3 114N 400 255 12N
Sample 4 86N 400 255 9N
Sample 5 114N 400 255 12N
Sample 6 86N 400 255 9N
Sample 7 114N 400 255 12N
Sample 8 86N 400 255 9N
Sample 9 86N 400 255 9N
Sample 10 86N 400 255 9N
Average 97N 400 255 10N
71
Determine the apparent density General
This annex gives the test method for determination of the apparent density (see 7.3.4) of fibre-
cement profiled sheets. This is the average density of the material and its pores.
Principle
The volume of a saturated specimen is determined by immersion in water. The specimen's oven-
dry mass is then measured. The apparent density is determined by calculation from the measured
values.
Apparatus
• Oven, ventilated, capable of achieving a temperature of 100 °C ± 5 °C with a full load of specimens.
• Balance, accurate to within 0,1 % of the specimen mass, equipped to determine both the immersed mass and the non-immersed mass of the specimen.
Test procedure
Immerse specimen in water for at least 24 h.
Take saturated specimen, remove excess water from surfaces and then determine the volume, V,
of the water displaced by the saturated specimen when placed into a water bath. Record this value.
Any other method having an equivalent accuracy may be used.
Remove specimen from water bath and place it into a ventilated oven that is maintained at a
temperature of 100 °C 5 "C until the specimen has reached constant mass, determined as a
difference between successive weighing of less than 0,1 % in any 24 h period. Record this value as
m.
Calculation of apparent density
The apparent density, p, expressed in grams per cubic centimetre, is given by Equation (F.1):
(F 1)
where.
m is the mass, expressed in grams, of the test piece after drying; V is the volume of the specimen,
in cubic centimeters.
72
TEST RESULTS – DENSITY
Figure 28: Recording Density
DENSITY CHRYSTALITE
Asbestos Water Displacement Dry Weight Density
Sample 1 0.0000370m3 0.0622Kg 1681.08 Kg/m3
Sample 2 0.0000380m3 0.0610Kg 1605.26 Kg/m3
Sample 3 0.0000380m3 0.0619Kg 1628.95 Kg/m3
Sample 4 0.0000360m3 0.0597Kg 1658.33 Kg/m3
Sample 5 0.0000380m3 0.0622Kg 1636.84 Kg/m3
Sample 6 0.0000389m3 0.0612Kg 1573.26 Kg/m3
Sample 7 0.0000380m3 0.0607Kg 1597.37 Kg/m3
Sample 8 0.0000370m3 0.0620Kg 1675.68 Kg/m3
Sample 9 0.0000390m3 0.0621Kg 1592.31 Kg/m3
Sample 10 0.0000380m3 0.0629Kg 1655.26 Kg/m3
Average
1630.43 Kg/m3
DENSITY FIBER CEMENT
Fiber cement Water Displacement Dry Weight Density
Sample 1 0.0000400m3 0.0437Kg 1091.36 Kg/m3
Sample 2 0.0000410m3 0.0437Kg 1064.74 Kg/m3
Sample 3 0.0000400m3 0.0437Kg 1091.36 Kg/m3
Sample 4 0.0000380m3 0.0437Kg 1148.80 Kg/m3
Sample 5 0.0000380m3 0.0437Kg 1148.80 Kg/m3
Sample 6 0.0000350m3 0.0437Kg 1247.27 Kg/m3
Sample 7 0.0000340m3 0.0437Kg 1283.96 Kg/m3
Sample 8 0.0000420m3 0.0437Kg 1039.39 Kg/m3
Sample 9 0.0000420m3 0.0437Kg 1039.39 Kg/m3
Sample 10 0.0000340m3 0.0437Kg 1283.96 g/cm3
Average
1143.90 Kg/m3
73
water permeability of a sheet General
This annex gives details of the test procedure (see 7.3.5) and apparatus required to determine that
fibre-cement profiled sheets comply with the water-permeability requirements of this
International Standard.
Principle
A specified depth of water is applied to the upper face of a horizontally positioned specimen for a prescribed
period of time. Visual examination of the test specimen determines compliance with the
requirements of this International Standard. AO.
Apparatus
• Frame, constructed as shown in Figure 29 Figure 29.
The width of the frame depends on the profile of the sheets and shall be, wherever possible,
greater than 0,5 m. The length of the frame shall be between 0,5 m and 1,0 m.
Dimensions in millimeters.
Figure 29: Arrangement for the water permeability test
Procedure
Seal the frame on the upper face of the specimen. Place the specimen horizontally, in normal
laboratory conditions and above the ground, e.g. on supports, in such a way as to allow visual
inspection of the under face. Without moving the specimen.
Fill the frame with water until the level is approximately 20 mm above the top of corrugations and
maintain the level constant during the test.
After 24 h, examine the under face for the presence of water drops. Report the visual condition of
the specimen. Compare the result with the specification given.
74
TEST RESULTS – WATER PERMEABILITY TEST
Figure 30: NAIL HEAD PULL THROUGH TEST
TEST RESULTS - NAIL HEAD PULL THROUGH TEST Asbestos Results
Sample 1 ** No sign of water droplets after 24h of time Pass
Sample 2 ** No sign of water droplets after 24h of time Pass
Sample 3 ** No sign of water droplets after 24h of time Pass
Average ** No sign of water droplets after 24h of time Pass
Fiber Cement Results
Sample 1 ** No sign of water droplets after 24h of time Pass
Sample 2 ** No sign of water droplets after 24h of time Pass
Sample 3 ** No sign of water droplets after 24h of time Pass
Average
Pass
75
Soak-dry performance of long and short sheets General
This annex gives the details of the apparatus and testing procedure required to evaluate the soak-
dry performance of long and short fibre-cement profiled sheets.
Principle
A lot of specimens is subjected to a number of test cycles comprising a period of
immersion in water and drying in an oven. A comparison is made between the breaking
load (long sheets) or the bending moment (short sheets) of the specimen exposed to
soak-dry test cycling and the breaking load (long sheets) or the bending moment (short
sheets) of the unexposed reference specimen from the same sample for each sample in
the lot.
Apparatus
• Oven, ventilated, capable of maintaining a temperature of 60 °C ± 3 °C and a relative humidity less than or equal to 20 % with a full load of specimens.
• Bath, filled with water at ambient temperature (> 5 °C).
The water in the water bath should be saturated with soluble salts derived from fibre-cement
sheets. Test equipment, for determination of breaking load or bending moment; see Annexes C
and D.
Procedure
Divide the specimens at random into two lots of 10.
Submit the first lot of 10 specimens to the breaking load test for the long sheets (taking for w
the average of two measurements of the width of the specimen) or to the bending moment test
for the short sheets, including the conditioning procedure for type testing; see Table 7.
At the same time, submit ttie second lot of 10 specimens to 50 soak-dry cycles
as follows: immersion in water at ambient temperature (> 5 °C) for 18"h;'
drying in a ventilated oven at €0°C± 3°C and a relative humidity of less than 20 % for 6 h.
The 20 % humidity shall be achieved for at least 3 h prior to the end of the drying period.
If necessary, an interval of up to 72 h is allowed between cycles. During this interval, store
specimens in the immersed condition.
long sheets (taking for w the average of two measurements of the width of the specimen) or the
bending moment test for short sheets.
76
Calculation of results
For each of the two lots, calculate the mean breaking load or bending moment and the standard
deviation of the values obtained.
Let X1 and s1 be the mean and the standard deviation of the results obtained on the first lot, and
X2 and s2 be the mean and the standard deviation of the results obtained on the second lot tested
after the soak-dry cycles.
The lower estimation, L2, of the mean breaking load or bending moment after immersion in warm
water (second lot) at the 95 % confidence level is calculated as given in Equation (K.1) and the
upper estimation, L1, of the mean breaking load or bending moment at the 95 % confidence level
of the reference (first) lot is calculated according to Equation (K.2):
L2 = X2 —(0,58Xs2) (K.1)
L1 = +(0,58 xsi) (K.2)
where the coefficient of 0,58 is related to a sampling size of 10 specimens, as defined in tS0
2602:1980, Table 1, for the unilateral level of confidence at 95 %.
Calculate the ratio, RL, as given in Equation (K.3):
RL = L2
Assess the ratio against the specification of 5.4.8.
Test report
• The test report shall contain the following information: a reference to this International Standard;
• all details necessary for complete identification of the batch of profiled sheets from which sample sheets were taken;
• dimensions of the test specimen;
• test equipment details;
• test temperature and condition of the test pieces;
• breaking loads or bending moments of exposed and unexposed sheet specimens;
• calculated results;
• date of testing.
77
Costing This study has two objectives, the first to measure the impact to general public, such an impact
can be calculated easily calculating the initial cost comparison of alternative roofing materials. But
for dandier study the life cycle cost of alternative roofing materials was calculated.
Comparing impact of banning asbestos roofing sheets to general use in
the country. The initial cost comparison of different roofing materials could be done by using simple BOQ
calculation. But different roofing materials need different roofing structures. Therefore, total
house boq was prepared and roofing cost comparison was done. In order to compare the one
house model was used. The model is being developed calculate the total embodied energy data
and the useful life of a residential building elements, materials and equipment. The secondary
objective is to simulate this house model and analyze the sustainability of different building
materials. The model is being developed where the designer can then add more features to the
same and understand their possible variations against the life cycle cost.
Defining a house model
The best method of selecting the house model is to use the most common house type in the
country [19]. In order to find the most common house type in the country [20], the general
statistics were used and analyze accordingly shown in the Figure 31.
Figure 31: Selected house model for the study
Statistics shows that most of Sri Lankan houses built in rural areas [21], the house model was
selected from rural area. The other details such as construction materials were selected from the
maximum number of building construction technology used to build houses in the country. And
the data were collected from the census department.
The type of building material was selected and the maximum building type was selected into the
house model developed by this research. Accordion to the most common building material for wall
construction is the brick and the cement they used to build by using cement floors. The most
common building material for roof is cement fiber sheets. Since the material pallet was decided,
the next step is to define a house model according to the requirements of the house.
Energy accounting and LCC calculation for basic house model Preliminary Bills of Quantities (BOQ) were calculated in order to account the amount of materials
required to build the basic house model. Accession the costing was done in order to understand
the cost variation of different roofing materials. Subsequently, the total energy account was
78
transformed into the life cycle model where the total energy consumption of a period of sixty years
(one life span) was calculated considering the maintenance and replacement energy cost.
LCC accounting for period of sixty years
The sixty-year life span of the affordable house was defined by using British standards. The sixty-
year definition helps the research to omit unnecessary calculation. However, all the selected
roofing materials have the life span more than sixty years, therefore, the replacement cost of
roofing materials was neglected from the LCC calculation process. But necessary maintenance cost
was included while calculating the total life-cycle cost of the building. Hence, the total life cycle
cost is calculated by using following equation 1.
𝐿𝐶𝐶 = 𝐼𝐶 + (𝑀𝐶 + 𝐸𝐶 + 𝑂𝑐) + 𝑈𝑐 − 𝑅𝑣 (1)
Initial Cost (IC)
The initial cost of the basic house was calculated by using Bills of Quantity sheet considering 2016
market prices. Quantities were calculated by using Taking off the sheet. Then the roofing materials
changes and the quantity changes due to the differentiation in roofing material were added to
BOQ.
Maintenance Cost (MC)
Maintenance cost of the building calculated only for the roofing material. Other maintenance
works such as roof flooring etc. were omitted from the analysis in order to understand the cost
changes due to roofing materials.
Resale value
Resale value is the trade value of a building after using for a specific period. But in this case, it is
sixty years. But the problem is after sixty years the basic house cannot resale. Therefore, the
reusability of materials is taken into consideration. Since this is about roofing materials, roofing
materials resale value only taken into final comparison.
The resale value was measured by evaklut8ng real world market conditions. The new materials
price was compared with 10-year-old same materials for sale in the market. The price comparison
was evaluated into value index and used to calculate the reusability of roofing materials.
LCC techniques
There are many methods of calculating life cycle cost of a residential building. Since this research
is to compare roofing material LCC equipment cost and other household expenses were neglected.
But the most common LCC costing techniques were used to calculate the life cycle cost of single
affordable housing unit while changing the roofing materials.
Simple payback period
Simple payback period is the time taken to return the investment to build the house. This is simple
as “if the house is rented to similar use the payback period of the house”. And the inflation and
interest rates and cash flow or taxation were included in the calculation.
79
Net present values (NPV)
The net present value is simple as the value in the present of a sum of money incurred in the future.
And the all the future financial investments arise throughout the life of an investment. In this case,
NPV calculated for the period of sixty years (see the equation 2).
t = Cash flow requirement
i = interest rate assumptions
Energy cost (EC)
By all mean basic houses in Sri Lanka doesn’t use air conditioners to cool their houses. Therefore,
the energy cost is more or less zero[34]. But in order to understand the thermal comfort factors
and the cooling load incurred by differentiating roofing material, It was assumed that all four types
of different roofing material used houses are using an air conditioner to cool their house. The
energy cost of cooling loads was calculated by using design building software for a period of sixty
years.
Industrial impact factor banning asbestos sheets The industrial impact is simply the production increase alternatives of asbestos roofing sheet. The
demand of the roofing materials is the main concern in this study. The demand of an alternative
roofing materials before and after banning roofing materials shall be calculated by using statistic
data.
In this study all the necessary roofing alternative future demand was calculated against the existing
demand of asbestos roofing sheets.
Table 2: Comparison of industrial impact
Asbestos roofing ► Clay Tile
Asbestos roofing ► Zinc Calum
Asbestos roofing ► GI Sheets (ටකරන් )
Asbestos roofing ► Cement roof tiles
Environmental impact after banning asbestos roofing sheets to the country
The overall argument of this paper is that Sri Lankan is such a middle income country and yet to
be developed. There are many poor families those who are still wants to develop their residential
house at a minimum cost. However, the overall task is to identify the sustainability after banning
asbestos roofing materials in Sri Lanka. Thus in order to understand the environmental
sustainability, the embedded energy was calculated and compared. The embedded energy was
calculated by using energy accounting hierarchical structure. And recent literature was used to
measure and evaluate the overall all embedded energy of different roofing materials in Sri Lanka.
80
Initial cost comparison The initial cost comparison is very important to understand the impact to poor communities in the
country. The cost factor was calculated in to one house model selected for this study. And the one
square area (10ft X 10ft) was compared as a foot print to the comparison shown in the Table 3 .
Figure 34: Total Life cycle cost of different roofing materials
Industrial Impact after banning asbestos roofing materials in Sri Lanka. Sri Lanka is a middle income country and not having much enough resources to increase the
production at a given small period of time. The production capacity cannot have increased without
prior capital gain. And also there many repercussion dues to the increase of materials production
in the country. The industrial impact after banning asbestos roofing materials was measured
Discussion Asbestos in loose form is dangerous. In Sri Lanka, loose form has not been used in our production
so the main reasons for this whole issue are misconception of the name asbestos, and the way it
has been misused. Coordinator of the Fiber Cement Product Manufacturers Association (FCPMA)
of Sri Lanka, Anton Edema spoke to The media and refuted the allegations made with regard to
the use of asbestos in the country and said no one has ever been able to prove that it was
hazardous. Concurring to them “Not a single death has been reported for the past 70 years by
having asbestos roofing. All what they do is quoting outdated information from the internet and
say it has caused this much of deaths. But it has not yet been proved by anyone that in Sri Lanka
anyone has died of having asbestos roofing,”
According to FCPMA, without any consistent evidence banning asbestos is meaningless and we are
subjected to this type of situation due to the trade war between the EU and Russia. And the
discussion should be “Are we strong enough to ban asbestos as a roofing materials?”
The initial cost estimate as well as the life cycle cost estimation shown in the Figure 34 explains
that asbestos is the most suitable roofing materials for Sri Lanka and other alternative yet to be
considered as expensive for a middle income country like Sri Lanka.
Economical sustainability
The priority for a middle income country like Sri Lanka is to reduce the cost and develop its
infrastructure. Thence the first priority should be to improve the cost. However, cost wise
alternative for asbestos are not great in terms of their initial cost maintenance cost and resale
value. Asbestos are the best roofing materials in terms of overall. The GI sheets are very cost
effective but need to be replaced from time to time. And GI sheets resale value is almost close to
Zero. And the so called alternative of clay tiles are highly expensive comparing to the other roofing
materials in the list Figure 33.The industry wise it would greater problem to alter the demand of
asbestos roofing sheets I the country. The results sows that clay tile manufacturing increase should
be more than 400% and need many infrastructure developments. And yet increasing clay tile
production would be environmental hazardous process. The zinc Calum is good alternative, since
it’s an imported roofing materials. But there is a limit to import for a middle-income country like
Sri Lanka. However, cement roofing tiles can be increased the manufacturing but its carbon
footprint is very high comparing to other roofing materials in the industry.
Environmental sustainability
Environmental conservation should be a priority for an eco-friendly country like Sri Lanka. By
banning asbestos can save the country natural beauty by introducing good alternatives. But the
study shows that already existing alternatives are not environmentally sustainable comparing
asbestos.
The asbestos roofing sheet area of one square account for 999MJ while others are way above
asbestos embedded energy. Cement tile roof accounts for highest embodied energy dues its use
of cement and machinery during manufacturing process. Clay tile is the next best product but it’s
consume most of fire wood to manufacture the clay tiles. The steel products have much bigger
energy foot print because of their manufacturing methods. However, asbestos roofing sheets are
nest in that sense except its health hazards.
93
References
• ISO. (2002). ISO 8336- Fibre-cement flat sheets — Product specification and test methods. Shock, 2009, 1–8.
• ISO. (2002). ISO 10904- Fibre-cement corrugated sheets and fitting for roofing sheets— Product specification and test methods. Shock, 2009, 1–8.
• ISO. (2002). ISO 12504- Hydrothermal performance of building materials and products — Determination of water vapour transmission properties. Shock, 2009, 1–8.
• American Society for Testing and Materials. (2013). Standard Test Methods for Evaluating Properties of Wood-Base Fiber and Particle-D1037. Annual Book of ASTM Standards, (July), 1–30. https://doi.org/10.1520/D1037-06A.1.2
• D. M. Bernstein et al., “Evaluation of the fate and pathological response in the lung and pleura of brake dust alone and in combination with added chrysotile compared to crocidolite asbestos following short-term inhalation exposure,” Toxicol. Appl. Pharmacol., vol. 283, no. 1, pp. 20–34, 2015.
• B. A. Cressey and E. J. W. Whittaker, “Five-fold symmetry in chrysotile asbestos revealed by transmission electron microscopy,” Mineral. Mag., vol. 57, no. December, pp. 729–732, 1993.
• D. Bernstein et al., “Health risk of chrysotile revisited Health risk of chrysotile revisited,” vol. 8444, no. March, 2017.
• A. Tossavainen, M. Kotilainen, K. Takahashi, G. Pan, and E. Vanhala, “Amphibole fibres in Chinese chrysotile asbestos.,” Ann Occup Hyg., vol. 45, no. 2, pp. 145–52, 2001.
• V. L. Roggli, R. T. Vollmer, K. J. Butnor, and T. A. Sporn, “Tremolite and mesothelioma,” Ann. Occup. Hyg., vol. 46, no. 5, pp. 447–453, 2002.
• J. C. McDonald and A. D. McDonald, “Chrysotile, tremolite and carcinogenicity,” Ann. Occup. Hyg., vol. 41, no. 6, pp. 699–705, 1997.
• L. T. Stayner, D. A. Danhovic, and R. A. Lemen, “Occupational exposure to chrysotile asbestos and cancer risk: A review of the amphibole hypothesis,” Am. J. Public Health, vol. 86, no. 2, pp. 179–186, 1996.
• A. H. Smith and C. C. Wright, “Chrysotile asbestos is the main cause of pleural mesothelioma,” American Journal of Industrial Medicine, vol. 30, no. 3. pp. 252–266, 1996.
• E. Yano, Z. M. Wang, X. R. Wang, M. Z. Wang, and Y. J. Lan, “Cancer mortality among workers exposed to amphibole-free chrysotile asbestos,” Am. J. Epidemiol., vol. 154, no. 6, pp. 538–543, 2001.
• G. Boulanger et al., “Quantification of short and long asbestos fibers to assess asbestos exposure: a review of fiber size toxicity.,” Environ. Health, vol. 13, no. 1, p. 59, 2014.
• P. J. Landrigan, W. J. Nicholson, Y. Suzuki, and J. Ladou, “The Hazards of Chrysotile Asbestos : Review,” Ind. Health, vol. 37, pp. 271–280, 1999.
• Q. Rahman, P. Nettesheim, K. R. Smith, P. K. Seth, and J. Selkirk, “International Conference on Environmental and Occupational Lung Diseases Conference Themes : Exposure,” Environ. Heal., vol. 109, no. 4, pp. 425–431, 2001.
• R. Pasetto, B. Terracini, D. Marsili, and P. Comba, “Occupational burden of asbestos-related cancer in argentina, Brazil, Colombia, and Mexico,” Ann. Glob. Heal., vol. 80, no. 4, pp. 263–268, 2014.
• E. Commission, “Regulations amending Annex XVII of REACH,” no. 1907, 2016.
• S. B. Markowitz and J. M. Moline, “Malignant mesothelioma due to asbestos exposure in dental tape,” Am. J. Ind. Med., Feb. 2017.
• J. LaDou, “The asbestos cancer epidemic,” Environ. Health Perspect., vol. 112, no. 3, pp. 285–290, 2004.
• F. A. Ansari, M. Ashquin, H. Siddiqui, R. Prasad, M. Imran Khan, and I. Ahmad, “Workplace atmospheric asbestos levels in different plants manufacturing asbestos-cement roofing sheets in India,” Atmos. Pollut. Res., vol. 1, no. 2, pp. 128–131, 2010.
• A. Ramanathan and V. Subramanian, “Present status of asbestos mining and related health problems in India - A survey,” Ind. Health, vol. 39, no. 4, pp. 309–315, 2001.
• I. Safitri Zen, R. Ahamad, K. Gopal Rampal, and W. Omar, “Use of asbestos building materials in Malaysia: Legislative measures, the management, and recommendations for a ban on use,” Int. J. Occup. Environ. Health, vol. 19, no. 3, pp. 169–178, 2013.
• S. Bovornkitti, “Asbestos and Mesothelioma in Thailand *,” pp. 44–46.
• S. L. Leong, R. Zainudin, L. Kazan-Allen, and B. W. Robinson, “Asbestos in Asia,” Respirology, vol. 20, no. 4, pp. 548–555, May 2015.
• Central Bank of Sri Lanka, “National output and expenditure,” Annu. Rep. 2012, pp. 1–30, 2012.
• U. G. Y. Abeysundara, S. Babel, and S. Gheewala, “A matrix in life cycle perspective for selecting sustainable materials for buildings in Sri Lanka,” Build. Environ., vol. 44, no. 5, pp. 997–1004, May 2009.
• R. S. P. Coutts, “A review of Australian research into natural fibre cement composites,” Cem. Concr. Compos., vol. 27, no. 5, pp. 518–526, May 2005.
• A. L. Frank and T. K. Joshi, “The global spread of asbestos,” Ann. Glob. Heal., vol. 80, no. 4, pp. 257–262, 2014.
• S. Ikai, J. R. Reichert, A. V. Rodrigues, and V. A. Zampieri, “Asbestos-free technology with new high toughness polypropylene (PP) fibers in air-cured Hatschek process,” Constr. Build. Mater., vol. 24, no. 2, pp. 171–180, 2010.
• P. T. C. Harrison, L. S. Levy, G. Patrick, G. H. Pigott, and L. L. Smith, “Comparative hazards of chrysotile asbestos and its substitutes: A European perspective,” Environ. Health Perspect., vol. 107, no. 8, pp. 607–611, 1999.
• G. Fischer and V. Li, International Workshop on High Performance Fiber Reinforced Cementitious Composites (HPFRCC) in Structural Applications. RILEM Publications, 2006.
• B. Xu and T. Lavin, “Properties of poly(vinyl alcohol) fiber reinforced high-performance cementitious material,” pp. 1–9.
• S. A. S. Akers, J. B. Studinka, P. Meier, M. G. Dobb, D. J. Johnson, and J. Hikasa, “Long term durability of PVA reinforcing fibres in a cement matrix,” Int. J. Cem. Compos. Light. Concr., vol. 11, no. 2, pp. 79–91, May 1989.
• H. De Raeve, J. Van Cleemput, and B. Nemery, “Airborne polyvinyl alcohol (PVA) and cellulose fibre levels in fibre-cement factories in seven European countries,” Ann. Occup. Hyg., vol. 45, no. 8, pp. 625–630, 2001.
• C. Udawattha and R. Halwatura, “Embodied energy of mud concrete block (MCB) versus brick and cement blocks,” Energy Build., vol. 126, no. 0, pp. 28–35, 2016.