44
.consulting .solutions .partnership Sourcing in China Supplier Quality, Costs and Strategies of companies that source from China msg systems

.consulting .solutions .partnership
Sourcing in ChinaSupplier Quality, Costs and Strategies of companies that source from China
msg systems


3
With modern societies turning more and more into a global village, “coopetition“ is, for global companies, becoming the name of the game. The logic behind this concept is simp-le: under the premise that “only the one who knows best the challenges I am facing can help me overcome them”, numerous companies have sought lately to establish colla-borations with their closest competitors in order to foster technological development in a specific area.
This approach can be extrapolated to a country level. Traditional industrialized countries such as Germany have long faced procurement and cost competition challenges especially in the manufacturing scene. China on the other hand, as the biggest emergent economy is also starting to face the establishment of lower-cost competitors in other emerging economies in the region. The question is then, how can, under these circumstances, both economies maintain their respective commercial and technological leadership in a growingly global competitive environment, whilst at the same time securing sustainability in their resource consumption and manufacturing processes?
The answer lies, at least partially, in the development of strong and trustworthy supply chains and manufacturing networks oriented towards the upholding of high quality and sustainability standards, which both countries (with granted, surely different degrees of success) have been developing in the last decades.
The present study intends to offer a contribution towards understanding the perception European and Western companies have gained when it comes to quality and sus-
tainability standards observed by Chinese suppliers and networks, as well as the influence new emerging econo-mies are having in the Asian giant´s commercial strategies. The results are relevant for those seeking to build up their “coopetitive” partnerships with local Chinese producers and supply chains.
Wishing you an enjoyable read.
Prof. Dr.-Ing. Günther SeligerTechnische Universität BerlinChair of Assembly Technologies and Factory ManagementHead of Department
PrefaceProf. Dr.-Ing. Günther Seliger

5
Many companies across the world have adopted sourcing activities in China as a strategy for competitive advantage. This strategy was successful in the past due to China’s vast offer of low cost labor and resources. During the last three decades, the economy of China has evolved from a system near to international trade to a market-oriented system with a fast growing private sector. China’s exports growth has supported its rapid economic growth (Meyer, 2010). The Chinese growth rate in GDP measures the rate in the adjus-ted value of goods and services produced in China. China’s economy has become the second largest economy in the world. The Chinese currency has strengthened remarkably over the past years by more than 30 percent and compa-nies are expected to see what is going to happen (Trading Economics, 2014). However, this situation began to weaken through continuous significant labor cost increases, very high fluctuation rates and a growing competition with other developing Asian countries and never the less related to the weak Euro logistics advantages in Eastern Europe.
International companies having sourcing activities in China are looking for solutions to lower their costs of goods sold. Most companies mainly tend to focus on manufacturing savings, rather than on total cost of sourcing, hence being exposed to different hidden costs and risks including longer material pipelines, increased rules and regulations, currency fluctuations, customs requirements, increased management attention and other cultural and regional issues. (Christopher, Jia, 2007).
This study is aimed to evaluate the benefits and problems that medium-size companies are currently facing in sour-cing from China, to identify new industry trends to maintain a competitive advantage, to foresee future movements and potential competing markets to China and to propose the best measures and solutions to react to this rapidly chan-ging environment. The methodology used for this study is a mixed method including qualitative and quantitative rese-arch and the study was conducted through a questionnaire over a sample of over 300 different companies currently sourcing from China.
We wish you a stimulating and rewarding read, and every success in your sourcing activities in China.
Stephan E. WilligensVice President Supply Chain Managementmsg systems ag
PrefaceStephan E. Willigens

6
Acknowledgments
On behalf of the initiators of this study I would like to thank the supply chain team at the msg group of companies, the TU Berlin, China Consulting and iTraining for their active participation and support. This study would not have been possible without them. We would like to specifically thank Barbara Bickel, Julia Kohlmorgen, Ananth Revankar, Raquel Elda Gonzalez, Jens Palacios, Bastian Müller, Reinhard Hill and Federico Avellan Borgmeyer for their support. In addition, we would also like to thank the procurement decision makers who actively participated in the study and discussed the future of ‘Sourcing in China’ with us through relevant social networks, workshops and interviews.
Stephan E. WilligensVice President Supply Chain msg systems ag
Company Information
© msg systems ag, Ismaning/Munich, 2015All rights, including translation into foreign languages, reserved. No parts of this work may be reproduced in any way, shape or form without the express written consent of the publisher, nor may any parts hereof be processed, reproduced or shared in electronic form.
Published by: msg systems agAuthors: Barbara Bickel, Julia KohlmorgenResearch partners: Technical University of Berlin, China Business Consulting Ltd., i-Training Asia Ltd.Design, layout and graphics: msg systems agEditing: msg systems agCover Image: shutterstock

7
8
11
14
17
37
39
41
Table of Contents
Key Findings and TrendsSuppliers and QualityCostsStrategyCompany Information
Insights on China’s Economic Situation and its Repercussion on Global Sourcing
Methodology and SamplePhase 1: Content Analysis and Literature Review Phase 2: Survey LaunchPhase 3: Survey Analysis and ReportContent and Focus of the Study
Results and Outcomes of the SurveySuppliers and QualityCostsStrategyCompany Information
Conclusion
Research Partner
References

8
Suppliers and Quality
Companies show a clear preference to source components and / or parts from China rather than finished goods that would need no further handling. Among the problems associated with sourcing in China, quality issues remain the major concern.
Some of the most important facts and trends concerning suppliers and qua-lity are:
• Electronic, electrical and mechanical products account for the majority of industry products being sourced from China (over 50 percent).
• Companies prefer to have a pool of strategic suppliers from which they can choose according to availability and product specification. The majority of participating companies in the survey (40 percent) indicate the presence of 10-50 strategic sourcing suppliers.
• According to the respondents companies prefer to only place up to 25 percent of their suppliers into one country to avoid dependencies but still take advantage of cost benefits and synergy effects. Almost 75 percent of companies have a small but steady percentage of their global suppliers based in China. China is thereby part of a mix but not the dominant country.
• Over 70 percent of the companies use KPIs to measure their suppliers’ performance to allow transparency and evaluation. The top classifications used to measure performance are quality and supplier reliability that both have a direct impact on costs.
• Almost half of the companies report no change in lead time over the past three years while sourcing from China. Only 9 percent achieved a positive change and managed to decrease their timings. 43 percent of respondents believe that lead times have increased over the past few years.
• The percentage of defaults has either increased since companies have moved their sourcing activities to China or has remained unchanged. Impro-vement is rare.
• 95 percent of companies that are sourcing from China face some kind of quality issue. The majority of that is related to production and / or the quality of raw materials being used. Since moving into China the amount of defects has been increasing.
• To ensure supply companies utilize various measures without dominant preference. Alternative suppliers are being used from within China as well as developed countries.
• The majority of measurements in regard to sustainability such as audits, assessments and spot checks have already been taken by companies. Only supplier awards and workshops are not too popular just yet.
• China’s top challenges confirm previous findings in regard to quality and cost control. The importance of sustainability has increased significantly in previous years.
Key Findings and Trends

9
Key Findings and Trends
Costs
Low-cost advantages of the Chinese market remain the main incentive for companies to source from China. Main facts and trends are:
• Companies continue to expect low cost advantages in China. Although other requirements such as sustainability, social issues or risk-mitigation capa-bilities are increasingly discussed in the media, cost pressure remains the ultimate criterion for companies to source in China.
• The grand majority of companies do not only consider China to be as attrac-tive as a sourcing country as three years ago but even regard China as being more attractive than ever. The negative consequences of some of the econo-mic changes of the past few years did not outweigh China’s dominance and its competitive advantage.
• To meet changing market conditions companies engage in dual and multip-le sourcing strategies (“second source”) but also in greater engagement and control in regard to the Chinese market.
• Apart from labor costs the main areas that companies work on in order to reduce costs include the technology that deals with the work process, the sourcing strategy and the materials.
• Even though labor costs constitute an important factor, companies see the highest potential for cost reduction in improving their production efficiency by further investing in manufacturing processes such as lean management, six sigma and quality improvement.
Strategy
China will remain a key part of the sourcing mix but the significance of other emerging markets such as Eastern European and Southeast Asian countries will grow. Main facts and trends are:
• Companies expect savings that are achieved through sourcing from China neither to decrease nor increase very much but rather steady themselves in a range of 10-20 percent.
• Products that are being sourced in high quantities are mainly used for manufacturing and / or sales outside of China to take full advantage of the economies of scale.
• The risk of supply guarantee is regarded with the greatest concern among all potential risk factors. This is why alternative suppliers are being used. Organizational risks are seen to have a rather minor effect on procurement activities in China.
• The vast majority of companies take advantage of a supplier mix which im-plicates suppliers in China but also suppliers in other markets in developed and / or emerging countries.
• Southeast Asia proves to be the most attractive alternative sourcing market for companies which are sourcing in China right now. Countries which will be considered in the next few years include Vietnam, Thailand, Indonesia, Cambodia, Myanmar and Laos but not Malaysia or the Philippines.
• Countries that will receive less consideration in the future according to the survey results include most of the Central European countries such as Slovenia, Slovakia, Poland, Czech Republic, Hungary, Serbia and Croatia.
• Currently important alternative sourcing countries in Eastern Europe such as Turkey and Romania will be considered less frequently for sourcing activities in the future while the standing of less dominant markets such as Macedonia, Montenegro, Bosnia and Albania is expected to increase.
• Considering the BRIC(S) debate, it is noteworthy that neither Brazil nor South Africa are considered to be alternative markets while the importance of Pakistan, India and Bangladesh is continuously rising. The United States of America and Mexico will also lose importance in the future.

10
Company Information
Most of the companies that participated in the survey report that they have been sourcing from China for more than 10 years and that they prefer to do so through in-house forces such as International Purchasing Offices (IPO’s).
Main facts and trends:
• Almost 50 percent of the companies report that they control all the compa-ny related operations from a corporate office located somewhere in Europe.
• The majority of the company representatives, who took the survey, can be described as decision makers who are working in departments directly connected to sourcing activities.
• The medium sized companies of an average employee base of 5,000 emplo-yees that operate mostly in the production industry have been in the lead in taking the survey as also envisioned upfront.
• Also according to their global procurement volume most companies fall into the category of medium size. The procurement volume for China amounts for 50 percent to more than USD 50 million.
• More than half of the companies surveyed report that they have used China for sourcing activities for more than 10 years. Only 12 percent discovered the market just recently.
• Most of the companies rely on in-house procurement managers preferab-ly located in an own IPO somewhere in China (35 percent of participating companies). Alternative organizational set-ups such as procurement offices located in the companies headquarter or at the Chinese manufacturing site, third-party service provider or local dealer are used little.
• The vast majority of participating companies that is working through an IPO is trusting on an IPO directly located inside of China instead of using an IPO located in another Asian country.
• IPO’s are relying on local manpower for operational tasks but are managed and lead by 1-3 expatriates. For 2017 the relation of locals vs. expatriates is broadly to be expected 10:1.
• In IPOs most of the disciplinary issues are managed by the local manage-ment whereas there is a corporate communication in case of technical discrepancies.
• IPOs in China will be able to exercise more control in the upcoming years due to an increasing procurement volume to manage.
• The two most common legal set-ups for IPO’s are either using an existing subsidiary or setting up a WFOE (Wholly Foreign-Owned Enterprise).
• IPOs in China perform various tasks and are responsible for most opera-tional issues at location such as supplier development, supplier search, supplier negotiation and supplier management but also benchmarking and cost analysis. Their presence close to one of the suppliers thereby plays a crucial role in exercising control.
Key Findings and Trends

11
Insights on China’s Economic Situation and its Repercussion on Global Sourcing
China initiated its industrialization process in the early 1950s, after the establishment of the People’s Republic in October 1949; but its economic proliferation really started after 1978. Before 1978, China had a standard GDP growth rate of 3 percent a year; similar to the growth rate in the United States, however starting from more challenging conditions. From 1978 on, the Chine-se GDP speeded up exceeding a 9 percent average real growth rate per year (Chow G., 2004). Figure 1 shows the Chinese GDP average yearly growth rate from 1979 to 2013. The average level thereby proves to be continuously high.
In 1979, China promoted foreign trade and investment and implemented free market reforms turning it into one of the world’s fastest-growing economies. China has recently emerged as a leading global economic and trade power. It is today the world’s second-largest economy, largest trading economy, largest holder of foreign exchange reserves, largest manufacturer and second largest
destination of foreign direct investment (FDI) (Morrison, 2014). Figure 2 shows the largest recipients of global foreign direct investment in billions of US dollars.
In the year 2008, the global economic crisis had a high impact on China’s eco-nomy. Imports, exports, and FDI inflows decreased, consequently the Chinese GDP growth stalled, and unemployment increased. As a measure to counter-act this negative impact, the Chinese government geared up a USD 586 billion economic incentive program to promote domestic consumption by loosening monetary policies to increase bank lending. This program helped to prevent a demand recession for Chinese products and the potentially resulting negative or idle economic growth. During this period of time until year 2011, the Chine-se GDP grew at an average of 9.6 percent; but in the past two years economic growth has slowed down to 7.7 percent as shown in Figure 1 (Morrison, 2014).
0
2
4
6
8
10
12
14
16
1 | Chinese Real GDP Growth (Percent): 1979-2013 (Source: Morrison, 2014)
19791981
19831985
19871989
19911993
19951997
19992001
20032005
20072009
20112013
7,6 7,9
5,3
9
10,9
15,2
13,5
8,9
11,6 11,3
4,1
9,2
14,2 13,913,1
10,910
9,3
7,8 7,68,4 8,3
9,110 10,1
11,3
12,7
14,2
9,6 9,210,4
9,2
7,7 7,7
3,8

12
As the Chinese economy evolves, its economic growth is somewhat stagnating with recent growth rates beneath the past decade. The repercussion of growth decline on labor markets has so far been relatively small due to the changes of economic activity into labor-intensive service sectors; as drivers of economic growth keep shifting from manufacturing to services on the supply side and from investment to consumption on the demand side, and as actions to curb the rapid aggregation of credit were implemented (The World Bank, 2014).
China is no longer simply a low cost country but a sourcing region with first-class infrastructure, a highly skilled workforce and high-end technology in regards to a lot of industry sectors. Wage levels in China have risen increa-singly during the past decades as the economy expands and the private
sector creates new business and employment opportunities. Figure 3 shows the development of China’s average yearly wages over the past decade.The cost of manufacturing in China is constantly increasing and this is di-recting companies to search for alternative sources of supply, particularly if they are producing low-priced goods such as garments. Popular destinations for those companies are countries in Southeast Asia; usually specializing in one single product. Globalization has given the opportunity for companies to explore cost arbitrage around the world; the low cost countries phenomenon induces foreign direct investment flows away from developed to developing countries offering more attractive cost advantage. Although average labor cost is surely lower in these low cost countries, it is very important to take into account many other factors when selecting another sourcing destination.
Insights on China’s Economic Situation and its Repercussion on Global Sourcing
2 | Largest Recipients of GLOBAL FDI Inflows in 2013 (Source: Morrison, 2014)
UK
Singapore
Brazil
Canada
Hong Kong
BVI (British Virgin Island)
Russia
China
United States of America
0 20 40 60 80 100 120 140 160 180

13
0
10
20
30
40
50
60
Insights on China’s Economic Situation and its Repercussion on Global Sourcing
Wage levels in China increased continually over the last two decades as the economy has developed and the private sector has created new employment opportunities. However, disparities among geographic regions, industrial sectors and employment levels have also increased significantly, widening on the one hand the rich-poor gap but also allowing China to still offer rather low cost labor that can compete with other low cost countries. Costs of land in these regions appear to have similar conditions (Cuñat, 2014).
Even though China is shifting to become a more expensive sourcing country, it still offers many other advantages other low cost countries do not have. Among these advantages are the vast availability of natural resources, world class infrastructure and supply channels, good quality products, high skilled
labor and the ease of doing business. Low cost countries might present some issues such as skilled workforce deficit, lack of infrastructure and geopolitical instability among others (Cuñat, 2014).
China might not be convenient for all business opportunities, but it is still playing a major role when formulizing most global supply chain strategies. China’s continuous development has created the adequate competitive conditions to appeal to companies around the world. In order to counter the increasing production costs, Chinese companies are currently focusing on optimizing the value chain to enhance productivity and efficiency and to keep its position as a leading world-class manufacturer (Yue, 2010).
3 | China Average Yearly Wages in RMB (Source: Trading Economics, 2014)
60000
50000
40000
30000
20000
10000
0
16024
Jan 05 Jan 06 Jan 07 Jan 08 Jan 09 Jan 10 Jan 11 Jan 12 Jan 13 Jan 14
1836421001
24932
2922932736
37147
4245246769
51474

14
The project was completed as a close cooperation of four research partners of whom two are located in China: msg systems ag, Technical University of Berlin, China Business Consulting Ltd. and i-Training Asia Ltd.
Phase 1: Content Analysis and Literature Review
The methodology used for this project consists of two phases. First, an ana-lytical review of the literature was conveyed to provide the academic support for the research, pursuing an evidence-based approach. Second, the applica-tion of an interview divided into four different dimensions: service and quality, costs, strategy and type of company. These dimensions were developed in order to obtain relevant data covering all major issues and features compa-nies frequently encounter when sourcing in China.
The investigation uses a mixed method combining quantitative and qualitati-ve research. Qualitative Research is basically exploratory research. It is used to develop concepts to understand fundamental reasons, characteristics and motivations, by using a specific set of research methods such as in-depth interviews, focus group discussion, observation, content analysis and visual methods among others. This study uses open questions that were partially answered through personal interviews to allow the results to have the inten-ded depth.
Quantitative research refers to the systematic empirical investigation using statistical or numerical data. It is a research strategy that asserts quantifica-tion by the collection and analysis of numerical data showing the relationship between theory and research, in which the purpose is the testing of hypothe-sis. Most questions of this survey were presented online and answered in this quantitative approach.
Methodology and Sample

15
Phase 2: Survey Launch
The survey targeted mid-size companies across major global regions, in an effort to obtain a representative sample of organizations. As shown in Figure 4 a wide diversity of responses from Western and Eastern Europe, United States of America and Southeast Asia was obtained.
Almost 50 percent of respondents were from manufacturing industries, with 10 percent focusing on construction hardware and 5 percent on IT. The sizes of the companies surveyed are shown in Figure 5. The location of the majority of participants indicates that international sourcing decisions mostly are made out of the headquarters. In regards to company size either the smaller or the larger medium size corporations show more activity when it comes to sourcing in China.
Figure 6 illustrates the sample of participants which is widely spread across industries in an effort to obtain a diverse point of view. Yet dominant players remain in manufacturing industry. Core industries represented in the survey are all linked to products that require production activities in one way or the other. Above all the survey represents the automotive industry’s dominant interest in the Chinese market.
0% 5% 10% 15% 20% 25%
4 | Countries Represented in the Survey
5 | Size of Companies Represented (No. of Employees Worldwide) 6 | Industry Sectors Represented
Germany
Switzerland
Hong Kong and China
USA
Turkey
Japan
Others
Less than 250
250 to 1000
1000 to 5000
5000 to 20000
more than 20000
Automotive
Industrial Machinery
Manufacturing
Construction Hardware
Others
IT
Retail Distribution
14%
33%
21%
4%
16%42%
17%
24%
19%
14%
14%
14%
10%
5%
14%
12%
10%
8%
9%
Methodology and Sample

16
Phase 3: Survey Analysis and Report
The last phase of the study concluded with the analysis of the results and a final report of the study. In the remainder of the report, we describe the major trends and strategies identified in the analysis.
Content and Focus of the Study
To present a holistic overview of business activities taking place in China the study is broadly structured into four major categories that cover different angles as seen in Figure 7.
7 | Focus Areas of the Study
Methodology and Sample
• Materials being sourced • Global countries • Strategic sourcing suppliers • KPIs to measure supplier
performance • Quality problems
• Cost reduction potential • Important cost drivers • Changing market conditions • Important risks in sourcing
• Percentage of savings since concentrating on China
• Relocation strategy • Alternative markets • Percentage of sourced goods
• Headquarters • Number of employees • Global procurement value • Organizational setup • IPO – International Procurement
Office
Suppliers & Quality
Status quo Evaluation Business Case Long-term Orientation Background Information
Costs Strategy Company Information
17
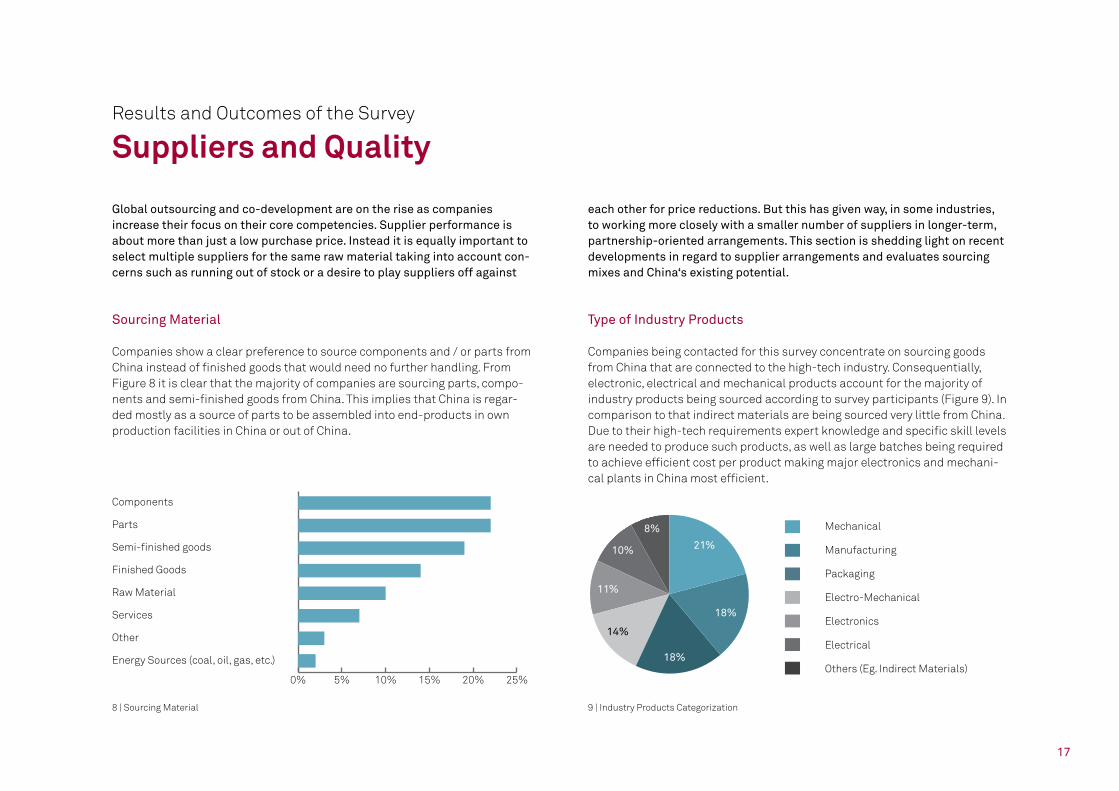
Sourcing Material
Companies show a clear preference to source components and / or parts from China instead of finished goods that would need no further handling. From Figure 8 it is clear that the majority of companies are sourcing parts, compo-nents and semi-finished goods from China. This implies that China is regar-ded mostly as a source of parts to be assembled into end-products in own production facilities in China or out of China.
Type of Industry Products
Companies being contacted for this survey concentrate on sourcing goods from China that are connected to the high-tech industry. Consequentially, electronic, electrical and mechanical products account for the majority of industry products being sourced according to survey participants (Figure 9). In comparison to that indirect materials are being sourced very little from China. Due to their high-tech requirements expert knowledge and specific skill levels are needed to produce such products, as well as large batches being required to achieve efficient cost per product making major electronics and mechani-cal plants in China most efficient.
Results and Outcomes of the Survey
Suppliers and Quality
8 | Sourcing Material 9 | Industry Products Categorization
Global outsourcing and co-development are on the rise as companies increase their focus on their core competencies. Supplier performance is about more than just a low purchase price. Instead it is equally important to select multiple suppliers for the same raw material taking into account con-cerns such as running out of stock or a desire to play suppliers off against
each other for price reductions. But this has given way, in some industries, to working more closely with a smaller number of suppliers in longer-term, partnership-oriented arrangements. This section is shedding light on recent developments in regard to supplier arrangements and evaluates sourcing mixes and China‘s existing potential.
Components
Parts
Semi-finished goods
Finished Goods
Raw Material
Services
Other
Energy Sources (coal, oil, gas, etc.)
Mechanical
Manufacturing
Packaging
Electro-Mechanical
Electronics
Electrical
Others (Eg. Indirect Materials)
21%
18%
18%
11%
10%
8%
14%
0% 5% 10% 15% 20% 25%

18
0% 10% 20% 30% 40% 50% 60% 70% 80%
Strategic Sourcing Suppliers in China
The majority of participating companies (40 percent) in the survey indicate the presence of 10 to 50 strategic sourcing suppliers in China (Figure 10). Ano-ther 30 percent work with 1 to 5 suppliers and another 25 percent with 5 to 10 strategic sourcing suppliers. This indicates that companies prefer to have a pool of strategic suppliers from which they can choose according to availa-bility and product specification. Being closer to the market through supplier contacts makes it easy to keep up with new developments and allows to build up more trust worthy relationships. Only a very small minority is working with 50 or more strategic sourcing suppliers as complexity presumably increases with a larger number of suppliers to manage.
Global Suppliers in China
Most of the companies surveyed (71 percent) only have up to 25 percent of their suppliers based in China. They prefer a small but steady percentage where China is part of the mix but not the dominant country (Figure 11). Pla-cing such an amount of suppliers into one country allows cost benefits and synergy effects without dependencies. By avoiding too much concentration companies thereby mitigate their risks through the greater diversification of their global sourcing outreach.
Results and Outcomes of the Survey – Suppliers and Quality
0%
5%
10%
15%
20%
25%
30%
35%
40%
45%
10 | Strategic Sourcing Suppliers 11 | Global Suppliers in China
30%
5%25%
14%
40%10%
5%71%
75% and more Suppliers
50% to 75% of Suppliers
25% to 50% of Suppliers
0% to 25% of Suppliers
1 to 5 5 to 10 10 to 50 50 and more

19
KPIs – Supplier Performance
Over 70 percent of the companies use KPIs to measure their suppliers’ performance to allow transparency and evaluation. Most suppliers remain under close supervision and control of their buyers. This indicates that buyers closely monitor and manage performance.
The main purpose of KPIs is to:
• Measure the supplier’s performance and improvement. • Manage supplier improvement efforts as per your expectations
and requirements. • Strengthen and improve supplier relations. • Develop suppliers.
All KPIs can be broadly arranged according to six main categories. Quality and supplier reliability related KPIs are the most dominant as seen in Figure 13.
The work on quality and delivery related issues require major care as both have a direct impact on costs and overall supply chain performance. Over 50 percent of the participating companies provide special consideration to these areas and regularly evaluate the performance here.
0% 10% 20% 30% 40% 50% 60% 70% 80% 0% 5% 10% 15% 20% 25% 30%
Results and Outcomes of the Survey – Suppliers and Quality
12 | KPIs to Measure Supplier Performance 13 | KPIs Categorization
10%
26%
10%
17%
9%29%
71%
11%
10%
7%
Not yet / in planning
Currently not
Sometimes
Yes, regularly
Quality
Delivery
Non conformity
Others
Costs
Supplay chain

20
Degree of Change in Lead Time
Almost half of the companies report no change in lead time of their Chinese suppliers over the past three years (Figure 14). Only 9 percent achieved a posi-tive change and managed to decrease their timings.
Consequentially, more than 90 percent of surveyed companies observe that lead times have not been changing or that there is an increase in lead time. To a significant level the change was even stated to have largely increased to over a month.
Claim-free goods
The percentage of defects has either increased since companies have moved their sourcing activities to China or has remained unchanged (Figure 15). Improvement seems to be the exception.
Moving sourcing activities to China had an increasing effect on defective products for almost half of the companies. Only a small share of companies stated that they felt their products arrived in a better quality compared to conditions before moving into China. This very well explains why the KPIs focusing on quality have also been ranked so highly. Quality in China still remains a significant focus of attention and its current level allows a great enough range for improvement.
14 | Lead Time Statistics 15 | Percentage of Claim-free Goods since Sourcing from China Compared to the Time before Sourcing from China
Results and Outcomes of the Survey – Suppliers and Quality
0% 10% 20% 30% 40% 50% 60% 0% 5% 10% 15% 20% 25% 30% 35% 40% 45% 50%
48%
41%
30%
9%45%
13%14%
Lead times have decreased
Unchanged
Moderate increase in lead time (up to 30 days)
Large increase in lead time (more than 30 days)
We experience more default in our goods than before.
We have the same percentage of default as before.
We have more claim-free goods since moving our sourcing activities to China.

21
Since moving into China the condition of products has either not been chan-ging at all or has improved. Only a minority of companies state a decrease in quality as observed in Figure 16. While sourcing from China the situation did not change in most cases. One third of the companies experience more claim-free products, implying that they were successful in managing their suppliers’ quality.
Nature of Quality Related Issues
95 percent of companies that are sourcing from China face some kind of quality issue. The majority of that is related to production which accounts for almost half of the problems (Figure 17). This implies that the majority of issu-es are directly connected to the product quality and shows that it is crucial to manage quality closely at an early stage before and during production.
Nevertheless, there is also a cluster of three non-production topics that have an impact on quality. Most dominant are thereby quality problems being cau-sed by raw material and / or transportation. Especially transportation related issues, counting for over a quarter of all issues, show a great potential for improvement as this is an area that can be influenced directly by the company and should hence not be ignored. In general, KPIs focusing on quality have been widely installed already and provide a first beneficial step to improve and further control product quality issues.
16 | Percentage of Claim-free Delivered Goods while Sourcing from China 17 | Quality Issues Categorization
Results and Outcomes of the Survey – Suppliers and Quality
0% 10% 20% 30% 40% 50% 60% 0% 5% 10% 15% 20% 25% 30% 35% 40% 45% 50%
50%
20%
15%44%
35%
17%
12%
5%
2%
We experience more defect in our goods today than when we started sourcing from China.
We have the same percentage of defect all along.
We have more claim-free products today than when we started sourcing from China.
Quality issues related to production
Quality of raw materials
Quality issues related to transport
Quality issues related to the number of units
No quality issues
Other

22
Risk Management to Ensure Supply
To ensure supply companies utilize the usual measures without dominant preference. However, choosing an alternative supplier from an emerging mar-ket appears to be less beneficial.
From Figure 18 it can be clearly observed that most companies already use buf-fer stocks but also alternative suppliers from developed markets and / or China. This option has apparently been exploited to the extent of 75 percent already. The use of further alternative suppliers from other emerging markets is also al-ready being exploited by 63 percent of survey participants although the degree of further unknown costs and risks that cannot be anticipated in advance is a little higher in those markets which makes companies slightly more cautious. Companies remain in China but additionally explore alternative markets.
Supplier Awareness towards Sustainability
The majority of measures in regard to sustainability have already been taken by companies (Figure 19). Only supplier awards and workshops are not too popular. All companies participating in the survey work with audits in order to measure sustainability. Spot checks, assessments and training also take place in the sustainability program of most companies with the aim to guide and support their suppliers in that topic. Supplier awards and workshops are still less implemented and will get more attention in the future.
18 | Measures to Ensure Supply 19 | Supplier Awareness Categorization
Results and Outcomes of the Survey – Suppliers and Quality
0% 10% 20% 30% 40% 50% 60% 70% 80% 90%100% 0% 20% 40% 60% 80% 100% 120%
75%
86%
25%
14%
63%42%
100%
37%58%
75%
46%
78%25%
54%
22%
78%82%
22%18%Buffer stocks / increase of
inventory
Alternative 2nd source supplier from developed market country
Alternative 2nd source supplier from an emerging market country
Alternative 2nd source supplier from China
Spot Checks
Assessment beyond certification
Audits
Supplier Awards
Workshop
Training
Already taken Already takenPlanning to take / not to take at all Planning to take

23
Sourcing Challenges
China’s top challenges confirm previous findings in regard to quality and cost control. Improved quality thereby has a direct impact on saving costs and hence companies mainly regard both challenges accumulated. The importan-ce of sustainability has increased significantly in previous years (Figure 20). Other differences such as language and culture also play a role and count as difficult to manage.
20 | Sourcing Challenges Categorization
Results and Outcomes of the Survey – Suppliers and Quality
0% 5% 10% 15% 20% 25%
13%
10%
10%
7%
17%
23%
17%
3%
Quality related
Cost control
Others (Eg. Culture, Flexibility)
Substainability
Raw materials volatility
Government policy
Demand fluctuations
Delivery rate

24
Why Source from China?
Low cost advantages of the Chinese market are the major factor leading com-panies to source in China (Figure 21). More than 80 percent of the companies surveyed indicated cost advantages.
• Cost pressure seems to remain the ultimate criterion for companies that are sourcing from China.
• Raw material costs also play a major role and go along with the pressure of competition.
• Sourcing in China helps to access lucrative markets and investment options in the region.
• The growth of the Chinese market and the potential that comes along with it play a rather minor role.
Attractiveness of Sourcing from China
The most successful companies source globally in order to achieve cost bene-fits and synergy effects. The resources are obtained irrespective of the location, wherever they are available in sufficient quantity, at the required quality and at the optimum price. Against this background, China remains to be as attractive as a sourcing country as it was three years ago in spite of the economic changes that have happened in China (Figure 22). Only 13 percent of firms are not satisfied with the situation in China and regard the market as unattractive. This confirms China’s consistent importance as a sourcing country and the fact that China is not neglected but still holds on to its dominant role in the global supply mix.
0%
20%
40%
60%
21 | Reasons for Sourcing from China 22 | Attractiveness of Sourcing from China
Results and Outcomes of the Survey
Costs
The shift to a global economy is driven by a desire to access lower labor costs, but exposes organizations to higher transportation costs which are in turn driving a dramatic impact on where companies source, where they pro-duce, and the complexity of processes required in delivering the products to the customer. As organizations grow and sell to more customers in more re-
gions, complexity is rising. New global customers present a lucrative target, but there are considerable costs inherent in serving these customers. This section focuses on the significance of costs, cost advantages and measures taken by companies that source globally.
Cost pressure of global competition
51%
31%
16%
2%
Product and raw material
cost reduction
To facilitate access to the
Chinese market ( from sales perspective)
Increase capacity / market growth
0% 10% 20% 30% 40% 50% 60%
13%
52%
13%
22%
Not attractive
As attractive as it was before
Moderately attractive
Very attractive
25
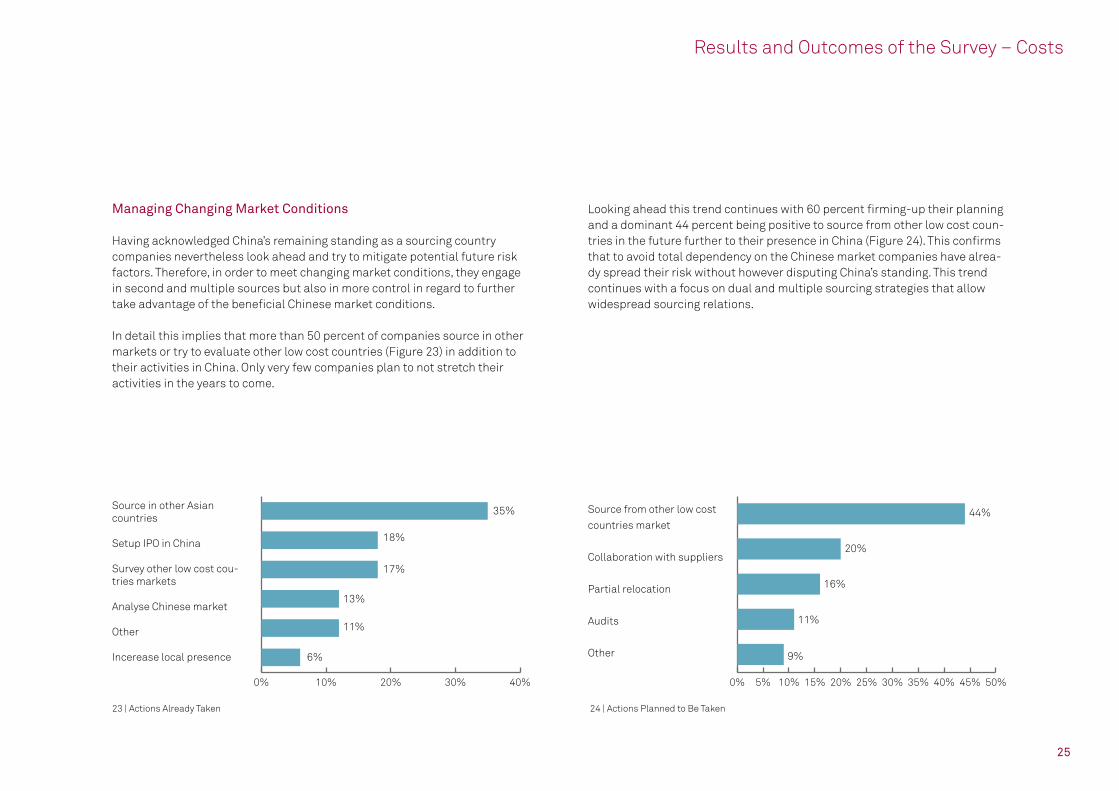
Managing Changing Market Conditions
Having acknowledged China’s remaining standing as a sourcing country companies nevertheless look ahead and try to mitigate potential future risk factors. Therefore, in order to meet changing market conditions, they engage in second and multiple sources but also in more control in regard to further take advantage of the beneficial Chinese market conditions.
In detail this implies that more than 50 percent of companies source in other markets or try to evaluate other low cost countries (Figure 23) in addition to their activities in China. Only very few companies plan to not stretch their activities in the years to come.
Looking ahead this trend continues with 60 percent firming-up their planning and a dominant 44 percent being positive to source from other low cost coun-tries in the future further to their presence in China (Figure 24). This confirms that to avoid total dependency on the Chinese market companies have alrea-dy spread their risk without however disputing China’s standing. This trend continues with a focus on dual and multiple sourcing strategies that allow widespread sourcing relations.
23 | Actions Already Taken 24 | Actions Planned to Be Taken
Results and Outcomes of the Survey – Costs
0% 10% 20% 30% 40% 0% 5% 10% 15% 20% 25% 30% 35% 40% 45% 50%
13%
11%11%
18%20%
17%16%
35% 44%
6% 9%
Source in other Asian countries
Setup IPO in China
Survey other low cost cou-tries markets
Analyse Chinese market
Other
Incerease local presence
Source from other low cost
countries market
Collaboration with suppliers
Partial relocation
Audits
Other

26
Potential Areas of Cost Reduction
Main areas that companies work on to reduce additional costs include manufac-turing technology, the strategy and the materials (Figure 25). The potential areas for cost reduction can be mainly divided into six categories; the dominant ones are technology and strategy. Companies see the highest potential for cost reduc-tion in improving their efficiency at location by further investing in manufacturing processes such as lean management, six sigma and quality improvement.
Also, they constantly work on their sourcing strategy and consider other suppliers, locations or other means of how to approach the market. Further materials or the way of sourcing are being analyzed and questions such as the product state when leaving China or the use of alternative parts are under consideration.
Cost Drivers Affecting Procurement Activities
Companies need to identify the cost factors which contribute significantly to overall cost to ensure effective cost management. Labor costs still play a dominant role for companies sourcing from China followed by the importance of materials and parts and the costs to ensure quality (Figure 26).
25 | Cost Reduction Potential Areas 26 | Cost Drivers Affecting Procurement Activities
Results and Outcomes of the Survey – Costs
0% 5% 10% 15% 20% 25% 30% 35% 0% 20% 40% 60% 80% 100% 120%
21%
27% 50% 23%
14%
18% 59% 23%
11%
9% 50% 41%
21% 26% 53%
29%
24% 47% 29%
13%
10% 45% 45%
67% 33%
39% 13%
12%
48%
Technology
Strategy
Materials
Other
State of the art components
Manufacturing process
Cost of components and parts
Cost of raw materials
Cost to meet product quality
Customs and taxes
Energy cost
Labor cost
Transporting cost
Warehouseing cost
Extremely Important Important Less Important

27
Results and Outcomes of the Survey
Strategy
Savings Achieved through Sourcing from China
Companies do not expect savings that are achieved through sourcing from China to change very much in the upcoming three years. Instead average savings in the range of 10-20 percent are anticipated to steady themselves meaning a slight increase while very little (0-10 percent range) or very high savings of 20-30 percent range are estimated to be achieved rather less frequently by 2017.
Whereas today 1/5 of companies achieve cost savings of 20 percent or more, this number will be half in 2017. Only 5 percent of the companies that today achieve savings of 0-10 percent expect to realize higher savings in the future. In general higher savings than 20 percent will not be expected and the overall dominance lies within 10-20 percent.
Destination of Sourced Goods
According to the survey participants companies that source a high quantity of the same product from China mainly need it for activities outside of the country. The economies of scale play a major role. If the volume is low the pro-duct is mostly used within China to feed into the Chinese market. This state of things will have to remain under careful surveillance as the spending power of the Chinese population evolves.
Relocation Plans of Companies
The vast majority of companies does not plan to move their entire sourcing activities to other countries but is instead planning on relocating parts while at the same time further using China as a sourcing country. This does not eliminate the desire to mitigate risk by using multiple sources and suppliers from other countries additionally in the future. Hence only partial relocations are of interest in the mid and long term.
0%
20%
40%
60%
27 | Savings Achieved by Sourcing in China
A “Strategy” refers to an organization’s intended plans to mitigate, respond, or react to a change / trend. The success of a strategy must be measured to ensure that it did in fact effectively address the challenge it was designed to meet. A supply chain strategy involves making decisions: How do you distribute? Do you distribute into your own warehouse structure or another?
And how many distributors do you select for the territory? Organizations are recognizing that they need to identify partners who can optimize and under-stand local legislation and conditions to effectively navigate this increa-singly complex set of decisions.
50%
45% 45%
30%
20%
10%
Today 2014
0%-10% 10%-20% 20%-30%
Expected 2017

28
70 percent of companies do currently not see the need to move their sourcing locations within China but are happy to remain with their current location in China. If other sourcing sites are considered all of them receive similar attenti-on while Dalian / Shanghai on the East Coast appear slightly more interesting.
Risks of Sourcing from China
The vast majority (70 percent) of companies is mostly concerned about insufficient guaranteed supply (Figure 30). Other risks considered important are transportation (47 percent) and the country risk of China (42 percent) which includes political components and volatility. The risk of processes and the procurement organization receive less attention and are regarded as less critical. The risk of insufficient quality is in this context considered to be an in-tegral part of ’lacking supply guarantee’ as quality problems impact sufficient supply in a manner that should not be underestimated.
29 | Relocating Sourcing activities within China 30 | Risks of Sourcing from China
Results and Outcomes of the Survey – Strategy
28 | Relocating Sourcing activities
Yes, we are planning to move out of China completely in the upcoming years.
Yes, we are planning to reduce our activities in China.
We are not sure yet and are currently evaluating alternative countries.
No, we currently have no plans to move out of China.
4%
13%
79%
4%
0% 10% 20% 30% 40% 50% 60% 70% 80%
8%
10%
70%
12%
No, sourcing offices will
remain the same.
Smaller cities in Guangdong
Foshan
Dalian and Shanghai
0% 20% 40% 60% 80% 100% 120%
27% 33% 40%
16% 37% 47%
47% 27% 26%
16% 39% 45%
42%
16%
32%
33%
26%
51%
11% 39% 50%
44% 29%
15% 15%70%
27%
Compliance risk and risk of governance
Country risk
Geopolitical risk
Process risk
Procurement organisation
Risk of financial market
Risk of supply guarantee
Risk of transportation
Selling market risk
Very Important Important Less Important

29
Alternative Sourcing Markets
For this study a total of four regions were considered as potential alterna-tive sourcing markets in addition to the operations that remain in China: Southeast Asia, Central Europe, Eastern Europe and Other Countries.
Southeast Asia
Amongst the various Southeast Asian countries, Vietnam is going to be the most preferred alternative country (Figure 31). In the future countries such as Thailand, Indonesia and Cambodia are also going to be on the rise. All of them are accounted to offer low cost labor but also a relatively established infra-structure which allows sourcing to be potentially efficient.
Central Europe
A lot of countries in Central Europe that are still being exploited as sourcing mar-kets will lose importance in the future. The Asian markets remain in the focus.
0% 2% 4% 6% 8% 10% 12% 14% 16% 0% 1% 2% 3% 4% 5% 6% 7% 8%
31 | Alternative Sourcing Market - Southeast Asia 32 | Alternative Sourcing Market – Central Europe
Results and Outcomes of the Survey – Strategy
Thailand
Vietnam
Myanmar
Laos
Indonesia
Cambodia
Philippines
Malaysia
Slovenia
Slovakia
Serbia
Poland
Hungary
Czech Republic
Croatia
Con
side
red
in 2
017
Not
con
side
red
in 2
017
Not
con
side
red
in 2
017
Today 2014
Today 2014
Expected 2017
Expected 2017

30
Eastern Europe
Current important sourcing countries in Eastern Europe such as Turkey and Romania will be considered less frequently for sourcing in the future while the standing of less dominant markets such as Macedonia and Montenegro is expected to increase.
Other Countries
Bearing in mind the BRIC(S), it is interesting to note that neither Brazil nor South Africa are considered alternative markets while the importance of Pakistan, India and Bangladesh is rising. The United States of America will also not receive the expected increase of attention according to the respondents of the survey.
33 | Alternative Sourcing Market – Eastern Europe 34 | Alternative Sourcing Market – Other Countries
Results and Outcomes of the Survey – Strategy
0% 1% 2% 3% 4% 5% 6% 7% 8%
Montenegro
Macedonia
Bosnia
Albania
Turkey
Romania
Bulgaria
Con
side
red
in 2
017
Not
con
side
red
in 2
017
Today 2014 Expected 2017
0% 2% 4% 6% 8% 10% 12% 14%
Pakistan
India
Bangladesh
United States of America
Mexico
South Africa
Brazil
Con
side
red
in 2
017
Not
con
side
red
in 2
017
Today 2014 Expected 2017

31
Results and Outcomes of the Survey
Company Information
Company‘s Headquarters
Almost 50 percent of the companies report that they control all the compa-ny related operations from a corporate office located somewhere in Europe (Figure 35). Also, the majority of participants indicate international sourcing decisions mostly to be made out of their headquarters in Europe.
Participants’ Responsibilities and Job Titles
The majority of survey participants is in the position to actively take decisions while working in departments that are directly connected to the function of sourcing.
The majority of participants are based within the DACH region in Europe (Deutschland / Germany – Austria – Switzerland). Other markets represented include China, Hong Kong, USA, Turkey and Japan.
35 | Headquarters Locations
This section deals with the information pertaining to International Procu-rement Office (IPO), global procurement volumes, organizational setup and other details of the company.
36 | Location of Participants
0% 5% 10% 15% 20% 25% 30% 35%
13%
10%
9%
5%
14%
33%
16%
Germany
Switzerland
Others
Hong Kong and China
USA
Turkey
Japan
Germany
Switzerland
Hong Kong and China
USA
Turkey
Japan
Others14%
33%
12%
10%
8%
9%
14%

32
The majority of participants are in one way or the other linked to purchasing functions or supply chain management. Only 30 percent of the survey partici-pants are related to operations and / or sales.
Over 90 percent of the survey participants were decision makers in their com-pany (acting at least on a manager level) with 14 percent holding the position of Chief Executive Officer (CEO). This allows the conclusion that the results of the survey can be based on profound insights.
Industry Sector and Company Size
Most respondents operate in the production industry. In regard to company size the medium sized companies with an average employee base of 5,000 emplo-yees represent the majority of participants (Figure 41).
Amongst the various industries, the automotive industry is holding on to its dominant interest in the Chinese market as is reflected in a fairly high number of respondents (Figure 39). Further industrial machinery, manufacturing and construction hardware are represented.
37 | Responsibilities of Participants
Results and Outcomes of the Survey – Company Information
38 | Job Titles of Participants 39 | Industry Sector Categorization 40 | Number of Employees
0% 10% 20% 30% 40%
27%
18%
12%
5%
38%Procurement
Supply Chain Managmenet
Operations
Sales
Others
Purchasing Manager 30%
CPO 17%
Head of Global Procu-rement 17%
CEO 14%Others
7%
Senior VP/Director 15%
Retail Distribution
IT
Others
Construction Hardware
Manufacturing
Industrial Machinery
Automotive
Less than 250
250 to 1000
1000 to 5000
5000 to 20000
more than 2000
10%
5%21%
14% 4%
14%16%
14%
42%19%
24%17%

33
Procurement Volume of Participating Companies
The majority of the participating companies can be categorized as medium sized according to their global procurement volume with half of the companies having a spend of more than USD 50 million in China (Figure 41 and 42).
Duration of Sourcing Activities in China
More than half of the companies surveyed report that they have used China for sourcing activities for more than 10 years. Only 12 percent entered the market just recently (Figure 43). One third of companies have been sourcing from China for 10–14 years and another quarter even more than 15 years.
43 | Duration of Sourcing in China
Results and Outcomes of the Survey – Company Information
41 | Global Procurement Volume
42 | Global Procurement Volume in China
Less than USD 1 billion
USD 1 to 5 billion
More than USD 5 billion
Less than USD 1 million
USD 1 to 50 million
More than USD 50 million
60%
35%
30%
50%
10%
15%
0%
5%
10%
15%
20%
25%
30%
35%
12%
29%
34%
25%
1 to 3 years ago 4 to 9 years ago 10 to 14 years ago Over 15 years ago
34
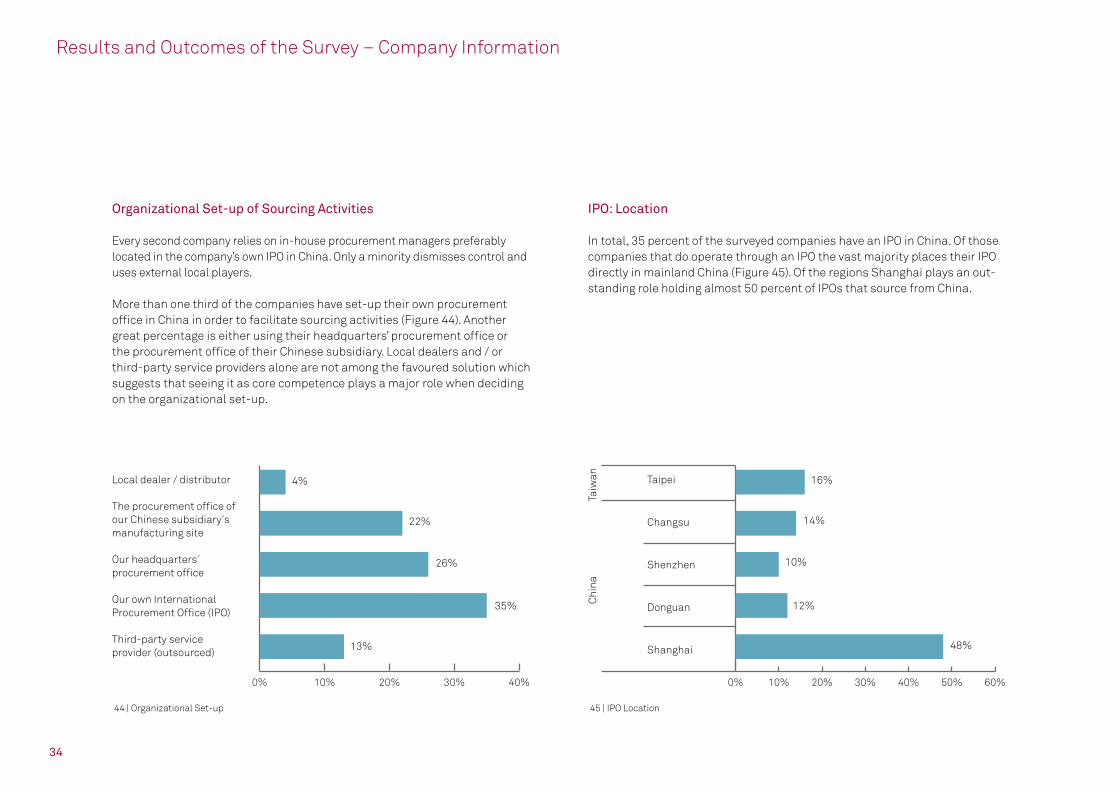
Organizational Set-up of Sourcing Activities
Every second company relies on in-house procurement managers preferably located in the company’s own IPO in China. Only a minority dismisses control and uses external local players.
More than one third of the companies have set-up their own procurement office in China in order to facilitate sourcing activities (Figure 44). Another great percentage is either using their headquarters’ procurement office or the procurement office of their Chinese subsidiary. Local dealers and / or third-party service providers alone are not among the favoured solution which suggests that seeing it as core competence plays a major role when deciding on the organizational set-up.
IPO: Location
In total, 35 percent of the surveyed companies have an IPO in China. Of those companies that do operate through an IPO the vast majority places their IPO directly in mainland China (Figure 45). Of the regions Shanghai plays an out-standing role holding almost 50 percent of IPOs that source from China.
44 | Organizational Set-up 45 | IPO Location
Results and Outcomes of the Survey – Company Information
0% 10% 20% 30% 40% 0% 10% 20% 30% 40% 50% 60%
22% 14%
26% 10%
35% 12%
13% 48%
4% 16%Local dealer / distributor
The procurement office of our Chinese subsidiary´s manufacturing site
Our headquarters´ procurement office
Our own International Procurement Office (IPO)
Third-party service provider (outsourced)
Taipei
Changsu
Shenzhen
Donguan
Shanghai
Chi
naTa
iwan

35
IPO: HR Structure
The organizational structure of IPOs in China is focused on local manpower for operational matters and expatriates in regard to management tasks. For 2017 the relation is expected to be 10:1 as IPO’s are growing in general while the share of expatriates in comparison to local employees is decreasing.
IPO: Reporting Structure
The leadership of IPO’s is exercised in two separate streams. Most of the disciplinary issues are managed by the local management whereas there is a centralized communication in case of technical discrepancies.
IPO: Procurement Volume
IPOs in China will have to manage an increasing procurement volume in the upcoming years.
Most companies expect an increase of the procurement volume managed by their IPOs (Figure 48). Most common set-ups managing their IPO are existing subsidiaries or a WFOE (Wholly Foreign-Owned Enterprise – Figure 49). Not very popular on the other hand are Representative offices, which have limited possibilities and are very often only allowed to act on behalf and account of their headquarters.
46| Local Employees at the IPO
47 | Expatriates at the IPO 48 | Procurement Volume managed at IPO
Results and Outcomes of the Survey – Company Information
60 to 80
40 to 60
20 to 40
0 to 20
> 3
1 to 3
0
More than USD 50 million
USD 25 -50 million
USD 15-25 million
USD 1-15 million
0% 20% 40% 60% 80%
0% 20% 40% 60% 80% 0% 20% 40% 60% 80% 100%
Today 2014
Today 2014 Today 2014
Expected 2017
Expected 2017 Expected 2017

36
0% 2% 4% 6% 8% 10% 12% 14%
IPO: Task List
IPOs in China perform several tasks and are responsible for most operational issues at location. Taking care of everything related to suppliers is key (Figure 50). IPOs concentrate on various tasks such as supplier development / search / nego-tiation / management but also quality and cost control. In general it can be said that tasks to be carried out by local IPOs are very much focused on managing the operations in China in all aspects.
50 | Tasks carried out by the IPO
Results and Outcomes of the Survey – Company Information
49 | Legal form of IPO
Part of an existing subsidiary
Representative office
WFOE (wholly foreign-owned enterprise)14%
42% 44%
Supplier search
Supplier development
Supplier management onsite at supplier´s site
Supplier selection / negotiation
Quality assurance / trouble shooting
Benchmarking
Cost analysis / cost engineering
Purchasing orders
Logistics (transport of goods, customs, etc)
Technology / product scouting
8%
6%
6%
9%
9%
11%
13%
13%
13%
13%
37
Conclusion
This study outlines clearly the dilemma for companies who are already sour-cing in China or plan to move toward it. While the size of the Chinese market and the development of it still is very interesting (for both sourcing and sel-ling) sourcing risks and alternatives are growing not only in Asia.
This means there is no single answer how to handle and manage a company’s value sourcing activities for direct and indirect materials. Companies need to evaluate and align their sourcing decisions taken into consideration their global strategy, sourcing market developments and risks as well as “real” total costs of ownership.
It is far away from stating that China is no longer an interesting and competi-tive sourcing market but no longer the only serious option. This circumstance has to be imbedded into companies’ evaluation processes.
Looking into the future the importance of the Chinese B2B and B2C market will continuously grow and therefore the flow of goods and materials to and from China will increase. This will have significant impact on the costs of logistics and sustainable aspects (GRI 4) which are becoming more important in the western world increasing the complexity of decision making. In this light sourcing has become (if it is not already) a key element of the value chain of companies. The alignment of sales and sourcing strategy leading to a global or at least regional approach and the trends known as Industry 4.0 require a holistic view on sourcing.
Therefore 4 steps are key to land on the company’s sourcing strategy
1. Align your sourcing strategy with the all over company strategy2. Assure the positive impact of it on the end to end value chain of the
company (costs, quality, risks)3. Base your decision on a “real” total cost of ownership evaluation 4. Keep flexibility and ensure responsiveness to market changes


39
msg is an independent, international group of companies with more than 5,000 employees around the world. The group of companies offers a holistic service spectrum of creative, strategic consulting and intelligent, sustainable and value-added IT solutions for the following industries: automotive, financi-al services, food, insurance, life science & healthcare, public sector, telecom-munications & media, travel & logistics as well as utilities and has acquired an excellent reputation as an industry specialist during its more than 30 years in business.
Within the group, independent companies cover the wide variety of industry and issue-based competence: msg systems ag forms the core of the company group and works in close cooperation with the subsidiaries, both on a busi-ness and organizational level. This allows the competence, experience and know-how of all the members to be bundled into a holistic solution portfolio with measurable added value for its customers.
msg holds seventh place in the ranking of IT consulting and system integration companies in Germany.
Technical University of Berlin: The Department Assembly Technology and Factory Management of the Technische Universität Berlin gets its bearing for research and development from industrial and technological tasks. In doing so it is preeminent to exploit potentials for economization resulting from the manifold interactions between product, operating material and organization of facilities and their peripherals as well as the consistent implementation of innovative technology and form of organization. Research activities in the field of sustainable manufacturing and its international dissemination are core research activities of the department seeking to contribute towards global value creation.
Research Partners

40
China Business Consulting Ltd.: China Business Consulting is an indepen-dent consulting company based in China with headquarters in Beijing.
The mission of China Business Consulting is to make sure your interest are protected at any time and you will be spared a China shock when setting up and running your business in China!
China Business Consulting offers high quality and cost effective business services for foreign invested Small-/Medium Enterprises (SME) and major corporations in China. The service scope covers everything from market entry, incorporation, transformation, turnaround and divestment to classical busi-ness consulting in the fields of corporate organization, business processes, business development, marketing, sales and supply chain solutions. China Business Consulting distinguishes from most other consulting companies by its entrepreneurial background and extensive practical experiences behind the „Chinese Curtain“, acquired from projects provided to Chinese corpora-tions in China and abroad.
China Business Consulting is your competent partner to help you understand your Chinese operations and assist you to achieve your business objectives in China.
i-Training Asia Ltd.: i-Training Asia, a subsidiary of i-Training Europe, aims to be Asia’s premier one-stop shop for training services and equipment. We provide proven, cutting-edge training equipment, tools, systems, methodolo-gies and certifications by global training professionals to the Asian market. Our aim is to assist public and private organizations in sustaining and further boosting growth and competitiveness in the entire APAC region.
i-Training is the partner of choice for every quality-minded professional trainer, training organization, academy, university, conference & congress organization, trade show, business hotel, sales-, marketing-, HR- and R&D department or executive boardroom. We can assist in any, or every, aspect of corporate, public or individual training, from planning or running complete training courses, helping you set up and execute your own training schemes, moderating meetings and negotiations, TTT and general consulting, to provi-ding top-quality German-made training software and equipment, including online live-training packages, flipcharts, markers, pin boards etc.
Research Partners

41
References
• Bielaz, Brown, Muldowney, Partida and Williams Erin. “Supplier Category Management DRIVING VALUE THROUGH THE PROCUREMENT ORGANIZATI-ON”. APQC (2012). Print
• Brannen, Julia. Mixing Methods: Qualitative and Quantitative Research. Aldershot: Avebury, 1992. Print.
• „China GDP Growth Rate.“ TRADING ECONOMICS. N.p., n.d. Web. 16 June 2014. <http://www.tradingeconomics.com/china/gdp-growth>.
• „China Economic Update.“ The World Bank (2014): 31. 1 June 2014. Web. 12 July 2014.
• Chow, Gregory C. „Economic Reform and Growth in China.“ ANNALS OF ECO-NOMICS AND FINANCE 5 (2004): 127–152. Print.
• Christopher, Jia, Khan, Mena, Palmer and Sandberg Erick. “Global Sourcing and Logistics: Logistics Policy project number - LP 0507”. Cranfield School of Management (2007). Print
• Cook, Thomas A. “Global sourcing logistics how to manage risk and gain competitive advantage in a worldwide marketplace”. New York, N.Y.: AMA-COM (2007). Print.
• Cuñat, Javier. „China’s Transformation: Implications for Global Supply Chains.“ The China Analyst. The Beijing Axis, 1 Sept. 2013. Web. 10 June 2014. <http://www.thebeijingaxis.com/tca/editions/the-china-analyst-sept-2013/203-chinas-transformation-implications-for-global-supply-chains>.
• Errasti, Ander. “Global production networks operations design and manage-ment”. 2nd ed. Boca Raton, FL: CRC Press (2013). Print.
• Fang, Olsson, Sporrong Josefin. “Sourcing in China: The Swedish Experien-ce”. Stockholm University School of Business (2004). Print
• “Global Sourcing”. Morrison & Foerster LLP (2010). Print
• Goh, Wang, Gan, Li and Yu Zahnfu. „China 2015: Transportation and Logistic Strategies“. ATKEARNEY (2010). Print
• Hemerling Jim and Lee David. “Sourcing from China: Lessons from the Lea-ders”. Boston Consulting Group (2007). Print
• „Is China Trade becoming Less or More Expensive for Your Business?.“ Accounts Receivable Financing. N.p., n.d. Web. 13 June 2014. <http://www.invoicefactoringus.com/is-china-trade-imports-more-expensive/>.
• Kayser, Albrech, Billings, and Ruske, Klaus- Dieter. „Sourcing and logistics in China: Costs, processes and strategies of German companies procuring in the Chinese market”. PricewaterhouseCoopers (2008). Print
• Kitagawa, Hironobu. “The Procurement Activities of Japanese Companies in Asian Countries”. Institute of Developing Economies (2008). Print
• Liwen, Liu. “Logistics Sourcing Strategies in Supply Chain Design”. The Josai Journal of Business Administration (2007), Vol. 4, No.1, 11-19. Print.
• Mayer, Jörg. “Global Rebalancing: Effects on trade flows and employment”. United Nations (2010). Print
• Mauldin, John. „China Has The Potential To Become A Real Economic Pro-blem.“ Business Insider. Business Insider, Inc, 1 June 2014. Web. 13 June 2014. <http://www.businessinsider.com/looking-at-the-middle-kingdon-with-fresh-eyes-2014-6>.

42
• Mohamad, M.N, Julien, D.J. and Kay, J.M. „A Framework to Improve Sourcing Strategy Implementation“. The 11th Asia Pacific Industrial Engineering and Management Systems Conference (2010). Print
• Morrison, Wayne M. „China’s Economic Rise: History, Trends, Challenges, and Implications for the United States.“ Congressional Research Service 9 July 2014. Print.
• Platts Ken and Ninghua Song. “The true costs of overseas sourcing”, Institu-te for Manufacturing (2009). Print
• Rendon, Rene G. “Commodity Sourcing Strategies: Processes, Best Practices, and Defense Initiatives”. Journal of contract management (2005). Print
• •Taylor Colin and Leng Stephen. “Integrated Capabilities for Global Sourcing and Import Logistics in the Retail Industry – A Smarter Strategy”. IBM Global Business Services (2009). Print
• “The Supply Chain Risks of Global Sourcing”. LCP Consulting (2009). Print • Weinberg, Darin. Qualitative Research Methods. Malden, MA: Blackwell,
2002. Print.
• Wolf- Rodda Howard A. and Mitterhoff Daniel J. “International Procurement”. University of Maryland (2012). Print
• Yu Carrie, “Global Sourcing: Shifting Strategies”. PricewaterhouseCoopers (2008). Print.
• Yue, Pan. „Moving up the Value Chain: Upgrading China’s Manufacturing Sector.“Iisd2010 (2010). Www.iid.org. Web. 25 July 2014. <http://www.iisd.org/pdf/2010/sts_3_moving_up_the_value_chain.pdf>.
References


msg systems agRobert-Buerkle-Strasse 1 | 85737 Ismaning/MunichTelephone: +49 89 96101-0 | Fax: +49 89 96101-1113 www.msg-systems.com | [email protected]
.consulting .solutions .partnership
H-0
41-1
505-
1


