66
The potential of electricity storage in Belgium Dr. Kristof De Vos – KU Leuven & EnergyVille Prof. Johan Driesen and Tom Brijs

The potential of electricity storage in Belgium
Dr. Kristof De Vos – KU Leuven & EnergyVille
Prof. Johan Driesen and Tom Brijs

211/11/2015

311/11/2015
Power system revolution

411/11/2015
Scope and objective
Introduction
• Definition
• Applications
• Need
Technical aspects
• Technologies
• Belgian projects
• Worldwide projects
Economic aspects
• Cost structure
• Remuneration
• Business case
Regulatory aspects
• Regulatory barriers
• Administrativebarriers
Objective - Insight in the potential role of storage in the Belgian electricity system
Outcome: SWOT analysis of selected technologiesPolicy Recommendations
Variability of RenewableEnergy Sources:
wind and photovoltaics
Need for flexibility: power plants, demandresponse and storage
European electricitysystem:
interconnectedtransmission grid and
market integration
CONTEXT

PART I.
Introduction

611/11/2015
The growing share of variable generation
De Vos, 2014
Table 1: Installed capacity (GW) and annual electricity generation (TWh) of wind and PV in selected European countries by the end of 2013 (based on data published by ENTSO-E 2015)
wind solar (mostly PV3)
[GW] [TWh]penetration [%]
[GW] [TWh]penetration [%]
mean1 max2 mean1 max2
Germany 33,1 50,8 9,16 101,85 35,9 31 5,59 110,46
Belgium 1,7 3,6 4,18 27,87 2,7 2,4 2,78 44,26
France 8,2 15,9 3,21 27,70 4,4 4,7 0,95 14,86
Denmark 4,8 11 33,95 436,36 0 0 0,00 0,00
Portugal 4,4 11,7 23,78 125,71 0,3 0,4 0,81 8,57
Spain 22,8 54,7 20,89 133,33 6,9 12,8 4,89 40,35
Ireland 1,8 4,5 17,31 105,88 0 0 0,00 0,00
Italy 8,5 14,8 4,69 44,50 18,4 21,2 6,71 96,341 average electric energy penetration: annual electricity generation in terms of total consumption; 2 max penetration: installed capacity in terms of minimum consumption; 3 solar in Spain includes 2.3 GW Concentrated Solar Power (CSP)

711/11/2015
The system need for flexibility
Real-time balance of generation and load is a prerequisite for a stable frequency level
Deviations from nominal frequency results in system failures, and eventually a system black out
Up to now, variable demand has always been covered by flexible power plants
Generation adapts to loadFlexible gas-fired power plants
Increasing penetration of variable renewable generation
Replacing controllable by variable supplyPeriods with excess or shortage energyPrediction errors
NEED FOR ADDITIONAL AND ALTERNATIVE MEANS FOR FLEXIBILITY!

811/11/2015
The system need for flexibility
Need for storage is to be seen in broader context
Technology and cost evolutions of storage
Evolutions competing technologies
Power system evolution (supergrid versus smartgrid)
FLEXIBLE TECHNOLOGIESFACILITATORSSYSTEM IMBALANCES
conventional and renewable
generators
(CCGT, OCGT,wind,…)
storage
(pumped-hydro storage,
CAES,...)
demand-side management
(industry, residential,…)
Transmission &
Interconnections
Market Design
Equipment Outages
Demand Variations
RES-E Variations
De Vos, 2013

911/11/2015
Electricity storage: definition
A. Use of electrical energyB. Capacity (power rating, MW)C. Efficiency, energy loss
A. Any form of energye.g. thermal, kinetic, chemical,…
B. Energy buffer (MWh)
A. Generation of electrical energyB. Capacity (power rating, MW)C. Efficiency, energy loss

1011/11/2015
Applications in a liberalized market

1111/11/2015
Quantification of the need for storage is a complex problem determined by different parameters
Integration of storage and flexibility in Generation Expansion Models (operations research)
Need for new software tools for determining future electricity market scenarios
Prediction errors RESPower plant constraintsNetwork constraintsNew technologies
Distribution levelStorage and demand-response
Quantification of system need for storage
Van Stiphout, De Vos, et al. 2015

PART II.
Storage technologies and their techno-economic characteristics

1311/11/2015
Technologies and technical characteristics
Mechanical
PHS
CAES
Flywheel
Chemical
P2G
Fuel cell
Electrical
SMES
Supercap
Electro-chemical
Battery
Flow battery
Thermal
Power Dischargetime
ResponseTime
Efficiency Lifetime Maturity
GW, MW, kW
m, d, h, min, sec
min, sec, ms
% year high, low
1411/11/2015
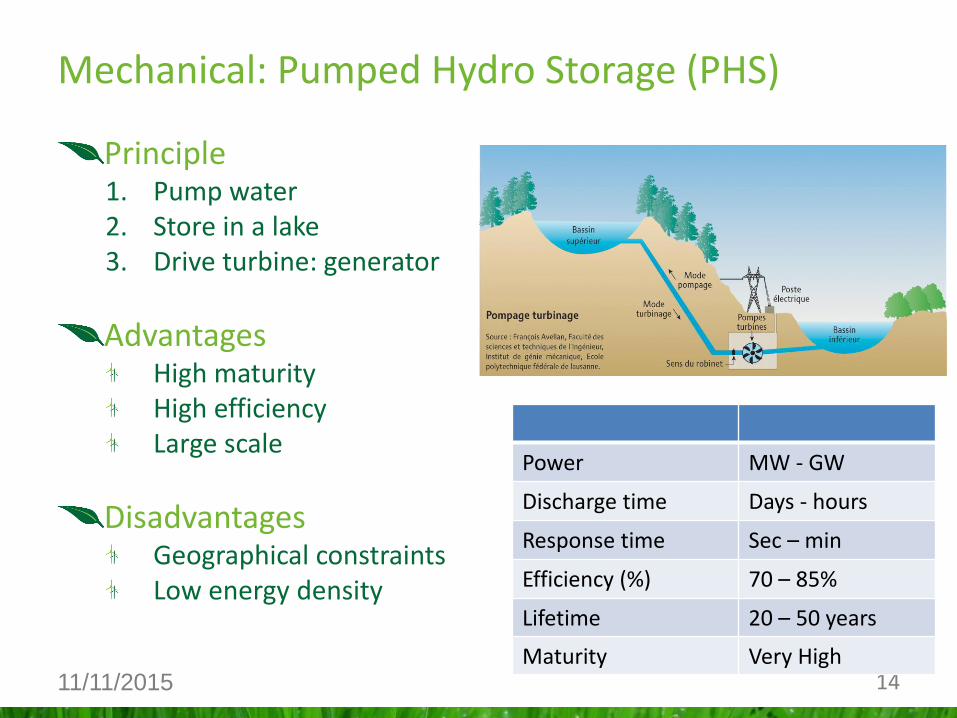
Principle1. Pump water 2. Store in a lake3. Drive turbine: generator
AdvantagesHigh maturityHigh efficiencyLarge scale
DisadvantagesGeographical constraintsLow energy density
Power MW - GW
Discharge time Days - hours
Response time Sec – min
Efficiency (%) 70 – 85%
Lifetime 20 – 50 years
Maturity Very High
Mechanical: Pumped Hydro Storage (PHS)

1511/11/2015
Belgian case studies
Coo-Trois-Ponts (Electrabel):*Gen. Capacity: 470 MW (Coo I)+ 690 MW (Coo II)*Energy buffer: 2,3 GWh (Coo I) + 2,7 GWh (Coo II)
Possible extention (study phase): Coo III*Gen. Capacity:600 MW *Energy buffer: 3 GWh
Plate Taille (Lampiris)*Gen. Capacity: 144 MW*Energy buffer: 0,8 GWh
iLand (study phase)*Gen. Capacity: 550 MW*Energy buffer: 2 GWh

1611/11/2015
Principle1. Compress air2. Store under pressure 3. Drive turbine (+gas): generatorNew: Adiabatic CAES
AdvantagesLarge scaleHigh maturity (diabatic)
DisadvantagesLow efficiencyGeographical constraintsComplementary infrastructure: gas turbine and gas network
Projects:Huntorf, DE (320 MW), McIntosh, USA (110 MW), Adiabatic Plant ADELE under construction 90 MW
Power MW - GW
Discharge time Days - hours
Response time min
Efficiency 40 – 70%
Lifetime 20 – 40 years
Maturity Very High
Mechanical: Compressed Air Energy Storage (CAES)

1711/11/2015
Principle1. Motor2. Kinetic energy3. Generator
AdvantagesHigh response time High power densityEfficiency
DisadvantagesEnergy densitySelf discharge
Projects: New York, 20 MW (frequency control), Offalay, IE under construction
Power kW - MW
Discharge time sec - min
Response time msec
Efficiency 75 – 88%
Lifetime 15 – 20 years
Maturity High
Mechanical: Flywheel
20 MW Plant, Hazle USA

1811/11/2015
Specht, M. et al. 2012
Principle1. H2O H2 + O2 and H2 + CO2 CH4
2. Store as gas (inject in gas network)3. ??? (open cycle)
AdvantagesUnlimited energy bufferIntegration with industrial processes
DisadvantagesLow maturity, low efficiencyComplementary infrastructure: gas or hydrogen network and gas turbines
Projects: Werlte, DE 6,3 MW (waste-biogas), Utsira, NO, 48 kW (excess RES)
Power kW - MW
Discharge time Weeks - months
Response time Sec - min
Efficiency 20 – 60%
Lifetime 5 – 30 years
Maturity Very low
Chemical :Power To Gas (P2G)

1911/11/2015
Principle1. ??? (open cycle)2. Store gas (gas network)3. H2 + O2 H2O and CH4 H20 + CO2
AdvantagesEnergy densityIntegration with industrial processes
DisadvantagesLow maturity, efficiencyComplementary infrastructure: gas, hydrogen network
Projects: South Windsor, US 200 KW, Lillo BE 1 MW Solvay (hydrogen recycling)
Power kW - MW
Discharge time hours
Response time Sec - min
Efficiency 50 – 70%
Lifetime 5 – 15 years
Maturity Low
Chemical: Fuel Cell
Specht, M. et al. 2012

2011/11/2015
PrincipleSMES: electrical storage based on magnetic induction and superconduction; SC: electric based on electric field in capacitor;
AdvantagesFast response timePower densityEfficiency
DisadvantagesEnergy density
Projects: Wisconsin, US 800 KW (network support); La Palma, ES 4 MW (network support)
Power kW - MW
Discharge time sec -min
Response time ms
Efficiency 90 – 97%
Lifetime 20 – 40 years
Maturity Average
Electrical: SMES and Supercaps
Specht, M. et al. 2012

2111/11/2015
Principleprocess based on flow of electrons between anode and cathode (electrolyte)
AdvantagesScalabilityEfficiency, Response timePower and energy density
DisadvantagesLifetime (cycles)Safety
Projects: Rokkasho, JP 34 MW (excess RES), West Meckleburg, DE (frequency control)
NaS, Li-Ion Flow
Power kW - MW kW - MW
Discharge time hours hours
Response time ms ms
Efficiency 75 – 85 %(NaS)80 – 95 %(Li-ion)
70-85%
Lifetime 10 – 20 years 5 – 20 years
Maturity High Average
Electro-chemical: Batteries and Flow-BatteriesBatterijen
Klassiek
Pb
Gel VRLA
AGM VRLA
Open cel
Ni
NiCd
NiMH
NiZn
Li
LiCoO2
LiMn2O4
LiFePO4
Li4Ti5O12
Metaal-lucht
Hoge temperatuur
NaS NaNiCl
Flow-type
PSB
VRB
ZnBr
CeZn

2211/11/2015
Principle1. Cooling: liquification of air2. Low pressure storage3. Pump to high pressure gas to drive turbine
AdvantagesIntegration of heat and cold from industrial processesEnergy density
DisadvantagesMaturityEfficiency
Projects: Scotland, 350 kW and upscale planned towards 5MW
Power kW - MW
Discharge time hours
Response time min
Efficiency 50 – 80 %
Lifetime 25 – 30 years
Maturity Low
Thermal: Liquid Air Energy Storage (LAES)
West Highland Power 2012

2311/11/2015
Cost of storageInstallation Cost Maintenance Cost Cycle Efficiency
w.r.t. Power w.r.t. Energy Cost Efficiency[€/kW] [€/kWh] [€/kW/year] [%]
MechanicPHS 400 - 5000 5 - 100 10 - 15 70 - 85CAES 400 - 1200 2 - 50 10 - 25 40 - 70Flywheel 100 - 300 1000 - 3500 20 - 30 75 - 88ChemicalP2G 550 - 1600 1 - 5 - 20 - 60Fuel Cell 5000 - 10000 5000 - 10000 - 50 - 70ElectricalSMES 200 - 400 1000 - 10000 10 - 25 90 - 97Supercapacitors 100 - 300 300 - 2000 10 - 15 93 - 97ElektrochemicNaS 1000 - 3000 300 - 500 10 - 50 75 - 85Li-ion 1200 - 4000 400 - 2000 20 - 60 80 - 95Flow battery 600 - 2500 150 - 1000 10 - 55 70 - 85ThermicLAES 900 - 1900 260 - 530 - 50 - 80
*Large margins due to low maturity of technologies (demonstration or pilot projects)
**Compared to: CCGT : 700 – 1200 €/kW ; Nuclear 3800 – 6000 €/kW
*

2411/11/2015
Maturity
Source: SBC Energy Institute Analysis
Low Inst. C. [€/kWh]High Efficiency
Low Inst. C. [€/kWh]Low Efficiency
High EfficiencyHigh Inst. C. (ec. o. scale)
Low Inst. Cost [€/kW]High Inst. Cost [€/kWh]High Efficiency

2511/11/2015
Transmission level
PHS largest potential for large-scale storage
Cost-efficiency ( CAES)
Geographical constraints
Flywheels, SMES and Supercaps for specific applications such as network stability
Distribution level
Batteries provide largest potential for distributed storage
Various applications
Economies of scale
P2G, LAES, Fuel Cell require further Research and Development
Conclusions on storage technologies

PART III.
Building a business case for storage

2711/11/2015
Applications in a liberalized market

2811/11/2015
Day-Ahead Market
Night: charge
Day: discharge
~Electricity demand
Decreasing day-night difference
Impact profitability
Corr. Expected RES
Energy services: arbitrage
0
10
20
30
40
50
60
70
80
1 2 3 4 5 6 7 8 9 10 11 12 13 14 15 16 17 18 19 20 21 22 23 24
Day
-Ah
ead
Pri
ce [
€]
Time [hour]
AverageSummer2010-2011
AverageWinter2010-2011
0
10
20
30
40
50
60
70
1 2 3 4 5 6 7 8 9 10 11 12 13 14 15 16 17 18 19 20 21 22 23 24
Day
-Ah
ead
Pri
ce [
€]
Time [hour]
AverageSummer2015
AverageWinter2014-2015
Data: Belpex
Data: Belpex

2911/11/2015
Merit Order Effect
Renewable Generation
Expected price volatility may change operation strategy
Expected Demand
Expected RES
Price forecasts
Negative Prices
Must Run
Base Load
RES support
Priority feed-in RES
BASE LOAD
MID LOAD
PEAK LOAD
PEAK LOAD
RES
Low Demand High Demand Low Demand High DemandP
Q
P
Q
SmoothedSupply Curve
BASE LOAD
MID LOAD
SmoothedSupply Curve
MUST-RUN
BASE LOADF
MID LOAD
PEAK LOAD
Low Demand High DemandP
QBASE LOADNF
MUST-RUN
MID LOAD
PEAK LOAD
Low Demand High Demand
QRES
P
RESDG RESDG
BASE LOADNF
BASE LOADF
De Vos, 2015

3011/11/2015
Negative Prices
June 15-16, 2013
Low demand (holiday)
High wind and PV
Market coupling
BE – FR - DE
Rare event (hours)
2015: 0
2014: 2
2013: 15
2012: 7
3111/11/2015
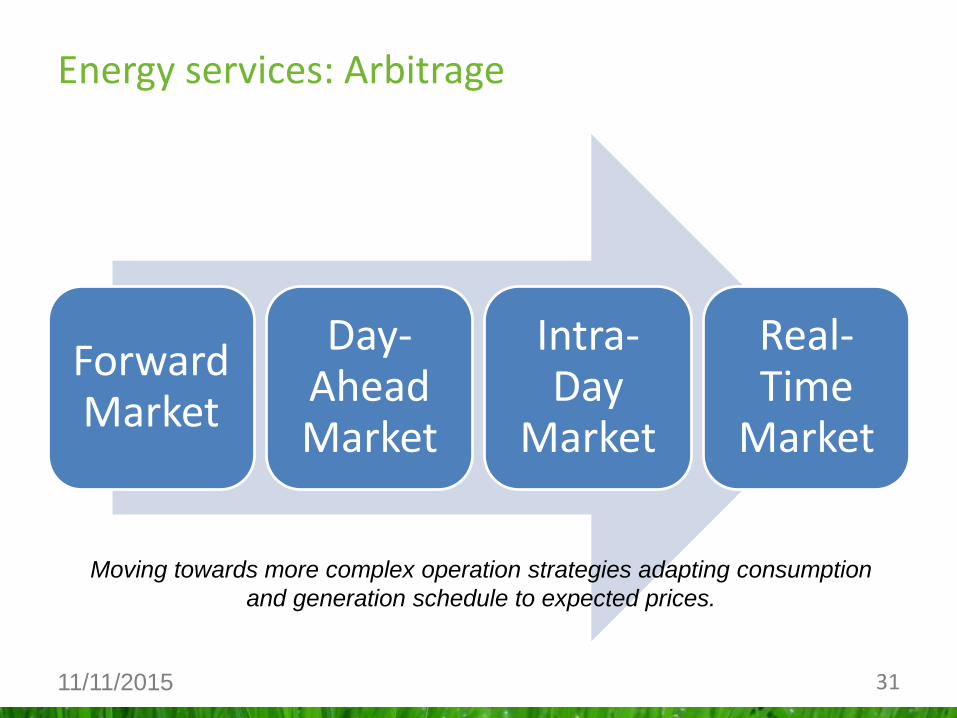
Energy services: Arbitrage
Forward Market
Day-AheadMarket
Intra-Day
Market
Real-Time
Market
Moving towards more complex operation strategies adapting consumption
and generation schedule to expected prices.

3211/11/2015
Long term
Portfolio investmentsDemand scenario
RES scenario
“Make or buy” decision
Optimize portfolio investments
E.g. avoid investment in gas-fired power plants to cover peak demand and renewable injection.
Medium term
Portfolio schedulingPredicted RES
Predicted demand
Availability power plants
Optimize generation schedule
E.g. avoid start-up of an expensive peak power plant
Energy services: portfolio management

3311/11/2015
Portfolio management: scheduling

3411/11/2015
Short term
real-time portfolio balancing
Prediction errors RES
Prediction errors demand
Unexpected outages
Optimize real-time portfolio balance
E.g. Avoid the start-up of peak power plant or imbalance price risk.
Energy services: portfolio management

3511/11/2015
Portfolio management: balancing

3611/11/2015
Energy services: portfolio management
MDPBRP pays TSO
IGCC
FREE BIDS
Acti
va
tio
n P
rice
Available reserve capacity
R2
R3
IGCC
R2FREE BIDS
R3TSO
SYSTEM
EXCESS SHORTAGE
BR
P
MDPTSO pays BRP
MIPTSO pays BRP
MIPBRP pays TSO
EX
CE
SS
SH
OR
TA
GE
-Imbalance
A positive upward activation price and negative downward activation price is translated into a positive settlement tariff (MIP and MDP). In case of a positive downward activation price, the settlement tariff is negative and money flows are reversed.

3711/11/2015
Increasing RES
Prediction errors
Increased need for reserve capacity
Decreasing conventional power
Business case for flexibility: storage
Portfolio managementMinimize imbalance volume
ArbitrageDirect market participation
Energy services: portfolio management

3811/11/2015
Interaction with tariff design
Net metering
Injection price and tariff
New price and tariff design
Time of Use
Capacity-based
Subsidy for storageE.g. Germany
Retail market: self-consumption
Bryan Ekus, 2013

3911/11/2015
Applications in a liberalized market

4011/11/2015
Operating Reserves 2015
R1 – Frequency Containment Reserve (94 MW)
R2 – Frequency Restoration Reserve (140 MW)
Free bids (not guaranteed)
R3 – Frequency Restoration Reserve (400 MW)
ICH Demand Curtailment (261 MW, only up)
R3 Dynamic profile (max. 100 MW, only up)
Act
ivat
ion
Ord
er
Inter TSO reserves (250 MW, not guaranteed)

4111/11/2015
International Cooperation: IGCC
Netting of cross-border imbalance
Germany, Belgium, The Netherlands
Not guaranteed

4211/11/2015
FCR – R1
Automatic and decentralized modulation of generation profile based on frequency deviations.
Very fast response (seconds)
Transmission level
Monthly Tender: Reservation price [€/MW]
Conventional power plants
Industrial demand and aggregators (asymmetric)
International providers
42

4311/11/2015
Automatic and central activation of reserve capacity based on Area Control Error
Fast response (sec to min)
Transmission level
Conventional power plantsMonthly tenders
Reservation price
Capped activation price
Free bids
Not guaranteed
Free activation price
FRRa – R2

4411/11/2015
FRRa, free bids
• Wind power curtailment to balance the grid
• Negative price bid windpower generators

4511/11/2015
FRRm – R3
Manual and central modulation of generation in order to relieve R2
Response (minutes)
Transmission and distribution level
Monthly Tender
reservation price [€/MW]
Activation price [€/MWh]
Technologies
Conventional power plants
Industrial demand (ICH) and aggreggators (R3DP)
Inter-TSO reserves45

4611/11/2015
Congestion Management (TSO)
Re-dispatch mechanismDay-ahead nominationsTSO load flow analysisRe-dispatch power plants
CIPU contractPower plants (bidding available capacity at cost)Merit order activation
Storage, if at right location, can provide congestion management services
G1= 2GW (wind)G2 = 1 GW (CCGT)
D1 = 1 GW
G3= 1 GW (CCGT)D2 = 3 GW
MAX 1,5 GW
-0,5 GW (CCGT)
+0,5 GW (CCGT)
-0,5 GW (charge storage)
+0,5 GW (discharge storage)

4711/11/2015
Voltage control (TSO)
Reactive powerBy-product of active powerNot useful, but line congestionImpact on voltage levelLocal balancing required
Voltage and reactive power controlTransmission assets (TSO)Power plants services (Generators)
Tenders with reservation and/or activation priceGrid code requirements for grid usersPotential service for large scale storageEx. Coo-Trois-Ponts

4811/11/2015
Congestion and Voltage Management (DSO)
New electric applicationsElectric vehicles and heat pumps
Increasing consumptionDemand response
Distributed generationPhotovoltaic and wind powerIncreasing injections
Trade-off: storage as an alternative for grid investmentsDistribution gridLocal: stand-alone batteries and electric vehicleNo market framework in place in BelgiumLinear project: Tariff based Incentive based

4911/11/2015
Black Start
After a large black out
TSO needs to gradually restart the system
Units with independent power supply
Electrical storage (e.g. Coo-Trois-Ponts)
Tendering procedure
Contracts for multiple years
Meet technical criteria (> 200 – 300 MW)
Fixed cost: additional investments and tests
Variable cost: opportunity cost

5011/11/2015
Applications in a liberalized market

5111/11/2015
Capacity Remuneration
Capacity Remuneration Mechanism
Instrument ensuring adequate level of generation capacity
Complementary mechanism besides the energy market influencing the volume and capacity through remuneration available capacity
Additional revenue streams valuing the installed capacity [€/MW]

5211/11/2015
Capacity remuneration mechanisms as complementary adaptation if existing markets fail to create adequate investment climate
Potential explanation:
Market design
Overcapacity
Market power
Energy policy
Capacity remuneration
Höschle, 2014

5311/11/2015
European Situation
Höschle, 2015

5411/11/2015
Capacity remuneration and storage
Strategic reserves in Belgium2014-2015
All production units for which closure is announced, and all units which are temporarily shut down (750 MW)
Demand response products (100 MW)
Day-ahead signal (warm up period), activation signal
2015-2016Additional 2750 MW
300-500 MW from power plants (2 years)
Additional capacity (1 year)
Downward revision if Doel 3 or Tihange 2 re-commissioned

5511/11/2015
Local reliability
Value of providing improved reliability
Back-up power sourceValue of lost loadAlternative to back-up generator Strategic infrastructure Industrial processes
Microgrid applicationsLocal generation with storageSpecific applications, e.g. remote areas (Princess Elisabeth Station)
Power management system
Princess Elisabeth Antarctica Research Station
Chet Lyons, 2014

5611/11/2015
Markets for Flexibility
DSOTSO BRP
DR Storage DGLarge ScaleFLEXIBILITY
Local MarketGlobal Market
Flexibility Users
Flexibility Providers
?
New services
New actors

5711/11/2015
Which technology and where to put it…
Reuster, 2012

5811/11/2015
Variety of applications in current electricity market
Energy and network services
Move away from classic applications such as day and night arbitrage
Mover towards operation strategies optimizing revenues over different markets
Economic aspects: building a feasible business case for storage

PART IV.
REGULATORY AND ADMINISTRATIVE BARRIERS

6011/11/2015
UnbundlingSpecific definition of storage is required generation or demandDetermine storage as market or regulated activity
Storage productsMarket framework should allow products and services which allow efficient operation of storage
Capacity Remuneration Mechanisms
Participation of storage in capacity remuneration mechanismsInteraction with electricity market
Regulatory and Administrative Barriers
Market Design
Network Tariffs
Framework Network Operators
Administrative andPolitical Barriers

6111/11/2015
Network tariff designInjection versus off-take
Impact on profitability storage
Harmonization
Distribution TariffsLack of a regulatory framework
Storage connected o the distribution level
Interaction with consumption and injection tariffs for local storage
Regulatory and Administrative Barriers
Market Design
Network Tariffs
Framework Network Operators
Administrative andPolitical Barriers

6211/11/2015
Remuneration Framework
Drives innovation of regulated parties (e.g. contracting system services from new technologies)
Cost-based and Performance-based remuneration do not incentivize innovation
Regulatory and Administrative Barriers
Market Design
Network Tariffs
Framework Network Operators
Administrative andPolitical Barriers

6311/11/2015
Permitting ProceduresImpacts project lead timeUncertainty
Energy PolicyStable regulatory and market framework such as network tariffs, levies and support mechanism.Stable electricity sector evolutions such as a consistent nuclear phase-out policy
Ensuring Stable RevenuesLong term contracts for network services reduce the investment risk but act as a potential entry barrier for competitors ( trend).
Regulatory and Administrative Barriers
Market Design
Network Tariffs
Framework Network Operators
Administrative andPolitical Barriers

6411/11/2015
Policy Recommendations
There is need for a quantitative study towards the need for flexibility on long, medium and short term. This requires an evolution of current methodologies.
A market and regulatory framework is a key element for the operation of electricity storage. This framework does preferably not discriminate between different providers of flexibility.

6511/11/2015
Policy Recommendations
PHS are, due to their maturity and large-scale, an interesting technology for providing flexibility to the transmission system level. A potential extension of the PHS capacity requires a detailed cost-benefit analysis.
Batteries provide, due to expected market evolutions, large potential for the distribution system level. Potential of distributed storage should be studied together with the evolution towards electrical vehicles and thermal storage.


