MARKET ANNOUNCEMENT Computershare Limited ABN 71 005 485 825 Yarra Falls, 452 Johnston Street Abbotsford Victoria 3067 Australia PO Box 103 Abbotsford Victoria 3067 Australia Telephone 61 3 9415 5000 Facsimile 61 3 9473 2500 www.computershare.com MARKET ANNOUNCEMENT Date: 19 April 2018 To: Australian Securities Exchange Subject: 2018 Investor Day Presentations Attached are the materials that are being presented to investors and analysts today at Computershare’s annual business briefing session. A copy of these materials will also be posted on the Computershare website (www.computershare.com). For further information contact: Michael Brown Investor Relations Ph +61 (0) 400 24 8080 [email protected]About Computershare Limited (CPU) Computershare (ASX: CPU) is a global market leader in transfer agency and share registration, employee equity plans, mortgage servicing, proxy solicitation and stakeholder communications. We also specialise in corporate trust, bankruptcy, class action and a range of other diversified financial and governance services. Founded in 1978, Computershare is renowned for its expertise in high integrity data management, high volume transaction processing and reconciliations, payments and stakeholder engagement. Many of the world’s leading organisations use us to streamline and maximise the value of relationships with their investors, employees, creditors and customers. Computershare is represented in all major financial markets and has over 16,000 employees worldwide. For more information, visit www.computershare.com
Transcript
MA
RK
ET A
NN
OU
NC
EMEN
T
Computershare Limited ABN 71 005 485 825
Yarra Falls, 452 Johnston Street Abbotsford Victoria 3067 Australia
Attached are the materials that are being presented to investors and analysts today at Computershare’s annual business briefing session. A copy of these materials will also be posted on the Computershare website (www.computershare.com). For further information contact: Michael Brown Investor Relations Ph +61 (0) 400 24 8080 [email protected]
About Computershare Limited (CPU) Computershare (ASX: CPU) is a global market leader in transfer agency and share registration, employee equity plans, mortgage servicing, proxy solicitation and stakeholder communications. We also specialise in corporate trust, bankruptcy, class action and a range of other diversified financial and governance services. Founded in 1978, Computershare is renowned for its expertise in high integrity data management, high volume transaction processing and reconciliations, payments and stakeholder engagement. Many of the world’s leading organisations use us to streamline and maximise the value of relationships with their investors, employees, creditors and customers. Computershare is represented in all major financial markets and has over 16,000 employees worldwide. For more information, visit www.computershare.com
Born 1980 or later Born 1966-80 Born 1948-65 Born 1947 or earlier
Home ownership rates increase from 15% to 45%
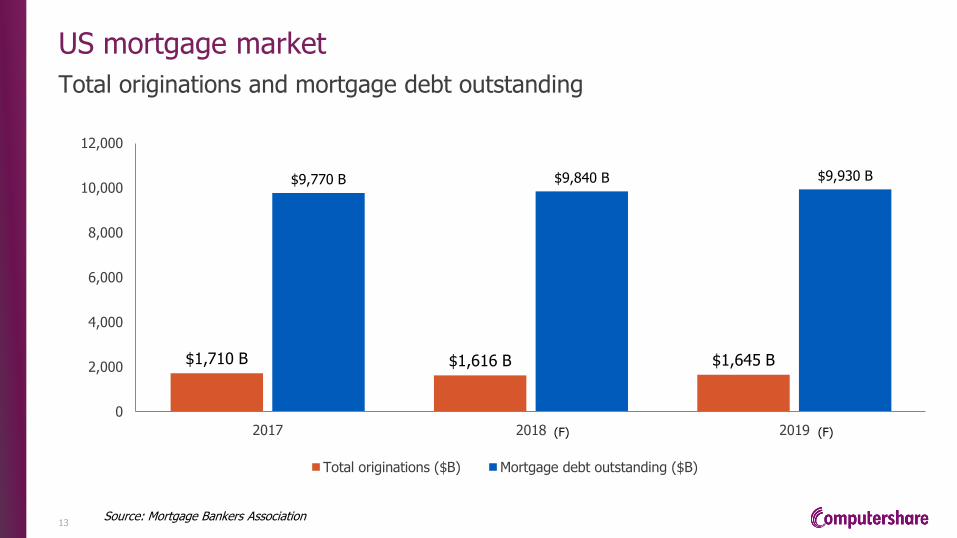
Demographic tailwinds support $1.6tn origination market
Rising population entering housing demand years
14
Source: U.S. Census Bureau
(Population Estimates & New Residential Construction), June 2016
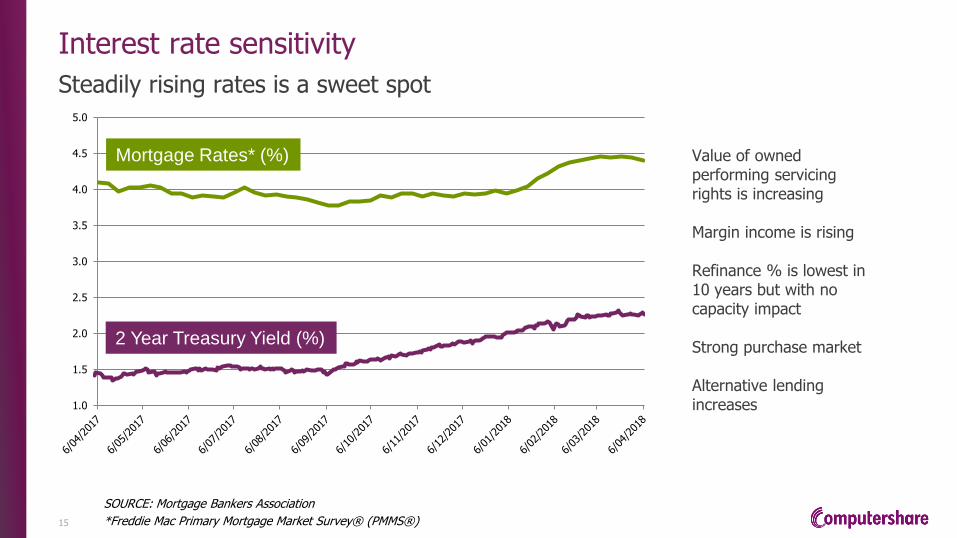
Interest rate sensitivity
Steadily rising rates is a sweet spot
Value of owned performing servicing rights is increasing Margin income is rising Refinance % is lowest in 10 years but with no capacity impact Strong purchase market Alternative lending increases
1.0
1.5
2.0
2.5
3.0
3.5
4.0
4.5
5.0
2 Year Treasury Yield (%)
Mortgage Rates* (%)
15
SOURCE: Mortgage Bankers Association
*Freddie Mac Primary Mortgage Market Survey® (PMMS®)
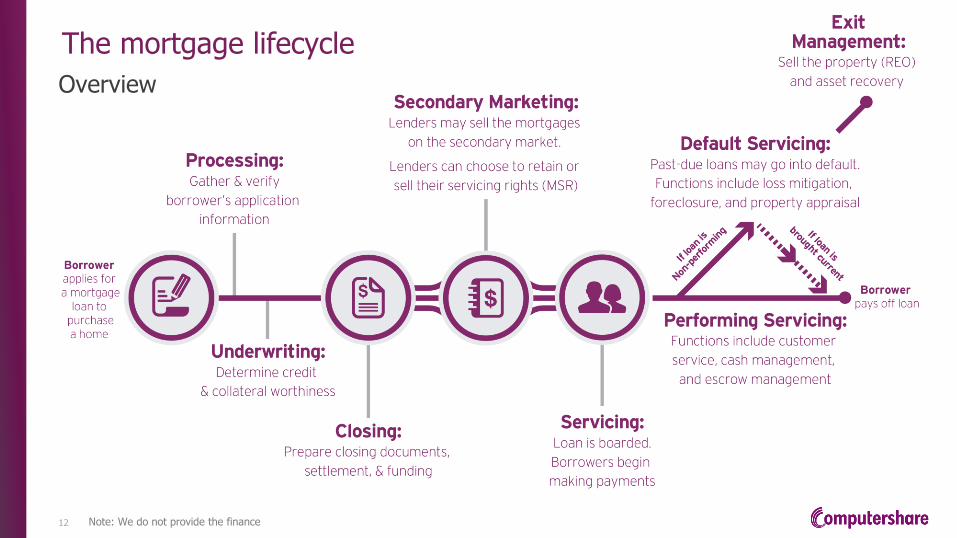
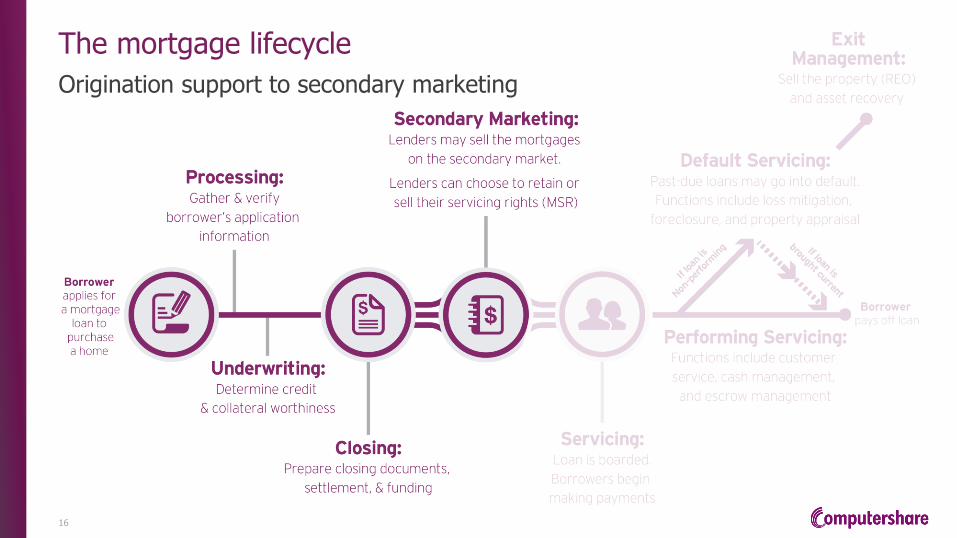
The mortgage lifecycle
Origination support to secondary marketing
16
Originations
Scope of the market and loan origination process
$1.6 tn
mortgage originations (Projected for 2018)
~1500 US lenders and 500+ are
customers Mortgage
applications initiate the
loan lifecycle
Mortgage lenders
Online applications
Loan officers
17
$320+ bn Combined annual production produced by patrons
Our rapidly growing CMC network
18
506 PATRONS
$120bn Total co-issue
market
$12bn 10% market
share
Co-issue servicing Average acquisition price of MSR
is at 15% discount to MSR fair market value
The mortgage lifecycle
Servicing to end-of-loan
19
The customer experience
Customer engagement drivers
65 transfers boarded per month totalling 10,000
customers
200 data fields mapped to servicing platform
900 data checks performed per customer
100% accuracy expected
DRIVERS OF CUSTOMER ENGAGEMENT
Payment assistance due to change of situation or life event
50% OF INBOUND INQUIRIES RESOLVED THROUGH IVR TECHNOLOGY
200,000+ INBOUND CALLS
500,000+ OUTBOUND CALL ATTEMPTS
750,000+ DOCUMENTS MAILED
175,000+ EMAILS SENT
200,000+ WEBSITE LOGINS
Figures shown above are monthly
Escrow account questions
Payment application questions
Recent loan transfer
20
The Computershare difference
Driving exceptional customer experience
Web design
Mobile access
Event based e-communication
Speech analytics
Text analytics
PEGA Workflow
Survey tools
Modelling tools
Video capabilities
Information control and security
Knowledgeable human capital
21
22
SLS loss mitigation
Customer touch points
Final modifications / month 1,000
BORROWERS IN LOSS MITIGATION ON AVERAGE PER MONTH 142 STAFF
IN LOSS MITIGATION
Trial modifications / month 1,300
125,580 26% of 483k loans are delinquent revenue in FY17
$22M
23
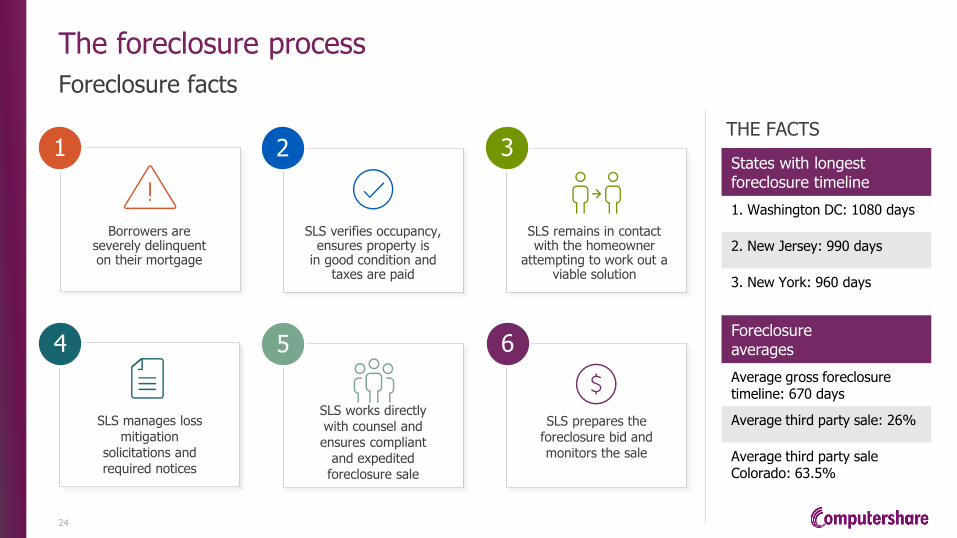
The foreclosure process
Foreclosure facts
SLS manages loss mitigation
solicitations and required notices
Borrowers are severely delinquent on their mortgage
SLS works directly with counsel and ensures compliant
and expedited foreclosure sale
SLS verifies occupancy, ensures property is
in good condition and taxes are paid
SLS prepares the foreclosure bid and monitors the sale
SLS remains in contact with the homeowner
attempting to work out a viable solution
1 2 3
4 5 6
States with longest foreclosure timeline
1. Washington DC: 1080 days
2. New Jersey: 990 days
3. New York: 960 days
Foreclosure averages
Average gross foreclosure timeline: 670 days
Average third party sale: 26%
Average third party sale Colorado: 63.5%
THE FACTS
24
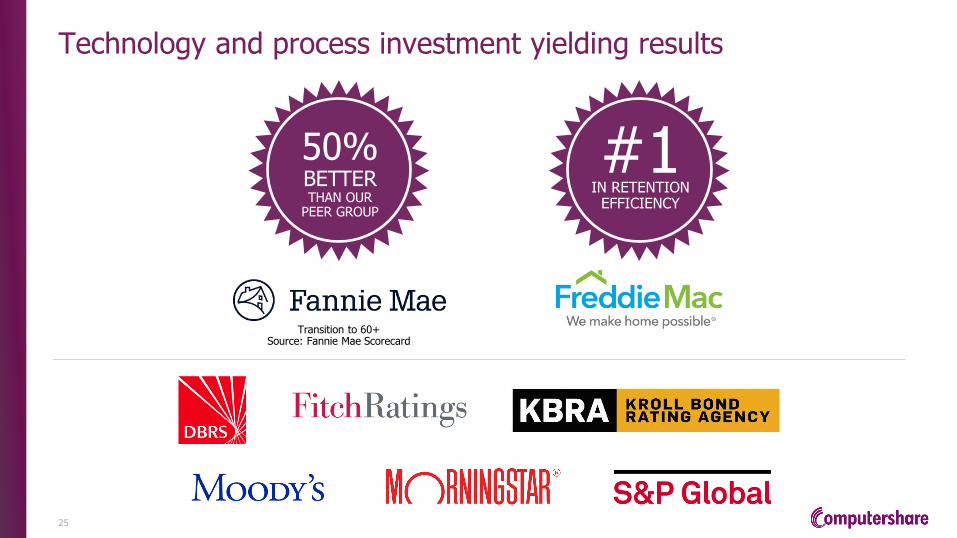
Technology and process investment yielding results
Transition to 60+ Source: Fannie Mae Scorecard
50% BETTER THAN OUR
PEER GROUP
#1 IN RETENTION
EFFICIENCY
25
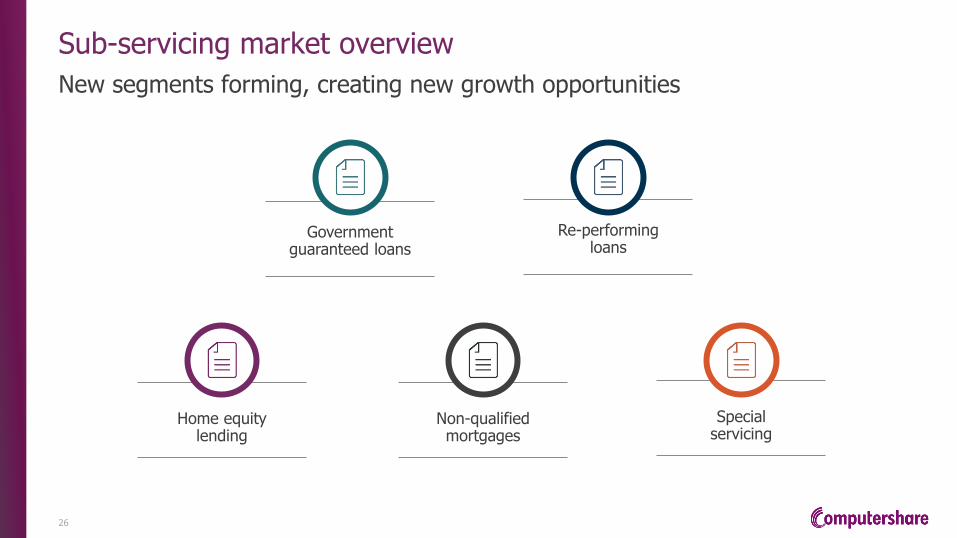
Sub-servicing market overview
New segments forming, creating new growth opportunities
Home equity lending
Government guaranteed loans
Non-qualified mortgages
Re-performing loans
Special servicing
26
The mortgage lifecycle
Exit management
27
Property Solutions
Property Solutions drives revenue diversification
Valuations REO management
Inspections Title and Settlement
Services
28
Third party appraisal management
Example appraisal
29
Assets more than
180 days on market 66 Total inventory more than
180 days on market 2.45%
REO
Case study
Sold for $235,000
$213,195.58 net to seller
Appraised between $225,000
& $233,000
30
Execution priorities for the next 12 months
Delivering on the next stage of the plan
31
ADD SERVICING SCALE – through a range of opportunities, including expanding our co-issue programme and executing on the new business opportunities we see
FURTHER IMPROVE CUSTOMER EXPERIENCE – enabling us to further differentiate ourselves in the sub-servicing market, make our loan onboarding process more efficient and our business more compliant
GROW OUR THIRD PARTY FEE FOR SERVICE BUSINESS (FULFILMENT AND PROPERTY SOLUTIONS) – increase revenue contribution from current 24% to closer to 30%
DELIVER ON OPERATIONAL EFFICIENCIES – capture the benefits from the new loss mitigation system and from our ongoing process automation and productivity improvement initiatives
ENHANCE OUR RECAPTURE MODEL – adding lending partners and product / geographical coverage to better position us to capture returns
MANAGE OUR CAPITAL – we plan to execute excess deals over the next 12 months to free up capital to re-cycle / re-invest, and helping create reciprocal business opportunities with capital partners
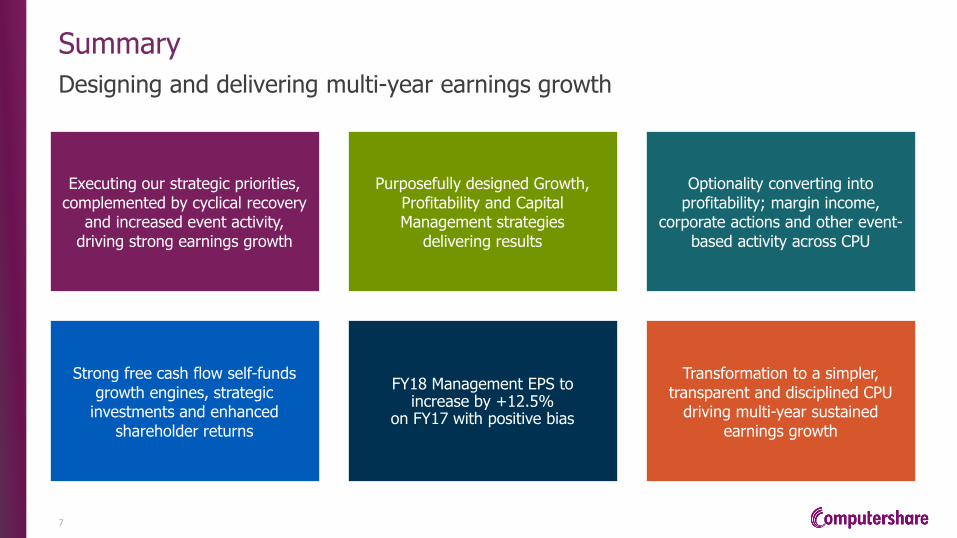
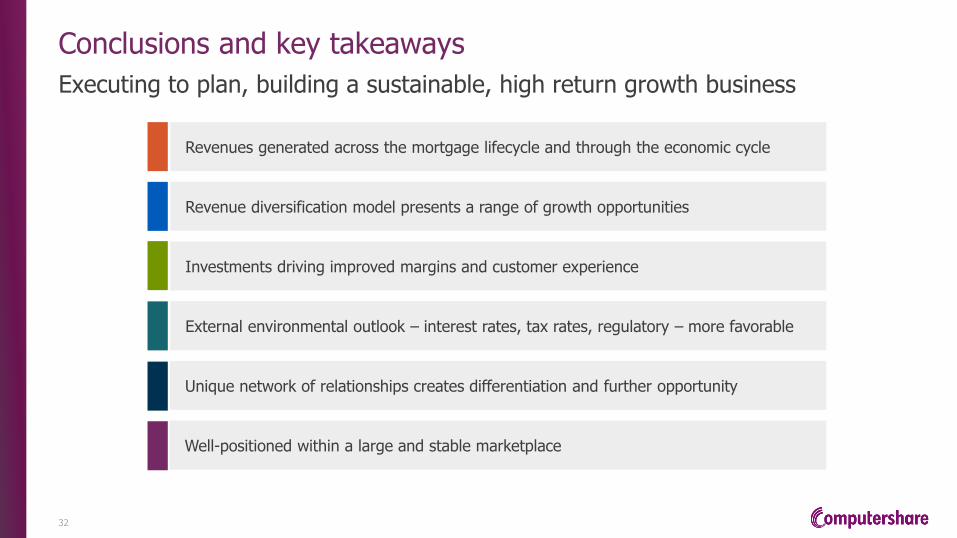
Conclusions and key takeaways
Executing to plan, building a sustainable, high return growth business
32
Revenues generated across the mortgage lifecycle and through the economic cycle
External environmental outlook – interest rates, tax rates, regulatory – more favorable
Revenue diversification model presents a range of growth opportunities
Unique network of relationships creates differentiation and further opportunity
Investments driving improved margins and customer experience
Well-positioned within a large and stable marketplace
UK AND IRELAND
MORTGAGE SERVICES
Executing to plan
Andrew Jones
Head of UK and Ireland Mortgage Services
19 April 2018
Executive summary
Delivery of our strategy is on track
34
UKAR Contract performing well
› UKAR contract remains on track to deliver £600m of revenue and £100m of PBT
› 70% of the UKAR book has now been sold with all servicing retained
› UKAR currently has a number of sales processes under way
› We still expect contract profitability to peak in FY20
Integration on track
› First migration from UKAR platform to CPU platform has been completed successfully
› Remaining migrations will be completed over the next 6-8 months
› Process automation programme progressing well with circa 4,000 hours per month being saved
Organic growth by FY20 / FY21
› Three clients now originating with two more in the pipeline
› Circa £1.5bn of new lending will be completed in FY18
› We are on track for new lending volumes to exceed book run-off by FY20/21
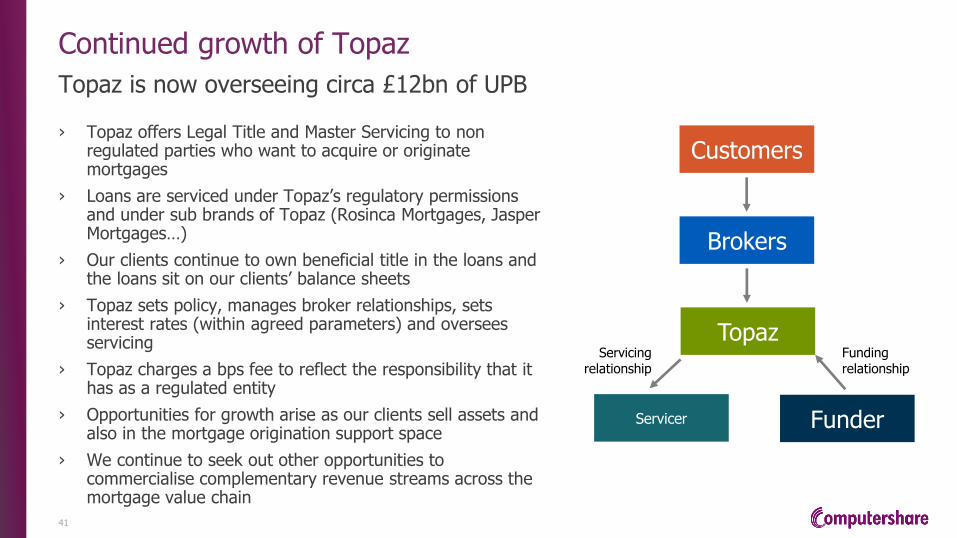
Strong growth in Topaz
› Topaz is our complementary offering which provides a regulatory wrapper allowing non-regulated entities to acquire or originate mortgages
› Topaz has now grown to oversee £12bn of UPB as a result of mandates secured with Blackstone, Prudential, Pimco and Goldman Sachs in the last 12 months
Key areas of strategic focus
We continue to focus on four key strategic pillars
35
Retain servicing as assets are sold
› Continued focus on retaining servicing as UKAR sells assets
› Circa £12bn UPB remains in UKAR
Drive out cost
› Deliver Integration programme on time and on budget
› Deliver significant improvement in operational activity over the next five years through a programme of activity
Geographic and product expansion
› Continue to grow Topaz
› Look to drive greater alignment with US Mortgage Services
› Evaluate geographic expansion opportunities as and when they arise
Grow organically by FY20 / 21
› Continue to focus on Challenger Banks, Asset Traders and Retail Banks
› Focused on delivering two further new lending clients and one significant retail bank opportunity in the next 12-18 months
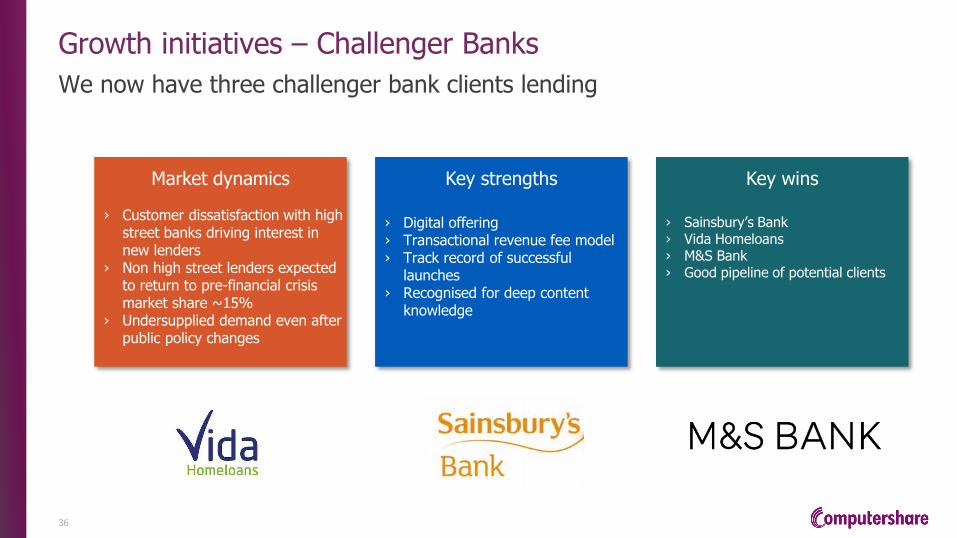
Growth initiatives – Challenger Banks
We now have three challenger bank clients lending
36
Market dynamics Key strengths Key wins
› Digital offering › Transactional revenue fee model › Track record of successful
launches › Recognised for deep content
knowledge
› Customer dissatisfaction with high street banks driving interest in new lenders
› Non high street lenders expected to return to pre-financial crisis market share ~15%
› Undersupplied demand even after public policy changes
› Sainsbury’s Bank › Vida Homeloans › M&S Bank › Good pipeline of potential clients
› Topaz charges a bps fee to reflect the responsibility that it has as a regulated entity
› Opportunities for growth arise as our clients sell assets and also in the mortgage origination support space
› We continue to seek out other opportunities to commercialise complementary revenue streams across the mortgage value chain
Funding relationship
Customers
Brokers
Topaz
Servicer Funder
Servicing relationship
Integration and cost out
Integration programme well on track
42
› Main focus of Integration Programme is the migration of all mortgages onto CPU iConnect platform
› First migration of circa £12bn of assets from UKAR platform to iConnect platform has already been completed
› Further migrations will take place during FY18 with all systems decommissioned by the end of FY18
› Integration benefits on track with benefits starting to flow through from FY19 with first full year of benefits in FY20
Integration 550,000
Customer accounts being migrated
600 Colleagues being
retrained
74% Of development completed
41,000 Days of effort
delivered so far
6 sigma Level of code quality – only 6 defects per million lines of code
Integration and cost out – Process Automation and Digital
Plan to significantly reduce operational cost base over next five years
43
› Significant reduction in operational cost base over the next five years with majority of benefits delivered by FY21
› Process automation roll out progressing well with 11 processes now live and circa 4,000 hours saved every month
› So far 50 processes have been identified with potential to automate
› Digital solutions being developed and implemented
› Web based new lending
› Web based retention offering
› Expansion of existing self-service capability
› Transition from postal to digital
Process Automation and Digital
Redemptions and Balancing
Down DSARS
Collections Admin
Processing
Consent To Let
11 Automated Processes have been delivered to date. These include:
Issue Field Agent
We are aiming to have achieved 6,500 hours delivered back to the business (each month) by June 2018
Conclusions
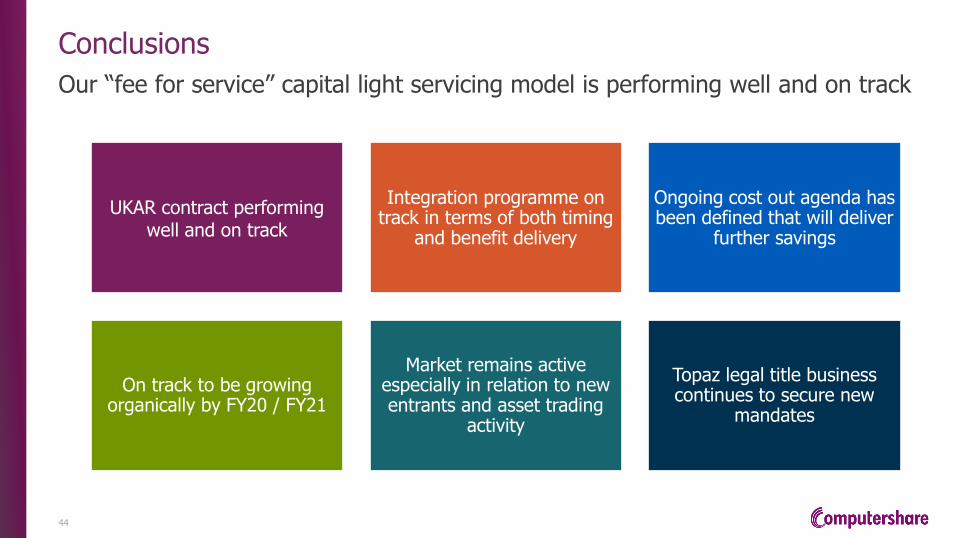
Our “fee for service” capital light servicing model is performing well and on track
44
UKAR contract performing well and on track
Integration programme on track in terms of both timing
and benefit delivery
Ongoing cost out agenda has been defined that will deliver
further savings
On track to be growing organically by FY20 / FY21
Market remains active especially in relation to new entrants and asset trading
activity
Topaz legal title business continues to secure new
mandates
GLOBAL REGISTRY
Leveraging our leading franchise
Steve Rothbloom
President, Computershare USA
19 April 2018
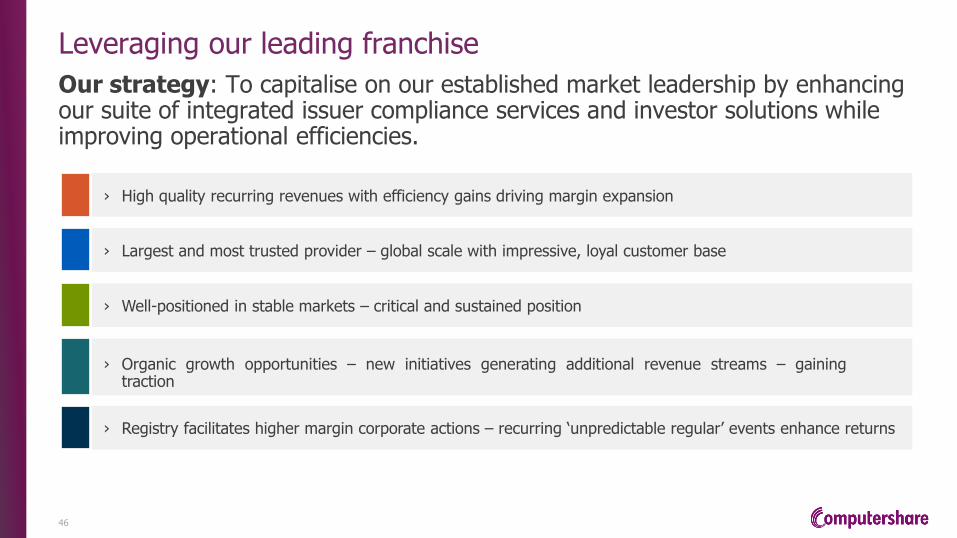
Leveraging our leading franchise
Our strategy: To capitalise on our established market leadership by enhancing our suite of integrated issuer compliance services and investor solutions while improving operational efficiencies.
46
46
› Largest and most trusted provider – global scale with impressive, loyal customer base
Enhancements to go to market strategies gaining traction
54
Segmenting our markets with tailored value propositions, offerings and service delivery models.
› The complex needs of Fortune Global 500 corporate secretaries and their staff are markedly different than the needs and interests of mid-market executives.
› Creating a low cost offering with basic service delivery for “value driven” buyers.
Packaging, pricing and product bundling showing early dividends, improving win and retention rates.
› New programmes have generated meaningful EBITDA to date in US.
› US and UK market share of IPO appointments up more than 20% year on year.
› NPS for AU clients has increased from 48 to 60 over the past 12 months.
› Active negotiations underway with several large, brand-name companies on an upsell from their current single service contract to a bundled contract incorporating multiple products.
Developing indirect sales channels to expand reach into US private market.
› Channel partner targets include crowdfunding specialists, legal and HR outsourcing firms, compliance vendors.
› Secured 50 new clients in US over past year and on-boarding clients from CWT acquisition in Canada.
Streamlining sales coverage model to improve ease of doing business with us.
› Actions taken in response to feedback and broadened interest from senior-level buyers.
› Consolidated four sales teams in US to one now selling full suite of services.
› Co-ordinated IPO sales process across all product lines in the UK.
US Corporate action revenues recur with ‘unpredictable regularity’ through the cycle
55
› Registry facilitates large complex M&A projects and other corporate transactions, generating a consistent ~20% additional revenue flow on top of base Registry revenue on average each year.
› Type of corporate action can change through the cycle with different trends for M&A and capital raisings.
USD
mill
ion
0%
5%
10%
15%
20%
25%
30%
35%
-
10
20
30
40
50
60
70
80
90
100
FY11 FY12* FY13* FY14 FY15 FY16 FY17
Corp. Actions Revenue CA % of Registry Revenue
*Shareowner Services (legacy BNYM) revenue included for 2HFY12 (acquisition date 1/1/12) and FY13
US Corporate actions activity
US Corporate actions revenues and transaction volumes
56
› The average revenue per transaction has grown steadily, and the volume of projects has shown steady upward progression.
› FY18 is anticipated to return to higher levels of project volumes and deal size.
-
10
20
30
40
50
60
70
80
90
100
-
100
200
300
400
500
600
700
800
900
FY13 FY14 FY15 FY16 FY17
Average $ amount per job No. of Projects
USD
‘000
Delivering efficiency gains
Registry, as our largest business, has and continues to receive the largest benefit of all enterprise cost initiatives, creating positive margin jaws.
57
US CA UK AU HK CE
Louisville
Process Automation
Operations Efficiency
Spans of Control
Global Service Model
Procurement
Underway To be implemented Completed
Conclusions
58
Industry-leading global registry franchise with significant scale and deep expertise across the platform
Impressive customer base with recurring revenues, new client wins, long term relationships and excellent retention
Stable and recurring revenues successfully upheld given decline in US shareholder numbers (2018 increase due to spin-offs)
Registry is a high quality global franchise that facilitates high margin corporate actions and strong free cash flow to self fund growth engines and shareholder returns
GLOBAL EMPLOYEE
SHARE PLANS
Building a global growth engine
Naz Sarkar
Head of United Kingdom, Channel Islands, Ireland and Africa
19 April 2018
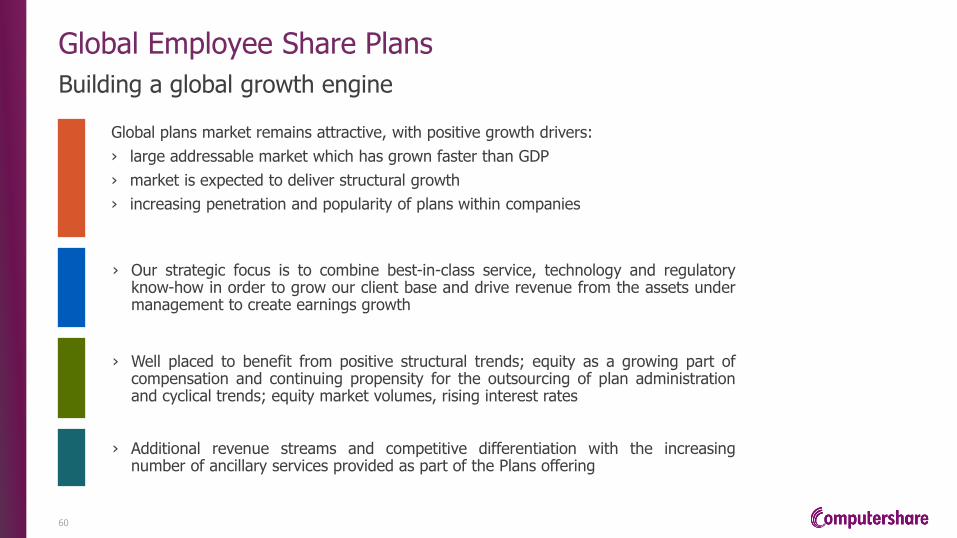
Global Employee Share Plans
Building a global growth engine
60
Global plans market remains attractive, with positive growth drivers:
› large addressable market which has grown faster than GDP
› market is expected to deliver structural growth
› increasing penetration and popularity of plans within companies
› Our strategic focus is to combine best-in-class service, technology and regulatory know-how in order to grow our client base and drive revenue from the assets under management to create earnings growth
› Well placed to benefit from positive structural trends; equity as a growing part of compensation and continuing propensity for the outsourcing of plan administration and cyclical trends; equity market volumes, rising interest rates
› Additional revenue streams and competitive differentiation with the increasing number of ancillary services provided as part of the Plans offering
Global Employee Share Plans Revenue
61 $ m *Translated at FY17 avg fx rates
90.7 100.5 100.6 104.8 107.0
111.5
122.5 118.3 102.9 113.6
-
50.0
100.0
150.0
200.0
250.0
FY13A* FY14A* FY15A* FY16A* FY17A
Other Revenue
Issuer Fee
Global Employee Share Plans
Revenue analysis – multiple revenue streams across sources and regions
62
89% of companies score
global reach ‘high’ or ‘very high’
88% of companies score
regulatory/industry compliance
‘high’ or ‘very high’
Other 8%
Issuer Fees 48%
Margin Income 7%
Dealing and FX 37%
North America
38%
APAC 18%
EMEA 44%
Revenue by source Revenue by region
Global Employee Share Plans
Competitive strengths aligned with customer needs
63
89% of companies score
global reach ‘high’ or ‘very high’
Source: Global GEO Insights Survey 2017: Importance ratings of different criteria for the selection of an external plan administrator in % of companies
88% of companies score
regulatory/industry compliance
‘high’ or ‘very high’
99% of companies score quality of service ‘high’ or ‘very high’
Computershare has a clear global footprint, full service capability, deep market understanding, global franchise and strong track record in innovation and efficiency. Our strengths are fully aligned to the global market needs.
In rating the importance of different criteria for the selection of an external plan administrator, a significant percentage of global companies score quality of service, global reach and regulatory/industry compliance as the three most important factors in their selection of provider.
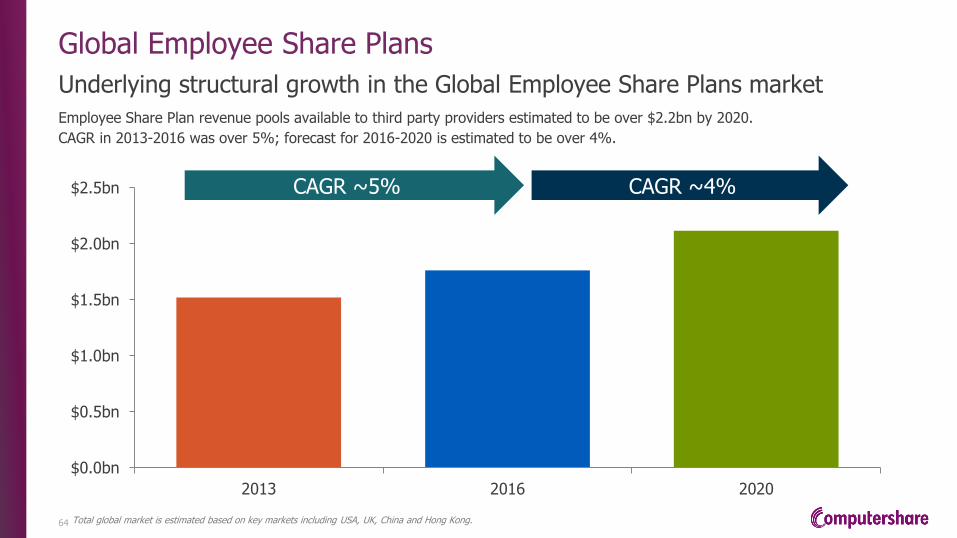
Employee Share Plan revenue pools available to third party providers estimated to be over $2.2bn by 2020.
CAGR in 2013-2016 was over 5%; forecast for 2016-2020 is estimated to be over 4%.
Global Employee Share Plans
Underlying structural growth in the Global Employee Share Plans market
64
$0.0bn
$0.5bn
$1.0bn
$1.5bn
$2.0bn
$2.5bn
2013 2016 2020
CAGR ~5% CAGR ~4%
Total global market is estimated based on key markets including USA, UK, China and Hong Kong.
Assets under administration has grown by around 4% in six month period from 30 June ‘17 to 30 Dec ‘17
This is reflective of the structural growth of the Global Employee Share Plan market.
Over half of the units are in the money creating opportunities for future transaction fees.
Global Employee Share Plans
$130bn of assets under administration – latent earnings power
65
~$130bn HY’18
~$125bn FY’17
>4% Increase in
assets under administration
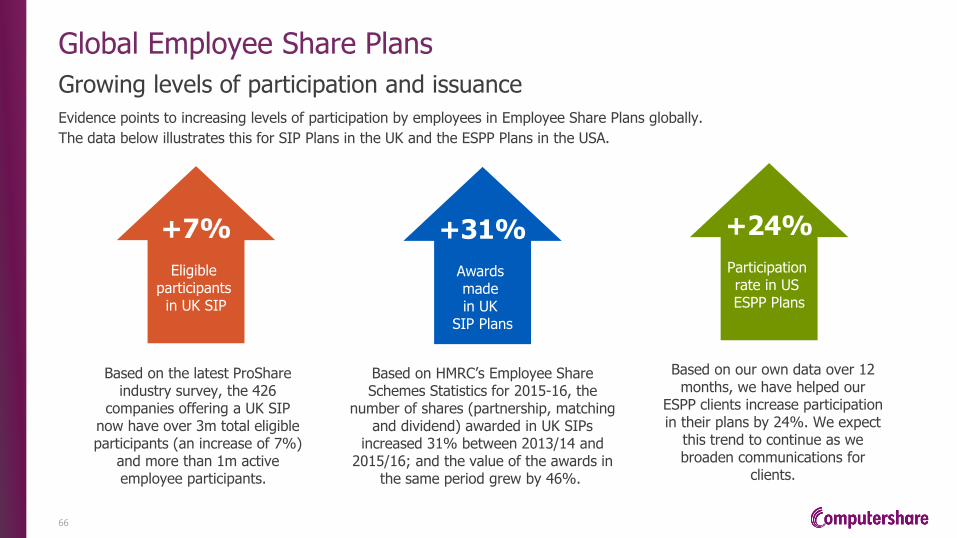
Evidence points to increasing levels of participation by employees in Employee Share Plans globally.
The data below illustrates this for SIP Plans in the UK and the ESPP Plans in the USA.
Global Employee Share Plans
Growing levels of participation and issuance
66
Based on the latest ProShare industry survey, the 426
companies offering a UK SIP now have over 3m total eligible participants (an increase of 7%)
and more than 1m active employee participants.
Based on our own data over 12 months, we have helped our
ESPP clients increase participation in their plans by 24%. We expect
this trend to continue as we broaden communications for
clients.
+24%
Participation rate in US ESPP Plans
+7%
Eligible participants
in UK SIP
+31%
Awards made in UK
SIP Plans
Based on HMRC’s Employee Share Schemes Statistics for 2015-16, the
number of shares (partnership, matching and dividend) awarded in UK SIPs
increased 31% between 2013/14 and 2015/16; and the value of the awards in
the same period grew by 46%.
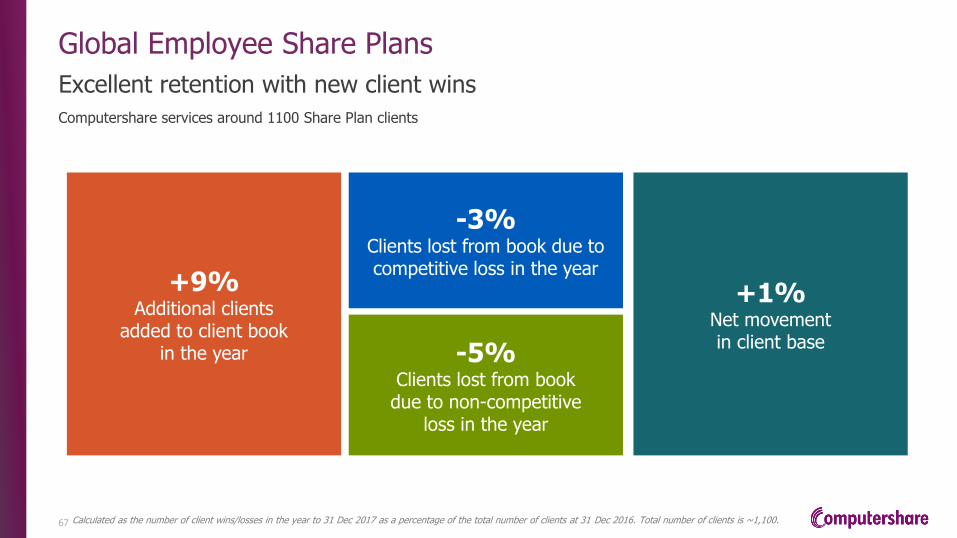
Computershare services around 1100 Share Plan clients
Global Employee Share Plans
Excellent retention with new client wins
67
+9% Additional clients
added to client book in the year -5%
Clients lost from book due to non-competitive
loss in the year
+1% Net movement in client base
-3% Clients lost from book due to competitive loss in the year
Calculated as the number of client wins/losses in the year to 31 Dec 2017 as a percentage of the total number of clients at 31 Dec 2016. Total number of clients is ~1,100.
The average tenure of our top clients in our key regions is over 12 years, representing over 50% of total global Employee Share Plans revenue demonstrating the strength and quality of our client relationships.
ASIA & ANZ
>8 years average client
tenure
EMEA
>13 years average client
tenure
NORTH AMERICA
>15 years average client
tenure
A high quality global client base
Global Employee Share Plans
Based on the average length of tenure for the top 20 clients by revenue in each of our key markets; aggregated tenure calculated as the average of those 100 clients.
Our recent focus has been to improve the quality of service and customer satisfaction of our EMEA clients. This focus has helped us improve both our client satisfaction and employee participant advocacy.
Global Employee Share Plans
Improving client loyalty and customer satisfaction
69
Client satisfaction, as measured quarterly by the Net Promotor Score (NPS),
improved by a 6 fold increase in the 12 months to 31 Dec ’17
The level of participant satisfaction increased by 13% in the 12 months to 31 Dec ’17. Neutral scores accounted for 10% of
responses in Dec ’17 (down from 12%), and fewer than 10% of respondents were dissatisfied with Computershare (previously 19%).
68% Overall
satisfied/very satisfied with
Computershare
81% Overall
satisfied/very satisfied with
Computershare
>6 fold Increase
in client NPS
Our strong local market knowledge, combined with the wealth of executive and contributory plans data, built over many years, is helping us to engage with clients earlier in the plans design cycle and is also enabling us to help drive improved participant take-up rates.
Global Employee Share Plans
Leveraging our expertise and data analytics capability
70
>40 IPO &
first time Plan wins
1 Jan’17-31 Dec’17
“In terms of data analytics, the possibility to obtain
benchmark reports is rated as most important”
“Companies consider
communication services and participant experience as the most important area
for investment in technology”
GEO Insights Survey 2017
54% of companies
score possibility to measure participant behaviour
‘high’ or ‘very
Source: GEO Insights Survey 2017: Importance of aspects in connection with data analytics in % of companies
We have invested in our China and Hong Kong Employee Share Plans business to help us leverage the growing market potential in this region. In October 2017 we launched the new tailor made platform specifically for the growing share plan market in the region.
Global Employee Share Plans
Accelerating our growth in China and Hong Kong plans market
71
Computershare is the largest provider of Employee Share Plans in China and Hong Kong. In the year to 31 December 2017 we grew the number of clients by 15% and the number of underlying participants by 13%. Our new tailor made platform is already indicating improving participation levels and this is expected to drive an acceleration in new client mandates and increased participant numbers.
Market position
# Clients
# Participants
Global Employee Share Plans
Expanding our regional market leadership
72
+15% >190
Largest provider in China and Hong Kong
+13% >240k
Global Employee Share Plans
Key messages
73
73
Computershare has excellent client retention and customer loyalty and is growing share in key markets with new client wins
Investment in technology, product offering and customer service, reflected in improved customer satisfaction which is helping drive revenue growth and earnings
Revenues affected by lower margin income in UK
Data analytics and improved plan design and communication also support growth
~$130bn assets under administration - latent earnings potential as units transacted
Structural growth in use of deferred equity compensation plans, underlying participation levels and outsourcing
First mover advantage in large and growing China and Hong Kong markets including recent client breakthrough with China ‘A’ Shares client win
Plans is a global growth engine for Computershare. We have a multi-year strategic plan to deliver earnings growth
INVESTOR DAY 2018
Summary and question time
Stuart Irving, Chief Executive Officer
Mark Davis, Chief Financial Officer
19 April 2018
Simpler, more transparent, disciplined and profitable
Important notice
76
Summary information
• This announcement contains summary information about Computershare and its activities current as at the date of this announcement.
• This announcement is for information purposes only and is not a prospectus or product disclosure statement, financial product or investment advice or a recommendation to acquire Computershare’s shares or other securities. It has been prepared without taking into account the objectives, financial situation or needs of a particular investor or a potential investor. Before making an investment decision, a prospective investor should consider the appropriateness of this information having regard to his or her own objectives, financial situation and needs and seek specialist professional advice.
Financial data
• Management results are used, along with other measures, to assess operating business performance. The company believes that exclusion of certain items permits better analysis of the Group’s performance on a comparative basis and provides a better measure of underlying operating performance.
• Management adjustments are made on the same basis as in prior years.
• The non-IFRS financial information contained within this document has not been reviewed or audited in accordance with Australian Auditing Standards.
• All amounts are in United States dollars, unless otherwise stated.
Past performance
• Computershare’s past performance, including past share price performance and financial information given in this announcement is given for illustrative purposes only and does not give an indication or guarantee of future performance.
Future performance and forward-looking statements
• This announcement may contain forward-looking statements regarding Computershare’s intent, belief or current expectations with respect to Computershare’s business and operations, market conditions, results of operations and financial condition, specific provisions and risk management practices.
• When used in this announcement, the words ‘may’, ‘will’, ‘expect’, ‘intend’, ‘plan’, ‘estimate’, ‘anticipate’, ‘believe’, ‘continue’, ‘should’, ‘could’, ‘objectives’, ‘outlook’, ‘guidance’ and similar expressions, are intended to identify forward-looking statements. Indications of, and guidance on, plans, strategies, management objectives, sales, future earnings and financial performance are also forward-looking statements.
• Forward-looking statements are provided as a general guide only and should not be relied upon as a guarantee of future performance. They involve known and unknown risks, uncertainties, contingencies, assumptions and other important factors that are outside the control of Computershare.
• Actual results, performance or achievements may differ materially from those expressed or implied in such statements and any projections and assumptions on which these statements are based. Computershare makes no representation or undertaking that it will update or revise such statements.
Disclaimer
• No representation or warranty, expressed or implied, is made as to the fairness, accuracy, completeness or correctness of the information, opinions and conclusions contained in this announcement. To the maximum extent permitted by law, none of Computershare or its related bodies corporate, or their respective directors, employees or agents, nor any other person accepts liability for any loss arising from the use of this announcement or its contents or otherwise arising in connection with it, including, without limitation, any liability from fault or negligence.
Not intended for foreign recipients
• No part of this announcement is intended for recipients outside Australia. Accordingly, recipients represent and warrant that they are able to receive this announcement without contravention of any applicable legal or regulatory restrictions in the jurisdiction in which they reside or conduct business.