THEORETICAL AND EXPERIMENTAL STRESS ANALYSES OP COMMON MECHANISMS IN FARM MACHINERY By SYED AEJAZ ALI A THESIS Submitted to the School of Graduate Studies of Michigan State College of Agriculture and Applied Science in partial fulfillment of the requirements for the degree of DOCTOR OF PHILOSOPHY Department of Agricultural Engineering 1952
Transcript
THEORETICAL AND EXPERIMENTAL STRESS ANALYSES OPCOMMON MECHANISMS IN FARM MACHINERY
BySYED AEJAZ ALI
A THESISSubmitted to the School of Graduate Studies of Michigan
State College of Agriculture and Applied Science in partial fulfillment of the requirements
for the degree of
DOCTOR OF PHILOSOPHY
Department of Agricultural Engineering
1952
ACKNOWLEDGMENTS
The author wishes to express his thanks and sincere appreciation for the helpful suggestions and timely guidance and encouragement from the following persons who brought this project into existence.
Dr. W. M. Carleton, professor in charge of major work. Professor A. W. Farrall, Head of Agricultural Engineering Department.Professor H. F. McColly, Agricultural Engineering Department .The writer is also grateful to Dr. R. T. Hinkle, and
Professor Paul DeKoning both of the Mechanical Engineering Department for their cooperation and assistance in making possible the use of electronic instruments. The author also expresses his thanks for the help received from other staff members and persons in charge of the research laboratory in the Agricultural Engineering Department.
THEORETICAL AND EXPERIMENTAL STRESS ANALYSES OPCOMMON MECHANISMS IN FARM MACHINERY
BySyed Aejaz All
AN ABSTRACTSubmitted to the School of Graduate Studies of Michigan
State College of Agriculture and Applied Science in partial fulfillment of the requirements
for the degree of
DOCTOR OP PHILOSOPHY
Approved_
Depart of Agricultural Engineering
Year 1952
Ia/ ) / ) f'
- lV -
SYED AEJAZ ALI ABSTRACT
In the development and manufacturing of the farm implements and machinery, a common practice that had been followed very extensively, and still is followed to a certain extent is to design a machine or its part basing the knowledge on the rigorous mathematical theory or derived and empirical formulas plus the previous experience in the experimental trial and error methods* These analytical solutions were frequently aided by many safety factors assuring the designer that his designed mechanisms were devised with a sufficient margin of safety.
These practices which are very much refined and improved in the industrial design by the exhaustive theoretical investigations supported by the highly developed experimental techniques, have begun to influence the realm of farm equipment design. Experimental methods developed and introduced during the past decade for the amelioration of design and developmental procedures in the industrial work are at present being utilized by a farm machinery design engineer. The photoelasticity, X-ray analysis, brittle lacquer method and the electric strain gauges are among the many experimental means made available for the determination and analysis of stresses and strains which form the basis of any design.
With these constantly improving trends in the field of machinery design, an attempt was made by the author to use one of the available means, namely the electric strain gauges as
- V -
SYED AEJAZ ALI - ABSTRACT
an aid for the experimental stress analysis. The goal set for the utilization of this experimental technique was to evaluate analytically, the stresses in some of the commonly used mechanisms in farm machinery, to determine the stresses from the experimental work and to compare or correlate the two. For this purpose, an experimental laboratory machine was constructed representing the common mechanisms such as the plunger assembly, the mower assembly, and the belt and gear drives.
It was apparent from the experimental results that the magnitudes of stresses in the above mechanisms was in almost every case higher than the theoretically determined values. Moreover, the stress patterns as revealed by the experimental work not only point out the form and types of stresses in the assembly, but also serve as a tremendous aid as a valuable tool for the design engineer in the field of farm machinery. Such factors as the effects of centrifugal forces, the repeated stresses, and the variable power requirements influenced the stress pattern in each of the above assemblies.
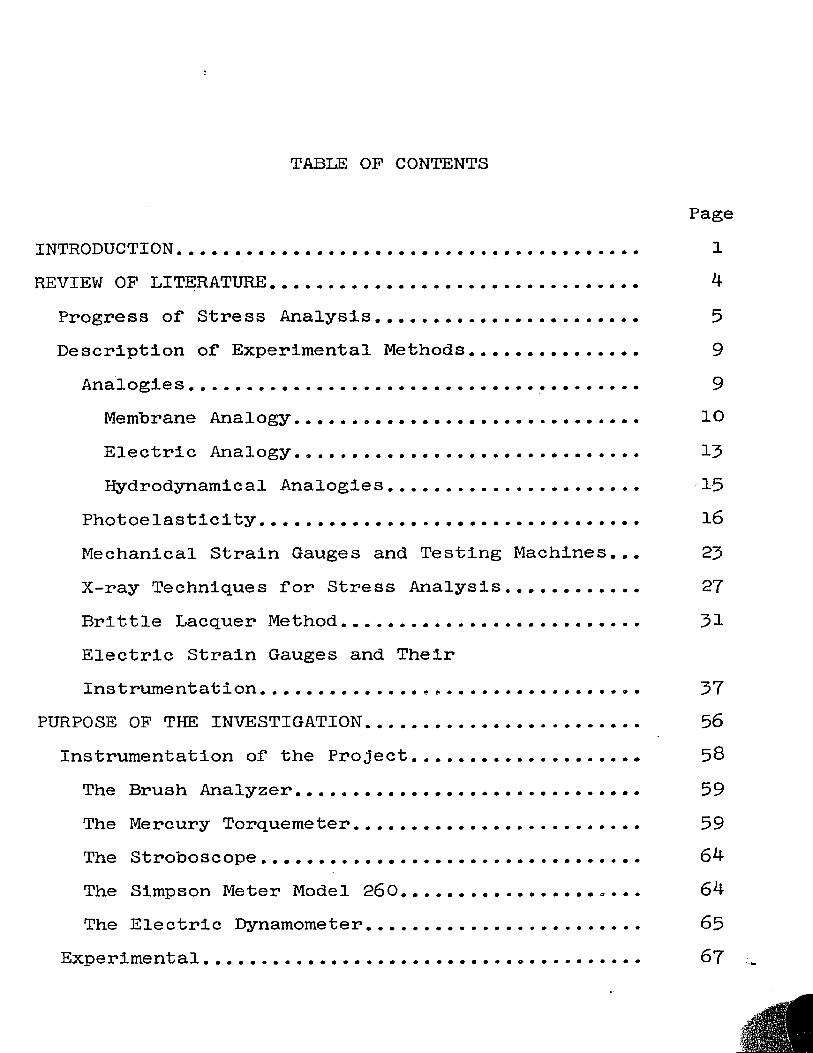
TABLE OP CONTENTS
PageINTRODUCTION................... 1REVIEW OP LITERATURE................................ 4
Progress of Stress Analysis....................... 5Description of Experimental Methods............... 9
Photoelasticity................................. 16Mechanical Strain Gauges and Testing Machines... 25X-ray Techniques for Stress Analysis........... 27Brittle Lacquer Method.......................... 51Electric Strain Gauges and TheirInstrumentation................................. 57
PURPOSE OP THE INVESTIGATION........................ 56Instrumentation of the Project.................... 58The Brush Analyzer.............................. 59The Mercury Torquemeter......................... 59The Stroboscope................................. 64The Simpson Meter Model 260................... 64The Electric Dynamometer........................ 65
Experimental............................ 67
- vii -
PageThe Analysis of the Centre-Crank Mechanism..... 70
The Analysis of the Side Crank Mechanism........ 75The Gear Drives.............................. 80The V-belt Drives............................. 8l
CONCLUSIONS................................ 84SUGGESTIONS FOR FURTHER STUDY....................... 86APPENDIX............................................. 87SELECTED BIBLIOGRAPHY.................................. 106
LIST OF FIGURES
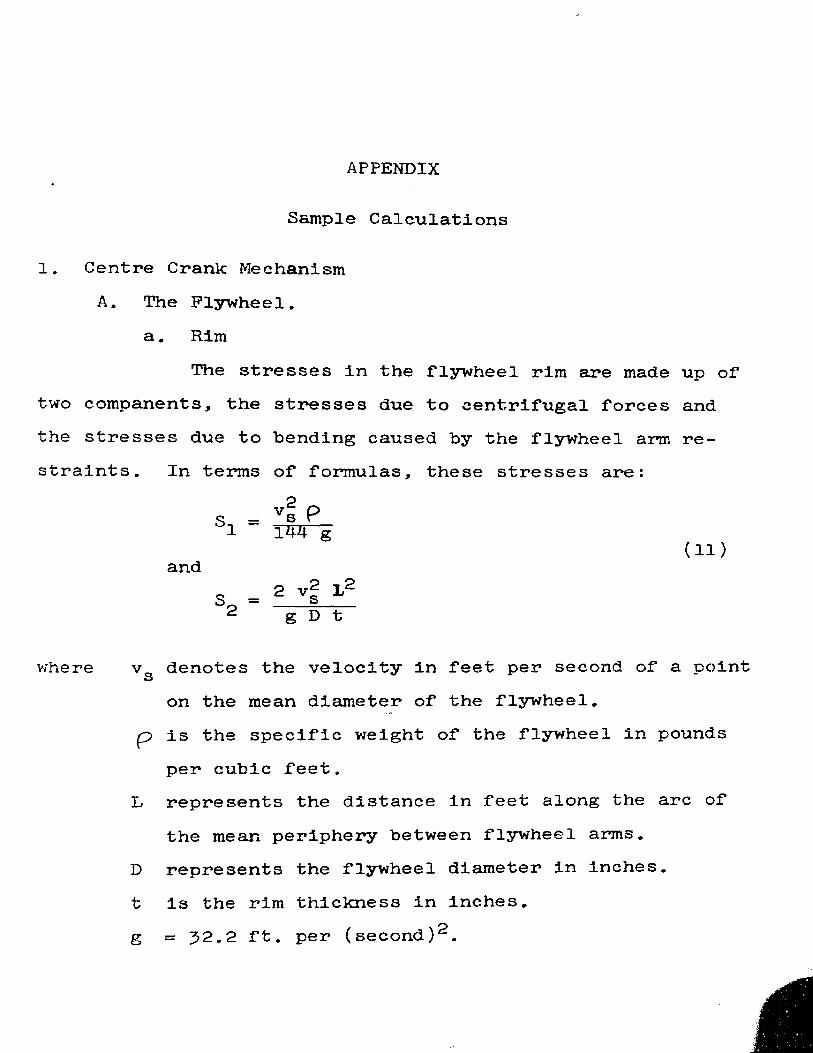
Figure Page1 Model Under Study in a Plane Polarlscope 202 Localized Stresses in the Fillets of a
Type S 14-C.................................. 5510 Wiring Diagram Brush Analyzer Model BL 310... 6011 Detail Drawing of the Mercury Torquemeter.... 6212 Mercury Torquemeter Mounted on the Main
Shaft......................... 6313 Instruments Used in the Project.............. 6614 Side View of the Experimental Machine 6815 Rear Right Side View of the Experimental
Machine....................................... 6916 Graph of Effects of Load Variation on
Crankshaft Stresses.......................... 76
- ix -
Figure Page
17 Strain Recordings of 1/2 inch Gauge at thePitman Mid-section for Variation Speeds..... 78
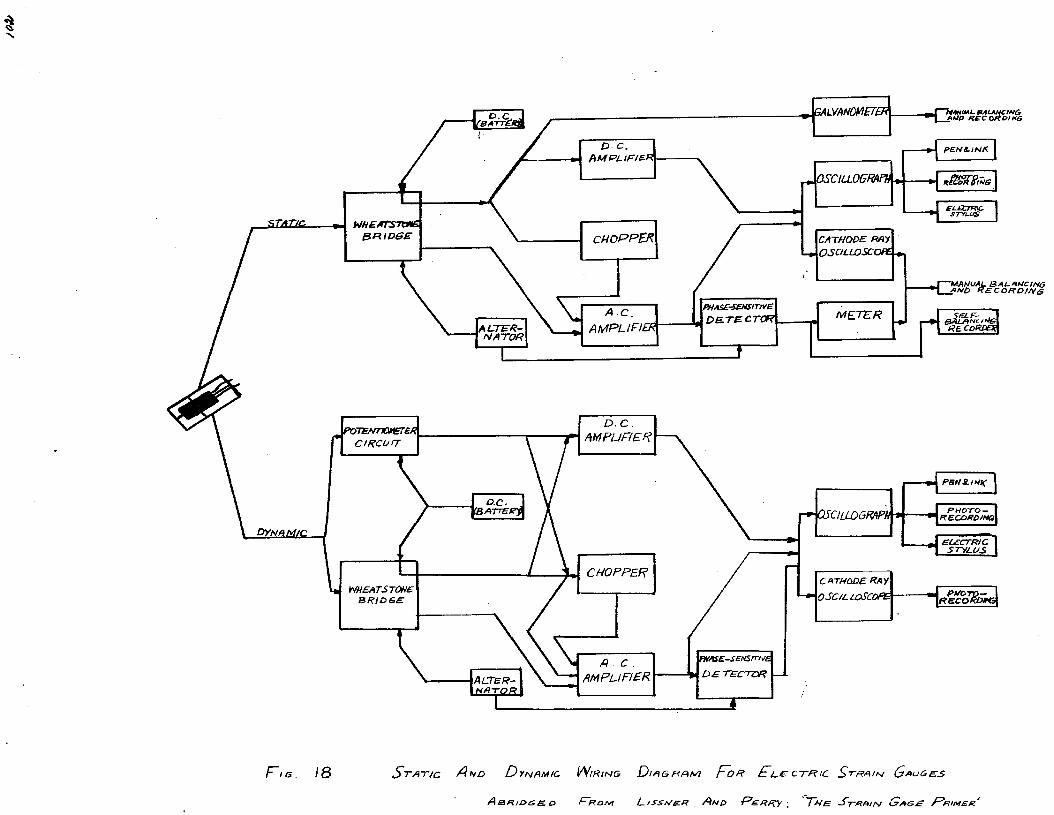
18 Dynamic and Static Wiring Circuit forElectric Strain Gauges....................... 102
19 Top View of the Assembly..................... 10j520 Side View of the Assembly..................... 10421 Front View of the Gear Assembly.............. 105
LIST OP TABLES
Table PageI Thickness Radiographed with Different
Voltages........................................ 29II Characteristics of Stresscoat Brittle
Coatings............................. 35
INTRODUCTION
Engineering design has in the past been based mainly on the personal experience of the designer and some mathematically derived or empirical equations. Analytical approaches to design problems, aided by various safety factors, had for some time no appropriate experimental means possible for evaluation of actual loading patterns In machine parts. Current trends in the development of experimental aspect as a vital tool of the design engineer have revolutionized the procedures and practices followed by predecessors. Serviceability of a machine part for a long time based on the idea of designing huge and cumbersome elements has been replaced by refined techniques and more rationalistic methods which determine experimentally the load distribution in a certain machine under actual operating conditions. Furthermore, the significance of such factors as fatigue, elastic limit, S-N curve, and residual and repeated stresses In relation to design problems has been emphasized by means of experimental tests which reveal the influence of the above factors on the actual design.A great achievement made in this field was the experimental study of forces and stresses under dynamic conditions which not only Improved the design fundamentals, but also gave a comparison between the prevailing analytical methods and the more advanced experimental procedures.
- 2 -
Similar to the history of engineering design has been the evolution of agricultural machinery design. Constant changes in this field have brought forth the improved form of modern ploughs through a gradual process of replacement, and a better performing efficient tractor for farm power developed from the primitive prototypes.
Like in the industry, in the farm machinery enterprise, most prevalent design practices included judgment of design based on the engineer's experience and field testing of the machines; reinforcing certain parts, if they failed during the previous tests. No specific procedures or simplified and yet accurate means were available to evaluate the actual phenomena taking place in various components of a machine, particularly under dynamic conditions.
Experimental aids originally developed and improved for industrial applications have influenced significantly the field of farm machinery design, where crude and bulky machines are steadily and progressively being replaced by efficient ones.With the advent of better experimental design methods, the application of these techniques became more common in farm machinery design. Use of such techniques as photoelasticity, electric strain gauges, and electro-magnetic devices has been responsible for the improvements in present day equipment used in agriculture. Studies on reduction of extra weight, stability of tractors and other equipment, elimination of undesired vibrations transmitted to the supports of a mower or a harvesting machine, analysis of indeterminate frame structures of a harrow or a loader, and tests on the force distributions
- 3 -
in a mold/board plough are among the innumerable problems where experimental techniques are being successfully applied for solving conditions which otherwise involved mathematical approach founded on factors which were in many cases impossible to evaluate. In certain cases, use of these experimental methods for the design of harvesting machines has resulted in the reduction of undesirable excessive weight up to twenty percent.
The object of this study was to apply some of these available experimental means in the analysis of stress patterns in some mechanisms of farm machines, both under static and dynamic operating conditions, and then drawing a comparison or similarity with the theoretical and analytical methods.
For this purpose, certain components, such as a plunger or compressor, a side-crank machine like a mower, and various kinds of drives such as gear and belt drives were isolated and mounted in a compact form. This experimental stress machine made feasible a comparative study and testing of the mechanisms under variable operating conditions. The electric strain gauge method was employed for the testing purpose. Among the main features of this experimentation were such items as the determination of repeated and whipping stresses in connecting rods, evaluation of effects of torsional vibrations in crankshafts, torsional and bending stresses in flywheels, gear teeth, and the main shaft. Having evaluated these values, an attempt was made to compare them with the theoretically determined values in order to correlate the two techniques, and to bring out the elements of relatively higher accuracy and simplicity as observed in the former.
REVIEW OF LITERATURE
In any conventional design work, knowledge of the following three elements is of significant importance:
1. Type of loading,2. Distribution of load.3. Properties of the material.At present, various techniques are employed in evaluating
the applied load pattern. Some of these methods determine the static and average or steady state dynamic loads with reasonable accuracy. However, two factors usually account for the complication and difficulty in solving for load distribution. Statically indeterminate structures such as frames of many farm implements make mathematical solution impractical. In addition to this, the computation of force distribution in individual members of complex shapes becomes extremely difficult .
Two possible approaches are made by the design engineers in evaluating the working stresses in various mechanisms. The first is the usual theoretical design procedure, very often involving calculations based on rigorous mathematical formulae and equations. This is the method where, at the end of the solution, a so-called factor of safety is thrown in. This safety factor usually varies anywhere from two to twenty, depending on the magnitude of the risk involved in the use of
- 5 -
that particular machine, and to overcome the possible errors in assumptions made at various stages of the design. The second commonly used procedure is the trial and error method, which has a very wide application in industrial design works. Elaborating on the use of this method in farm machinery design, a research engineer has said that most new designs of fanri -=> implements are modifications of some previous implement, enough similar to provide the basic design data by virtue of its successful or unsuccessful performance. Many very dependable implements have been developed by building an admittedly inadequate pilot model, placing it in the field and reinforcing the part that failed until the revised model performed (19).The method, as compared to the former, is not too impractical, but the main drawback in this type of work is that in most instances, such an approach leads to extra heavy structures which become expensive and uneconomical from the commercial and practical standpoint.
Progress of Stress Analysis
Stress analyses techniques, whether theoretical or experimental, are concerned with the determination of stresses and strains caused in a structure deformed within the elastic range, and also due to the plastic deformation. Theoretical evaluation of stresses is not flexible enough in that it is limited in application to structural members of certain shapes. The
■S’"theory without the experimental part becomes invaluable from
- 6 -
the standpoint of planning and development in design work. A combination of both the theoretical knowledge and experimental procedure is very much desirable for the execution of successful planning in the field of engineering design. With the evolution of experimental stress analysis techniques to an advanced stage, this link between theory and experimental work has been growing stronger.
In the early part of the seventeenth century, Galileo stated several factors responsible for the failure of simple elements: his conclusions mainly derived from experimental work. Realizing that the science of mechanics of materials was hardly known at that time, his contributions, though erroneous, can be referred to as the precedent of modern stress analysis (22). Robert Hooke gave an impetus to the retarded experimental elasticity by stating his well-known Hooke's law where he mentioned that the elongation of an elastic member was proportional to the applied force. Location of the neutral axis of deflected beams was another significant contribution made by Mariotte (22). During the eighteenth century, Bernouli compared the elastic properties of the materials by using their cellular structure. Euler's formula derived from his column theory, Lagrange's and Euler's theory of elastic stability, and Coulomb * s torsion theory were among the outstanding works accomplisher during the latter part of the eighteenth century. It could be stated that during this century, concentration of efforts was more towards the theory of elasticity than on the direct improvement of experimental elasticity.
- 7 -
Young's modulus of elasticity was a significant addition towards furthering the experimental knowledge. Equilibrium equations as given by Navier form the basis of the theory of elasticity. Poisson's work on verification of Navier's equations, and Poisson's ratio, along with Cauchy's analysis of stress at a point by using six components, were the important works of the earlier nineteenth century.
Contributions made by Saint Venant- his famous torsion theory and his Saint Venant principle, Maxwell's works on statically indeterminate structures, and Airy's stress functions marked the progress of theory of elasticity during the latter half of the nineteenth century.
David Brewster, F. E. Neumann, and Clerk Maxwell discovered the laws about the double refraction of the deformed isotropic solids, and the stress-optical relationship, which laid the foundation for the modern science of photoelasticity (12). Later on, Wilson and Mesnager attempted some investigations on simple structures by utilizing the same principles.A further contribution made in this field was the treatise on photoelasticity by Coker and Filon in 1951 (7).
Use of hydrodynamic-torsion analogies, and membrane- torsion analogy are among the several experimental methods, evolved during this century. Kelvin, Tait, and Boussinesq have been the pioneers in the hydrodynamic-torsion analogies work; while the name of Prandtl is mentioned in connection with the membrane-torsion analogy.
Dr. L. B. Tuckerman revolutionized mechanical strain gauging technique by developing a mechanical-optical strain gauge of a short gauge length; rugged in construction and of greater accuracy. During the period of 1920 to 19 -0, several mechanical gauges were made available. Among these were the Huggenberger tensometer and the dePorest scratch-type gauge, the latter made flexible for recording static and dynamic strains of rather low frequency.
Along with the experimental progress, two significant contributions to the theory were made during the earlier twentieth century. Buckingham's theory of dimensional analysl by means of pi theorem, presented in 1915* and Westgaard's pre sentation of strain rosette equations, added tremendously in analyzing the relationship between the model under study and the prototype, and in graphical and mechanical solutions of various problems.
The Brittle lacquer method marks another distinct step towards the progress of experimental stress analysis. Preliminary investigation on this subject was made by Dietrich and Lehr, two German scientists. This study was followed up by the Frenchmen, Portevin and Cymboliste, and later on materialized for a useful practical purpose by dePorest and Ellis.
The application of X-Rays technique for evaluation of stresses in machine parts has been a fairly recent addition to the list of experimental means of stress analysis. Also,
- 9 -
the development or high speed photography has found a very wide scope In analyzing loading patterns, travelling Impacts, and other stresses In several mechanisms which need a quick evaluation not possible by any other experimental procedure.
Among the latest of these developments, and probably a very highly accurate and practical method, with a very wide application In studies of both the static and dynamic loadings, is the development of the variable resistance electric strain gauge by the ingeneous works of de Forest. With the constant improvements in electronic devices, it can be said that electric strain gauge technique will be extensively adapted in numerous phases of experimental stress analysis work.
Description of Experimental Methods
Analogies
With the advancement of mathematics in applied sciences and engineering, analogic experimental methods in stress analysis became more popular. In general, analogic treatment to a certain problem is desirable in situations where solutions of equations representing a physical system are often too difficult to derive, or the numerical solution becomes a labourious task, and a direct study either on the system or a model Is not quite feasible.
Analogical investigations made on electric circuits were correlated for determination of the nature of mechanical vibrations, flow of fluids through tiles and closed or open pipes,
- 10 -
and other problems Involving study of mechanical properties of certain mechanisms. Application of membrane analogy can be cited In cases like the shape of a soap film representing shearing stress In a twisted bar; and the solution of a problem of slow motions of a viscous fluid In two dimensions representing the solution to a flexure problem of a plate.
Various stages that form the basis of an analogic experiment can be briefly stated in the following words. At first, a mathematical analysis or equations are derived for a physical system whose analogue is to be studied. Similar mathematical form is obtained for the analogue of the physical system. An attempt is then made to correlate the two by means of their mathematical expressions. Finally, the physical investigation is conducted on the analogue and the results are transferred to the original physical system.
Membrane Analogy. Membrane analogies are used either for a torsion or bending experiment. In such cases, either a soap film, a rubber membrane, or a meniscus surface is the most common kind. Soap film analogy is a very desirable one because of the fact that the unit tension T is automatically uniform throughout. The differential equation of the elevated surface z = f (x,y) assumed for a homogeneous membrane stretched with uniform edge tension T over a contour s bounding an area S of the (x,y) plane and dilated by a uniform pressure p
- I l
ls
ti + (#)g3 ¥§a'- g If If life + t1 + (gf)2l gf* _ ^[i + ( H )2 + ( | f )2 ] 4 T
In a case where no pressure Is exerted against the membrane,the above equation reduces to zero on the right hand side (17).
Anthes was the first one to come out with the application of soap film analogy for torsion problems in 1906, He used a rectangular box with a slot in its vertical side through which the film was stretched. The film was inflated by blowing in a measured amount of air displaced from a glass tube. Later on, Griffith and Taylor introduced their apparatus in 1917* which became very widely used for such experiments.
The maximum limiting linear dimension for an experimental hole is around 5 inches, in case of circular hole the radius is taken equal to twice the ratio of the area to the perimeter of the circle, so that the average boundary slope of the experimental hole should equal to the slope at the edge of thecirle. In case of symmetrical patterns, studies of contourson only one half the hole are conducted.
The Anthes checkerboard, Griffith and Taylor autocollimeter, Quest collimeter, Relchenbacher's automatic recorder, and Thiel's photogrammetric camera are the instruments developed and used for evaluation of the slope of the pressure soap film in order to determine the stress pattern of the model under study. The first one yields results closer to the theoretical
12 -
analysis (within 1 to 3^) than any other method. Measurement of volume under the soap film surface is accomplished either by contour method using a vertical micrometer (Taylor and Griffith), the 'black-spot* method, or by the integration of the slopes as determined by the former instruments. Probably the most direct way would be the measurement of the volume of air introduced in forming the soap film membrane.
When the zero-pressure soap film is used in a torsion test, the use of function F = - GGx2 is suggested for the building of the boundary wall. The boundary ordinates lie on the surface of a parabolic cylinder zf= kx^ (k a constant), and the shape of actual hole to be cut from a flat plate can be obtained by computing the ordinates.
Here x § represents the x coordinate of the projection of the boundary on the horizontal plane, and x is the corresponding x coordinate on the developed surface. After cutting the hole, the sheet is bent on a cylinder z( = kxp, the edge of the curved plate giving the boundary ordinates.
Kopf and Weber have introduced the use of a rubber diaphragm, stretched over a cut out surface in a plate and bulged into a mass of paraffin of unit specific gravity by water
(2kx(f^l+4k2xf)
- 13 -
pressure. On hardening, the paraffin proves a permanent cast of the bulged diaphragm. This enables getting data on Inclination of normal stress lines. The advantageous part of this rubber diaphragm is the sizeable reduction of sag due to weight on account of large allowable tension, the permanent nature of the diaphragm, the simplicity of operation, the lie- surely evaluation of contours from frozen paraffin, and the allowable accuracy in the measurement of the ordinates and in building of boundary heights.
Meniscus surface membrane analogy has been first suggested by Piccard and Baes in 1926. The separation of two immiscible liquids is used in these experiments for torsion analogy. Due to the presence of capillarity, an equivalent constant tension exists on the surface, and the meniscus can be used both for pressure and no-pressure experiments.
Electric Analogy. Jacobsen was the first one to perform electric analogy experiments on torsion of axially symmetric shaft for determining stress-concentration factor for circular shafts of two diameters connected by a circular fillet. The results of his experiment checked with the graphical results of Willers (18), but differed from the experimental results of Weigand or the theoretical work of Sonntag.
Thum and Bautz have also introduced a method of electric analogy studying the problem of stress-concentration factor in shafts. Their method, in comparison to that of Jacobsen's, does not require measurement of the potential, but drawing of
- 14 -
equipotential lines only. This directly locates the point of maximum stress concentration. Moreover, the 3hape of the model can he easily changed.
The differential equation for the distribution of the steady-state potential V in a thin plate of constant thickness can be represented as follows:
b2V + d2V _ o .the coordinate plane x,y, is in the same plane as the plate.For the analogy between the above equation and that of torsion problem, the"following relationship is used:
2V & = 0
where y,ls a function of x and y.To represent similarity between the above differential
equation and the case of bending, the differential equation2V <p = 0
is used, where <)> is some other function of x and y only.The boundaries of the thin plate used should be of such
shape and held at such voltages that V on the boundaries should be similar to those required of <|> and if* by their boundary and single-valuedness conditions.
Similar to the above differential equation for steady- state potential V in a thin plate, the equation of steady-state current flow can be stated as follows:
15
or6 ( h_ av) _d_ (h_ av)55c R dx + dy R dy “
where x and y are cartesian coordinates, R Is the specific resistance of a cube of unit edge, h Is the plate thickness, and axis z is chosen parallel to the thickness of the plate*
In connection with electric analogy as a means of solving stress problems experimentally, Kron's analogy of elastic field, Bush*s electric network for pin-connected and rigid- joint structural frames, Mallock's machine for solving simultaneous linear equations, hold a very significant place.
Hydrodynamical Analogies. Three hydrodynamic analogies on torsional problems have been studied by Thomson and Tait, Boussinesq, and Greenhill (17). A brief account of these is presented in the following:
a). The steady-state motion of an irrotaional non-viscous fluid filling an infinite prism of cross-section S, rotating with unit negative angular velocity can be interpreted by
y, is the stream function.b). The steady-state pressure produced laminar axial
flow of a viscous fluid in a pipe of cross-section S can also be represented by the above equations, where now denotes the axial velocity.
-2 over S,C a constant, (commonly taken as Zero)
over boundary s.
- 16 -
c). The steady-state motion of an ideal non-viscous fluid circulating with uniform longitudinal vorticity in a foxed prism S is characterized by the equations:
Z = (J) + i and
2V -2 over S,where Z is an analytic function, (p is the velocity potential and represents the stream function. Since the producing of a vorticity of such a nature is difficult, this analogy does not have much of sin experimental significance.
Photoelasticity
Photoelasticity as a designer's tool has met with a great success in the stress analysis work. Problems not readily solvable analytically by other available techniques have yielded valuable data when the method of photoelasticity was applied. Photoelasticity provides an over-all visual picture of the shearing-stress distribution throughout a specimen. It makes possible the measurement of stresses at a point, thus the regions of high stress gradient can be evaluated. In precision, results obtained in two dimensions by photoelastic methods are comparable to strain gauge measurements. A fairly elaborate pattern of stress distribution can be obtained on irregular shapes of the model used for studying the prototype. Thus stresses at interior points may be evaluated.
Sir David Brewster was the first one to publish in 1816 that clear stressed glass when examined in polarized light
- 17 -
exhibited coloured patterns. However, not much practical use was made of these results, and very few applications were made until the turn of that century. Reputed physicists like Neumann, Maxwell, and Wertheim (22), have furthered the progress of the theory established by Brewster by defining that the optical retardation causing the colour effects is proportional to the difference of the principal stresses existing in the glass. Later, Professor E. G, Coker of the University of London introduced celluloid models and used monochromatic light which made possible modem laboratory photoelastic studies. The development of synthetic plastics and invention of Polaroid for producing large beams of polarized light have greatly assisted the promotion of photoelasticity for laboratory techniques, and have significantly reduced the cost factor involved.
Works accomplished by Procht, Hetenyi, Drucker, I>olan, Filon and Murray have played a great role in furnishing an adequate tool for modern design engineer.
Glass, celluloid, bakelite, and several other synthetic resins under stress refract a beam of light similar to a crystal. This double-refraction, temporary in nature, is like in a wave plate; and the retardation is dependent on the intensity of the stress, the refraction disappearing at the removal of the load. For the cases of plane stresses within the elastic limit, the following laws govern the trans-
c
mission of light for photoelastic stress determination.
- 18 -
a.. The light 4s polarized in the directions of the principal stress axes and is transmitted only on the planes of principal stress.
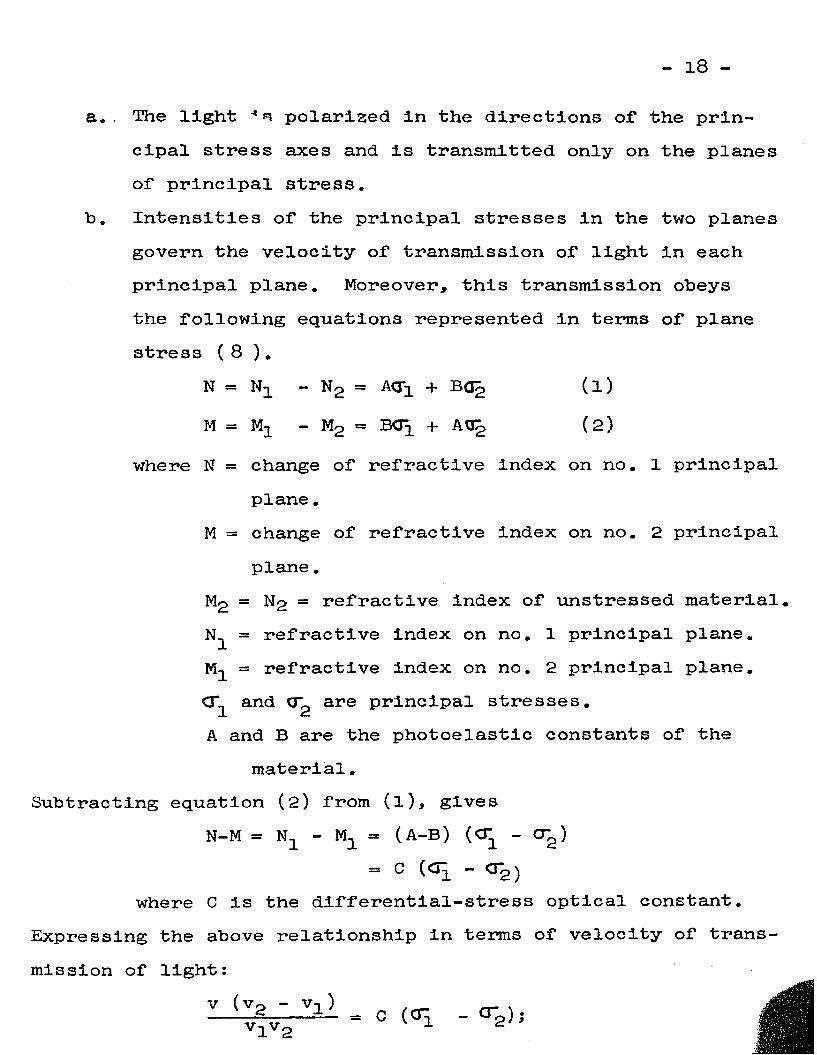
b. Intensities of the principal stresses in the two planes govern the velocity of transmission of light in each principal plane. Moreover, this transmission obeys the following equations represented in terms of plane stress (8 ).
where N = change of refractive index on no. 1 principal plane.
M = change of refractive index on no. 2 principal plane.
Mg = N2 = refractive index of unstressed material.
where C is the differential-stress optical constant. Expressing the above relationship in terms of velocity of transmission of light:
N — — Ng = AQ*2_ + B<JgM = M-l - Mg = + A W 2
(1)(2)
N1 = refractive index on no. 1 principal plane M- = refractive index on no. 2 principal plane CT and are principal stresses.A and B are the photoelastic constants of the
material.Subtracting equation (2) from (l), gives
N-M = Nx - M 1 = (A-B) (O^ - 0"2)— C (^2. — ^2)
- 19 -
the notations and V2 represent transmission velocities on the principal planes of stress, and v is the velocity of transmission in the surrounding medium.
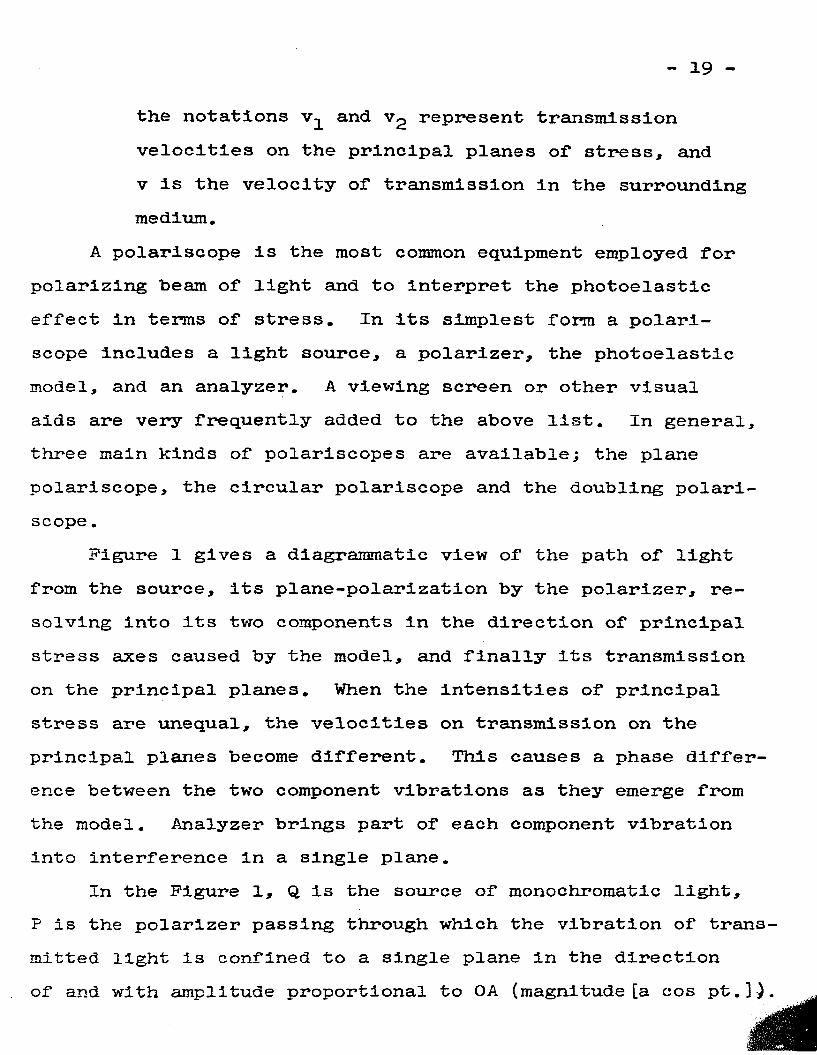
A polariseope is the most common equipment employed for polarizing beam of light and to Interpret the photoelastic effect in terms of stress. In its simplest form a polari- scope includes a light source, a polarizer, the photoelastic model, and an analyzer. A viewing screen or other visual aids are very frequently added to the above list. In general, three main kinds of polariscopes are available; the plane polariscope, the circular polariscope and the doubling polari- scope.
Figure 1 gives a diagrammatic view of the path of light from the source, its plane-polarization by the polarizer, resolving Into its two components In the direction of principal stress axes caused by the model, and finally its transmission on the principal planes. When the intensities of principal stress are unequal, the velocities on transmission on the principal planes become different. This causes a phase difference between the two component vibrations as they emerge from the model. Analyzer brings part of each component vibration into interference in a single plane.
In the Figure 1, Q is the source of monochromatic light,P is the polarizer passing through which the vibration of trans mitted light is confined to a single plane in the direction of and with amplitude proportional to OA (magnitude [a cos pt.]^
Pig. 1. Model Under S-fctzdy in a Plana Polarise ope. (8)
~ 21 rDue to the fact that the model Is stressed, the original vibration, when it approaches the model, is resolved into components [a cos oc cos pt] (parallel to no. 1 principal plane), and [a sin oc cos pt] (parallel to no. 2 principal plane), where o< represents angle between original vibration and the principal plane no. 1. Since the time required for transmission on the no. 1 and no. 2 principal planes, and the model thickness along the path of light influences the above components, the relation between principal stresses and time and thickness finally resolves to:
ti - t0 = hC ( - cr2 ).v
Here t^ and tg are transmission times on no. 1 and no. 2 planes, respectively; h is the model thickness, and other notations are same as described earlier.
Following is the form of the two components of vibrationsemerging from the model and transmitted by the analyzer:
[a cos cx sin oc cos p(t - t^)][a sin oc cos o< cos p(t - t2)]
showing both have same amplitude. Thus the resultant vibrationfinally resolves to:
[a sin 2 o< sin p(t-, - t2 ) sin p(t - t-j -tg)].2 2
Applications of the science of photoelasticity to the problems in stress analysis have gained more popularity in recent years. Exhaustive works done in this field have led to the solution of such problems as stresses in shaft fillets
Figure 2. Localized stresses in the fillets of a gear tooth. (8)
- 23 -
in bending, plastic model study of crankshaft stresses* and stress patterns in gear teeth under load. Figure 2 shows stress form in the tooth of the meshing spur gear as the load is applied.
Recently, the extension of Iknowledge acquired on photoelasticity in two dimensions is being effectively utilized on problems of three-dimensional nature where internal stresses are evaluated and checked.
However, with all the advantages discussed above, photoelasticity has some drawbacks which could be summarized in the following account. Being an indirect method, accuracy of scale of models and interpretation of data for the phototype sometime become impractical. Three-dimensional study requires rather involved and complicated techniques. Preparation of stress-free models calls for further care and attention to the experimental procedure j,
Mechanical Strain Gauges and Testing Machines
Mechanical strain gauges and testing machines have been the predecessors of several experimental stress analysis techniques evolved during the present era. The wedge type gauge devised by Hodgkinson and Unwin ( 9), and the touch micrometer developed by Unwin are examples of the strain instruments used as early as 1856 and 1883.
Various kinds of extensometers were designed during 1870- 1890. Screw-type micrometers and the mechanical lever extensometers for a long time have been applied for stress work. The
- 24 -
Benjamin extensometer, the Bushby hairline extensometer, Strohmeyer's roller extensometer, and Capp*s multiplying divider are among the above types developed between 1880 and 1910.
Compound magnification systems have also been devised for strain analysis. Among these are the Berry straun gauge developed in 1910 (for measuring strain to the nearest 0.0002 inch with a 0.001 inch micrometer), and the Hurst-Tomlinson extensometer patented in 1918. Various autographic recording instruments were made by men like R. H. Thurston (torsion recorder), Kennedy and Ashcroft (strain recorder), Dr. P. H. Dudley (stremmatograph), by Dalby (stress-strain recorder), and by the University of Wisconsin (strain-time recorder).Later on came the famous Huggenberger Tensometer, and the Porter-Lipp strain gauge employing compound lever magnification, lightweight, and a very high magnification range (300 to 2000).
Dial gauges employing gear magnification have also found wide applications where accurate measurements of small motions are required. These are compact, and easy to apply. The maximum probable error in accordance with the specifications of the U-. S. Bureau of Standards is 0.000225 inch, Including backlash. Gauges of this type are being manufactured by the Standard Gauge Company, Ames Company, Federal Products Corporation and Starrett Company. A modification of these dial gauges have been used in dial indicators commonly used as extenso- meters for direct strain measurement. The Whittemore Fulcrum- Plate strain gauge manufactured by the Baldwin Southward
- 25 -
Division is a very good example of the dial indicators.De Forest scratch recording strain gauge is a very excel
lent instrument for recording low dynamic strains in moving elements of machines. Although the gauge is not equipped with any magnification of the motions, the record may be examined by means of a microscope. This gauge has the advantage of being lightweight, simple, easy to install and requires small operational force.
Goldbeck*s recording strain gauge was designed for applications to concrete roads and structures, and it has the feature of automatic temperature correction. Goodyear stress change recorder is designed for study of stresses over a longer range of time. This found successful application in aircraft, automobiles, bridges and ships, in measuring stress variations caused by weather, road conditions, volume and frequency of traffic, wave action and other uncontrollable factors.
Some work has also been done in devising mechanical strain gauges using acoustical principle, and pneumatic flow through orifice. But it was found that these gauges do not have much application in measuring stresses of short-duration, and the dust particles may cause trouble in flow through small orifices.
Several important factors account for the accuracy on all types of mechanical strain gauges. Inaccuracies in shapes of cams, gear teeth, or other mechanism may cause variable magnification and non-linear relation between measured and the
- 26 -
magnified motion. Lost motion can also cause changes in the direction of the existing force. Variation of temperature, critical as in any other physical phenomenon, can effect the magnification ratio. Flexure of parts and slippage and creep in friction drives play a significant role when variable forces are present. The effects of the above factors could be eliminated or reduced to a certain extent by the use of calibration charts. One distinct disadvantage, however, is the inflexibility of any of these mechanical strain gauges in their application for the evaluation of dynamic stresses, particularly of a higher frequency.
Stress testing machines are generally of two kinds, one dealing with the mechanical properties of the materials, and the other concerned with the behavior of built-up structure or machine member. From the standpoint of further presentation of this material, the testing machines are categorically described separately as static testing machines and dynamic testing machines.
Static testing machines are used for the determination of mechanical properties of materials under static stresses. Universal testing machines are commonly used for evaluation of simple static stresses such as tension, compression, and bending. Universal machines not being adaptible for torsion, screw-type Riehle machines are employed for torsion tests and determination of shearing strength. Besides these machines, other machines, such as combined tension-torsion machine
- 27 -
developed by the Westinghouse Research Laboratories, combined- tension-torsion machine manufactured by the Crysler Corporation, and creep-tenslon testing machine made by the General Electric Company are among the various kinds built for determination of combined and creep stresses.
Dynamic testing machines have been devised for evaluating impact and fatigue stresses which cannot be determined by the static machines. The common types among the dynamic testing machines are the automatic stress relaxation machine of the Westinghouse Research Laboratories, the Moore reversed-bending- fatigue machine, the fixed-cantilever constant-amplitude fatigue machine of Krouse Testing Machine Company, the inertia- type flexure fatigue machine of Baldwin Southwark Division, Baldwin Locomotive Works, and the Oxford pendulum type impact machine. Even though the testing machines described in this section are for dynamic tests, these do not find any significant application in stress work involving dynamic stresses of higher frequencies.
X-ray Techniques for Stress Analysis
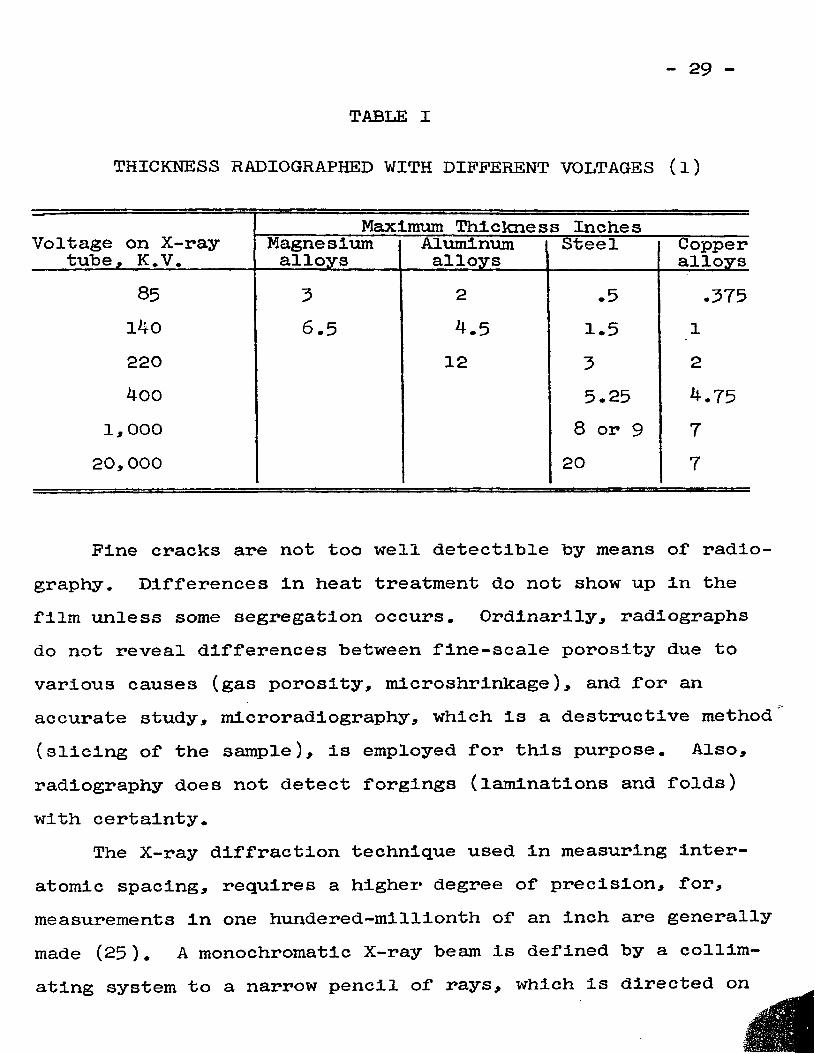
Stress measurement in metals by using the X-rays has been a successful development for the solution of some practical problems. The detection of internal flaws in the material is accomplished by the radiographic method, whereas, evaluation of stresses is done by the X-ray diffraction procedure.
- 28 -
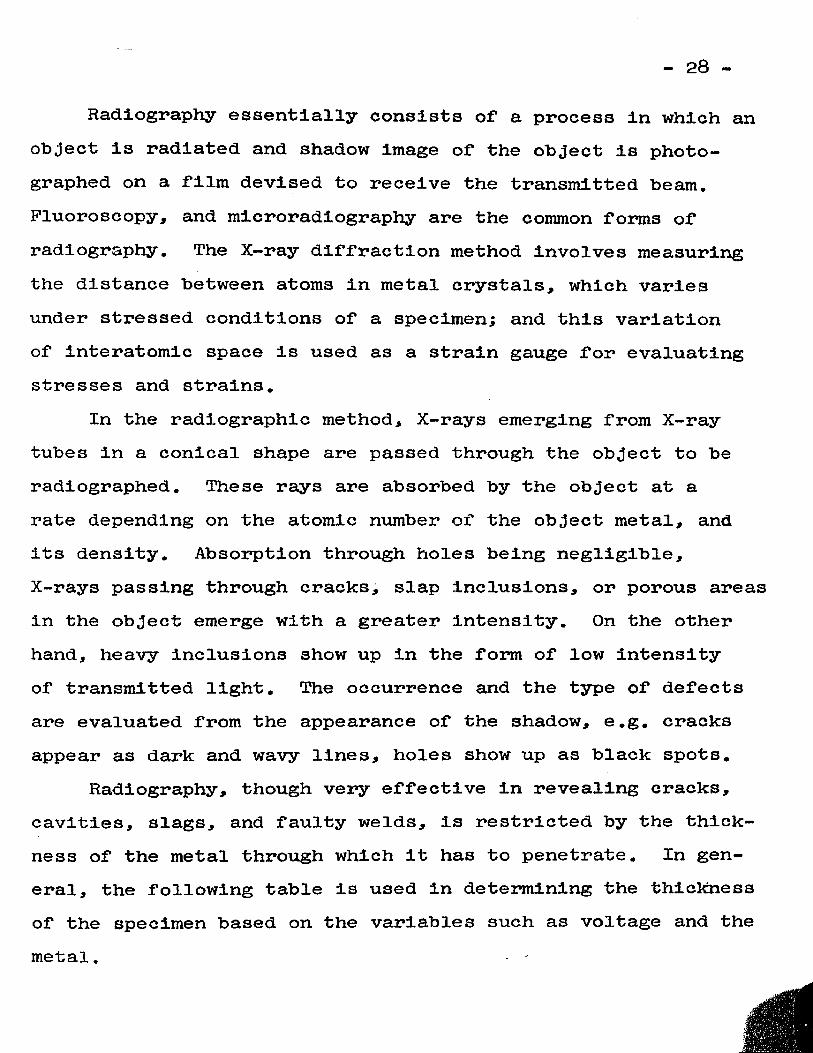
Radiography essentially consists of a process in which an object is radiated and shadow image of the object is photographed on a film devised to receive the transmitted beam. Fluoroscopy, and microradiography are the common forms of radiography. The X-ray diffraction method involves measuring the distance between atoms in metal crystals, which varies under stressed conditions of a specimen; and this variation of interatomic space is used as a strain gauge for evaluating stresses and strains.
In the radiographic method, X-rays emerging from X-ray tubes in a conical shape are passed through the object to be radiographed. These rays are absorbed by the object at a rate depending on the atomic number of the object metal, and its density. Absorption through holes being negligible,X-rays passing through cracks, slap inclusions, or porous areas in the object emerge with a greater intensity. On the other hand, heavy inclusions show up in the form of low intensity of transmitted light. The occurrence and the type of defects are evaluated from the appearance of the shadow, e.g. cracks appear as dark and wavy lines, holes show up as black spots.
Radiography, though very effective in revealing cracks, cavities, slags, and faulty welds, Is restricted by the thickness of the metal through which it has to penetrate. In general, the following table is used in determining the thickness of the specimen based on the variables such as voltage and the metal.
- 29 -
TABLE I
THICKNESS RADIOGRAPHED WITH DIFFERENT VOLTAGES (l)
Fine cracks are not too well detectible by means of radiography. Differences in heat treatment do not show up in the film unless some segregation occurs. Ordinarily, radiographs do not reveal differences between fine-scale porosity due to various causes (gas porosity, microshrinkage), and for an accurate study, microradiography, which is a destructive method (slicing of the sample), is employed for this purpose. Also, radiography does not detect forgings (laminations and folds) with certainty.
The X-ray diffraction technique used in measuring interatomic spacing, requires a higher degree of precision, for, measurements in one hundered-millionth of an inch are generally made (25). A monochromatic X-ray beam is defined by a collimating system to a narrow pencil of rays, which is directed on
- 3 0 -
the specimen at any desired angle. The crystalline structure of the specimen causes a conical diffraction of the incident beam. The trace of the cone appears dark with lighter background. The apex angle of the diffracted cone of rays being dependent on the atomic spacing in the direction of the incident beam, the cone diameter serves as a measure of the atomic spacing.
Since the crystals of most metals have different elastic constants, the problem of using the proper elastic constant becomes rather confoundling. The values employed in mechanical calculations are generally those that have been averaged over a certain surface, whereas, X-ray diffraction method depends entirely on the elastic constants of the specific crystals within the specimen that are under the incident beam. This phenomenon is very conspicuous in case of copper alloys where the elastic constants of the crystals in various planes vary widely so as to influence the results. In the case of steel, practically all grains have the same strain regardless of their orientation.
The method of X-ray diffraction is usually of a non-destructive nature. Stresses at any desired depth can be evaluated by this method. Residual stresses can be determined with a reasonable accuracy. The area over which stress is being measured is so small that fairly close approximations of stresses at a point could be made. This method measures only the elastic deformation; the plastic deformation, due to the fact that it has different fundamental nature of
- 51 -
crystalline substances than the elastic deformation, does not influence the determination. Problems involving the yield point in heterogeneous stress fields can be very readily solved by this method. The influence of plastic flow on the occurrence of brittle failures in metal is easily deducted.
With these advantages, the drawbacks of this technique are the need for careful and cautious preparation of the proper surface condition of the metal, the skilled and experienced operation of the instruments involved, and the non-flexibility of this method to field applications.
Brittle Lacquer Method
Brittle coatings for stress analysis work are fundamentally based on the principle that such coatings, through their cracking under loads, can indicate relative magnitudes of strain in test specimens. When a surface of a specimen is coated with some adhering brittle material, under the application of load, the coating will crack first at the point of maximum strain.A stress pattern and approximate magnitudes of stresses can be obtained by observing the initial point of cracking of the coating and the spreading of the cracks as the load is increased.
The brittle lacquer method has the advantage of being used both on static and dynamic testing. Lacquer coating can be applied on complicated structures of various shapes and finishes, and either on the prototype or the model under investigation. The stress pattern is produced by the cracking
- 32 -
of the coating (on the specimen) perpendicular to the line of stress. A preliminary test run with brittle lacquer, if feasible, would yield valuable data and enables further investigation on an elaborate scale.
Iron oxide formed on the hot-rolled steel stock was the first brittle coating studied for strain work. Whitewash or white cement solution are occasionally used to bring out the cracks formed in iron oxide mill scale. A solution of shellac in alcohol, as used by Sauerwald and Wieland, 'Maybach* lacquer made by Dietrich and Lehr, and other resinous coatings as used by Portevin and Cymboliste, and B. P. Haigh and J. S. Blair were some of the means for stress analysis work by using the cracking of the brittle coating principle. A satisfactory lacquer for this purpose has been developed by de Forest and Ellis, and is manufactured under the name of 'stresscoat1.It consists of limed wood rosin K and dibutyl phthalate, with carbon disulphide as solvent.
Stresscoat, if used with required precautions, can yield some quantitative strain values within elastic limit. Cracking of the stresscoat is very apparent under tensile forces. In case of compressive loading, the cracks are not too significant, and test work at times becomes impractical because in compression test, the specimen is stresscoated under applied load, and then the load is removed in order to give cracks due to a negative tension. Due to its high sensitivity to humidity and temperature, stresscoat can be applied with more success under controlled laboratory conditions. By variations of the
- 33 -
ingredients and components of the lacquer, the strain sensitivity can be obtained for various combinations of humidity and temperature. Taking into account the variations of temperature and humidity, about a dozen lacquers have been prepared, each being affective within a certain range. The chart of these lacquers, which are conveniently numbered from 1200 up to 1211, as made by the Magnaflux Corporation, manufacturers of stresscoat, is shown in Figure 3. This covers the favorable humidity and temperature ranges for each one of the twelve lacquers. Table II gives further analysis of some properties of the stresscoat.
In spite of its limitations, the stresscoat has been successfully applied in obtaining valuable data for analysis of aircraft engine cylinder, propeller and landing gear failures, and various mechanisms of locomotives and trucks. An illustration showing the stresscoat pattern on a crankshaft loaded in bending is presented in Figure 4. Among some of the rather unusual applications, the analysis of firing tests on shot guns, and the analysis of skull behavior when subjected to injurious blows are of significant interest.
Dry-bulb
Temperature
- 34
110
100
Wet-bulb Temperature P.
Fig.3 Stresscoat Lacquer Selection Chart. (l6)
- 35 -
TABLE II
CHARACTERISTICS OF STRESSCOAT BRITTLE COATINGS (10)
Amount of tension strain to Initiate pattern.....
Range or strain above Initial where amount can be Judged by comparison with Calibration Strip..Direction of patterns...
Temperature sensitivity.
Humidity sensitivity,...
Creep of coating
Speed of formation of patterns....... .
. 0007-normal.
.0005-.0015— practical limits.
.0002.Perpendicular to principal tension stress in coating.Highly sensitive.+f5°F. limits during six to twenty-four hour drying period.+1°F. during testing period.Calibration Strip and test structure must stay within +1/2 F.Moderate. Ordinary weather changes not serious factor.Appreciable. Must be compensated for if loading takes over 15 seconds. Coating relaxes an applied stress in three hours.
Extremely rapid.
M
- 37 -
Electric Strain Gauges and Their Instrumentation
Experimental stress analysis work has been revolutionized by the advent of electric strain gauges and their application in stress and strain measurements. No other method described earlier, is as accurate and at the same time lends Itself to such a diversity of stress work as do these gauges, an ingenious device of direct strain evaluation.
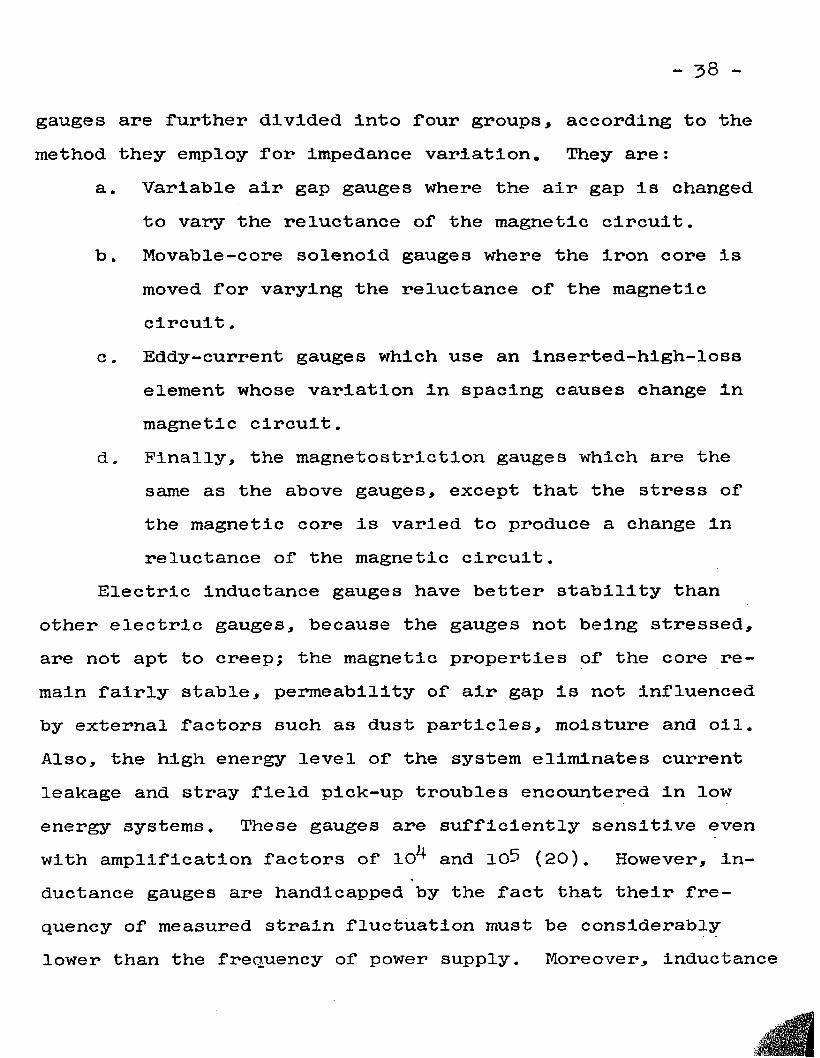
Pour main types of electric strain gauges have been constructed for the experimental analysis work. Although they differ very much in their individual operational principles, they all seem to have this property in common that each one of them transforms mechanical variation in the properties of the test specimen into either electric or electro-magnetic variation which is measured by means of available electronic instruments. Strain gauges are generally classified as follows:
1. Electrical inductance gauges.2. Electrical capacitance gauges.5. Piezoelectric strain gauges.4. Electrical resistance strain gauges.Inductance strain gauges consist of a magnetic inductance
coil. The mechanical property to be measured varies the magnetic field and thus the impedance in the current-carrying coil. Actually the inductance varies because of a change either in the spacing of air gap in flux circuit, or by the movement of an iron armature ih the coil. Electric inductance
- 3 8 -
gauges are further divided into four groups, according to the method they employ for impedance variation. They are:
a. Variable air gap gauges where the air gap is changed to vary the reluctance of the magnetic circuit.
b. Movable-core solenoid gauges where the iron core is moved for varying the reluctance of the magnetic circuit.
c. Eddy-current gauges which use an inserted-high-loss element whose variation in spacing causes change in magnetic circuit.
d. Finally, the magnetostriction gauges which are the same as the above gauges, except that the stress of the magnetic core is varied to produce a change in reluctance of the magnetic circuit.
Electric inductance gauges have better stability than other electric gauges, because the gauges not being stressed, are not apt to creep; the magnetic properties of the core remain fairly stable, permeability of air gap is not influenced by external factors such as dust particles, moisture and oil. Also, the high energy level of the system eliminates current leakage and stray field pick-up troubles encountered in low energy systems. These gauges are sufficiently sensitive even with amplification factors of 10^ and 105 (20). However, inductance gauges are handicapped by the fact that their frequency of measured strain fluctuation must be considerably lower than the frequency of power supply. Moreover, inductance
- 39 -
gauges are heavy and large, an undesirable property which further restricts their application in comparison to wire resistance gauges.
In variable capacitance strain gauges, the change in capacitance is accomplished by changing condenser plate spacing, by altering their area, or by varying the dielectric constant of the material separating the plates. Variable capacitance gauges have found applications in pressure cells, engine indicator units, and in torsiographs ( 6 ). These gauges are well-suited for high temperature ranges where wire resistance gauges cease to function adequately. But, the need of high- frequency carrier requires static calibration, and causes difficulty in the installation of gauge element. This also demands for special attention and care for insulation and planning of circuits. Damp atmospheres very significantly influence the operation of these gauges. The dielectric properties of the material used also affect the calibration, particularly within higher ranges of temperatures.
Piezo-electric gauges use crystals with piezoelectric property such as quartz and Rochelle salt, to transform mechan ical variations into electrical effects. Some common troubles encountered are the insulation of the crystal from the frame of the strain gauge, and the crystal's reaction to compressive action only. Furthermore, since higher forces are required to deform the crystal, this type of gauge cannot be applied to lighter structures.
- 40 -
The three kinds of above-mentioned electric gauges were devised prior to the advent of electric resistance wire strain gauges, the latter being an attempt to overcome the troubles or limitations in the use of the above gauges, and also to broaden the scope of experimental stress analysis.
The operating theory of an electric resistance strain gauge is based on the fact that mechanical displacement or change in strain causes variation in electric resistance which is amplified and measured by means of a potentiometer circuit. There are non-metallic and metallic wire resistance gauges, and Jfe>oth have either a bonded or unbonded form. The non- metallic unbonded gauge has a resistance element so arranged that when one part of the gauge is varied with respect to the other, it causes a change in pressure, which in turn varies the resistance of the element. It consists of a series of carbon plates put together in a stack. Any displacement in one part of this stack relative to the other, changes pressure on the stack plate, hence the resistance of the element is altered.
The non-metallic bonded gauge has the resistance element bonded directly to the specimen, and the strains in the specimen change the pressure or the dimensions of the bonded element, thus transforming a displacement into electrical resistance. Bloch prepared a carbon coating to be directly applied to the structure under test. The carbon particles, by moving closer or apart give a variation in resistance similar to that of a microphone. The measuring unit employed by Bloch was an
- 4 1 -
ordinary two-stage amplifier. Later, Hamilton Standard Division of United Aircraft Corporation developed an impregnated- plastic resistor which is used at present in place of carbon coating. Both bonded and unbonded non-metallic gauges have a rather restricted range of applications such as in aircraft propeller tests during flight, displacements, loads and strains in flexible cables, vibrating members, pressure gauges and dynamometers. The main disadvantages are that they are cumbersome and less accurate than the wire resistance strain gauges.
The unbonded metallic gauge was first devised by R. W. Carlson (5).» and used in detecting strains in concrete structures. Carlson gauges in their simplest form consisted of three coils of wound wires, one coil being unaffected by the gauge motion, and the other two colls made tension sensitive; one having reduction in tension and the other an increase in its tension whenever the gauge was displaced. Unbonded wire strain gauges having essentially the same principle are made by Statham Laboratories, and are used in several devices such as pressure pick-ups, and force and acceleration recordings.
Clark and Datwyler at California Institute of Technology and Professor Ruge at Massachusetts Institute of Technology were the noted men who came out with practical application of the bonded electric wire-reslstance strain gauge directly to the specimen being tested. A resistance wire strain gauge is composed of a fine grid of wire about 0.001 inch in diameter, and cemented between two sheets of treated paper or felt.SR-4 gauges manufactured by the Baldwin Southwark Division,
- 42 -
Baldwin Locomotive Works, are the type of electric strain gauges used extensively in current stress analysis work.
In order to obtain better and accurate results by the use of electric strain gauges, the following factors are of importance : The determination of the location for mountingstrain gauges, a thorough cleaning of the surfaces on which the gauge is to be applied, a good bond between the gauge and the specimen, sufficient drying period (preventing excessively high temperatures if artificial heat is used), and an open check of the gauge to detect any damage done during the mounting process. Detailed information on mounting procedure is furnished by the gauge manufacturing company or could be obtained from various articles dealing on this topic.
Fundamentally, electric wire resistance gauges require four simple circuits for the transformation of the measured mechanical displacement into electrical resistance. The first circuit Includes the source of supply; it could be a d-c battery or an a-c oscillator unit. The gauge circuit Is the second part of the main circuit. This correlates the mechanical displacement to be measured to the potential difference caused due to the displacement. The amplifier circuit, which merely boosts up the signal from the gauge circuit without any warping or distortion, forms the third circuit. The recording or metering circuit is the fourth element of the main circuit. This circuit has two parts, the discriminator and the galvanometer or oscilloscope. Thus It has a double function, it discriminates the sign of displacement being measured
- 4? -
and then records the signal. A diagrammatic sketch of the static and dynamic circuits as prepared by H. R. Lissner and C. C. Perry, and used for a resistance wire electric strain gauge is presented in the Appendix. The circuit essentially consists of a simple Wheatstone bridge, the active and dummy gauges usually forming two sides of the bridge. To start with, the bridge is balanced under no load, or for dynamic testing, under static loading conditions. As the active gauge is further stressed, either due to static loading in a static circuit, or due to dynamic stresses in a dynamic circuit, it unbalances the formerly balanced Wheatstone bridge.The deviation from balanced condition, after being amplified, serves as a measure of mechanical strain in the specimen tested.
Gauge factor, very frequently encountered in connection with bonded wire electric gauges, is simply a ratio of change of resistance to change of strain, and is dimensionless. Expressed by a formula is would be:
ARG.F. = R
Ewhere G.F. refers to gauge factor,
A R is the change in resistance,R is the total change,and E indicates the unit strain.
According to F. G. Tatnall (28), three basic types of circuits are applicable in all types of strain gauge work. A
- 44 -
diagram representing all three forms of the circuits is shown in Figure 5. The first one is for measuring bending, eliminating both tension or compression. Applications of this type can be cited in shop gauges, comparators, and other instruments replacing dial gauges. The second kind of circuit is the one for measuring axial components only by eliminating bending. This circuit is commonly used in determination of load on the work as in a press or power tool, in measuring fluid pressures, in commercial pressure cells, and in engine indicators. The last type of circuit is the one used for measuring torque or twist. This circuit measures both static torque and torsional vibrations.
Electric strain gauges have diversified uses. Some of the more unusual and important applications are listed below. These gauges have been used in explosive impact tests, analysis of hortonsphere, underwater explosions, evaluation of residual and fatigue stresses, and in model studies in supersonic wind tunnel tests. In the aircraft Industry they are used for determining Impact loading of the airplane, repeated load Investigations in aircraft components, and In telemetering Impact forces in airplane drop-test. The gauges are applied in ship-building problems, structural evaluation of engine parts, in observing performance of large machinery operating conditions, and in determining vibratory stresses In turbosupercharger buckets. They are used in farm machinery as an aid in development and In design, and for determining power
- 45 -
IDAS
FIG. A. MOMENT
LOADl R2
F1G*B« FORCE
I ■x ‘ I)
C AND D OH OPPOSITE SIDS
FIG.C. TORSION
Pig. 0. Three Basic Circuits of Wire Resistance Gauges. (29)
- 46 -
and torque distribution under field conditions. As a means of measuring other physical properties, the gauges are used for precision determination of weights, as accelerometers, as velocity meters, as three component force recorders, and used as drawbar dynamometers as shown in Figure 6. Among the unusual applications, strain gauges are used for determining mechanical behavior of the skull and its contents when subjected to injuring blows.
With so numerous advantages, these strain gauges also have some drawbacks. Exact location of the gauges is a very important factor, its determination sometimes becoming impractical. High temperatures or oily conditions can make these gauges defective. Centrifugal forces in rotating parts (where gauges are mounted), tend to break the lead wires away from the gauge, thus ruining the finer gauge wires. Instrumentation and careful analysis of the stresses calls for an experienced person with high skill in order to get satisfactory performance and accurate results.
In most of the stress analysis work, strain gauges are mounted on rotating parts, and a satisfactory means to make electrical contact between the rotating elements and the stationary recording and control unit Is highly desirable. The devices used for this purpose are called torquemeters. Figure 7 shows a bonded wire gauge torquemeter designed by A. C.Ruge (26). This is essentially a brush and slip ring assembly where three brushes In parallel are used on each slip ring In
Figure 6. Strain gauge drawbar dynamometer. (i4)
Figure 7. Bonded wire gauge torquemeter.
- 49 -
order to provide continuous contact even under heavy vibrations. However, due to the fact that at times the resistance between the rings and brushes is greater in magnitude than the actual variation in resistance of the strain gauges, this unit becomes inefficient and may cause severe error in recordings or readings of actual strains. Also high speeds and oil in the slip rings effect the performance.
Another unit using electromagnetic principle for making between stationary instruments and rotating mechanisms is the magnetic-coupled torquemeter constructed by B. P. Langer and K. L. Wommack (2l), as shown in Figure 8. In principle, the torquemeter consists of a magnetic strain gauge where the portion of magnetic circuit carrying the coils remains stationary, and the variable air gaps are mounted on the rotating shaft.The magnetic flux is transmitted from the stator to the rotor through radial air gaps. No slip ring3 and no electric coil3 (which may be damaged due to centrifugal forces) are required.On account of its calibration of the circuit and rather intricate construction, its accuracy is effected, and construction becomes a costly item.
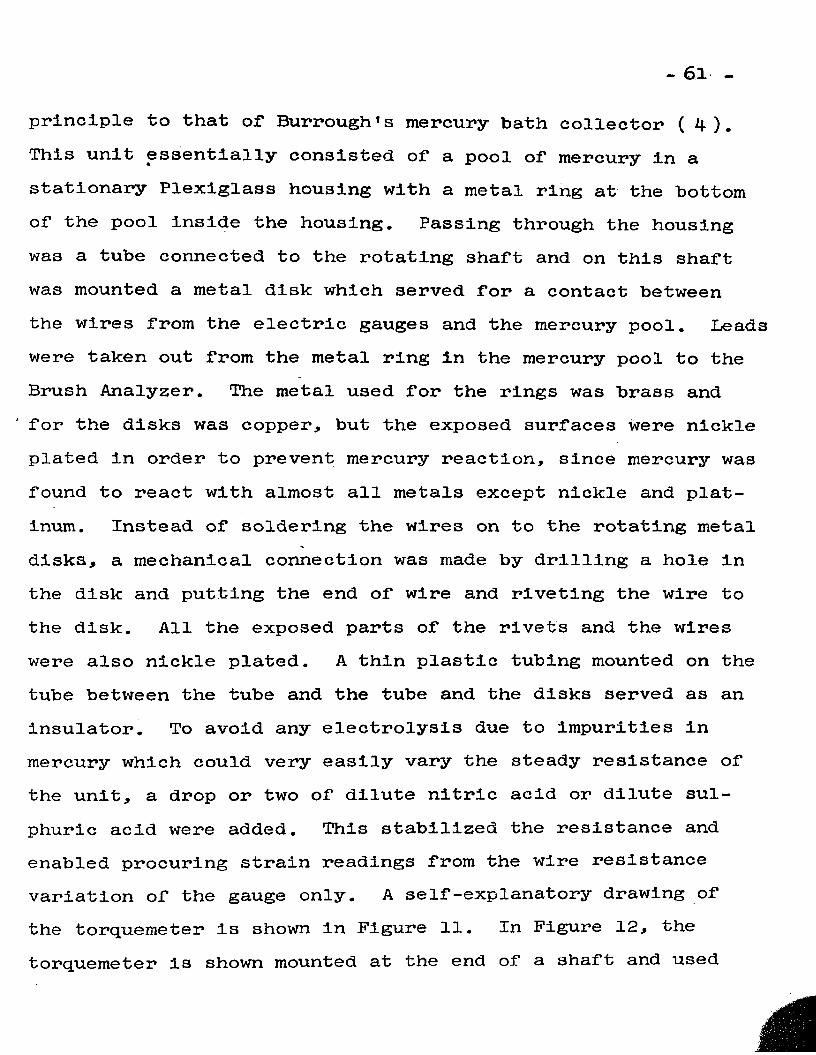
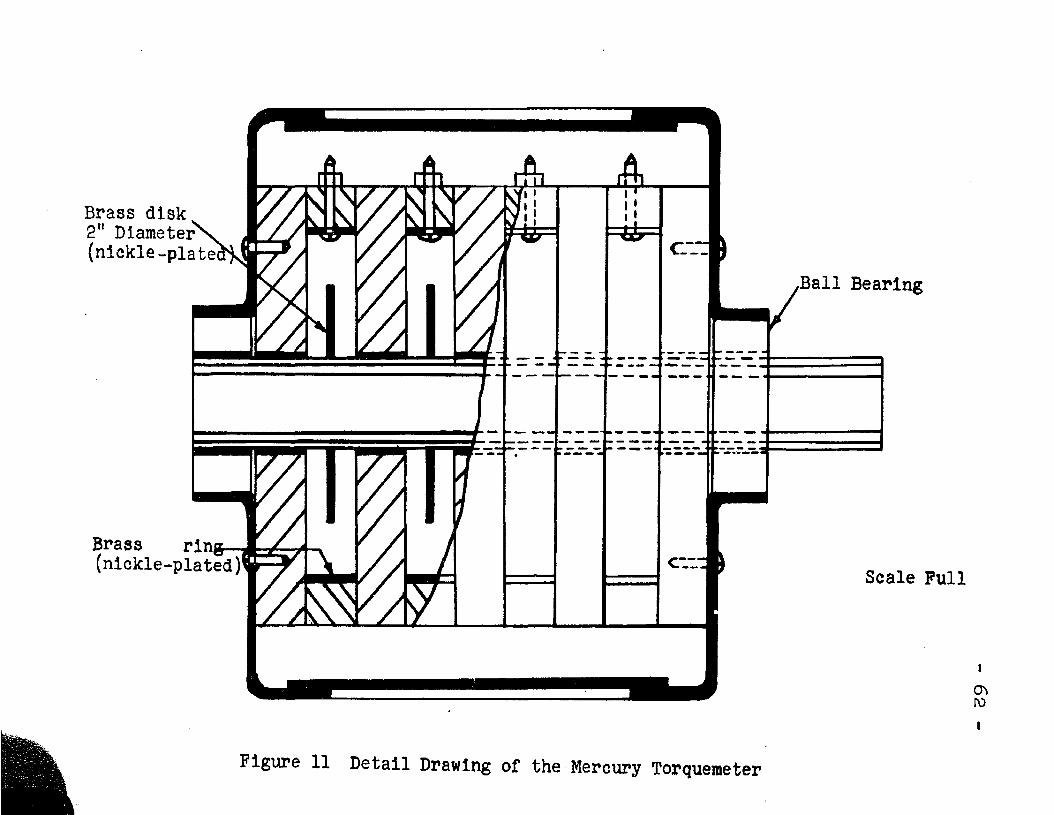
A mercury bath collector as constructed by D. E. Burrough (4) has been used on some power and torque determinations. The critical electro-chemical nature of mercury being in contact with metal influences the properties and tends to vary the resistance more than the resistance variation in the body of the gauge itself. The construction details, together with modified torquemeter as designed by the author are discussed in the experimental part of the thesis.
- 50 -
- 51 -
The strain gauge is a fine and tiny resistance element in which slight changes in length or cross-section result in resistance variations of the Wheatstone bridge. The means of measuring and recording the strains, therefore, become essentially a problem of determining these minute resistances.
The more important pieces of equipment that go into the strain measuring circuits are power supply units, bridge circuits, amplifiers, oscillographs and galvanometers. Several strain recording sets have been manufactured, varying mainly in the number of measuring channels, capacity, and power supply units .
An entire strain gauge control unit consists of balancing controls for strain gauge bridge, a zero adjuster, sensitivity controls, a vacuum-tube amplifier and an output circuit for coupling amplifier output to the oscillograph. In fact it includes all the electrical instruments between the strain gauge and the recording oscillograph.
Several types of amplifiers can be used in the circuit depending on the frequency requirements of strain measurement, and on the kind of electrical power input. A direct-coupled amplifier responds to both static and dynamic strains, whereas the capacitance-coupled amplifier will respond to dynamic strains only. But the direct-coupled amplifier Is not stable, and runs out of adjustment and balance. A capacitance-coupled amplifier together with a phase-sensitive demodulator or discriminator is more commonly used. This combination eliminates
- 52 -
inter-relationship between zero and sensitivity adjustments.The demodulator prevents the carrier frequency from reaching the galvanometer, but lets strain variations pass through.Also this system enables the current to flow through the galvanometer in one direction for tension and in the opposite direction for compression, and galvanometer current will be zero for zero strain. To avoid drifts (caused by heater and plate voltages variation, and by slower variations in the emission of the cathode surfaces) in the vacuum-tube amplifier, negative feedback principle is used. This merely consists of balancing a part of output voltage against the input voltage. Negative feedback is essentially a resistance voltage divider operating backwards, and even though the gain of amplifier may vary widely, the entire gain with a proper negative feedback may change very little so as to be immeasurable. These strain gauge control units have resistance and capacitance balancing controls to permit convenient balancing of the strain gauge bridge. A ten-step attenuator is provided for accurate adjustment of sensitivity from zero to one hundred percent in 1C$ steps.
The source of power comprises a 12-volt or 24-volt storage battery, or a llO-volt 60-cycle line, and furnishes accurate and regulated d-c power for the anodes of the vacuum tubes in the control unit and carrier power for the strain gauge circuits.
Indicating and recording devices have a great bearing in their use with strain gauges. Proper selection of these
- 55 -
instruments is necessary in order to assure satisfactory results. An oscillograph is a high speed recording instrument that records strain variations in a permanent form. The galvanometer and a small rotating mirror and the sensitive moving film are the essential recording elements. The mirror rotates through an angle proportional to galvanometer current and reflects a beam of light onto a moving chart of sensitized paper or film. Sometimes, a combination of galvanometers is used in a single oscillograph so as to record a number of strains simultaneously on the same chart.
Following are the essential elements of an oscillograph:1. Galvanometers with mirrors and moving charts.2. Chart-drive mechanism and a light source and optical
system.3. Time-recording device.4. A transmission to select suitable recording speed.5. Viewing screen for the operator to read deflections.6. A counting device to record each oscillogram.7. A length-control device for the recording film.8. Galvanometer circuit attenuators.9. Automatic control on oscillograph lamp voltage.Oscillographs can be classified into the following groups1. Cathode ray oscillograph.2. Magnetic oscillograph.c. Piezoelectric or crystal oscillograph.
- 54 -
The first kind of oscillographs are not produced commercially. They are mainly used for high frequencies recording which are too high for magnetic oscillographs. The common forms of magnetic oscillographs are the string type and the moving-coil type. The former is sensitive to frequencies ranging from zero to 8,000 cycles per second, and consists of a single straight conductor whose shadow is projected on a moving photographic film. Moving-coil type has a torsion- ally rotatable coil in a magnetic field with a small mirror reflecting beam of light on a moving film. Its frequency res ponse is from zero to 12,000 cycles per second. These oscill ographs have as many as 24 galvanometers and are multichannel instruments. An illustration of a general-purpose Economy Oscillograph is given in Figure 9 manufactured by the Hathaway Instrument Company (15)* an organization of high reputation for making electronic instruments for electric strain gauges and other devices. This oscillograph is multi-channel instrument having six to twenty-four elements.
PURPOSE OF THE INVESTIGATION
The science of machine design has been in the past based on theoretical evaluations and certain analytical techniques. With the advancement of the experimental procedures and perfection achieved in the application of these experimental methods to the design or redesigning of the machines, an extensive field of experimental machinery testing has been developed. In the case of farm machines, bulky and somewhat crude mechanisms, formerly designed on the basis of trial and error method, are being refined and modernized by means of the available experimental aids.
The main object of this study was to apply one or several of the available experimental techniques in the evaluation of stresses either in the farm machines already designed or in an experimental machine representing a combination of various common mechanisms. Then an attempt was to be made to compare and correlate the experimental data with the theoretical determination of design analysis on the same machine.
With this intent, a preliminary investigation was conducted on a hay baler by stresscoating some of the parts with higher stress concentration determined previously by using the theoretical analysis. However, the circumstances did not favor the study on one specific machine, hence the Investigation was left Incomplete. Later, the work was conducted on the feasibility of such an investigation on several
- 57 -
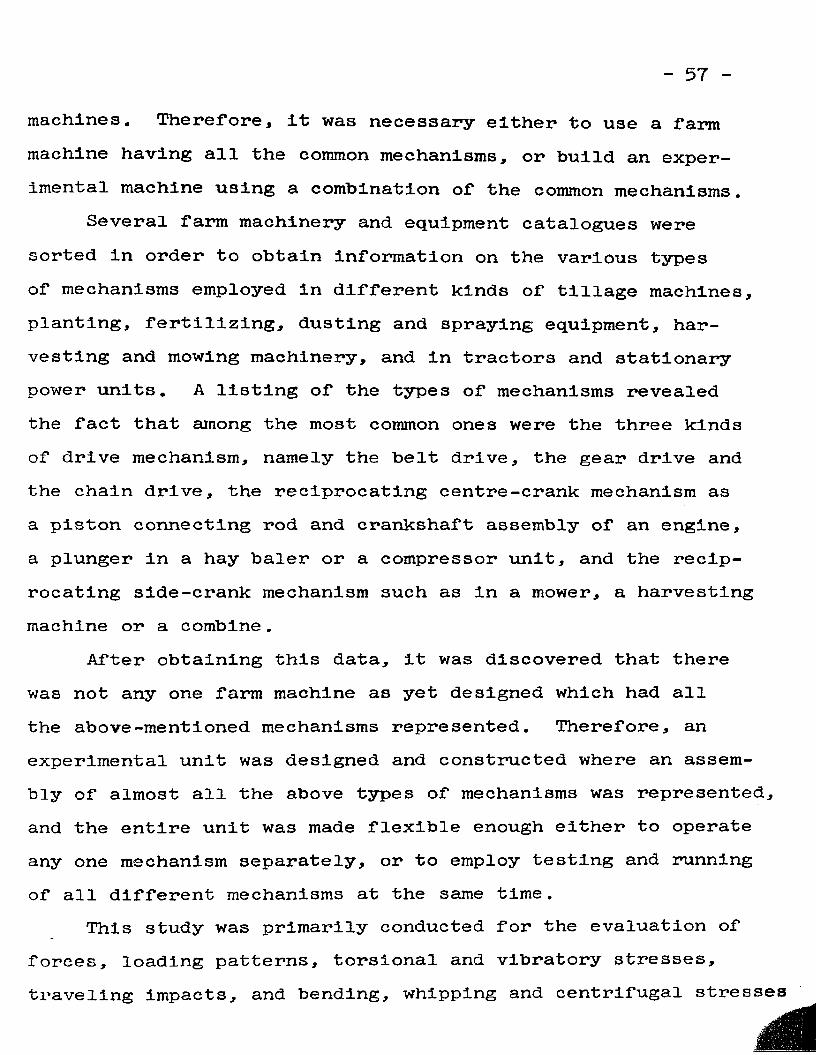
machines. Therefore, it was necessary either to use a farm machine having all the common mechanisms, or build an experimental machine using a combination of the common mechanisms.
Several farm machinery and equipment catalogues were sorted in order to obtain information on the various types of mechanisms employed in different kinds of tillage machines, planting, fertilizing, dusting and spraying equipment, harvesting and mowing machinery, and in tractors and stationary power units. A listing of the types of mechanisms revealed the fact that among the most common ones were the three kinds of drive mechanism, namely the belt drive, the gear drive and the chain drive, the reciprocating centre-crank mechanism as a piston connecting rod and crankshaft assembly of an engine, a plunger in a hay baler or a compressor unit, and the reciprocating side-crank mechanism such as in a mower, a harvesting machine or a combine.
After obtaining this data, it was discovered that there was not any one farm machine as yet designed which had all the above-mentioned mechanisms represented. Therefore, an experimental unit was designed and constructed where an assembly of almost all the above types of mechanisms was represented, and the entire unit was made flexible enough either to operate any one mechanism separately, or to employ testing and running of all different mechanisms at the same time.
This study was primarily conducted for the evaluation of forces, loading patterns, torsional and vibratory stresses, traveling impacts, and bending, whipping and centrifugal stresses
- 58 -
in the mechanisms commonly used in farm machines. For this purpose the electric wire resistance strain gauges were to be used and a similarity or comparison were to be drawn between the experimental and analytical procedures. Moreover, it was desired that such an investigation being fundamental in its nature, would assist in designing or redesigning the above mechanisms in any farm machine where the knowledge of operation and performance characteristics were already known.
Due to the fact that the experimental machine was to consist of diversified mechanisms, and no recording instruments
»
for field conditions were available, it was not practical to test the machine under actual field conditions. Therefore, all the experimental test work and analysis was conducted in the laboratory.
Instrumentation of the Project
A project involving work of an experimental nature would undoubtedly have some instrumentation in order to facilitate measurement and evaluation of certain desired quantities. The nature of this project being similar, this kind of experimentation demanded instruments for measuring speed of rotating parts, mechanical and electrical loads of transmission and drive mechanisms, and the variation of electric resistance of the fine grid of the wire gauges. Besides, some type of arrange- • ment for the steadyresistance electric contact between rotating parts and the stationary recording instruments was necessary
- 59 -
to transfer* electric signals from the gauges to the pen recorder.
The Brush Analyzer
The type of electronic instrument used to amplify the strain gauge signals and to record them in terms of calibrated strains was the Model BL 310 Brush Analyzer and Oscillograph ( 5 ). This instrument had a frequency range from zero to 120 cycles per second, and was equally applicable for both static and dynamic strain measurement. The type of recording consisted of a magnetic pen motor with a recording pen, and chart speed adjustable to 5» 25 and 125 mm/second. The wiring diagram for the instrument is given in Figure 10. This clearly indicates the path of the electric signal after it is picked up from the Wheatstone bridge. The functions of the attenuator the discriminator, the oscillator and the amplifiers are the same as stated earlier in connection with the description of instruments for strain gauges in the review of literature.
tThe Mercury Torquemeter
In order to bring the electric signals from the rotating units to the stationary Brush Analyzer, some kind of electric contact device with non-varying resistance was required. In looking through the types of such devices, called torquemeters, It was desirable from the economical and steady electric con-
t
ductance standpoint to construct one based on somewhat similar
- 6o -
Attenuator PenMotorA-cAmplifier
Oscillator T£Ts crimina- tor.
Fig. 10 Wiring diagram Brush Analyzer Model BL 310
principle to that of Burrough's mercury bath collector (4). This unit essentially consisted of a pool of mercury in a stationary Plexiglass housing with a metal ring at the bottom of the pool inside the housing. Passing through the housing was a tube connected to the rotating shaft and on this shaft was mounted a metal disk which served for a contact between the wires from the electric gauges and the mercury pool. Leads were taken out from the metal ring in the mercury pool to the Brush Analyzer. The metal used for the rings was brass and for the disks was copper, but the exposed surfaces Were nickle plated in order to prevent mercury reaction, since mercury was found to react with almost all metals except nickle and platinum. Instead of soldering the wires on to the rotating metal disks, a mechanical connection was made by drilling a hole in the disk and putting the end of wire and riveting the wire to the disk. All the exposed parts of the rivets and the wires were also nickle plated. A thin plastic tubing mounted on the tube between the tube and the tube and the disks served as an insulator. To avoid any electrolysis due to impurities in mercury which could very easily vary the steady resistance of the unit, a drop or two of dilute nitric acid or dilute sulphuric acid were added. This stabilized the resistance and enabled procuring strain readings from the wire resistance variation of the gauge only. A self-explanatory drawing of the torquemeter is shown in Figure 11. In Figure 12, the torquemeter is shown mounted at the end of a shaft and used
Brass disk 2" Diameter (nickle-plate
Brass rin0 (nickle-plated)
Ball Bearing
A■v
7Scale Full
o\r o
Figure 11 Detail Drawing of the Mercury Torquemeter
- 63 -
Figure 12. Mercury torquemeter mounted on the main shaft.
A
- 64 -
for strain readings of the rosette gauges on the pulley shown in the figure.
The Stroboscope
The nature of the experimental work demanded for more pre cise measurement of the magnitudes of various quantities. Knowing that the type of drive used would affect the precision desired, no mathematical computations were relied upon to determine various speeds of several drives under varying or constant loading conditions. For a higher precision and greater accuracy, the Strobotac was used. Strobotac was used as an electric timing device to measure rotational speeds. Low and high intensities of speeds could be measured by this Strobe- light, although in this particular experiment only the low range was used. The accuracy of this instrument as stated by its manufactures was within + 1%.
The Simpson Meter Model 260
A combination of volt meter, ohm meter and ammeter was used during the experimental work. The ohm meter was used to make open check of the resistance gauges so as to determine whether or not there was any damage done to the gauges while mounting or during the operation of the machine. The steadiness of the resistance in the torquemeter cells was also determined by means of the ohm meter. The volt meter and the ammeter combination was used in measuring the output of the electric motor generator type dynamometer used for loading the gears.
- 65 -The Electric Dynamometer
The power-take-off absorption dynamometer was used for loading the gears. It was necessary to have some kind of fairly uniform load and due to its accessibility and flexibility, the electric motor generator combination dynamometer in the research laboratory was the only possibility that could assure comparatively uniform loading. The experimental machine was driven by a Co-op 4 E tractor, and on one end of the main shaft of the machine a universal Joint wa3 mounted to drive the electric dynamometer; the dynamometer was in turn hooked to an electric resistance load panel consisting of 24 individual heating elements. This enabled uniformity of loading and some variation in the amount of loading by hooking any number of heating elements desired for any specific run.
Figure 13 shows the instruments used for this project.From left to right the instruments are the Brush Analyzer with pen recorder, top right the Strobotac and bottom right the combination unit of the ohm meter, ammeter and volt meter.
Figure 15. Instruments used in the project. a\
- 67 -
Experimental
The experimental stress analysis machine constructed for the purpose of the investigation consisted of the following mechanisms all mounted together to form a compact unit and yet each of the mechanisms was independent of the other in its operation, or the entire unit was operated as an assembly:
1. The plunger mechanism consisting of a flywheel, acrankshaft, a connecting rod, and a piston used asa plunger. The chamber or cylinder part was substituted for by a circular pipe whose inside diameter was equal to the diameter of the plunger. A compression spring was used to load the unit.
2. The mower assembly comprising a flywheel type crank,a steel pitman, and a cutter bar. No load was applied to this assembly, and all the analyses were based on no load conditions.
5. The V-belt drive consisting of pulleys driving the plunger mechanism or the mower assembly.
4. The spur gear drive. In this unit the gear was mountedon the shaft connected to the power-take-off of thetractor, and the pinion was keyed to the main shaft which was driving the electric dynamometer.
Figures 14 and 15 show the right side and the rear right side views of the assembly. These pictures were during the testing of the plunger and the mower units; therefore, the torquemeter is shown mounted at the end of the main shaft
Figure 14. Side view of the experimental machine. oo
Figure 15. Rear right side view of the experimental machine
instead of* the universal joint which was replaced in the gear tests for driving the electric dynamometer. Detail drawings of the assembly showing each unit separately are added in the Appendix. The machine was at times driven by an adjustable speed electric motor or by the tractor.
The Analysis of the Centre-Crank Mechanism
Theoretical analysis of the plunger mechanism was made on the flywheel, the crankshaft, and the connecting rod for the conditions under which the experimental testing was conducted.A further discussion on each of these elements is presented below.
Flywheel. Three half inch gauges were mounted on the flywheel, one of them was on the underside of the rim, and two were cemented on either side of one of the arms near the gauge on the rim. The variation of the load on the piston was accomplished by using a compression spring having a spring scale of 31 pounds per inch. This enabled the evaluation of stresses for three different loading conditions. In the first case no load was applied against the piston head and it was allowed to operate free. In the second instance, the compression spring was used, but the spring was not initially loaded. In the third series of the test run, the compression spring was initially loaded by placing an extra tube behind the springinside the main tube.
The intent of this test was to measure the total stresses in the rim and in the arms. On account of the fact that this
- 71 -
particular flywheel was too stiff for the set-up, the bending stress signals of a greater magnitude either from the rim or the arms could not be obtained. However, it was observed that the stresses in the arms were much higher than in the rim. In the case of the arms it was apparent that the experimental stress due to sudden starting was as much as five times higher than the dynamic running stresses both due to the belt tension and the centrifugal forces. This value was higher than the theoretically calculated stress, which itself might have been off due to .the variation in magnitude of certain assemptions that were made. Moreover, the computed theoretical stress was for the point of maximum stress concentration, whereas, due to the flywheel curvature, the gauges could not be mounted directly on the theoretical point of maximum stress.
The experimental stress in the flywheel rim was 4.7^ higher than the theoretical stress. The flywheel speed was varied from 52.5 rpm to 450 rpm in order to determine the magnitude of the stress due to the centrifugal force. The nature of the set-up restricted speeds of a greater magnitude. Although the values of the stresses in both the rim and the arms were not very high, a significant upward trend was noticeable. However, the increase did not quite follow the high increase in the magnitude obtained from the theoretical analysis. It was not the primary intent to run the mechanism at higher speeds, for it was supposed to represent conditions for a plunger of a baler, or a low speed compressor.
- 72 -
One thing was very significant from the data on the two gauges mounted on the arms. In case of the gauge mounted a— head of the other in the direction of rotation, the belt tension seemed to add to the existing stresses thus giving a higher stress value than the other gauge recordings which had a somewhat cancellation effect between their compressive and tensile stresses acting at the same point. This was in accordance with the theoretical analysis of the situation.
Connecting Rod. Three gauges were mounted at different locations on the connecting rod. One 1/8" gauge was mounted directly above the centre line of the wrist pin and oriented in the direction of the travel of the piston. The second 1/2" gauge was mounted on the middle of the connecting rod between the centre lines of the wrist pin and the crankshaft. The third gauge was cemented directly above the centre line of the crankshaft. The last two gauges were oriented in the same direction as the first gauge.
The intent of tests on the connecting rod was to determine the effects and relative magnitudes of repeated compressive and tensil stresses, whipping stresses due to inertia forces, and the vibrating stresses due to impact.
Test readings were taken from all three gauges for no load, spring load, and the loaded spring conditions, and for a speed range of 52.5 rpm to 4^0 rpm. A comparison between the theoretical and experimental values of the total stress was made and it was found that the average stress values
- 73 -(averaged for the three gauges) were about 2-1/2 times higher than the calculated stresses from Bach's and Gordon's Formulas (27). The maximum stress for the same run was far greater in value than the theoretical stress. The stresses, however, increased as the load was applied on the piston head from a no load to loaded spring condition. It was found that for the 1/8" gauge the stress for loaded spring condition was as high as 1200 psi in comparison to the theoretical stress of 541 psi.
The stress distribution pattern was also determined from the experimental values, and it was found that the maximum total stress was nearer to the piston end of the connecting rod and decreased slightly from the wrist pin end to about half the length of the connecting rod, but decreased to almost 1/3 at a point directly above the crank pin centre.
An effort to Isolate and evaluate the vibratory stresses did not prove successful. It could have been due to two reasons, either the speed of 430 rpm was not high enough to cause any vibratory stress or that the recording instrument which had a maximum frequency range of about 100 cycles per second was not capable of picking up the higher frequency vibratory and travelling impact signals. According to the author's belief, most probably the latter case was true.
By studying the graphs from the charts for all the three gauges, it was apparent that for no load condition, the 1/8" gauge recorded maximum stress at an angle of about five degrees between the connecting rod front end and the horizontal. The
- 74 -
application or load increased this angle until the point of maximum stress was attained at around 15 degrees ahead of the dead centre for the loaded spring condition. For the 1/2" gauge on the mid—section of the connecting rod, it was observed that the maximum stress point was reached ahead of the dead centre. No much variation was noticeable between the no load and the loaded conditions. The other l/2n gauge strain patterns were not sufficiently clear to conclude any results from their graphs.
Crankshaft. A 1/8" gauge was mounted on the crankshaft fillet where the crank pin and the crank were jointed, and it was oriented along the centre line of the crank pin. Realizing the fact that most crankshaft failures occur due to repeated bending or reversed torsional stresses, the object of this part of the experiment was to determine experimentally and theoretically the total stress caused by the torsional and bending stresses in the crankshaft caused due to the forces acting against the piston, and due to the inertia forces.
Although many approximate methods are available for evaluating the stresses theoretically, none of these methods seem to give a decent approximation for any general condition where the stresses in the crankshaft are to be measured. In the project work, it was not feasible to evaluate the torsional and bending stresses separately, but an attempt was made to obtain the total stress. A glance at the comparative magnitudes of the theoretical and experimental values presented in
- 75 -
the Appendix distinctly reveals that the experimentally determined stresses were far greater than the calculated values.The experimental chart revealed also that the compressive stresses were two to four times higher than the tensile stresses. Another interesting thing observed from the stress pattern of the graph was that the total stress did not change sharply from the compressive to the tensile stress, but the compressive stress decreased with one slope at first, then the slope changed around 75° of the connecting rod angle with the horizontal before a high point of tensile stress was reached. This fact indicated that at the point of slope change, impact forces are prevalent, and these forces suddenly vary the load exerted by the connecting rod on the crank pin. An oscilloscope would have been desirable for evaluating the impact frequency.
A chart showing the effect of load variation on crankshaft stresses is presented in Figure 16.
The Analysis of the Side Crank Mechanism
The mower assembly was rather similar to the distribution and types of stresses determined earlier in the plunger mechanism. In this experiment, a steel pitman Instead of a wooden pitman was used so as to give a true picture of the stresses with possible dampening effect. The mower was used with no load due to the lack of feasibility of the loading operation in the laboratory.
- 76 -
Fig. 16 Graph of effocts of load variation on crankshaft stresses.
- 77 -The stresses evaluated experimentally were mainly in
various sections of the pitman and in the driving pulley for the mechanism. In this section only the pitman stresses are discussed and the stresses in the pulley are presented in the section of stresses in v-belt drives.
Three gauges were mounted at three different locations on the pitman. All gauges used were 1/2 inch In size. One gauge was used directly on the fillet of the socket of the pin Joining the pitman and the cutter bar. The second gauge was mounted at the mid-section of the pitman. The third one was mounted on the fillet directly under the socket of the crank pin. All three gauges were oriented In the direction of travel of the pitman. The unit was run from a speed of 175 r.p.m. to about 1020 r.p.m. The main purpose of this study was to evaluate whipping stresses, compressive or tensile stresses, and if possible, the vibratory stresses due to impact.
The theoretical analysis was made for the whipping stress and the compressive or tensile stress due to the load. These two added together gave the total average stress in the pitman. The analysis of the experimental data yielded the total stress. The picture of recordings ranging from the minimum speed of 175 r.p.m. to higher speeds showed a considerable increase in the magnitude of the stress with the speed, indicating the effect of whipping stress becoming more pronounced as the speed was increased. A chart of the experimental strain curve for the 1/2 Inch gauge at the mid-section of the pitman is presented in Figure 17t for a speed range of 175 r.p.m. to 615
Fig. 17 Strain recordings of inch, gauge at the pitman mid-section for various speeds.
- 79 -r.p.m., showing that an increase in speed of about 3.5 times resulted in an increase of about 200 percent in the magnitude of the total stress. Furthermore, the chart revealed the fact that the tensile stress at that particular point developed from about 150 psi to 1500 psi for a speed range of 175 r.p.m. to 615 r.p.m. The compressive stress for the same speed range increased from 1500 psi to almost 3000 psi. This experimental increase of the stress with an increase in the speed checked fairly well with the theoretical relationship obtained from Bach's formula (26) for whipping stresses.
A similar trend was apparent in the case of the other two gauges, but the magnitudes of stresses were not quite as high. The stress pattern gave the information that the maximum stress was somewhere near the mid-section of the pitman and that the stresses at crank end were of a greater magnitude than the stresses at the cutter bar end of the pitman. It is certain that when the load is applied on the cutter bar, the stress pattern may not remain the same. Probably the cutter bar end of the pitman will then show higher stresses. It Is of question whether the stresses at the mid-section will still be the critical stresses in the design of the pitman. Again, comparing the values of the theoretical and experimental stresses it was apparent that the latter were of greater magnitude .
The vibratory stresses could not be evaluated experimentally, due to the inability of the instruments to pick up high frequency signals.
- 80 -
The Gear Drives. Gear drives were recognized as a common mode of power transmission in various farm machines. Spur gears, helical gears and bevel gears are very frequently used for transmitting greater load or for chaning the direction of motion of the transmitted load. Any machine from the tillage equipment to a combine will have at least some kind of gear drive. Noticing that gears were very common among the mechanisms used in farm machinery, a study on an experimental level was conducted in evaluating stresses and the stress patternsiin the gear teeth.
For the purpose of the investigation, a pair of spur gears of a diametral pitch of 5 were used. The pinion was made of steel and had a pitch diameter of four inches. The gear was made of cast iron and with a pitch diameter of eight inches.Two l/l6 inch gauges were mounted on one particular tooth of the pinion and two more l/l6 inch gauges were mounted on the tooth of the gear mating with the tooth of the pinion with the gauges. The locations for mounting the gauges were chosen from the photo elastic tests on mating of spur gears conducted by Boor and Stitz (2). One gauge was mounted directly at the root of the tooth and the direction was oriented such that its centre line made an angle of 90° with the tooth profile. This was to approximate the stresses at the point of the tooth base where the stresses were supposed to be very great. Another gauge was mounted at the point of contact of the tooth and direction oriented approximately along the pitch diameter.
- 81 -
An electric generator load was used for loading the gear and the pinion. The gear was used as the driver and the pinion was the driven one. The load applied was actually a panel of 24 electrical heating elements each of 660 watts and 115 volts. Some variation of the load was accomplished by hooking or unhooking the heating elements in the circuit. The maximum stress due to starting load was also sought.
The analysis of the stresses both for the theoretical and experimental points of view were made, and the latter were found to be slightly higher. The stress values for one particular load and speed conditions mentioned in the Appendix were as much as 26.5 percent higher for the experimental analysis in comparison to the calculated value.
Also, it was significant that the stress for the sudden starting was almost 1.5 times higher than the running stress. Moreover, a signal indicating a higher stress than the running stress was recorded when the generator started operating. The effect of the variable power demand of the generator was apparent from the fluctuations of the strain curve. This could mean that the input and thus the output of the generator was rather unsteady, a factor which would not be too desirable.
The V-belt Drives. Centrifugal forces and the forces due to net belt tension are usually responsible for the total stresses acting on the rim of a pulley. For the experimental and theoretical analysis of the stress, a rosette of l/l6 inch gauges was made on a point on the rim of the pulley.
- 82 -
Later*, due to the damage done to two of the gauges in the rosette, these were replaced by 1/8 inch gauges. This influenced the approximate point concept to a certain extent by increasing the area of contact over which the gauges measured the stresses.
A rosette was used on a six inches diameter v-belt pulley used for driving the mower mechanism. The idea was not only to evaluate experimentally the magnitudes of the total stresses, but also to determine approximately the direction in which the maximum stress was acting.
The results obtained aided in meeting the above goal.The axis of maximum stress was along the perpendicular to the horizontal centre line of the pulley. The values obtained in the test consistently revealed that according to the orientation of the gauges, the gauge mounted at 45° with the horizontal and to the left of the perpendicular gauge showed a stress of about one-half of the stress recorded by the perpendicular gauge. The gauge to the right of the perpendicular gauge and at 45° with the horizontal gave a recorded value of about a third of the stress in the perpendicular gauge. The effect of speed increase was also pronounced in all gauges on the development of higher stresses.
The tests were made while using the pulley as a driver for the mower assembly. The observation of various forms of the strain graphs for the gauges was also interesting and informative. The two gauges at 45° with the horizontal had
apparently the same general stress pattern, whereas the perpendicular gauge had a pattern of its own. The strain recording for the perpendicular gauge was of a sinusoidal nature showing smoothness of the stress variations. The other two gauge patterns distinctly revealed the temporary discontinuity and a sudden large stress showing the mower effects transmitted back to the pulley.
The values obtained by calculation were much lower than the experimental values. Therefore, no comparison was drawn between the two. The lower theoretical values could be attributed to either one or both of the following two reasons.Either the net belt tension was far greater than the one approx imated by the theoretical calculations, or the centrifugal forces were higher in magnitude than the ones determined theoretically.
CONCLUSIONS
From the results obtained in the various mechanisms, and from the discussion presented in the experimental part, the following conclusions can be derived:
The theoretical stress analysis furnishes stress values only on an average basis which in many instances are not the maximum stresses prevailing in a machine part.
A flywheel with a heavy rim has greater stresses in the arms than in the rim since the arms carry a greater share of the load.
Sudden starting or stopping stresses in the arms may be about 2 to 4 times higher than the running dynamic stresses depending on the set-up.
The connecting rod has its maximum stress concentration in the area near the wrist pin, and the value of the stress decreases as points are chosen nearer to the crankshaft.
The effect of whipping stress gets pronounced at speeds even as low as 400 r.p.m. The stress pattern varies and suddenly increases with the application of load against the piston, showing a significant increase in the compressive stresses.
The stresses in the crankshaft fillet at the Juncture of the crank web and the crank pin are higher in magnitude than the ones theoretically evaluated for bending or torsional
- 85 -
effects combined.. These stress build up tremendously with an increase in load or speed.
The pitman stresses for no load conditions are maximum near the mid-section of the pitman, with a greater stress value at the cutter bar end than at the crank end.
The stress pattern in the pitman is controlled by the inertia and impact forces and most probably by the loading characteristics that cause variations or yield unsmooth curves for strains.
The experimental values of the gear analysis are at some points and certain speeds as much as 26 percent higher than the theoretical values within the speed range of this experiment. The power requirement of the generator was unsteady which constantly varied the stress pattern of the gear tooth.
The stresses in the pulley rim are at a maximum at a point on the centre of the rim perpendicular to the centre line of rotation of the pulley. The stress pattern is very distinctly dictated by the type of mechanism the pulley is driving. In the test work the variation of force requirements of the mower influenced the stress patterns of the gauges on the pulley.
SUGGESTIONS FOR FURTHER STUDY
With the introduction of electric strain gauges, a practically new field of experimental stress analysis has come forward with bright prospects. It was the Intent of the author to Initiate such type of work in application to farm machinery. Immense opportunities exist for persons Interested in this field. Detail and thorough analysis of even one of the mechanisms used by the author could in Itself turn out to be an interestingly extensive project requiring exhaustive research on various factors governing the stress pattern and magnitude and Influencing the operation of the mechanism.
Further investigation could be continued in order to refine the design of farm machines. It would be desirable not to restrict to strain gauges only, but to use other experimental methods such as photoelasticity, optical methods and high speed photography, and stress coat.
Furthermore, a fundamental research on the development of a versatile torquemeter for field applications would also be of very significant importance.
APPENDIX
Sample Calculations
1. Centre Crank MechanismA. The Flywheel,
a . RimThe stresses in the flywheel rim are made up of
two eompanents, the stresses due to centrifugal forces andthe stresses due to bending caused by the flywheel arm restraints. In terms of formulas, these stresses are:
S = vs P&l TTT4- g(II)and
s2 = iA j L2 g D t
where v denotes the velocity in feet per second of a pointon the mean diameter of the flywheel.
p is the specific weight of the flywheel in poundsper cubic feet.
L represents the distance in feet along the arc of the mean periphery between flywheel arms.
D represents the flywheel diameter In Inches,t is the rim thickness In inches,g = 52.2 ft. per (second)2.
- 88 -The resultant stress In the rim is usually taken as 0.75
of S- , plus 0.25 of the stress Sg.The specific data for the flywheel is as follows:Wt. of the flywheel = 22 pounds.8p. wt. of cast iron = 450 pounds per cubic ft.Mean diameter = 15 inches.Velocity of a point onmean diameter = 4.12 ft. per second to 55.5 ft. per second. No. of arms = 5Arc length between arms = O.785 ft.Rim thickness = 1.575 inches.Prom the above data, for the maximum linear velocity of
the flywheel:
q _ (35.5 )2 450si - 144 x 52.2
si = 121 psi
q _ 2(35.3 )2 (0.785)22 - 52.2 x 15 x 1.375
S2 = 2.3 psi
The resultant stress S = 91 psi
Prom the chart, the recorded strain was 8 micro inches per inch
fiModulus of Elasticity of cast iron = 12 x 10 psi The stress = 96 psi
which is almost 4.7 higher than the computed theoretical stress.
- 89 -b . Arms
Stresses in flywheel arms consist of three kinds of stresses, namely the bending due to speed variation, bending due to the belt tension since the flywheel was used as a pulley,and the tensile stress due to the centrifugal force. Equationswith the explanation of notations are given below.
s = T (D - a)1 1 Z D(23)
s = <pi - p2) (D - a)2 2 i Z
S, = 0.000914 wr2n2g
where T = the transmitted torque in inch pounds.D = the mean diameter of the flywheel in inches,d = the hub diameter in inches,i = number of arms.Z = section modulus of the arm cross-section at the hub. F1 " F2 = net belt tension.w = specific wt. of flywheel in pounds per cubic inch, n = number of r.p.m. of the flywheel, g = 32.2 ft. per (sec.)2.
The total stress in the arms of the flywheel would beS = ^2 +
The arms of the flywheel had an elliptical section 1.25inches by 0.73 inch.
The total work done on compressing the spring inside thetube was 201 x 5.5 = 1105 in.-lb.
The maximum speed of the flywheel was 450 r.p.m. Hub diameter was 2.125 inches.
ty _ Tfbd2 7r x 0.75 (1.25)232 = 52 ----
= 0.115 cubic inches.
sl " 1103 (15 - 2.125)5 x 0.115 x 15Sj = 1650 psi
- P2 - bt (S - 12 j £ ) a££_i (11)52.2 } e te
2Here, the term 1 ..s which is the centrifugal effect,32.2
could be neglected because of comparatively low speeds. Therefore
F-, - F0 = bt (S) efe - 1e f *
where b = belt width.t = belt thickness.f =* coefficient of friction between belt and flywheel. & - angle of contact between belt and flywheel in
radians.S = design stress in pounds per square inch for belt
material,
In the set-up, the following value of the above notations were valid or assumed to be valid.
From the chart the measured strain was 160 microinches
Stress was 1920 psi.
B. The Connecting RodThe whipping stress in a connecting rod could be eval
uated theoretically from Bach's Formula (27).
S-, = 2 x 10"6 n2 r A d l2 1 Z
where A = area of the mean sectionn = speed in r.p.m.1 = length of the connecting rod between centres in inches.
d = specific weight in pounds per cubic inch.r = radius of crank in inches.Z = section modulus = ~d26
Following was the data pertaining to the connecting rod.A = 1.125 x 0.75 = 0.788 in.2.n = 52.5 rpm to 450 rpm.1 = 7 inches
490d = j-728 P°uncis Per cubic inch, r = 2.75 inches.Z = 0.148 inch5 .
For a speed of 4j50 rpm.
o _ 2 X 1 0 ~ 6 x 4302 X 2.75 X 0.788 X 490 X 7.52_ 1728 x 0.148S-j = 86.5 psi
The compressive or tensile stress due to the load acting on the connecting rod treated as a column could be determined by Gordon's Formula (27):
S2 = I (1 +where P = load on the connecting rod.
A = mean sectional area in in.2.L = length of connecting rod in inches.C = a constant = 000 ^ or a P^n enc e( column.p = radius of gyration.
The last term in the parenthesis could be neglected because of a sufficiently low value. Thus:
- 93 -
201 = oTTBH
S2 = 255 psiThe total computed stress would be = 86.5 + 255
S = 341.5 psiStresses taken from the chart for loaded spring conditions: For the 1/8 inch gauge on the connecting rod directly
above the centre line of the wrist pin, the strain was,40 microinches per inch
Modulus of elasticity = 30 x 10^ psi Stress S- = 1200 psi
For the 1/2 inch gauge on the mid-section of the connecting rod, the recorded strain was:
35 microinches per inch.Stress S2 = 1050 psi
For the 1/2 inch gauge mounted on the connecting rod directly above the centre line of the crank pin, the recorded strain was:
15 microinches per inch.= 450 psi
The average stress in the connecting rod S = 900 psi
C. The CrankshaftTheoretically, the stresses at the fillet (juncture
of the crank pin with the side webs) being the maximum, these
- 94- -
were evaluated as follows (23):The bending stress
sn = 6% (a - 0.5 1 - 0.5 h) + gp (r _ 0-5 d )t o 2 -------
The stress due to direct compression would beSo = 5lbh
The total normal stress S = S-]_ + S2The shear stress due to twisting moment would be:
= 4.5 R2 (a - c)bh2
The total resulting shear stress Ss would beS„ = /(i/2 S)2 + s|s
The above notations could be interpreted as follows:Rj = reaction at the fillet due to connecting rod load
exerted on crank pin parallel to the radial component of the crank pin rotation circle,
a = distance between centre of crank pin and the centre of left journal bearing.
1 = total length of the crank pin.h = thickness of the crank web.F = tangential component at the crank pin centre due
to the load exerted by the connecting rod on thecrank pin.
r = radius of the crank,d = diameter of the crank pin.b = width of the crank web.
- 95 -
Rg = reaction at the fillet due to the connecting rod load exerted on the crank pin parallel to F, the tangential component above.
c = distance between the centre of the crank pin and the centre of the crank web.
For the test work, the following values for the above notations were measured or determined.
R = 96 lbs. a = 1.875 inch.1 = 1.75 inch, h = 0.625 inch.F = 9 lbs. r = 2.75 inches, d = 1.5 inches, b = 2.25 inches.R2= 4.5 lbs. c = I.I85 inches.sl= 6 x 96 (1.875 - .5 x 1.75 - 0.5 x .625)
2.25 (0.625)2+ 6 x 9 (2.75 - .75)
2.25 (0.625)2S2= 574 psi
S2= 2^25 x 0.625 = 68 pS±
The total normal stress was S = 642 psi
- 96 -
The shearing stress was
S = ^-5 x 4.5 (1.875 - 1.183)5 2.25 (0.625)2
= 16 psi
The resultant shearing stress was Ss = 322 psi
The experimental values of the total stress as read off the chart was
80 x 30 = 2400 psi.
2. Mower Mechanism A. Pitman
The whipping stress in the pitman could be evaluatedas earlier in the case of the connecting rod.
Sn = 2 x 10“6 n2 r A d if. (27)-1 Z
All the notations are the same as in the above case.The experimental data for the pitman is as follows:
A = 1 in.2n = 175 rpm to 615 rpm.1 = 13.875 inches.d = .. pounds per inch^.1728r = 1.5 inches.Z = 0.167 in.5 .
For a speed of 615 rpmS-l = 2 x 10"6 (615)2 1.5 x 1 x x
S-, = 370 psiaJlilSSI
- 97 -
The compressive or tensile stress due to the load acting on the connecting rod treated as a column was determined by Gordon's Formula (27)» where the load was the weight of moving blade of the cutter bar and the inertia forces acting on the pitman.
The stress due to this effect was approximately
S2 = 12.2 psi
The total stress S = 382.2 psi
Stresses taken from the chart:For gauge 1 (near the cutter bar)
25 x 30 = 750 psi For gauge 2 (at the mid-section)
150 x 30= 4500 psi For gauge 3 (at the crank end)
30 x 30 = 900 psi Average stress
S = 2050 psi
3. The Gear DriveThe output of the generator was 5280 watts. The effic
iency of the generator was assumed to be 82^ (24). Thus the generator input was 6450 watts. The efficiency of the universal joint driving the generator shaft was assumed at 95 (23). Therefore, the load on the pinion was 6800 watts. Converted
4 1
- 98 -
into horsepower, the transmitted load by the pinion tooth was 9.1 horsepower.
Knowing that the measured pinion velocity from the stroboscope reading to be 516 rpm, the transmitted load was
p = 25.QPP h -P- (11)^ vm
where h.p. is the horsepowervm = velocity in ft. per minute.F = 33000 x 9.1 x 12t 516 x tr x 4Ft = 555 lbs.
The dynamic load for cast teeth would be:Fd =(600 + vm ) Ft
W O O (11)= (600 + 516 £-■%■ --) 555
_
Fd = 1580 lbs.The projected area of the tooth on which the above load
was assumed to be acting was1.75 x 0.5 = 0.875 inch2
The shape of the tooth being assumed as trapezoidal, the area of the tooth at the point of contact would be in this particular case 85$ lower than above.
Therefore, the calculated stress would be0 _ 1580b “ 07875 x O.85S = 2150 psi
For the same load conditions as stated above, the experimental stress value determined by the strain gauge was:
- 99 -
S = 100 X 50 = 5000 psi The component of this stress along the pitch diameter
would be5000 cos 15°
S = 2890 psi
4. The V-belt DriveThe centrifugal forces due to a higher speed of operation
cause a stress in the rim of the pulley.The stress would be
Sl = V3 P144 g
vs = velocity of the pitch diameter of the pulley in ft. per second.
p = sp. wt. in pounds per ft.- g = 32.2 ft. per sec.2
For a speed of rotation of 615 rpm the linear velocity would be
v = ^ x t r X J-5s 12 x w x _6o= 15.1 ft. per sec.
p = 490 pounds per ft.^q - (15.I)2 490 1 “ 144 x 32.2Sj = 24.1 psi
Furthermore, there was an additional stress due to the net belt tension. Written in a formula the tension would be
F = bt (S - 12 (?v| ) efg - 132.2
- 1 00 -
The notations are the same as mentioned earlier in connection with the calculations on the flywheel. The last term being very small, could be neglected as before. For the pulley the values of various symbols were as follows:
b = inch.7t = inch,
f = 0.3 S = 200 psi0 ~ 3.16 radiansP _ 21 x 7 fP-95 - iF " 32 15* C200} 0795“
aThe rim area of the pulley at the section where this
force was acting was 0.375 x 0.125 = 0.047 inch2 .The stress due to belt tension was
S2 = 07470 = psiThe total stress was
S = 769.1 psiThe experimental values were determined for the three
gauges forming a rosette.For gauge 1 mounted at 45° to the horizontal and at the
left in the rosette, the stress for 615 rpm was recorded as 3000 psi.
For gauge 2 mounted perpendicular to the horizontal, the recorded stress for 615 rpm was
63OO psi
- 101 -
For gauge 3 mounted at 45° with the horizontal and to the right of gauge 2, the recorded stress for 615 rpm was
2100 psi.Because of some probable error unaccounted for In the
calculation of theoretical stresses, no comparison could be made with the stress values obtained experimentally.
. B A L A N C IN GA N D R E C O R D IN G
OSCILLOGRAPH
H H E /trsrm m & FU D G E c h o p p e r CATHODE fW y
OSCILLOSCOPE. *
PHASE-SENSITIVE
DETECTOR
FOTEHnOHETERC tR C u rr
\ P H O T O — PeCOXOJHGftQSCILLDOHAPh
C A T H O D E R A i
OSCILLOSCOPEW HEATSTONEB R ID G E
P H O T O -R E C O R D P G
PHASE-SENSmva
DETECTORAM PLIFIER
F~i g . 1 8 S t a t ic A n d D i n a m i c W ir in g D ia g r a m F o r S e e c t R ' C S t r a in G a u g e s
A s r /d g e d P p.o n L is s n e R A n d P e r r y ; T h e S t r a in G a g e P r im e r
SIDE-CR ANK MECHANISMC E N TR E -C R A N K MECHANISM
F/Q, 19 SIDE VIEW OF THE ASSEMBLY
-f-r
(
-CSixEL-6 E A R d r i v e
Scale 1=14
l
5
c e n t r e -crank MECHANISMSECTION B-&-,
SIDE-CRANK m echanism
s e c t io n , a - a
FIG. 20 FROHT VIEWS OF THE ASSEMBLY
S.**
J
C E N T R E -C R A N K MECHANISM
Fie. 21 TOP VIEW OF THE ASSEMBLY
S i d e - c r a n k m e c h a n is m
SELECTED BIBLIOGRAPHY
1.
2 .
5.
4.
5.
6.
7.
8.
9.
10.
Barrett, C. S.X-Ray Analysis. Handbook of Experimental Stress Analysis. John Wiley and Sons, New York. p.p. 980. 1950.
Boor, F. H. and Stitz, E. 0.Stress Distribution in Spur Gear Teeth. Proc.Society for Experimental Stress Analysis. Vol 5,No. 2. p.p. 28-39. 19^6.
Brush Instrument Company, Cleveland, OhioOperating Manual for Brush Analyzer Model BL 310. 1948.
Burrough, D. E.A Method for Determining Power and Torque Distribution In Farm Machinery under Field Conditions. Unpublished M.S. Thesis, Purdue University. 1951.
Carlson, R. W.Five Years Improvement of the Elastic-wire Strain Meter. Engineering News Record. Vol. 114. May 16, 1955. P.P. 696 - 697.
Carter, B. C., Shannon, J. F., and Forshaw, J. R.Measurement of Displacement and Strain by Capacity Methods. Proceedings, Institution of Mechanical Engineers. Vol. 152. p.p. 215 - 221. 1945.
Coker, E. G. and Filon, L. N. G.A Treatise on Photoelasticity. Cambridge University Press, London. 1951.
Dolan, T. J. and Murray, W. M.Photoelasticity. Handbook of Experimental Stress Analysis. John Wiley and Sons, New York. p.p. 828 - 965. 1950.
Donnell, L. H. and Savage, W. T.Mechanical Gauges and Extensometers. Handbook of Experimental Stress Analysis. John Wiley and Sons, New York. p.p. 75 - 117. 1950.
Ellis, GreerPractical Strain Analysis by Use of Brittle Coatings. Proc. Society for Experimental Stress Analysis. Vol.1. No. 1. May 1945.
- 107 -
11.
12.
13.
14.
15.
16.
17.
18.
19.
20.
21.
Faires, V. M.Design of Machine Elements. Revised Edition. The MacMillan Company, New York. 1948.
Froeht, M. M.Photoelasticity. John Wiley and Sons, New York.Vols. 1 and 2. 1941, 1948.
Greaves, R. W., Kirstowsky, E. C., and Llpson, C.Residual Stress Study. Proc. Society for Experimental Stress Analysis. Vol. 2 No. 2. p. 56. 1944.
Hathaway, E. M.Electrical Instruments for Strain Analysis. Proc. Society for Experimental Stress Analysis. Vol. 1.No. 1. p. 89. March 1945.
Hathaway Instrument Company, Denver, ColoradoGeneral-purpose Economy Oscillograph Type S 14-C. Section 2, Division D, Sheet 1. Feb. 1, 1951.
Hetenyl, M.Brittle Models and Brittle Coatings. Handbook of Experimental Stress Analysis. John Wiley and Sons,New York. p.p. 646. 1950.
Higgins, T. J.Analogic Experimental Methods in Stress Analysis as Exemplified by Saint-Venant1s Torsion Problem. Proc. Society for Experimental Stress Analysis. Vol. 2. No.2. Oct. 1944.
Jacobsen, L. S.Torsional Stress Concentrations In Shafts of Circular Cross-section and Variable Diameter. Transactions A.S. M. E. Vol 47. P.P. 619 - 641. 1925.
Jensen, J. K.The Use of SR-4 Strain Gauges In the Development of Farm Implements. A paper presented t6 the Joint meeting of A. S. A. E. and S. A. E. Nov. 1950.
Langer, B. F.Design and Applications of a Magnetic Strain Gauge. Proc. Society for Experimental Stress Analysis. Vol. 1. No. 2. p. 82. 1944.
Langer, B. F. and Wommack, K. L.The Magnetic-coupled Torquemeter. Proc. Society for Experimental Stress Analysis. Vol. 2. No. 2. p. 12. Oct. 1944.
- 108 -
22.
23.
24.
25.
26.
27.
28.
29.
Lee, G. H.An Introduction To Experimental Stress Analysis.John Wiley and Sons, New York. 1950.
Maleev, V. L.Machine Design. The International Textbook Company, Scranton, PaT Revised Edition 1946.
Marks, L. S.Mechanical Engineers1 Handbook. 4th Edition. Me Graw Hill Book Company. p. 2012.
Norton, J. T. and Rosenthal, D.Recent Contributions to the X-ray Method In the Field or Stress Analysis. Proc. Society for Experimental Stress Analysis. Vol. 5. No. 1. 1947.
Ruge, A. C.The Bonded Wire Gauge Torquemeter. Pro. Society for Experimental Stress Analysis. Vol. 1. No. 2.Dec. 1943.
Streeter, R. L. and LIchty, L. S.Internal Combustion Engines. Me Graw Hill Book Company^ p.p. 345 - 348. 1929.
Tatnall, F. G.Applications of Bonded Wire Strain Gauges. The Baldnrin Locomotive Works. March 1951.
Tatnall, F. G.Methods for Evaluating Loads and Stresses for Machine Design. Society of Automotive Engineers, N. Y.June 1951.