DOEMC/28 178-95/C0449 Subquality Natural Gas Sweetening and Dehydration Potential of the Physical Solvent N-Formyl-Morpholine Authors : James T. Semrau Nagaraju Palla Anthony L. Lee Contractor: Institute of Gas Technology 1700 S. Mt. Prospect Road Des Plaines, IL 60018 Contract Number: DE-FC21-92MC28 178 Conference Title: Laurance Reid Gas Conditioning Conference Conference Location: Norman, Oklahoma Conference Dates: February 17 - March 1, 1995 Conference Sponsor: Office of Continuing Education The University of Oklahoma
Transcript
DOEMC/28 178-95/C0449
Subquality Natural Gas Sweetening and Dehydration Potential of the Physical Solvent N-Formyl-Morpholine
Authors :
James T. Semrau Nagaraju Palla Anthony L. Lee
Contractor:
Institute of Gas Technology 1700 S. Mt. Prospect Road Des Plaines, IL 60018
Contract Number:
DE-FC21-92MC28 178
Conference Title:
Laurance Reid Gas Conditioning Conference
Conference Location:
Norman, Oklahoma
Conference Dates:
February 17 - March 1, 1995
Conference Sponsor:
Office of Continuing Education The University of Oklahoma
DISCLAIMER
This report was prepared as an account of work sponsored by an agency of the United States Government. Neither the United States Government nor any agency thereof, nor any of their employees, makes any warranty, express or implied, or assumes any legal liability or responsibility for the accuracy, completeness, or usefulness of any information, apparatus, product, or process disclosed, or represents that its use would not infringe privately owned rights. Reference herein to any specific commercial product, process, or service by trade name, trademark, manufacturer, or otherwise does not necessarily constitute or imply its endorsement, recommendation, or favoring by the United States Government or any agency thereof. The views and opinions of authors expressed herein do not necessarily state or reflect those of the United States Government or any agency thereof.
This report has been reproduced directly fkom the best available copy.
Available to DOE and DOE contractors fkom the Office of Scientific and Technical Information, 175 Oak Ridge Turnpike, Oak Ridge, TN 37831; prices available at (615) 576-8401.
Available to the public fkom the National Technical Information Service, US. Department of Commerce, 5285 Port Royal Road, Springfield, VA 22161; phone orders accepted at (703) 487-4650.
\
DlSCLAlMER
Portions of this document may be illegible in electronic image products. Images are produced from the best available original document.
,
Introduction
Needs of the Gas Tndustrv
Almost all gas produced in the Unitedestates requires processing before it is placed in
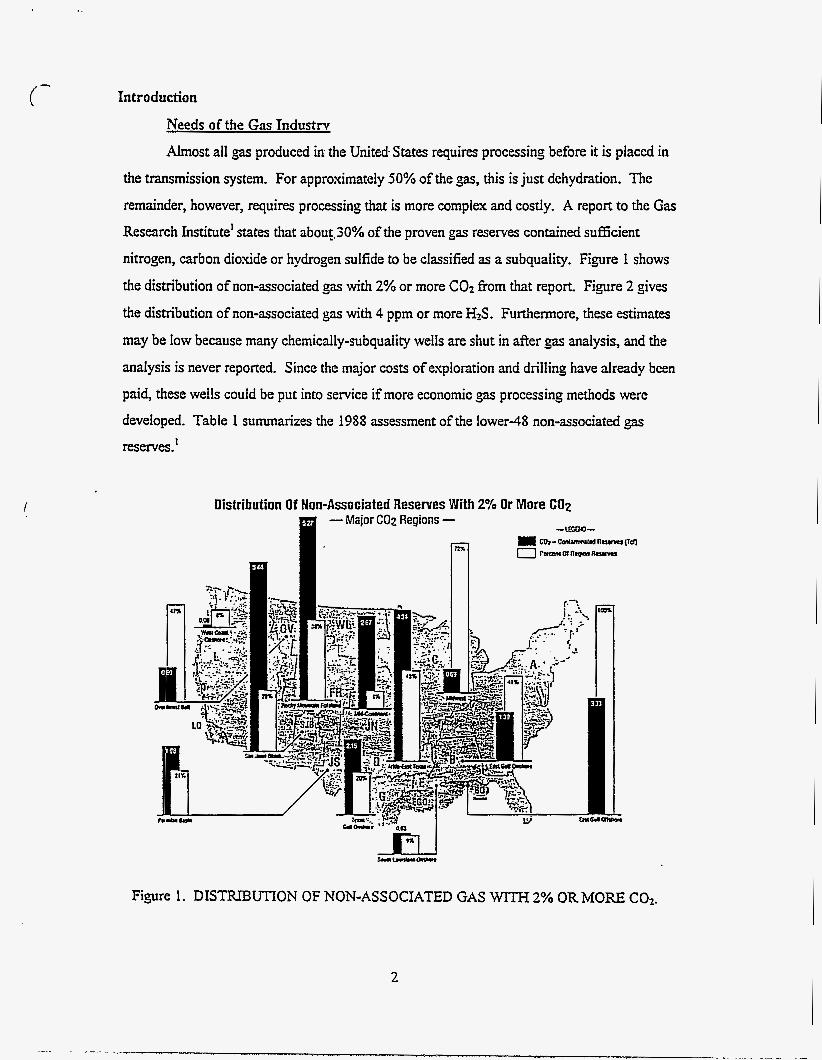
the transmission system. For approximately 50% of the gas, this is just dehydration. The remainder, however, requires processing that is more complex and costly. A report to the Gas Research Institute' states that abouf.30% of the proven gas reserves contained sufficient
nitrogen, carbon dioxide or hydrogen sulfide to be classified as a subquality. Figure 1 shows
the distribution of non-associated gas with 2% or more COZ from that report. Figure 2 gives
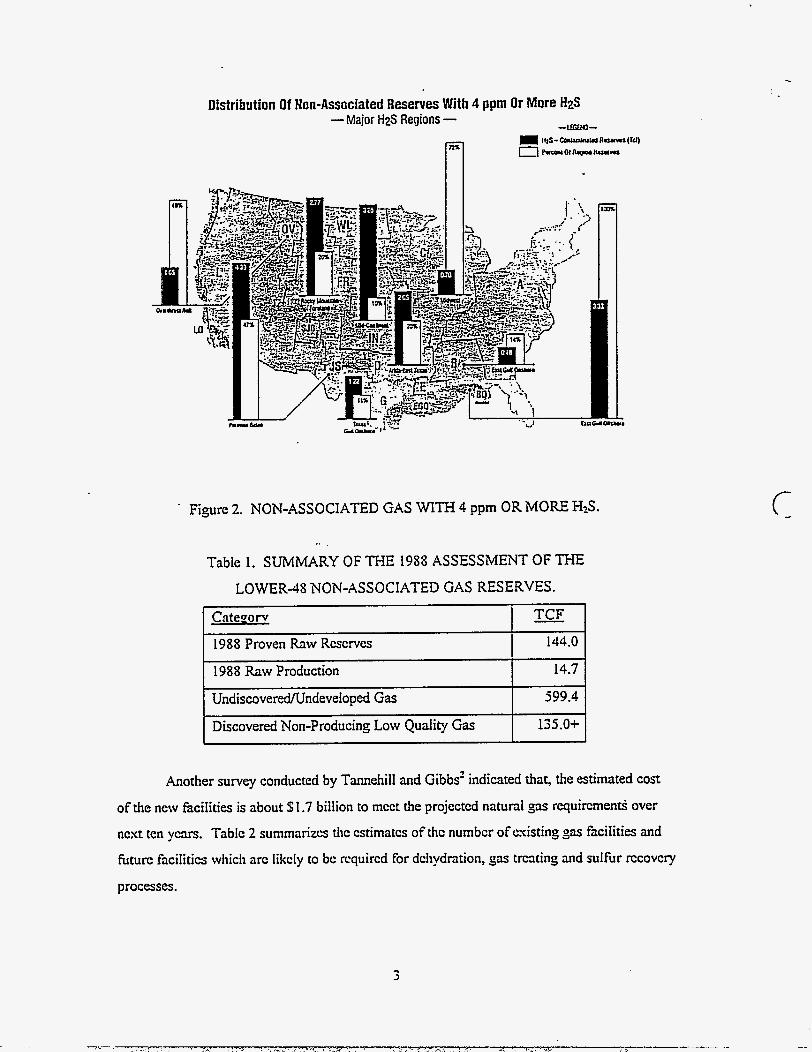
the distribution of non-associated gas with 4 ppm or more HZS. Furthermore, these estimates
may be low because many chemically-subquality wells are shut in after gas analysis, and the
analysis is never reported. Since the major costs of exploration and drilling have already bcen
paid, these wells could be put into service if more economic gas processing methods were
developed. Table 1 summarizes the 1988 assessment of the lower48 non-associated gas
reserves.'
Distribution Of Nan-Associated Reserves With 2% Or More CU;! - Major CO;! Regions - - 1 m - = CO?--R-VCfl
0 F s c a n t o l l l q l o a ~
Figure 1. DISTRPBUTION OF NON-ASSOCIATED GAS WITH 2% OR MORE COz.
2
Distribution Of Nan-Associated Reserves With 4 ppm Or More H2S
UndiscoverecVUndeveloped Gas
Discovered Non-Producing Low Quality Gas
-Major H2S Regions -
599.4
135.0+
. Figure 2. NON-ASSOCIATED GAS WITH 4 ppm OR MORE HZS.
Table 1. SUMMARY OF THE 1985 ASSESSMENT OF THE
LOWER48 NON-ASSOCIATED GAS RESERVES.
Catezorv 1988 Proven Raw Rcscrves 144.0
1988 Raw Production
Another survey conducted by Tannehill and Gibbs' indicated thar, the estimated cost
of the new faciIities is about $1.7 billion to mcct the projectcd natural gm rcquircmenti over ncxt ten ymrs. Tablc 2 summarizcs thc cstimatcs of thc numbct of cxisting gas kcilities and
hturc facilitics which arc likcly to bc rcquircd for dchydntion, gas trmting and sulfur rccovcry
processes.
3
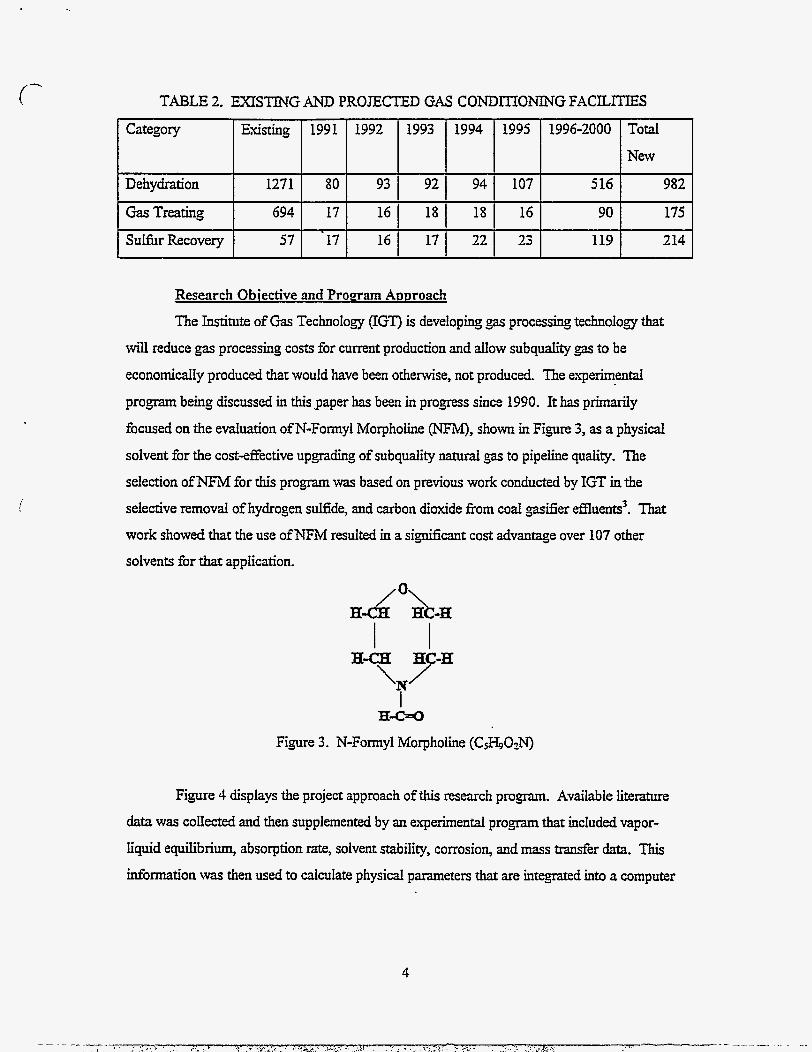
(- TABLE 2. EXISTING AND PROJECTED GAS CONDITIOMNG FACILITIES
Research Obiective and Propram Aoproach
The Institute of Gas Technology (IGT) is developing gas processing technology that
will reduce gas processing costs for current production and allow subquality gas to be
economically produced that would have been otherwise, not produced. The eqerimentai
program being discussed in this japer has been in progress since 1990. It has primarily
focused on the evaluation of N-Formyl Morpholine (NFM), shown in Figure 3, as a physical
solvent for the cost-effective upgrading of subquality naturai gas to pipeline quality. The
selection of NFM for this program was based on previous work conducted by IGT in the
selective removal of hydrogen sulfide, and carbon dioxide fiom cod =wiiier efnuents3. That work showed that the use of NFM resulted in a significant cost advantqe over 107 other
solvents for that application.
a-C-0 Figure 3. N-Formyl Morpholine (C&T9OzN)
Figure 4 displays the project approach of this research program. Available literature
data was collected and then supplemented by an e.xperimental program that included vapor-
liquid equilibrium, absorption rate, solvent stability, corrosion, and mass transfer data. This information was then used to calculate physical parameters that are integrated into a computer
4
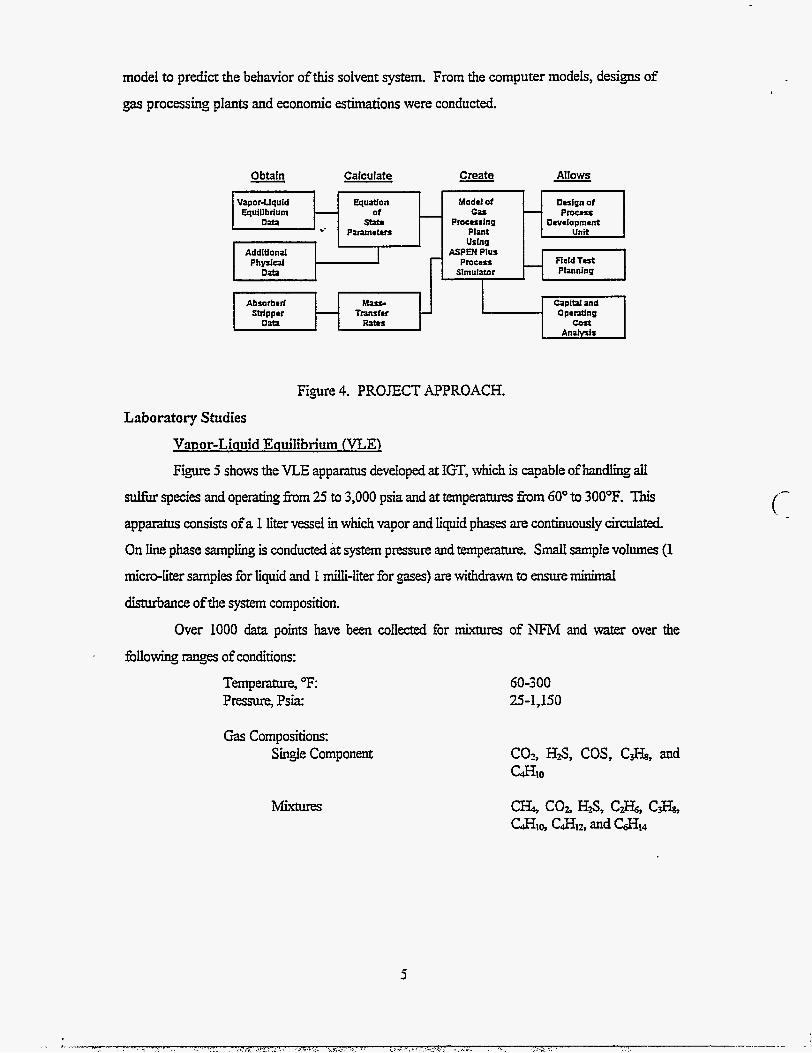
model to predict the behavior of this solvent system. From the computer models, designs of
gas processing plants and economic estimations were conducted.
Allows - Create - Obtain Calculate -
Figure 4. PROJECT APPROACH.
Laboratory Studies
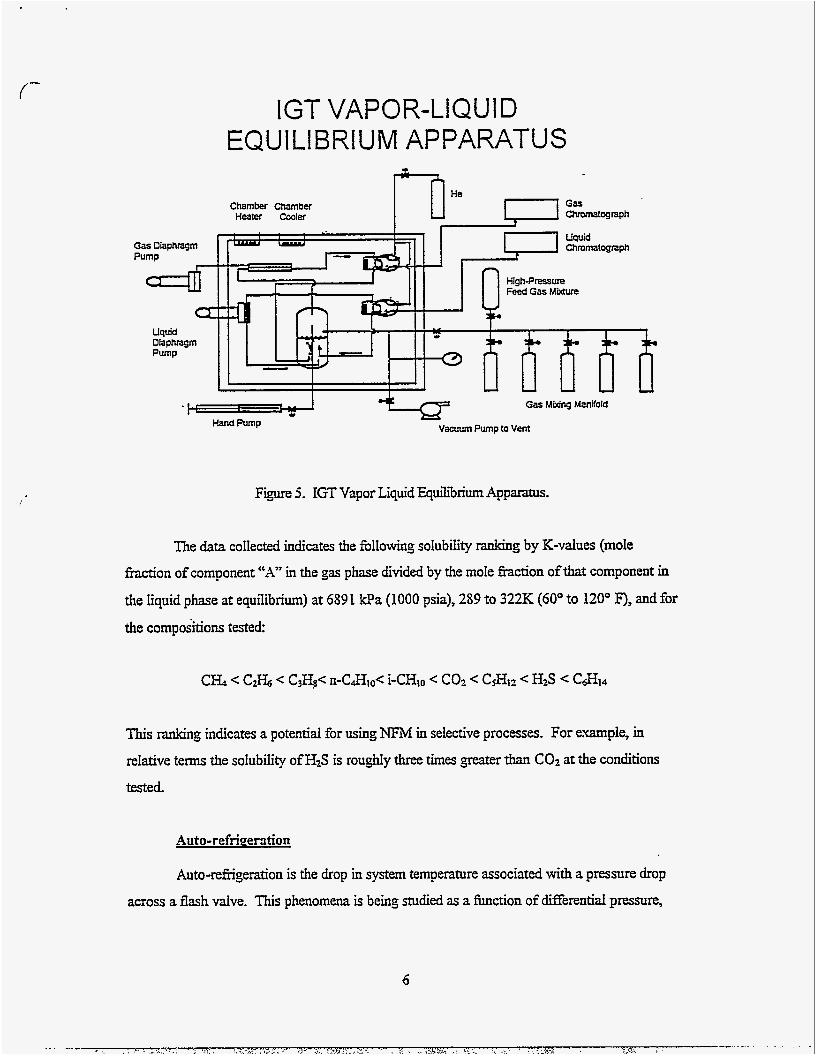
Vauor-Lhuid Eouilibnurn (VILE) Figure 5 shows the VLE apparatus deveioped at IGT, which is capable of handling all
sulfix species and operating from 25 to 3,000 psia and at temperatures h m 60” to 300°F. This
apparatus consists of a 1 liter vessel in which vapor and liquid phases are continuousiy circulated.
On line phase sampling is conducted micro-liter samples for liquid and 1 &-liter for gases) are withdrawn to ensure minimal
disturbance of the system Composition.
system pressure and temperature. Small sampie volumes (1
Over 1000 data points have been colIected for mktures of NFM and water over the
’ following ranges of conditions:
Temperature, “F: Pressure, Psia:
Gas Compositions: SingIe Component
5
60-300 25-1,150
CO?, H2S, COS, C a y a d c4&0
IGT VAPOR-LIQUID EQU 1 LI B RI U M AP PARATUS
Chamber Chambw Heater Coaler
Feed Gas Mbdun
acum Pump to vent
Figure 5. IGT Vapor Liquid Equilibrium Apparatus.
'h
The data collected indicates the following solubility ranking by K-values (mole
hct ion of component "A" in the gas phase divided by the mole hc t ion of that component in
the liquid phase at equilibrium) at 6891 kPa (1000 psia), 289 to 322K (60" to 120" F), and for
the compositions tested
This ranking indicates a potential for using NFM in selective processes. For example, in
relative terms the solubility of H2S is rougbly three times greater than CO? at the conditions
tested.
Auto-refrigeration
Auto-refrigeration is the drop in system temperature associated with a pressure drop
across a flash valve. This phenomena is being studied as a function of differential pressure,
6
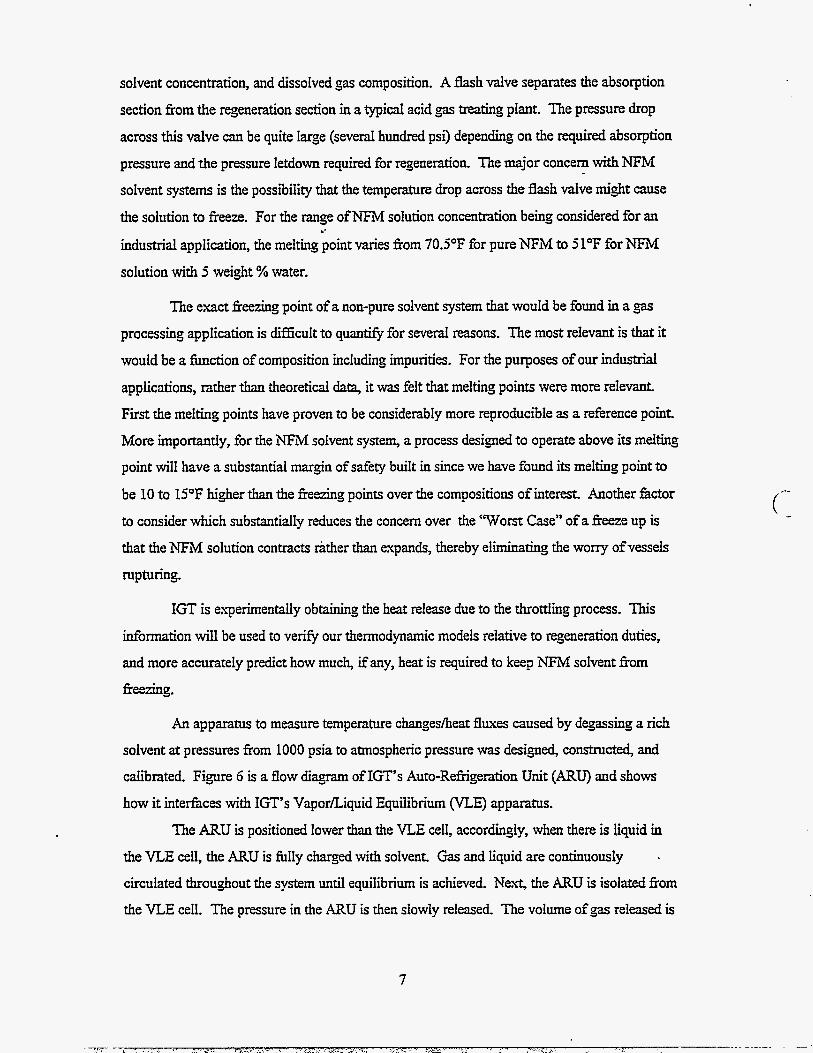
solvent concentration, and dissolved gas composition. A flash valve separates the absorption
section fiom the regeneration section in a typical acid gas treating plant. The pressure drop
across this valve can be quite Iarge (several hundred psi) depending on the required absorption
pressure and the pressure letdown required for regeneration. The major concern with W M solvent systems is the possibility that the temperature drop across the flash valve might cause
the solution to freeze. For the ranse of NFM solution concentration being considered for an
industrial application, the melting point varies fiom 703°F for pure MFiM to 5 1°F for j3F.M solution with 5 weight % water.
.-
The exact freezing point of a non-pure solvent system that would be found in a gas
processing application is difficult to quantify for several reasons. The most relevant is that it
would be a fhction of composition including impurities. For the purposes of our industrial
applications, rather than theoretical data, it was felt that melting points were more relevant.
First the melting points have proven to be considerabIy more reproducible as a reference point.
More importantly, for the NFM solvent system, a process designed to operate above its melting
point will have a substantial margin of safety built in since we have found its melting point to
be 10 to 15°F higher than the fi&g points over the compositions of interest. Another factor
to consider which substantially reduces the concern over the 'Worst Case" of a freeze up is that the NFM solution contracts rither than expands, thereby eliminating the worry of vessels
rupturing.
IGT is experimentally obtaining the heat release due to the throttling process. This
information will be used to veri@ our thermodynamic models relative to regeneration duties,
and more accurately predict how much, if any, heat is required to keep NFM solvent from
freezing.
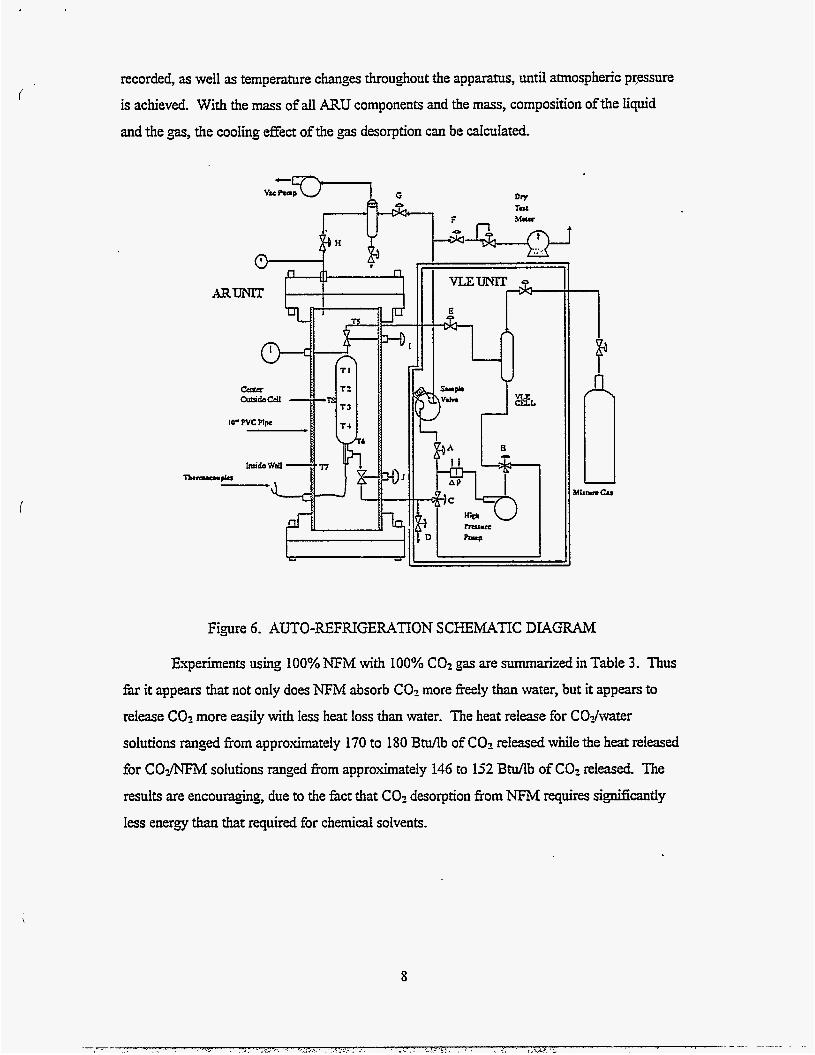
An apparatus to measure temperature changesheat fluxes caused by degassing a rich
solvent at pressures fiom 1000 psia to atmospheric pressure was designed, constructed, and
calibrated. Figure 6 is a flow diagram of IGT's Auto-Refrigeration Unit (ARU) and shows
how it intehces with IGT's VaporLiquid Equilibrium (VLE) apparatus.
The ARU is positioned lower than the VLE cell, accordingly, when there is liquid in . the VLE cell, the ARU is filly charged with solvent. Gas and liquid are continuously
circulated throughout the system until equilibrium is achieved. Ne% the ARU is isolated from
the VLE cell. The pressure in the ARU is then slowly released. The volume of gas released is
7
recorded, as well as temperature changes throughout the apparatus, until atmospheric p p s u r e
is achieved. With the mass of all ARU components and the mass, composition of the liquid
and the gas, the cooling effect of the gas desorption can be CalcuIated.
pr
Fipure 6. AUTO-REFRIGERATION SCHEMATIC DIAGRAlM
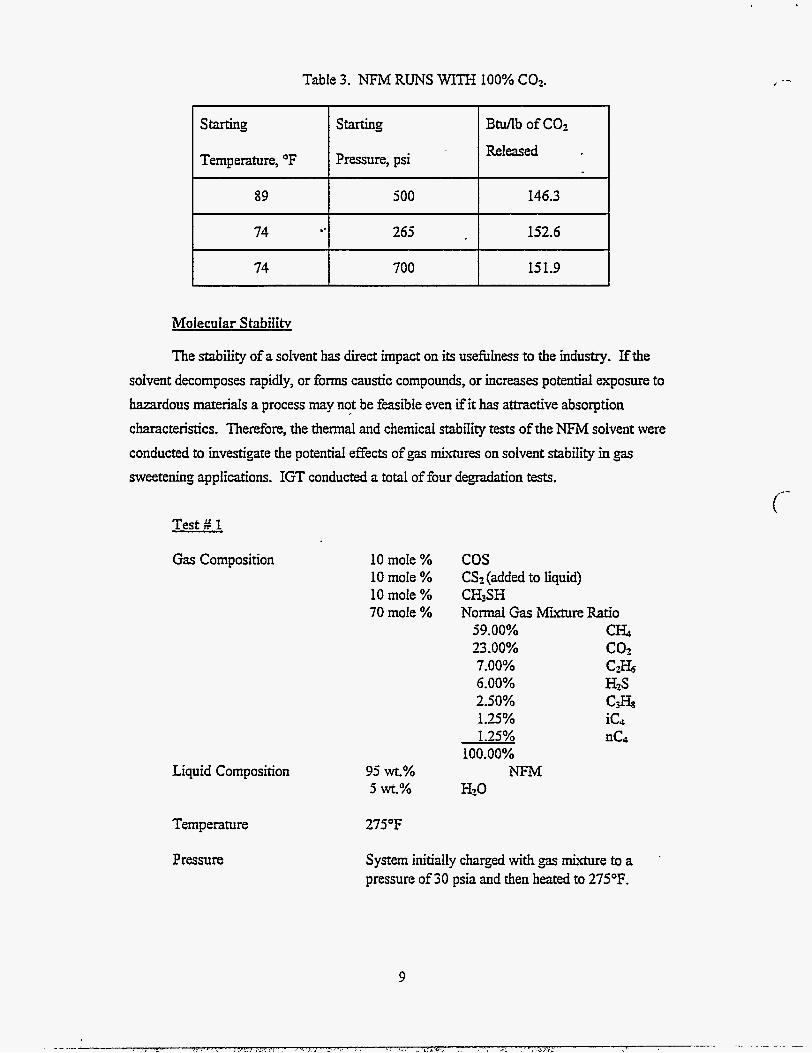
Experiments using 100% NFM with 100% COz gas are summarized in TabIe 3. Thus
fhr it appears that not only does NFM absorb C02 more freely than water, but it appears to release CO? more easily with less heat loss than water. The heat release for C O j .f water
solutions ranged fiom approximately 170 to 180 Btu/lb of COz released while the heat released
for C0.f- solutions ranged fiom approximately 146 to 132 Btu/lb of COz released. The
results are encouraging, due to the ~ c t that C02 desorption fiom NFM requires sign5cantly
less energy than that required for chemical solvents.
Table 3. NFM RUNS WITJ3 100% COZ.
Starting Starting BWlb of COZ
Temperature, O F
89
74
74
.-
Moiecuiar StabiIitv
Released Pressure, psi
500 146.3
265 152.6
700 15 1.9
The stability of a solvent has direct impact on its usefulness to the industry. Ifthe solvent decomposes rapidly, or forms caustic compounds, or increases potential exposure to hazardous materials a process may not be feasible even if it has attractive absorption characteristics. Therefore, the thermai and chemical stabiIity tests of the NFM solvent were conducted to investigate the potential effects of gas mixtures on solvent stabirity in gas sweetening applications. IGT conducted a total of four degradation tests.
cos CS:! (added to liquid) CH3SH N o d Gas MivtureRatio
99.00% CH4 23.00% COZ 7.00% CZ& 6.00% H2S
2.50% CJls 1.25% iC4 1.25% nC4
100.00%
HZO NFM
System initidy ch;uged with gas mixture to a pressure of 30 psia and then heated to 275°F.
'
9
Sampling Gas and liquid samples were taken twice a day during the first week, once a week t h e d e r , unless no changes were observed, thus the sampling rate was dropped to once in two weeks.
Run Duration 3 months.
The results from Test 1 indicated minimal degradation of NFM with exposure to large
quantities of gases such as COS (Carbonyl Sulfide), CS? (Carbon Disulfide), HzS (Hydrogen
Sulfide). NFM degradation to morphoiine that o,ccurred was steady and minimal during the
entire duration with a final count of 3600 ppm, i.e., 0.36% o f W M degraded to morphohe
over a three month period at the above conditions.
Test 2 was conducted at the same conditions as Test 1 except that 100% ak was used
at 60 psia in place of the 'Wormal Gas M~.?rture." This test wils run for about three weeks,
during which time, the pressure in the cell steadily rose to 100 psia Gas samples taken at that
time indicated that the oxygen in the air reacted with the formyl group of the NFM resulting in hydrogen and carbon dioxide as the product gases. Oxygen degradation of N3.f at high temperature was expected and does not M e r appreciably from what occurs to commercial
solvents at these conditions. Analysis of liquid samples shows that about 0.45% of the WM reacted to form morpholine and its derivatives. A balance of components in the vessel indicate
that all the oxygen in the system reacted with
morphoiine, COZ and hydrogen.
on a 1:2 mole basis ( 0 2 to NFM) to form
Test 3 was conducted at the same conditions as Test 2 except the temperature was
lowered to 160 OF. Gas samples indicated that the oxygen in the air again reacted with NFM producing CO2. However, no change in pressure was observed. The liquid analysis indicated
that NFM degadation to morphoiine was steady and very minimaI during the entire duration of
Test 3 with a &EII count of 370 ppm, Le., 0.037% of NFM charged, degraded to morpholine
over a period of four weeks. Test 4 was initiated as continuation of Test 3. At the end of Test 3 the temperature
was increased from 160°F to 212°F for the system (gas composition of 02 & Argon 0.83%,
Nitrogen 90.9% and COz 8.3 1% on mole basis). Again, no change in pressure was observed
during the entire two weeks of this experiment. Liquid samples again indicated that NFiM .
degadation was minimal with a final count of 300 ppm to morpholine for this test. A total of 0.067% M.'iLI charged degraded to morpholine over a six week period during the entire
10
duration of Test 3 and Test 4.
Based on the results of the stability experiments conducted, we do not anticipate any
changes in plant operation and materids of construction requirements, due to the chemical and
thermal characteristics of the NFM solvent system compared to standard commercid practice
for gas sweetening processes.
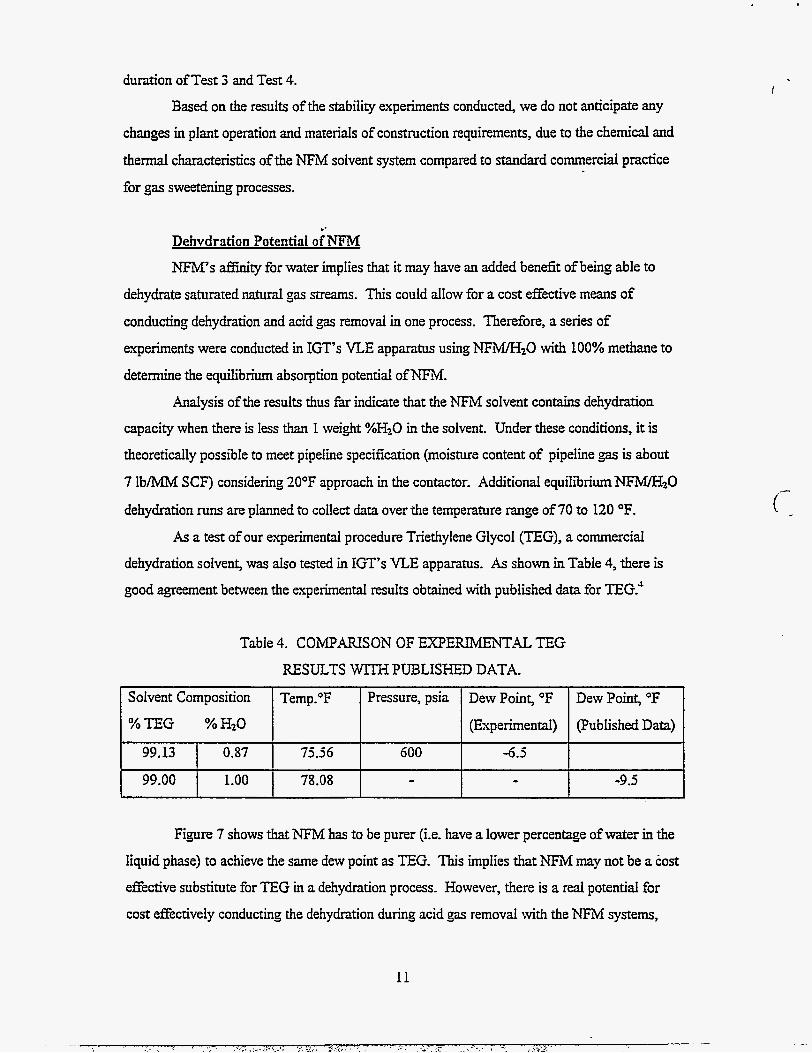
99.13
99.00
.- Dehvdration Potential of NFM
NFM's affinity for water implies that it may have an added benefit of being able to
0.87 75.56 600 -6.5
1.00 78.08 - - -9.5
dehydrate saturated ~ t u d
conducting dehydration and acid gas removal in one process. Therefore, a series of
experiments were conducted in IGT's VLE apparatus using NFWH20 with 100% methane to
determine the equilibrium absorption potential of W.
streams. This could allow for a cost effective means of
Analysis of the results thus fiu indicate that the NFM solvent contains dehydration
capacity when there is less than 1 weight %H20 in the solvent. Under these conditions, it is
theoretically possible to meet pipeline specification (moisture content of pipeline gas is about
7 Ib/MM SCF) considering 20°F approach in the contactor. Additional equilibrium NFM/H20 dehydration runs are planned to collect data over the temperature range of 70 to 120 OF.
As a test of our experimental procedure Triethylene Glycol (TEG), a commercial
dehydration solvent, was dso tested in IGT's VLE apparatus. As shown in Table 4, there is
good agreement bemeen the experimental results obtained with published data for TEG.'
Table 4. COMP,WSON OF EXPERIMMT I ALTEG RESULTS WITH PUBLISHED DATA.
Solvent Composition I Temp."F I Pressure, psia I Dew Point, O F I Dew Point, O F I %TEG %HzO I I (Experimental) I (PublishedData) I
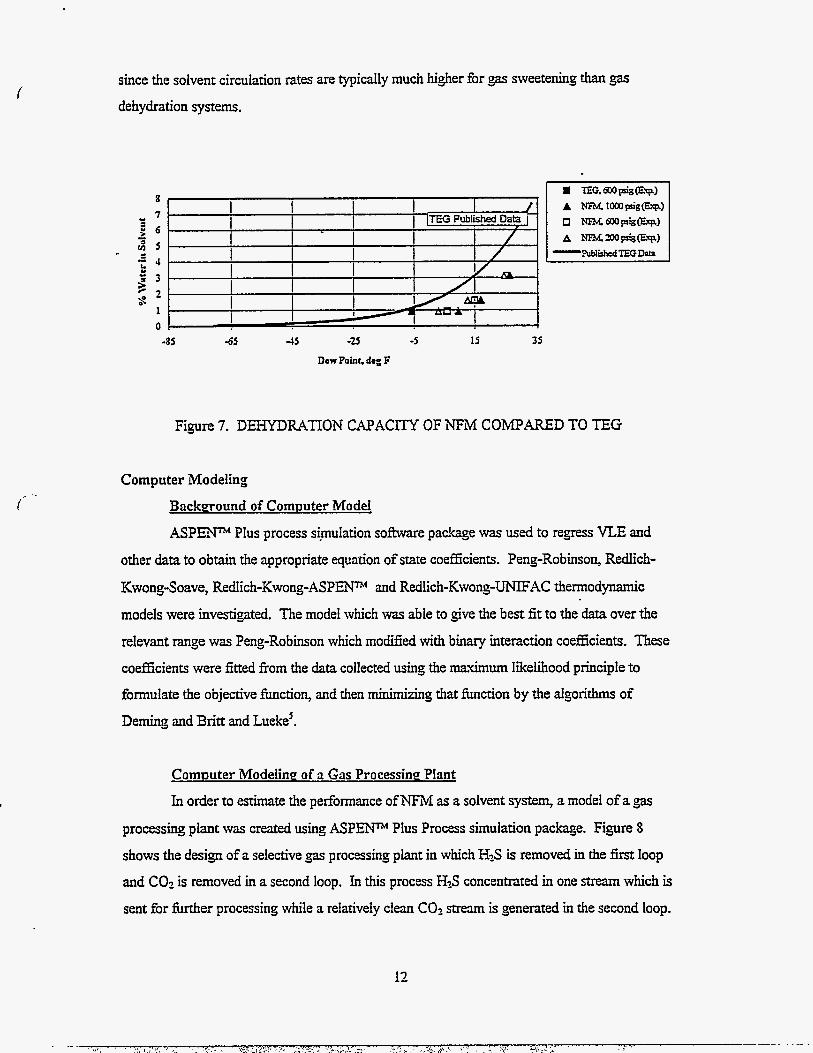
Figure 7 shows that NFM has to be purer (i.e. have a lower percentage of water in the
liquid phase) to achieve the same dew point as TEG. This implies that NFiM may not be a Cost
effective substitute for TEG in a dehydration process. However, there is a real potential for
cost effectively conducting the dehydration during acid gas removal with the NFM systems,
11
since the solvent circulation rates are typically much higher for gas sweetening than gas dehydration systems.
8
- 7 g 6 D 5 - 4 t ? 3
s
- - e
5 , 1 0
-85 6 5 4 5 -2s -5 1s 35
Dew Point, deg F
Figure 7. DEHYDRATION CAPACITY OF BFM COMPARED TO TEG
Computer Modeling Backmound of Comuuter Model
A S P P Plus process simulation so- package was used to regress VLE and
other data to obtain the appropriate eqmtion of state coefficients. Peng-Robinson, Redlich-
Kwong-Soave, Redich-Kwong-ASPW and Redlich-Kwong-UNIF,4C thermodynamic
models were investigated. The model which was able to give the best fit to the data over the
relevant range was Peng-Robinson which modXed with binary interaction coefficients. These
coefficients were fitted from the data collected using the mximum likelihood principle to
formulate the objective function, and then minimidng that function by the aigorithms of
Deming and Britt and Lueke'.
Cornouter Modeiinp of a Gas Processinq Plant
In order to estimate the performance of NFM as a solvent system, a model of a gas
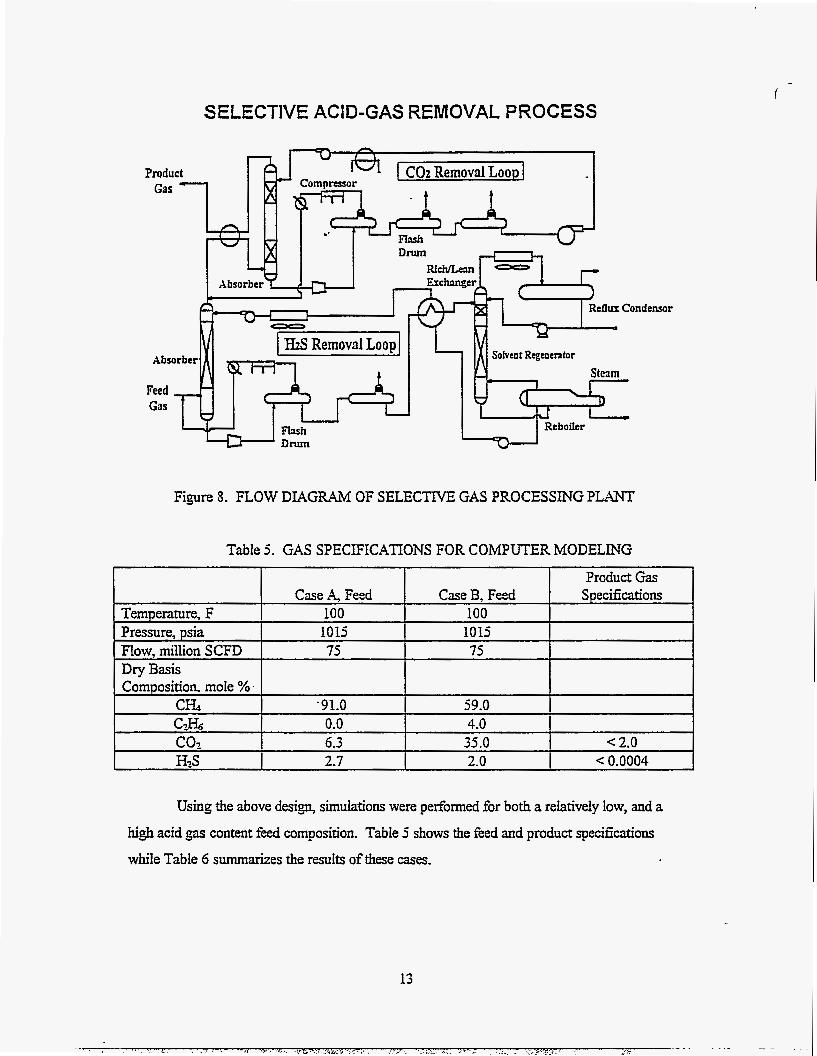
processing plant was created using A S P P Plus Process simulation package. Figure 8
shows the design of a selective gas processing piant in which HzS is removed in the first loop
and COz is removed in a second loop. In this process H2S concentrated in one stream which is
sent for fbrther processing while a relatively clean C02 stream is generated in the second loop.
12
SELECTIVE ACID-GAS REMOVAL PROCESS
Temperature, F Pressure, psia FIow, million SCFD Dry Basis Composition, mole %.
CH4
eUux Condensor
Sokcnt Rtgcncntor
Product Gas Case A, Feed Case B, Feed Speciiications
100 100 1015 1015 75 75
'91.0 59.0
Figure 8. FLOW DIAGRAM OF SELECTIVE GAS PROCESSING PLANT
C1& coz HzS
Table 5. GAS SPECIFICATIONS FOR COMPUTER MODELING
0.0 4.0 6.3 35.0 .e 2.0 2.7 2.0 < 0.0004
Using the above design, simulations were performed for both a relatively low, and a
high acid gas content feed composition. Table 5 shows the feed and product specifications
while Table 6 summarizes the results of these cases.
13
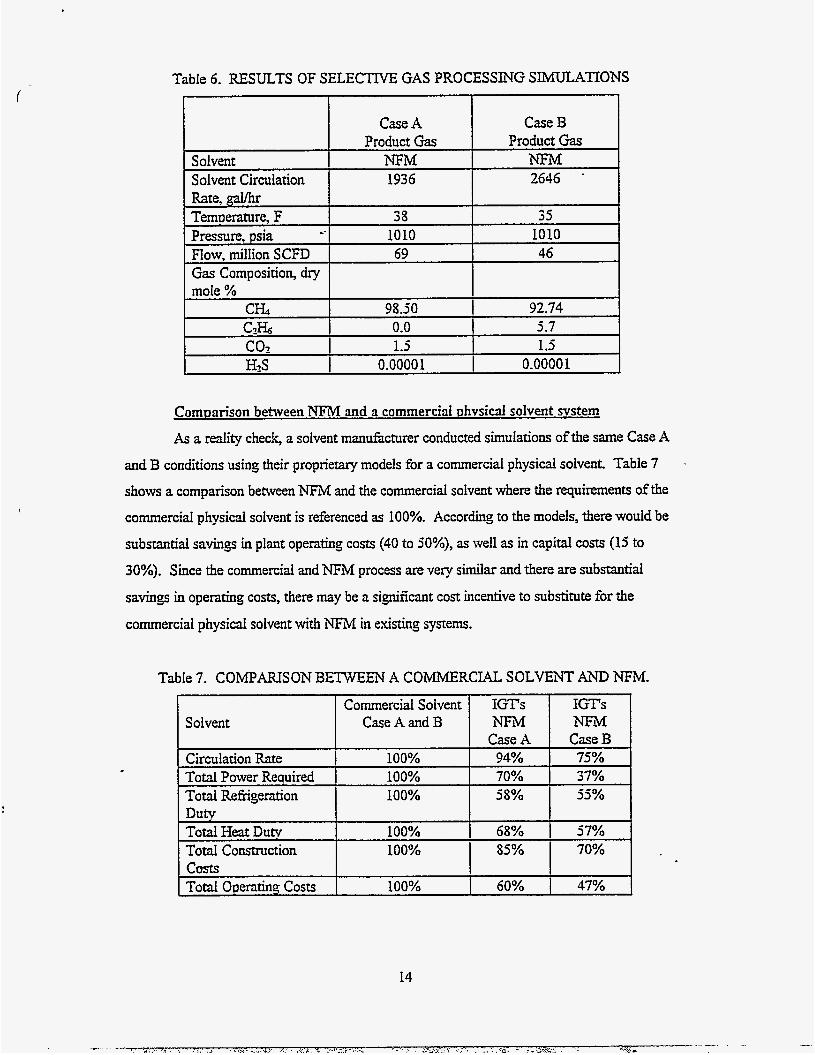
I Case A Case B
Product Gas Product Gas Solvent NFM NFM Solvent Circulation 1936 2646 Rate, Temperature, F 38 35
!
Pressure, psia Flow, million SCFD
1010 1010 69 46
Comparison between NFM and a commercial phvsicd solvent svstem
As a reality check, a solvent manufacturer conducted simulations of the same Case A and B conditions using their proprierary models for a commercial physical solvent. Table 7
shows a comparison between NFM and the commercial solvent where the requirements of the
commercial physical solvent is referenced as 100%. According to the models, there would be
substantial savings in plant operating costs (40 to 50%), as well as in capital costs (15 to
30%). Since the commercial and NFh4 process are very similar and there are substantid
savings in operating costs, there may be a significant cost incentive to substitute for the
commercial physicd solvent with NTM in existing systems.
Gas Composition, dry mole %
CH4
Table 7. COMPARISON BETWEEN A COMMERCIAL SOLVENT AND NFM.
-
98.50 92.74 C1& co:! H:!S
0.0 5.7 1.5 1.5
0.00001 0.00001
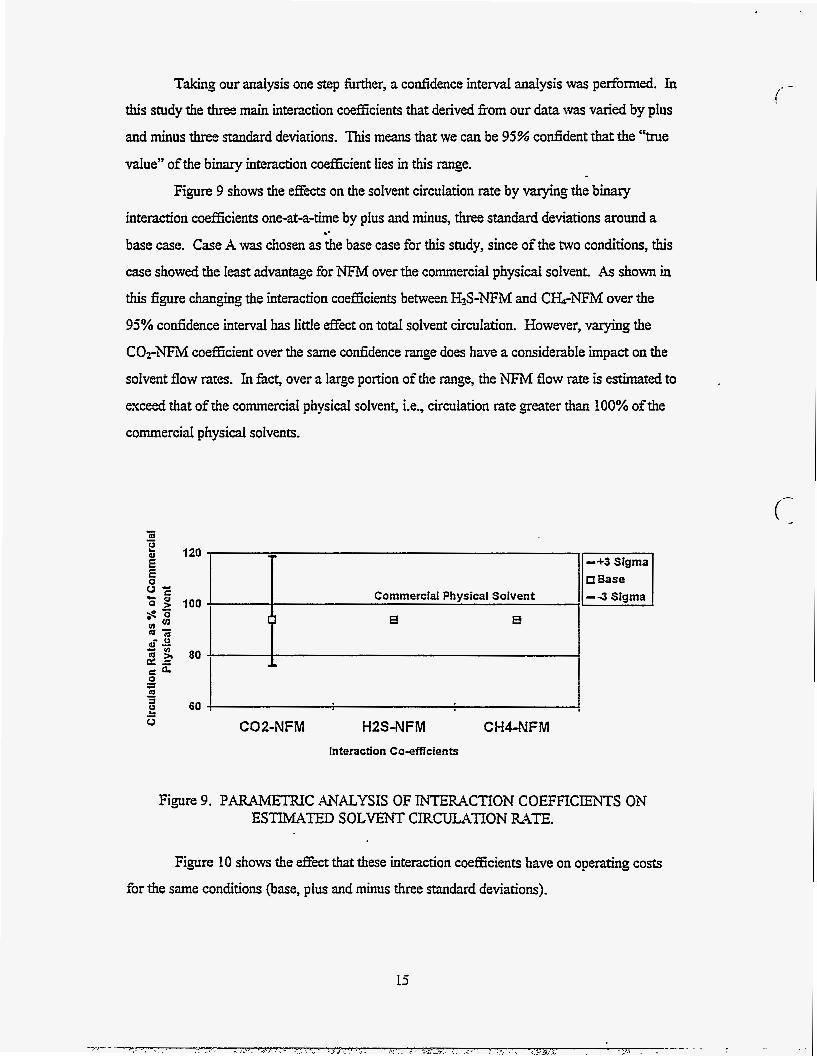
Taking our analysis one step further, a confidence interval analysis was performed. In this study the three main interaction coefficients that derived from our data was varied by plus
and minus three standard deviations. This means that we can be 95% confident that the "true
value" of the binary interaction coefficient lies in this range.
Figure 9 shows the effects on the solvent circulation rate by varying the binary
interaction coefficients one-at-a-time by plus and minus, three standard deviations around a
base case. Case A was chosen as the base case for this study, since of the two conditions, this
case showed the least advantage for NFM over the commercial physicaI solvent. As shown in
this figure changing the interaction coefficients between H2S-NTM and C H A F M over the
95% confidence interval has little effect on total solvent circulation. However, varying the
CO2-NFM coefficient over the same confidence range does have a considerable impact on the
soivent flow rates. In fkt, over a large portion of the range, the NFM flow rate is estimated to
exceed that of the commercial physical solvent, i.e., circulation rate greater than 100% of the
commercial physical solvents.
.*
0 Base Commercial Physical Solvent
CO 2-NFM H2S-NFM CH4-N F M Interaction Co-efficients
Figure 9. PARAMETRIC AUALYSIS OF INTERACTION COEFFICIENTS ON ESTIMATED SOLVENT CIRCULATION WE.
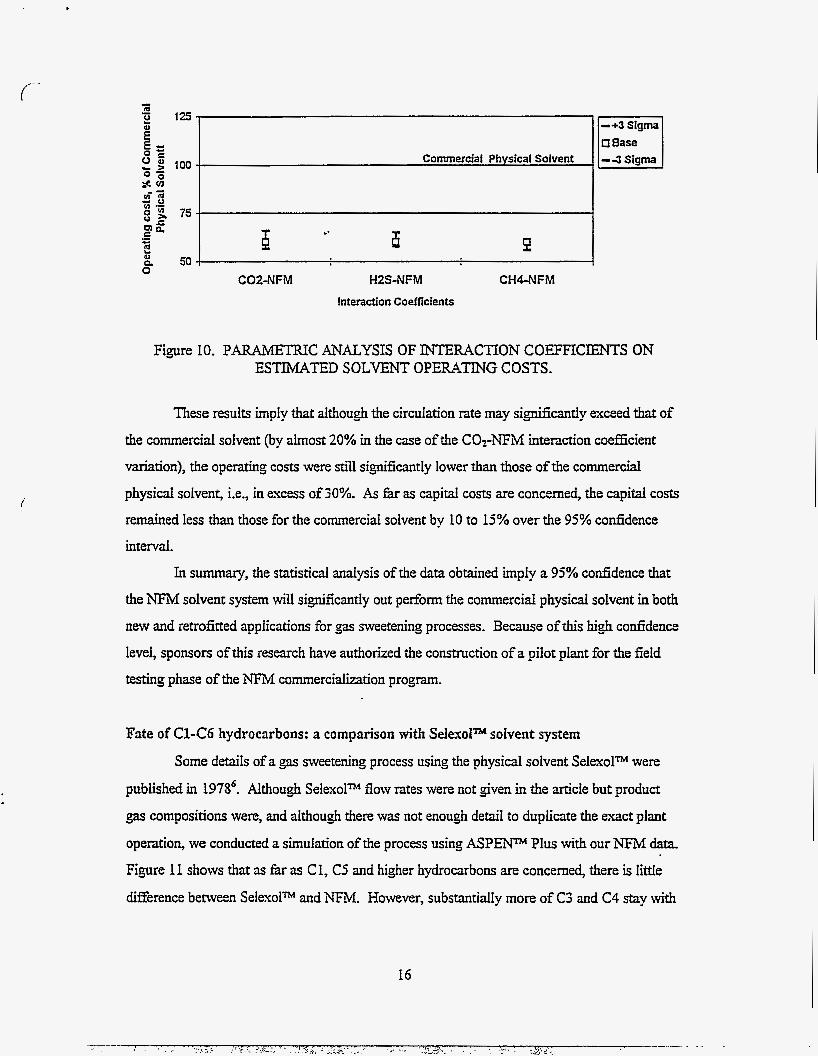
Figure 10 shows the effect that these interaction coefficients have on operating costs
for the same conditions (base, pius and minus three standard deviations).
5 125- E g s z z " f 100
0 =ea ui7 - u :z 75 U r " I E a - c
501
-+3 sigma
- 3 Sigma Commercial Physical Solvent
6 P .- 6
Figure 10. PARAMETRTC ANALYSIS OF INTERACTION COEFFICIENTS ON ESTIMATED SOLVENT OPERATING COSTS.
These results imply that although the circulation rate may significantly exceed that of the commercial solvent (by almost 20% in the case of the C02-NFM interaction coefficient
variation), the operating costs were still significantly lower than those of the commercial
physical solven& Le., in excess of 30%. As far as capital costs are concerned, the capital costs
remained less than those for the commercial solvent by 10 to 15% over the 95% confidence
interval.
In summary, the statistical analysis of the data obtained imply a 95% confidence that
the NFM solvent system will significantly out perform the commercial physical solvent in both
new and retrofitted applications for gas sweetening processes. Because of this high confidence
level, sponsors of this research have authorized the construction of a pilot plant for the field
testing phase of the WM commercialition program.
Fate of Cl-C6 hydrocarbons: a comparison with Se lexoP solvent system
Some details of a gas sweetening process using the physical solvent SelexoP were
published in 19786. Although Selexolm flow rates were not given in the article but product
gas compositions were, and although there was not enough detail to duplicate the exact plant
operation, we conducted a simulation of the process using ASPENm Plus with our NFM data.
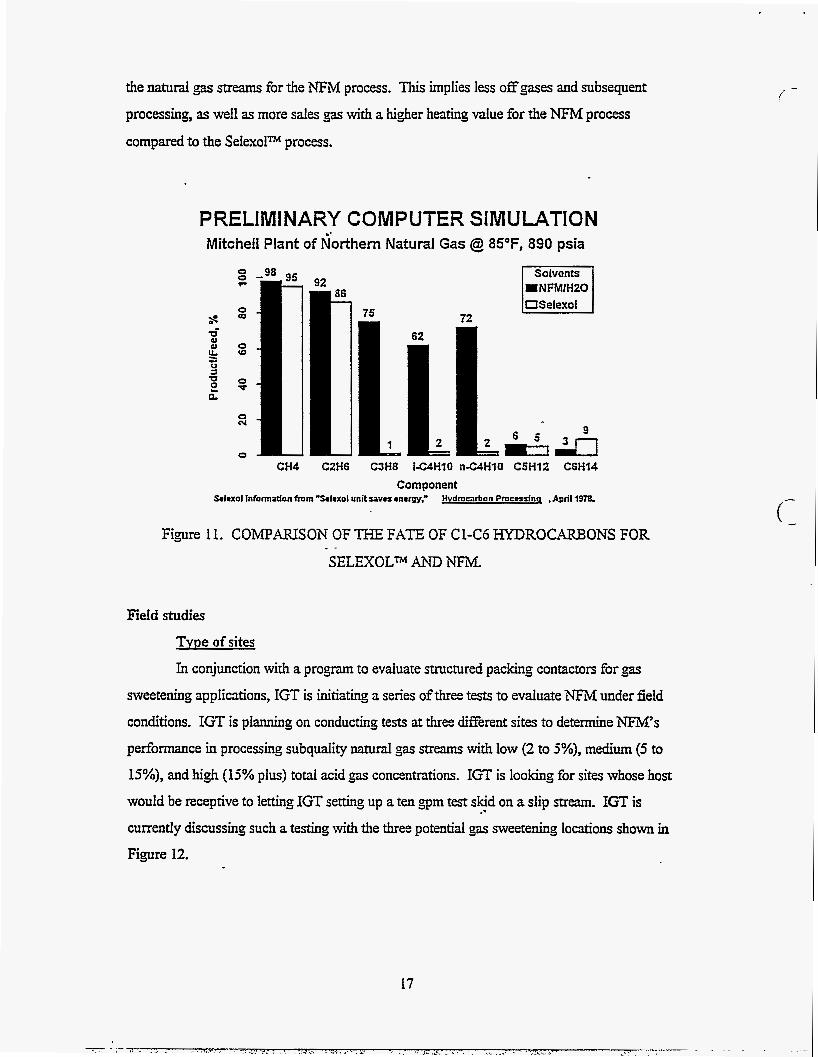
Figure 11 shows that as far as C 1, C5 and higher hydrocarbons are concerned, there is little
difference behveen SeIexoP and NFM. However, substantially more of C3 and C4 stay with
16
the natural gas streams for the NFM process. This implies less off gases and subsequent
processing, as well as more sales gas with a higher heating value for the NFM process
compared to the SeIexolm process.
PRELIMINARY COMPUTER SIMULATION Mitchell Plant of iorthern Natural Gas @ 85"F, 890 psia
S.laxol Information fmm 'Salrxol unit l a v a anargy," H v d m h o n Pmcminq .April l S T &
72
Figure 11. COMPARISON OF THE FATE OF Cl-C6 HYDROCARBONS FOR
SELEXOLm AND NFM. - -
Field studies
Tvpe of sites
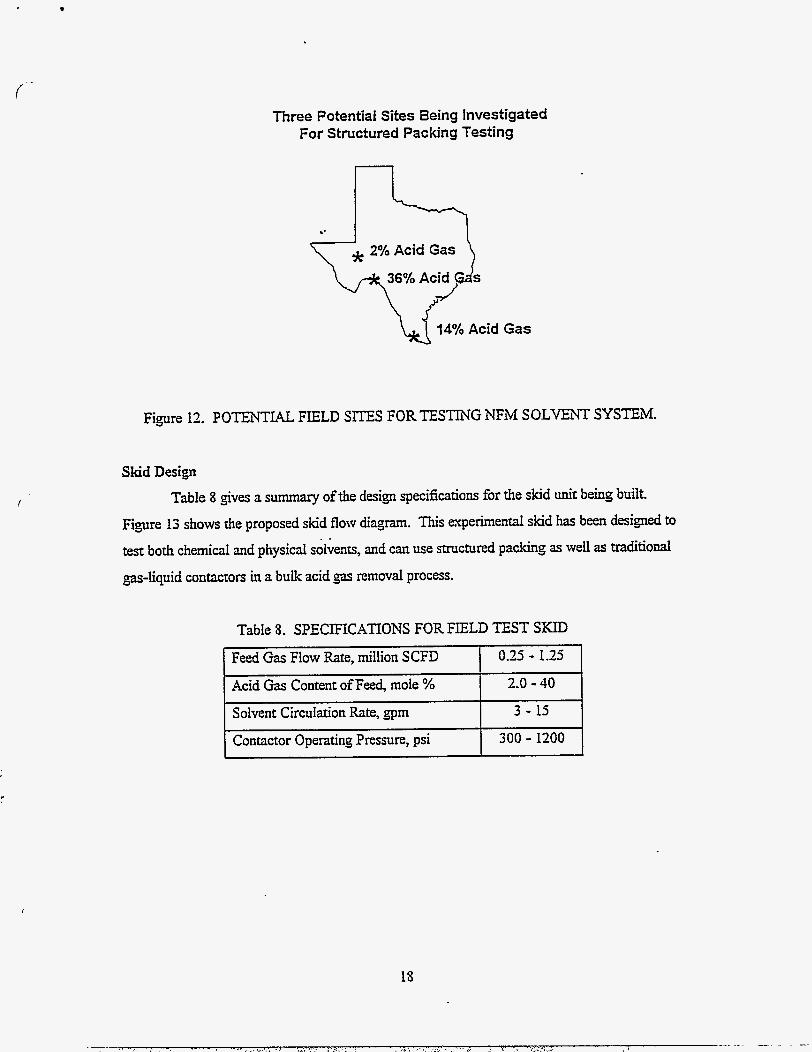
In conjunction with a program to evaluate structured packing contactors for
sweetening applications, IGT is initiating a series of three tests to evaluate NFLM under fieId
conditions. IGT is planning on conducting tests at three different sites to determine NEM's
performance in processing subquality natural g;ls streams with low (2 to 5%)7 medium (5 to
15%), and high (15% plus) total acid gas concentrations. IGT is looking for sites whose host
would be receptive to letting IGT setting up a ten gpm test skid .. on a slip stream. IGT is C U I T ~ ~ ~ ~ Y discussing such a testing with the three potential p s sweetening loutions shown in
Figure 12.
- i
Feed Gas Flow Rate, million SCFD
Acid Gas Content of Feed, mole %
Solvent Circulation Rate, gpm
Contactor Operating Pressure, psi
Three Potential Sites Being Investigated For Structured Packing Testing
0.25 - 1.25
2.0 - 40
3 - 15
300 - 1200
.-
Gas
Figure 12. POTENTIAL FIELD SITES FOR TESTING NFM SOLVENT SYSTEM.
Skid Design
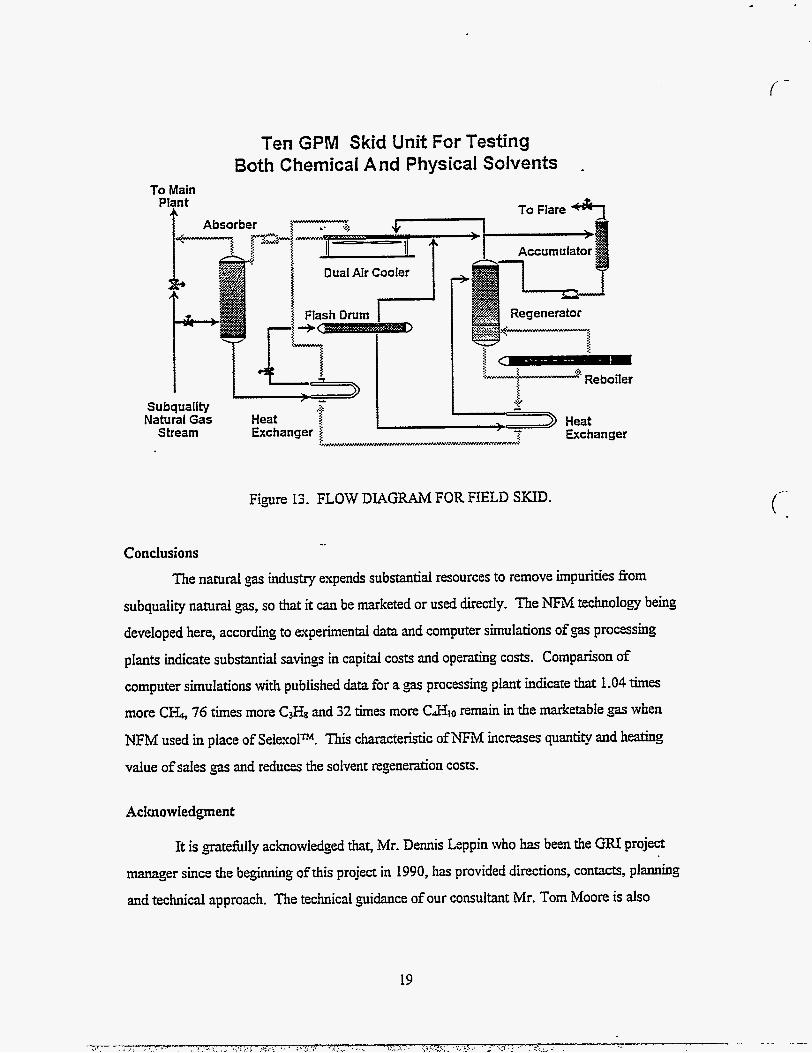
Table 8 gives a summary of the design specifications for the skid Unit being built.
Figure 13 shows the proposed skid flow diagram. This experimental skid has been designed to
test both chemical and physical solvents, and can use structured packing as well as traditional
gas-liquid contactors in a bulk acid gas removal process.
I I
18
( -
Ten GPM Skid Unit For Testing Both Chemical And Physical Solvents
To Main
Figure 13. FLOW DIAGRAM FOR FIELD SKID.
_. Conclusions
The natural gas industry expends substantial resources to remove impurities fiom
subquality natural gas, so that it can be marketed or used directly. The NFM technology being
developed here, according to experimental data and computer simulations of gas processing
plants indicate substantial savings in capital costs and operating costs. Comparison of
computer simulations with published data for a gas processing plant indicate that 1.04 times
more C& 76 times more C3& and 32 times more CJfl0 remain in the marketable gas when
NFM used in place of Selexolm. This characteristic ofNFM increases quantiv and heating
value of sales gas and reduces the solvent regenedon costs.
Acknowledgment
It is gatef3ly acknowledged that, Mr. Dennis Leppin who has been the GRI project
manager since the beginning of this project in 1990, has provided directions, confacts, planning
and technical approach. The technical guidance of our consultant Mr. Tom Moore is also
19
c
f - greatly appreciated. The authors also extend their appreciation to Mr. Thomas Kresse and Mr.
James Frazier of NGPL for their guidance, and to Mr. Jim CritcMedd and Ms. Vicki Anderson
of Huntsman Chemical Co. which is cofunding portion of this work. IGT’s Sustaining
Membership Program has also helped to make this research possible by providing 25% of the
coordinated funding and technical guidance. Finally, we express our gratitudeto Messrs. John
DeSando, Frank Miao, Mark Martelli, Louis Diaz and Ms. Ghenet Aberra of IGT for their
assistance in data collection and analysis.
References
1. Hugman, Vidas, and Springer, “Chemical Composition Of Discovered And Undiscovered Natural Gas In The U.S. Lower-48, March 1993, Energy and Environmental Analysis, Inc. Tannehill,C.C., and Gibbs, J.E., “Gas Processing Industry Lower 48 States,”July 1991, PurVin & Gertz, Inc. GRI-911/0232. Macriss, RA., and Duncan, D., “Acid-gas and Trace Impuriv Removal,” Annual Report for 1975, A.G.A Project No. N410, 1976. Engineering Data Book, G.P.S.A 9th edition, 1972. BriR H. I. and Lueke, R.H., “The estimation of parameters in Non-linear, Implicit Models,” Technometrics, 15, 2,283 (1973). “Selexol unit saves energy,” Hvdrocarbon Processinq, April 1978.


![Copolymerization of [epsiv]-caprolactone and morpholine-2 ... · Makromol. Chem. 193, 1927-1942 (1992) 1927 Copolymerization of &-caprolactone and morpholine-2,5-dione derivatives](https://static.documents.pub/doc/80x56/5ad096377f8b9ae2138dec54/copolymerization-of-epsiv-caprolactone-and-morpholine-2-chem-193-1927-1942.jpg)


