25
Hmp Bedford: Drug and Alcohol Needs Assessment Suffolk Adult Substance Misuse Needs Assessment
Contents
Executive Summary .................................................................................................................................... 3
Introduction .................................................................................................................................................... 6
Aims and Objectives ................................................................................................................................ 6
Method ..................................................................................................................................................... 6
Epidemiology ................................................................................................................................................. 8
Suffolk Estimates ..................................................................................................................................... 8
Treatment Bullseye ................................................................................................................................ 11
Treatment Mapping ............................................................................................................................... 13
Drug Intervention Programme ............................................................................................................... 15
Treatment Outcomes ............................................................................................................................. 17
Suggested Next Steps ............................................................................................................................. 23
Recommendations ................................................................................................................................. 23
References .................................................................................................................................................... 26
2
Suffolk Adult Substance Misuse Needs Assessment
Executive Summary
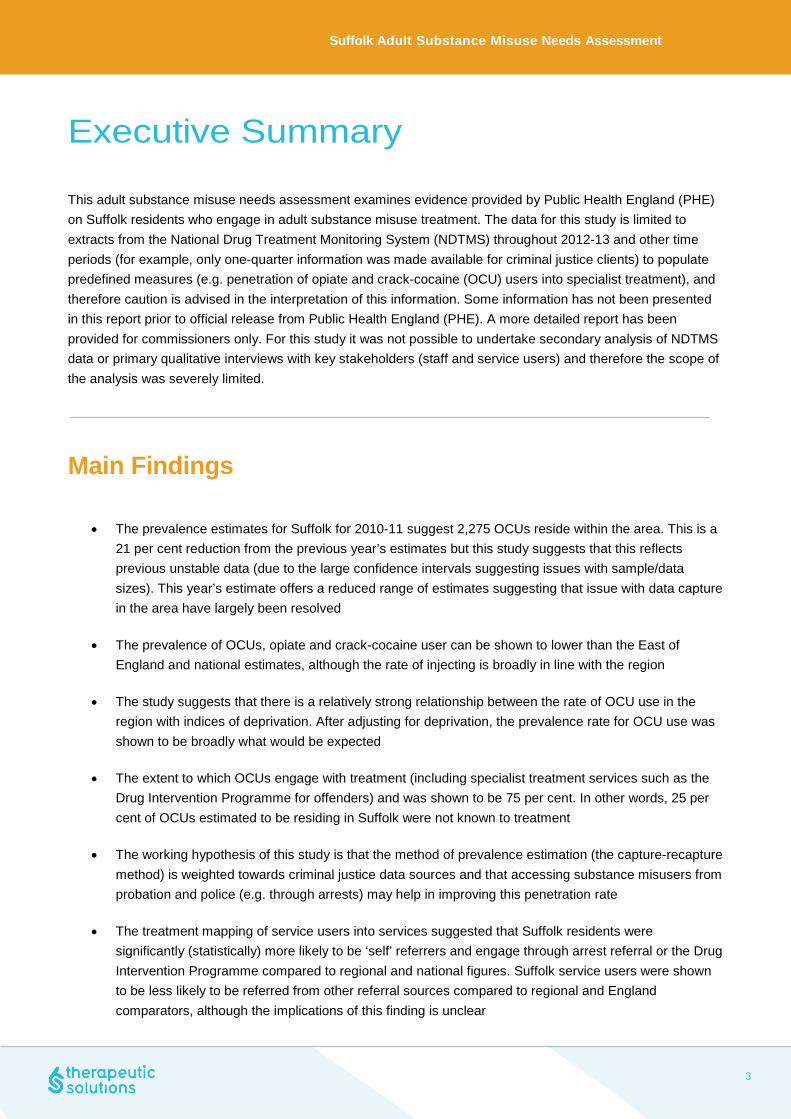
This adult substance misuse needs assessment examines evidence provided by Public Health England (PHE) on Suffolk residents who engage in adult substance misuse treatment. The data for this study is limited to extracts from the National Drug Treatment Monitoring System (NDTMS) throughout 2012-13 and other time periods (for example, only one-quarter information was made available for criminal justice clients) to populate predefined measures (e.g. penetration of opiate and crack-cocaine (OCU) users into specialist treatment), and therefore caution is advised in the interpretation of this information. Some information has not been presented in this report prior to official release from Public Health England (PHE). A more detailed report has been provided for commissioners only. For this study it was not possible to undertake secondary analysis of NDTMS data or primary qualitative interviews with key stakeholders (staff and service users) and therefore the scope of the analysis was severely limited.
Main Findings
• The prevalence estimates for Suffolk for 2010-11 suggest 2,275 OCUs reside within the area. This is a 21 per cent reduction from the previous year’s estimates but this study suggests that this reflects previous unstable data (due to the large confidence intervals suggesting issues with sample/data sizes). This year’s estimate offers a reduced range of estimates suggesting that issue with data capture in the area have largely been resolved
• The prevalence of OCUs, opiate and crack-cocaine user can be shown to lower than the East of England and national estimates, although the rate of injecting is broadly in line with the region
• The study suggests that there is a relatively strong relationship between the rate of OCU use in the region with indices of deprivation. After adjusting for deprivation, the prevalence rate for OCU use was shown to be broadly what would be expected
• The extent to which OCUs engage with treatment (including specialist treatment services such as the Drug Intervention Programme for offenders) and was shown to be 75 per cent. In other words, 25 per cent of OCUs estimated to be residing in Suffolk were not known to treatment
• The working hypothesis of this study is that the method of prevalence estimation (the capture-recapture method) is weighted towards criminal justice data sources and that accessing substance misusers from probation and police (e.g. through arrests) may help in improving this penetration rate
• The treatment mapping of service users into services suggested that Suffolk residents were significantly (statistically) more likely to be ‘self’ referrers and engage through arrest referral or the Drug Intervention Programme compared to regional and national figures. Suffolk service users were shown to be less likely to be referred from other referral sources compared to regional and England comparators, although the implications of this finding is unclear
3

Suffolk Adult Substance Misuse Needs Assessment
• Suffolk residents were significantly more likely to be in treatment for between two and four years compared to their regional and national counterparts
• Based on 2012-13 NDTMS outcome data, Suffolk service users were more likely to report an ‘unplanned’ exit compared to the East of England and national figures and therefore less likely to record a successful outcome (‘planned’ exit)
• Based on an extract of the data for a period of less than one year (data not published in this report until released by Public Health England), that show referrals from the Drug Intervention Programme (DIP) were lower than the expected regional averages although caution is advised in interpreting this finding as there is an issue with interpreting percentages and not the absolute number of referrals (e.g. for example, the numbers presented by Public Health England are small). This finding is also based on a sample of the DIP data available only and should be treated with caution
• Based on a sample of data from the Drug Intervention Programme there is a sizable proportion of offenders seen as part of DIP that had no record with treatment agencies suggesting that DIP maybe in contact with a segment that of user that could be engaged further into structured treatment
• Two outcome metrics were examined – the number and proportion of successful completions across the whole treatment system; and the number and proportion of service users who successfully complete treatment (as defined by NDTMS) and who do not re-present within six months. Across both indicators, opiate users were shown to do less well in treatment although caution is advised in the interpretation of the data as it was not possible to interrogate the data to examine trends over a long-time frame
• The study examined data derived from the Treatment Outcome Profile (TOP) that suggested over a range of indicators service users who have report a ‘successful treatment completion’ will do well as of consequence of being in treatment. That is, successful treatment completions will always be a subset of the wider treatment population and that it may be more fruitful to examine analytical energy on non-successful treatment outcomes. A working hypothesis for this study is that this finding confirms the wider literature on treatment engagement but more intelligence is required to understand the treatment dynamics for service users who do not successfully complete treatment and to understand what is needed to facilitate a higher level of successful completions
4
Suffolk Adult Substance Misuse Needs Assessment
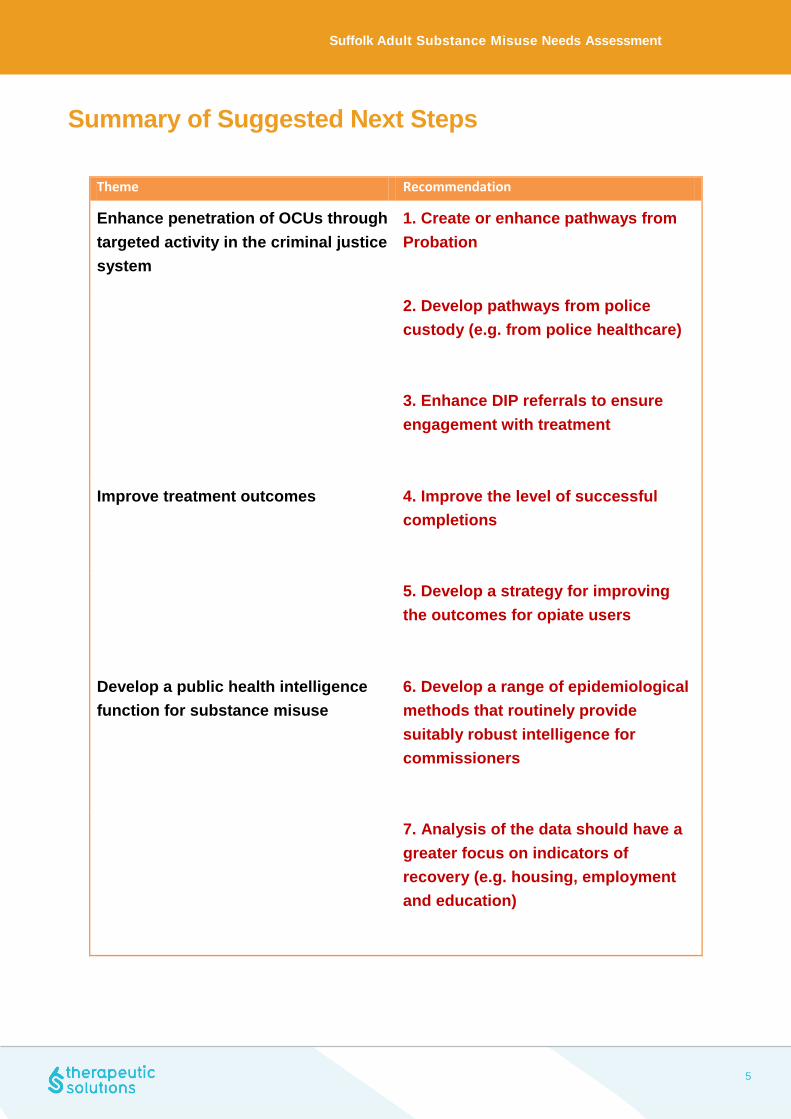
Summary of Suggested Next Steps
Theme Recommendation
Enhance penetration of OCUs through targeted activity in the criminal justice system
1. Create or enhance pathways from Probation
2. Develop pathways from police custody (e.g. from police healthcare)
3. Enhance DIP referrals to ensure engagement with treatment
Improve treatment outcomes
4. Improve the level of successful completions
5. Develop a strategy for improving the outcomes for opiate users
Develop a public health intelligence function for substance misuse
6. Develop a range of epidemiological methods that routinely provide suitably robust intelligence for commissioners
7. Analysis of the data should have a greater focus on indicators of recovery (e.g. housing, employment and education)
5
Suffolk Adult Substance Misuse Needs Assessment
Introduction
This study supplements the previous year’s adult substance misuse needs assessment (2012-2013) utilizing a broadly similar methodological approach deploying an epidemiological analysis of data held on the National Drug Treatment Monitoring System (NDTMS). Some data in this report will not be presented prior to an official release from Public Health England although a more detailed report has been made available for commissioners.
Aims and Objectives
The aim of this study is to establish an evidence-base to support the 2013-2014 treatment planning process and in particular to identify gaps and barriers in service provision prior to re-commissioning of substance misuse treatment services. The scope of this study is to examine the needs of adult drug misusers residing in Suffolk. Adult drug misusers are defined as an individual aged 18 or over at the point of entry into the treatment system.
The study is structured over two chapters. The first examines the prevalence of opiate and crack-cocaine use across Suffolk and the extent to which this segment of substance misuser engaged in treatment. The analysis also examines how an individual service user moves across the treatment system and looks specifically at a range of treatment outcomes that are associated with recovery. The final chapter provides some suggestions for next steps.
Method
The study provides an epidemiological overview of the nature of presenting problem drug misuse in Suffolk based on information held on NDTMS. NDTMS is a national surveillance system that captures data on substance misusers at various points during their time in community-based treatment, for example at initial engagement (triage); at start of an intervention (modality start) and at exit. This is supplemented through a formalized review process using a simple schedule (the Treatment Outcome Profile- TOP) that aims to understand how well a service user is doing during their time in treatment. Data on specific segments of problem drug misuser such as those in the criminal justice system are also included but provided only for one period of time (PHE personal communication) and details have not been published in this report prior to a national release. The analysis for this study is based on access to specific “cuts” of NDTMS data only – in other words, secondary analysis already undertaken by Public Health England and provided back to partnerships for interpretation in the form of pre-populated reports.
6
Suffolk Adult Substance Misuse Needs Assessment
The information provided for this study includes a number of themes including understanding the overall prevalence rates within Suffolk; the level of service user engagement in treatment (as a proportion of the prevalence rate); treatment mapping of movement throughout the system and some basic information derived from TOP on service user outcomes.
The study is therefore limited in a number of ways. First there can be limited interrogation of the data extracts provided – it was not possible to develop a more robust and enhanced analytical approach (for example, using multivariate statistical techniques) that could determine whether any correlations or associations between factors are statistically significant. It was not possible to explore or drill-down into issues or themes that may have arisen for the data which will limit the power of the analytical method. Second, from the information provided from the cuts of data, there is little commentary on issues such as data quality and the impact this may have on the findings, although there will be commentary on such matters in the text as they arise. Moreover, it was not in scope for this needs assessment to utilize qualitative methods to support the epidemiological analyses including service user and staff consultation events. This may create the possibility of “data artefacts” whereby trends or associations in the data may emerge but are not “real” and are a function of (for example) how information has been collected or been analyzed and presented back to partnerships from PHE. For some of the analysis provided by PHE the automation process includes little commentary on key issues such as statistical significance and sample sizes, although there will be some discussion of these topics in the text.
Third, trend data are not routinely collected and interrogated as a routine. This is a major shortcoming of the extraction process especially when data analysis is limited to a period of less than one year, as short time-frames will be subject to a number of possible fluctuations including how data are recorded; changes in operational activity and introduction of new ways of working. In addition, although the majority of the data referred to data from 2012-13 some data (not used) referred to the latest Recovery Diagnostic Toolkit available for this study referred to a period before the last financial year and therefore was not included as there will be issues in cross-referencing any conclusions from differing time-periods. Thus, the findings from this study should be treated with some caution and should be considered indicative only. Where possible, the analysis will point towards developing further research questions that may help explain particular issues within the data.
7

Suffolk Adult Substance Misuse Needs Assessment
Epidemiology Measures of drug use prevalence among key groups who often have significantly high levels of dependency on Class A drugs (such as offenders) require alternative approaches compared to the general population. One method is to calculate the total drug using prevalence in an area (by estimating the extent of those ‘missing’ or not in contact with services). Capture-recapture (CRC) or a Multiple Indicator Model (MIM) is a statistical technique that originated in ecology that utilizes at least two independent datasets to derive an estimate of the total population (including those that are not known to official agencies). This method has been used amongst the adult problem drug-using population across a number of geographical sites and over a long period of time (Hay et al, 2013; Frischer et al, 2004; Hickman et al, 2004; Millar et al, 2004). The method (Hay et al, 2013) integrates four datasets including NDTMS; Probation; Police and Prison domains to derive the overall prevalence estimate. This chapter will examine the extent and nature of presenting substance misuse based on CRC estimates and analysis of other related quantitative datasets.
Suffolk Estimates
CRC methods have been used to describe the prevalence of opiate and/or crack users across all local authority areas. Analysis suggests that in 2010-2011 there were 2,275 (2,106 - 2,498; 95% confidence interval) opiate and/or crack (OCU) drug users estimated to be resident within Suffolk (Hay et al, 2013). These figures will form the basis of the estimates of treatment penetration. The number of opiate and crack-cocaine users estimated to reside within Suffolk for 2010-11 was a reported drop of 21% from the previous year (2,872 estimated in 2009-10). This compares to a 1% drop in the East of England region and 2% nationally1.
The reduction in prevalence rates from 2009-10 to 2010-11 should be treated with some caution. The full range of lower and upper estimates (at 95% confidence level) is also shown in Table 1. The range of possible prevalence estimates can be shown to vary widely in 2009-10 compared to 2010-11 (for example, the OCU estimate is between 1,462 and 4,381 a difference of nearly 3,000 compared to 2010-11 where the difference is only 392). This suggests that the prevalence estimates for 2009-10 can be considered unstable. A number of factors may influence the level of stability in the prevalence estimates:
• The size of the sample in each cohort used for matching may vary (for example, one or more of the
three datasets used in the capture-recapture method may suffer from under-reporting and therefore the size of the dataset may be small)
• Changes in methodology of the datasets used to establish the prevalence estimates may affect what is included or excluded and therefore may vary over time. For example, one year may include recording of certain groups of substance misuser, if this changes the next year and they are no longer included this will influence the estimate and the CI range
1 In the East of England from 24,158 in 2009/10 to 23,851 in 2010/11 and for England 298,752 in 2010/11 from 306,150
8

Suffolk Adult Substance Misuse Needs Assessment
• The prevalence estimates and in-treatment population are not comparable (e.g. the prevalence
estimates refer to 2010-11 whilst the treatment demand data captures client information for 2012-13)
• Changes in the prevalence estimation methodology from one year to the next
• The sources used for the analysis are heavily weighted to criminal justice agencies (police, probation and prison) which would bias the model, as the independence of being in each category would be affected. Hay et al (ibid) advises caution when using these estimates as the basis for estimating the extent and nature of future demand for treatment services. Although the method has been effectively refined over time, including the development of supporting analyses that provide statistical ‘anchor points’, there may be scope for instance for the development of local analytical techniques using both direct and indirect methods, such as a study based in Lambeth that can be cited as possible examples of good practice (Cathcart et al, 2007).
TABLE 1: Prevalence estimates Suffolk 2009-10 to 2010-2011
Substance – Estimate 2009-10 (Lower –
Upper 95% CI2)
2010-11 (Lower –
Upper 95% CI)
% Point Prevalence
Difference Number (Range)
-Opiate and Crack Users 2,872 (1,462-4,381) 2,275 (2,106-2,498) -21% -Opiate users 2,342 (1,521-3,185) 2,029 (1,894-2,289) -13%
-Crack-cocaine users 1,452 (478-2,767) 1,229 (1,002-1,570) -15% -Injecting drug users 1,071 (491-1,645) 892 (577-1,298) -17%
Rate per 1,000 pop -Opiate and Crack Users 6.37 (3.24-9.72) 5.03 (4.65-5.52)
-Opiate users 5.20 (3.37-7.07) 4.48 (4.18-5.06) -Crack-cocaine users 3.22 (1.06-6.14) 2.72 (2.21-3.47)
-Injecting drug users 2.38 (1.09-3.65) 1.97 (1.28-2.87)
Given that the size of the lower and upper level CI for 2010-11 is much smaller than the previous years, it may be concluded that this figure may be considered a more robust estimate. The prevalence rates within the East of England contrasted to each area’s deprivation score is shown below in Figure 1. Two points can be gleamed from this analysis – first, that there is a relatively strong relationship between the OCUs rate per 1,000 population and deprivation (R²=0.71); second, that the OCU rate is broadly what would be expected taking into account the area’s relative deprivation levels (the rate is close to the regression line). Put another way, the prevalence level of OCUs in Suffolk is roughly what would be expected given the social and demographic make-up of the area compared to other locations in the region.
2 CI indicates the confidence interval and The size of the confidence interval depends on the sample size and the standard deviation of the study groups
9

Suffolk Adult Substance Misuse Needs Assessment
FIGURE 1: OCU rate per 1,000 resident population by indices of deprivation, East of England 2010-11
Figure 2 overleaf shows the comparative prevalence of OCUs; opiate; crack use; and injecting rates across Suffolk, East of England region and England. Overall, Suffolk prevalence levels are lower than the comparison areas although the levels of injecting are comparable with regional estimates (1.97 per 1,000 population in Suffolk compared to 1.92 per 1,000 in the Eastern region).
10

Suffolk Adult Substance Misuse Needs Assessment
FIGURE 2: Comparison of prevalence rates across key indicators, Suffolk; East of England region and England
Treatment Bullseye
The first section looks at the extent to which treatment services have been able to access the wider problem drug misusing population (defined as the “treatment penetration” rate). This has been calculated by using the estimates of problematic drug use (as devised by Hay et al) and comparing this figure with the number of people known to treatment services. The aim of the treatment bulls-eye is to drill-down into the prevalence data and determine the numbers of users in contact with services with a view of calculating a population that are ‘not known to treatment’. In other words, how many of the estimated opiate and crack-cocaine users are not known to services (and therefore become a target group).
The point prevalence estimates suggest 2,275 OCUs reside in the Suffolk area – Figure 3 suggests that of these 2,275; 984 were recorded as in treatment (43%); 389 (17%) were in treatment at some point during the year; 203 (9%) were known to the treatment system but had not engaged with services during the year and 719 (32%) were not known to services. Of the 719 not recorded as engaged with community-based substance misuse treatment services, a further 156 were known to criminal justice agencies (e.g. the Drug Intervention Programme) in the community and in prison. Adjusting for DIP contact, this suggests that 563 (25%) individuals who report use of OCUs were not known or reported to treatment services although the range may be between 399 and 791 individuals (Table 2 overleaf).
5.03 4.48
2.72
1.97
6.3
5.44
3.46
1.92
8.67
7.59
4.95
2.71
0
1
2
3
4
5
6
7
8
9
10
OCU Opiate Users Crack Users Injectors
Suffolk East of England England
11

Suffolk Adult Substance Misuse Needs Assessment
FIGURE 3: Treatment Bullseye Suffolk 2010-11
TABLE 2: Prevalence estimates Suffolk 2009-10 to 2010-2011
Estimate Lower Estimate Upper Estimate OCU Estimate 2,275 2,106 2,498
Estimate of Not Known Population
563 399 791
719 not known to treatment
203 known but not treated last
year
369 in treatment last
year
984 in treatment
12

Suffolk Adult Substance Misuse Needs Assessment
The principal underpinning the treatment bullseye methodology is to enhance the penetration rate (e.g. the number in treatment as a proportion of the total number of OCUs). Given that the prevalence estimation methods utilizes criminal justice data (e.g. police and probation) it would make sense that attempts to either (a) encourage reporting to NDTMS from related services such as Probation as a Tier 3 specialist structured treatment programme; and/or (b) establish new treatment pathways from both police and probation services should be encouraged. This may include developing new pathways of care directly from police custody such as via Forensic Medical Examiners or related Healthcare Professionals.
Treatment Mapping
A further requirement of the needs assessment process is to examine the extent to which adults move across the drug services as part of their treatment ‘journey’. The aim of this approach is examine whether any blockages occur that may result in an unplanned treatment exit. Figure 4 overleaf presents the range of referral pathways into community-based treatment and the subsequent outcomes. Table 3 below expands on the visual mapping of pathways by testing whether referrals; time spent in treatment and outcomes differ significantly (statistically speaking) from regional and national figures. A basic chi-squared test was applied to the raw numbers to examine whether the differences are due to chance or indicate whether any other factors are at play – it should be noted that the method is a basic approach aimed at testing whether any difference may be significant and should be treated with caution as more detailed multivariate analysis would be able to adjust for correlations across a wider number of variables.
Using this method, the pathway mapping shows that the majority (56%) of referrals were reported as ‘self’ compared to 52% in the region and 40% across England. Referrals from arrest referral/DIP were also shown to be higher in Suffolk (16%) compared to regionally and in England (reported at 9% across both areas). The analysis in Table 3 also suggests that this referral pathway and all other referral types (GP, drug services, arrest referral/DIP, CARAT, Probation, Criminal Justice and Other referrals) differ significantly from either regional or national comparisons. However, despite these differences there is no way of discerning a meaning behind these differences – for instance, are variations in pathways associated with differences in treatment outcome or purely a facet of reporting to NDTMS?
An additional analysis examined the length of time Suffolk service users spent in treatment compared to their regional and national counterparts. This suggested that one-fifth (20%) of Suffolk residents spent between two and four years in treatment compared to 15% regionally and nationally and the difference can be shown to be statistically significant (χ²=33.4; p<0.0001 compared to the region; χ²=37.1; p<0.0001 compared to England).
13

Suffolk Adult Substance Misuse Needs Assessment
FIGURE 4: Treatment Pathway Mapping Suffolk 2012-13
In Treatment 2012/13
GP/Primary Care Self Drug Services Arrest Referral/
DIP Probation CARAT CJS Other Other
Planned Referred On Unplanned- dropped out Unplanned - prison Unplanned Other
N=25; 4% N=334; 56% N=48; 8% N=92; 16% N=15; 3% N=26; 4% N=19; 3% N=34; 6%
N=224; 41% N=83; 15% N=184; 34% N=8; 1% N=41; 8%
Suffolk residents more likely to be in treatment for 2-4 years (20%) compared to national (15%) and regional estimates. There is no difference in levels engaging in treatment for 4 years or more (22% in Suffolk; 21% regionally and 20% in England)

Suffolk Adult Substance Misuse Needs Assessment
TABLE 3: Referral pathways Suffolk 2010-2011 compared to regional and England (underscore identifies statistically significant differences from Suffolk)
Suffolk East of England England Significance Referral
- GP 4% 4% 6% χ²=4.2; p<0.04
- Self 56% 52% 40% χ²=64.6; p<0.0001
- Drug Services 8% 10% 13% χ²=12.1; p<0.0005
- Arrest
Referral/DIP
16% 9% 9% χ²=22.4; p<0.0001
(regional); χ²=25.9; p<0.0001 (national)
- Probation 3% 4% 5% χ²=9.4; p=0.002
- CARAT 4% 8% 9% χ²=10.2; p=0.001
(regional); χ²=17.7; p<0.0001 (national)
- CJS Other 3% 4% 7% χ²=13.0; p=0.003
- Other 6% 8% 10% χ²=4.7; p=0.03
(regional); χ²=10.1; p=0.001 (national)
Drug Intervention Programme A key component of the engagement strategy has been to ensure that offenders engage with specialist substance misuse treatment. Analysis from the Arrestee Survey (Boreham et al, 2007) research program of drug-testing in police custody suites between 2003 and 2006 concluded that over a quarter (26%) of all arrestees had taken heroin, crack or cocaine powder in the last month – although it should be noted that the research is around a decade old by this stage. This analysis suggested that the following prevalence rates for last month use: Cannabis 41%; Heroin 13%; Crack 13%; Cocaine 11%. The trend over the three-year period of the study suggested that there has been a decline in the prevalence of heroin and crack use, but an increase in the use of powder cocaine (which was consistent with the findings amongst the general household population). In addition, there was a declining proportion of OCUs (from 18% in 2003-2004 to 13% in 2005-2006) reported to be current injectors. The study also established the links between drug use and offending with 79 per cent of regular (weekly) users of heroin and/or crack arrested in the last year, and 16 per cent also in prison within the last year.
15

Suffolk Adult Substance Misuse Needs Assessment
Here, the extent to which offenders are dependent on drugs can be illustrated through use of the Severity of Drug Addiction (SDA) scale which demonstrated the following:
• 85% of heroin users (using in the last year) • 55% of crack users (using in the last year) • 23% of cocaine users (using in the last year)
Moreover in the same study (Boreham, ibid), the levels of treatment demand amongst a key cohort of high-level users are also significant. Amongst heroin users who used five times a week, there remained a strong demand for treatment with a third (32%) reported to be currently in treatment and 60 per cent stating that they would like access to specialist services. In comparison, there was a reduced level of treatment demand amongst other regular users of drugs and alcohol – 35 per cent of crack, 60 per cent of powder cocaine and 74 per cent of alcohol users said that they did not require treatment for their drug use. Findings from the evaluation of DIP (Skodbo et al, 2007) suggested that the criminal justice system was an appropriate route for offenders to access treatment services with 79% reporting a reduction in offending rates. However, this research was able to identify a sub-group of offenders (around a quarter) who actually increased their offending rates. This is consistent with other research (Best et al, 2008) that suggested positive outcomes for offenders with lower levels of prison incarcerations but higher levels of drug use (drug-using offenders) compared with negative results for offenders with more intensive criminal histories and lower levels of drug use (offending drug-users). Offenders with a history of injecting use, opiate or poly-drug dependence and were prolific offenders were all considered to be high-risk and recommendations included the need for specialist aftercare interventions such as the Drugs Intervention Programme (DIP) and other related services. The relationship between drug-related death and alcohol use has provoked some debate including the hypothesis that opiate users who use alcohol may require less heroin to overdose – raising the possibility that greater alcohol use could be associated with reduced tolerance (Hickman et al, 2008). Other research has also identified the importance of engaging high-risk groups of drug-using prisoners released into the community including the need for housing support (Fox et al, 2005). The extent to which offenders engaged with treatment programmes is has been presented in the full publication for commissioners that suggests a lower proportion of offenders referred to specialist drug treatment programmes for Suffolk who subsequently engaged with treatment services (defined as being triaged and starting a modality) compared to the East of England average. Caution is advised with the interpretation of these data as the Suffolk treatment engagement rate refers to a small number of service users. Further work is required to understand the nature of referrals into treatment – for example, why is there a relatively low proportional rate compared to other areas? In addition, the DIP data suggests that of those offenders referred, there is a sizeable cohort who were not known to treatment services suggesting a potential segment of substance misuser that may benefit from enhanced support and engagement.
16
Suffolk Adult Substance Misuse Needs Assessment
Treatment Outcomes
There is a relatively large literature on the efficacy of treatment as an intervention that has an impact on offending and other outcomes. Research from the Drug Treatment Outcome Research Study (DTORS) interviewed 1,796 adults in Tier 3 and 4 drug treatment services and re-interviewed these clients at the 3-5 period (including 245 outside this “window”) and again at second follow-up 11-13 months later. The findings suggested that drug treatment was effective in reducing harmful behaviours associated with drug misuse (Jones et al, 2009; Donmall et al, 2009).
The study was also able to show that the majority of clients in treatment received a care-plan, were satisfied with their treatment and were retained by services for greater than 12 weeks. These factors all predicted statistically significant reductions in self-reported drug use; offending; social-functioning ; health and risk behaviours. These findings echo other longitudinal research (Millar et al, 2008; Stewart et al, 2000) including key findings from the earlier National Treatment Outcomes Research Study (NTORS).
Furthermore, the DTORS study also argued that treatment services should be “sufficiently flexible” to meet the multiple needs of drug misusers including ensuring effective multi-agency practices are in place (Donmall et al, 2009).
Moreover, the research suggested that whilst most improvements occur in the first few months after entering treatment, improvements continued for up to six months – suggesting the need for a more finely calibrated performance metric (Jones et al, 2009). This analysis confirms another recent study examining outcomes from NDTMS that found significant improvements in treatment outcomes for PDUs with the one caveat of a reduced level of improvement for poly-drug users of both opiates and crack-cocaine (Marsden et al, 2009).
The wider research literature suggests that a key factor predicting a successful treatment outcome is retention in treatment (cf. Simpson et al, 1997a). The implications of this are that premature drop-out from treatment decrease the overall effectiveness and efficiency of service provision. Therefore there is a need to ensure clients are sufficiently retained with three months seen as a minimum length of stay and around twelve months for opiate users receiving clinical support (Simpson et al, 1997a). Although the research evidence supports the existence of a treatment duration threshold for positive long-term outcomes, some commentators have suggested that the relationship is unclear – for instance, whether longer treatment is better or individuals with a more favourable prognosis simply stay longer (Fletcher & Battjes, 1997). Retention may be an artefact of other client personality characteristics that may be also associated with more positive outcomes or retention may be a function of the interaction of treatment environment and client (Walker et al, 2009).
Moreover, the exposure to treatment can also be seen as a predictive factor and there is a suggestion that having a number of treatment episodes over a drug-using career may be more beneficial than one single “burst” of activity. In other words, drug users may accrue incremental improvements with each additional treatment contact (Anglin et al, 1997). By way of contrast, there is some suggestion that a drug user with a history of multiple episodes over time may undermine an individual’s confidence to resist drug use following treatment (Grella et al, 1999).
17
Suffolk Adult Substance Misuse Needs Assessment
The evidence also supports the notion that system factors are sufficiently related to improved treatment outcomes. For example, client-worker relations, the range of services delivered and customer satisfaction ratings were all shown to relate to retention in treatment and wider beneficial outcomes (Simpson et al, 2009; Morris & Gannon, 2008; Morris & McKeganey, 2007; Joe et al, 1999; Simpson et al, 1997b). Where staff exhibit greater levels of autonomy, have better communication and are sufficiently focused on change can all be seen as resulting in improved treatment satisfaction (Lehman et al, 2002). Put another way, organizational factors have been shown to be vital in enhancing the therapeutic relationship with clients (Simpson & Flynn, 2008; Greener et al, 2007; Broome et al, 2007).
The evidence also highlights the need for individuals to engage effectively with treatment and not merely attend (Joe et al, 1999). Yet ensuring that individuals effectively engage with treatment is also a major factor predicting a successful outcome and some research has highlighted that extraneous issues (such as obstacles inhibiting access) may be the dominant obstacle in early treatment engagement (Coulson et al, 2010). Other independent factors potential to interfere with readiness for treatment include; waiting times; referral mechanisms; and the quality of relationship with treatment staff (Redko et al, 2007).
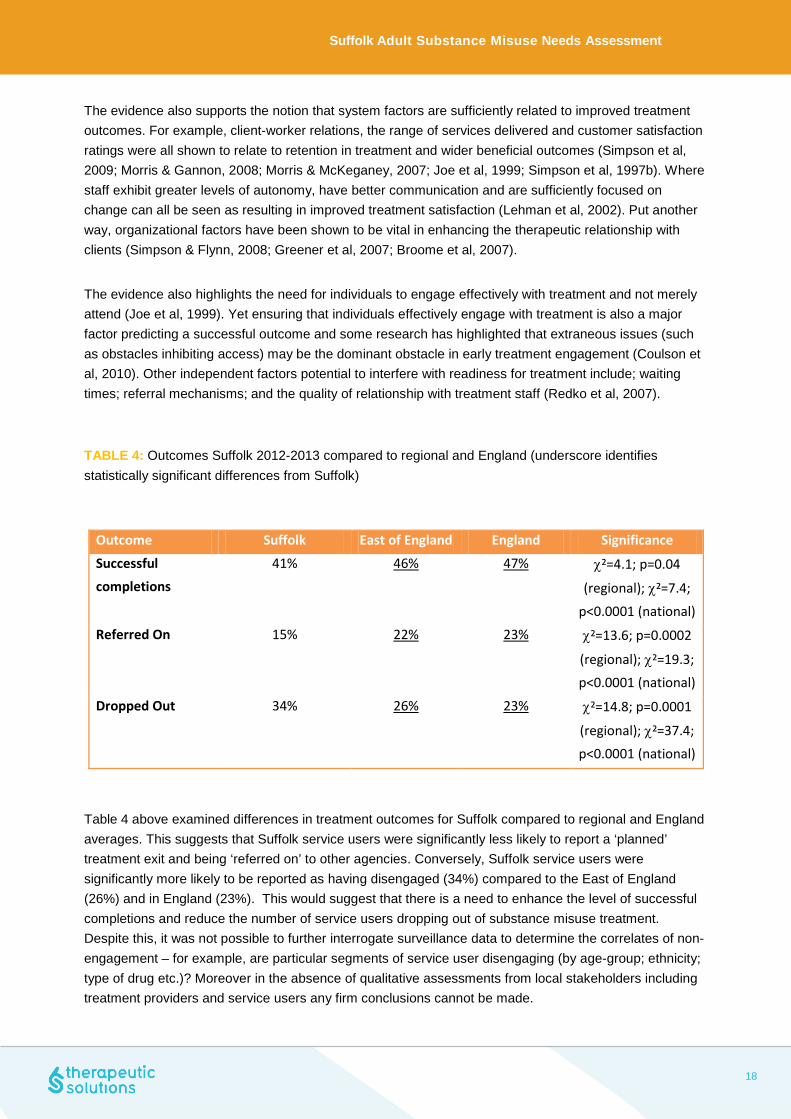
TABLE 4: Outcomes Suffolk 2012-2013 compared to regional and England (underscore identifies statistically significant differences from Suffolk)
Outcome Suffolk East of England England Significance
Successful completions
41% 46% 47% χ²=4.1; p=0.04
(regional); χ²=7.4;
p<0.0001 (national) Referred On 15% 22% 23% χ²=13.6; p=0.0002
(regional); χ²=19.3; p<0.0001 (national)
Dropped Out 34% 26% 23% χ²=14.8; p=0.0001
(regional); χ²=37.4; p<0.0001 (national)
Table 4 above examined differences in treatment outcomes for Suffolk compared to regional and England averages. This suggests that Suffolk service users were significantly less likely to report a ‘planned’ treatment exit and being ‘referred on’ to other agencies. Conversely, Suffolk service users were significantly more likely to be reported as having disengaged (34%) compared to the East of England (26%) and in England (23%). This would suggest that there is a need to enhance the level of successful completions and reduce the number of service users dropping out of substance misuse treatment. Despite this, it was not possible to further interrogate surveillance data to determine the correlates of non-engagement – for example, are particular segments of service user disengaging (by age-group; ethnicity; type of drug etc.)? Moreover in the absence of qualitative assessments from local stakeholders including treatment providers and service users any firm conclusions cannot be made.
18
Suffolk Adult Substance Misuse Needs Assessment
Higher levels of disengagement may indicate issues with service provision or alternatively could indicate that specific groups do less well in treatment or be a reflection of how information is recorded onto NDTMS. Data presented in the full needs assessment (not presented here) has highlighted key outcome metrics of successful treatment completion and re-presentation. Of those service users in contact with structured services who successfully completed their programme of treatment (as defined by NDTMS) and did not represent back into treatment – a key performance indicator – the analysis suggested that Suffolk residents were represented at levels directly comparable to national averages. In addition, looking at successful completions as a whole (and excluding the re-presentation component) there was also variable levels of success from a lower rate for opiate users, to higher success rates for alcohol users and for non-opiate users (data presented in the full needs analysis).
The information routinely provided by PHE includes summary data derived from the Treatment Outcome Profile (TOP) that includes the possibility of examining the changes in an individual’s drug use (and other factors) at key points during their treatment. One key metric is to compare the difference between drug use at treatment start and at completion. There is an acceptability threshold to be met to report on this information – at least 80% of individuals that exited treatment in a planned way during 2012-13 should have a TOP form completed. Table 6 overleaf shows average number of days service users reported use of selected drugs at treatment start and at discharge – with a higher ‘score’ relating to a positive status and a lower figure and less positive position. This confirms reductions across all substances and for high-risk behaviours such as injecting. Although it should be noted for some substances (e.g. powder cocaine, amphetamine and crack-cocaine) the numbers reporting use of these drugs are small. The analysis also does not provide a statistical test (for examine paired-samples t-test) to test whether the changes are statistically significant or occurred by chance.
In addition, it was possible to supplement this with an examination of changes in education, employment, housing, psychological, physical and quality of life scores. In all categories there have been improvements in a service user’s outcomes at treatment exit (for successful completion). These findings may be considered self-evident as the literature shows that service users who engage and successfully complete treatment are likely to report improvements across a number of domains from substance misuse to associated indicators with recovery including housing and quality of life indicators. Moreover, the sample size for interrogation of key recovery indicators such as housing, employment and education/training remain small (ranging from six individuals to 24) which prohibits any meaningful understanding of how these factors link into better substance misuse outcomes. It is imperative that for a fuller understanding of the role these factors play in an individual’s treatment, more in-depth and sophisticated analysis of the data is required. There is a need for further interrogation of the data to understand reporting to NDTMS – for example, cross-referencing the number of days service users used opiates (estimated to be 9 days per month) at exit compared to the reported outcome. Is reporting of opiate use at discharge reflected in the correct recorded outcome and not as ‘discharged drug-free’? However, there is little available information provided from TOP that could help predict a non- successfully completed exit (e.g. disengagement from service). In many ways this segment of service user may be more interesting to commissioners – does an episode of treatment elicit any changes? Can these changes be sustained and what would help service users re-engage with treatment? For example, are particular attributes associated with disengagement that could act as markers at treatment initiation? For example, a higher quality of life score has been shown to be a predictor of successful treatment outcomes and sustained remission (Laudet et al, 2009). In a similar vein, previous research highlighted that acute housing need is strongly associated with early drop-out from treatment services (cf. Stevens et al, 2008).
19

Suffolk Adult Substance Misuse Needs Assessment
TABLE 6: Outcomes Suffolk by substance 2012-2013
TOP Category Number of Users At Treatment Start At Planned Exit
Average opiate use (days) 74 21.5 9.2
Average crack use (days) 18 12.6 1.0
Average cocaine use (days) 3 11.3 0.0
Average amphetamine use (days)
4 13.5 6.0
Average cannabis use (days)
42 21.1 11.8
Average alcohol use (days) 25 12.6 8.6
Average injecting (days) 36 21.5 8.7
TABLE 7: Outcomes Suffolk by other indicators 2012-2013
TOP Category Number of Users At Treatment Start At Planned Exit
Average days attended education
6 5.7 11.6
Average days in paid employment
24 17.0 18.2
Percentage reporting a housing problem
24 16.2 10.1
Psychological Health Score 148 9.8 14.5
Physical Health Score 148 11.3 14.7
Quality of Life 148 9.9 15.0
20
Suffolk Adult Substance Misuse Needs Assessment
Suggested Next Steps This final section will provide an overview of the suggested next steps based on the analysis provided above. The study is cautious about any generalizations made in this report – information is provided for epidemiological analysis based on a ‘cut’ of data derived from NDTMS. No secondary analysis of data was possible to test for correlations and inferences across the full range of variables collected on NDTMS including outcome data (through the use of TOP). Moreover, the study was not able to report on stakeholders’ (e.g. service users and treatment staff) perceptions of progress. Some associations for example may be due to the way information is coded on NDTMS and may reflect differing practices in Suffolk compared to other areas.
Recommendations Enhance penetration of OCUs through targeted activity in the criminal justice system 1. Create or enhance pathways from Probation 2. Develop pathways from police custody (e.g. from police healthcare) 3. Enhance DIP referrals to ensure engagement with treatment The prevalence estimates suggest that around 25 per cent of OCUs may not be in contact with specialist substance misuse services. The prevalence estimation methodology is heavily weighted towards criminal justice data collection (namely Probation and Police arrest information using the Police National Computer). Data derived from the Drug Intervention Programme including interventions in police custody and in prison have been included in the prevalence estimate. Therefore, there may be scope in ensuring that substance misusers known to Probation and the police engage with services. This may include better reporting of probation clients to NTDMS and may also indicate a need to develop enhanced pathways to specialist substance misuse services. Similarly, the prevalence estimates include individuals known to the police. This suggest two possibilities – either DIP reporting may be at fault (and the reduced confidence intervals in this year’s estimate suggest issues with reporting may have been corrected); or OCUs are known to the police but not engaging with services.
21

Suffolk Adult Substance Misuse Needs Assessment
One possibility is that substance misusers may engage with police healthcare services but not with specialist treatment agencies (e.g. through forensic medical services). Pathways from police healthcare to substance misuse services may need to be developed to access this segment. Analysis of DIP data suggested that there was a relatively low level of treatment engagement following a DIP referral. Caution is advised with the interpretation of this finding, as there was nearly the same number of individuals referred in Suffolk as in Essex (with a much higher referral rate). It is recommended that there should be an enhancement of the links from DIP to treatment. Improve treatment outcomes 4. Improve the level of successful completions The analysis has shown that the level of successful completions in Suffolk is less than would be expected in comparison to regional and national figures. It is unclear whether these differences were an artefact of reporting practices in Suffolk (e.g. how management information is collected and coded onto NDTMS) or whether it represents a ‘real’ difference in treatment outcomes. Mapping the pathways from arrival to exit from a service user perspective is recommended.
5. Develop a strategy for improving the outcomes for opiate users The extent to which opiate users successfully complete treatment was lower than expected compared to other regional partnerships. In addition, only a small percentage of opiate users who were recorded as ‘successfully completing treatment’ and who did not re-present to services within six months (full data presented not presented in this report). These findings suggest that opiate users may be struggling to maintain remission from services post-release. There may be a need to develop a bespoke treatment response for opiate users including the possibility of ideas such as a ‘Recovery Check-Up’ for service users about to leave treatment.
Develop a public health intelligence function for substance misuse 6. Develop a range of epidemiological methods that routinely provide suitably robust intelligence for commissioners
This study has suggested that the level of information available from NDTMS to undertake a thorough and meaningful needs analysis has been curtailed through access to limited ‘cuts’ of the data and in particular the absence of interrogation looking at changes over time (trend analysis). Secondary analysis on treatment engagement; segmentation of service user groups alongside use of qualitative assessments (e.g. staff and service user surveys) are also recommended.
22

Suffolk Adult Substance Misuse Needs Assessment
7. Analysis of the data should have a greater focus on indicators of recovery
There is only basic information and small sample sizes for this report (and reliant on TOP information) on factors that facilitate recovery such as housing, education/training and employment. There is a need to develop a more sophisticated analytical framework (ideally including but not solely reliant on NDTMS) that can explore the role such factors play in an individual’s recovery from addiction.
23

Suffolk Adult Substance Misuse Needs Assessment
References
Best D., Day E., Homayoun S., Lenton H., Moverley R., Openshaw M. (2008), Treatment retention in the Drug Intervention Programme: Do primary drug users fare better than primary offenders, Drugs : Education, Prevention and Policy, Vol. 15, Issue 2, pp201-209
Best D. & Laudet A (2010), The Potential of Recovery Capital, London: RSA.
Boreham, R, Cronberg A, Dollin L, Pudney S (2007), Arrestee Survey 2003-2006, Home Office Statistical Bulletin 12/07.
Cathcart S., Patton R, Hickman M, Hendry C, Ashworth M (2007), Comparing population estimates for drug users, the prevalence of blood borne viruses and the provision of services in one London borough: Evidence of a gap in provision?, Drugs: Education, Prevention and Policy, Vol. 14, Issue 3 pp. 205-215.
Donmall M, Jones A, Davies L & Barnard M (2009), Summary of key findings from the Drug Treatment Outcomes Research Study (DTORS), Home Office Research Report 23.
Fiorentine R., Nakashima J., Anglin MD. (1999), Client engagement in drug treatment, Journal of Substance Abuse Treatment, Volume 17, Issue 3, October 1999, pp 199-206.
Fox A, Khan L, Briggs D, Rees-Jones N, Thompson Z, Owens J (2005), Throughcare and aftercare: approaches and promising practice in service delivery for clients released from prison or residential rehabilitation, Home Office On-Line Report 01/2005.
Frischer, M., Heatlie, H. and Hickman, M. (2004), Estimating the prevalence of problematic and injecting drug use for Drug Action Team areas in England: a feasibility study using the Multiple Indicator Method. Online Report OLR 34/04. London: Home Office.
Greener J., Joe G., Simpson D.,Rowan-Szal G. & Lehman W. (2007), Influence of organisational functioning on client engagement in treatment, Journal of Substance Abuse Treatment, Vol. 33, No. 2. 139-147
Hay, G. et al,. (2013) Estimates of the prevalence of opiate use and/or crack cocaine use (2010/11): PHE: London.
Hickman, M., Higgins, V., Hope, V. and Bellis, M.A. (2004), Estimating prevalence of problem drug use: multiple methods in Brighton, Liverpool and London. Online Report OLR 36/04. London: Home Office.
Hickman M., Lingford-Hughes A., Bailey C., MacLeod J., Nutt J., Henderson G. (2008), Does alcohol increase the risk of overdose death: the need for a translational approach, Addiction, Vol. 103, Issue 7, pp1060-1062.
24
Suffolk Adult Substance Misuse Needs Assessment
HM Government (2010), Drug Strategy 2010 Reducing demand, restricting supply, building recovery: Supporting people to live a drug free life.
Joe G., Simpson D. & Broome K. (1999), Retention and patient engagement models for different treatment modalities in DATOS, Drug and Alcohol Dependence, Vol. 57, No. 2, 113-125
Jones A, Donmall M, Millar T, Moody A, Weston S, Anderson T, Gittins M, Abeywardana V amd D’Souza J (2009), The Drug Treatment Outcomes Research Study (DTORS): Final Outcomes Report, Home Office Research Report 24.
Laudet A., Becker J. , White W. (2009), Don’t wanna go through that madness no more: Quality of Life satisfaction as predictor of sustained remission from illicit drug misuse, Substance Use and Misuse, 44(2); 227-252.
Marsden J, Eastwood B, Bradbury C, Dale-Perera A, Farrell M, Hammond P, Knight J, Randhawa K (2009), Effectiveness of community treatments for heroin and crack cocaine addiction in England: a prospective, in-treatment cohort study, Lancet online October 2009.
Millar, T., Gemmell, I., Hay, G. and Donmall, M. (2004,) The dynamics of drug misuse: assessing changes in prevalence. Online Report OLR 35/04. London: Home Office.
Millar T., Jones A., Donmall M., Roxburgh M. (2008), Changes in offending following prescribing treatment for drug misuse, Research Briefings 36, NTA: London.
Simpson D., Joe G., Broome K., Hiller M., Knight K & Rowan-Szal (1997a), Program Diversity and Treatment Retention Rates in the Drug Abuse Treatment Outcome Study (DATOS), Psychology of Addictive Behaviours, Vol. 11, No. 4,279-293
Simpson D., Joe G & Brown B (1997b), Treatment Retention and Follow-Up Outcomes in the Drug Abuse Treatment Outcome Study (DATOS), Psychology of Addictive Behaviours, Vol. 11, No. 4, 294-307
Simpson, D. D., & Flynn, P. M. (2008). Drug Abuse Treatment Outcome Studies (DATOS): A national evaluation of treatment effectiveness. In G. Fisher & N. Roget, (Eds.), Encyclopaedia of Substance Abuse Prevention, Treatment, and Recovery (pp. 303-307). Thousand Oaks, CA: Sage Publishing.
Simpson D., Rowan-Szal., Joe G., Best D., Day E & Campbell A. (2009), Relating counsellor attributes to client engagement in England, J of Substance Abuse Treatment, Vol. 36 313-320.
Stevens A., Radcliffe P., Sanders M. & Hunt N. (2008), Early exit: Estimating and explaining early exit from treatment, Harm Reduction Journal 5(13)
Walker R. (2009), Retention in Treatment – Indicator or Illusion: An Essay, Substance Use and Misuse, Vol. 44, No. 1, pp18-27.
Skodbo S., Brown G., Deacon S., Cooper A., Hall A., Millar T., Smith J., Whitham K. (2007), The Drug Intervention Programme (DIP): addressing drug use and offending through ‘Tough Choices’, Home Office Research Report 2.
25


