Global climate change, priorin volcanic activity. Sulfur dand is readily oxidized to s
Sulfur dioxideSO2
Carbon dioxideCO2
Global warmingOxidationOxidizing capacityVolcanoVolcanic eruptionMass extinctionTipping pointMethane
ulfuric acid normally within weeks. But trace amounts of SO2 exert significantinfluence on climate. All major historic volcanic eruptions have formed sulfuric acid aerosols in the lowerstratosphere that cooled the earth's surface ~0.5 °C for typically three years. While such events are currentlyhappening once every 80 years, there are times in geologic history when they occurred every few to a dozenyears. These were times when the earth was cooled incrementally into major ice ages. There have also beentwo dozen times during the past 46,000 years when major volcanic eruptions occurred every year or two oreven several times per year for decades. Each of these times was contemporaneous with very rapid globalwarming. Large volumes of SO2 erupted frequently appear to overdrive the oxidizing capacity of theatmosphere resulting in very rapid warming. Such warming and associated acid rain becomes extreme whenmillions of cubic kilometers of basalt are erupted in much less than one million years. These are the times ofthe greatest mass extinctions. When major volcanic eruptions do not occur for decades to hundreds of years,
to the 20th century, appears to have been initiated primarily by major changesioxide (SO2) is the most voluminous chemically active gas emitted by volcanoes
the atmosphere can oxidize all pollutants, leading to a very thin atmosphere, global cooling and decadaldrought. Prior to the 20th century, increases in atmospheric carbon dioxide (CO2) followed increases intemperature initiated by changes in SO2.By 1962, man burning fossil fuels was adding SO2 to the atmosphere at a rate equivalent to one “large”volcanic eruption each 1.7 years. Global temperatures increased slowly from 1890 to 1950 as anthropogenicsulfur increased slowly. Global temperatures increased more rapidly after 1950 as the rate of anthropogenicsulfur emissions increased. By 1980 anthropogenic sulfur emissions peaked and began to decrease because ofmajor efforts especially in Japan, Europe, and the United States to reduce acid rain. Atmosphericconcentrations of methane began decreasing in 1990 and have remained nearly constant since 2000,demonstrating an increase in oxidizing capacity. Global temperatures became roughly constant around 2000and even decreased beginning in late 2007. Meanwhile atmospheric concentrations of carbon dioxide havecontinued to increase at the same rate that they have increased since 1970. Thus SO2 is playing a far moreactive role in initiating and controlling global warming than recognized by the Intergovernmental Panel onClimate Change. Massive reduction of SO2 should be a top priority in order to reduce both global warmingand acid rain. But man is also adding two to three orders of magnitude more CO2 per year to the climate thanone “large” volcanic eruption added in the past. Thus CO2, a greenhouse gas, is contributing to globalwarming and should be reduced. We have already significantly reduced SO2 emissions in order to reduce acidrain. We know how to do it both technically and politically.In the past, sudden climate change was typically triggered by sudden increases in volcanic activity. Slowincreases in greenhouse gases, therefore, do not appear as likely as currently thought to trigger tipping pointswhere the climate suddenly changes. However we do need to start planning an appropriate human responseto future major increases in volcanic activity.
The atmosphere is a very thin blanket of gases, aerosols, andminute particles that makes the earth habitable. Over 90% of theatmosphere bymass is within 16 km of the earth's surface [1].Without
ll rights reserved.
an atmosphere, world temperatures would approach −19 °C (−2 °F) [2]but with the atmosphere the average world temperature has beenwithin 0.7 °C of 14 °C (57.2 °F) since 1880 [3]. A small difference of0.1 °C between the mean temperatures of the Medieval WarmingPeriod and the Little Ice Age [4] had a major effect on climate change,glacial length, food supplies, and population growth [5,6].
The atmosphere selectively reflects, refracts, scatters, absorbs, ortransmits broadband radiant energy from the sun, infrared energy
Fig. 1. Fresh sulfur deposits on the summit of Trident Volcano, Katmai National Park,southwestern Alaska. This picture was taken on August 7, 1963, looking northwest. Thethermometer went off scale above 400 °F. Access was possible because very strongwinds kept the hot toxic gases close to the ground. Trident erupted in April and October,1963. (Photo by Peter L. Ward).
Table 1The four cardinal rates of SO2
Rate of SO2
emissionEruption rate Effect Cause
I Low No large volcaniceruptions fordecades
Cooling anddecadal droughts
Lack of significant SO2
allows the oxidizingcapacity of atmosphereto be restored, purgingall greenhouse gases andpollutants, reducing theinsulating capacity of theatmosphere and inhibitingrain.
II Moderate One large volcaniceruption (VolcanoExplosivity Index z6)every few decadesor longer
Cooling for afew years
Erupted SO2 formssulfuric acid layer in thelower stratosphere,reflecting heat from thesun typically for threeyears. Eruptions spaced afew years to decadesapart cool the earthincrementally into iceages.
III High More than one largevolcanic eruption eachyear for decades
Global warming Erupted SO2 uses up theoxidizing capacity of theatmosphere causinggreenhouse gases andother pollutants toaccumulate.
IV Extreme More than 100,000large flood basalticeruptions in less thanone million years
Extreme globalwarming andmass extinctions
Erupted SO2 causesextreme globalwarming and acid rainover tens of thousandsof years.
3189P.L. Ward / Thin Solid Films 517 (2009) 3188–3203
radiated outwards by the earth, and cosmic rays bombarding theearth from all directions. Gases, aerosols, and particles in theatmosphere maintain a delicate and very dynamic balance suchthat the energy at the top of the atmosphere received from the sunequals the energy reflected or radiated by the earth and itsatmosphere [7]. We will see below that very small changes inatmospheric chemistry can lead to major changes in reflection,refraction, scattering, absorption, and transmission that changeglobal climate. An analogy would be a horizontal slat windowshade (venetian blind) where the very small amount of energyneeded to rotate the slats could have a major effect on the solarenergy reflected and transmitted.
The atmosphere originally formed from outgassing of the earth,primarily through volcanoes. The atmosphere changed from reducingto oxidizing around 2.5 Ga (billion years ago) when volcanism shiftedfrom being primarily submarine to having a major subaerialcomponent [8]. The major source of new gases in the atmospherehas been from volcanoes. Volcanic gases are modified, for example, bychemical processes in the atmosphere, by plants converting carbondioxide (CO2) to oxygen (O2), by animals doing the reverse, by decay ofanimal and vegetable matter, by forest fires, and by chemicalweathering of geologic materials. The single most important chemicalprocess in the atmosphere today is oxidation. The atmosphere cleansitself of impurities by oxidizing them to form larger molecules thatsettle out or are rained out.
Similarly, the only well-known sources of regular major changesin atmospheric chemistry throughout geologic time are volcanoes,major fires and now human burning of fossil fuels. Large volcaniceruptions that spew hundreds of megatons of water and gases occurtoday approximately once every 80 years, but have been known inthe past to occur as often as several times each year. Largemeteoroids, the methane “clathrate gun hypothesis” [9], suddendraining of glacial lakes [10], massive iceberg discharges [11], andother possible climate changing events are orders of magnitude lesscommon.
The Intergovernmental Panel on Climate Change (IPCC) WorkingGroup I published an extensive report in 2007 [12] that concludesthat carbon dioxide (CO2) is the most important cause of climatechange and that the only important effect of volcanoes on climatechange is to cause global cooling for a few years following largevolcanic eruptions. While the concentration of CO2 clearly haschanged in phase with changes in global temperature in the past,
recent data suggest that these changes actually followed changes intemperature. For example, Stott et al. [13] observed that at the end ofthe last ice age, deep-sea temperatures warmed by ~2 °C between19 ka (thousand years ago) and 17 ka, preceding the rise inatmospheric CO2 and tropical sea-surface warming by ~1000 years.Similar delays were observed at the end of the last three glacialperiods at 19 ka, 125 ka and 240 ka [14–17]. CO2 is soluble in waterand more soluble in cold water. Ocean temperature is therefore theprimary natural control for atmospheric CO2 concentration [18].Similarly, before the widespread growth of plants (~350 Ma, millionyears ago), the mass of atmospheric CO2 may have been as large as 17times the mass of pre-human atmospheric CO2 but global tempera-tures were not significantly higher [19]. In fact, glaciers werecommon. These extremely important observations must be exploredin detail before we can assess how much the 7.8 Gt of carbon addedto the atmosphere yearly by humans burning fossil fuel andmanufacturing cement [20] is influencing global warming.
Volcanoes erupt large amounts of sulfur (Fig. 1) and the mostchemically active gas erupted by volcanoes in significant volumesis sulfur dioxide (SO2) [21], which is readily oxidized to sulfuricacid. Sulfuric acid, “because of its low vapor pressure, quicklyattaches to aerosol particles” [22]. The primary oxidant is thehydroxyl radical (OH) which is formed high in the atmosphere fromozone (O3) primarily through photodissociation in the near ultra-violet [23]. Ozone and OH are in limited supply. If large amounts ofSO2 are erupted frequently enough, as will be explained in detailbelow, the atmosphere loses its oxidizing capacity, its ability tocleanse itself. Greenhouse gases such as water vapor, methane andcarbon monoxide, and other pollutants increase, causing globalwarming.
This paper explains the evidence for each of the four cardinal ratesof SO2 erupted by volcanoes and their effects on global climate change(summarized in Table 1). The IPCC only discussed the moderate rate(II). The other three rates are quite unexpected in the prevalent
Fig. 2. Amajor increase in volcanism led to the modern glacial epoch. The red line is thecumulative number of knownmajor volcanic eruptions (Table S1). The green line is δ18Omeasured in shells of foraminifera, a proxy for mean paleotropical sea-surfacetemperature and global ice volume with lowest temperatures and more glaciers tothe left [70]. The range in temperatures is approximately 7 °C [71]. The blue line at33.9Ma shows the time of major cooling of the earth leading to suddenmajor glaciationin Antarctica and major changes in flora and fauna in North America and Eurasia [62–65]. The black line shows the area of ocean crust formed per year [72]. Note the majorincrease in seafloor production and volcanism around 34, 12 and 3 Ma. Red “F” symbolsshow times of major flood basalts (Table S1).
3190 P.L. Ward / Thin Solid Films 517 (2009) 3188–3203
climatological thinking of today. For those who understand thewidespread distribution of volcanoes, their sometimes extremely highrates of eruption, and the large volume of water and gases erupted,what is unexpected is why it has taken so long to recognize theirimportant role in climate change. SO2 is also emitted when fossil fuelsare burned. This paper provides the clearest link yet publishedbetween human activities and global climate change.
There are numerous ideas about what initiates climate change.Many of these processes may be at work, but in this paper, Ipropose that the concentration of SO2 has been the primaryinitiator of climate change prior to the industrial revolutionbeginning in 1850. The climate appears to have maintained adelicate balance among the four cardinal rates of SO2. This is goodnews, because we have already developed effective technologicaland political ways to reduce SO2 emissions in order to reduce acidrain. Throughout geologic history, changes in CO2 have been theresult of climate change. The prodigious emission of greenhousegases by man may now have become a secondary initiator ofclimate change.
2. Moderate rate: Occasional large volcanic eruptions, short-termglobal cooling
The largest volcanic eruption in the past 95 years was from Mt.Pinatubo in the Philippines in 1991 [24]. Pinatubo erupted into theatmosphere 491 to 921Mt (megatons) ofwater (H2O), 42 to 234Mt CO2,15 to 19Mt SO2, and3 to 16Mt chlorine (Cl) [25]. This eruption increasedthe total mass of the atmosphere [26], primarily with water, by only0.23 ppm (parts per million). The amount of SO2 added to theatmosphere was only 3.3 ppb (parts per billion), although the changeswere much greater near the volcano. Within 21 days, an aerosol layercircled the earth at altitudes of 20 to 23 km that was 99% pure sulfuricacid/water solution droplets (~75% H2SO4 and 25% H20) [27,28]. Theseaerosols increased the optical depth of the atmosphere to 0.4, reflectingand absorbing incoming solar energy, reducing globally averaged netradiation at the top of the atmosphere by about 2.5 W m−2, causing anaverage global cooling of surface temperatures by 0.5 °C over three years[28,29] and warming the tropical lower stratosphere 3 °C [30]. Whilethere was global average cooling, winter surface temperatures overEurasia and North America were slightly higher [31].
Pinatubo erupted 2.5 to 14 times more CO2 than SO2 and 29 to 54times more water than SO2. Yet the constant rate of growth of CO2 inthe atmosphere decreased after the eruption from 1 to 2 ppmv peryear between 1982 and 1990 to less than 1 ppmv per year in 1992–1993 [32,33]. This decrease was most likely caused by the decrease inglobal temperature, cooling the water that then absorbed more CO2.The aerosols following the eruption also increased diffuse radiation,enhancing noontime photosynthesis of a deciduous forest by 23% in1992 and 8% in 1993 under cloudless conditions and thereforeabsorbing more CO2 [34]. Similarly the cooling decreased total watervapor in the atmosphere [35]. In this way the sulfate (SO4
2−) aerosolsnegated the potential global warming effects of both erupted water,the dominant greenhouse gas [7], and erupted CO2.
But the erupted water did play a key role. Sulfate aerosols arehygroscopic; their formation depends on availability of one moleculeof OH and ~3 molecules of water for each molecule of SO2 oxidized inthe stratosphere [36]. Since the stratosphere is normally almostcompletely dry [37,38], the presence of erupted water is extremelyimportant in formation of these aerosols [39].
Cooling of the earth for several years has beenobserved after all largevolcanic eruptions throughout history [40–49], has been successfullymodeled [50–55], is discussed clearly by the IPCC [12] andwill thereforenot be discussed further here (Cardinal Rate II, Table 1).
Church et al. [56] estimate that the eruption of Pinatubo causeda rapid “reduction in ocean heat content of about 3×10²² J and aglobal sea-level fall of about 5 mm” and that “recovery was not
complete at the end of the simulations in 2000,” 8.5 years later.The only way to move the earth into an ice age is to reduce themassive heat capacity of the ocean. These calculations suggestthat a sequence of large volcanic eruptions only a few years to afew decades apart could cool the ocean incrementally into an iceage.
3. Volcanism and glacial epochs
Table S1 (see Supplementary data) provides the most completelist available of all known large volcanic eruptions through the last542 million years. These events typically have a Volcano Explosiv-ity Index (VEI) [24,57] of 6 or greater. The red line in Fig. 2 showsthe cumulative number of the largest known volcanic eruptions inthe past 120 m.y. (million years) based on the red highlightedentries in Table S1. The general shape of this curve is what is mostimportant and is probably a reasonable estimate. The actualnumber of largest eruptions is a major underestimate. For example,more than 50% of the eruptions shown are within the United Statesportion of the largest known Silicic Volcanic Province extendingfrom central Colorado to central Mexico and active primarilybetween 32 and 27 Ma as described in detail by Ward [58,59]. Yetmore than 75% of this province is in Mexico where insufficientfieldwork has been done to delineate the date and volume of mostspecific eruptions [60]. Thus the major increase in number of large
Fig. 3. Major volcanic activity in Silicic Volcanic Provinces (SVP) typically precedes anincrease in glaciation and a decrease in sea-level throughout the last 600 million years.Times of SVP are shown in red from Table S1.The shaded green areas show the δ18Oproxy for tropical sea surface temperature [70]. Values to the left of the vertical greenline show times of glaciation (icehouse). Values to the right of the line show times oflittle of no glaciation (greenhouse). The blue curve shows sea level [81–84]. The black“E” symbols are times of major mass extinctions [180] and the red “F” symbols are timesof major flood basalts (Table S1).
3191P.L. Ward / Thin Solid Films 517 (2009) 3188–3203
eruptions between 32 and 27 Ma could be 4 times greater thanshown.
Despite these limitations, there is clearly a significant increase inthe rate of large volcanic eruptions between 37 and 27Ma, between 17and 10 Ma, and since 5 Ma. Around 33.9 Ma (blue line), major coolingof the earth occurred in two 40 k.y. (thousand years) phases separatedby 200 k.y. leading to suddenmajor glaciation in Antarctica [61]. At thesame time the temperature in central North America decreased by8.2 °C [62] and abrupt cooling was observed in China [63]. There weredramatic changes toward colder climate in flora and fauna in NorthAmerica and Eurasia [64,65]. Major increases in ice volume inAntarctica also began at 23.7, 16–12, and 2.7 Ma [66,67]. Extensiveice-rafted debris appeared in the Norwegian–Greenland Sea between38 and 30 Ma [68]. Other major increases in glaciation in the Arcticbegan around 14 and 3.2 Ma [69].
The green line in Fig. 2 is an estimate of the mean paleotropicalsea-surface temperature based on δ18O, which is the ratio of theisotopes 18O to 16O measured in the shells of foraminifera andcompared to some standard [70]. Increasing δ18O is sensitive todecreasing temperature and to increasing world ice volume and istherefore a good proxy for the amount of glaciation. Individualmeasurements were averaged for each million years. Independentcalibration of δ18O for temperature using Mg/Ca suggests a differenceof 2.8±0.7 °C between the Last Glacial Maximum and the present [71].Therefore the range shown may be as much as 7 °C with the coldesttemperatures to the left. Clearly cooling has increased most around33.9 Ma and since 15 Ma when the rate of major volcanic eruptionswas high.
The black line shows the ocean crust production per year [72].The rate of ocean crust formation similarly is higher for periods ofrapid cooling. One might assume that submarine volcanoes wouldheat the ocean, but for new ocean floor to form, similar amounts ofocean floor must be subducted elsewhere around the globe.Increased subduction leads to increased volcanic activity abovesubduction zones. Such eruptions are largely unreported in Table 1before 5 Ma because of the difficulty of mapping their depositsunder piles of more recent volcanic debris. The rapid increase ofocean crust production around 40 Ma, 33 Ma and 10 Ma arecontemporaneous with global cooling. The net cooling after majorvolcanic eruptions demonstrates that the reduction of incomingsolar heat caused by volcanic atmospheric aerosols is considerablygreater than the heat released directly by subaerial or submarinevolcanoes.
Starting after 4Ma, the world is slipping into the coldest part of theice age. Ice Rafted Debris (IRD) are first observed in the North Atlanticaround 3 Ma [73] as forests in Africa turn into open savannah [74,75].At 2.65 Ma there are major increases of IRDs and deep-sea volcanicsediments in the North Pacific [76,77] marking the beginning of thePleistocene Ice Age preferred by climatologists (2.58 Ma). Geologiststhink of the Pleistocene as starting at 1.81 Ma [78]. This increase involcanism correlates with the major increase in the rate of subductionunder Alaska and Asia.
The red Fs in Fig. 2 show times of major flood basalts listed inTable S1. The dates of individual flood basalt eruptions are unknownand are not included in the red curve. As will be discussed below,major flood basalts normally cause major short-term global warmingfor periods of less than 1 million years. Such warmings have largelybeen averaged out of the green curve, which shows one mean valueper million years.
The same paleotropical sea-surface temperature data are shownby the shaded green curve about a vertical axis in Fig. 3 for thepast 600 m.y. (million years). Essentially, data to the left of thegreen vertical axis (average δ18O per m.y.=1.45‰ (per mil)) repre-sent times of extensive glaciation or Icehouse Climate and datato the right of this axis represent warmer times of limited glacia-tion or Greenhouse Climate. Note the four numbered basic epochs
of glaciation. Times of these epochs and the specific times of ma-jor glaciation shown agree well with detailed geologic evidencefor glaciation throughout the world within the temporal resolu-tion of both data sets [79,80]. Note that most major Silicic Vol-canic Provinces (SVP) listed in Table S1 and shown in this figureoccur near the onset of major glaciation and that the largest knownSVP at 32 Ma begins the largest known glacial epoch in the past600 m.y.
The blue curve in Fig. 3 shows sea-level [81–86]. Note that SVPs, asfar back as they have been mapped, typically occur at the onset ofdecreases in sea-level most likely associated with increased glaciation.
Fig. 4 shows the relationship of volcanism to global temperatureduring the last glacial cycle since 125 ka. The green line shows stackedδ18O data measured in the shells of foraminifera from 57 globallydistributed benthic sites [87]. Note that it took 100,000 years to cool
Fig. 4. The most recent glacial cycle involves incremental decreases in temperatureover 100,000 years followed by rapid warming of the same amount in less than8000 years. The green line is the stacked δ18O proxy for tropical benthic temperatureand ice volume [87] with lowest temperatures to the left and a temperature range ofapproximately 2.8 °C between the Last Glacial Maximum and the present [71]. Theblack curve shows the changes in temperature resulting from earth orbital changes aspredicted by Milanković [89]. The purple line is the δ18O proxy for temperature andglaciation on the glacial surface in Greenland [91]. Horizontal black lines are majorvolcanic eruptions (Table S1). Red bars show individual sulfate anomalies measured inthe GISP2 ice core [96]. Blue bars show the number of eruptions per century inferredby Zielinski et al. [96] to correct for ice compaction. The dashed blue line at 18eruptions per century is the approximate boundary between the cooling effects of asmall number of eruptions and the warming effects of a large number of eruptions.Toba is the largest known volcanic eruption since 28 Ma and the Z2 tephra is avolcanic ash widely recognized in deep-sea sediment cores. H0 thru H6 are Heinrichevents. Numbers 0 thru 12 and the letter A are Dansgaard–Oeschger sudden warmingevents. The largest sulfate anomalies clearly coincide with the rapid warming sincethe Last Glacial Maximum.
3192 P.L. Ward / Thin Solid Films 517 (2009) 3188–3203
the earth incrementally but less than 9000 years to warm it up again.Why?
In 1920, Milanković first published an explanation for ice ages thathas been the only widely accepted mechanism [88]. He noted that theamount of solar energy reaching the earth is controlled primarily byperiodic changes in the earth's precession, obliquity, and eccentricityand proposed that the net effect could explain the origin andtermination of ice ages. The insolation in August at 65°N predictedby Milanković is shown in black in Fig. 4 [89,90]. The long periodcomponents of the green curve are similar to the black curve but thetemperature varies much more frequently.
The purple line in Fig. 4 shows δ18O measured in the GISP2ice cores in Greenland [91]. Various data show that the surfacetemperature in Greenland cycles through a range of as much as 16 °C
[92,93] with modest change of mean until the end of the ice ageswhile the green line suggests that ocean temperatures changed lessthan 3 °C [71], ratcheting incrementally down into the depths of theice age and then warming rapidly.
Major volcanic eruptions listed in supplementary Table S1(horizontal black lines in Fig. 4) typically occur at the beginning ofsudden decreases in δ18O. The precision of the age dates for most ofthese eruptions is limited, but this temporal relationship isparticularly clear for the few precisely dated eruptions [94,95]. Therecord of specific eruptions during this time period is fairly limited,but evidence in the latter part of Table S1 suggests there were enoughmajor eruptions to have at least one occur for each and everyinflection point along the δ18O curve.
The red bars in Fig. 4 show the concentrations of volcanic sulfate(SO4
2−) measured by ion chromatograph in specific layers in theGISP2 ice core [96]. The amount of sulfate designated as volcanic isdetermined by an empirical orthogonal function (EOF) analysis onthe entire glaciochemical time series [97,98]. The primary sourcesof sulfate are continental dust rich in calcium, sea salt rich insodium, and volcanoes rich in a host of other elements. The EOFanalysis essentially uses the proportions of all elements to separatesources.
Ice layers become more compacted and more difficult to decipherwith increasing depth. The blue bars in Fig. 4 show the number oferuptions per century inferred by Zielinski et al. to correct for suchcompaction [96]. Note that while most red bars before the Last GlacialMaximum correspond to cooling, some red bars and all blue barslonger than 18 eruptions per century (blue dashed line) occur duringbrief warming phases. Also note that the greatest levels of volcanicsulfate by a factor of 3–4 correspond to the period of most rapidwarming after the Last Glacial Maximum (LGM). Moderate rates ofvolcanism appear to cause cooling (Cardinal Rate II, Table 1) whilehigh rates of volcanism appear to cause warming (Cardinal Rate III,Table 1).
4. The oxidizing capacity of the atmosphere is limited
The primary oxidants in the atmosphere are ozone, the hydroxylradical (OH) and hydrogen peroxide (H2O2) [23]. OH has been calledthe “tropospheric vacuum cleaner” [99] because it reacts with dozensof gases. In fact OH is responsible for removing ~2380 Mt of carbonmonoxide (CO), ~90 Mt of SO2, and ~1180Mt of other trace gases fromthe atmosphere each year [22]. Ozone in the stratosphere forms fromthe effects of ultraviolet sunlight on oxygen. OH and H2O2 form fromozone by photodissociation in the near-ultraviolet [23]. All threeoxidants are highly reactive, short lived, and in limited supply,especially at night, at high latitudes, and during the winter. Theavailability of these three oxidants is called the “oxidizing capacity” ofthe atmosphere.
Immediately following the eruption of Pinatubo in 1991, ozonelevels in the lower stratosphere dropped by as much as 25%, thelowest level since satellite measurements began in 1979 [100,101].There was a strong downward trend in OH concentration [102–105]and sharp increases in the growth rates of CH4 and CO concentrationsin the tropics and at high southern latitudes [105,106]. Manning et al.[107] calculated that an OH reduction of the order of 10%, decayingover about a year, is consistent with anomalously high CH4 growthrates during this period.
Small changes in SO2 can cause large changes in atmosphericchemistry for several reasons:
A. SO2 when oxidized, forms sulfuric acid, which has a particularlylow vapor pressure allowing it to adsorb on tiny dry particles andthen to increase the size of these particles by molecularcondensation of more acid [22]. The resulting molecules “nucleatenew particles under favorable conditions, increasing aerosol
Fig. 5. Warming correlates with high rates of volcanism, times of continuous volcanismwithin contiguous layers and increases inmethane. Redbars showvolcanic sulfate [96], thepurple line shows the δ18O proxy for surface temperature in Greenland [91], and the oliveline showsmethane since25ka from theGISP2drill hole [116]. Thegreen line is cumulativevolcanic sulfate; the more horizontal the slope, the higher the rate of volcanism. The bluecircles with numbers show the time and number of contiguous layers in the GISP2 corescontaining volcanic sulfate. These are the periods of greatest warming. The brown shadedareas show times of increased glaciation. The pink shaded areas show times of lushvegetation in Egypt, Sudan, Libya and Chad [117]. The largest sulfate anomalies arecontemporaneous with times of rapid warming, increases in methane, and northwardmovement of the ITCZ in Africa. RWP is the RomanWarming Period. MWP is theMedievalWarm Period. H0–H2 are Heinrich glacial surges. Black 0, A, 1–2 are Dansgaard–Oeschgersudden warming events.
3193P.L. Ward / Thin Solid Films 517 (2009) 3188–3203
number density and the population of cloud condensation nuclei”[108]. Sulfuric acid is formed in the lower stratosphere via thefollowing three cascading chemical reactions [22]:
SO2 þ OHþM→HSO3 þM
HSO3 þ O2→HO2 þ SO3
SO3 þ H2O þM→H2SO4
where M is either N2 or O2, the most common molecules in theatmosphere.
B. Other oxidation pathways can become important including theSO2+O(3P) reaction which tends to deplete ozone [109]. Modelingof these changes suggests that H2SO4 is converted to ultrafinesulfate particles (radius ~0.01 µm or even less) and therefore theirresidence time in the stratosphere is increased by at least a factorof 2 [110,111].
C. SO2 reacts immediately with any available OH leaving little OH tooxidize slower reacting gases such as CH4 and CO. Thereforeincreasing concentrations of CH4 and CO indicate decreasingoxidizing capacity.
D. SO2 gas absorbs ultraviolet light at wavelengths of 290–330 nm. Asa result, SO2 reduced production of OH by reducing the actinic fluxby ~12% immediately after the eruption of Pinatubo [106].
E. Scattering by the sulfate aerosols perturbed the actinic flux for upto one year after the eruption [106].
F. Oxidation of SO2 after the eruption of Pinatubo had an e-foldingtime of 35 days, which means it took 35 days to oxidize 1/e or 37%of the gas [112]. The rate controlling molecule in the oxidation ofSO2 is OH [22]. Therefore it took 35 days for enough OH to beavailable to oxidize 37% of the SO2. Most SO2 was in theatmosphere for less than a fewmonths. Its effect on the availabilityof OH was greatest in the months following the eruption, butcontinued for several years while the sulfate aerosols remained inthe lower stratosphere.
G. SO2, in sufficient concentration, condenses to a liquid below−10 °C. The temperature of the troposphere decreases withincreasing altitude at −6.4 °C/km to −55 °C at the tropopauseand then increases with altitude in the overlying stratosphere.Thus in most of the troposphere and lower stratosphere, SO2 ispotentially a liquid. This liquid has good solubility and can beoxidized readily by H2O2 in cloud droplets and in precipitation[22]. Ehhalt [22] argues that 70% of the available SO2 is oxidized inthis way. Such oxidation does not lead to nucleation of newparticles [108]. Yet Carslaw et al. [113] write “An important sourceof new aerosol particles in the atmosphere is the nucleation ofultrafine condensation nuclei from trace condensable vapors suchas sulfuric acid. Despite intensive research over several decades,the sources of the ubiquitous background of ultrafine aerosols inthe troposphere have not been conclusively identified.” I proposethat the SO2 gas/liquid, which exists in the troposphere for at leastmonths after volcanic eruptions, is the likely source of such vapors.I will discuss below the fact that man is adding SO2 to theatmosphere constantly by burning fossil fuels.
Laj et al. [114] argue that the depletion of H2O2 in the ice inGreenland suggests that SO2 reached Greenland as a gas and was thenoxidized in precipitation. Barrie and Hoff [115] studied SO2 in thearctic originating from fossil fuel burning in Eurasia. They concludethat the residence time is 14–20 days in late fall, 16–32 days in mid-winter and 10–19 days in April.
All of these observations show that the oxidizing capacity of theatmosphere is limited over periods of months to a few years followingmajor volcanic eruptions. It typically takes from one to ten years forthe atmosphere to recover totally. Therefore the oxidizing capacity ofthe atmosphere can be overwhelmed if large volcanic eruptions begin
occurring every year or several times a year. The result is globalwarming.
5. High rate: Frequent large volcanic eruptions, global warming
Volcanic sulfate anomalies in the Greenland ice layers aresignificantly larger and more frequent between 15 and 7 ka asshown by the red bars in Fig. 4. This is exactly the time of greatestglobal warming coming out of the last ice age (green line). Fig. 5 showsthis relationship in more detail. The purple line shows the GISP2 δ18Oproxy for temperature and ice volume for the past 25,000 years [91].The world was coldest during the Last Glacial Maximum (LGM)between 22 and 24 ka, depending on the data set. Warming was slowuntil between 15 and 9 ka when temperature increased abruptly. Thegreen line shows the cumulative amount of volcanic sulfate. The slopeof the green line is the inverse of the rate of sulfate per thousand years.The more horizontal the green line, the greater the rate of sulfatedeposition. The slope is most horizontal, which means the volcanicactivity is highest between 11.3 and 9.5 ka, the time of greatest globalwarming, the Preboreal warming.
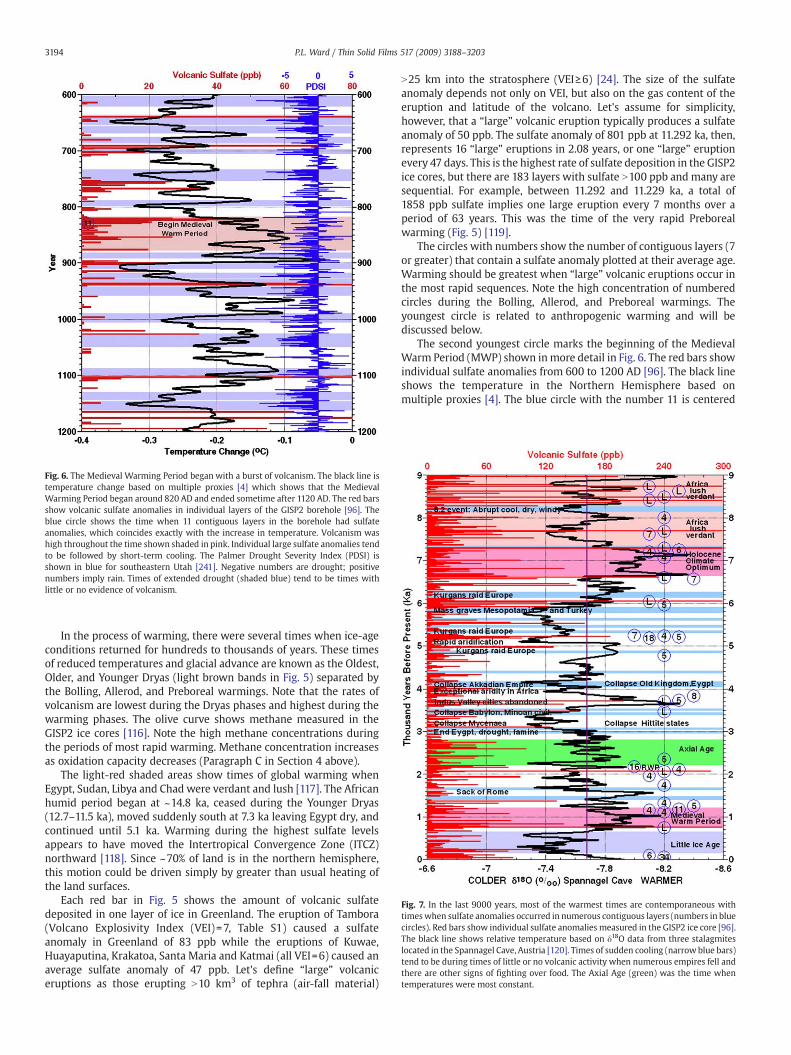
Fig. 6. The Medieval Warming Period began with a burst of volcanism. The black line istemperature change based on multiple proxies [4] which shows that the MedievalWarming Period began around 820 AD and ended sometime after 1120 AD. The red barsshow volcanic sulfate anomalies in individual layers of the GISP2 borehole [96]. Theblue circle shows the time when 11 contiguous layers in the borehole had sulfateanomalies, which coincides exactly with the increase in temperature. Volcanism washigh throughout the time shown shaded in pink. Individual large sulfate anomalies tendto be followed by short-term cooling. The Palmer Drought Severity Index (PDSI) isshown in blue for southeastern Utah [241]. Negative numbers are drought; positivenumbers imply rain. Times of extended drought (shaded blue) tend to be times withlittle or no evidence of volcanism.
Fig. 7. In the last 9000 years, most of the warmest times are contemporaneous withtimeswhen sulfate anomalies occurred in numerous contiguous layers (numbers in bluecircles). Red bars show individual sulfate anomalies measured in the GISP2 ice core [96].The black line shows relative temperature based on δ18O data from three stalagmiteslocated in the Spannagel Cave, Austria [120]. Times of sudden cooling (narrow blue bars)tend to be during times of little or no volcanic activity when numerous empires fell andthere are other signs of fighting over food. The Axial Age (green) was the time whentemperatures were most constant.
3194 P.L. Ward / Thin Solid Films 517 (2009) 3188–3203
In the process of warming, there were several times when ice-ageconditions returned for hundreds to thousands of years. These timesof reduced temperatures and glacial advance are known as the Oldest,Older, and Younger Dryas (light brown bands in Fig. 5) separated bythe Bolling, Allerod, and Preboreal warmings. Note that the rates ofvolcanism are lowest during the Dryas phases and highest during thewarming phases. The olive curve shows methane measured in theGISP2 ice cores [116]. Note the high methane concentrations duringthe periods of most rapid warming. Methane concentration increasesas oxidation capacity decreases (Paragraph C in Section 4 above).
The light-red shaded areas show times of global warming whenEgypt, Sudan, Libya and Chad were verdant and lush [117]. The Africanhumid period began at ~14.8 ka, ceased during the Younger Dryas(12.7–11.5 ka), moved suddenly south at 7.3 ka leaving Egypt dry, andcontinued until 5.1 ka. Warming during the highest sulfate levelsappears to have moved the Intertropical Convergence Zone (ITCZ)northward [118]. Since ~70% of land is in the northern hemisphere,this motion could be driven simply by greater than usual heating ofthe land surfaces.
Each red bar in Fig. 5 shows the amount of volcanic sulfatedeposited in one layer of ice in Greenland. The eruption of Tambora(Volcano Explosivity Index (VEI)=7, Table S1) caused a sulfateanomaly in Greenland of 83 ppb while the eruptions of Kuwae,Huayaputina, Krakatoa, Santa Maria and Katmai (all VEI=6) caused anaverage sulfate anomaly of 47 ppb. Let's define “large” volcaniceruptions as those erupting N10 km3 of tephra (air-fall material)
N25 km into the stratosphere (VEI≥6) [24]. The size of the sulfateanomaly depends not only on VEI, but also on the gas content of theeruption and latitude of the volcano. Let's assume for simplicity,however, that a “large” volcanic eruption typically produces a sulfateanomaly of 50 ppb. The sulfate anomaly of 801 ppb at 11.292 ka, then,represents 16 “large” eruptions in 2.08 years, or one “large” eruptionevery 47 days. This is the highest rate of sulfate deposition in the GISP2ice cores, but there are 183 layers with sulfate N100 ppb and many aresequential. For example, between 11.292 and 11.229 ka, a total of1858 ppb sulfate implies one large eruption every 7 months over aperiod of 63 years. This was the time of the very rapid Preborealwarming (Fig. 5) [119].
The circles with numbers show the number of contiguous layers (7or greater) that contain a sulfate anomaly plotted at their average age.Warming should be greatest when “large” volcanic eruptions occur inthe most rapid sequences. Note the high concentration of numberedcircles during the Bolling, Allerod, and Preboreal warmings. Theyoungest circle is related to anthropogenic warming and will bediscussed below.
The second youngest circle marks the beginning of the MedievalWarm Period (MWP) shown inmore detail in Fig. 6. The red bars showindividual sulfate anomalies from 600 to 1200 AD [96]. The black lineshows the temperature in the Northern Hemisphere based onmultiple proxies [4]. The blue circle with the number 11 is centered
Table 2Times of a high rate of volcanic activity shown by sulfate anomalies within 4 or morecontiguous layers or by sulfate anomalies of at least 200 ppb within one or twocontiguous layers (L in column 1)
The last column, sulfate per year, provides a way to compare intensity of volcanism.
Fig. 8. Periods of greatest warming coming out of the last ice age are contemporaneouswith times of sulfate anomalies in numerous contiguous layers (blue circle and numberof layers). Red bars show sulfate anomalies in individual layers of ice in the GISP2borehole [96]. The purple line shows the δ18O proxy for temperature adjusted for gasage [91]. The Preboreal warming coincides with the largest sulfate anomaly observed.The BollingWarming coincides with the largest number of contiguous layers containingvolcanic sulfate. Dryas periods of increased glaciation coincide with little or novolcanism.
3195P.L. Ward / Thin Solid Films 517 (2009) 3188–3203
on the period with volcanic sulfate in 11 contiguous layers (819 to 840AD). This high rate of volcanism continues until 878 AD shown by thered shaded area. Note how the beginning of the Medieval WarmPeriod coincides exactly with the high contiguous rate of volcanism(Cardinal Rate III, Table 1). Most individual major volcanic sulfateanomalies in Fig. 6 are followed by short-term cooling (Cardinal RateII, Table 1), although this is pushing the accuracy of the temperaturedata.
The red bars in Fig. 7 show volcanic sulfate anomalies for thepast 9000 years [96]. The black line is temperature based on δ18Odata from three stalagmites located in the Spannagel Cave, Aus-tria [120]. The numbers in the blue circles again show the numberof contiguous layers containing volcanic sulfate anomalies (4 orgreater). Very high volcanic activity is sometimes confined to oneor two layers. An L in a blue circle denotes a time when total sulfatein one or two layers is at least 200 ppb. The data in the blue cir-cles are summarized in Table 2. Note that the warmer temperatures(δ18Ob−7.8) are contemporaneous with high volcanic activity shownby the blue circles. This is true for the Medieval Warm Period, theRomanWarm Period (RWP), the warm peaks around 3.7 ka and 5.2 ka[121], the Holocene Climate Optimum, and the period from 8.4 to9 ka. The Little Ice Age, on the other hand is a time of relatively lowvolcanism.
The correlation between warming and high volcanic activity inFig. 7 appears particularly robust when you realize that the width of
the red lines tends to obscure the fact that 74% of the ice layers formedsince 9 ka contain zero volcanic sulfate. Note that climate changeappears to be initiated by levels of sulfate far less than one “large”volcanic eruption per year (50 ppb). The more I work with the rawdata in Fig. 7 and Table 2, the more convinced I become that whenwehave developed the best model integrating the four cardinal rates ofSO2 (Table 1), we should be able to input observed volcanic sulfatelevels and predict a temperature profile within the error bars ofobserved temperature profiles.
The red bars in Fig. 8 show volcanic sulfate anomalies between 9and 16 ka [96]. The numbers in the blue circles show the number ofcontiguous layers containing volcanic sulfate anomalies (7 or more).The purple line is temperature based on δ18O data from layers of snowin the GISP2 borehole [91]. As snow accumulates, it forms firn, a layerof ice with interconnected air passages. The gases are not trappedwithin the ice until buried by 40 to 120m of snow [122,123]. Thereforethe gas age is less than the layer age. The Meese/Sowers timescalerelates depth in the GISP2 holes to layer age and to gas age [124]. Gasages are typically 220 years younger from 0 to 10,000 years and550 years younger around 15,000 years ago. The purple line is plottedas a function of gas age. The largest sulfate anomaly of 801 ppb at11.292 ka followed by numerous contiguous layers of volcanic activityis contemporaneous with the rapid Preboreal warming. The BollingWarming begins with 33 contiguous layers (14.484 to 14.586 ka) andthen with 64 contiguous layers (14.235 to 14.457 ka). The AllerodWarming coincides with 37 contiguous layers (13.577 to 13.732 ka) of
Fig. 9. Dansgaard–Oeschger sudden warming events (numbers on the right side) allcorrespond to times of high volcanism. Red bars show sulfate anomalies in individuallayers of ice in the GISP2 borehole [96]. The purple line shows the δ18O proxy fortemperature adjusted for gas age [91]. Numbers in blue circles show the number ofcontiguous layers containing sulfate anomalies at the time plotted. H2 to H5 areHeinrich events when large numbers of icebergs suddenly appeared in the northernAtlantic Ocean.
Fig. 10. Recent warming correlates with increases in sulfur from fossil fuels. Red barsshow sulfate in each layer of ice in Greenland [96], the blue line shows average globaltemperature [132] and the black line shows sulfur emitted by burning fossil fuels[133,134]. Names of volcanoes (VEI) are shown with associated sulfate anomalies [24].All layers since 1925 contain residual sulfate that increases yearly in proportion to theincrease in anthropogenic sulfur emissions.
3196 P.L. Ward / Thin Solid Films 517 (2009) 3188–3203
volcanic sulfate anomalies. Single, even large, sulfate anomalies tendto be contemporaneous with cooling (Cardinal Rate II, Table 1) whilesulfate in multiple contiguous layers tends to be contemporaneouswith warming (Cardinal Rate III, Table 1). Steffensen et al. [125]document from detailed sampling of ice layers in Greenland thatwarming of as much as 10 °C occurred within 3 years during theBolling Warming and 60 years during the Preboreal Warming withcorresponding increases in layer thickness (precipitation) of 40%.
The red bars in Fig. 9 show volcanic sulfate anomalies from 22 to46 ka [96]. The numbers in the blue circles again show the number ofcontiguous layers containing volcanic sulfate anomalies (5 or more).The purple line is temperature based on δ18O data from layers of snowin the GISP2 borehole based on gas age [91]. Numbers 2 thru 12 areDansgaard–Oeschger events when rapid warming of 10 to 16 °C inGreenland occurred in less than 40 years [92,93,126–129]. All warmingphases except event 5 at 31.5 ka are contemporaneous with volcanicsulfate in 5 or more contiguous layers. Event 5 is contemporaneouswith much higher volcanic sulfate (795 ppb) than usual between31.632 and 31.203 ka, but not in more than 4 contiguous layers.
Heinrich events [130] (H0–H6 in Figs. 4, 5, 8 and 9) when largenumbers of icebergs suddenly appeared in the northernAtlantic Oceantend to occur when there is little volcanism. H2 and H3 in Fig. 9 appearto be contemporaneouswithmajor cooling while H4 and H5 appear tobe contemporaneous with rapid warming. The temporal resolution isnot yet accurate enough for an unambiguous interpretation.
Figs. 4–9 and Table 2 show that all major warming events in thepast 46 k.y. are contemporaneous with high rates of volcanismwhen
“large” volcanic eruptions are occurring every few months to everyyear or two for years to decades (Cardinal Rate III in Table 1). No otherprocesses are known that can cause such rapid warming so often. Thereason for thewarming appears to be reduction of oxidationpotentialcausing an increase in gases such as carbon monoxide and methane.Once warming begins, the erupted water and CO2 would compoundthe warming. Increasing temperatures would further increase atmo-spheric concentrations of water and CO2. Such positive feedbackshelp us understand how the global temperatures could change sorapidly.
In conclusion, prior to man, global climate change appears to beinitiated primarily by changes in SO2. Changes in CO2 are a result, not acause.
6. Anthropogenic warming
The red bars in Fig. 10 show sulfate anomalies in the GISP2 ice corein Greenland from 1850 to 1985 [96] along with the names of knownvolcanic eruptions with their VEI [24]. The blue line shows meanyearly global surface temperature [131,132]. The black line shows theamount of sulfur emitted by humans burning fossil fuel [133,134].During the 19th century, 72% of the ice layers had no volcanic sulfate.Since 1927, all layers had sulfate and the amount of sulfate increasesproportionally to the sulfur emitted by burning fossil fuels (black line).
3197P.L. Ward / Thin Solid Films 517 (2009) 3188–3203
Such a linear increase in background sulfate has never been observedin any ice cores going back many hundreds of thousands of years. Thesulfate in Greenland increases proportional to known human emis-sions and decreases after 1980 when the amount of anthropogenicsulfur was decreased through international efforts to reduce acid rain.
This same increase before 1980 and then decrease is seen in ice andshallow firn cores throughout Greenland in holes drilled as recently as1999 [135–137]. Similar sulfate trends observed in the Alps corre-spond closely with known sulfate emissions in surrounding countries[138]. The rise and fall has been successfully modeled using knownanthropogenic emissions [139,140] and known efforts to reduce sulfurdioxide emission throughout Europe [141]. Similar rise and fall isobserved in ice cores from the Dasuopu glacier [142] and the EastRongbuk glacier [143] in the Himalayas, the Belukha ice core in theSiberean Altai [144], the Lomonosovfonna ice field on Svalbard [145]and from ice cores in Severnaya Zemlya, Eurasian Arctic [146]. Theamount of sulfate varies with distance to industrial centers with verylow anthropogenic signals observed in ice cores from the St. EliasMountains in Yukon, Canada [147].
These sulfate signals corresponding closely to known anthropo-genic emissions prove that SO2 emitted from smokestacks around theworld rises high enough and remains in the troposphere long enoughto reach regional ice fields but not long enough to be thoroughlyhomogenized worldwide. Barrie and Hoff [115] conclude that theresidence time for industrial SO2 from Eurasia in the Arctic is 14–20 days in late fall, 16–32 days at mid-winter and 10–19 days in April.Laj et al. [114] found that high concentrations of sulfate in Greenlandwere associated with local depletions in H2O2, suggesting that the SO2
remained a gas until oxidized as it was deposited in Greenland. Allauthors agree that the majority of anthropogenic sulfate in Greenlandoriginated from northern Eurasia.
The amount of sulfate deposited in each layer (1.7 years) inGreenland had risen by 1962 to 50 ppb, the equivalent to one “large”volcanic eruption. Humans burning fossil fuels have raised the
Fig. 11. Anthropogenic sulfur emissions peaked around 1980, followed by both methane concarbon dioxide meanwhile increases at the same rate. The thin black line is monthly averageshows the temperature trend fit to five cycles. The solid purple line shows known anthranthropogenic sulfur releases until 2020 [158]. The green line shows annual average meth[156,157]. Symbols “E” show times of the largest known El Niño events [149,150].
background SO2 levels in the atmosphere to levels that throughoutthe past 46 k.y. have caused global warming.
Since 2000, the world reached a peak in global warming as shownin Fig. 11. The thin black line shows the monthly temperature data[131,132] with a running, centered, 12-point average. The thick blackline shows a five-cycle trend fit to the data. Note that since 2000,global temperature has remained relatively constant and evendecreased since autumn 2007. The peak in temperature duringWorld War 2 (1939–1945) was discovered recently to be an artifactcaused by a change in countries reporting ocean temperatures thatused different methods for measuring [148]. The low in temperaturearound 1910 is most likely related to the large volcanic eruptions ofKrakatau (1883), Santa Maria (1902), and Katmai (1912), all VEI 6. Ifthese effects were corrected, the temperature data would approach amonotonically increasing line similar to the other lines in this Figure.Sudden peaks in temperature appear to correspond to the very largestknown El Niño currents (Symbol “E” in Fig. 11) [149,150].
The purple line in Fig. 11 shows the sulfur emission resulting fromman burning fossil fuels [133,134]. Note the moderate increase intemperature before 1950 when anthropogenic sulfur increased slowlyand the rapid increase in temperature since 1950when anthropogenicsulfur increased rapidly. Anthropogenic sulfur peaked around 1980.
The green line shows the atmospheric concentration of methanebased on Etheridge et al. [151] prior to 1993 and Dlugokencky et al.[152] [153] since 1993. The levels of methane shown are higher thanany values observed in the past 650,000 years [154] with currentvalues being 2.3 times larger than any value known prior to theindustrial era. Note that the methane peaks around the year 2000,which implies that the oxidizing capacity of the atmosphere hadbegun to recover by 2000. This is when the temperature peaked. Theatmospheric lifetime of methane has increased 25–30% during thepast 150 years to a current value of 7.9 years [155] implying graduallydecreasing oxidizing capacity. Lifetime is based on the availability ofOH and lifetime calculations do not consider continuing methane
centrations and global temperatures around 2000. The atmospheric concentration fortemperature smoothed with a 12-point, centered running average. The thick black lineopogenic sulfur releases [133,134]. The dashed purple line shows the likely range ofane measured [151,152]. The red line shows annual average carbon dioxide measured
3198 P.L. Ward / Thin Solid Films 517 (2009) 3188–3203
emissions. Thus the peaking of methane and temperature 20 yearsafter the peaking of anthropogenic sulfur is a reasonable delay.
The red line shows the atmospheric concentration of CO2 based onthe annual fitted average of Keeling et al. since 1959 [156] and 20 yearsmoothed data measured in ice layers of the Law Dome in Antarcticawith gas ages prior to 1959 [157]. Note that there is no change in therate of increase of CO2 since 1970 except for a small decrease and thenincrease after the Pinatubo eruption in 1991 caused by eruptioninduced global cooling [33]. There is no change in the rate of change ofCO2 concentration in the atmosphere that precedes or is contempora-neous with the flattening of the temperature profile since 2000. Thusit seems reasonable to accept the hypothesis that global warmingduring the 20th century was primarily initiated by a rapid increase inthe rate of anthropogenic emission of sulfur by man, that the SO2
reduced the oxidizing capacity of the atmosphere, leading to anincrease in methane, water, and other greenhouse gases.
This does not mean that CO2 did not have any role, but it does notappear to have had a lead role. Humans burning fossil fuels andmanufacturing cement are releasing 7.8 Gt of carbon into theatmosphere yearly [20]. If all this carbon were in the form of CO2, itwould be 28.6 Gt, or 122 to 681 times greater than the amount of CO2
emitted in the 1991 eruption of Pinatubo. Humans are putting two tothree orders of magnitude more CO2 into the atmosphere every yearthan one “large” volcanic eruption. There are many feedback loops inthe carbon cycle, but there is little doubt that since the beginning ofthe industrial era, humans burning fossil fuels and making cementhave been the primary cause for increasing the atmospheric mixingratio of CO2 globally from 285 ppm to 379 ppm [20]. CO2 is agreenhouse gas that is also causing global warming as emphasized bythe IPCC [12]. We need to incorporate the four cardinal rates of sulfurdioxide (Table 1) into atmospheric models before we can evaluate thenet effect of CO2.
The dashed purple lines in Fig. 11 show the upper and lower limitsof likely future sulfur dioxide emissions [158]. Increase in methanebeginning in early 2007 [159], suggests that sulfur values are alreadyincreasing. While the most developed countries have reduced andcontinue to reduce sulfur emissions, the problem is that the rest of theworld wants to improve their standards of living. China [160] andIndia, for example, are adding two new coal-fired power plantstypically each week [161]. Burning coal is a primary source of sulfurgas. Yet the use of coal is rapidly growing because more than 70countries have coal reserves and coal reserves are significantly largerthan all the other fossil fuel reserves worldwide [162]. The U.S. has thegreatest coal reserves of any country and thus judicious use of coal is akey to American energy independence.
The good news is that during the past three decades we havemadeconsiderable progress reducing SO2 emissions both technically andpolitically in order to reduce acid rain. Flue-gas desulfurizationtechnologies can remove up to 98% of the sulfur gases fromsmokestacks and in some cases produce commercial products withthe residue [163,164]. Improved combustion techniques such aspressurized fluidized bubbling-bed combustion can extract the energyfrom coal without releasing much sulfur [165]. The Clean Air ActAmendments of 1990 set legal limits for power plants that caused areduction of SO2 emissions in the U.S. by more than 50% as of January1, 2000. Agreements in Europe led to a nearly 70% decrease in land-based sulfur emissions between 1980 and 2000 [166]. Clearly we needa major program to improve and implement these technologiesworldwide as soon as possible [158]. We also need to improvetechnologies for reducing sulfur dioxide emissions from burning oiland natural gas. A significant source of sulfur emissions are ships thatburn oil with as much as 5% sulfur by weight [167] and are largelyunregulated. Reducing SO2 emissions will not only reduce globalwarming, but will also reduce acid rain, and make the world healthier.The sulfur pollution produced by burning coal in China contributes to400,000 premature deaths per year [168]. Significantly reducing
global emissions of sulfur dioxide is well within out technical andpolitical capabilities if we chose to give it top priority.
Thousands of papers have been written about very rapid changesof climate in the past, searching for their cause and expressing the fearthat such changes could happen at any time in the near future whenthe climate reaches some unknown tipping point. Recognizing thatthe past 24 times of very rapid global warming were all caused bysudden increases in volcanic activity, allows us to stop worrying abouttipping points and to begin worrying about what society should dowhen volcanoes become that active again in the future.
The emphasis in this paper has been on non-sea-salt sulfatemeasured in ice cores because this results from the largest volume ofchemically active gas emitted from volcanoes. Other anthropogenicgases that have similar important effects with respect to aerosolsinclude ammonium, nitrate, black carbon, and primary and secondaryorganics [169]. All will need to be addressed.
7. Extreme rate: Very frequent basaltic eruptions, mass extinctions
The largest known basaltic fissure eruption in the past 1000 yearsis Laki in southern Iceland, which produced 14.7 km3 of basalt in8 months beginning in June, 1783 [48]. The 10 eruption episodes werenot all that spectacular (VEI=4), with ash reaching altitudes of only13 km, but this 27-km-long fissure complex emitted 122 Mt of SO2,more than 5 times that of Pinatubo, as well as 235 Mt of H2O, 15 Mt ofchlorine, 7 Mt of fluorine, some hydrogen sulfide and some ammonia.Most of these gases were emitted into the troposphere but highenough to be caught in the jet stream headed for Europe. A dry fogcovered the North Atlantic, Europe, North Africa and Asia with thegreatest opacity between mid-June and mid-July.
It was a very cold and harsh summer in Iceland and Siberia, butvery dry and hot in western Europe, most likely from solar heating ofthe dry fog. Intense thunderstorms and hail were unusually frequent.The winter of 1783–1784 was one of the most severe on record forEurope and North America with large floods in Europe in the spring.Cold winters and crop failures in Europe lasted into 1788 helping tospawn the French Revolution in 1789 [170]. Most birch trees, shrubs,and moss were killed in Iceland. Grass withered to the roots.Throughout Europe, from England to Sweden to Italy, trees and plantswere damaged by acid rain and crops failed.
In Iceland, 50% of the cattle, 79% of the sheep, 76% of the horses and24% of the people (10,521) perished from pollution of the air, water,and forage by the volcanic gases or from the resulting famine [171]. InEngland there were approximately 20,000 deaths related to theeruption [172], and more than 16,000 in France [173]. Famine anddeath even resulted among the Alaskan Inuit [174]. When similarmortality studies are completed throughout Europe, life loss from theeruption of Laki is likely to rival the largest known historic volcanicloss of 60,000 people during the eruption of Tambora in Indonesia in1815 (VEI=7) [175]. In fact one million people died during the GreatTenmei Famine in Japan exacerbated by the eruption of Laki and thelocal small eruption of Asama [176].
Basaltic eruptions typically emit 10 to 100 times more volatiles percubic kilometer of magma than the “large” silicic eruptions discussedin earlier sections of this paper [177–179]. Given such majorenvironmental effects from erupting less than 15 km3 of basalt,what would be the effects of erupting more than 3,000,000 km3 ofbasalt in the Siberian Traps around 249.4 Ma, the equivalent of200,000 Laki eruptions? The Siberian Traps cover an area of2,500,000 km2, almost as large as Washington, Oregon, Californiaand Nevada combined.
Courtillot and Renne [180] summarize studies of the twelve largestfissure basalt eruptions known in the past 360 m.y. and known massextinctions and ocean anoxia events. They find a one-to-onecorrespondence between basaltic eruptions and extinctions withinthe precision of the dating for all the events (Fig. 3). The only exception
3199P.L. Ward / Thin Solid Films 517 (2009) 3188–3203
is the Ordovician–Silurian mass extinction (443.7 Ma), probably thesecond largest, occurring in two separate prolonged events. Floodbasalts of this age have not yet been recognized. Therefore there maybe another explanation for at least one major mass extinction.
Only onemass extinction, on the other hand, clearly coincides witha meteorite impact, the Cretaceous/Tertiary boundary (65.5 Ma). Mostpaleontologists conclude that mass extinctions are not instantaneous;they tend to occur over at least thousands of years. While a meteoritemay have complicated the extinction around 65.5 Ma, it is now clearthat radiation did not kill the dinosaurs [181] and that largepercentages of animals could have survived a large impact bysheltering [182]. Mass extinctions typically involve runaway green-house warming, major changes of acidity of air and water, dramaticincreases in light carbon isotopes, and anoxia over hundreds to tens ofthousands of years [183–188].
Given that massive increases in SO2 appear to have caused massextinctions in the past (Cardinal Rate IV, Table 1) and that there hasbeen a significant increase in SO2 gases since 1925 (Fig. 10), we shouldnot be too surprised to discover that we are currently in the midst of amajor mass extinction. In 2005, more than 1360 scientists under theauspices of the United Nations, completed the Millennium EcosystemAssessment [189,190]. This was followed by the Global BiodiversityOutlook 2 under the Convention on Biological Diversity, a legallybinding global treaty created in 1992 with nearly universal participa-tion of countries. Among their conclusions are [191]:
1. “15 out of 24 ecosystem services are in decline including the abilityto provide fresh water and the ability of the atmosphere to cleanseitself of pollutants.”
2. “Trends among 3000 wild populations of species show a consistentdecline in average species abundance of about 40% between 1970and 2000.”
3. “Between 12% and 52% of species within well-studied higher taxaare threatened with extinction.”
4. “The global demand for resources exceeds the biological capacity ofthe Earth to renew these resources by some 20%.”
5. “Humans are currently responsible for the sixth major extinctionevent in the history of the earth, and the greatest since thedinosaurs disappeared, 65 million years ago.”
8. Low rate: No volcanic eruptions, clean atmosphere, coolingand drought
The fourth type of abrupt climate change is very rapid cooling withwidespread drought that appears to happenwhen the rate of volcanicactivity decreases from a very high level to a very low level. Theclearest example is known as the 8.2 ka event (Figs. 5, 7) (Cardinal RateI, Table 1). At approximately 8175 years BP (Before Present) thetemperature in Greenland dropped at least 3.3 °C in less than 20 years[192]. After 60 cold years, the temperature recovered in approximately70 years. At the start of this event, methane in the ice core decreased15% in 40 years perhaps lagging temperature by approximately 7 years[192]. Snow accumulation rate dropped and debris from wind-blowndust and forest-fire smoke increased [193]. Cooling (typically 1 °C),drought, and increased wind were observed throughout NorthAmerica, Europe, Asia, and Africa [194,195]. This drought caused anend to the earliest known large farming settlement in theworld (5000people) founded around 9.3 ka at Çatalhöyük, Turkey [196]. The hugeLake Agassiz in Canada along thewestern edge of the ice sheet drainedcatastrophically into Hudson Bay at 8490 and 8290 years BP andmodels of this process can explainmany of the observations of climatechange [197–199]. But a surprising observation shown clearly inFigs. 5 and 7 is that the sulfate in the GRISP2 ice core had been veryhigh but dropped to nearly zero around 8.2 ka. Similar sudden drops insulfate are found throughout human history with the following dis-astrous consequences.
The largest drought in the past 5000 years occurred around 4.1 kathroughout all the continents of the northern hemisphere (Fig. 7).Widespread effects over 200 to 300 years included forest fires, dunereactivation, abrupt changes in forest composition, decreases in floodmagnitudes, significantly increased dust, desiccation of lakes in mid-latitudes and positive moisture anomalies at high latitudes in Eurasiaand North America [200–202]. This drought led to the collapse of theAkkadian Empire [203–206] and many early civilizations from Egyptto Greece. Empires collapse when they cannot feed their populous.Sulfate was particularly low at this time (Fig. 7).
Sulfate was similarly low around 5.8 ka. Mass graves with evidenceof subsequent feasting implying fighting over dwindling foodresources have been found in Turkey and Mesopotamia dating fromthis time [207]. Similarly the Kurgan pastoralists (Yamna Culture) fromthe steppes of Russia raided Europe most likely in search of foodduring sulfate lows at 6.2, 5.4, and 5 ka [208].
Every time the level of sulfate per century measured in thisGreenland ice core dipped close to zero (blue shaded areas in Fig. 7),severe drought and famine brought the demise of major civilizations.The Old Kingdom of Egypt ended with decades of drought and faminebetween 2200 and 2150 BC [209]. Egyptian power ultimately endedwith the eruption of Hekla in Iceland from 1159 to 1140 BC followed bydecades of drought and famine. The Minoan civilization, weakened bythe eruptions of Santorini from 1627 to 1600 BC, ultimately collapsedduring the sulfate low around 1450 BC [210]. The Kassites, a mountaintribe, were able to conquer Babylonia around 1595 BC because ofwidespread famine [211]. The Greek Dark Ages between 1100 and 750BC is also known as the Bronze Age of Collapse when Mycenaean andHittite civilizations collapsed. There were “fewer and smaller settle-ments suggesting famine and depopulation” [212]. The Roman Empirefell around 476 AD [213] during a sulfate low. The Fremont andAnasazi cultures of southwestern North America and the Mississip-pian Cahokian culture were severely stressed by droughts between990 and 1060 AD, 1135 and 1170 AD and 1276 and 1297 AD (Fig. 6)[214]. Plagues were also common during these major times of colderclimate and they show some relation to the cold years followingvolcanic eruptions [215–217].
The largest droughts are not worldwide. They show somerelationship to movement of the Intertropical Convergence Zone(ITCZ) affecting different cultures. The African Humid Period shown inFigs. 5 and 7 is a clear example. Therefore we should not be toosurprised to find that the Mayan civilization [218] and the TangDynasty [219] collapsed from droughts centered at approximately 810,860, and 910 AD. Similarly the Indus Valley civilization collapsed fromdroughts around 1700 BC [220] when there were high levels ofvolcanic sulfate and most likely northward shifts in the ITCZ.
Droughts are particularly common in the American southwest. ThePalmer Drought Severity Index as listed in the North AmericanDrought Atlas [221] is shown in Fig. 6 for southeastern Utah. Data fromwestern Colorado through eastern Nevada show similar results.Negative numbers imply drought. Note that periods of extendeddrought tend to be times with little or no volcanism (Cardinal Rate I,Table 1).
One gets the impression from Fig. 7 that humanity in populouscities tended to flourish when the temperature averaged the amountequivalent to a δ18O value of −7.68±2 (vertical purple line). This is truefrom the success of the Akkadian Empire and the Old Kingdom ofEgypt prior to 4.1 ka, to the Axial Age from 800 to 200 BC when nearlyall the religions of theworld were created andwhen Greek democracy,literacy, philosophy, and science flourished, to the Tang dynasty, thegolden age of poetry and sculpture (618–907 AD), to the ProtestantReformation (16th century), the Age of Reason, the Age of Enlight-enment, the roots of the Industrial Revolution, and the roots ofdemocracy through the American and French Revolutions. A similarrelationship is seen during the period from 38 to 36 ka in Fig. 9. Theunusually high volcanic activity and the associated warm period,
3200 P.L. Ward / Thin Solid Films 517 (2009) 3188–3203
coincides with the start of the Upper Paleolithic Revolution whenmodern humans spread rapidly into Eurasia and there was a suddenincrease in sophistication of stone-working technologies, art, music,elaborate burials, and such [222].
When volcanoes are no longer erupting large amounts of SO2, theoxidizing capacity of the atmosphere can increase, leading to moreeffective oxidation of methane, CO, and other pollutants. As theatmosphere becomes cleaner, ultraviolet rays penetrate closer to theearth, increasing production of OH and H2O2 in the troposphere andincreasing oxidation. In this way, the atmosphere “scrubs” itself fromthe top down, cooling the earth. Rainfall depends on coagulation ofpollutants around very small particles. With the decrease in volcanicactivity, there are less particles and less sulfuric acid, inhibiting rain.Small particles can become condensation nuclei in the presence ofions, which are atoms or groups of atoms bearing an electric charge[223,224]. Ions are produced by cosmic rays that are also able topenetrate a thinner atmosphere. The net result of cosmic rays on theseultrafine particles is to increase cloud cover, cloud reflectivity, andcloud lifetime and to suppress rainfall [113]. The effects are greatestwhen there are the largest concentrations of ultrafine particlesfollowing either the largest volcanic eruptions or series of volcaniceruptions or following significant, continuous pollution by man. Theeffects are also greatest at the more polar latitudes because cosmic rayintensity at the top of the atmosphere is only about 5% near thegeomagnetic equator, but 50% at the poles [113]. The effects are alsogreatest for low-altitude clouds and therefore for times when cosmicrays can penetrate most of the atmosphere.
There is an extensive literature reporting apparent correlationsbetween solar cycles or proxies for solar cycles with climate change,but satellites now show that the variation in solar output is only 0.1%on decadal time scales, which can only explain temperature changesof about 0.1 °C [225]. Two proxies commonly used to infer solar cyclesare 14C in tree rings and 10Be in ice cores [226,227]. Both of these lightisotopes are generated by cosmic rays and their production probablyincreases during atmospheric purging events when there are nostratospheric or tropospheric aerosols and cosmic rays can thereforepenetrate deep into the troposphere. 14C levels also increase whenmethane is oxidized [228], which should happen as SO2 levelsdecrease. These associations may give insight into why there aresudden changes in the slope of the curve relating 14C dates to calendardates.
Cooling the atmosphere encourages glaciers to grow, but droughtinhibits glacial growth.
9. Discussion
The international debate over climate change has been betweenthose who argue that periods of sudden warming have happenedwithout man many times in the geologic past and those who arguethat the prodigious amounts of gases emitted by man are causing thecurrent warming. I have shown in this paper that both groups havemerit and the mechanisms are similar. Sudden global warming hasoccurred dozens of times in the past 46,000 years and each of thosetimes is contemporaneous with a significantly higher rate of “large”volcanic eruptions essentially every year for dozens of years. The mostchemically active gas emitted by volcanoes in significant amounts isSO2. Changing concentrations of SO2 are observed to cause cooling,warming, acid rain, and drought. Measurements in Greenland showthat man is currently putting as much SO2 into the atmosphere every1.7 years as one “large” volcanic eruption, enough to cause globalwarming. The only “large” volcanic eruption in the past 96 years wasPinatubo. Therefore, man is clearly responsible for current globalwarming even though man had nothing to do with earlier periods ofglobal warming.
If too much SO2 causes global warming and mass extinctions andtoo little causes cooling and drought, there must be an ideal level in
between. Our first challenge is to reduce SO2 emissions significantly toreduce warming. The second challenge will be to allow just enoughSO2 emissions to prevent drought. The third challenge will be to stopall human SO2 emissions during volcanic eruptions and to discoverother ways to mitigate the effects of volcanoes putting too much SO2
into the atmosphere. Therefore geoengineering of a stable “ideal”climate might be scientifically feasible, although politically a night-mare. Current suggestions for geoengineering by injecting SO2
[229,230] into the lower stratosphere are likely to cause more harmthan good unless massive amounts of water are also injected.
SO2 has its largest effect by changing how the atmosphere reflects,refracts, scatters, absorbs, or transmits broadband radiant energy fromthe sun, infrared energy radiated outwards by the earth, and cosmicrays bombarding the earth from all directions. The result is differentialheating of the atmosphere and the earth's surface that then affectatmospheric and oceanic currents. Many different feedback loops areset into motion. In order to understand in detail the effects of the fourcardinal rates of SO2 on climate, we must adapt current climatemodels to be driven by changes in SO2. This should involve moredetailed studies of the effects of past volcanic eruptions. The resultsmay not always be intuitive.
For example, beginning 6 years after the Laki eruption in 1783,when the cooling of the stratospheric aerosol is likely to havedeclined, the South Asia Monsoon failed leading to majorprolonged droughts from 1790 through 1792 in southern India,southern Africa, Australia, Mexico and many Atlantic islands. InIndia more than 600,000 people died from the resulting famine[231]. A moderate El Niño current occurred in 1786, but anextraordinary El Niño formed in 1791. Many authors have suggestedthat volcanoes can affect El Niños [232–235]. The suggestion of an8-year delay seems preposterous. Yet there was an apparent 8-yeardelay for a very severe El Niño following the large 1883 eruption ofKrakatau, and a 9-year delay following the 1902 large eruption ofSanta Maria as well as smaller but significant eruptions of Peléeand Soufriere. Such delays suggest that the very large El Niño of1997–1998 might be the result of the large 1991 eruptions ofPinatubo and Cerro Hudson. Such correlations are complicated bythe large number of El Niños in history that vary significantly insize [149,150], but the largest volcanic eruptions do seem toprecede the largest El Niños by ~9 years. Delays of several yearsneed to be considered and may well be related to delays inchanging the huge heat capacity of the oceans with low heatcapacity atmospheric currents. There are other sources of multi-year delays. For example, modeling the effects of the 1991 eruptionof Pinatubo suggests that significant effects on atmospheric waterin the stratosphere peaked 3.5 years after the eruption and decayedslowly after that [236].
El Niño currents are caused by heating of the atmosphere andtherefore the ocean in the western Pacific. La Niña currents, on theother hand, are caused by cooling of the same region. La Niñas areclosely associated with drought in southwestern North America[201,237–240]. Significantly reducing sulfur emissions leads todrought and cooling as discussed above. Therefore some care mustbe taken in the rate of SO2 reduction. Note in Fig. 10 that there waslow volcanic activity in the 1920s and a decrease in anthropogenicsulfur release in the early 1930s related to the Great Depression inthe United States. It is conceivable that this decrease in SO2
emissions is related to the extreme drought of the 1932–1939 insouthwestern America. Similarly man's success in reducing sulfuremissions beginning around 1980 may have had an effect on thedroughts of 1998–2002.
We have much to learn about climate. There have been manysuggestions about what initiates climate change. The conceptpresented in this paper that changing concentrations of SO2 is theprimary initiator of climate change is new and should be evaluated indetail.
3201P.L. Ward / Thin Solid Films 517 (2009) 3188–3203
10. Conclusions
The concentration of SO2 in the atmosphere appears to initiateglobal climate change in four ways:
I. Very low concentrations allow the atmosphere to cleanse itselfby oxidizing most pollutants. This thins the atmosphericblanket, cooling the earth and causing drought.
II. Sporadic “large” volcanic eruptions cause cooling of the earthfor approximately three years by forming a sulfuric acid aerosolin the lower stratosphere. A sequence of such eruptions canincrement the world into an ice age.
III. When “large” volcanic eruptions occur in quick succession atthe rate of at least one each year for ten or more years, theoxidizing capacity of the atmosphere is severely impaired,greenhouse gases accumulate, causing global warming.
IV. Every 20 million years or so, the eruption of millions of cubickilometers of flood basalts overwhelms the oxidizing capacityof the atmosphere for tens of thousands of years or more,causing mass extinctions.
Humans burning fossil fuels are currently emitting as much SO2
every 1.7 years measured in Greenland as one “large” volcaniceruption. Such a high level of SO2 is causing not only global warmingbut widespread extinction of many species. Humans are also emitting2 to 3 orders of magnitude more CO2 than large volcanic eruptions,compounding global warming. Both CO2 and SO2 emissions must bereduced significantly to reverse global warming, but reducing SO2
should be the highest priority.Humans have developed many ways to reduce significantly the
amount of SO2 emitted; we need to implement them widely andaggressively. It might even be possible in the future to carefullymaintain a constant ideal level of SO2 by supplementing naturalreleases with controlled human releases.
Acknowledgement
This paper is dedicated to Bob Decker shown in Fig. 1, whoseinfectious enthusiasm enticed me into geophysics and volcanology,Chuck Drake, who argued strongly for the importance of volcanoes inmass extinctions when most scientists were overly enamored withmeteor impacts, and Jack Oliver, who inspired broad but highlydisciplined thinking. I wish to thank the thousands of contributors toWikipedia and the creators of Google and Google Scholar who havemade knowledge so much more accessible. This work would not havebeen possible without Carol Connors and her inter-library loan staff atthe Teton County Public Library. I wish to thank Steven Smith, NicoleVollweiler, and Greg Zielinski for providing their published data inelectronic form. IreneMellion and Jon Stuart assisted in improving Fig.1from an old scratched slide. I especially thankmywife, Adrienne, who isa constant source of interesting ideas and edits and Peter Molnar andZachHall for prompt, thorough, and provocative reviews. This paper hasbenefited greatly from thoughtful critical reviews by Clyde Anderson,Jim Barlow, John Good, Joe Greene, John Hebberger, Dick Hobbins, DaveMiller, Jack Oliver, Bert Raphael, Bert Raynes, Bob Tilling, Wally Ulrich,and E. O. Wilson.
Appendix A. Supplementary data
Supplementary data associated with this article can be found, inthe online version, at doi:10.1016/j.tsf.2009.01.005.
References
[1] F.K. Lutgens, E.J. Tarbuck, The Atmosphere: An Introduction to Meteorology,Prentice Hall, 2006.
[2] H. Le Treut, R. Somerville, U. Cubasch,Y. Ding, C.Mauritzen, A.Mokssit, T. Peterson,M.Prather, in: S. Solomon, D. Qin, M. Manning, Z. Chen, M. Marquis, K.B. Averyt, M.
Tignor, H.L. Miller (Eds.), Climate Change 2007: The Physical Science Basis.Contribution of Working Group I to the Fourth Assessment Report of theIntergovernmental Panel onClimateChange,CambridgeUniversity Press, 2007, p.93.
[3] data.giss.nasa.gov/gistemp/abs_temp.html.[4] M.E. Mann, P.D. Jones, Geophys. Res. Lett. 30/15 (2003) 1820.[5] C. Pfister, R. Brázdil, Clim. Change 43/1 (1999) 5.[6] B.M. Fagan, The Little Ice Age: How Climate Made History, 1300–1850, Basic
Group I to the Fourth Assessment Report of the Intergovernmental Panel onClimate Change, Cambridge University Press, Cambridge, United Kingdom andNew York, USA, 2007.
[13] L. Stott, A. Timmermann, R. Thunell, Science 318 (2007) 435.[14] H. Fischer, M. Wahlen, J. Smith, D. Mastroianni, B. Deck, Science 283 (1999) 1712.[15] E. Monnin, A. Indermuhle, A. Dallenbach, J. Fluckiger, B. Stauffer, T.F. Stocker, D.
Raynaud, J.-M. Barnola, Science 291 (2001) 112.[16] N. Caillon, J.P. Severinghaus, J. Jouzel, J.-M. Barnola, J. Kang, V.Y. Lipenkov, Science
299 (2003) 1728.[17] U. Siegenthaler, T.F. Stocker, E.Monnin,D. Lu¨thi, J. Schwander, B. Stauffer,D.Raynaud,
J.-M. Barnola, H. Fischer, V.r. Masson-Delmotte, J. Jouzel, Science 310 (2005) 1313.[18] T.M. Marchitto, S.J. Lehman, J.D. Ortiz, J. Flückiger, A.v. Geen, Science 316 (2007)
1456.[19] R.A. Berner, Am. J. Sci. 306 (2006) 295.[20] P. Forster, V. Ramaswamy, P. Artaxo, T. Berntsen, R. Betts, D.W. Fahey, J. Haywood, J.
Lean, D.C. Lowe, G.Myhre, J. Nganga, R. Prinn, G. Raga, M. Schulz, R.V. Dorland, in: S.Solomon, D. Qin,M.Manning, Z. Chen,M.Marquis, K.B. Averyt, M. Tignor, H.L. Miller(Eds.), Climate Change 2007: The Physical Science Basis. Contribution of WorkingGroup I to the Fourth Assessment Report of the Intergovernmental Panel on ClimateChange, Cambridge University Press, Cambridge, United Kingdom, 2007.
[21] Chlorine as HCL is removed by condensed supercooled water in the eruptioncolumn reducing HCL vapor concentrations by up to four orders of magnitude. A.Tabazadeh, R.P. Turco, Science 260 (1993) 1082.
[22] D.H. Ehhalt, Phys. Chem. Chem. Phys. 1/24 (1999) 5401.[23] A.M. Thompson, Science 256 (1992) 1157.[24] T. Simkin, L. Siebert, Volcanoes of the World: A Regional Directory, Gazetteer, and
ChronologyofVolcanismDuring the Last 10,000years,GeosciencePress, Tucson,1994.[25] T.M. Gerlach, H.R. Westrich, R.B. Symonds, in: C.G. Newhall, R.S. Punongbayan
(Eds.), Fire and Mud: Eruptions and Lahars of Mount Pinatubo, Philippines,Philippine Institute of Volcanology and Seismology and University of WashingtonPress, 1996, p. 415.
[26] K.E. Trenberth, L. Smith, J. Clim. 18/6 (2005) 864.[27] L. Oman, A. Robock, G.L. Stenchikov, T. Thordarson, D. Koch, D.T. Shindell, C. Gao,
J. Geophys. Res. 111/D (2006) 12209.[28] L.L. Stowe, R.M. Carey, P.P. Pellegrino, Geophys. Res. Lett. 19/2 (1992) 159.[29] F.P.J. Valero, P. Pilewskie, Geophys. Res. Lett. 19/2 (1992) 163.[30] J.K. Angell, J. Geophys. Res. 102/D8 (1997) 9479.[31] A. Robock, J. Mao, Geophys. Res. Lett. 19/24 (1992) 2405.[32] C.D. Keeling, T.P. Whorf, M. Wahlen, J.v.d. Plicht, Nature 375 (1995) 666.[33] G. Lambert, P. Monfray, B. Ardouin, G. Bonsang, A. Gaudry, V. Kazan, G. Polian,
Tellus B 47/1–2 (1995) 53.[34] L. Gu, D.D. Baldocchi, S.C. Wofs, J.W. Munger, J.J. Michalsky, S.P. Urbanski, T.A.
Boden, Science 299 (2003) 2035.[35] B.J. Soden, R.T. Wetherald, G.L. Stenchikov, A. Robock, Science 296 (2002) 727.[36] S. Bekki, Geophys. Res. Lett. 22/8 (1995) 913.[37] K.H. Rosenlof, Science 302 (2003) 1691.[38] J. Lelieveld, C. Brühl, P. Jöckel, B. Steil, P.J. Crutzen, H. Fischer, M.A. Giorgetta, P.
Hoor, M.G. Lawrence, R. Sausen, H. Tost, Atmos. Chem. Phys. 7/5 (2007) 1313.[39] For this reason, current proposals to cool the earth by injecting SO2 into the
stratosphere (R. Kunzig, Sci. Am. Nov. (2008) 46.) do not seem practical.[40] R.F. Griggs, The Valley of Ten Thousand Smokes, National Geographic Society,
1922.[41] P.M. Kelly, C.B. Sear, Nature 311 (1984) 740.[42] J.K. Angell, J. Korshover, J. Appl. Meteorol. 24/9 (1985) 937.[43] P. Handler, J. Volcanol. Geotherm. Res. 37 (1989) 233.[44] S.L. de Silva, G.A. Zielinski, Nature 393 (1998) 455.[45] A. Robock, Rev. Geophys. 38/2 (2000) 191.[46] R.B. Stothers, Clim. Change 45/2 (2000) 1573.[47] G.A. Zielinski, Sci. World J. 2 (2002) 869.[48] T. Thordarson, S. Self, J. Geophys. Res. 108/D1 (2003) 4011.[49] J. Fei, J. Zhou, Y. Hou, Clim. Change 81/3–4 (2007) 469.[50] S. Ramachandran, V. Ramaswamy, G.L. Stenchikov, A. Robock, J. Geophys. Res.105/
D19 (2000) 24409.[51] J. Hansen, M. Sato, L. Nazarenko, R. Ruedy, A. Lacis, D. Koch, I. Tegen, T. Hall, D.
Shindell, B. Santer, P. Stone, T. Novakov, L. Thomason, R. Wang, Y. Wang, D. Jacob,S. Hollandsworth, L. Bishop, J. Logan, A. Thompson, R. Stolarski, J. Lean, R. Willson,S. Levitus, J. Antonov, N. Rayner, D. Parker, J. Christy, J. Geophys. Res. 107/D18(2002) 4347.
[52] C.M. Ammann, G.A. Meehl, W.M. Washington, C.S. Zender, Geophys. Res. Lett. 30/12 (2003) 1657.
[53] G.A. Meehl, W.M. Washington, C.M. Ammann, J.M. Arblaster, T.M.L. Wigley, C.Tebaldi, J. Clim. 17/19 (2004) 3721.
3202 P.L. Ward / Thin Solid Films 517 (2009) 3188–3203
[54] D.T. Shindell, G.A. Schmidt, M.E. Mann, G. Faluvegi, J. Geophys. Res. 109 (2004)D05104.
[55] C. Timmreck, H.-F. Graf, Atmos. Chem. Phys. 6 (2006) 35.[56] J.A. Church, N.J. White, J.M. Arblaster, Nature 438 (2005) 74.[57] C.G. Newhall, S. Self, J. Geophys. Res. 87 (1982) 1231.[58] P.L. Ward, J. Geophys. Res. 96/B7 (1991) 12.[59] P.L.Ward, in: D.M.Miller, C. Busby (Eds.), Jurassic Magmatism and Tectonics of the
North American Cordillera, Geological Society of America Special Paper, vol. 299,1995, p. 1.
[60] F.W. McDowell, S.E. Clabaugh, Geol. Soc. Am. Spec. Pap. 180 (1979) 113.[61] H.K. Coxall, P.A. Wilson, H. Palike, C.H. Lear, J. Backman, Nature 433 (2005) 53.[62] A. Zanazzi, M.J. Kohn, B.J. MacFadden, D.O. Terry, Nature 445 (2007) 639.[63] G. Dupont-Nivet, W. Krijgsman, C.G. Langereis, H.A. Abels, S. Dai, X. Fang, Nature
445 (2007) 635.[64] R.A. Kerr, Science 257 (1992) 1622.[65] D.R. Prothero, R.J. Emry, The Terrestrial Eocene–Oligocene Transition in North
America, Cambridge University Press, 1996.[66] J.C. Zachos, J.R. Breza, S.W. Wise, Geology 20 (1992) 569.[67] B.P. Flower, in: P. Barrett, G. Orombelli (Eds.), Proceedings of the Workshop:
Geological Records of Global and Planetary Changes, Siena, 1998., vol. 3, TerraAntarctica Report, 1999, p. 27.
[68] J.S. Eldrett, I.C. Harding, P.A. Wilson, E. Butler, A.P. Roberts, Nature 446 (2007) 176.[69] K.Moran, J. Backman, H. Brinkhuis, S.C. Clemens, T. Cronin, G.R. Dickens, F. Eynaud,
J. Gattacceca, M. Jakobsson, R.W. Jordan, M. Kaminski, J. King, N. Koc, A. Krylov, N.Martinez, J. Matthiessen, D. McInroy, T.C. Moore, J. Onodera, M. O'Regan, H. Palike,B. Rea, D. Rio, T. Sakamoto, D.C. Smith, R. Stein, K.S. John, I. Suto, N. Suzuki, K.Takahashi, M. Watanabe, M. Yamamoto, J. Farrell, M. Frank, P. Kubik, W. Jokat, Y.Kristoffersen, Nature 441 (2006) 601.
[70] J. Veizer, D. Alab, K. Azmy, P. Bruckschen, D. Buhl, F. Bruhna, G.A.F. Cardena, A.Dienera, S. Ebneth, Y. Godderis, T. Jasper, C. Korte, F. Pawellek, O.G. Podlaha, H.Strauss, Chem. Geol. 161 (1999) 59.
[71] D.W. Lea, D.K. Pak, H.J. Spero, Science 289 (2000) 1719.[72] J.-P. Cogne, E. Humler, Geochem. Geophys. Geosyst. 7/3 (2006) Q03011.[73] N.J. Shackleton, J. Backman, H. Zimmerman, D.V. Kent, M.A. Hall, D.G. Roberts, D.
Schnitker, J.G. Baldauf, A. Desprairies, R. Homrighausen, P. Huddlestun, J.B. Keene,A.J. Kaltenback, K.A.O. Krumsiek, A.C. Morton, J.W. Murray, J. Westberg-Smith,Nature 307 (1984) 607.
[74] A.K. Behrensmeyer, Science 311/5760 (2006) 476.[75] J.G. Wynn, Am. J. Phys. Anthropol. 123/2 (2004) 106.[76] L.M. Prueher, D.K. Rea, Geology 26/11 (1998) 1027.[77] L.M. Prueher, D.K. Rea, J. Volcanol. Geotherm. Res. 106/1–2 (2001) 67.[78] F. Gradstein, J. Ogg, A. Smith, A Geologic Time Scale 2004, Cambridge University
Press, Cambridge, 2006.[79] J.C. Crowell, Geol. Soc. Am. Spec. Pap. 192 (1999) 1.[80] L.A. Frakes, J.E. Francis, J.I. Syktus, Climate Modes of the Phanerozoic: The History
of the Earth's Climate Over the Past 600 Million Years, Cambridge UniversityPress, Cambridge, New York, 2005.
[81] B. Haq, J. Hardenbol, P. Vail, Science 235 (1987) 1156.[82] B.U. Haq, J. Hardenbol, P.R. Vail, in: C.K. Wilgus, B.J. Hastings, H. Posamentier, J.C.v.
Wagoner, C.A. Ross, C.G. St. C. Kendall (Eds.), Sea-level Changes: An IntegratedApproach, Society of Economic Paleontologists and Mineralogists SpecialPublication, vol. 42, 1988, p. 71.
[83] B.U. Haq, S.R. Schutter, Science 322 (2008) 64.[84] C.A. Ross, J.R.P. Ross, Cushman Found. Foraminifer. Res. Spec. Publ. 24 (1987) 137.[85] Data averaged per million year from hydro.geosc.psu.edu/Sed_html/exxon.sea.[86] K.G. Miller, M.A. Kominz, J.V. Browning, J.D. Wright, G.S. Mountain, M.E. Katz, P.J.
Sugarman, B.S. Cramer, N. Christie-Blick, S.F. Pekar, Science 310 (2005) 1293(suggest that the maximum long-term height of sea-level may be less than halfthat shown, but this does not affect the conclusions in this paper relative to short-term sea-level changes).
[87] L.E. Lisiecki, M.E. Raymo, Paleoceanography 20/1 (2005) PA1003.[88] J.D. Hays, J. Imbrie, N.J. Shackleton, Science 194 (1976) 1121.[89] J. Laskar, P. Robutel, F. Joutel, M. Gastineau, A.C.M. Correia, B. Levrard, Astron.
Astrophys. 428/1 (2004) 261.[90] www.imcce.fr/Equipes/ASD/insola/earth/earth.html.[91] J.W.C. White, L.K. Barlow, D. Fisher, P.M. Grootes, J. Jouzel, S.J. Johnsen, M. Stuiver,
[92] C. Huber, M. Leuenberger, R. Spahni, J. Flückiger, J. Schwander, T.F. Stocker, S.Johnsen, A. Landais, J. Jouzel, Earth Planet. Sci. Lett. 243/3–4 (2006) 504.
[93] C. Lang, M. Leuenberger, J. Schwander, S. Johnsen, Science 286 (1999) 934.[94] A.M. Sarna-Wojcicki, M.S. Pringle, J. Wijbrans, J. Geophys. Res. 105/B9 (2000) 21.[95] M.A. Lanphere, D.E. Champion, R.L. Christiansen, G.A. Izett, J.D. Obradovich, Geol.
Soc. Amer. Bull. 114/5 (2002) 559.[96] G.A. Zielinski, P.A. Mayewski, L.D. Meeker, S. Whitlow, M. Twickler, Quat. Res. 45
[108] B. Alexander, R.J. Park, D.J. Jacob, Q.B. Li, R.M. Yantosca, J. Savarino, C.C.W. Lee, M.H. Thiemens, J. Geophys. Res. 110 (2005) D10307.
[109] F. Keppler, J.T.G. Hamilton, M. Braß, T. Rockmann, Nature 439 (2006) 187.[110] D.J. Lary, M. Balluch, S. Bekki, Q. J. R. Meteorol. Soc. 120/520 (1994) 1683.[111] W. Zhong, J.D. Haigh, R. Toumi, S. Bekki, Quat. J. Roy. Meterol. Soc. 122/534 (1996)
data/paleo/icecore/greenland/summit/gisp2/gases/gispch4.txt).[117] R. Kuper, S. Kropelin, Science 313 (2006) 803.[118] The ITCZ or monsoon trough is a belt of low pressure surrounding the earth near
the equator formed by ascending moist warm air.[119] S. Bjorck, M. Rundgren, O. Ingolfsson, S. Funder, J. Quat. Sci. 12/6 (1997) 455.[120] N. Vollweiler, D. Scholz, C. Muhlinghaus, A. Mangini, a.C. Spotl, Geophys. Res. Lett.
33 (2006) L20703.[121] L.G. Thompson, E. Mosley-Thompson, H. Brecher, M.E. Davis, B. Leon, D. Les, T.A.
Mashiotta, P.-N. Lin, K. Mountain, PNAS 103/28 (2006) 10536.[122] M. Bender, T. Sowers, E. Brook, PNAS (1997) 8343.[123] J.P. Severinghaus, M.O. Battle, Earth Planet. Sci. Lett. 244 (2006) 474.[124] D.A. Meese, T. Sowers, ftp.ncdc.noaa.gov/pub/data/paleo/icecore/greenland/
summit/gisp2/depthage/gisp2age.txt (1994).[125] J.P. Steffensen, K.K. Andersen, M. Bigler, H.B. Clausen, D. Dahl-Jensen, H. Fischer, K.
Goto-Azuma, M. Hansson, S.J. Johnsen, J. Jouzel, V. Masson-Delmotte, T. Popp, S.O.Rasmussen, R. Rothlisberger, U. Ruth, B. Stauffer, M.-L. Siggaard-Andersen, A.E.Sveinbjörnsdóttir, A. Svensson, J.W.C. White7, Science 321 (2008) 680.
[126] W. Dansgaard, S.J. Johnsen, J. Møller, C.C. Langway Jr., Science 166 (1969) 377.[127] J.P. Severinghaus, E.J. Brook, Science 286 (1999) 930.[128] A. Landais, V. Masson-Delmotte, J. Jouzel, D. Raynaud, S. Johnsen, C. Huber, M.
Leuenberger, J. Schwander, B. Minster, Clim. Dyn. 26/2–3 (2006) 273.[129] M.F.S. Goñia, A. Landais, W.J. Fletcher, F. Naughton, S. Desprat, J. Duprat, Quat. Sci.
Rev. 27/11–12 (2008) 1136.[130] S.R. Hemming, Rev. Geophys. 42 (2004) RG1005.[131] HadCRUT3, www.cru.uea.ac.uk/cru/data/temperature/ (2008).[132] P. Brohan, J.J. Kennedy, I. Harris, S.F.B. Tett, P.D. Jones, J. Geophys. Res. 111/D12
(2006) D12106.[133] S.J. Smith, H. Pitcher, T.M.L. Wigley, Glob. Planet. Change 29 (2001) 99.[134] S.J. Smith, E. Conception, R. Andres, J. Lurz, Pacific Northwest National Laboratory
Report PNNL-14537, 2004, p. 1.[135] H. Fischer, D. Wagenbach, J. Kipfstuhl, J. Geophys. Res. 103/D17 (1998) 21927.[136] H. Fischer, D. Wagenbach, J. Kipfstuhl, J. Geophys. Res. 103/D17 (1998) 21935.[137] J.R. McConnell, S. Kipfstuhl, H. Fischer, Pages 14/1 (2006) 13.[138] M. Schwikowski, A. Doscher, H.W. Gaggeler, U. Schotterer, Tellus B 51/5 (1999)
938.[139] T.F. Berglen, G. Myhre, I.S.A. Isaksen, V. Vestreng, S.J. Smith, Tellus 59 (2007) 773.[140] H. Fagerli, M. Legrand, S. Preunkert, V. Vestreng, D. Simpson, M. Cerqueira,
J. Geophys. Res. 112 (2007) D23S13.[141] V. Vestreng, G.Myhre, H. Fagerli, S. Reis, L. Tarrason, Atmos. Chem. Phys. Discuss. 7
(2007) 3663.[142] K. Duan, L.G. Thompson, T. Yao, M.E. Davis, E. Mosley-Thompson, Geophys. Res.
Lett. 34 (2007) L01810.[143] Q. Dahe, H. Shugui, Z. Dongq, R. Jiawen, K. Shichang, P.A. Mayewski, C.P. Wake,
Ann. Glaciol. 35 (2002) 278.[144] S. Olivier, C. Blaser, S. Brutsch, N. Frolova, H.W. Gaggeler, K.A. Henderson, A.S.
Palmer, T. Papina, M. Schwikowski, J. Geophys. Res 111 (2006) D05309.[145] J. Moore, T. Kekonen, A. Grinsted, E. Isaksson, J. Geophys. Res 111 (2006) D15307.[146] K. Weiler, H. Fischer, D. Fritzsche, U. Ruth, F. Wilhelms, H. Miller, J. Glaciol. 51/172
(2005) 64.[147] K. Yalcin, C.P. Wake, K.J. Kreutz, M.S. Germani, S.I. Whitlow, J. Geophys. Res 112
[153] 42.3 was subtracted from the recent data so that the two data sets had the samevalue in 1993.
[154] R. Spahni, J. Chappellaz, T.F. Stocker, L. Loulergue, G. Hausammann, K. Kawamura,J. Flückiger, J. Schwander, D. Raynaud, V. Masson-Delmotte, J. Jouzel, Science 310(2005) 1317.
[155] J. Lelieveld, P.J. Crutzen, F.J. Dentener, Tellus B 50/2 (1998) 128.[156] C.D. Keeling, T.P. Whorf, cdiac.esd.ornl.gov/trends/co2/sio-keel-flask/sio-keel-
Morgan, http://cdiac.ornl.gov/ftp/trends/co2/lawdome.combined.dat (1998).[158] S.J. Smith, H. Pitcher, T.M.L. Wigley, Clim. Change 73/3 (2005) 267.[159] M. Rigby, R.G. Prinn, P.J. Fraser, P.G. Simmonds, R.L. Langenfelds, J. Huang, D.M.
Cunnold, L.P. Steele, P.B. Krummel, R.F. Weiss, S. O'Doherty, P.K. Salameh, H.J.Wang, C.M. Harth, J. Muhle, L.W. Porter, Geophys. Res. Lett. 35 (2008) L22805.
[160] D. Guan, K. Hubacek, C.L. Weber, G.P. Peters, D.M. Reiner, Glob. Environ. Change18/4 (2008) 626.
[161] www.csmonitor.com/2007/0322/p01s04-wogi.htm.[162] World Energy Council, Survey of Energy Resources, World Energy Council, 2007
www.worldenergy.org/documents/ser2007_final_online_version_1.pdf, 2007.[163] P.S. Nolan, Presented by Michael X. Jiang at the Coal-Tech 2000 International
Conference, November, 2000, Jakarta, Indonesia, The Babcock &Wilcox Company,U.S., 2000, p. 1.
[164] en.wikipedia.org/wiki/Flue_gas_desulfurization.[165] National Productivity Council of India, Chapter 6 in Energy Efficiency in Thermal
Utilities, 2004, p. 142.[166] G. Lövblad, L. Tarrasón, K. Tørseth, S. Dutchak, www.emep.int/index_assessment.
html (2004).[167] G. Dominguez, T. Jackson, L. Brothers, B. Barnett, B. Nguyen, M.H. Thiemens, PNAS
105/35 (2008) 12769.[168] www.nytimes.com/2006/06/11/business/worldbusiness/11chinacoal.html.[169] K. Tsigaridis, M. Krol, F.J. Dentener, Y. Balkanski, J. Lathiere, S. Metzger, D.A.
Hauglustaine, M. Kanakidou, Atmos. Chem. Phys. 6 (2006) 5143.[170] en.wikipedia.org/wiki/Laki.[171] S. Thorarinsson, Bull. Volcanol. 33/3 (1969) 910.[172] C.S. Witham, C. Oppenheimer, Bull. Volcanol. 67/1 (2004) 1432.[173] J. Grattan, R. Rabartin, S. Self, T. Thordarson, C. R. Geosci. 337/7 (2005) 641.[174] G.C. Jacoby, K.W. Workman, R.D. D'Arrigo, Quat. Sci. Rev. 18/12 (1999) 1365.[175] J.-C. Tanguy, C. Ribière, A. Scarth, W.S. Tjetjep, Bull. Volcanol. 60/2 (1998) 137.[176] D.V. Botsman, Punishment and Power in the Making of Modern Japan, Princeton
University Press, 2007.[177] J. Palais, H. Sigurdsson, Amer. Geophys. Un. Monograph 52 (1989) 31.[178] C. Freda, D.R. Baker, P. Scarlato, Geochim. Cosmochim. Acta 69/21 (2005) 5061.[179] S. Self, S. Blake, K. Sharma, M. Widdowson, S. Sephton, Science 319 (2008) 1654.[180] V.E. Courtillot, P.R. Renne, C. R. Geosci. 335/1 (2003) 113.[181] L.C. Natarajan, A.L. Melott, B.M. Rothschild, L.D. Martin, Cornell University arXiv.
org (2007) arxiv.org/abs/0704.1912v4.[182] D.S. Robertson, M.C. McKenna, O.B. Toon, S. Hope, J.A. Lillegraven, Bull. Geol. Soc.
Wright, Holocene 15 (2005) 321.[201] M. Hoerling, A. Kumar, Science 299 (2003) 691.[202] W. Wenxiang, L. Tungsheng, Quat. Int. 117/1 (2004) 153.
[203] H. Weiss, M.-A. Courty, W. Wetterstrom, F. Guichard, L. Senior, R. Meadow, A.Curnow, Science 261 (1993) 995.
[204] H.N. Dalfes, G. Kukla, H. Weis, Third Millenium B.C. Climate Change and OldWorld Collapse, Springer-Verlag, 1997.
[205] H.M. Cullen, P.B. deMenocal, S. Hemming, G. Hemming, F.H. Brown, T. Guilderson,F. Sirocko, Geology 28/4 (2000) 379.
[206] M. Staubwasser, F. Sirocko, P.M. Grootes, M. Segl, Geophys. Res. Lett. 30/8 (2003)1425.
[207] A. Lawler, Science 317 (2007) 1164.[208] M. Gimbutas, J. Campbell, The Language of the Goddess, Thames & Hudson, 2001.[209] en.wikipedia.org/wiki/History_of_Egypt.[210] en.wikipedia.org/wiki/Minoan_civilization.[211] en.wikipedia.org/wiki/Babylonia.[212] en.wikipedia.org/wiki/Greek_dark_ages.[213] en.wikipedia.org/wiki/Roman_Empire.[214] L.V. Benson, M.S. Berry, E.A. Jolie, J.D. Spangler, D.W. Stahle, E.M. Hattori, Quat. Sci.
Science 299 (2003) 1731.[219] G. Yancheva, N.R. Nowaczyk, J. Mingram, P. Dulski, G. Schettler, J.F.W. Negendank,
J. Liu, D.M. Sigman, L.C. Peterson, G.H. Haug, Nature 445/4 (2007) 74.[220] en.wikipedia.org/wiki/Indus_valley_civilisation.[221] iridl.ldeo.columbia.edu/SOURCES/.LDEO/.TRL/.NADA2004/.pdsi-atlas.html.[222] O. Bar-Yosef, Annu. Rev. Anthropol. 31 (2002) 363.[223] F. Raes, A. Janssens, R.V. Dingenen, J. Aerosol Sci. 17 (1986) 466.[224] F. Yu, R.P. Turco, J. Geophys. Res. 106/D5 (2001) 4797.[225] C. Fröhlich, J. Lean, Geophys. Res. Lett. 25 (1998) 4377.[226] E. Bard, G. Raisbeck, F. Yiou, J. Jouzel, Tellus B 52/3 (2000) 985.[227] I.G. Usoskin, M. Schussler, S.K. Solanki, K. Mursula, J. Geophys. Res. 110 (2005).
doi:10.1029/2004JA010946.[228] R.M. Kalin, J.L. Jirikowic, Holocene 6/1 (1996) 111.[229] K.E. Trenberth, A. Dai, Geophys. Res. Lett. 34/15 (2007). doi:10.1029/2007GL030524.[230] R. Kunzig, Sci. Am. Nov. (2008) 46.[231] R.H. Grove, Nature 393 (1998) 318.[232] M. Hirono, J. Geophys. Res. 93/D5 (1988) 5365.[233] J.B. Adams, M.E. Mann, C.M. Ammann, Nature 426 (2003) 274.[234] M.E. Mann, M.A. Cane, S.E. Zebiak, A. Clement, J. Clim. 18/3 (2005) 447.[235] J. Emile-Geay, R. Seager, M.A. Cane, E.R. Cook, G.H. Haug, J. Clim. 21/13 (2008)
3134.[236] D.B. Considine, J.E. Rosenfield, E.L. Fleming, J. Geophys. Res 106/D21 (2001) 27711.[237] C. Herweijer, R. Seager, E.R. Cook, J. Emile-Geay, J. Clim. 20/7 (2007) 1353.[238] E.R. Cook, R. Seager, M.A. Cane, D.W. Stahle, Earth Sci. Rev. 81 (2007) 93.[239] J.E. Cole, J.T. Overpeck, E.R. Cook, Geophys. Res. Lett. 29/13 (2002) 1647.[240] K.M. Menking, R.Y. Anderson, Geology 31/11 (2003) 937.[241] iridl.ldeo.columbia.edu/SOURCES/.LDEO/.TRL/.NADA2004/.pdsi-atlas.html.
Peter L. Ward was educated at Noble & Greenough School(1961), Dartmouth College (BA in Geophysics, 1965) andColumbia University (Ph.D. in Seismology, 1970). He beganworking on active volcanoes in 1963 in Alaska. His Ph. D.thesis was on a new interpretation of the geology of Icelandbased on studies of small earthquakes and on the relation-
ship of these earthquakes to volcanoes and geothermalpower sources. He worked 27 years with the United StatesGeological Survey on volcanoes, earthquakes, and platetectonics. In the early 1970s he developed a prototype globalvolcano surveillance system using the ERTS satellite tocollect data from ground instruments on volcanoes through-
out the western U.S., Central America, and Iceland. In 1975, he became chief of theBranch of Seismology, a group of 140 scientists and staff. He helped sell to Congress,develop and guide the new U. S. National Earthquake Hazards Reduction Program in1977–1978. In 1990, he wrote and produced a 24-page magazine about living safelywith earthquakes. Editions in English, Spanish, Chinese and Braille were distributedprimarily in 41 Sunday-morning newspapers throughout Northern California to3.3 million people, winning him two national awards. His major publications in the1990s explored the relationship between volcanoes and other geologic features ofwestern North America with the motion of plates in the northeastern Pacific Ocean.This led to significant new ideas about the origins and nature of volcanoes, granites,silicic volcanic provinces, flood basalts, and volcanic hot spots. He currently lives inJackson, Wyoming, continuing his research on the effects of volcanoes on man. Seewww.tetontectonics.org. (Photo by Irene Mellion).