40
Sulfur Emission Trading and Regulation in Europe Klaassen, G. IIASA Working Paper WP-93-069 November 1993

Sulfur Emission Trading and Regulation in Europe
Klaassen, G.
IIASA Working Paper
WP-93-069
November 1993

Klaassen G (1993). Sulfur Emission Trading and Regulation in Europe. IIASA Working Paper. IIASA, Laxenburg, Austria: WP93069 Copyright © 1993 by the author(s). http://pure.iiasa.ac.at/id/eprint/3745/
Working Papers on work of the International Institute for Applied Systems Analysis receive only limited review. Views or
opinions expressed herein do not necessarily represent those of the Institute, its National Member Organizations, or other organizations supporting the work. All rights reserved. Permission to make digital or hard copies of all or part of this work
for personal or classroom use is granted without fee provided that copies are not made or distributed for profit or commercial advantage. All copies must bear this notice and the full citation on the first page. For other purposes, to republish, to post on servers or to redistribute to lists, permission must be sought by contacting [email protected]

Working Paper
Ger Klaassen
Sulfur Emission Trading and Regulation in Europe
WP-93-69 November 1993
B IlASA International Institute for Applied Systems Analysis A-2361 Laxcnburg A u s h
Tclephonc: +43 2236 715210 Tclcx: 079137 iiasa a U Tclcfax: +43 2236 71313

Sulfur Emission Trading and Regulation in Europe
Ger KZaassen
WP-93-69
November 1993
Working Papers are interim reports on work of the International Institute for Applied Systems Analysis and have received only limited review. Views or opinions expressed herein do not necessarily represent those of the Institute or of its National Member Organizations.
IEIIIASA International Institute for Applied Systems Analysis 14-2361 Laxenburg D Austria
Telephone: +43 2236 715210 Telex: 079 137 iiasa r o Telefax: +43 2236 71313

Preface
Initiatives to reduce emissions of acidifying air pollutants, such as the new 'sulfur protocol' presently discussed under the Convention on Long-range Transboundary Air Pollution, are important steps to reduce acid deposition in Europe. It is always useful, however, to examine whether there might not be more cost-effective means of achieving environmental protection. Or stated conversely, if the same amount of money could not be spent differently to achieve more environmental protection.
This paper explores the use of relative simple emission trading schemes, such as the ones currently applied for sulfur in the USA under the 1990 Clean Air Act Amendments, as complements to existing and proposed regulations to control sulfur emission in Europe. Making use of IIASA's Regional Acidification INformation and Simulation (RAINS) model, the paper explores the costs, environmental impacts as well as the distributional consequences of emission trading.
Abstract
How to implement emission trading is only one question in the current negotiations on a new sulfur protocol in Europe. Whereas the current protocol stipulates a 30 per cent uniform reduction, national emission ceilings included in the proposed new protocol imply differentiated reductions. In addition, emission and fuel standards are proposed. This paper examines the costs and environmental impacts of emission trading. A new element is that emission trading is combined with regulations. Calculations, using the RAINS (Regional Acidification INformation and Simulation) model, suggest that overlaying emission trading on regulations does reduce the cost savings but has beneficial impacts as well: ecosystem protection is not changed and significant decreases in environmental benefits for countries are largely avoided. Emission trading can also be used to decrease emissions and increase ecosystem protection. If combined with existing legislation, this minimizes losses in expected environmental benefits for some countries since most countries gain. The initial distribution of emission ceilings, however, has to be used to avoid that some countries are confronted with higher costs. Trade-offs thus appear to exist between using emission trading to achieve cost savings on the one hand and ecosystem protection and distributional equity on the other hand.
Key words: emission trading, sulfur, acid rain, costs, Europe

In the ongoing negotiations on a new sulfur protocol in Europe the possibility of joint
implementation of agreed emission ceilings is addressed. Whereas the current protocol
stipulates a 30 per cent uniform reduction, national emission ceilings included in the proposed
new protocol imply differentiated reductions. In addition, emission and fuel standards are . proposed. On top of this an emission trading system is point of discussion as well. The major
question appears how to design emission trading so as to avoid negative environmental effects
for third parties. In theory, a system of deposition permits (Montgomery, 1972) or pollution
offset trading would be ideal (Krupnick et al., 1983). Model simulations generally confirm
this (Tietenberg, 1985). In practice, however, these systems either have not been applied or
excessive transaction costs have limited the number of external trades (Hahn and Hester,
1989). Moreover, in practice emission trading has always been applied in combination with
existing regulations, especially emission standards (Hahn and Hester, 1989). This is also true
for the most radical approach to emission trading taken so far: allowance trading for sulfur
emissions in the USA (Kete, 1992). The US system simply allows trading in one zone. It is
based on the assumption that, given the size of the emission reduction and the expected
distribution of marginal control costs of power plants in different US states, emission
reductions would take place where they are necessary to protect the environment anyway.
The aim of this paper is to examine the costs and environmental impacts of emission
trading in Europe, similar to that of the USA. This implies trading in one zone in
combination with existing emission and fuel standards in Europe and alternatively also
combined with the standards proposed in the new sulfur protocol.
In the remainder, Section 2 describes existing regulations in Europe and Section 3 the
draft sulfur protocol. In Section 4 the method and data to simulate emission trading are
clarified. Section 5 gives the simulation results and Section 6 draws the major conclusions.
his is a slightly revised version of a paper prepared for the conference "Economic Instruments for Air Pollution Control", October 18-20, 1993, IIASA, Laxenburg.

2 Existing Regulations
2.1 The European Community
The European Community's policy to control air pollution takes two forms. First,
'environment action programs' formulate the broad, mid term strategic framework. Secondly,
specific ineasures are adopted as legislation. In the field of air pollution these have usually
taken the form of Directives (Bemett, 1991). A Directive being an item of EC legislation,
proposed by the European Commission and adopted by the Council of Ministers. It places
binding obligations on the member states (Haigh, 1989).
The legislation regarding the control of air pollution falls into the following categories
(Bemet, 1991):
1. air quality standards,
2. product standards for fuels
3. product or emission standards for motor vehicles
4. emissions from industrial plants
5. information and monitoring
6. atmospheric change (greenhouse gases and ozone layer).
This section will be confined to product standards for fuels and emissions from
industrial plants in as far as they affect sulfur dioxide emissions in Europe. Two types of
regulations influence sulfur dioxide emissions substantially: directives regulating the sulfur
content in fuels and directives on industrial, in particular large combustion, plants.
The fuel directives regulating the sulfur content of gas oil originate in large part from
the concern to prevent barriers in trade caused by different national standards. It was not
before the 1980s that environmental considerations came to play a more dominant role
(Bennet, 1991). In 1975 a directive was adopted to arrive at reductions in sulfur dioxide
emissions caused by gas oil fuels (Johnson and Corcelle, 1989, p.122). Gas oil includes
heating oil for domestic, commercial or industrial use as well as diesel fuel (for motor
vehicles). The directive stipulates that only two types of gas oil would be allowed in the
internal market of the EC: type A low sulfur gas oil (sulfur content below 0.3 per cent as
of 1980) and type B with a higher sulfur content to be used in specific zones only. In 1987
a directive was accepted to further reduce the sulfur content in gas oil (Johnson and Corcelle,

1989, p. 122). To avoid important specific air quality problems especially in urban centers,
the limit value was further reduced to 0.3 per cent sulfur everywhere in each member state.
Furthermore, member states were allowed to enforce the use of gas oils with a sulfur content
below 0.3 per cent but not below 0.2 per cent. On 23 March 1993 the EC accepted a
Directive (93112lEEC) to further limit the sulfur content in gas oil to 0.2 per cent and if used
as diesel oil in vehicles of not more than 0.05 per cent (Dumas, 1993). Background was the
wish to further standardize the sulfur content in gas oils, to improve air quality and to
improve fuel quality in order to enable further reduction (by means of a catalyst) in exhaust
gas emissions from diesel engines. The 0.2 per cent standard has to be met in 1994 and the
0.05 per cent standard in 1996. Greece is granted a derogation. It has to meet the standards
ultimately on 3 1 December 1999.
The directive of 1984 on the combatting of air pollution from industrial plants is a
framework directive in the sense that it foresees that specific emission standards are set in
subsequent directives (Be~e t t , 1991). The directive requires that new, or significantly
modified, industrial plants are given prior authorization before starting operation. Before
issuing authorization the following conditions have to be met:
1. the best available technology not entailing excessive costs (BATNEEC) has to be
applied to prevent air pollution;
2. emissions must not cause significant air pollution;
3. emission limit values have to be met and air quality limit values must be taken into
account.
The plants covered by the directive are to be found in the following sectors: energy, metal
production and processing, non-metallic mineral production, chemicals, waste disposal and
paper pulp manufacturing. Eight substances are seen as the most polluting among which
sulfur dioxide, nitrogen oxides, asbestos and fluorine. The Council of Ministers is
empowered to fix emission limit values on the basis of BATNEEC.
In 1983, the Commission presented a directive proposal on the limitation of emissions
of pollutants into the air from large combustion plants (Johnson and Corcelle, 1989).
Concern for air pollution and significant forest damage observed in Northern Europe
triggered the proposal. The proposal accounted for the different laws already existing
(Germany) or about to be accepted (the Netherlands), the associated costs as well as the
desire to harmonize national provisions in this area. Initial drafts were modeled on German
legislation and included only technology based emission standards, reflecting the German
approach to pollution control under the name "VorsorgeprinzipW or the principle of
prevation. This implies the use of the best technology to prevent pollution (Haigh, 1989).
Acceptance of the directive implied that, for the first time, the EC fixed common emission
standards. When finally adopted in November 1988 (OJ, 1988), the Directive on the
limitation of pollutants in the air from large combustion plants, however, consisted of two
main elements:
1. emission standards for new, large combustion plants, depending on the size of the
plant;
2. emission ceilings or bubbles, limiting the national sulfur- and nitrogen oxides
emissions from existing large combustion plants in three phases: 1993, 1998 and
2000.
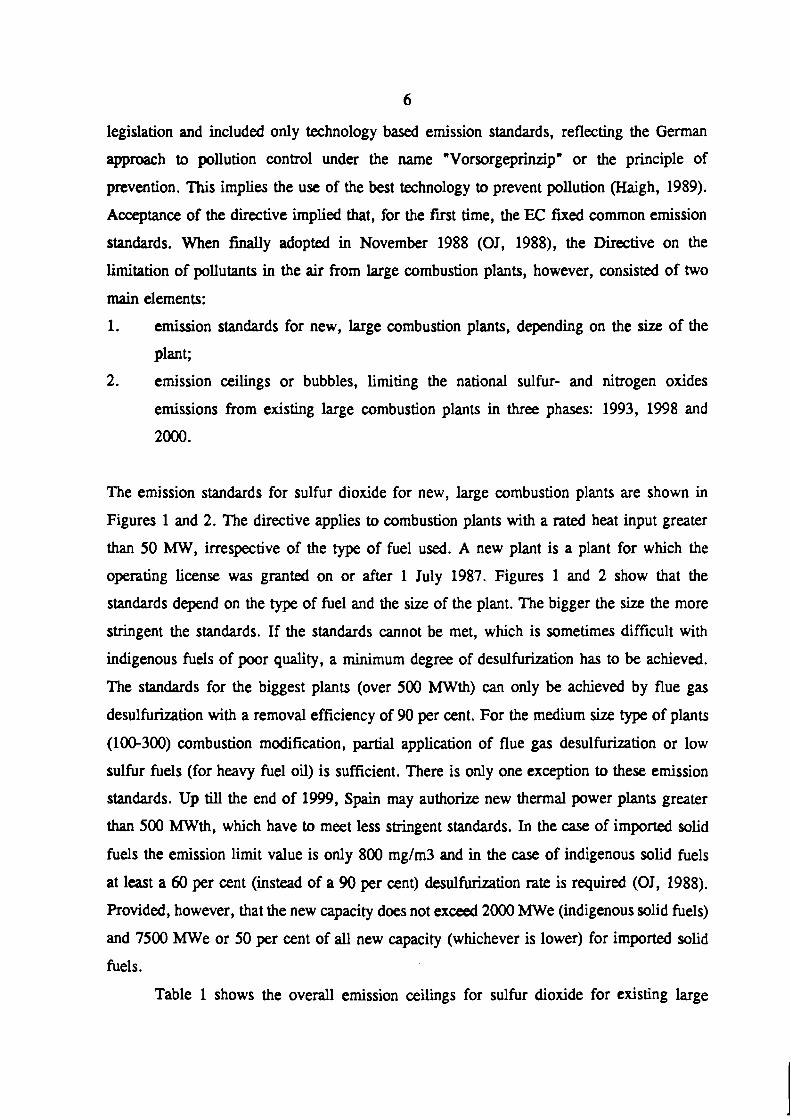
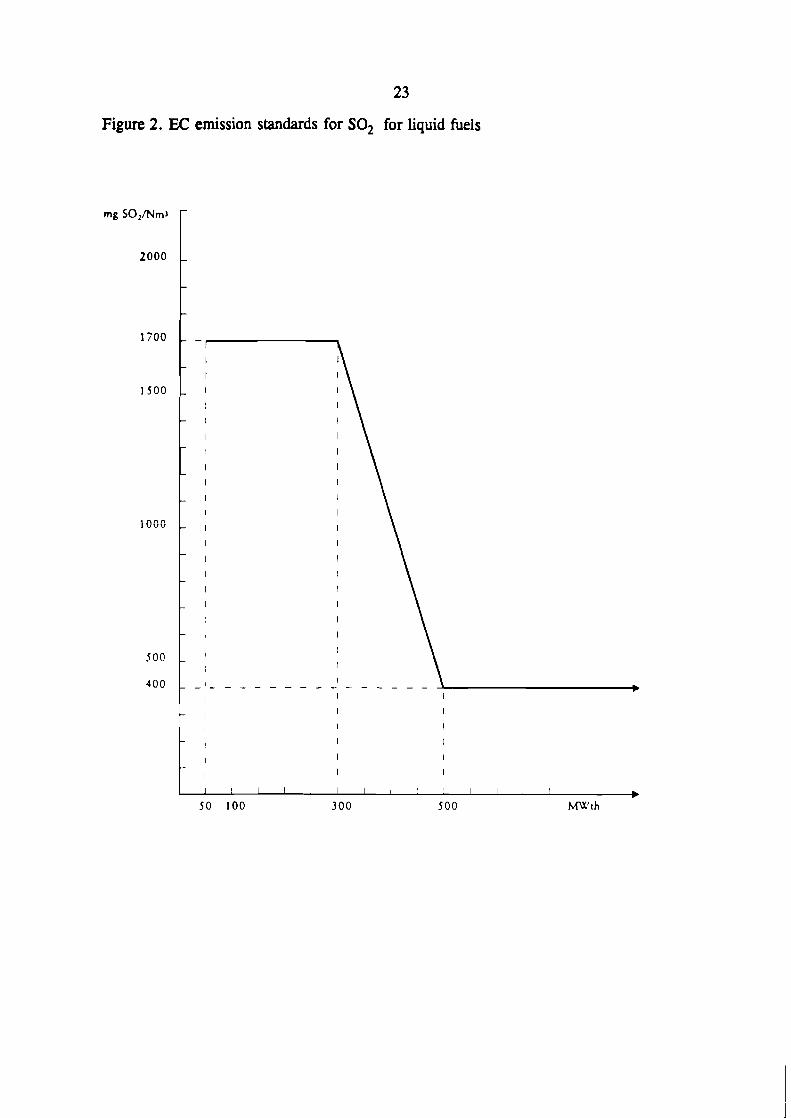
The emission standards for sulfur dioxide for new, large combustion plants are shown in
Figures 1 and 2. The directive applies to combustion plants with a rated heat input greater
than 50 MW, irrespective of the type of fuel used. A new plant is a plant for which the
operating license was granted on or after 1 July 1987. Figures 1 and 2 show that the
standards depend on the type of fuel and the size of the plant. The bigger the size the more
stringent the standards. If the standards cannot be met, which is sometimes difficult with
indigenous fuels of poor quality, a minimum degree of desulfurization has to be achieved.
The standards for the biggest plants (over 500 MWth) can only be achieved by flue gas
desulfurization with a removal efficiency of 90 per cent. For the medium size type of plants
(100-300) combustion modification, partial application of flue gas desulfurization or low
sulfur fuels (for heavy fuel oil) is sufficient. There is only one exception to these emission
standards. Up till the end of 1999, Spain may authorize new thermal power plants greater
than 500 MWth, which have to meet less stringent standards. In the case of imported solid
fuels the emission limit value is only 800 mglm3 and in the case of indigenous solid fuels
at least a 60 per cent (instead of a 90 per cent) desulfurization rate is required (OJ, 1988).
Provided, however, that the new capacity does not exceed 2000 MWe (indigenous solid fuels)
and 7500 MWe or 50 per cent of all new capacity (whichever is lower) for imported solid
fuels.
Table 1 shows the overall emission ceilings for sulfur dioxide for existing large
combustion plants. Clearly, emission reductions required from the member states differ
considerably, according to their environmental, economic and energy situation. Belgium,
France, Germany (West) and the Netherlands are aiming at 40 per cent, 60 per cent and 70
per cent cutbacks while the UK is aiming at 20 per cent, 40 per cent and 60 per cent
reductions and Greece, Ireland and Portugal are allowed to increase emissions compared to
1980.
2.2 National legislation
A number of countries in Europe have accepted national legislation to reduce sulfur
dioxide emissions (UNIECE, 1991; UNIECE, 1987). Chiefly, this legislation consists of
emission standards for combustion installations, fuel standards and the regulation of industrial
process emissions. In a number of countries (Denmark and the Netherlands), however, the
bubble concept is applied to cap the emissions from power plants, and in other countries
(Norway and Sweden) sulfur taxes are also being used.
Table 2 gives an overview of the emission standards for combustion plants in place
in a number of countries in Europe. Countries that have adopted similar standards as the EC
Directive on large combustion plants are not explicitly mentioned unless their standards are
more stringent. The table shows that a large number of countries have accepted regulations
to limit the emission from combustion. Only a few countries limit these emission standards
to new installations. Most countries have set emission standards for both new and existing
installations. Existing installations usually have to comply with these standards within a
certain period of time (Austria, Germany, CSFR, the Netherlands) andlor are faced with
more lenient standards (Austria, Poland). In all but one country (Poland) the emission
standards depend on the size of the installation. In comparing the emission standards among
different countries, one should be aware of the fact that standards are sometimes set in
different units (Sweden, Finland, Poland). They may also differ per coal type (Poland) and
conversion of these standards in gram SqIm3 flue gas depends on the heat value and the
flue gas volume of the fuel under consideration (Vernon, 1988).
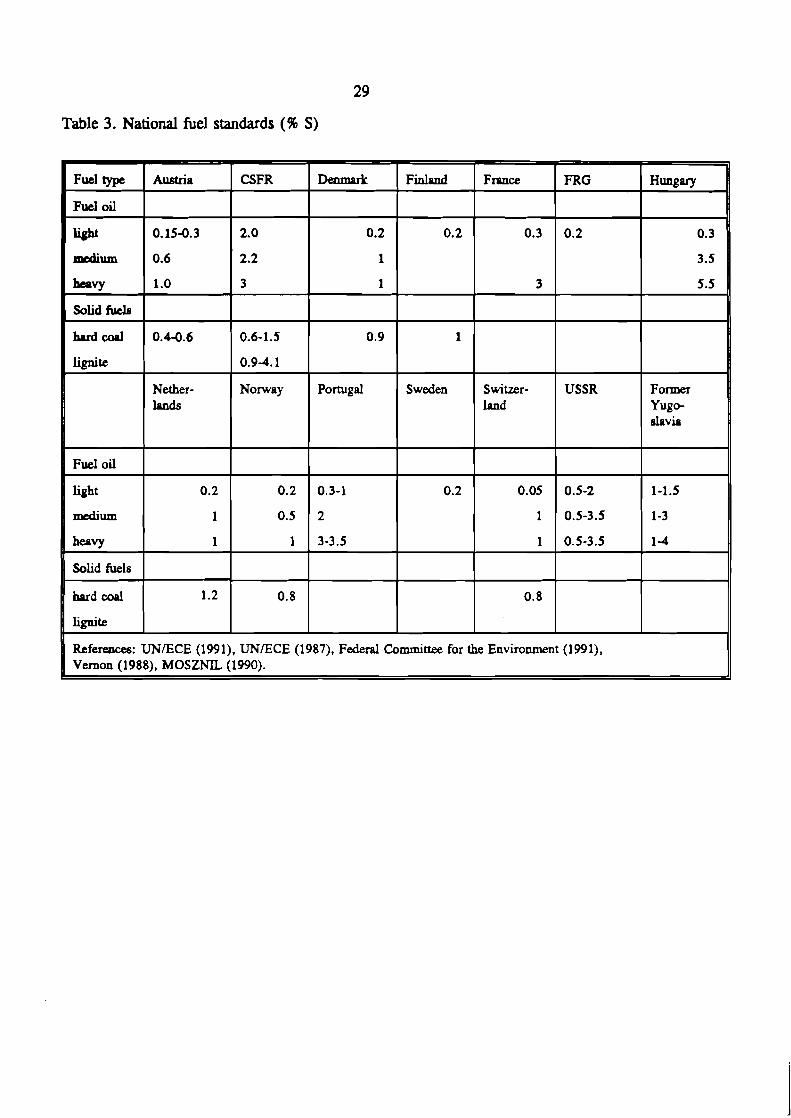
Fuel standards are in place in a number of countries as well (Table 3). In various EC-
countries the sulfur content in gas oil was already restricted to 0.2 per cent S before
acceptance of the comparable EC Directive. Furthermore, a number of countries limited the

sulfur content in heavy fuel oil, usually to 1.0 per cent S, and have put an upper limit in the
sulfur content in hard coal (0.5-1.0 per cent S).
On top of this, various countries have regulated the noncombustion emissions from
industrial processes such as smelters, refineries, iron and steel plants, cement plants, paper
mills and gas plants: Austria, Finland, Germany, the Netherlands and Norway (UNIECE,
1991).
Both the Netherlands and Denmark have set a cap on the total annual emissions from
power plants. In the Netherlands the cap is set at 18 kton S$ to be attained in the year 2000
(Wieg, 1993). The cap is agreed upon in a covenant between the state, provincial authorities
and the electricity production bcmd (SEP). In Denmark the cap has been set at 125 kton SO,
to be attained in 1995 and at 85 kiloton for the year 2000 (UNIECE, 1991).
In Norway and Sweden fuel taxes are being used to promote the use of low sulfur
fuels. In Norway the sulfur content in gas oil is less than 0.15 per cent S as a result of the
sulfur tax. In the northern parts of Norway, were the maximum allowable sulfur content in
fuel oil is 0.25 per cent S, 1 per cent S is used to a greater extent due to the sulfur tax. In
the thirteen southern and southwestern countries the maximum allowable sulfur content is 1.0
per cent, in Oslo and Drammen the maximum allowable level is 0.8 per cent S. The tax
structure is as follows. There is no tax for sulfur contents below 0.05 per cent. In the range
0.05-0.25 per cent S, the tax is 0.07 NOK (0.01 ECU). For sulfur contents exceeding 0.25
per cent S, there is an additional tax of 0.07 NOK (0.01 ECU) per liter per 0.25 per cent S.
For example the sulfur tax for residual oil with 0.95 per cent S is 0.28 NOK (0.03 ECU)
liter (Borge, 1992).
In Sweden a sulfur tax came into force in January 1991 corresponding to SEK 30000
per ton of sulfur emitted (3500 ECU per ton). It is imposed on coal, peat and oil.
Technically, the sulfur tax takes the form of a fuel tax. There exists also a differentiation in
the tax on diesel fuel to stimulate the use of environmentally superior grades of diesel oil.
As a result of the taxes diesel fuels with less than 0.01 per cent S have a market share of
10 per cent and diesel fuels with less than 0.05 per cent S a market share of 60 per cent. For
heavy fuel oils, the average sulfur content has decreased from 0.65 per cent to 0.4-0.5 per
cent S (Bergman et al., 1993).
9
3 The UNIECE and the Making of a New Sulfur Protocol
Currently, within the framework of the UNIECE (the United Nations Economic
Commission for Europe) Convention on Imng-Range Transboundary Air Pollution,
negotiations are in progress on a new protocol to control sulfur dioxide emissions in Europe.
The present protocol calls for all signatories to uniformly reduce their SO2 emissions by 30
per cent compared to the year 1980 by 1993. A major new element of the current
negotiations is the intention to apply an effect-oriented approach by basing the extent of
emission reductions on the susceptibility of natural ecosystems to acid deposition. Hence,
emission reduction strategies should account for the so called 'critical loads': Critical loads
being defined as the maximum levels of deposition (sulfur, nitrogen or total acidity) below
which, according to current scientific knowledge, no damage to sensitive ecosystems occurs
(Hettelingh et al., 1991). The paper restricts calculations to sulfur only. The (net) deposition
of base cations may neutralize the acidifying impact of sulfur emissions. A net base cation
balance is used to derive so-called critical sulfur deposition values. Critical sulfur deposition
values are equal to the critical loads for sulfur corrected for the net base cation balance.
Figure 3 displays the map of the 5-percentile values for critical sulfur deposition provided
by the Coordination Center for Effects (CCE) at the National Institute of Public Health and
Environmental Protection (RIVM), the Netherlands. This is the map being used in the
ongoing negotiations. Obviously, the map shows that the sensitivity of soils and ecosystems
differs within Europe and highly sensitive areas are to be found especially in Northern
Europe.
Since these critical loads are hard to achieve on the short run, compromises have been
discussed in the course of the negotiations. A compromise that has been used as the latest
(August 1993) reference point accepts that, although critical loads remain the long term
objective, the new sulfur protocol makes a gradual move towards these goals only. The
difference (the gap) between the sulfur deposition in 1990 and the 5 percentile critical loads
(protecting 95 per cent of all ecosystems for excessive sulfur deposition) has to be reduced
by at least 60 per cent. In grids where the 1990 deposition was already below the 5 percentile
values (especially in parts of Portugal, Spain and Russia), the 5 percentile values were chosen
as deposition targets (being the long-term objective). The resulting targets for the deposition
of sulfur have to be attained in a cost-effective way minimizing total European costs. This

10
cost minimization takes into account that countries at least will do what they were planning
to do anyway: the Current Reduction Plans (CRP). It also accounts for the fact that the sulfur
content in the fuel oil used by ships, in the Baltic Sea, the North Sea and the Atlantic Ocean,
will not be reduced although this would be costeffective. The resulting scenario is called AS
and formed the basis for further negotiations (see Amann et al., 1993). Although AS still
sewes as reference point, further negotiations assessing the countries' willingness to reduce
emissions lead to a provisional schedule for emission ceilings. Main result is that countries,
especially in eastern Europe, are allowed to delay their reduction until the year 2010,
although some countries will not meet the reductions required under AS at all.
In addition to the above ceilings, derived from a receptor oriented policy, the second
tier of the protocol is formed by a source oriented, preventive approach. More specifically,
emission standards and fuel standards are proposed, similar to the ones adopted by the EC,
or already adopted by some European countries (Germany, the Netherlands, Austria,
Switzerland). Parties are to make use of the best available technologies and control options
(not entailing excessive costs) and encourage the use of low sulfur fuels (UN/ECE, 1993).
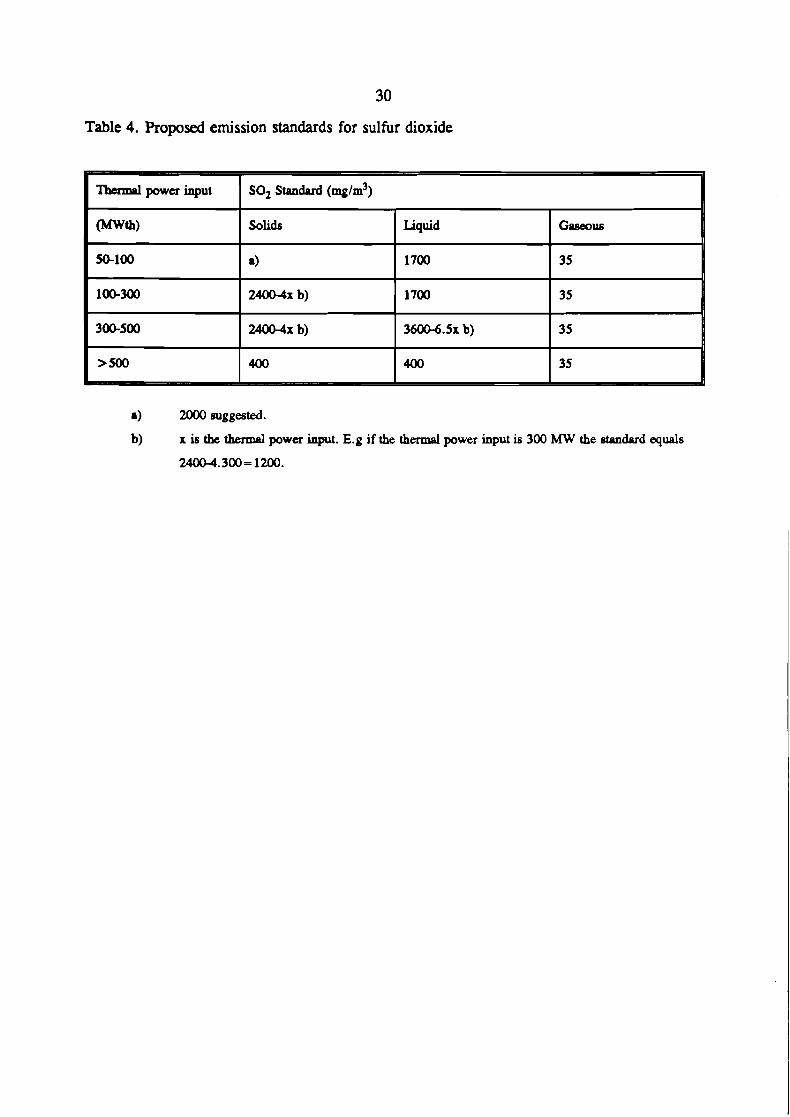
The proposed emission and fuel standards state that:
1. no later than one year after entry into force of the new protocol, countries shall apply
emission standards similar to the EC (see Table 4) for all major, stationary sources;
2. no later than five/ten years after entry into force, apply national emission standards
(as Table 4) to all major existing combustion sources;
3. no later than two/five years apply standards for the sulfur content of fuels, especially
a reduction in the sulfur content of gas oil to 0.2 per cent S but for diesel (for on-
road vehicles) to 0.05 per cent S.
Finally, a proposal is included in the draft protocol on joint implementation
(UNECE, 1993). The proposal states that two or more parties may jointly fulfil the
obligations in terms of annual emission ceilings, subject to rules and conditions to be
specified, ensuring that the overall environmental objectives are fulNled and that the
calculated environmental improvements for third parties are not compromised.
11
4 The Trade Simulation: Method and Data
4.1 Introduction
This section describes the method used to simulate emission trading,besMditicn, 1ta
on the costs and transfer coefficients used for the example simulation runs are S S l y
summarized. Use is made of the optimization module in the RAINS (Regional Acidificaldn
INformation and Simulation) model (Alcamo et al., 1990). This model simulates the fiowof
acidifying pollutants (sulfur and nitrogen species) from source regions in -ope to
environmental receptors. The current model (version 6.1) covers 38 source . ;om in
Europe: 26 countries, 7 regions in the former USSR and 5 sea regions (shii. s s h s ) .
Analysis of deposition is performed for 547 land-based receptor sites with a- -rid irk
of 150*150 km. First, the control costs options and atmospheric transport data-arb =riM.
Then the optimization and emission trading method is elucidated.
Data on costs and atmospheric transport
The RAINS model contains a sub-module to assess the feasibility and costs of
alternative emission abatement technologies. The evaluation is based o n i n t e d o d l y
reported performance and cost data of control devices. Cost estimates for -3
technologies are extrapolated by the model to reflect country-specific m W o n s sxchas
operating hours, boiler size, and fuel price. The following technical options are&&:
1. Use of low sulfur fuels and fuel desulfurization. This pertains to the use off& vb.ib: a
reduced sulfur content, such as fuels with a lower natural sulfur content or fuels fhat b e
undergone a desulfurization process. For low sulfur hard coal, the sulfur content is set at%6
per cent. Desulfurhtion of gas oil and diesel oil can reduce the sulfur content in two stqs:
down to 0.3 per cent and down to 0.05 per cent. The desulfurization of heavy hd &is
assumed to be possible up to a level of 0.6 per cent.
2. Desulfurhtion of flue gases during or after combustion. This set of measures requks
investments at the plant site. Three techniques are considered: desulfurizatim durjgg
combustion with removal efficiencies of 50 per cent at relatively low Acosts, fix gas
desulfurhtion with a removal efficiency of 95 per cent at moderate costs, a n d the useof
advanced flue gas purification with emission reduction of 98 per cent at high costs.
Not all abatement technologies are applicable for all fuel types and energy sectors.
Moreover, a distinction is made between new and existing plants to account for the additional
costs of retrofitting existing plants.
For the optimization RAINS creates 'national cost functions' for controlling
emissions. National circumstances (such as sulfur content and operating hours) result in
variations in the costs for applying the same technology in different countries in Europe.
Another difference is the structural variation of energy systems, especially in the amount and
structure of energy use, which determines the potential for application of individual control
options. One way to combine these factors is to compile national cost functions. These
functions display the lowest costs for achieving various emission levels by applying the cost
optimal combination of abatement options. The cost curves used in this paper are based on
official energy use projections for the year 2000 (Amann et al., 1993).
Source-receptor transfer coefficients, which relate (country) emissions in the diffusion
model to deposition at receptor points (for each grid), are based on the acid deposition model
developed within the European Monitoring and Evaluation Program (EMEP) (Sandnes and
Styve, 1992). The model calculates transboundary fluxes of oxidized sulfur and nitrogen as
well as reduced nitrogen (ammonia and its product ammonium). For the trade simulations
presented in this paper, EMEP model results have been applied that reflect the meteorological
average of the years 1985, 1987, 1988, 1989 and 1990.
4.3 The optimization approach implemented in the RAINS model
The optimization mode of the RAINS model allows the user:
1. to identify the cost-minimal international allocation emission reduction measures to
attain a set of deposition levels for each receptor site in Europe;
2. to determine the lowest costs to attain a target level of total European emissions.
The optimization modules formulate possible strategies to minimize the costs of
achieving deposition targets at certain receptors as a linear optimization problem that can be
solved with LP packages. The cost-effective solution requires that the total costs of emission
reductions are minimized, subject to the constraint that the desired depositions are met at
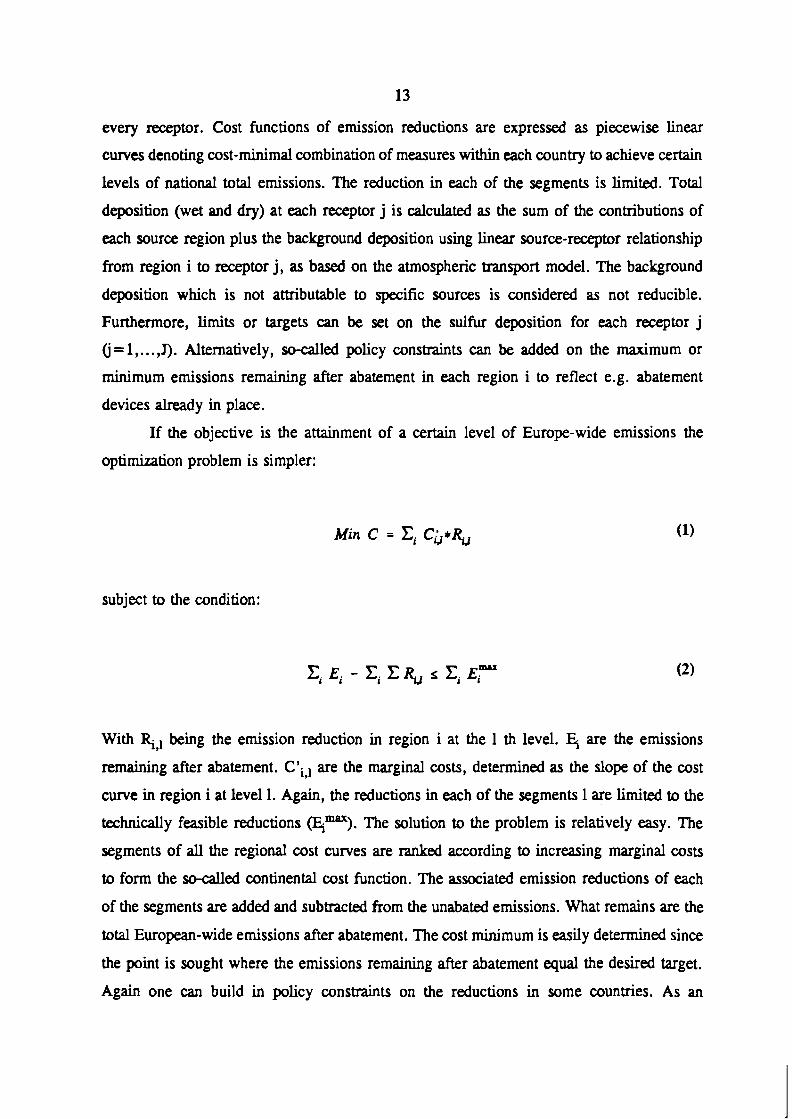
every receptor. Cost functions of emission reductions are expressed as piecewise linear
curves denoting cost-minimal combination of measures within each country to achieve certain
levels of national total emissions. The reduction in each of the segments is limited. Total
deposition (wet and dry) at each receptor j is calculated as the sum of the contributions of
each source region plus the background deposition using linear source-receptor relationship
from region i to receptor j, as based on the atmospheric transport model. The background
deposition which is not attributable to specific sources is considered as not reducible.
Furthermore, limits or targets can be set on the sulfur deposition for each receptor j
(i = 1,. . . , J). Alternatively, so-called policy constraints can be added on the maximum or
minimum emissions remaining after abatement in each region i to reflect e.g. abatement
devices already in place.
If the objective is the attainment of a certain level of Europe-wide emissions the
optimization problem is simpler:
Min C = xi Cj*Q
subject to the condition:
With R, being the emission reduction in region i at the 1 th level. are the emissions
remaining after abatement. C'i,l are the marginal costs, determined as the slope of the cost
curve in region i at level 1. Again, the reductions in each of the segments 1 are limited to the
technically feasible reductions Rrnax). The solution to the problem is relatively easy. The
segments of all the regional cost curves are ranked according to increasing marginal costs
to form the so-called continental cost function. The associated emission reductions of each
of the segments are added and subtracted from the unabated emissions. What remains are the
total European-wide emissions after abatement. The cost minimum is easily determined since
the point is sought where the emissions remaining after abatement equal the desired target.
Again one can build in policy constraints on the reductions in some countries. As an

alternative one can maximize the volume of emission reduction, given a certain cost budget.
4.4 Simulating emission trading and regulations
The MINS model allows the user to specify any control strategy in the so-called
simulation mode. This option has been used to estimate the emissions and costs of existing
and proposed regulations on national emissions. Since the emission standards depend on the
size of the installation and on whether the plant is new or existing, assumptions were made
on the size distribution of combustion plants and the replacement of old by new plants. The
size distribution data is based on CITEPA (1986) and Klaassen et al. (1988). The capacity
of new plants is based on Klaassen et al. (1988) and data in the RAINS model.
To clarify how one could combine emission trading and regulations the concept of the
national cost function is illustrated. Figure 4 gives an example cost function for Italy for the
year 2000. The step function depicts the marginal costs and the other line depicts the total
annual costs. The Figure shows that without control SO2 emissions in Italy would amount
to around 3000 kiloton. Applying all emission reduction measures would bring emission to
below 500 kilotons at costs of around 5000 million DWyear. This cost function represents
what would happen with a perfect emission trading scheme. If one would set a limit of 1000
kiloton on the Italian emissions, a perfect permit market would result in an equilibrium
permit price of around 1500 DWton SO2 and reach the cap at minimum costs (around 1000
million DWyear). If one combines regulations with emission trading, part of the abatement
options are and remain implemented, irrespective of their costs. This is shown in Figure 5.
Figure 5 shows that, given the existing regulation in Italy, emissions would already come
down to some 2250 kiloton S%. If one would apply a ceiling of 1000 kiloton in this case
the market equilibrium price would only be 1000 DWton S% and annual costs would be
around 500 million DM. To obtain total annual costs we have to add the costs of the existing
regulation since part of the abatement options where already taken before.
In this paper this part of the optimization routine was used to simulate the result of
a perfectly functioning permit market. In this case the result of emission trading would be
equal to the cost minimization option for a given emission ceiling. To simulate the case in
which emission trading is combined with regulations the "shrunk" cost functions, with simply
less segments or control options, such as the one in Figure 5, have been employed.

5 Simulation Results
Current negotiations on a new sulfur protocol not having reached final agreement yet,
this section will assume that countries agree on the national emission ceilings as they have
been proposed in August 1993 (UN/ECE, 1993). Calculations in this section are for the year
2000 only. Furthermore, it is assumed that: the protocol will include the envisaged emission
standards for new plants, that emission standards for existing standards will not be accepted
or their implementation is postponed beyond the year 2000, and that the proposed fuel
standards are accepted.
Bearing the above in mind, this section examines the cost-efficiency, environmental
impacts and distributional impacts of emission trading in Europe, combined or not combined
with existing legislation and the proposed emission and fuel standards in the draft protocol.
More specifically the following scenarios are analyzed:
1. The proposed protocol including existing legislation and the proposed standards
2. Trading plus existing legislation and proposed standards to achieve emissions of
scenario 1
3. Trading plus existing legislation for emissions of scenario 1
4. Trading for the same emissions as scenario 1
5. Trading plus existing legislation and proposed standards given the same cost as the
protocol (scenario 1)
6. Trading plus existing legislation given the same costs as the protocol
7. Trading for the same costs as the protocol.
Scenarios 1 to 4 have one objective in common: A Europe wide emission ceiling of
30063 kiloton SO2 to be attained in the year 2000. This is the level of emissions that is
expected to result from the national ceilings in the protocol proposal plus existing legislation
plus the proposed emission and fuel standards. Scenario 1, 5 to 7 have in common that the
same budget of 25480 DMIyear is spent as under the protocol. The main results of the
analysis are presented before the country level details are discussed.
Table 5 shows the main results. The protocol plus existing legislation and the protocol
standards would cost 25480 million DM/yr (scenario 1). As a result 84 per cent of all
ecosystems would be protected against excessive sulfur loads, above the critical loads. If one

would allow emission trading in Europe on top of the existing legislation and the proposed
standards (scenario 2) cost savings would be small; only 4 per cent of the costs could be
saved. A positive aspect is that the same Europe wide level of ecosystem protection would
be achieved. A potential problem is indicated under the heading equity. This column shows
the extent to which ecosystem protection in countries is altered, compared to scenario 1. The
column shows that for scenario 2 the country with the highest gain in term of ecosystem
improvement would see its percentage of ecosystem protection increase by 37 per cent points
(e.g from 40 to 77 per cent). The highest loss would be 9 per cent points. Trading on top
of the existing legislation only, without the proposed protocol standards (scenario 3), would
save more costs (17 per cent compared to scenario I), would not change the overall
percentage of ecosystem protection, and have similar distributional impacts as scenario 2.
Allowing one Europe wide trading without the existing legislation could (in theory) result in
enormous cost savings, with a perfect market, and bring costs down to only 43 per cent. The
price for this is being paid in terms of less ecosystem protection (only 81 per cent) and more
equity problems; in this case the biggest loser might be confronted with a loss in ecosystem
protection of 27 per cent points. Apparently, there appears to be a trade-off between costs
savings on the one hand, and environmental protection and distributional equity on the other
hand.
The latter conclusion is only partly true, however, since the potential costs savings
of emission trading can also be used to reduce emissions further and to increase ecosystem
protection compared to the protocol. This is based on the notion that for the same budget to
be spent under the protocol, more emission reduction could be achieved by emission trading.
This is shown in Table 5. If the potential cost savings of emission trading would be spent to
achieve more emission reduction, emission trading with existing and proposed legislation
(scenario 5) could reduce emissions down to 28970 kton, combined with existing regulation
(scenario 6) achieves a reduction to 24643 kton and (hypothetical) emission trading only
(scenario 7) would even reduce emissions to 17132 kton. As a result, ecosystem protection
would also improve to respectively 86 per cent (scenario S), 87 per cent (scenario 6) and
even 90 per cent (scenario 7). In the latter case, however, some countries would be
confronted with significant losses in ecosystem protection (up to 14 per cent points) although
some might gain considerably (+ 54 per cent point). Overlaying trading on existing
legislation (scenario 6) and proposed standards (scenario 5) would minimize these equity
problems; expected highest losses in terms of ecosystem protection would be 6 per cent point
(scenario 5) or only 3 per cent points (scenario 6). In conclusion, emission trading could be
used to increase ecosystem protection without significant negative impacts on the distribution
of ecosystem protection.
Before drawing firm conclusions, however, one might as well examine what would
exactly happen under the Europe wide trading systems. Which countries wou1.d increase
emissions and buy permits? Which ones would sell permits and reduce emissions? Which
countries would save costs? And what would happen to environmental protection?
Table 6 shows the shifts in emissions that would occur. With scenario 2 trading would
be restricted. The most active buyers in this case would be: Belgium, CSFR, Denmark,
Finland, FRG-E, Poland and the UK. On the seller side especially Hungary, Romania, Spain,
and the Ukraine would reduce emissions further. Under scenario 3 this picture is not
drastically altered. On the supply side, some of the Eastern European countries would be
more active since the proposed standards would not restrict them in reducing emissions
further in a cost-effective way. On the demand side Western European countries would
remain just as inactive since the existing legislation in place restricts their demand. Under
scenarios 5 and 6, significantly less emission reduction than the sulfur protocol (scenario 1)
would take place in Belgium, CSFR, FRG-E and Italy. More reduction would occur in:
France, Hungary, Poland, Rumania, Spain, the Ukraine, and Moldavia. Russia, Turkey and
the UK would only reduce more under scenario 6. Remarkably, scenario 6 would cut back
the protocol emissions down to 24643 kton. This is an additional cut-back of 18 per cent at
no extra costs.
Costs in this case consist of two elements: abatement costs and the costs c.q. revenues
of buying or selling permits (Table 7). If one would allow trading on top of existing
legislation and proposed standards (scenario 2), or existing legislation only (scenario 3), the
price of an emission permit is expected to range between 500 and 2200 DM/ton S q . The
median would be 700 DM/ton S%. Taking the median as the equilibrium price of a permit
the revenues and costs of buying permits are calculated in Table 7. The Table shows that
nearly all countries would save costs but some countries would save more costs than others.
Under scenario 2, relatively high cost savings (more than 100 million DM/year) are expected
in: Belgium, FRG-E, Romania, and Spain. Some countries would not save costs at all since
they would not trade: Bulgaria, France, FRG-W, Luxembourg, Portugal, Switzerland,
Turkey (due to the standards), Kola-Karelia and Byelorussia. Under scenario 3 (existing
legislation only) cost savings would be high especially in: Belgium, FRG-E, Hungary (net
savings), Poland, Romania, Spain, Turkey, Yugoslavia, the Baltic states, Ukraine and
Russia.
Table 7 shows what would happen to the costs if emission trading would be used to
reduce emission further (scenario 5 and 6). Although total abatement costs would remain the
same, the distribution would be altered significantly. Some countries (e.g Hungary, Rumania
and Ukraine) would have more abatement costs with emission trading than under the protocol
(scenario 1). The eventual costs, however, consist of two items: the abatement costs in sensu
stricto and the costslrevenues from buying/selling emission permits. These countries would
have to be allocated more emission permits (lower initial ceilings) before trading to give them
an incentive to agree to the emission trading scheme. To give an example: Under trading
scenario 6, Hungary would reduce emissions to 504 kiloton and the costs would be 397
million DM. Before protocol trading, emission would be 894 kiloton at costs of 186 million
DM. Since the equilibrium permit price is around 700 DMIton SO2, Hungary's initial permit
allocation should be 805 kiloton (301 kiloton higher than after trading) to ensure that the
expected costs are the same as under the protocol. Clearly, the initial distribution of emission
permits has to be used as instrument to induce countries to reduce emissions further than
under the protocol.
Table 8 shows that under emission trading (scenario 2 or 3) ecosystem protection
would improve significantly in Bulgaria and Hungary. In other countries the improvements
would be much smaller or ecosystem protection would generally be reduced slightly. With
a few exceptions this is since in some countries ecosystem protection would be reduced by
8 to 9 per cent points (Germany, Denmark). Under trading scenarios 5 and 6 ecosystem
protection, generally, would improve compared to the protocol and it would improve
considerably in some countries (Hungary and Bulgaria). However, some countries might have
less ecosystem protection (Germany and Luxembourg). Under scenario 5 the extent of the
losses would be higher since accepting the proposed standards would restrict the additional
emission reductions emission trading could achieve. Under scenario 6, the expected losses
in ecosystem protection would be small (below 3 per cent points) and most countries would
have more protection.
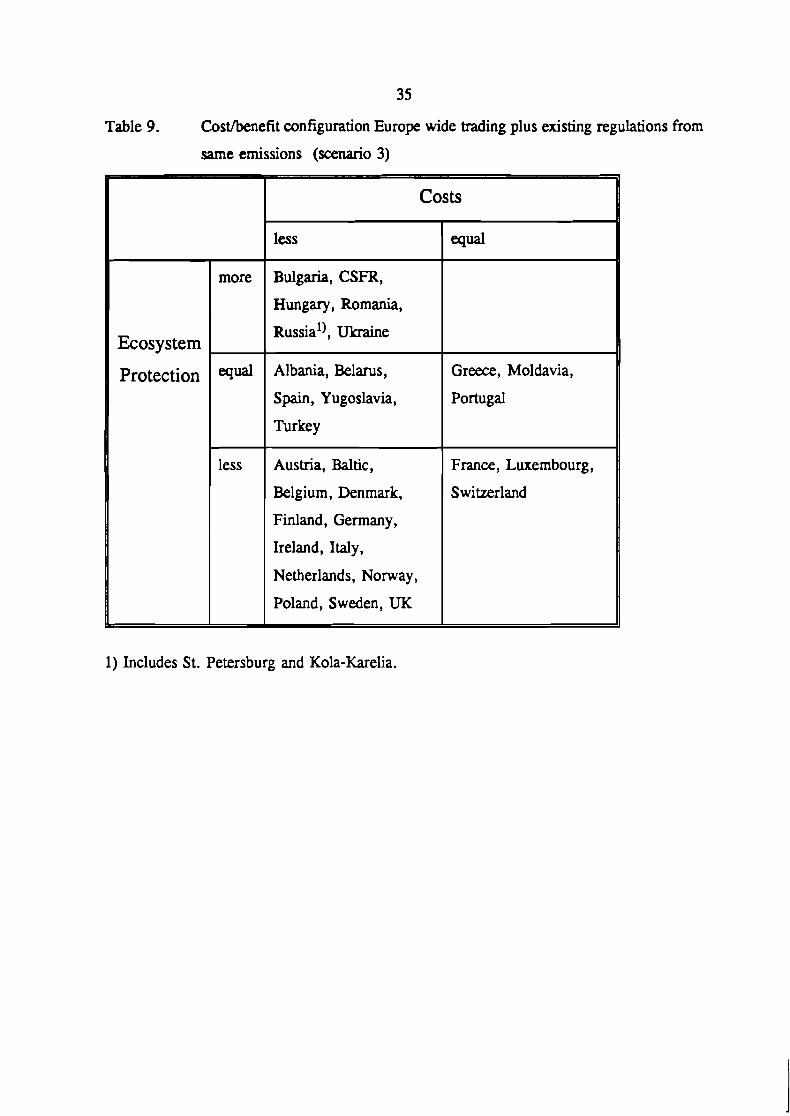
Going back to square one, it is now time to put the pieces together and compare the

19
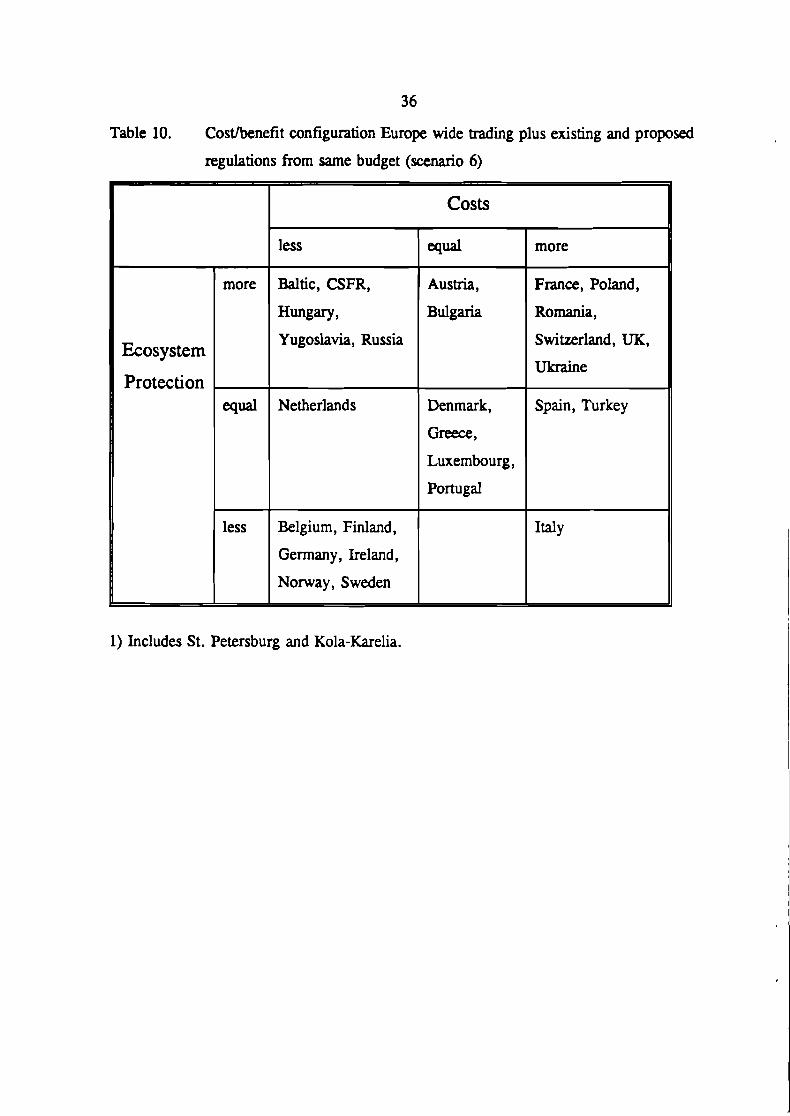
cost and benefits of emission trading in Europe. Table 9 shows the cost-benefit configuration
for scenario 3 (Europe wide trading on top of the existing legislation) and Table 10 for
scenario 6 (Europe wide plus existing legislation). Table 9 suggests that some countries (e.g
Bulgaria) would have less costs and more ecosystem protection in this schedule. Some have
equal protection and equal or less costs (e.g. Albania). Problems occur with countries that
have less protection and less costs since these countries might oppose. Most problematic are
countries Like France that are confronted with equal costs and less protection since they
would have nothing to gain. Using emission trading to curb emissions further would be less
problematic. Although some countries would have less ecosystem protection (Germany e.g.)
the extent would be limited and they would also have less costs. Only one country (Italy)
would have less protection and more abatement costs. In this case, however, the initial
distribution might be used to compensate Italy for the ecosystem losses. The same applies
to Spain and Turkey and possibly France, Poland, Romania, Switzerland, UK and Ukraine.
In summary, using emission trading on top of the existing legislation to curb
emissions further seems an attractive possibility to achieve more ecosystem protection.
Clearly, however, the initial distribution of emission permits would have to be used to
compensate potential losers and to determine which country would have to reduce emissions
to what extent on top of the initial protocol proposal.
6 Conclusions and Discussion
The aim of this paper was to examine the costs and environmental impacts of emission
trading in Europe in one zone given the emission ceilings and emission and fuel standards
proposed for a new sulfur protocol. A new element in the paper was the combination of
emission trading in Europe with existing emission and fuel standards and standards proposed
in the new sulfur protocol. The results suggest the following conclusions:
1. overlaying emission trading on regulations to achieve the same emission level as the
sulfur protocol reduces cost savings but has beneficial impacts as well since average
ecosystem protection is not altered;
2. combining trading with regulation, to achieve the same emission level, limits the
negative impacts on ecosystem protection but some countries would still have less
ecosystem protection than without trading;
3. the cost savings of emission trading can also be used to reduce emissions further and
to increase ecosystem protection. If combined with existing legislation, significant
negative environmental impacts for countries are then avoided;
4. if trading is used to increase ecosystem protection, the initial distribution of emission
reduction has to be used as instrument to redistribute costs to avoid that some
countries are confronted with higher costs than under the protocol.
In conclusion, there appears to be a trade-off between the use of emission trading to save
costs on the one hand and to increase ecosystem protection and also political acceptability on
the other hand.
References
Alcarno, J., R. Shaw and L. Hordijk (Eds.) (1990) The RAWS Model of Acidification. Science and Strategies in Euro-E Dordrecht, the Netherlands: Kluwer Academic Publishers.
Amann, M., G. Klaassen and W. Sch6pp (1993) Closing the naD between the 1990 - -
d w s . .
ition and the critical sulfur deposibon valueg Background paper prepared for the UNIECE Task Force on Integrated Assessment Modelling, June 7-8, 1993. May 1993. Laxenburg, IIASA.
Ben.net, G. (4 . ) (1991) Air ~ollution control in the Euro-~ean Community, London1 DordrechtIBoston, Graham and Trotrnan.
Bergman, H., 0. Jamsted and K. Efgren (1993) Five economic instruments in Swedish environmental ~rotection -mlicv, Solna: Swedish Environmental Protection Agency.
Borge, E. (1992) k t te r of September 1992, Oslo, State Pollution Control Authority ( S m . CITEPA (1986) W o . . . n emission factors and fuel distnbubon as collected in the frame of
an EEC emission inventory, (unpublished) Paris, CITEPA. Cofala, J. (199 1) Personal communication, Laxenburg, IIASA. Dumas, R. (1993) Personal communicatinn, The Hague, The Netherlands Ministry for Public
Housing Physical Planning and Environmental Protection (VROM), Directorate Air. Federal Committee for the Environment (1991) m l a t i o n . issued bv the Federal Committeg
for the Environment of October 1. 1991 concerning the law 309 of Julv. 1991 on air ppllution control, Prague.
Hahn, R.W. and G.L. Hester (1989) Where did all the markets go? An analysis of EPA's Emissions Trading Program, Yale Journal on reeulation, 6, 109-153.
Haigh, N. (1989) New tools for European air pollution control. International Environmental Affairs, 1(1), Winter 1989, p. 2637.
Hettelingh, J.-P., R. J. Downing and P. de Smet (1991) Maw~ing critical loads for Euro~e, CCE Technical Report No. 1. RIVM Report No. 259101001. Bilthoven, the Netherlands: Coordination Center for Effects: National Institute of Public Health and Environmental Protection
Johnson, S. and G. Corcelle (1989) J'he environmental mlicv of the environmental communities. London/DordrechtlBoston, Graham and Trotrnan.
Kete, N. (1992) The U.S. Acid Rain Control Allowance Trading System. In: Clim- change . i en ine a tradeable permit svstem, Paris, OECD.
Klaassen, G., P. Kee, A. Nentjes, W. Hafkamp and A. Olsthoorn (1988) . . croeconomic immts of the EC large co mbusb 'on ~lants d irective ~ro-msal.
Technical document I: assessment of investments. costs and emission reduction, Luxembourg, Commission of the European Communities.
Krupnick, A.J., W.E. Oates and E. van de Verg (1983) On marketable air pollution permits: the case for a system of pollution offsets. lournal of Environmental Fmnomics and Management, 10: 233-247.
Montgomery, W.D. (1972) Markets in licenses and efficient pollution control programs. Journal of Economic Theory, 5: 395-418.
MOSZNIL (Ministry of Environmental Protection, Natural Resources and Forestry) (1990) Ordinance of the MOSZNIL of 12th February 1990 on Protection on Air against Pollution. Journal of Laws No. 15. 1990,(In Polish), Warsaw.
OJ (1988) Council Directive of November 1988 on the limitation of emissions of certain pollutants in the air from large combustion plants. Official Journal of the E u r o m Communiti~, L336, Volume 31, 7 December 1988, p. 1-13.
Rentz, O., H.D. Haasis, T. Morgenstern, J. Remmers and G. Schons (1990) ODtimal control strateeies for reducing emissions form enerev conversion and energv use in all countries of the Euro-pean Community, KfK-PEf7 2, Karlruhe: Kernforschungszentrum Karlsruhe.
Sandnes, H. and H. Styve (1992) Calculated Budgets for airborne acidify in^ com-ponents in Euro~e. 1985.1987.1988. 1989.1990 and 1991, EMEP/MSC-W Report 1/92. Oslo, Norway: Meteorological Synthesizing Center-West, The Norwegian Meteorological Institute.
Tietenberg, T.H. (1985) Emission trading: an exercise in reforming pollution policy, Resources for the Future, Washington.
UN/ECE (1987) National str&gies and -policies for air pollution abatement. 1986 review, ECWEB.Air/l4. Geneva: United Nations Economic Commission for Europe.
UN/ECE (1991) Strategies and mlicies for air mllution abatement. 1990 review, ECW EB.Airt27. Geneva: United Nations Economic Commission for Europe.
UNIECE (1993) Pe_~ort of the tenth session, Executive Body for the Convention on Long Range Transboundary Air Pollution, Working Group on Strategies, EB. AIR/ WG.5120. Geneva, United Nations Economic Commission for Europe.
Vernon, J. (1988) Emission standards for coal fired ~lants, London, IEA Coal Research. Vlieg, F. (1993) personal communication. The Hague, The Netherlands Ministry for Public
Housing Physical Planning and Environmental Protection (VROM), Directorate Air.
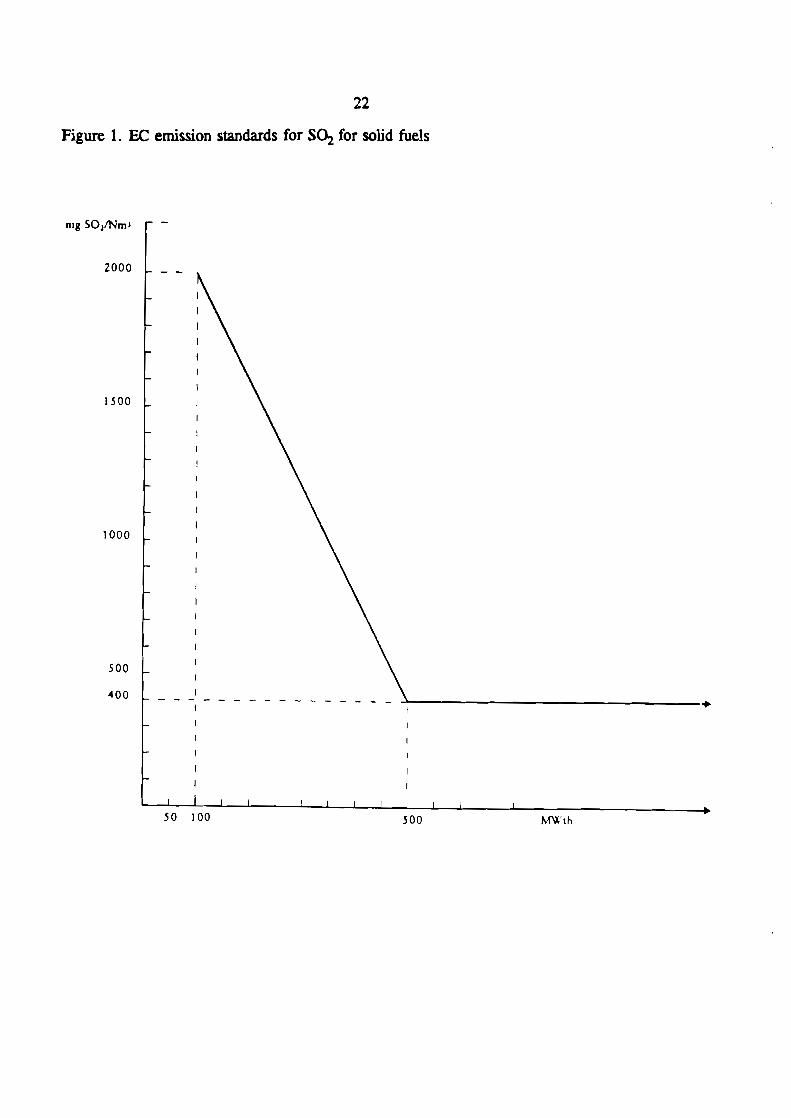
Figure 1 . EC emission standards for S% for solid fuels
23
Figure 2. EC emission standards for SO2 for liquid fuels

Figure 3. Critical sulfur deposition values (g Slrn2lyr)
Crit. sulfur dep.vaJues
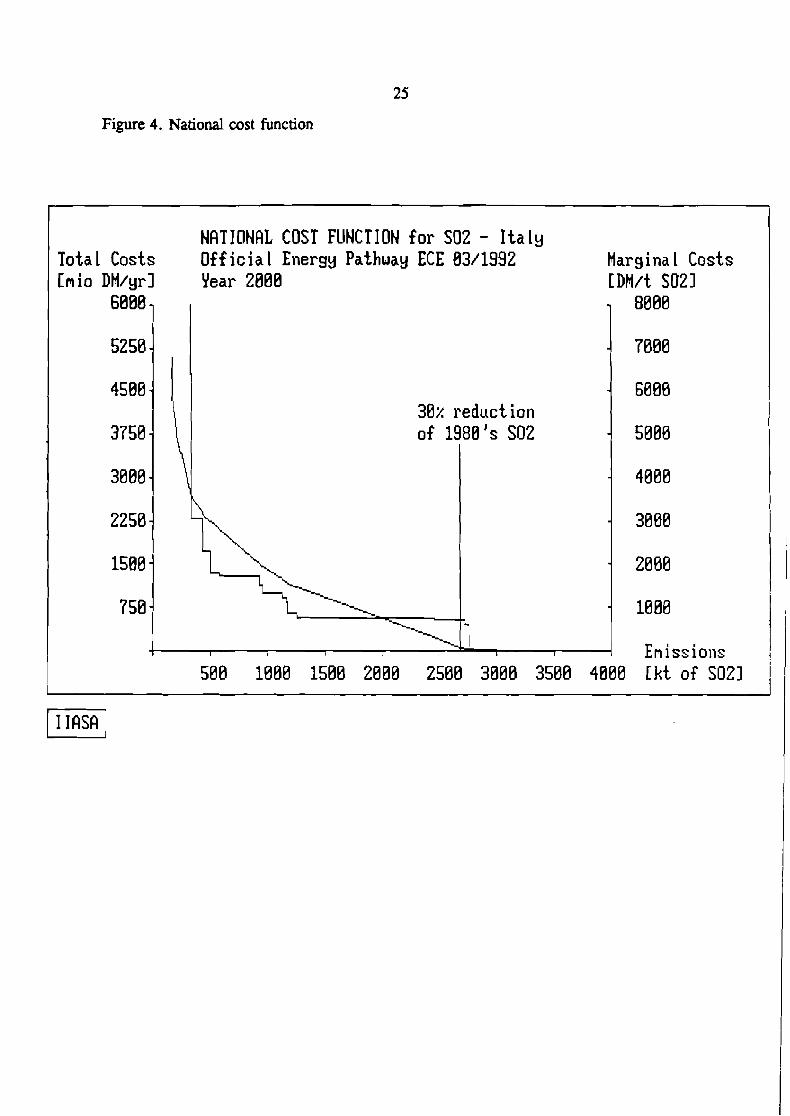
Figure 4. National cost function
N A T I O N R L COST FUNCTION for SO2 - Italy Total Costs Off i c ia l Energy Pathway ECE 03/1992 Marg i na 1 Costs Cmio DM/yrl Year 2000 CDM/t SO21
1 6000 - - 8000 I
5250 - I
4500 -
7000
6000 30x reduct ion
3750 - of 1988's SO2 50 00
3000 - 4000
2250 - 3000
1500 - 2000
750 - ---- 1- 1000 1.
Emissions

26
Figure 5. National cost function on top of existing legislation
3500 -
3000 -
NRTIDNRL COST FLINCTION f o r SO2 - I t a ly Total Costs LEGRL ELIROPE 3 Margina 1 Costs Cmio DM/yrl Year 2000 CDM/t SO21
7000
6000
4000 - 8000
2500:
2000
1500 -
1000 -
500 -
375 750 1125 1500 1875 2250 2625 3000 [ k t of SO21 I
l, 3 0 ~ reduct ion of 1980's SO2 080
4000 I I I
\-\
'---- 1-
-----\
Cr
I I I I I I
3000 I
2000
1000 i I
Emissions

Table 1. EC Emission ceilings for SO2 for existing large combustion plants (LCP).

28
Table 2. National emission standards (g ~%/rn ' )~)
Ref-: UNIECE (1 Wl), Federal Commietee for the Environment (1 Wl), Vanon (1988), Cofda (1 Wl), Rratz et d. (1990), MOSZNIL (1990).
29
Table 3. National fuel standards (96 S)
Solid fuel6
hard d
lignite
Fuel oil
light
medium
~ V Y
Solid fuels
hard coal
lignite
References: UNECE (1991), UNECE (1987). Federal Committee for the Environment (1991), Vernon (1988), MOSZNIL (1990).
0.44.6
Nether- lands
0.2
1
1
1.2
0.6-1.5
0.9-4.1
Noway
0.2
0.5
1
0.8
0.9
Portugal
0.3-1
2
3-3.5
1
Sweden
0.2
Switzer- lnnd
0.05
1
1
0.8
USSR
0.5-2
0.5-3.5
0.5-3.5
Former Yugo- slavia
1-1.5
1-3
1 -4
30
Table 4. Proposed emission standards for sulfur dioxide
1) 2000 suggested.
b) x is the thermal power input. E.g if the thennal power input is 300 MW the standard equals
24004.300= 1200.
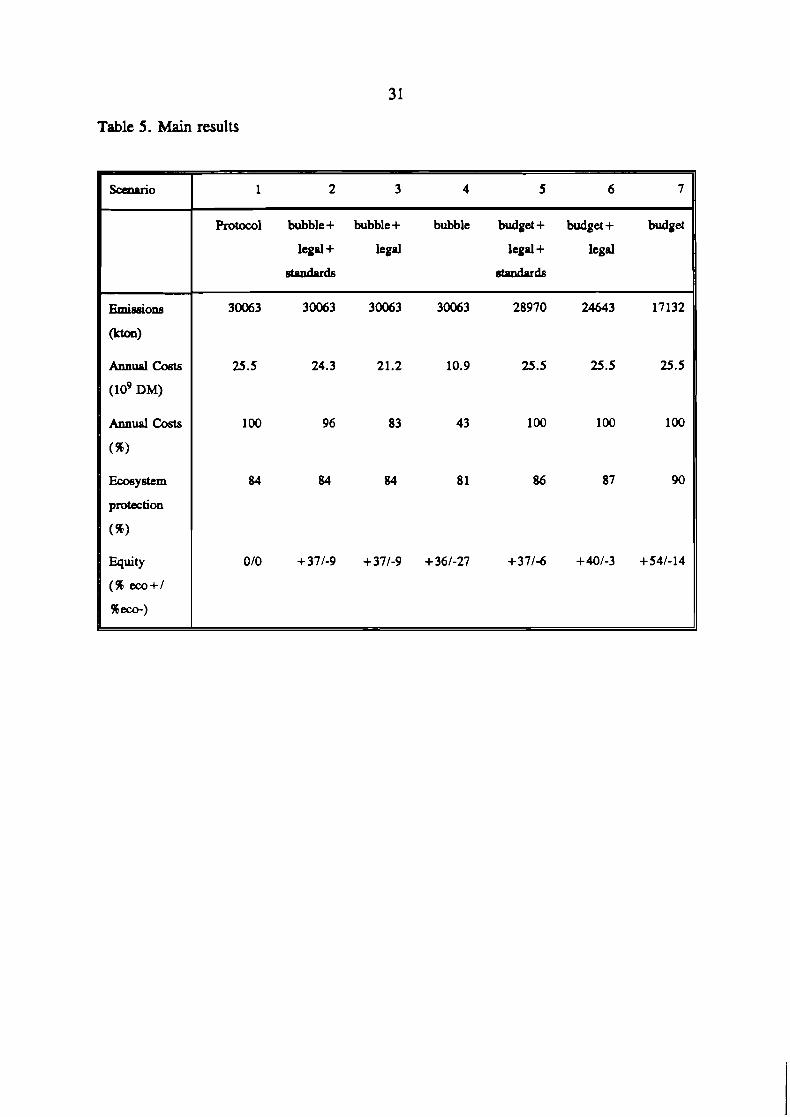
Table 5 . Main results
84 84 84 81 86 87 90
010 + 371-9 + 371-9 + 361-27 +37/-6 +MI -3 +54/-14
Ecosystem
prdec tion
(96)
Equity
P
(96 m+/
96-)

32
Table 6. Emissions
Notu: Rurrkn Pcdartion within the EMEP ua. Kok-hrch, St. Pdtnburg md K.liningrrd region: excludcd .
2) lncludcs Estonia, Win, Lithuania and K.liningrad @ut of Russian Federation).

33
Table 7. Abatement and permit costs
Nottr: Ruuian Ftdcrcrtion within the EMEP uca, Kola-Kucli., St. Pdenburg and Kaliningrad region8 excluded.
2) Includu Eatonia, Latvia. Lithuania and Kaliningrad @art of Russian Federation). 3) Abatement cortr only.

34
Table 8. Environmental protection
Nota: ') Ruuh FadcRtion within the EMEP uca, Koh-Kuclir, St. Petrrrburg and W g r a d regions excluded.
2) Includes &tonu, Latvia, Lithuania and Kdinhgnd of Rwcrh Federation).
35
Table 9. Costlbenefit configuration Europe wide trading plus existing regulations from
same emissions (scenario 3)
1) Includes St. Petersburg and Kola-Karelia.
Hungary, Romania,
Spain, Yugoslavia,
I less Austria, Baltic,
Belgium, Denmark,
Finland, Germany,
Ireland, Italy,
Netherlands, Norway,
Poland, Sweden, UK
France, Luxembourg,
Switzerland
36
Table 10. Costbenefit configuration Europe wide trading plus existing and proposed
regulations from same budget (scenario 6)
Yugoslavia, Russia
1) Includes St. Petersburg and Kola-Karelia.


