Page 1
Sulfur-Utilizing Autotrophic Denitrification Process
For the Treatment of Nitrate-Rich Water
A Major Qualifying Project Report
Submitted to the Faculty of the
WORCESTER POLYTECHNIC INSTITUTE
In Partial Fulfillment of the Requirements for the
Degree of Bachelor of Science
by
____________________
Seonhee Park
Date: March 2, 2010
Approved:
____________________
Professor Hong Susan Zhou, Advisor
Page 2
I
ABSTRACT
As the increasing concentration of nitrogen contamination in the water is becoming a
problem in many places, this project studied the method for the treatment of nitrate-rich water
using the autotrophic denitrification process. The effects of environmental and running
conditions were observed using the batch and continuous reactors. The autotrophic
denitrification process was able to treat nitrate or nitrite-rich water, but probably cannot be used
for the treatment of drinking water. The result showed that the process works well for acidic pH,
temperature higher than 15 °C and at HRT above 3.
Page 3
II
ACKNOWLEDGEMENTS
I would like to thank the following people and institutions:
School of Environmental Science and Engineering, Shanghai Jiaotong University
Professor Weili Zhou, SJTU Advisor
Sun Ye Jue
Huang Min
Zhang Yue
Chemical Engineering, Worcester Polytechnic Institute
Professor Hong Susan Zhou, Advisor
Professor David DiBiasio, Co-Advisor
Page 4
III
TABLE OF CONTENTS
ABSTRACT I
ACKNOWLEDGEMENTS II
TABLE OF CONTENTS III
LIST OF FIGURES V
LIST OF TABLES VI
LIST OF ACRONYMS VII
INTRODUCTION 1
BACKGROUND 3
NITROGEN IN THE WATER 3
THE TRADITIONAL TREATMENT METHODS FOR NITROGEN REMOVAL 8
CURRENT RESEARCHES ON THE AUTOTROPHIC DENITRIFICATION PROCESS 12
METHODOLOGY 16
BATCH REACTORS 16
NO3- and NO2
- Determination 18
Gas Analysis 20
CONTINUOUS REACTORS 22
NO3- and NO2
- Determination 25
SO42-
Determination 26
Gas Analysis 27
RESULTS AND DISCUSSIONS 29
BATCH REACTORS 29
CONTINUOUS REACTORS 40
CONCLUSIONS 54
REFERENCE 56
APPENDIX 59
APPENDIX A: RAW DATA 59
Table 1. Continuous Reactor #1 59
Table 2. Continuous Reactor #2 61
Page 5
IV
APPENDIX B: RESULTS 64
Table 3. Batch test gas analysis 64
Table 4. Continuous reactor gas analysis 65
Figure 1. Batch reactor: effect of pH at 40 mg-N/L NO3 at 8˚C 67
Figure 2. Batch reactor: effect of pH at 100 mg-N/L NO2 at 18˚C 67
Page 6
V
LIST OF FIGURES
FIGURE 1 NITROGEN CYCLE (HARRISON, 2003) 4
FIGURE 2 EFFECT OF THERMOCLINE ON THE TEMPERATURE AND OXYGEN IN LAKES (UNITED NATIONS ENVIRONMENT PROGRAMME) 7
FIGURE 3 NITROGEN TRANSFORMATION IN BIOLOGICAL TREATMENT PROCESSES (METCALF, 1991) 9
FIGURE 4 A/O PROCESS (METCALF, 1991) 11
FIGURE 5 A/A/O PROCESS (METCALF, 1991) 11
FIGURE 6 PICTURE OF REACTOR #1 22
FIGURE 7 PICTURE OF REACTOR #2 22
FIGURE 8 RESULTS OF BATCH EXPERIMENT WITH NITRATE A) NO3-N, B) N2O COMPOSITION OF THE GAS PHASE, AND C) NET N2O
PRODUCTION (PARK ET AL., 2001) 30
FIGURE 9 BATCH REACTOR: NITRATE AND NITRITE CONCENTRATION AT 10 MG-N/L NO3, 28˚C AND PH = 6 31
FIGURE 10 BATCH REACTOR: NITRATE AND NITRITE CONCENTRATION AT 100 MG-N/L NO3, 28˚C AND PH = 6 31
FIGURE 11 BATCH REACTOR: EFFECT OF PH AT 10 MG-N/L NO2 AT 28˚C 32
FIGURE 12 BATCH REACTOR: EFFECT OF PH AT 70 MG-N/L NO3 AT 28˚C 32
FIGURE 13 BATCH REACTOR: EFFECT OF TEMPERATURE AT 70 MG-N/L NO3 AT PH = 6 34
FIGURE 14 BATCH REACTOR: EFFECT TEMPERATURE PH AT 10 MG-N/L NO3 AT PH = 6 35
FIGURE 15 BATCH REACTOR: EFFECT TEMPERATURE PH AT 100 MG-N/L NO3 AT PH = 6 36
FIGURE 16 BATCH REACTOR NO3: EFFECT OF INFLUENT CONCENTRATION AT 28˚C, PH = 6 37
FIGURE 17 BATCH REACTOR NO3: EFFECT OF INFLUENT CONCENTRATION AT 18˚C, PH = 6 37
FIGURE 18 BATCH REACTOR NO3: EFFECT OF INFLUENT CONCENTRATION AT 8˚C, PH = 6 38
FIGURE 19 REMOVAL % AT INFLUENT CONCENTRATION OF 10 MG-N/L AND VARYING HRT 40
FIGURE 20 REMOVAL % AT INFLUENT CONCENTRATION OF 40 MG-N/L AND VARYING HRT 41
FIGURE 21 REMOVAL % AT INFLUENT CONCENTRATION OF 70 MG-N/L AND VARYING HRT 43
FIGURE 22 RUNNING CONDITIONS OF CONTINUOUS REACTORS 45
FIGURE 23 COMPARISON OF ROOM TEMPERATURES AT INFLUENT CONCENTRATION = 10 MG/L 46
FIGURE 24 COMPARISON OF NITROGEN REMOVAL AT 10 MG-N/L 47
FIGURE 25 PERCENTAGE OF NITROGEN GAS FROM GAS ANALYSIS AT EACH CONDITION 49
FIGURE 26 SULFATE CONCENTRATION AT EACH CONDITION 51
FIGURE 27 RATIO OF SULFATE PRODUCED AND NITRATE/NITRITE REDUCED 52
Page 7
VI
LIST OF TABLES
TABLE 1 TESTED CONDITIONS FOR THE BATCH REACTORS 17
TABLE 2 DILUTION MULTIPLE FOR THE SAMPLES 19
TABLE 3 TESTED CONDITIONS FOR THE CONTINUOUS REACTORS 23
TABLE 4 AMOUNT OF NITRATE AND NITRITE ADDED FOR THE SET INFLUENT CONCENTRATIONS 24
TABLE 5 HRT AND THE CORRESPONDING PUMP SETTINGS FOR THE CONTINUOUS REACTORS 24
TABLE 6 DILUTION MULTIPLE FOR THE SAMPLES 26
Page 8
VII
LIST OF ACRONYMS
A/A/O Anaerobic Anoxic Oxic
A/O Anaerobic Oxic
EPA Environmental Protection Agency
HRT Hydraulic Retention Time
metHb Methaemoglobin
Page 9
1
INTRODUCTION
Nitrogen in the water is one of the primary causes of the eutrophication in the ecosystems
such as lakes, rivers, and ocean waters. Due to the increase of the chemical nutrient, nitrogen in
this case, the primary productivity increases and causes drastic changes in ecosystems. Such
changes include increased toxicity of the system and severe change in biodiversity due to
decreased number of species or invasion of new species. Main cause for the accumulation of
nitrogen is from sewage and industrial productions such as fertilizer, food process, and oil
refinery. Currently, the nitrogen removal in the water system is mainly done through biological
nitrification-denitrification process.
Although nitrification-denitrification process is most widely used as the method of
removing nitrogen, there are a number of problems in the process. The traditional way of
removing nitrogen is done primarily through the heterotrophic bacteria in the denitrification
stage. However, low carbon level is required for nitrification stage to occur. Thus, the traditional
process requires the carbon source, usually methanol, to be added to the treatment process at the
denitrification stage for effective removal of nitrogen. However, as a result of additional carbon
source, there are problems such as increase in the cost and the possibility of carbon source
remaining after the removal of nitrogen.
Besides the heterotrophic denitrification process, there are a number of methods available
to minimize these problems while maximizing the nitrogen removal. One of which is called the
Anaerobic Oxic process that reverses the order of nitrification and denitrification. However,
there are problems of its own when nitrogen removal process is not completely done by
denitrification. Although nitrate is being reduced into nitrite, it is not further being reduced into
Page 10
2
nitrogen gas. Large amount of nitrite remains in the water afterward and it could be very harmful
to human. Furthermore, A/O and Anaerobic Anoxic Oxic processes are not as attractive as an
alternative to the heterotrophic denitrification since the processes are complicated and harder to
control.
The other types of research being conducted for the problems utilize the autotrophic
denitrification process instead of heterotrophic denitrification process in traditional process. This
process provides several advantages. Since autotrophic denitrifying bacteria are being used, there
is no need for external carbon source, which reduces both cost and the risk of carbon
contamination. For the autotrophic denitrification, electron donor, such as elemental sulfur, can
be utilized to improve the denitrification process by ensuring the reduction of nitrate into
nitrogen gas. The change of pH in the system due to denitrification can also be controlled by
adding limestone in the reactors. Overall, the autotrophic denitrification process provides same
outcome but eliminates the problems associated with the heterotrophic denitrification process.
The purpose of this project was to test the feasibility of autotrophic denitrification
process in treating the nitrate-rich water and investigate the effect of running and environmental
conditions on the process. The process utilized the autotrophic anaerobic bacteria and elemental
sulfur to prevent the problems of traditional denitrification stage and reduce cost and energy
consumption. The effect of running conditions, such as hydraulic retention time, flow rate, and
nitrate loading rate were observed by running continuous reactors. The batch test was also done
to analyze the environmental conditions, such as temperature and raw water pH.
Page 11
3
BACKGROUND
NITROGEN IN THE WATER
The increasing contamination of nitrogen in groundwater is becoming a serious problem
in many places. Nitrogen exists as several forms in the soil and groundwater, such as organic
nitrogen, ammonia, nitrate, and nitrite, mainly as the intermediate forms of the nitrogen cycle
occurring in the ecosystem.
Ammonia is one form of nitrogen that exists in the wastewater. In aqueous solution,
ammonia exists as ammonium ion or ammonia depending on the pH of the solution. Chemical
equilibrium reaction determines the form of the ammonia in the water: NH3 + H2O ↔ NH4+ +
OH-. When pH is above 7, the reaction shifts to the left side and the ammonia is predominant.
However, when pH is below 7, the reaction favors the right side and there are more ammonium
ions (Metcalf, 1991). The presence of ammonia in the wastewater is driven mainly from urine
and formed by the enzymatic cleavage of urea by ureases in the sewer system (Jordening and
Winter, 2005).
Nitrite nitrogen in the wastewater is unstable intermediate in the nitrogen cycle and
present in very low concentrations in both wastewater and surface or groundwater. Due to
instability, the nitrite is oxidized easily to the nitrate. Although the concentration of nitrite is
usually very low, it is important to wastewater studies due to the highly toxic nature of nitrite to
most fish and aquatic species (Metcalf, 1991).
Among several forms of nitrogen founds, nitrate is the most highly oxidized form found
in the wastewater. In naturally occurring nitrogen cycle, nitrate is oxidized from ammonia and
nitrite. However, nitrate can also accumulate in wastewater from lightning or fertilizers.
Page 12
4
Compared to other forms of the nitrogen, the high concentration of nitrate has fatal affects,
especially on infants, and needs to be closely watched. Details on effects and regulations will be
discussed further later in this section. Nitrate concentration can be usually determined by
calorimetric methods (Metcalf, 1991).
Figure 1 Nitrogen Cycle (Harrison, 2003)
Figure 1 shows where different forms of nitrogen exist in the ecosystem and how they
convert to intermediate or product in the nitrogen cycle. Nitrogen cycle is one of the important
nutrient cycles in the ecosystem as nitrogen is used to produce many organic molecules and
makes up large amount of air. There are five main processes in the nitrogen cycle to transform
nitrogen in different forms. One of the processes is nitrogen fixation in which nitrogen (N2),
from atmosphere, is converted to ammonia (NH3) through certain bacteria. Once ammonia is
produced by bacteria, it goes through another process called nitrogen uptake where plant,
Page 13
5
bacteria, or another organism will make use of ammonia and produce other organic nitrogen
compounds. Following nitrogen uptake is the nitrogen mineralization process where organic
nitrogen is converted to the form of inorganic nitrogen called ammonium salts (NH4+). In the
nitrification process, the ammonium salt is converted to the nitrate (NO3-). In the denitrification
process, oxidized nitrogen forms, such as nitrate and nitrite (NO2-), are converted to nitrous
oxide (N2O) and further to nitrogen gas (Harrison, 2003; Pidwirny, 2006). These two processes
will be discussed later as they are utilized in treatment method to remove nitrogen from the
contaminated water.
The nitrogen cycle is capable of transforming certain amount of naturally occurring forms
of nitrogen. However, the concentration of nitrogen in water increased in last few decades and
caused many problems in human and ecosystem. The increasing contamination of nitrogen
comes mainly from the anthropogenic sources. Daily people’s life and industrial productions,
such as fertilizers, stockbreeding, food, and oil refinery processes, contribute mainly to the
increasing contamination. Especially, the extensive use of nitrogen in fertilizers and the erosion
of soil from poor planning and management of the resource cause the high concentration of
nitrogen in water (United Nations Environment Programme). Residue from municipal and
industrial waste after the treatment, intensive animal practices, and increasing use of pesticides
also contribute to the increasing nitrate level. In addition, irrigation and drainage can affect the
quality of water and introduce a number of contaminants to water systems (World Health
Organization, 2004). Although the nitrogen cycle can transform nitrate, ammonia, and nitrite into
other forms in the ecosystem, it is not capable of converting extra nitrogen contamination
produced by the anthropogenic sources and thus, causes the accumulation of nitrogen in the
water system.
Page 14
6
Increasing level of nitrogen becomes serious problems once the contamination is carried
away to the drinking water system and ingested by human. One of the most well-known toxic
effects of the nitrate is methaemoglobinaemia, which is also known as “blue baby syndrome.”
When nitrate is ingested by human, it is reduced to nitrite, which can oxidize haemoglobin (Hb)
to methaemoglobin (metHb). As a result, the oxygen transport in the body decreases and can
cause the condition called methaemoglobinaemia when the concentration of metHb increases up
to 10%. Young infants, pregnant women, and people with low levels of metHb reductase or
gastric acidity are more susceptible to metHb than others (World Health Organization, 2006;
World Health Organization, 2007). Thus, in order to ensure safety of drinking water, there are
several limits set by World Health Organization and Environmental Protection Agency.
According to the World Health Organization, the concentration of nitrate and nitrite in the
drinking water should not exceed 50 mg/L and 3 mg/L, respectively, to protect against
methaemoglobinaemia (World Health Organization, 2006). In the United States and many other
countries, the maximum contaminant level for nitrate and nitrite are 10 mg/L and 1 mg/L,
respectively, in the drinking water (Environmental Protection Agency, 2009).
Accumulation of nitrogen contamination in the water system also has detrimental effect
called eutrophication in the ecosystem. As the concentration of nutrient like nitrogen increases,
the growth of microscopic floating plants and algae increase rapidly. Some types of algae, which
grow at high nitrogen level, in lakes and reservoirs release poisonous toxins. Even at minimal
concentration, they can have negative effects on livestock and even on human when ingested as
drinking water in high concentrations. In case of increasing floating plants, the transparency of
water reduces and the recreational value, such as for fishing or boating, of lakes also decreases.
With more plants covering the surface, there are less light available for submerged plants and the
Page 15
7
amount of dead organic matter increases, which can lead to lower oxygen concentrations and
emission of poisonous gases.
Figure 2 Effect of thermocline on the temperature and oxygen in lakes (United Nations Environment Programme)
As one of the results of the eutrophication, the layer called thermocline forms a few
meters below the surface as shown in the Figure 2. The thermocline prevents the mixing between
upper and lower layers, epilimnion and hypolimnion, respectively, and thus causes the change in
vertical oxygen concentration and temperature. In the deep layers of the lake or reservoirs,
oxygen depletion causes the complete deoxygenation or anoxia while high plant production in
shallow lakes causes the deoxygenation of the sediment. Deoxygenation conditions can kill the
certain species fish or invertebrate in the lake of reservoirs while some types of species increase
in number due to available food. As a result, the abundance of nitrogen in the water can reduce
the diversity of species significantly (United Nations Environment Programme).
The effects of the increasing nitrogen contamination are dangerous to human as well to
environment as it threats biodiversity. It is difficult and takes long time to achieve low
concentration of nitrogen in upper sediment layer of water naturally as it tends to remain in the
water. Thus, it is important to reduce or eliminate the nitrogen early in the water system using
water treatment methods.
Page 16
8
THE TRADITIONAL TREATMENT METHODS FOR NITROGEN REMOVAL
As the increasing level of nitrate contamination in water is becoming a prominent
problem in many places, there are a number of treatment methods developed to reduce the level
of nitrate in water. One of the conventional methods for the treatment of nitrate is ion exchange
process, where nitrate ions in the water are exchanged for strong anions, such as chloride or
bicarbonate ion, on the resin bed. However, ion exchange is hard to use due to poor selectivity
and high cost and risk associated with the disposal (Kapoor and Viraraghavan, 1997).
Reverse osmosis is another conventional method for treating the nitrate-rich water. In the
process, water is forced across a semipermeable membrane to leave nitrate and other ionic
species behind. It was proven to be working for full scale but the process does not target the
nitrate in specific. The membrane is subject to fouling, compaction, and deterioration with time
and thus, the process is sensitive to presence of other organic matters. (Kapoor and Viraraghavan,
1997).
Another conventional method for the removal of nitrate from water is electrodialysis. In
the process, direct electric current transfers ions from less concentrated to a concentrated solution
through a membrane. The water is treated by selective removal of ions through a semipermeable
membrane. This process is also disadvantageous that it requires close monitoring and high cost
of maintenance (Kapoor and Viraraghavan, 1997).
Page 17
9
Figure 3 Nitrogen transformation in biological treatment processes (Metcalf, 1991)
One of the most widely used methods for nitrogen removal besides conventional methods
mentioned earlier is the utilization of biological processes. There are two biological methods for
removing nitrogen from the water; assimilation and nitrification-denitrification as shown in
Figure 3 above. During the assimilation, microbes in the process digest ammonia, which will be
returned to the wastewater when cell death and lysis occurs (Metcalf, 1991).
On the other hand, the nitrification-denitrification is the removal process achieved in two
steps. In the denitrification process, two bacteria, Nitrosomas and Nitrobacter, play important
role of oxidizing ammonia to the intermediate product nitrite and converting nitrite to nitrate,
Page 18
10
respectively (Metcalf, 1991). During this step, only the form of nitrogen changes and there is no
removal of nitrogen from the wastewater.
In the second step, denitrification, nitrate is converted to nitrogen gas for removal by
several genera of bacteria, including Achromobacter, Aerobacter, Alcaligenes, Bacillus,
Bervibacterium, Flavobacterium, Lactobacillus, Micrococcus, Proteus, Pseudomonas, and
Spirillum. The bacteria are heterotrophs and conduct conversions from nitrate to nitrite and from
nitrite to other gaseous products, nitric oxide, nitrous oxide, and nitrogen gas (Metcalf, 1991).
Since bacteria play important role in the denitrification process, the temperature and pH of the
system are important parameters in this process. For different bacterial populations, the optimum
pH of the system is between 7.0 and 8.0.
Although the nitrification and denitrification process is being used widely over other
conventional methods due to reliability and effectiveness, there are unavoidable problems
associated with the process. The heterotrophic denitrification process requires adequate amount
of organic carbon as electron donating substrates. As a result, external carbon sources, such as
methanol and ethanol, have to be supplied to efficiently run the process. The problems associated
with this requirement are the high cost and risk of operation and the secondary pollution of a
water system (Moon et al., 2004; Wang and Qu, 2003). The full-scale application of
heterotrophic denitrification had seen a few troubles over bacterial contamination from high cell
yield and the presence of residuals organics can cause biofouling. As a result, the scale-up
process would require well-defined membrane bioreactor system and require extra cost on
operation and maintenance (Sierra-Alvarez et al., 2007).
Page 19
11
There are two advanced wastewater treatment methods, A/O and A/A/O processes, that
were developed as an alternative to denitrification process to remove nitrogen from the
wastewater. These processes aim to remove nitrogen and phosphorus in the wastewater by
biological methods. Thus, it is important to expose the microorganisms to the alternating
anaerobic and aerobic conditions in these processes (Metcalf, 1991).
Figure 4 A/O process (Metcalf, 1991)
A/O process is short for anaerobic stage and oxic stage in the process as shown in the
above Figure. This process is a single-sludge suspended-growth system and has anaerobic and
aerobic stages in sequence. Although the process is used mainly for carbon oxidation and
phosphorus removal from wastewater, it can be adjusted for denitrification by providing enough
detention time in the aerobic stage (Metcalf, 1991).
Figure 5 A/A/O process (Metcalf, 1991)
Page 20
12
As shown in the Figure 5, A/A/O process is a modified form of A/O process with anoxic
zone placed in between anaerobic and aerobic stages for denitrification. The anoxic zone lacks
the amount of dissolved oxygen, but the recycling nitrified mixed liquid from the aerobic section
provides the oxygen in the form of nitrate of nitrite. The detention time of the anoxic zone is
approximately one hour (Metcalf, 1991).
Although A/O and A/A/O processes circumvent problems of the heterotrophic
denitrification process, they have problems and disadvantages of their own. A/O process is
unable to achieve high removal level of nitrogen and phosphorus at the same time. Also the
process control flexibility of the A/O process is limited (Metcalf, 1991). While A/A/O process
works better than A/O process on denitrification stage, the process is more complex (Metcalf,
1991). Under cold weather operating conditions, the performances of both processes are
uncertain and need further improvement.
CURRENT RESEARCHES ON THE AUTOTROPHIC DENITRIFICATION PROCESS
Although there are a number of methods available for the removal of nitrogen in the
water, all of them have problems that prevent the scale-up of the process to real applications. As
the nitrification-denitrification seems the most promising biological methods among others and
the problems arise mainly at the heterotrophic denitrification stage, there are numbers of current
researches going on to investigate the denitrification process utilizing the autotroph. Unlike the
traditional method, the newly researched method of the autotrophic denitrification process makes
use of anaerobic bacteria, thus eliminated the need of external carbon source and the possibility
of secondary pollution of treated water.
In order to enhance the reduction of nitrate to nitrogen gas, the electron donor is required
to run the process efficiently. Thiosulfate can be used as an electron donor in the autotrophic
Page 21
13
denitrification process. While it is soluble in water and can achieve high loading rate, it is much
more expensive than the elemental sulfur (Park et al., 2002). The other possible electron donor
for the autotrophic denitrification is hydrogen gas. However, the hydrogen gas is dangerous and
costly to transport and generate. There are a number of researches involving the electrode-
biofilm reactor, where the hydrogen gas can be utilized by denitrifying microorganisms on the
cathode, to avoid these problems (Wang and Qu, 2003). Besides the risk and the cost of using
hydrogen gas, it also contributes to the microbial reactions, which impede the denitrification
process. Two microbial reactions that were identified are the production of acetate from
acetogenesis and of sulfide from sulfate reduction (Sierra-Alvarez et al., 2007).
Thus, instead of using the hydrogen gas, the elemental sulfur has been chosen as the
reagent in many experiments. The denitrifiers, Thiobacillus denitrificans and Thiomicrospira
denitrificans, can be utilized when sulfur is used to reduce nitrate or nitrite to nitrogen gas, as
presented in the stoichiometric equation below (Zhang and Lampe, 1998):
55𝑆 + 20𝐶𝑂2 + 50𝑁𝑂3− + 38𝐻2𝑂 + 4𝑁𝐻4
+ → 4𝐶5𝐻7𝑂2𝑁 + 25𝑁2 + 55𝑆𝑂42− + 64𝐻+
In addition, elemental sulfur is suitable for denitrification system because it is non-toxic, soluble
in water, and stable under ambient environmental conditions (Moon et al., 2004). As a result, the
elemental sulfur is the one being used mostly as the elemental donor in the researches of
autotrophic denitrification process. In the chemolithotrophic denitrification experiments, the
elemental sulfur was found to be effective as an electron donor for denitrification and showed
increase in the rate of denitrification with increasing surface area (Sierra-Alvarez et al., 2007).
While the elemental sulfur can be utilized as the electron donor and has vital role in
reducing nitrate to nitrogen gas, there is an additional problem of controlling pH during the
Page 22
14
denitrification experiment. During the denitrification, the hydrogen ions, H+, are produced,
which indicates that the alkalinity is consumed by the reaction. As a result, for denitrification
process to work, pH of the reactors has to be maintained to continue the removal of nitrate. One
of the possible alkalinity sources is sodium bicarbonate (NaHCO3). However, it is usually
provided as a powder, which makes the chemical harder to use in the reactor as a packing
material, and is not cost-effective (Moon et al., 2004).
As a result, many researches utilized the limestone for the source of alkalinity in the
autotrophic denitrification process in treating the nitrate-rich water. The limestone was found to
be effective in controlling the pH of the system. In testing of the sulfur and limestone autotrophic
denitrification processes on the pond reactors, the nitrate removal efficiency with the alkalinity
control was higher than the nitrate removal efficiency without the alkalinity control (Flere and
Zhang, 1998). In a permeable reactive barrier system with sulfur and limestone, the limestone
was effective in both neutralizing the hydrogen ions and providing the inorganic carbon source to
the autotrophs (Moon et al., 2004).
The combination of using elemental sulfur as an electron donor and limestone as the
source of alkalinity for the autotrophic denitrification is being studied extensively. In the study of
lab-scale batch reactors for treatment of surface or wastewater, the autotrophic denitrification
was recognized as a possible replacement for the heterotrophic denitrification in pond systems
and the optimum sulfur to limestone ratio was found to be 3:1 (Lampe and Zhang, 1999). The
study of the effect of co-contamination with heavy metals in denitrification was also studied.
While TCE or Cr did not have any effect on the sulfur-based denitrification, Zn and Cu inhibited
the activity by possibly associating with sulfur-oxidizing bacteria or precipitating as metal
sulfide forms (Moon et al., 2006). In the study of continuously fed sulfur packed bed reactors in
Page 23
15
down-flow mode, the nitrate removal efficiency decreased with increasing loading rate and
decreasing alkalinity consumption ratio (Park et al., 2002).
As the autotrophic denitrification is becoming the potential treatment of the nitrate-rich
water, this Major Qualifying Project is aimed to study the effect of environmental and running
conditions on the denitrification process to summarize the optimum conditions for the design and
future applications. Previous studies on the feasibility of utilizing autotrophic denitrification
process showed that there is a variety of parameters affecting the rate and efficiency of the
process. Thus, it is essential to understand the effect of these parameters and apply them in order
to have the optimal result, the best removal of nitrate for the given purpose. The environmental
conditions to be studied are temperature of the system and the pH of the raw water. For the
running conditions, hydraulic retention time, flow rate and the nitrate loading rate will be studied
on the continuous reactors.
Page 24
16
METHODOLOGY
To investigate the feasibility of the autotrophic denitrification for the treatment of nitrate-
rich water and observe the effect of running conditions and environmental conditions, the
experimental set-up and design described in this section were used. This research took place in
the Water Treatment and Membrane Separation Engineering Research Lab at the School of
Environmental Science and Engineering, Shanghai Jiaotong University (SJTU), from October
25th
to December 13th
, 2009.
BATCH REACTORS
Batch reactors were tested in order to examine the effect of environmental conditions,
such as temperature, influent concentration, and pH. The batch tests were done by Professor
Zhou, Sun Ye Jue, Huang Min, Zhang Yue, and me. The batch test included running two batch
reactors, one with nitrate substrate and the other one with nitrite substrate, for certain time period,
and doing sample analysis, such as determining nitrate and nitrite concentration and measuring
amount of nitrogen and oxygen gas.
Reactors were prepared about a week before the test by Professor Zhou. First, 80 g of
limestone and sulfur carrier, 5 ml of bacteria solution, and 50 ml of nitrate or nitrite solution
were added to the test bottles. Then the pHs of the reactors were adjusted to 6.0 or 7.5. Bottles
were placed inside the incubator with temperature of 30°C and hunting speed of 100 rpm. After a
week, little amount of nitrate or nitrite remains in the bottles and the batch test could be done
under different environmental conditions.
Page 25
17
Table 1 Tested conditions for the batch reactors
Substrate: NO3-N Substrate: NO2-N
Temperature Concentration
(mg-N/L)
pH value Temperature Concentration
(mg-N/L)
pH value
28 °C 10 6.0 28 °C 10 6.0
7.5 7.5
40 6.0 40 6.0
70 6.0 70 6.0
7.5 7.5
100 6.0 100 6.0
18 °C 10 6.0 18 °C 10 6.0
40 6.0 40 6.0
70 6.0 70 6.0
100 6.0 100 6.0
7.5 7.5
8 °C 10 6.0 8 °C 10 6.0
40 6.0 40 6.0
7.5 7.5
70 6.0 70 6.0
The table above shows the environmental conditions we tested for the batch reactors.
Three variables we had for testing the effect of environmental conditions were temperature,
substrate concentration, and pH. Substrate concentration and pH of the solution were adjusted
Page 26
18
during the process of preparing the reactors. The environmental temperature was varied by
keeping the bottles in the incubator at set temperature during the testing time period.
The batch tests usually lasted about five to seven hours, to allow enough time for the
completion of the denitrification process in the reactors. Syringe was used to extract the samples
by first injecting 2 ml of air into the reactors and removing same amount of samples from the
reactors to keep the volume of the reactor same. The samples were centrifuged for 10 minutes
after it was taken out of the reactors to remove the sludge and prevent further reaction with the
carrier. Only the liquid water of the samples was kept for the determination of nitrate and nitrite
concentration.
NO3- and NO2- Determination
Concentration of nitrate and nitrite were determined for samples at different times to
determine the nitrate and nitrite removal with time and analyze the effect of temperature and pH
on the removal efficiency. The methods for the determination of nitrate and nitrite measurements
were taken from the “Standard Method for the Examination of Water and Wastewater” by
American Public Health Association.
First, the nitrate working solutions of nitrate and nitrite were made with stock solutions in
order to make standard samples, which will generate the standard curves of nitrate and nitrite.
The concentration of the nitrate stock solution was 100 mg/L and 1:10 dilute were typically used
for the working solution of nitrate. The concentration of the nitrite stock solution was 250 mg/L
and the dilution of nitrite working solution was 1:500.
The standard samples were then made from the working solutions to various
concentrations. For the nitrate standard samples, the concentrations varied from 0 to 6 mg/L with
Page 27
19
the total volume of 10 ml for each sample. To make the nitrate standard samples, the
concentration were from 0 to 0.3 mg/L with total volume of 10 ml. The standard curve was
generated by plotting concentration versus the values obtained from spectrophotometer.
Table 2 Dilution multiple for the samples
Concentration (mg-N/L) Reactor Dilution
NO3-
NO2-
10 NO3-N 10 10
NO2-N 10 100
40 NO3-N 10 10
NO2-N 10 200
70 NO3-N 20 20
NO2-N 20 400
100 NO3-N 20 20
NO2-N 20 400
For each sample, a total volume of 10 ml water sample was made for each measurement,
except the water samples for the nitrate determination of nitrite reactors, which has a total
volume of 9 ml. The dilution multiplication shown on the table above was used for the ratio of
water sample to the distilled water. Since the samples taken from the reactors contained the
carrier and sometimes it was hard to extract samples from the reactors, the amount of liquid
water obtained after centrifugation was less than what was needed to make total volume of 10 ml
in some cases. As a result, for some samples, a less total volume of water samples was made for
the measurement.
Page 28
20
For the determination of the nitrate concentration in the samples, 200 µl of hydrochloric
acid (HCl), and 20 µl of sulphamic acid (H3NSO3) were added to the water samples of 10 ml.
The amount of reagent should be proportional to the volume of water samples. Thus, 9 ml of
water samples for nitrite reactors, 180 µl of hydrochloric acid, and 18 µl of sulphamic acid were
added. The spectrophotometric measurement was made using the UNICO 2802 UV/VIS
spectrophotometer. For the nitrate determination, the multi-wavelength spectrophotometry mode
was used with the wavelengths of 220 nm and 275 nm. The data was recorded and the
concentration of the nitrate in the samples was manipulated using the slope and the intercept of
the nitrate standard curve.
For the determination of the nitrite concentration in the samples, 200 µl of visualization
reagent was added to the 10 ml of water samples. The visualization reagent is toxic and the
gloves need to be worn during the measurement. For the nitrite determination, only one
measurement was taken at the wavelength of 540 nm on the same instrument after 15 minutes of
waiting time for reagent to react.
Gas Analysis
In order to determine the composition of nitrogen and oxygen gas in the reactors, the gas
chromatography was conducted for each reactor on Shimadzu Gas Chromatograph GC-14B.
Once the gas enters the injection port, the different composition of gas travels at different speed
through the column and reaches the detector. Peaks on the graph tell the number of components
of the gas and the percentage of the gas composition by using the area under the curve. From
previous experiments, it is known that the oxygen gas travels faster than the nitrogen gas and the
peak for oxygen should appear before nitrogen on the graph.
Page 29
21
The carrier gas used for the gas chromatography of our experiment was Argon and the
pressure was set to 0.5 MPa. After the gas was turned on, a few minutes were allowed for the
carrier gas to be stabilized. The carrier gas valve was set to 90 and the gas chromatograph was
turned on to the temperature of column at 20, injection port at 20, and the detector at 40 °C,. The
current of the machine was set to 80 mA by increasing 10 mA at a time to avoid any machine
failure.
Once the machine was set up for the gas chromatography, the baseline was stabilized for
30 minutes. Then, the baseline was set to zero and the 0.5 ml of the air was injected using
syringe for calibration. Each sample takes about 10 minutes to generate result, which has two
peaks, one for oxygen gas and the other one for nitrogen gas. Once the air analysis is complete,
the same amount of gas to be analyzed should be injected.
The gas chromatography was done at the end of the batch experiment, after taking the last
samples from the reactors were taken. Since the reactors had carriers inside, it was important to
keep the syringe tip above the water level of the reactors to prevent collecting water into the
syringe.
After data for all the samples were collected, the time and the area of the peaks were
obtained using the off-line analysis program. The machine was also shut down by turning the
current off to 0 mA and all the temperatures to 0 °C. About 5 minutes were allowed for the
chromatograph to cool down to the set temperatures and the machine was turned off after closing
the carrier gas.
Page 30
22
CONTINUOUS REACTORS
To evaluate the effect of the running conditions, such as HRT, flow rate, and the nitrate
loading rate, on the denitrification process, two up-flow reactors, NO3-N reactor (reactor #1) and
NO2-N reactor (reactor #2), were operated continuously for about 50 days. The reactors were
being operated prior to my arrival on the site by Professor Zhou and Sun Ye Jue.
Figure 6 picture of Reactor #1
Figure 7 picture of Reactor #2
Page 31
23
Both reactors were filled with 3 L, the effective volume of media for the reactors. The
media was supplied by a Japanese company and the ratio of sulfur and the limestone in the media
is 1:1.5. Reactors #1 and #2 have the inner diameter of 13.2 cm and 8.8 cm, respectively.
Because rector #1 is old, there is a problem of mass transfer and the reactor needs to be opened
and remixed once in a while to enhance the channel flow.
Table 3 Tested conditions for the continuous reactors
Reactor #1 (NO3-N) Reactor #2 (NO2-N)
Influent Concentration (mg-N/L) HRT (hr) Influent Concentration (mg-N/L) HRT (hr)
10 4 10 4
3 3
2 2
40 4 40 4
3 3
2 2
70 5 70 5
4 4
3 3
The test running conditions are as shown in the Table 3. Similar to the batch test, the
influent concentration tested were 10, 40, and 70 mg-N /L. In addition to the three different
influent concentrations, we varied HRT for each influent concentration to observe the effect of
flow rate on the denitrification process. The effect of these variables on the denitrification
process was observed by changing influent concentration and pump settings.
Page 32
24
Table 4 Amount of nitrate and nitrite added for the set influent concentrations
Reactor #1 (NO3-N) Reactor #2 (NO2-N)
Influent Concentration
(mg-N/L)
NaNO3 (g) added for 80 L Influent Concentration
(mg-N/L)
NaNO2 (g) added for 80 L
10 4.86 10 3.94
40 19.43 40 15.77
70 34.00 70 27.60
Table 4 shows the amount of nitrate and nitrite added for different influent concentrations.
The influents to the reactors were fed from the 80 L water storage tank. The influent
concentration was changed after taking the effluent sample of the day. Although the influent
concentration is changed, the 3 L previously tested influent with different concentration remains
in the reactor. Thus, to avoid the concentration influence, the samples can be taken when it first
burst off on the spot. The other way to avoid the concentration influence is to discard the effluent
and measure the volume after a few hours. Then the volume of the effluent measured on the next
day can be added and the water sample should only consist of treated water at changed influent
concentration.
Table 5 HRT and the corresponding pump settings for the continuous reactors
HRT (hr) Volumetric flow rate (L/d) Pump (rpm)
5 14.4 5.2
4 18 6.8
3 24 9.0
2 36 13.5
Page 33
25
Table 5 shows the corresponding pump settings for each HRT. The pump settings were
also changed after taking water samples of the day. In order to avoid the mixing of effluents at
two different HRTs, the method of taking volumes at two different times were used again as it
was used after changing influent concentration.
In order to observe the effect of the running conditions on the denitrification process, the
100 ml of water samples were taken daily for the determinations of nitrate, nitrite, and sulfate
concentrations. The following data were also taken daily when the water samples were taken:
time, room temperature, volume of the effluent, influent pH, and effluent pH. The water samples
were kept in the refrigerator until the analysis was done. In addition, the gas chromatography
was conducted for the gas inside the reactors once the conditions changed.
NO3- and NO2- Determination
The procedure for the determination of nitrate and nitrite concentration in the effluents of
continuous reactors is the same as the procedure of the batch reactors. Sun Ye Jue and I did
nitrate and nitrite determination of the samples, which were collected daily from effluents of
each reactor, to determine the removal percentage of nitrate and nitrite.
Page 34
26
Table 6 Dilution multiple for the samples
Concentration (mg-N/L) Reactor Dilution
NO3-
NO2-
10 #1 10 10
#2 10 100
40 #1 10 10
#2 10 100
70 #1 20 20
#2 20 200
For the effluent samples from the continuous reactors, the dilution multiplications as
shown on the Table 6 were used. Due to the turbidity of the water samples, the samples were
centrifugated for 10 minutes the measurement. After this pretreatment of the effluent water, the
rest of the steps to determine the nitrate and nitrite concentrations were all same as the ones used
in the batch test.
SO42- Determination
The analysis for the concentration of sulfate production was done only for the continuous
reactors. The level of sulfate concentration becomes a concern if used for the drinking water but
it also gives the efficiency of the denitrification. Thus, Sun Ye Jue and I did the sulfate
determination for one effluent sample from each condition.
First, the standard solutions were made to generate the standard curve with the
concentrations varying from 0 to 200 mg/L. The concentration of the sulfate radical (SO4-)
standard solution was 1 mg/mL. For the sulfate determination, the standard solutions or the
Page 35
27
standard curve do not need to be made every time the measurements are made. However, it needs
to be remade when different set of reagents are used.
To prepare the effluent samples for the spectrophotometric measurement, 5 ml of water
samples and 45 ml distilled water were added to the conical beakers, which had dilution
multiplication of water samples 10. Then 1 ml of hydrochloric acid (HCl) with the concentration
of 2.5 ml/L was added to remove the carbonate (CO32-
) and heated for 4 minutes. Once the
solution was heated, 2.5 ml of barium chromate (BaCrO4) was added, which is converted into
barium sulfate (BaSO4), and released chromate ion (CrO42-
) under acid condition. The solution
was heated for another 4 minutes.
After the solution was heated, the ammonia (NH3·H2O) was added drop by drop until the
color of the solution turned lemon yellow. This is due to the fact that the chromate ion (CrO42-
)
appears yellow under alkaline condition. Once the color of the solution became lemon yellow, 2
more drops were added to the solution. The solution was filtered by qualitative filter paper in 50
mL colorimetric tube. After emptying the solution in the conical beakers, conical beaker and
qualitative filter paper were washed with distilled water for twice or more. The distilled water
was added to the 50 mL mark. For the measurement of sulfate concentration, the wavelength of
420 nm was used and the concentration could be obtained by manipulating data with the slope
and intercept of the standard curve.
Gas Analysis
The procedure for the gas analysis of continuous reactors is the same as the gas
chromatography procedure of the batch reactors. In order to determine the compositions of
nitrogen and oxygen gas in each reactor at each operating conditions, we conducted gas
Page 36
28
chromatography. Usually the analysis was done on the third day after operating condition has
been adjusted, to allow enough time for the reactors to become stabilized to new operating
conditions.
For the continuous reactors, the gas inside the reactors was obtained from the hole of the
hose, which is connected to the reactor at one end and open to the air on the other end. To make
sure that the gas is pure from the reactor, the open end of the hose to the air was blocked before
obtaining the gas. The amount of gas used for the gas chromatography of continuous reactor was
also 0.5 ml.
Page 37
29
RESULTS AND DISCUSSIONS
In this section, data collected from batch and continuous reactors will be presented.
Furthermore, the effects of environmental conditions running conditions on denitrification
process will be analyzed using the collected data.
BATCH REACTORS
Batch reactors were tested to determine the effect of environmental conditions on the
denitrification process. In order to observe the change in denitrification process with varying pH,
temperature, and influent concentration, the concentration of nitrate or nitrite with respect to time
were plotted to observe the rate of nitrate or nitrite removal.
One of the first issues to be observed was whether nitrite is the intermediate of the nitrate
in the denitrification process. The reaction equation of nitrate reduction is (Metcalf, 1991):
𝑁𝑂3− → 𝑁𝑂2
− → 𝑁𝑂 → 𝑁2𝑂 → 𝑁2
Thus, if the denitrification follows this reduction, the concentration of nitrite in the water
samples should increase as the nitrate is being removed. Also according to the study by Park et al.
(2001), the nitrite production increased while nitrate concentration decreased in the batch
experiment with sulfur media as shown in the Figure below.
Page 38
30
Figure 8 Results of batch experiment with nitrate a) NO3-N, b) N2O composition of the gas phase, and c) net N2O
production (Park et al., 2001)
Figure 8 shows the concentration of nitrate and nitrite they observed with varying
influent nitrate concentration. It shows increase in total nitrite concentration and the combination
of nitrate concentration in both gas phase and liquid phase, while a decrease in nitrate
concentration. In addition, the concentration of nitrite produced was correlated with the
concentration of nitrate in the influent.
Page 39
31
Figure 9 Batch reactor: nitrate and nitrite concentration at 10 mg-N/L NO3, 28˚C and pH = 6
Figure 10 Batch reactor: nitrate and nitrite concentration at 100 mg-N/L NO3, 28˚C and pH = 6
The two figures above show the nitrate and nitrite concentraiton change in the batch
reactors during the testing time period. From the figures, we concluded that the nitrite is not the
intermediate of the denitrificiation process. We expected to see the strong peak in nitrite
concentration curve during the testing time period, if nitrite was the intermediate form in the
0
2
4
6
8
10
12
0 50 100 150 200 250 300
Co
nce
ntr
atio
n (
mg/
L)
Time (min)
10 mg-N/L, 28 ºC, pH = 6
NO3
NO2
0
20
40
60
80
100
0 100 200 300 400 500
Co
nce
ntr
atio
n (
mg/
L)
Time (min)
100 mg-N/L, 28 ºC, pH = 6
NO3
NO2
Page 40
32
process since treated nitrate in the water would be converted to nitrite. However, from any of the
data collected, the concentration of nitrite stayed mostly constant without any noticeable peak
while the concentration of nitrate decreased and reached almost complete removal of nitrate in
the water sample. Thus, for this denitrification process, the nitrite is not the intermediate form of
the nitrate in the denitrification process.
Figure 11 Batch reactor: effect of pH at 10 mg-N/L NO2 at 28˚C
Figure 12 Batch reactor: effect of pH at 70 mg-N/L NO3 at 28˚C
y = -0.0394x + 7.8405
y = -0.0375x + 8.8822
0
2
4
6
8
10
12
0 50 100 150 200 250 300
Co
nc.
(m
g/L)
Time (min)
10 mg-N/L NO2 at 28˚C
28C: pH = 6
28C: pH = 7.5
y = -0.1434x + 52.326
y = -0.0787x + 49.642
0
10
20
30
40
50
60
0 50 100 150 200 250 300
Co
nc.
(m
g-N
/L)
Time (min)
70 mg-N/L NO3 at 28˚C
28C: pH = 6
28C: pH = 7.5
Page 41
33
The effect of the pH was tested by running the batch reactors at the same concentration
and temperature with just different pHs, 6.0 and 7.5. The figures above show the concentration
of nitrate in the samples from the reactors when pH is the only variable. From both figures at
substrate concentration of 10 and 70 mg-N/L, it can be noted that the reactor with lower pH
reached the lower concentration of nitrate first. In addition, the trend lines of the plots of the
nitrate concentration were added to check the rates of denitrification at varying pH. At the
substrate concentration of 10 mg-N/L, the reactors with pH of 6.0 and 7.5 had slopes of -0.0375
and -0.0394, respectively. When the substrate concentration was changed to 70 mg-N/L, the
slopes of reactors with pH of 6 and 7.5 were -0.0787 and -0.1434, respectively. The magnitude
of the slopes corresponds to the rate of the nitrate disappearing in the samples. Thus, if the
magnitude of the slope is greater, the reaction or the denitrification process is faster. For both
substrate concentrations, the magnitude of the slope for pH of 6 is greater than the one for pH of
7.5, although it is not as clear when the substrate concentration of 10 mg-N/L. This can be
observed when the susbstrate concentraiton or temperature vaires as shown in the Appendix
Section B, Figures 1 and 2. Thus, it can be concluded that the denitrification process is better and
faster at the acidic pH than the neutral pH.
The stoichiometric equation for the utilization of sulfur in the reduction of ntirate into
nitrite or nitrogen gas is shown again below (Zhang and Lampe, 1998):
55𝑆 + 20𝐶𝑂2 + 50𝑁𝑂3− + 38𝐻2𝑂 + 4𝑁𝐻4
+ → 4𝐶5𝐻7𝑂2𝑁 + 25𝑁2 + 55𝑆𝑂42− + 64𝐻+
Accoring to the stoichiometric equation, the higher pH should be favored for the denitrification
process. Furthermore, the optimal pH of the bacteria are usually between 7.0 and 8.0, which
means pH of 7.5 should have worked better. Zhang and Flere noted the sulfate production in the
Page 42
34
system and looked for the mechanism of the decrease in pH and the increase in sulfate
production. They observed the effect of the sulfur-utilizing, non-denitryfing bacteria called
T.thiooxidans, which favored the acidic pH and caused the pH to decrease. Although the bacteria
is not involved in denitrification process, their experiment showed that the elimination of
T.thiooxidns caused the nitrate removal efficiency to dcrease (Flere and Zhang, 1998). Although
we did not observe the sulfate production or effluent pH of the batch reactors, this could be one
of the factors for the higher nitrogen removal efficiency at the lower pH.
The initial plan of the environmental conditions to be tested included two different pHs
for all substrate concentrations at three temperatures. However, after first few experiments, we
could observe that the trend of varying pH was the same and did not see any deviation. Thus, we
decided that it was not necessary to test all different possibilites for environmental conditions.
We eliminated most of the conditions with pH of 7.5 and only tested pH of 6, which showed
better denitrification process.
Figure 13 Batch reactor: effect of temperature at 70 mg-N/L NO3 at pH = 6
0
10
20
30
40
50
60
70
0 100 200 300 400
Co
nc.
(m
g-N
/L)
Time (min)
70 mg-N/L NO3 at pH = 6
28C
18C
8C
Page 43
35
Figure 14 Batch reactor: effect temperature pH at 10 mg-N/L NO3 at pH = 6
Figures 13 and 14 show the effect of temperature change on the denitrification process.
As shown, the only variable in the plot is the temperature and everything else, such as substrate
concentration, and pH, is constant. Figure 13 shows the effect of temperature when the substrate
concentration is 70 mg-N/L and the pH is 6. It can be observed from the plot that the nitrate
concentration of reactor at temperature of 28 °C decreases more rapidly and reaches lower final
concentration during the same time period when compared to the ones tested at temperature of
18 and 8 °C. The nitrate concentration decreases little at constant rate when the temperature was
18 °C. However, it showed even slower nitrate removal rate when the temperature was 8°C . The
one at substrate concentration of 10 mg-N/L and pH of 6 also show similar behavior. Although
the initial nitrate concentration of the reactors were different, it can be noted that the nitrate
concentration at temperature of 8 °C barely shows any removal. It shows very little removal of
nitrate in the beginning and stays constant for the rest of the time. Thus, from these two figures,
it can be concluded that the denitrifcation process works better at higher temperature than lower
temperature.
0
2
4
6
8
10
12
14
16
0 50 100 150 200 250 300 350
Co
nc.
(m
g/L)
Time (min)
10 mg-N/L NO2 at pH = 6
28C
18C
8C
Page 44
36
Figure 15 Batch reactor: effect temperature pH at 100 mg-N/L NO3 at pH = 6
Figure 15 shows the effect of temperature at substrate concentration of 100 mg-N/L at pH
of 6. This plot shows the effect two varying temperatures on the denitrification process. After
testing the temperature of 18 °C, we observed very little denitirification process happening in the
reactor with almost constant nitrate concentration in the samples. As a result, we concluded that
the testing of the substrate concentration of 100 mg-N/L at even lower temperature, 8 °C, would
not provide us any more useful data and omitted that condition from our initial plan of testing
environmental conditions.
0
20
40
60
80
100
120
0 100 200 300 400 500
Co
nc.
(m
g/L)
Time (min)
100 mg-N/L NO3 at pH = 6
28C
18C
Page 45
37
Figure 16 Batch reactor NO3: effect of influent concentration at 28˚C, pH = 6
Figure 17 Batch reactor NO3: effect of influent concentration at 18˚C, pH = 6
y = -0.0469x + 10.596
y = -0.0998x + 39.128
y = -0.1434x + 52.326
y = -0.1849x + 89.597
0
20
40
60
80
100
0 100 200 300 400 500
Nit
rate
Co
nc.
(m
g/L)
Time (min)
T = 28 °C, pH = 6
10 mg-N/L
40 mg-N/L
70 mg-N/L
100 mg-N/L
y = -0.0293x + 6.7058
y = -0.049x + 42.013
y = -0.0651x + 57.229
y = -0.0144x + 99.504
0
20
40
60
80
100
120
0 100 200 300 400 500
Nit
rate
Co
nc.
(m
g/L)
Time (min)
T = 18 °C, pH = 6
10 mg-N/L
40 mg-N/L
70 mg-N/L
100 mg-N/L
Page 46
38
Figure 18 Batch reactor NO3: effect of influent concentration at 8˚C, pH = 6
The effect of varying influent concentration on the denitrification process can be
observed on three Figures above. Four different influent concentrations were tested at same
temperature and pH. The trend lines were added in order to obtain the slope of the plot at each
condition and compare the rate of the denitrification. At temperature of 28 ºC and pH of 6, it can
be observed that the magnitude of the slope for the influent concentration of 100 mg/L is the
biggest. As the influent concentration decreases, the magnitude of the slope decreases as well.
For the temperature of 18 ºC and pH of 6, the one with the biggest magnitude of slope is at the
influent concentration of 70 mg/L. But we observed that at the influent concentration of 100
mg/L, the denitrification slows down and does not show effective removal rate. The magnitude
of the slope also decreases with decreasing influent concentration when temperatures are 18 and
8 ºC. Although higher influent concentration takes longer time to completely remove the nitrate
or nitrite, the rate of the removal is actually faster at the higher influent concentration than in the
lower concentration.
y = -0.0211x + 9.8905
y = -0.0208x + 29.916
y = -0.0349x + 61.741
0
20
40
60
80
0 100 200 300 400
Nit
rate
Co
nc.
(m
g/L)
Time (min)
T = 8 °C, pH = 6
10 mg-N/L
40 mg-N/L
70 mg-N/L
Page 47
39
The results for the gas analysis are presented in the Appendix Section B, Table 3 of the
report. Since nitrate and nitrite in water are being converted to the nitrogen gas in the
denitrification process, the increase in the percentage of nitrogen gas should indicate that the
treatment is faster and better. The gas chromatography results correlated with our observation on
the effect of change in water pH, room temperature, and the substrate concentration; i.e. higher
composition of nitrogen gas in the reactors at lower pHs. However, besides checking the
denitrification process, there is not much to be analyzed from the gas chromatography data and it
can be found in the Appendix.
Page 48
40
CONTINUOUS REACTORS
The continuous reactors were tested in order to observe the effect of running conditions
on the denitrification process. The nitrogen removal percentage was plotted at varying HRT,
flow rate, and loading rate. The results of the sulfate determination and the gas analysis were also
analyzed to determine how well the denitrification process works.
Figure 19 Removal % at influent concentration of 10 mg-N/L and varying HRT
0102030405060708090100
0
1
2
3
4
5
0 5 10 15N
re
mo
val (
%)
HR
T (h
r)
Elapsed time (days)
Inf. NO3-N: 10mg-N/L
HRT
Removal
0102030405060708090100
0
1
2
3
4
5
0 5 10 15
N r
em
ova
l (%
)
HR
T (h
r)
Elapsed time (days)
Inf. NO2-N: 10mg-N/L
HRT
Removal
Page 49
41
Two plots above show the percentage of nitrogen removal for influent concentration of
10 mg-N/L of two reactors at varying HRT. For both reactors, the percentage of nitrogen
removal decreases with decreasing HRT. For reactor #1, the percentage of nitrogen removal was
around 80% for HRT of 4, but it dropped to 20 ~ 30% when HRT was 2. For reactor #2, the
decrease in the percentage of nitrogen removal was not as observable when the HRT dropped to
3 from 4, but in general, it decreases with decrease in HRT.
Figure 20 Removal % at influent concentration of 40 mg-N/L and varying HRT
0102030405060708090100
0
1
2
3
4
5
11 16 21 26
N r
em
ova
l (%
)
HR
T (h
r)
Elapsed time (days)
Inf. NO3-N: 40mg-N/L
HRT
Removal
0
10
20
30
40
50
60
70
80
90
100
0
1
2
3
4
5
11 16 21 26
N r
em
ova
l (%
)
HR
T (h
r)
Elapsed time (days)
Inf. NO2-N: 40mg-N/L
HRT
Removal
Page 50
42
For varying HRT at the influent concentration of 40 mg-N/L, similar behavior can be
observed. Reactor #1 has experienced the problem of mass transfer as mentioned in the
background when we were testing the HRT of 4. The reactor was opened after testing HRT of 4
to remix the media and enhance the channel flow. Thus, the result from the time period when
HRT was 4 is probably not accurate and can be eliminated for analysis. However, the data for
HRT of 3 and 2 still show the same behavior of decrease in percentage of nitrogen removal with
decreasing HRT. In reactor #2, the decrease is observable as it drops to 20% at HRT of 2 from
almost 90% at HRT of 4.
Page 51
43
Figure 21 Removal % at influent concentration of 70 mg-N/L and varying HRT
The plots for the influent concentration of 70 mg-N/L are shown on the Figure above. For
the influent concentration of 10 and 40 mg-N/L, we tested HRT of 4, 3, and 2. However, for the
influent concentration of 70 mg-N/L, we tested HRT of 5, 4, and 3. The percentage of nitrogen
removal is around 20 % for both reactors. While the data from influent concentration of 10 or 40
mg-N/L showed decrease in the percentage of nitrogen removal with decreasing HRT, the
percentage of nitrogen removal is almost constant for the influent concentration of 70 mg-N/L,
0102030405060708090100
0
1
2
3
4
5
6
24 29 34 39
N r
em
ova
l (%
)
HR
T (h
r)
Elapsed time (days)
Inf. NO3-N: 70mg-N/L
HRT
Removal
0102030405060708090100
0
1
2
3
4
5
6
24 29 34 39
N r
em
ova
l (%
)
HR
T (h
r)
Elapsed time (days)
Inf. NO2-N: 70mg-N/L
HRT
Removal
Page 52
44
with no noticeable trend. For both reactors, the percentage of nitrogen removal is almost constant
at HRT of 5 and 4, and there is little decrease as HRT was changed to 3.
Although the data from influent concentration of 70 mg-N/L did not show exactly the
same trend as the other two, probably due to the cold weather, it can be concluded that the
percentage of nitrogen removal increases with HRT. Also, the flow rate increases with
decreasing HRT, as set by the pump, thus, the increase in flow rate causes the decrease in the
percentage of nitrogen removal. The nitrate or nitrite loading rate is the function of influent
concentration and flow rate. Thus, the loading rate increases with decreasing HRT at the constant
influent concentration, which means the increasing loading rate causes the percentage of nitrogen
removal to drop as well. At constant HRT, the loading rate also increases with increasing
influent concentration. When the percentage of nitrogen removal is compared at the same HRT
for three influent concentrations, it can be observed that the percentage of removal decreases
with increasing influent concentration.
Initially, our plan for the influent concentrations of continuous reactors was 10, 40, 70,
and 100 mg-N/L, same conditions as tested in batch reactors. However, after the batch test of
100 mg-N/L at the temperature of 18 ˚C, we concluded that the concentration of 100 mg-N/L
will not show any removal in nitrogen below that temperature.
Page 53
45
Figure 22 Running conditions of continuous reactors
As shown in Figure 22, the room temperature of the laboratory dropped below 15 ˚C in
November and December, about 20 days after we began running the two continuous reactors.
Because we initially planned to test the influent concentration of 100 mg-N/L between days 37
and 48, we were aware that the denitrification process would not work well from the result of
batch test. Thus, we have eliminated the testing condition of influent concentration at 100 mg-
N/L. Rather, we decided to do additional testing of the influent concentration of 10 mg-N/L
again during the allotted time to observe the effect of both the environmental and running
conditions.
0
1
2
3
4
5
6
0
5
10
15
20
25
30
0 10 20 30 40 50
HR
T (h
r)
Ro
om
T (
C)
Time (days)
Running Conditions
Room T
HRT
Page 54
46
Figure 23 Comparison of room temperatures at influent concentration = 10 mg/L
Figure 23 shows environmental and running conditions when the influent concentration
of 10 mg-N/L was tested on continuous reactors. Same HRT was tested while the change in
room temperature shows the difference in two time period as mentioned earlier. The room
temperature was above 20 ºC when the condition was first tested, while the room temperature
was below 15 ºC during the second time. From the batch test, we have observed the slower and
less efficient denitrification process at the lower temperature. Although we are not testing the
rate of the denitrification process, we expected to see less efficiency when we tested 10 mg-N/L
again on the continuous reactors.
0
1
2
3
4
5
0
5
10
15
20
25
30
0.00 5.00 10.00 15.00
HR
T (h
r)
Ro
om
T (
C)
Time (days)
Room T at Inf. Conc = 10 mg/L
Inf. Conc = 10 mg/L (1)
Inf. Conc = 10 mg/L (2)
HRT
Page 55
47
Figure 24 Comparison of nitrogen removal at 10 mg-N/L
Two plots in Figure 24 compare the percentage of nitrogen removal for the influent
concentration of 10 mg-N/L on two reactors tested at two different time periods. Removal 1 is
from the first time we tested the influent concentration of 10 mg-N/L and is the same as ones
shown before. Removal 2 is from the second time and shows very different trend for the
percentage of nitrogen removal compared to the other ones. In general, the percentage of
0102030405060708090100
0
1
2
3
4
5
0 5 10 15
N r
em
ova
l (%
)
HR
T (h
r)
Elapsed time (days)
NO3-N: Removal % at C=10mg-N/L
HRT
Removal 1
Removal 2
0102030405060708090100
0
1
2
3
4
5
0 5 10 15
N r
em
ova
l (%
)
HR
T (h
r)
Elapsed time (days)
NO2-N: Removal % at C=10mg-N/L
HRT
Removal 1
Removal 2
Page 56
48
nitrogen removal stays constant around 40 % for both reactors and has the highest removal
percentage on the third and fourth day when HRT is 3. As mentioned earlier, the reactor #1 has
the problem of mass transfer and was remixed on the third day with HRT of 3. The improvement
in the percentage of nitrate removal or the unexpected result from reactor #1 can be explained by
the effect of remixing or the poor mass transfer of reactor #1. Although not all of the result
matched our predictions, generally the percentage of the nitrogen removal from the first time,
when the room temperature was higher, is better than the second time.
Furthermore, based on the percentage of nitrogen removal data from the second run, it
can be observed that the denitrification process slowed down and did not work as well at cold
temperature. This could be probably due to the fact that the microorganisms for the
denitrification process are less active at colder temperature. The percentage of nitrogen removal
was around 40 %, but it could also drop lower than that if the influent concentration was higher.
Since the reactors are still showing some percentage of nitrogen removal, the bacteria can
probably survive the cold weather but not able to perform the denitrification at full capacity,
which might return once the temperature rises. As a result, the use of reactors might be limited to
the certain temperature range, depending on the microorganisms’ capability of reducing the
nitrate or nitrite at colder temperature.
Other daily collected data include the influent and effluent pH and the volume of the
effluent. Influent and effluent pHs were determined using the pH indicator test papers. However,
it stayed mostly constant around 6.0 as shown in the Appendix Section A, Table 1 and 2. Also
because the pH indicator test papers did not give precise measurement of pH, it was done daily to
make sure that there is no bizarre change to the each stream and the reactor. The volume of the
effluent stream was also measured daily to calculate the flow rate, which can be used for
Page 57
49
obtaining HRT and the nitrogen loading rate. There is no need for the further analysis of these
data but it is presented in the Appendix Section A, Tables 1 and 2 for reference.
79.61 79.69 79.82 78.92 78.79 79.2479.79 78.76 79.32 79.46 78.86 79.50
50
60
70
80
90
100
5 4 3 2
Pe
rce
nta
ge
HRT (hr)
Gas Analysis: NO3-N
N2 10 mg/L (1)
N2 10 mg/L (2)
N2 40 mg/L
N2 70 mg/L
92.89 92.65 94.06
79.1385.13 84.82
90.96
82.27 83.33
93.87 90.85 88.82
50
60
70
80
90
100
5 4 3 2
Pe
rce
nta
ge
HRT (hr)
Gas Analysis: NO2-N
N2 10 mg/L (1)
N2 10 mg/L (2)
N2 40 mg/L
N2 70 mg/L
Figure 25 Percentage of nitrogen gas from gas analysis at each condition
According to the equation for the nitrate reduction, the final product of the denitrification
process is the nitrogen gas. Thus, we have determined the composition of the gas in the reactors
for each condition by the gas chromatography as shown in the Figure above. From gas
chromatography, we observed the peaks for nitrogen gas and oxygen gas. The higher percentage
of nitrogen gas in the reactor should mean that the denitrification process is working better and
the more efficiently since more nitrogen gas would be produced if more nitrate or nitrite is
Page 58
50
reduced. The data from reactor #1 show do not show variation in the percentage of nitrogen for
each condition and have values around 79%, which is a little above the composition of nitrogen
gas in the air. The data from reactor #1 is probably not as accurate as data from reactor #2 as
reactor #1 is old and the air-tightness is not as good. Thus, the mix of air and the effluent gas
stream is probably possible in reactor #1 and the data from reactor #1 can be ignored in the
analysis of gas chromatography data.
From reactor #2 data, we can observe the similar trend for the efficiency of the
denitrification process to what has been observed earlier by concentration of nitrate and nitrite
concentration in the effluent stream; the percentage of nitrogen gas generally decreases as HRT
decreases. The composition of the nitrogen gas is above 80 % for most conditions tested and
indicates that the denitrification process is working. The composition of the nitrogen gas shows
similar trend to the percentage of nitrogen removal but the compositions at varying
concentrations do not necessarily indicate the efficiency of the denitrification process. The
percentage of nitrogen removal is around 30 % for all conditions at influent concentration of 70
mg/L. However, the compositions of nitrogen gas for influent concentration of 70 mg/L are
higher than the one at influent concentration of 40 mg/L, which generally had higher percentage
of nitrogen removal. The composition of nitrogen gas depends on the amount of nitrate or nitrite
being removed. Thus, even if the percentage of nitrogen removal is lower at 70 mg/L, the
composition of nitrogen gas is similar to ones at 10 mg/L because the amount of nitrate or nitrite
removed is about same as shown in the data in the Appendix Section A, Table 1 and 2, and
Section B, Table 2.
Page 59
51
251.67 214.63
177.59
260.93 268.33
522.04
312.78342.41
247.96
303.52 307.22 292.41
150
230
310
390
470
5 4 3 2
Su
lfa
te
C (
mg
/L
)
HRT (hr)
Sulfate Conc.: NO3-N
N2 10 mg/L (1)
N2 10 mg/L (2)
N2 40 mg/L
N2 70 mg/L
333.15
277.59
179.44
457.22
286.85
455.37
292.41
240.56210.93
281.30
218.33190.56
150
230
310
390
470
5 4 3 2
Su
lfa
te
C (
mg
/L
)
HRT (hr)
Sulfate Conc.: NO2-N
N2 10 mg/L (1)
N2 10 mg/L (2)
N2 40 mg/L
N2 70 mg/L
Figure 26 Sulfate concentration at each condition
Sulfur in the denitrification process is oxidized into sulfate in the effluent. Although
sulfate is not a primary pollutant if discharged into environment, too much sulfate production in
the effluent stream might be a concern. Under anaerobic conditions, the sulfate reducing bacteria
can reduce the sulfate further into sulfide or hazardous hydrogen sulfide, which may cause the
corrosion of metals.
For the continuous reactors, the concentrations of sulfate produced in the effluent stream
were determined as shown in the Figure above. The level of sulfate production should be taken
Page 60
52
into account when the treatment is for the drinking water. For the drinking water in the U.S.,
there is a limit on the sulfate concentration of 250 mg/L set by EPA (Environmental Protection
Agency, 2006). With this restriction, some of the conditions, such as ones at the influent
concentration of 70 mg/L or HRT of 4, cannot be used if the treatment is for the drinking water.
Although the sulfate concentration in the effluent stream needs to be taken into account in the
treatment of drinking water, it should not cause any problem if used for the discharge.
Figure 27 Ratio of sulfate produced and nitrate/nitrite reduced
y = 5.6254x + 2.0179R² = 0.773
0
1
2
3
4
0 0.05 0.1 0.15 0.2 0.25 0.3
Mo
le o
f Su
lfu
r p
rod
uce
d (
mm
ol/
L)
Mole of Nitrogen removed (mmol/L)
S/N ratio: NO3-N
y = 1.6334x + 2.4571R² = 0.8947
0
1
2
3
4
0 0.1 0.2 0.3 0.4 0.5 0.6 0.7 0.8
Mo
le o
f Su
lfu
r p
rod
uce
d (
mm
ol/
L)
Mole of Nitrogen removed (mmol/L)
S/N ratio: NO2-N
Page 61
53
As mentioned in the background, the amount of sulfate produced in the effluent stream
should correlate with the efficiency of the nitrate removal in the denitrification process. Figure
27 shows the correlation betweemole of sulfate produced to the mole of nitrate or nitrite reduced
from the denitrification process. In order to reduce one mole of the nitrate or nitrite, certain
number of moles of sulfur needs to be oxidized into sulfate. From the figure, it can be observed
that the moles of sulfate produced increases with moles of nitrate or nitrite reduced, as indicated
by the positive slope of the plot. Also the intercept, where there is no nitrogen removal,
corresponds to the moles of sulfur consumed by dissolved oxygen. The intercept of the reactor
#1 data and reactor #2 is approximately 2.02 and 2.46 mole of sulfur consumed by dissolved
oxygen, respectively. The higher slope for the reactor #1 indicates that the more moles of sulfur
are required for the removal of one mole of nitrate compared to the removal of one mole of
nitrite. Since nitrite is the reduced form of nitrate, it should make sense to have less mole of
sulfur required for the removal.
Page 62
54
CONCLUSIONS
The objectives of this project are to test the feasibility of sulfur-based autotrophic
denitrification process and observe the effects of environmental and running conditions to
summarize the optimum conditions. From the experiments on batch and continuous reactors, it
can be concluded that the autotrophic process using the elemental sulfur and limestone is feasible
for the treatment of nitrate-rich water. Test on the various environmental and running conditions
showed some limitations to the use of the denitrification process.
In the batch reactors, the changes in the denitrification process at varying environmental
conditions were tested. The acidic pH, 6.0, showed better nitrogen removal than at the neutral
pH, 7.5. Also the denitrification slowed down as the temperature decreased from 28 °C to 8 °C.
It was further proved by the experiment on the continuous reactors that the percentage of
nitrogen removal decreased a significant amount when the room temperature was below 15 °C,
which might cause the bacteria to become less active. The result of testing the various influent
concentrations under same conditions showed that the denitrification process was faster at higher
concentration as suggested by the slope of the trend line. However, the faster denitrification
process did not guarantee the complete removal of the nitrate or nitrite.
The effects of the running conditions on the denitrification process were observed on the
up-flow continuous reactors. For all influent concentrations, the percentage of nitrogen removal
decreased with the decrease in HRT, which meant the increase in the loading rate. Although
when the influent concentration was 70 mg/L, none of the HRT seemed to work better than the
other, at 10 and 40 mg/L, the denitrification process worked better at HRT of 4 and 3 than at 2.
The percentage of nitrogen removal also decreased as the influent concentration increased while
HRT was constant.
Page 63
55
The result of the gas chromatography from continuous reactors corresponded to the trend
observed in the nitrate and nitrite concentration of the effluent stream. Although the trend in the
composition of nitrogen gas corresponded to the trend observed, the composition of nitrogen in
the reactor gas correlated to the actual amount of nitrate or nitrite removed from water. The
determination of the concentrate of sulfate in the effluent stream also showed similar trend since
sulfur is oxidized to sulfate while nitrate or nitrite is reduced to the nitrogen gas. However, the
concentration of sulfate raised the concern over using the process for the treatment of drinking
water since the restriction of sulfate concentration on the drinking water is 250 mg/L.
In conclusion, the sulfur-based autotrophic denitrification process was feasible. The
optimum environmental conditions would be an acidic pH and temperature above 15 °C. For the
running condition, the denitrification process worked better when HRT was above 3. The process
was not capable of showing great denitrification capacity when the influent concentration was
above 70 mg/L despite the faster kinetics. Also the process is feasible if used for discharge, but
not for drinking water since for most conditions the sulfate level is higher than maximum
concentration allowed.
Page 64
56
REFERENCE
Environmental Protection Agency (2009). “Basic Information about Nitrate in Drinking
Water.” Drinking Water contaminants. February 17, 2010
<http://www.epa.gov/safewater/contaminants/basicinformation/nitrate.html>.
Environmental Protection Agency (2009). “Basic Information about Nitrite (Measured as
Nitrogen) in Drinking Water.” Drinking Water contaminants. February 17, 2010
<http://www.epa.gov/safewater/contaminants/basicinformation/nitrite.html>.
Environmental Protection Agency (2006). “Sulfate in Drinking Water.” Drinking Water
Contaminants. February 17, 2010
<http://www.epa.gov/safewater/contaminants/unregulated/sulfate.html>.
Flere J.M., Zhang T.C., Sulfur-based autotrophic denitrification pond systems for in-situ
remediation of nitrate-contaminated surface water. Water Science and Technology, 38 (1), 15-
22, 1998.
Harrison, John A. "The Nitrogen Cycle: Of Microbes and Men," Visionlearning Vol.
EAS-2 (4), 2003. <http://www.visionlearning.com/library/module_viewer.php?mid=98>.
Jordening and Winter, Environmental Biotechnology: Concepts and Applications.
Weinheim and Wiley, 2005.
Kapoor, A., Viraraghavan, T., Nitrate removal from drinking water-review. J. Environm.
Eng.-ASCE 123, 371-380, 1997.
Page 65
57
Koenig A., Liu L.H., Use of limestone for pH control in autotrophic denitrification:
continuous flow experiments in pilot-scale packed bed reactors. Journal of Biotechnology, 99
(2), 161-171, 2002.
Metcalf and Eddy, Wastewater Engineering: Treatment, Disposal and Reuse. McGraw-
Hill, New York. 3rd
edition, 1991.
Moon H.S., Chang S.W., Nam K., Choe J., Kim J.Y., Effect of reactive media
composition and co-contaminants on sulfur-based autotrophic denitrification. Environmental
Pollution, 144, 802-807, 2006.
Moon H.S., Ahn K.H., Lee S., Nam K., Kim J. Y., Use of autotrophic sulfur-oxidizers to
remove nitrate from bank filtrate in a permeable reactive barrier system. Environmental
Pollution, 129, 499-507, 2004.
Park J.H., Shin H.S., Lee I.S., Bae J.H., Denitrification of high NO3--N containing
wastewater using elemental sulfur; nitrogen loading rate and N2O production. Environmental
Technology, 23 (1), 53–65, 2002.
Pidwirny, M. (2006). "The Nitrogen Cycle." Fundamentals of Physical Geography, 2nd
Edition. Oct. 8, 2009. <http://www.physicalgeography.net/fundamentals/9s.html>.
Sierra-Alvarez R., Beristain-Car doso R., Salazar M., Gómez J., Razo-Flores E., Field
J.A., Chemolithotrophic denitrification with elemental sulfur for groundwater treatment. Water
Research, 41, 1253-1262, 2007.
“Standard Methods for the Examination of Water and Wastewater,” 21st edition.
American Public Health Association, 2005. 4-118 – 4-129.
Page 66
58
United Nations Environment Programme. “Water Quality: The Impact of
Eutrophication,” Lakes and Reservoirs vol.3. February 17, 2010
<http://www.unep.or.jp/ietc/publications/short_series/lakereservoirs-3/3.asp>.
Wang H., Qu J., Combined bioelectrochemical and sulfur autotrophic denitrification for
drinking water treatment. Water Research, 37, 3767-3775, 2003.
Winto E.F. Nitrate in drinking water. J Am Water Works Assoc., 63, 95–104, 1997.
World Health Organization. (2004). “5. Chemicals from agricultural activities,” February
17, 2010 <http://www.who.int/water_sanitation_health/dwq/cmp130704chap5.pdf>.
World Health Organization. (2006). “Guidelines for Drinking-water Quality,” February
17, 2010 <http://www.who.int/water_sanitation_health/dwq/gdwq0506.pdf>.
World Health Organization. (2007). “Nitrate and nitrite in drinking-water,” February 17,
2010 <http://www.who.int/water_sanitation_health/dwq/chemicals/nitratenitrite2ndadd.pdf>.
Zhang T.C., Lampe D.G., Sulfur:limestone autotrophic denitrification processes for
treatment of nitrate-contaminated water: batch experiments. Water Research, 33 (3), 599-608,
1999.
Page 67
59
APPENDIX
APPENDIX A: RAW DATA
Table 1. Continuous Reactor #1
Date Time V (L) Inf.
pH
Eff.
pH
Flow rate
(L/d)
HRT(h) N-in
(mg/l)
Loading Rate
(kg·N/m3·d)
V-up
(m/h)
Eff. NO3-
N (mg/L)
Eff. NO2-
N (mg/L)
09/10/27 8:40 16.7 6.1 6.1 17.04 4.2 10 0.06 1.25 1.83 0.67
09/10/28 9:58 18.9 6.1 6.1 17.93 4.0 10 0.06 1.31 1.63 0.73
09/10/29 7:47 15.7 6.1 6.1 17.27 4.2 10 0.06 1.26 1.98 0.79
09/10/30 8:22 17.7 6.1 6.1 17.28 4.2 10 0.06 1.26 2.38 0.88
09/10/31 9:03 24.8 6.0 6.1 24.11 3.0 10 0.08 1.76 2.85 0.97
09/11/01 9:38 24.3 6.0 6.1 23.72 3.0 10 0.08 1.73 3.17 0.82
09/11/02 9:17 22.9 6.0 6.1 23.24 3.1 10 0.08 1.70 4.95 0.81
09/11/03 8:33 22.9 6.0 6.1 23.62 3.0 10 0.08 1.73 5.35 0.86
09/11/04 9:28 36.7 6.0 6.1 35.35 2.0 10 0.12 2.58 6.85 1.01
09/11/05 9:02 35.1 6.0 6.1 35.75 2.0 10 0.12 2.61 7.33 0.68
09/11/06 11:31 39.2 6.0 6.1 35.52 2.0 10 0.12 2.60 7.17 0.66
09/11/07 8:39 31.4 6.0 6.1 35.66 2.0 10 0.12 2.61 7.21 0.64
09/11/08 8:27 18.3 6.0 6.1 18.45 3.9 40 0.25 1.35 27.93 2.81
09/1/09 18:12 24.8 6.0 6.1 17.64 4.1 40 0.24 1.29 26.94 3.30
09/11/10 8:09 9.8 6.0 6.1 16.86 4.3 40 0.22 1.23 28.52 1.91
09/11/11 20:02 26.6 6.0 6.1 17.79 4.0 40 0.24 1.30 33.14 1.55
Page 68
60
09/11/12 10:03 14.25 6.0 6.1 24.40 3.0 40 0.33 1.78 19.70 4.34
09/11/13 11:35 23.9 6.0 6.1 22.46 3.2 40 0.30 1.64 21.39 2.80
09/11/14 8:55 20.1 6.0 6.0 22.61 3.2 40 0.30 1.65 24.37 2.50
09/11/15 11:30 25.8 6.0 6.1 23.29 3.1 40 0.31 1.70 26.86 2.46
09/11/16 9:25 32.4 6.0 6.1 35.48 2.0 40 0.47 2.59 30.84 3.06
09/11/17 12:25 38.2 6.0 6.1 33.96 2.1 40 0.45 2.48 32.39 2.07
09/11/18 8:38 29.4 6.0 6.1 34.90 2.1 40 0.47 2.55 35.18 1.88
09-11-19 13:03 39.7 6.0 6.0 33.53 2.1 40 0.45 2.45 35.59 1.77
09/11/20 11:27 12.3 6.0 6.1 13.18 5.5 70 0.31 0.96 56.02 4.29
09/11/21 8:42 11.6 6.0 6.1 13.10 5.5 70 0.31 0.96 58.56 3.92
09/11/22 14:19 16.5 6.0 6.1 13.37 5.4 70 0.31 0.98 57.82 3.76
09/11/23 10:52 11.7 6.0 6.1 13.66 5.3 70 0.32 1.00 53.80 3.81
09/11/24 11:02 17.1 6.0 6.1 16.98 4.2 70 0.40 1.24 57.81 3.75
09/11/25 11:22 17.6 6.0 6.1 17.36 4.1 70 0.41 1.27 57.57 3.75
09/11/26 9:38 15.8 6.0 6.1 17.03 4.2 70 0.40 1.25 54.29 4.01
09/11/27 10:23 19.3 6.0 6.1 18.72 3.8 70 0.44 1.37 50.69 4.33
09/11/28 11:52 24.8 6.0 6.1 23.36 3.1 70 0.54 1.71 58.06 4.55
09/11/29 10:11 21.9 6.0 6.1 23.55 3.1 70 0.55 1.72 58.63 4.54
09/11/30 8:36 21.6 6.0 6.1 23.13 3.1 70 0.54 1.69 59.12 4.01
09/12/01 11:04 25.4 6.0 6.1 23.03 3.1 70 0.54 1.68 62.41 4.35
09/12/02 11:42 18.1 6.0 6.0 17.63 4.1 10 0.06 1.29 9.65 2.13
Page 69
61
09/12/03 17:52 22.8 6.0 6.0 18.14 4.0 10 0.06 1.33 6.71 1.93
09/12/04 10:50 12.7 6.0 6.0 17.96 4.0 10 0.06 1.31 6.06 1.99
09/12/05 8:29 16.7 6.0 6.1 18.51 3.9 10 0.06 1.35 5.76 2.38
09/12/06 8:29 24.5 6.0 5.9 24.50 2.9 10 0.08 1.79 6.24 2.91
09/12/07 9:24 23.0 6.0 6.0 22.15 3.3 10 0.07 1.62 5.68 3.28
09/12/08 8:29 21.7 6.0 6.1 22.56 3.2 10 0.08 1.65 4.68 3.49
09/12/09 11:28 27.0 6.0 6.0 24.01 3.0 10 0.08 1.76 3.34 3.43
09/12/10 9:03 33.2 6.0 6.0 36.92 2.0 10 0.12 2.70 5.74 2.89
09/12/11 11:14 38.9 6.0 6.1 35.66 2.0 10 0.12 2.61 6.50 2.70
09/12/12 8:22 32.7 6.0 6.0 37.14 1.9 10 0.12 2.72 6.66 2.54
09/12/13 8:59 36.6 6.0 6.1 35.68 2.0 10 0.12 2.61 6.22 2.34
Table 2. Continuous Reactor #2
Date Time V (L) Inf.
pH
Eff.
pH
Flow rate
(L/d)
HRT(h) N-in
(mg/l)
Loading Rate
(kg·N/m3·d)
V-up
(m/h)
Eff. NO3-
N (mg/L)
Eff. NO2-
N (mg/L)
09/10/27 8:40 16.7 6.1 6.1 17.04 4.2 10 0.06 1.25 0.07 0.45
09/10/28 9:58 18.9 6.1 6.1 17.93 4.0 10 0.06 1.31 1.14 0.13
09/10/29 7:47 15.7 6.1 6.1 17.27 4.2 10 0.06 1.26 1.52 0.00
09/10/30 8:22 17.7 6.1 6.1 17.28 4.2 10 0.06 1.26 0.15 0.18
09/10/31 9:03 24.2 6.0 6.1 23.53 3.1 10 0.08 1.72 0.39 0.07
09/11/01 9:25 24.1 6.0 6.1 23.74 3.0 10 0.08 1.74 0.55 0.14
09/11/02 9:12 22.7 6.0 6.1 22.91 3.1 10 0.08 1.67 0.71 0.18
Page 70
62
09/11/03 8:40 22.0 6.0 6.0 22.50 3.2 10 0.08 1.64 0.47 0.69
09/11/04 9:15 35.8 6.0 6.1 34.95 2.1 10 0.12 2.56 0.30 2.67
09/11/05 8:40 33.7 6.0 6.1 34.54 2.1 10 0.12 2.53 0.34 2.35
09/11/06 11:40 39.0 6.0 6.1 34.67 2.1 10 0.12 2.53 0.22 1.24
09/11/07 9:02 30.7 6.0 6.1 34.48 2.1 10 0.11 2.52 0.15 1.38
09/11/08 8:31 18.2 6.0 6.1 18.60 3.9 10 0.06 1.36 -0.09 5.03
09/1/09 18:06 23.2 6.0 6.1 16.58 4.3 40 0.22 1.21 0.15 3.22
09/11/10 10:50 12.6 6.0 6.1 18.07 4.0 40 0.24 1.32 -0.29 3.92
09/11/11 12:40 18.7 6.0 6.1 17.37 4.1 40 0.23 1.27 0.19 5.14
09/11/12 10:15 21.7 6.0 6.1 24.13 3.0 40 0.32 1.76 0.63 10.25
09/11/13 11:40 24.1 6.0 6.1 22.76 3.2 40 0.30 1.66 0.63 13.05
09/11/14 9:00 20.2 6.0 6.1 22.73 3.2 40 0.30 1.66 1.31 9.29
09/11/15 11:36 24.4 6.0 6.1 22.02 3.3 40 0.29 1.61 2.77 24.37
09/11/16 9:15 31.8 6.0 6.1 35.25 2.0 40 0.47 2.58 4.17 30.81
09/11/17 12:13 37.7 6.0 6.1 33.55 2.1 40 0.45 2.45 4.04 30.63
09/11/18 8:45 29.5 6.0 6.1 34.48 2.1 40 0.46 2.52 4.78 32.95
09-11-19 13:30 39.3 6.0 6.1 32.81 2.2 40 0.44 2.40 6.05 30.60
09/11/20 11:30 12.0 6.0 6.1 13.09 5.5 40 0.17 0.96 6.53 51.73
09/11/21 8:48 11.6 6.0 6.1 13.07 5.5 70 0.30 0.96 4.07 51.25
09/11/22 14:23 16.3 6.0 6.1 13.22 5.4 70 0.31 0.97 3.83 49.66
09/11/23 10:59 11.1 6.0 6.1 12.93 5.6 70 0.30 0.95 6.16 48.00
Page 71
63
09/11/24 11:09 17.1 6.0 6.1 16.98 4.2 70 0.40 1.24 5.58 48.59
09/11/25 11:27 17.8 6.0 6.1 17.58 4.1 70 0.41 1.29 3.21 51.51
09/11/26 9:41 17.2 6.0 6.1 18.57 3.9 70 0.43 1.36 2.64 49.03
09/11/27 10:29 18.1 6.0 6.1 17.52 4.1 70 0.41 1.28 2.88 49.52
09/11/28 11:57 24.0 6.0 6.1 22.62 3.2 70 0.53 1.65 2.47 50.14
09/11/29 10:17 22.0 6.0 6.1 23.64 3.0 70 0.55 1.73 3.37 56.10
09/11/30 8:40 22.1 6.0 6.1 23.70 3.0 70 0.55 1.73 6.24 56.35
09/12/01 11:23 26.7 6.0 6.1 23.99 3.0 70 0.56 1.75 6.91 56.39
09/12/02 11:45 18.0 6.0 6.1 17.73 4.1 10 0.06 1.30 4.60 18.42
09/12/03 17:57 22.2 6.0 6.0 17.64 4.1 10 0.06 1.29 2.27 5.79
09/12/04 10:55 12.5 6.0 6.0 17.68 4.1 10 0.06 1.29 2.18 5.33
09/12/05 8:34 16.2 6.0 6.1 17.96 4.0 10 0.06 1.31 2.22 5.82
09/12/06 8:35 24.6 6.0 5.9 24.58 2.9 10 0.08 1.80 2.40 6.21
09/12/07 9:34 23.1 6.0 6.0 22.19 3.2 10 0.07 1.62 2.35 6.18
09/12/08 8:34 22.0 6.0 6.1 22.96 3.1 10 0.08 1.68 1.49 4.59
09/12/09 11:32 26.9 6.0 6.1 23.94 3.0 11 0.09 1.75 1.29 3.86
09/12/10 9:13 33.1 6.0 6.0 36.64 2.0 12 0.15 2.68 1.81 5.73
09/12/11 11:18 38.2 6.0 6.0 35.15 2.0 13 0.15 2.57 2.01 6.19
09/12/12 8:30 32.6 6.0 6.0 36.91 2.0 14 0.17 2.70 1.97 6.00
09/12/13 9:07 37.0 6.0 6.1 36.07 2.0 15 0.18 2.64 2.01 6.95
Page 72
64
APPENDIX B: RESULTS
Table 3. Batch test gas analysis
Substrate C.
(mg/L)
T (°C) A (O2) A (N2) P (O2)% P (N2)% into 100%
P(O2)% P(N2)%
Air 380918.8 1204350 20.95 78.12 21.15 78.85
10 28 NO3-N pH=6.0 67892.31 1291918 3.73 83.80 4.27 95.73
NO3-N pH=7.5 76690.76 732978 4.22 47.54 8.15 91.85
NO2-N pH=6.0 97694.16 1276016 5.37 82.77 6.10 93.90
NO2-N pH=7.5 104472.7 767065 5.75 49.76 10.35 89.65
40 NO3-N pH=6.0 86020 1298820 4.58 81.85 5.30 94.70
NO2-N pH=6.0 134702 1294867 7.17 81.60 8.08 91.92
70 NO3-N pH=6.0 22128 1282291 1.19 81.56 1.43 98.57
NO3-N pH=7.5 23733 563871 1.27 35.86 3.43 96.57
NO2-N pH=6.0 47907 1341055 2.57 85.30 2.92 97.08
NO2-N pH=7.5 42753 637665 2.29 40.56 5.35 94.65
100 NO3-N pH=6.0 5630 1343289 0.33 93.14 0.36 99.64
NO2-N pH=6.0 81327 1380525 4.80 95.72 4.77 95.23
10 18 NO3-N pH=6.0 86886 1311846 4.60 81.90 5.32 94.68
NO2-N pH=6.0 108416 1398902 5.74 87.34 6.17 93.83
40 NO3-N pH=6.0 63453 1350646 3.31 83.31 3.82 96.18
NO2-N pH=6.0 90477 1391452 4.72 85.83 5.21 94.79
Page 73
65
70 NO3-N pH=6.0 45074 1390001 2.39 86.78 2.68 97.32
NO2-N pH=6.0 62114 1426985 3.29 89.09 3.56 96.44
100 NO3-N pH=6.0 55534 1479862 2.80 88.87 3.06 96.94
NO3-N pH=7.5 52964 763327 2.67 45.84 5.51 94.49
NO2-N pH=6.0 86813 1041890 4.38 62.57 6.55 93.45
NO2-N pH=7.5 100139 854974 5.05 51.34 8.96 91.04
10 8 NO3-N pH=6.0 115871 1370703 6.13 86.32 6.63 93.37
NO2-N pH=6.0 124445 1462436 6.58 92.10 6.67 93.33
40 NO3-N pH=6.0 162506 1327226 9.20 88.88 9.38 90.62
NO3-N pH=7.5 121610 1017290 6.88 68.12 9.18 90.82
NO2-N pH=6.0 167603 1323952 9.49 88.66 9.66 90.34
NO2-N pH=7.5 198884 1162418 11.26 77.84 12.63 87.37
70 NO3-N pH=6.0 113998 1417731 6.03 89.29 6.32 93.68
NO2-N pH=6.0 135741 1423758 7.18 89.66 7.41 92.59
Table 4. Continuous reactor gas analysis
Reactor Data N-in (mg/l) HRT A (O2) A (N2) P
(O2)%
P
(N2)%
into 100%
P(O2)% P(N2)%
1 10/29/2009 10 4 383403 1270942 19.61 76.58 20.39 79.61
11/2/2009 3 379091 1256938 19.76 77.53 20.31 79.69
11/3/2009 2 381836 1265250 20.19 79.86 20.18 79.82
Page 74
66
11/5/2009 40 4 376715 1247815 20.32 80.21 20.21 79.79
11/10/2009 3 389772 1219394 19.83 73.54 21.24 78.76
11/14/2009 2 403419 1298609 21.14 81.10 20.68 79.32
11/18/2009 70 5 374491 1212670 19.10 73.89 20.54 79.46
11/23/2009 4 401852 1257672 21.86 81.57 21.14 78.86
11/26/2009 3 379430 1237251 20.03 77.65 20.50 79.50
11/30/2009 10 4 380222 1202798 21.52 80.54 21.08 78.92
12/5/2009 3 361222 1136500 20.49 76.14 21.21 78.79
12/8/2009 2 368165 1170156 21.90 83.60 20.76 79.24
2 10/29/2009 10 4 138569 1537318 7.09 92.63 7.11 92.89
11/2/2009 3 133209 1418290 6.94 87.48 7.35 92.65
11/3/2009 2 110394 1464957 5.84 92.46 5.94 94.06
11/5/2009 40 4 165515 1396990 8.93 89.80 9.04 90.96
11/10/2009 3 327530 1281595 16.66 77.29 17.73 82.27
11/14/2009 2 311553 1307210 16.33 81.64 16.67 83.33
11/18/2009 70 5 119751 1535728 6.11 93.57 6.13 93.87
11/23/2009 4 174139 1450569 9.47 94.08 9.15 90.85
11/26/2009 3 204279 1365090 10.78 85.67 11.18 88.82
11/30/2009 10 4 388438 1244955 21.98 83.37 20.87 79.13
12/5/2009 3 245684 1191319 13.94 79.81 14.87 85.13
Page 75
67
12/8/2009 2 262490 1221033 15.61 87.24 15.18 84.82
Figure 1. Batch reactor: effect of pH at 40 mg-N/L NO3 at 8˚C
Figure 2. Batch reactor: effect of pH at 100 mg-N/L NO2 at 18˚C
y = -0.0263x + 31.275
y = -0.0203x + 36.313
0
5
10
15
20
25
30
35
40
0 100 200 300 400
Co
nc.
(m
g/L)
Time (min)
40 mg-N/L NO3: Change in pH
8C, pH = 6
8C, pH = 7.5
y = -0.0089x + 76.709
y = -0.0048x + 96.007
0
20
40
60
80
100
120
0 100 200 300 400 500
Co
nc.
(m
g/L)
Time (min)
100 mg-N/L NO2: Change in pH
18C, pH = 6
18C, pH = 7.5


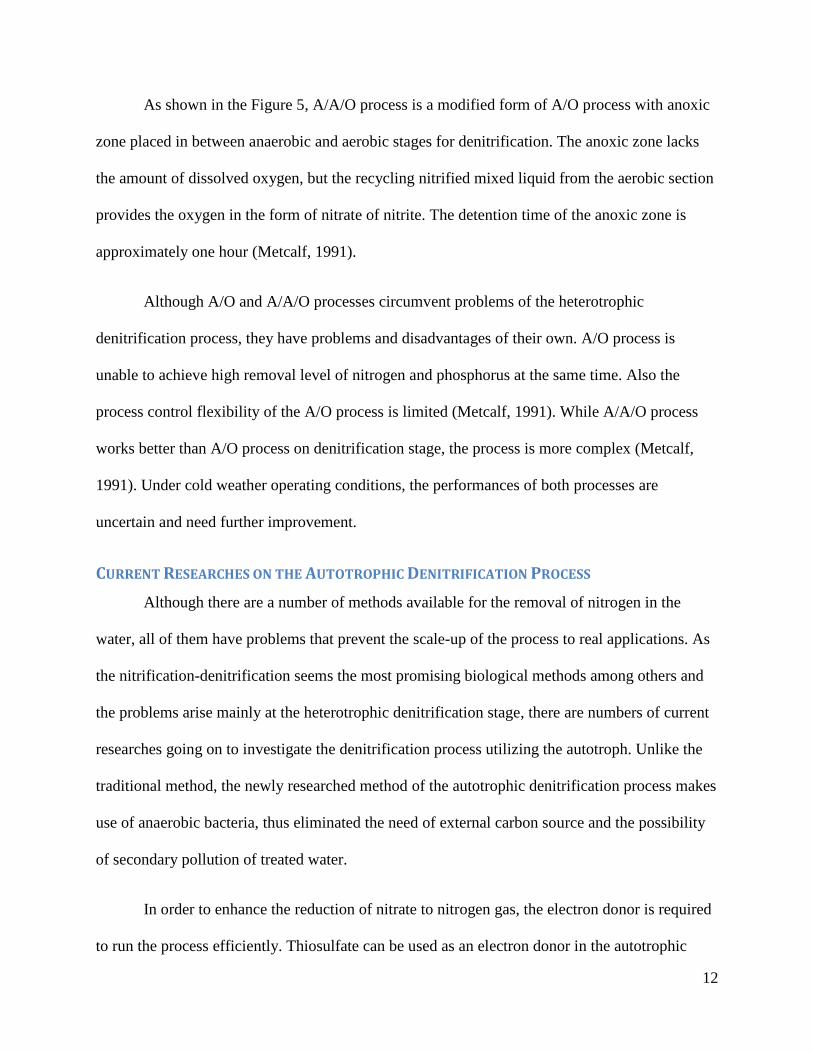
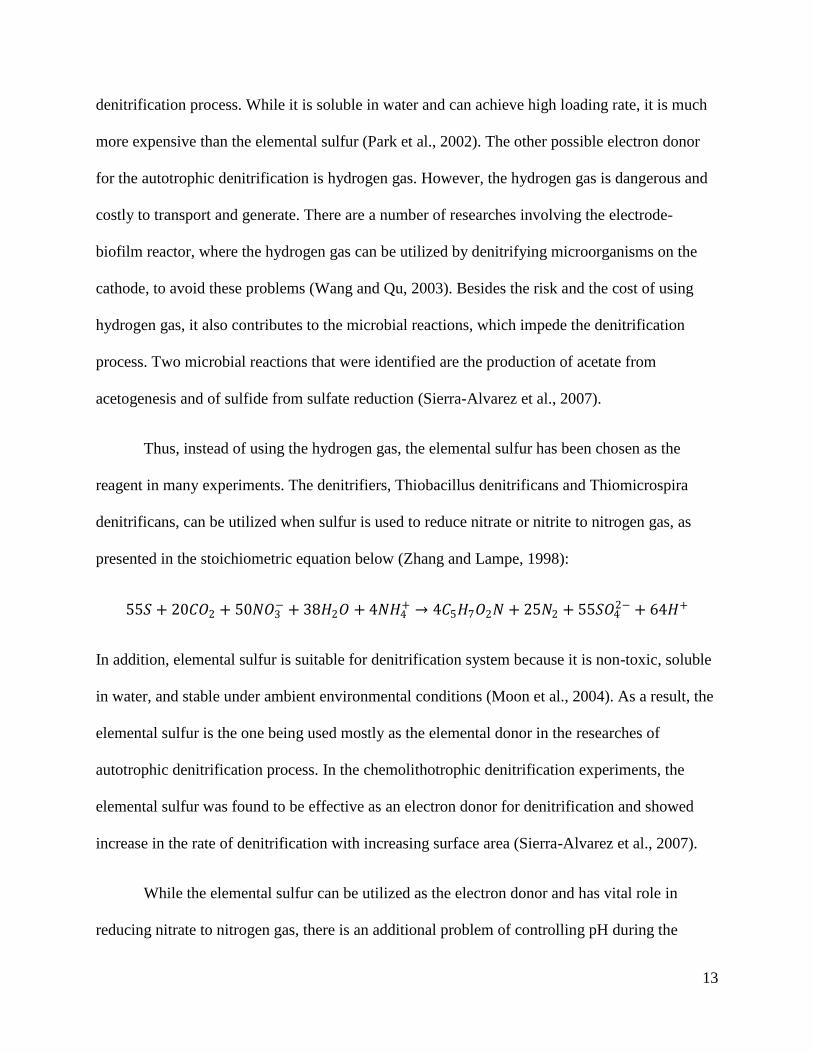


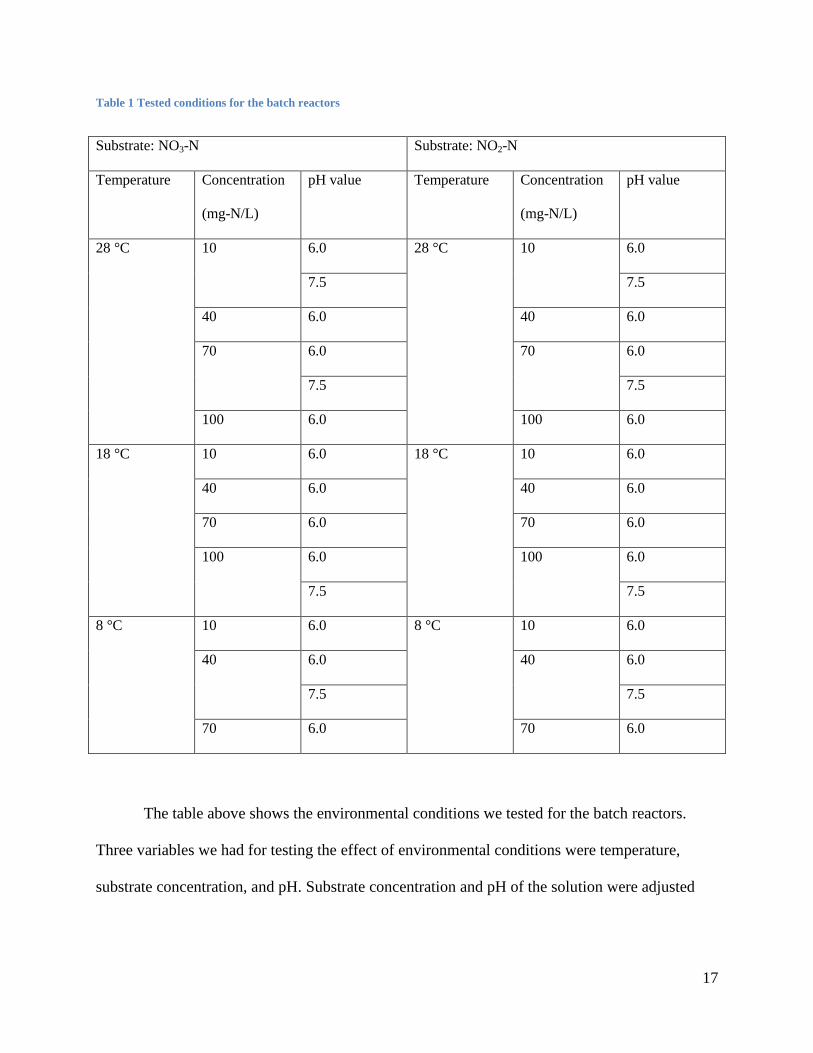


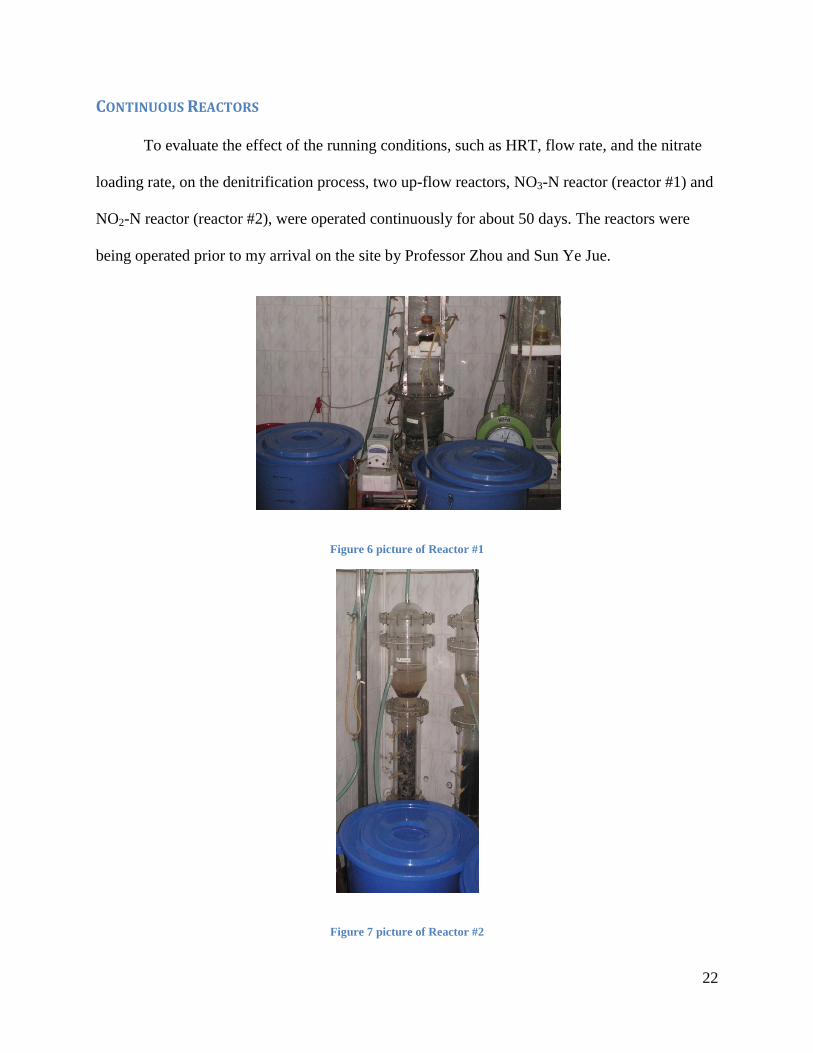
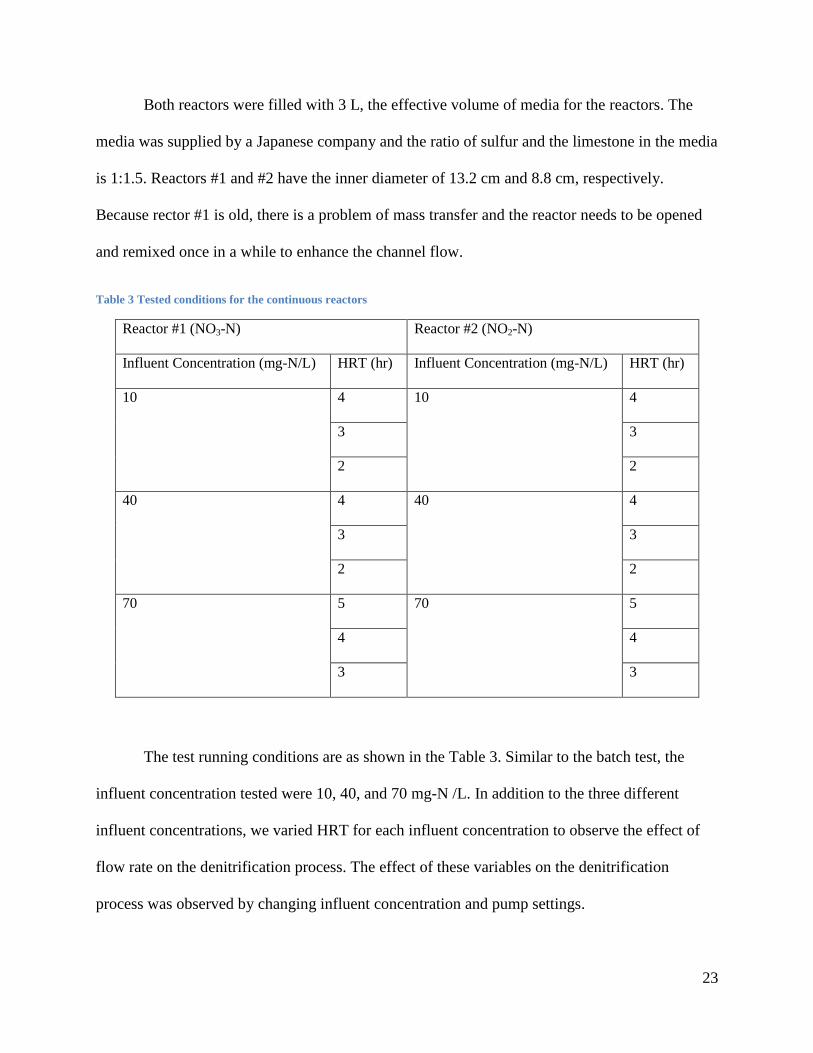


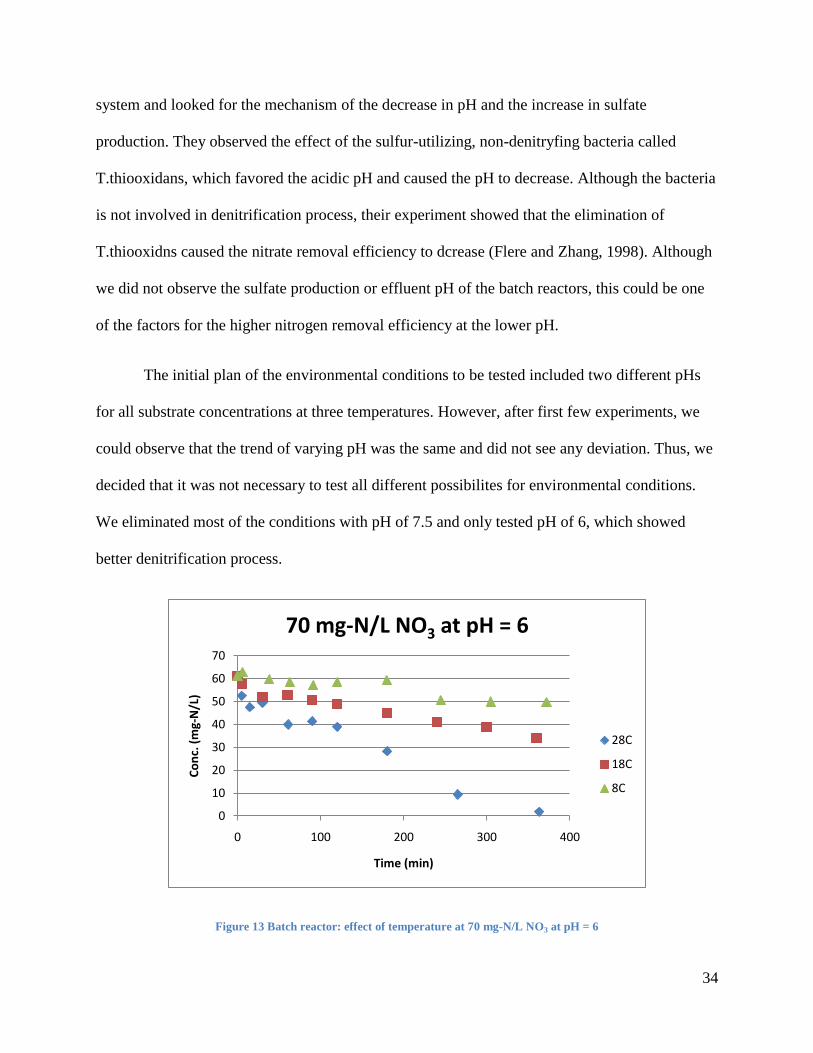
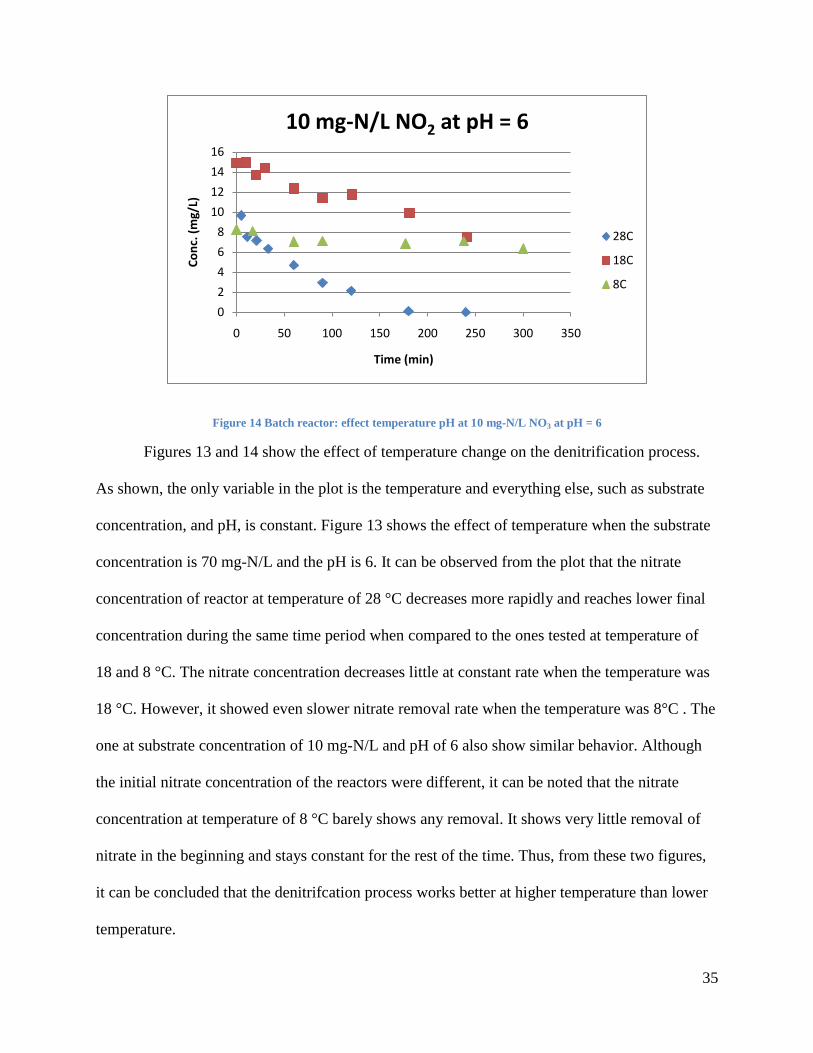


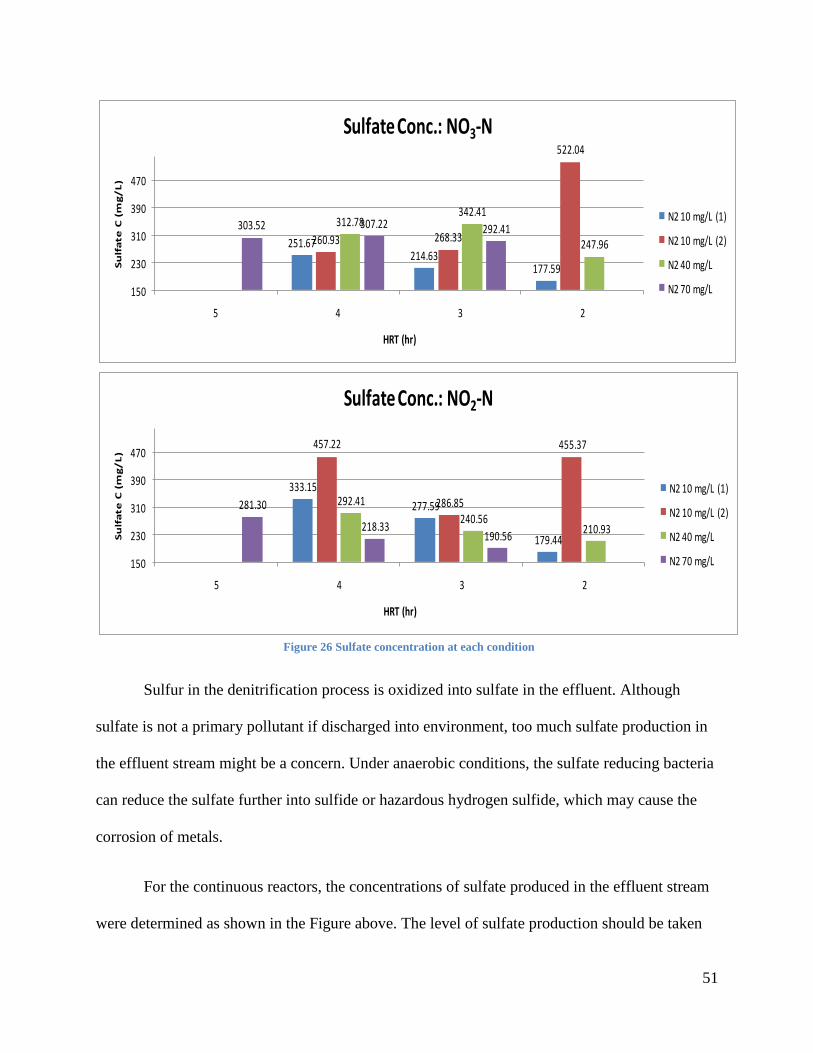
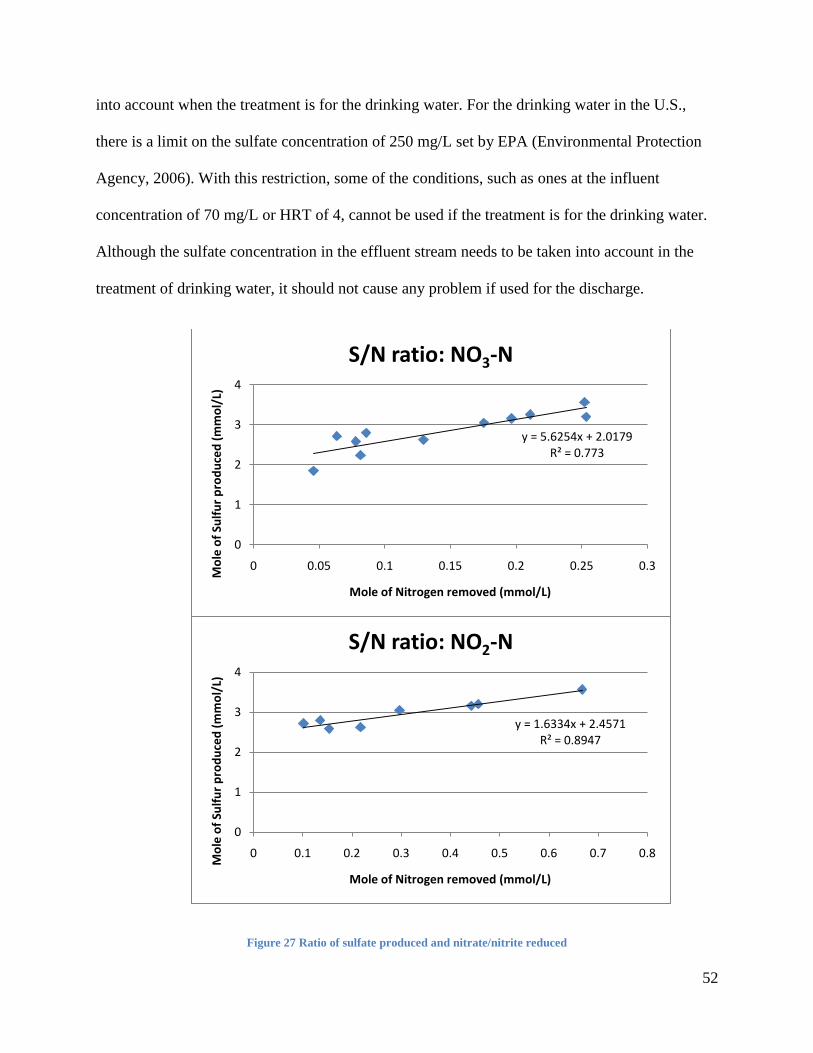


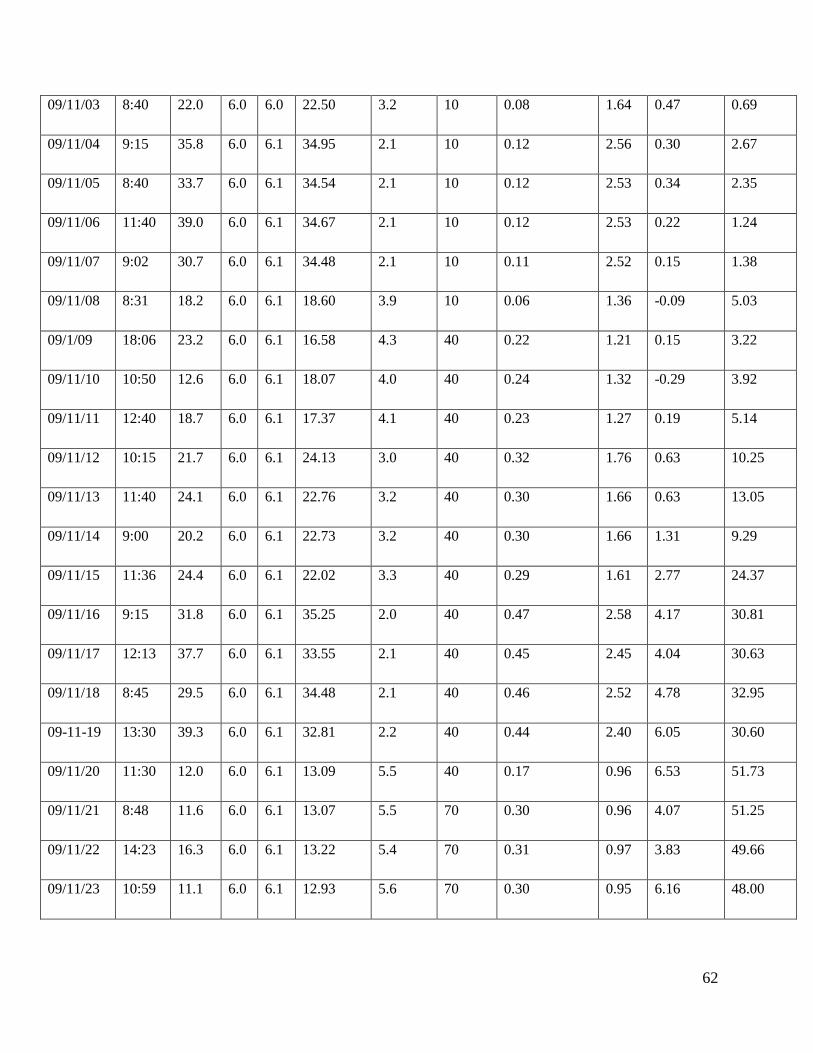


![Comparison of Biological Wastewater Treatment Ability of ...iicbe.org/upload/9007A0217031.pdf · [6] D. Han, H. Yun, and D. Kim, “Autotrophic nitrification and denitrification characteristics](https://static.documents.pub/doc/80x56/60f83e96da8a9c06bc4c9464/comparison-of-biological-wastewater-treatment-ability-of-iicbeorgupload-.jpg)


