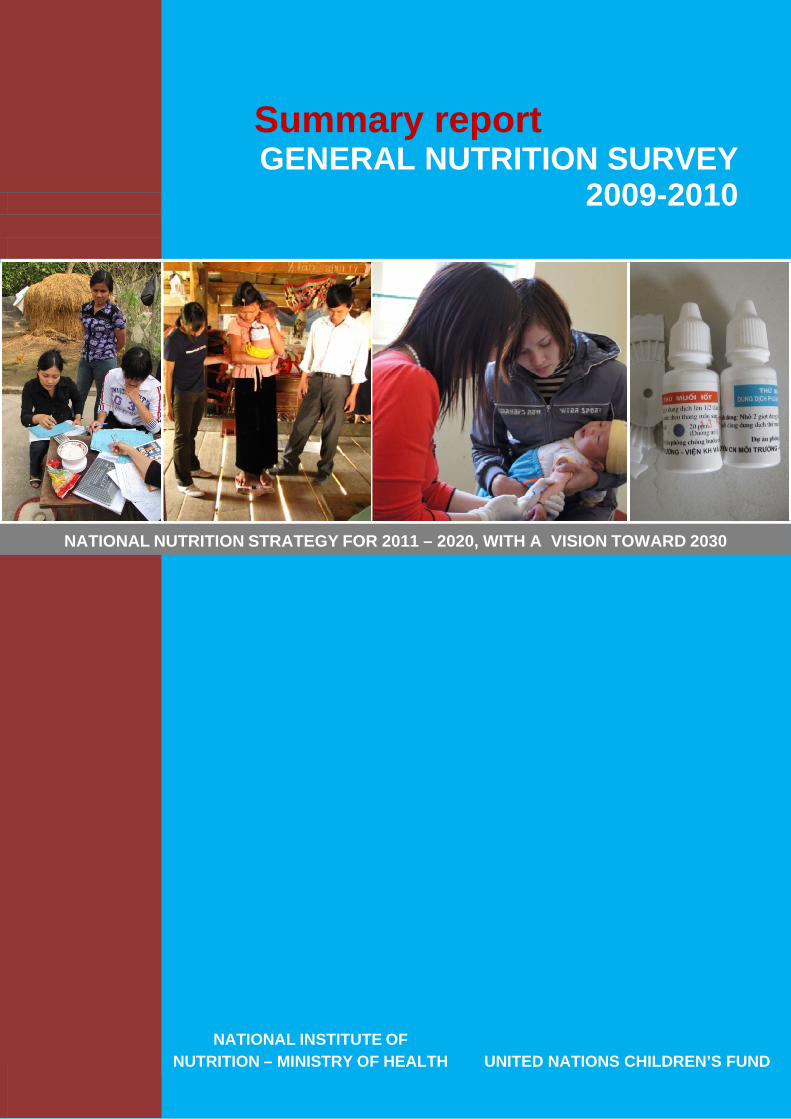
Summary report GENERAL NUTRITION SURVEY 2009-2010 NATIONAL NUTRITION STRATEGY FOR 2011 – 2020, WITH A VISION TOWARD 2030 NATIONAL INSTITUTE OF NUTRITION – MINISTRY OF HEALTH UNITED NATIONS CHILDREN’S FUND
Transcript
Summary report GENERAL NUTRITION SURVEY
2009-2010
NATIONAL NUTRITION STRATEGY FOR 2011 – 2020, WITH A VISION TOWARD 2030
NATIONAL INSTITUTE OF NUTRITION – MINISTRY OF HEALTH UNITED NATIONS CHILDREN’S FUND
NATIONAL INSTITUTE OF
NUTRITION – MINISTRY OF HEALTH UNITED NATIONS CHILDREN’S FUND
SUMMARY REPORT GENERAL
NUTRITION SURVEY
2009-2010
HANOI - 2012
1
SUMMARY Assessment of nutrition status, food consumption and monitoring of related factors are worldwide paid attention. The progress or problems existing in health-nutrition through nutritional and health indicators recommended by WHO, UNICEF, FAO should be monitored for the purpose of developing early interventions and effective prevention strategies. In Asia, there are still many challenges threaten the nutritional health status of people in some countries. Meanwhile, many countries - including Vietnam - have achieved remarkable success in hunger - poverty reduction and reduce the malnourished prevalence in children.
Heading into the next decade, the conduction of General Nutrition Survey (GNS) every 10 years is required for the purpose to assess the current nutritional situation and to analysis correlative factors and identify the risk factors. The survey results were used as an evidence bases for development of Action Plan for Nutrition in new period 2011-2020. The objective of this GNS is to assess nutritional status, household food consumption and other nutrition related issues in Vietnamese people, particularly children under 5 years old. This survey has been implemented in 512 randomly selected communes of 432 districts in 64 provinces (the administrative boundaries of provinces and cities in Vietnam before 2008). The data collection method mainly consists of interviewing, anthropometric measurement, 24-hours dietary recall and basic information of the health centers at communal, district and provincial levels. The provincial survey teams were responsible for the data collection and data checking before transferring to NIN for data cleaning and entering. Data analyzed by using Stata 11 with cluster sampling survey correction with the assistance of an international data analysis expert. The anthropometric indicators of children were analyzed based on WHO 2007 standard reference.
2
SUMMARY OF MAIN FINDINGS OF GENERAL NUTRITION SURVEY 2009‐2010 AND NNS 2011‐2020
1. In 2010, the prevalence of underweight (Weight‐for‐Age Z‐score < ‐2.00) among preschool children was 17.5%. Of which, mild, moderate and severe underweight were 15.4%, 1.8% and 0.3%, respectively. 20 out of 63 provinces/cities had prevalence of underweight higher than 20%, considered at high level by the WHO's classification.
At present, stunting (Height‐for‐Age Z‐score < ‐2.00) affects 29.3% of children under 5 years old. The
prevalence of stunting in 2 provinces was very high level ( 40%) and was high level (30‐39%) in 31 provinces. The average rate of reduction was 1.3 percentage points per year from 1995 to 2010. The prevalence of
wasting among children under fives (Weight‐for‐Height Z‐score < ‐2.00) was 7.1%.
Rate of overweight and obesity among children under fives years old was 5.6% (6.5% and 4.2% for the urban
and rural, respectively). The current rate is 6 times higher than that in the year of 2000.
2. Iron Deficiency Anemia affected 29.2% among children under 5. Prevalence of Iron Anemia in non‐pregnant women and pregnant women were 28.8% and about 36.5%, respectively.
Subclinical Vitamin A deficiency (<0.70 μmol/L) in Vietnam is now mainly subclinical which is still prevalent in
14.2% in children and about 35% in lactating mothers (Result from survey 2008). The Vitamin A capsule
coverage rate was 79.5% and 51.4% in children and lactating women after delivery, respectively.
3. The current attained height is reached between 22‐26 year of age for both males and females. The average height of Vietnamese males was 164 cm and 154cm in females.
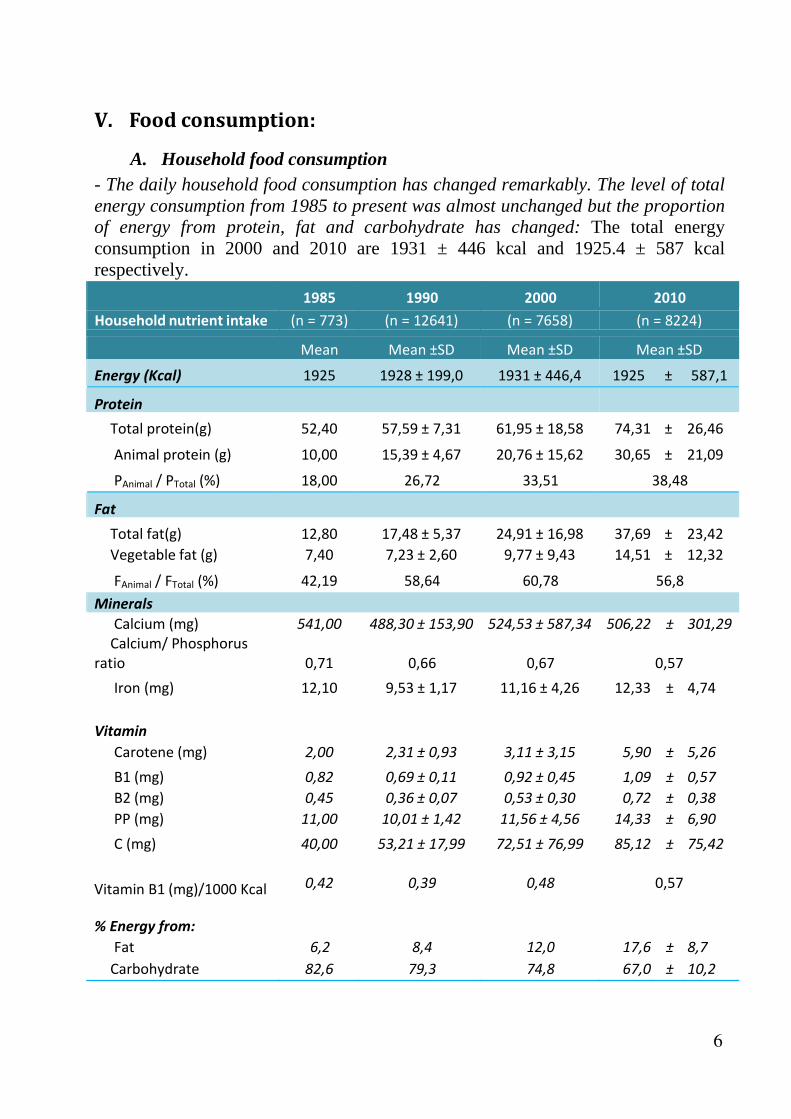
4. Daily household food consumption has had remarkable changes in comparison with previous time. There has been no significant changes of the average energy intake since 1985( 1925 kcal in 1981 and 1925.4 kcal in 2010) but the proportion of total energy from protein, lipids, carbohydrate has changed. In the energy composition was made up by the ratio of Protein: Lipids: Carbohydrate as following 11.2: 6.2: 82.6 (1983) and 15.9: 17.8: 66.3 (2010).
Amongst children 2‐5 years old, food consumption provided an average energy intake of 97% compared to
the recommended standard of National Institute of Nutrition (NIN). The total protein intake was 49 gram per
day and it provided 17% energy intake of food consumption which met the recommended standard of NIN.
Dietary iron intake in children between 24‐35 months of age currently meets only 56% of dietary reference
intake (DRI).
5. The percentage of reproductive aged women with low Body Mass Index (BMI< 18.5) was 18%. Meanwhile, the proportion of reproductive aged women with BMI ≥ 25 was 8.2% (overweight and obesity).
6. Nationally, 82.1% of consumers have known about food safety knowledge over communication mediums. This prevalence was equivalent among Red River Delta, North Central and South Central Coast, Central Highland and Southeast but lowest in Northern mountainous and Midland and Mekong River Delta ( 75.1% and 75.6%, respectively). 69.7%‐73.6% people can identify two typical symptoms of food poisoning.
7. On February 22, 2012, The Prime Minister of the Socialist Republic of Vietnam signed a Decision No 226QD/TTG to ratify National Nutrition Strategy period 2011‐2020 and vision 2030. The Strategy asserts that the duty of improving nutrition is the responsibility of all ministries and all people. The aims of strategy is enhancing totally the physical and intelligence of Vietnamese people as well as improving life condition by ensuring the balancing and appropriate nutrition. The strategy content includes six main objectives: 1. Improving quality and amount of people meal. 2. Improving maternal and child nutrition status. 3. Improving micro‐nutrient status. 4. Controlling overweight and obesity situation and chronic diseased elements related to nutrition of adults. 5. Enhancing appropriate nutrition knowledge and practices. 6. Strengthening ability and efficiency of nutrition network at communities and health facilities.
3
Malnutrition prevalence
Anthropometry index Male Female Total
Underweight 18,4 16,6 17,5
Pro
port
ion
%
0 5
10
15
20
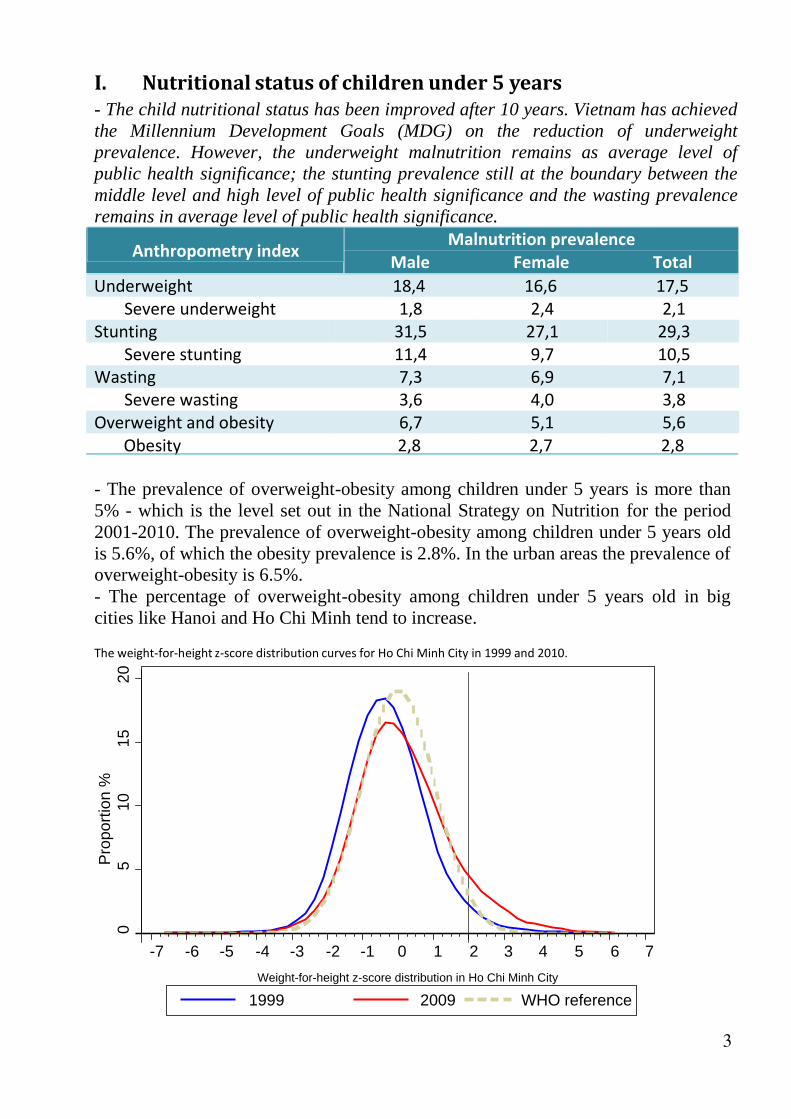
I.Nutritionalstatusofchildrenunder5years- The child nutritional status has been improved after 10 years. Vietnam has achieved the Millennium Development Goals (MDG) on the reduction of underweight prevalence. However, the underweight malnutrition remains as average level of public health significance; the stunting prevalence still at the boundary between the middle level and high level of public health significance and the wasting prevalence remains in average level of public health significance.
Severe underweight 1,8 2,4 2,1 Stunting 31,5 27,1 29,3
Severe stunting 11,4 9,7 10,5 Wasting 7,3 6,9 7,1
Severe wasting 3,6 4,0 3,8 Overweight and obesity 6,7 5,1 5,6 Obesity 2,8 2,7 2,8
- The prevalence of overweight-obesity among children under 5 years is more than 5% - which is the level set out in the National Strategy on Nutrition for the period 2001-2010. The prevalence of overweight-obesity among children under 5 years old is 5.6%, of which the obesity prevalence is 2.8%. In the urban areas the prevalence of overweight-obesity is 6.5%. - The percentage of overweight-obesity among children under 5 years old in big cities like Hanoi and Ho Chi Minh tend to increase.
The weight‐for‐height z‐score distribution curves for Ho Chi Minh City in 1999 and 2010.
-7 -6 -5 -4 -3 -2 -1 0 1 2 3 4 5 6 7
Weight-for-height z-score distribution in Ho Chi Minh City
1999 2009 WHO reference
4
%
%
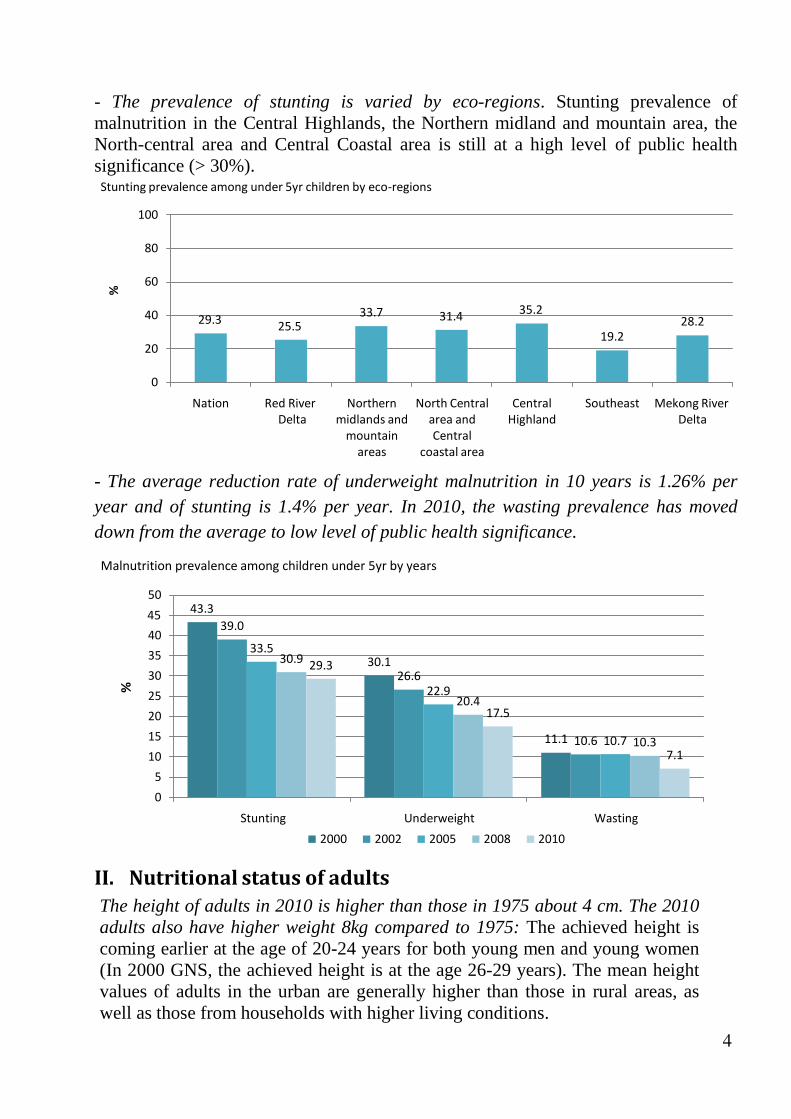
- The prevalence of stunting is varied by eco-regions. Stunting prevalence of malnutrition in the Central Highlands, the Northern midland and mountain area, the North-central area and Central Coastal area is still at a high level of public health significance (> 30%). Stunting prevalence among under 5yr children by eco‐regions
100
80
60
40 29.3 25.5
20
33.7 31.4 35.2
19.2
28.2
0
Nation Red River Delta
Northern
midlands and mountain areas
North Central area and Central
coastal area
Central Highland
Southeast Mekong River
Delta
- The average reduction rate of underweight malnutrition in 10 years is 1.26% per year and of stunting is 1.4% per year. In 2010, the wasting prevalence has moved down from the average to low level of public health significance.
Malnutrition prevalence among children under 5yr by years
50
45 43.3
40
35
30
25
20
15
10
5
0
39.0
33.5
30.9 29.3
30.1
26.6
22.9
20.4
17.5
11.1 10.6 10.7 10.3
7.1
Stunting Underweight Wasting
2000 2002 2005 2008 2010
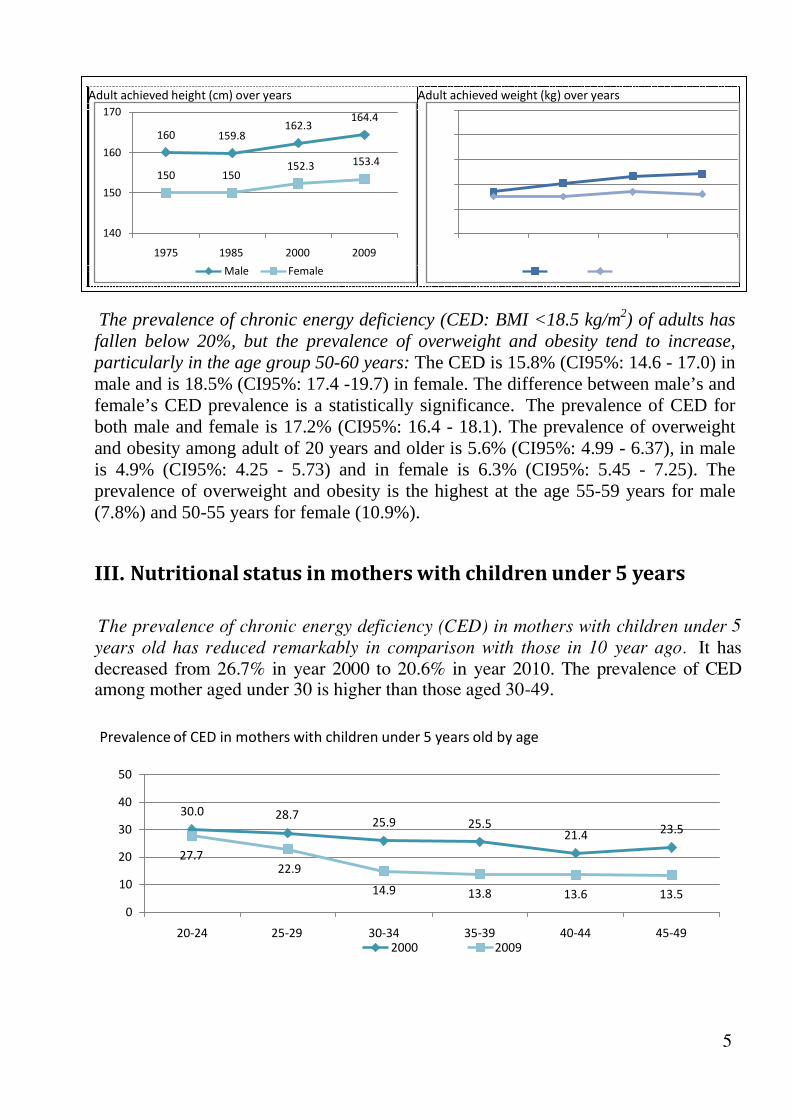
II. NutritionalstatusofadultsThe height of adults in 2010 is higher than those in 1975 about 4 cm. The 2010 adults also have higher weight 8kg compared to 1975: The achieved height is coming earlier at the age of 20-24 years for both young men and young women (In 2000 GNS, the achieved height is at the age 26-29 years). The mean height values of adults in the urban are generally higher than those in rural areas, as well as those from households with higher living conditions.
5
Adult achieved height (cm) over years Adult achieved weight (kg) over years
170
160
160 159.8
162.3
164.4 80
70
150
150 150
152.3 153.4 60 47
50
51 53 54
140
1975 1985 2000 2009
Male Female
40 45 45 47 46
30
1975 1985 2000 2009
Male Female
The prevalence of chronic energy deficiency (CED: BMI <18.5 kg/m2) of adults has fallen below 20%, but the prevalence of overweight and obesity tend to increase, particularly in the age group 50-60 years: The CED is 15.8% (CI95%: 14.6 - 17.0) in male and is 18.5% (CI95%: 17.4 -19.7) in female. The difference between male’s and female’s CED prevalence is a statistically significance. The prevalence of CED for both male and female is 17.2% (CI95%: 16.4 - 18.1). The prevalence of overweight and obesity among adult of 20 years and older is 5.6% (CI95%: 4.99 - 6.37), in male is 4.9% (CI95%: 4.25 - 5.73) and in female is 6.3% (CI95%: 5.45 - 7.25). The prevalence of overweight and obesity is the highest at the age 55-59 years for male (7.8%) and 50-55 years for female (10.9%).
III. Nutritionalstatusinmotherswithchildrenunder5years The prevalence of chronic energy deficiency (CED) in mothers with children under 5
years old has reduced remarkably in comparison with those in 10 year ago. It has
decreased from 26.7% in year 2000 to 20.6% in year 2010. The prevalence of CED among mother aged under 30 is higher than those aged 30-49.
Prevalence of CED in mothers with children under 5 years old by age
50
40 30.0 28.7
30
20 27.7
25.9 25.5
21.4 23.5
22.9 10
0
14.9 13.8 13.6 13.5
20‐24 25‐29 30‐34 35‐39 40‐44 45‐49 2000 2009
6
19,0 20,5 19,1 15,4 18,0 15,6 18,2
62,8
73,0
65,7
54,6
42,6
64,2
61,7
76,0
83,1
81,2
79,7
76,1
80,6
79,3
37.5
Prevalence (%)
% iron tablet used
IV.Micronutrientdeficiencies
- The prevalence of iron deficiency anemia and subclinical vitamin A deficiency among children under 5 years old nationwide is 29.2% and 14.2% respectively, which are on mild level of public health significance: the prevalence of vitamin A
deficiency among children in the Red River Delta was at mild level of public health
significance (9.1%). The prevalence of vitamin A deficiency among children in the Highland region was at severe level (20.9%). The prevalence of anemia and vitamin
A deficiency among children in the remaining ecological regions were all ranked at a
moderate level of public health significance. The prevalence of anemia was highest
in children between 0 to 23 months old (44-45%). The percentage of anemia
decreases significantly with age, with the lowest prevalence found in children
between 48-59 months at 14.2%. The prevalence of vitamin A deficiency was greatest in children less than 12 months old and is considered a severe level of public health significance. The prevalence in children 24-36 months was reduced to a mild
level; all others are representing an average level of public health significance.
- The vitamin A supplementation coverage rate among children 6-36 months is 87.0%. Percentage of mothers after delivery received vitamin A capsule is 65.2%.
Ecological region
Percentage of cover Northern
North
Red River Midlands Central
Central Mekong
Delta & &
Highlands Southeast River
Mountains Central Delta Coasts
Nation‐wide
Consume iron table in mother (last 6 moths) Vitamin A use in postpartum mother Vitamin A use in children < 60 months
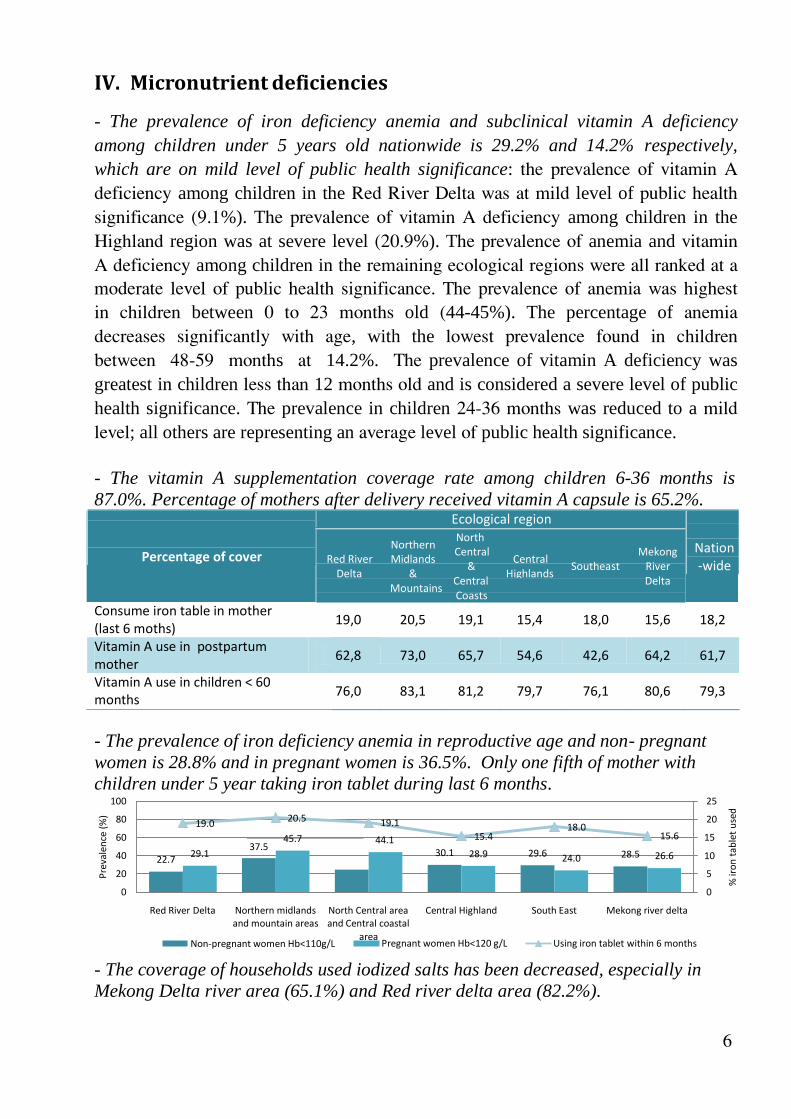
- The prevalence of iron deficiency anemia in reproductive age and non- pregnant women is 28.8% and in pregnant women is 36.5%. Only one fifth of mother with children under 5 year taking iron tablet during last 6 months.
100
80
60
40
20
0
22.7
19.0
20.5 19.1
45.7 44.1
29.1
30.1
15.4
28.9
29.6
18.0
24.0
28.5
25
20
15.6 15
26.6 10
5
0
Red River Delta Northern midlands North Central area Central Highland South East Mekong river delta
and mountain areas and Central coastal Non‐pregnant women Hb<110g/L
area Pregnant women Hb<120 g/L Using iron tablet within 6 months
- The coverage of households used iodized salts has been decreased, especially in Mekong Delta river area (65.1%) and Red river delta area (82.2%).
A. Household food consumption - The daily household food consumption has changed remarkably. The level of total energy consumption from 1985 to present was almost unchanged but the proportion of energy from protein, fat and carbohydrate has changed: The total energy consumption in 2000 and 2010 are 1931 ± 446 kcal and 1925.4 ± 587 kcal respectively.
Vitamin B1 (mg)/1000 Kcal
7
%
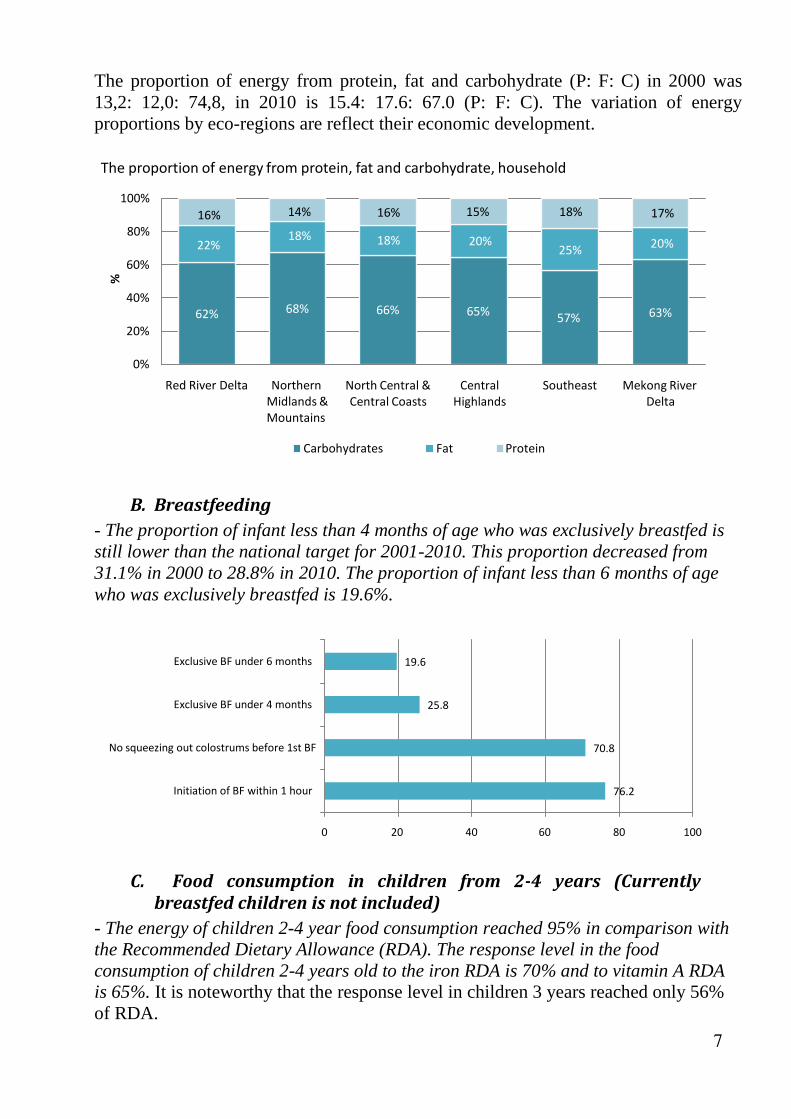
The proportion of energy from protein, fat and carbohydrate (P: F: C) in 2000 was 13,2: 12,0: 74,8, in 2010 is 15.4: 17.6: 67.0 (P: F: C). The variation of energy proportions by eco-regions are reflect their economic development.
The proportion of energy from protein, fat and carbohydrate, household
100%
80%
16% 14% 16% 15% 18% 17%
18% 18% 20%
60%
22% 25% 20%
40%
20%
62% 68% 66% 65% 57% 63%
0%
Red River Delta Northern Midlands & Mountains
North Central & Central Coasts
Central
Highlands
Southeast Mekong River
Delta
Carbohydrates Fat Protein
B. Breastfeeding- The proportion of infant less than 4 months of age who was exclusively breastfed is still lower than the national target for 2001-2010. This proportion decreased from 31.1% in 2000 to 28.8% in 2010. The proportion of infant less than 6 months of age who was exclusively breastfed is 19.6%.
Exclusive BF under 6 months 19.6
Exclusive BF under 4 months 25.8
No squeezing out colostrums before 1st BF 70.8
Initiation of BF within 1 hour 76.2
0 20 40 60 80 100
C. Food consumption in children from 2‐4 years (Currentlybreastfedchildrenisnotincluded)
- The energy of children 2-4 year food consumption reached 95% in comparison with the Recommended Dietary Allowance (RDA). The response level in the food consumption of children 2-4 years old to the iron RDA is 70% and to vitamin A RDA is 65%. It is noteworthy that the response level in children 3 years reached only 56% of RDA.
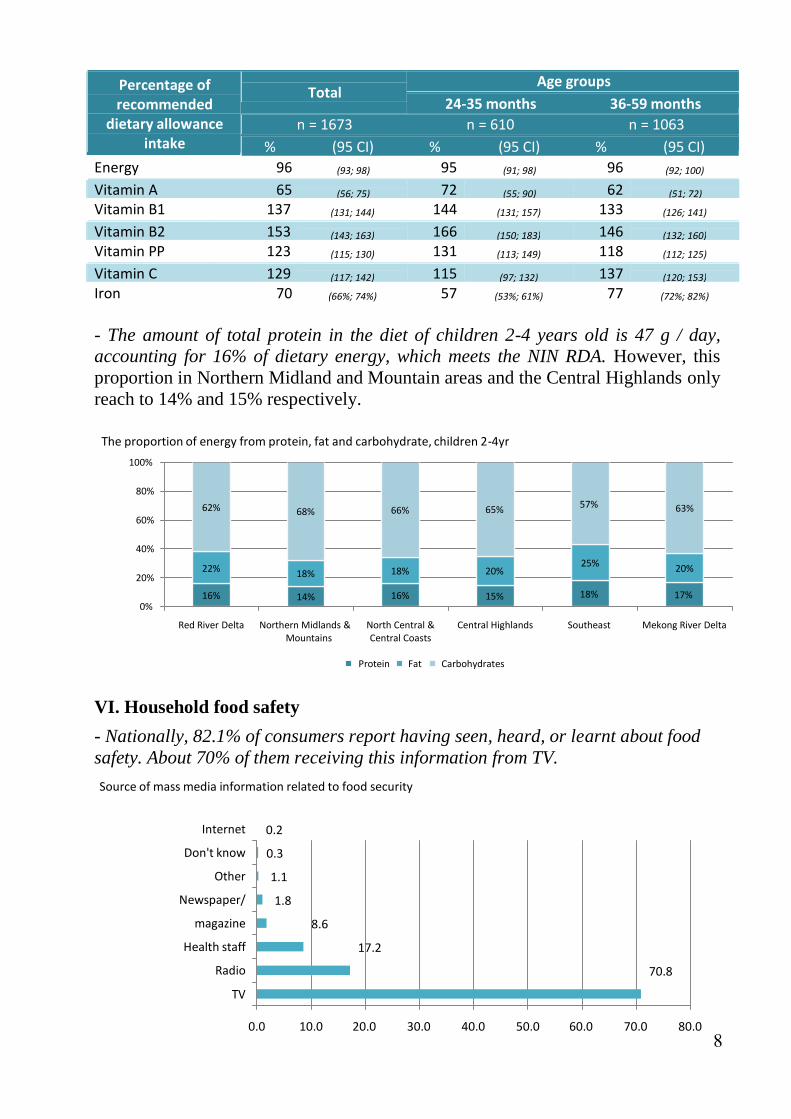
- The amount of total protein in the diet of children 2-4 years old is 47 g / day, accounting for 16% of dietary energy, which meets the NIN RDA. However, this proportion in Northern Midland and Mountain areas and the Central Highlands only reach to 14% and 15% respectively.
The proportion of energy from protein, fat and carbohydrate, children 2‐4yr
100%
80%
60%
62% 68% 66% 65%
57% 63%
40%
20%
22% 18% 18% 20%
25%
20%
16% 14% 16% 15% 18% 17% 0%
Red River Delta Northern Midlands & Mountains
North Central & Central Coasts
Central Highlands Southeast Mekong River Delta
Protein Fat Carbohydrates
VI. Household food safety
- Nationally, 82.1% of consumers report having seen, heard, or learnt about food safety. About 70% of them receiving this information from TV.
Source of mass media information related to food security
Internet
Don't know
Other
Newspaper/
magazine
Health staff
Radio
TV
0.2
0.3
1.1
1.8
8.6
17.2
70.8
0.0 10.0 20.0 30.0 40.0 50.0 60.0 70.0 80.0
9
The lowest rates were found in the Northern Midland and Mountain areas and Mekong River Delta (75.1% and 75.6%, respectively). The proportions of people have a habit of eating raw fish meat on the highest (4.7% and 5.2%) in Northern Midland and Mountain areas and Central Highlands is the proportion. However, the highest rates of poisoning cases were reported in Mekong River Delta and North Central and Central Coastal areas (14 and 18 per thousand per month respectively).
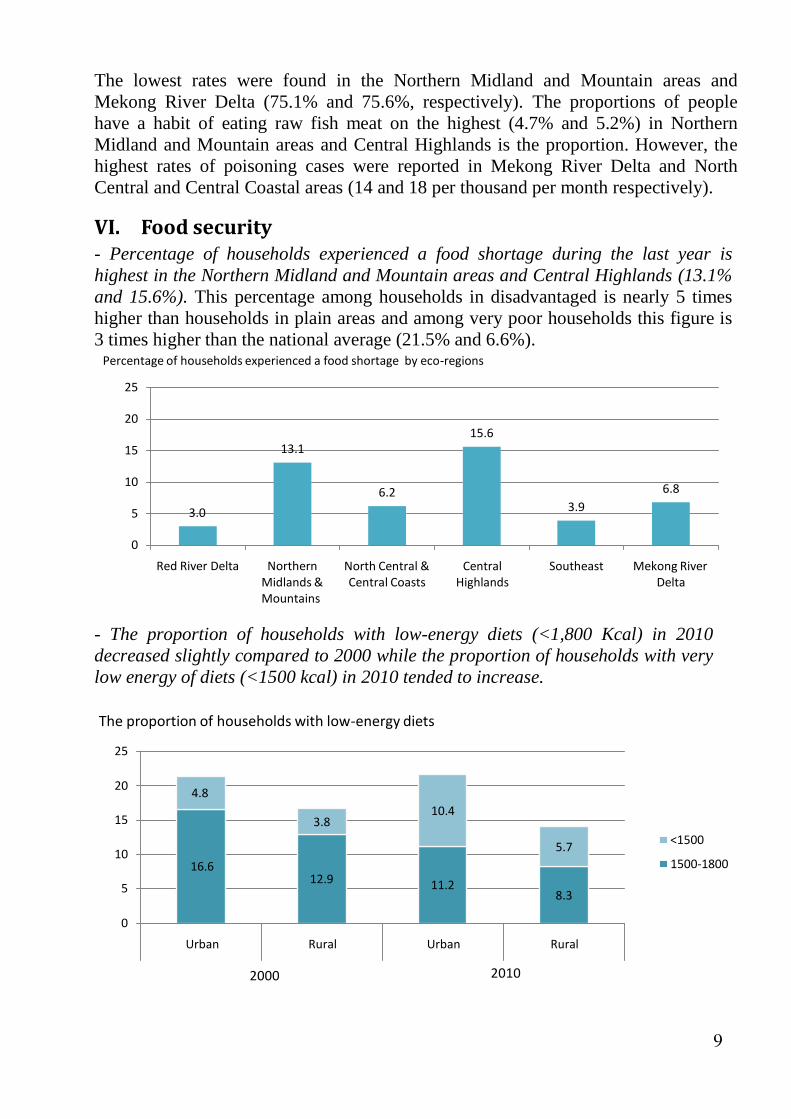
VI. Foodsecurity- Percentage of households experienced a food shortage during the last year is highest in the Northern Midland and Mountain areas and Central Highlands (13.1% and 15.6%). This percentage among households in disadvantaged is nearly 5 times higher than households in plain areas and among very poor households this figure is 3 times higher than the national average (21.5% and 6.6%). Percentage of households experienced a food shortage by eco‐regions
25
20
15
10
5 3.0
13.1
6.2
15.6
3.9
6.8
0
Red River Delta Northern Midlands & Mountains
North Central & Central Coasts
Central
Highlands
Southeast Mekong River
Delta
- The proportion of households with low-energy diets (<1,800 Kcal) in 2010 decreased slightly compared to 2000 while the proportion of households with very low energy of diets (<1500 kcal) in 2010 tended to increase.
The proportion of households with low‐energy diets
25
20
4.8
15
10
16.6
3.8
10.4
5.7
<1500
1500‐1800
5 12.9 11.2
8.3
0
Urban Rural Urban Rural
2000 2010
10
RECOMMENDATION 1. The monitoring and supervision should be reinforced so that the impacts of the
child malnutrition control program can be correctly evaluated at different levels. Interventions for stunting reduction should be strengthened in the first 2 years of life and during pregnancy.
The program for stunting reduction should target the poor and mothers with poor nutrition status (short and low BMI) and poor education. It should also target specific ecological regions with high stunting rate, such as Northern Midlands and Mountainous areas, Northern Central and Coastal areas, and Central Highlands. The program for stunting reduction should ensure that communication is effective to deliver nutrition messages to mother with low educational level.
High stunting prevalence in children under 6 months old (about 11%) indicates that the prevention should start from pregnancy period.
There should be counseling services for parents for the improvement of child dietary diversification when the children reach 6 months old.
2. Micronutrient deficiency control should be reinforced, especially for iron and vitamin A deficiency, through different approaches, of which food fortification for food diversification should be considered a key approach to supplement micronutrients in child and population diets.
3. The trend of height growth velocity observed now should be monitored. The phenomenon of ‘catch-up’ growth that often occurs after wars and economical crisis has been observed in Vietnam and it should be monitored. Counseling on the importance of breastfeeding and dietary micronutrients should be provided for mother before and during pregnancy and in the first 2 years of life.
4. The ratio of P:F:C is now 15.9: 17.8:66.3, which is considered optimal. It reveals
that food consumption of the population has been improved remarkably. However,
there should be guidance on proper nutrition so that the changes are in good
control and will not damage health. In the meantime, food consumption of
different target groups and regions should be considered to orient intervention
approach specified for them more appropriately.
5. Spot monitoring in the locality should be set up to provide experiences for
scaling-up. In the meantime, capacity building in program implementation and
evaluation at localities should also be strengthened.
NATIONAL INSTITUTE OF NUTRITION 48B Tang Bat Ho street, Hanoi, Vietnam Tel.(84-4) 3971 7090; 3971 3784 Fax: (84-4) 3971 7885 Email: [email protected] Website: www.nutrition.org.vn