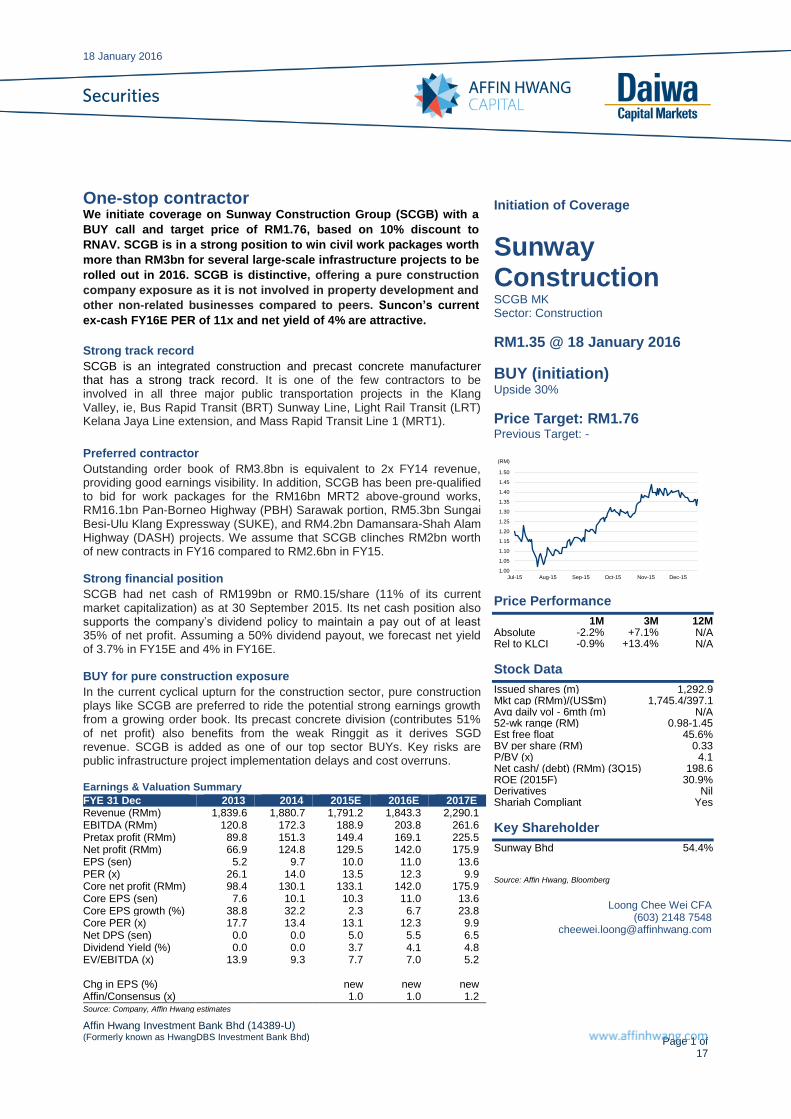
18 January 2016 Affin Hwang Investment Bank Bhd (14389-U) (Formerly known as HwangDBS Investment Bank Bhd) Page 1 of 17 One-stop contractor We initiate coverage on Sunway Construction Group (SCGB) with a BUY call and target price of RM1.76, based on 10% discount to RNAV. SCGB is in a strong position to win civil work packages worth more than RM3bn for several large-scale infrastructure projects to be rolled out in 2016. SCGB is distinctive, offering a pure construction company exposure as it is not involved in property development and other non-related businesses compared to peers. Suncon’s current ex-cash FY16E PER of 11x and net yield of 4% are attractive. Strong track record SCGB is an integrated construction and precast concrete manufacturer that has a strong track record. It is one of the few contractors to be involved in all three major public transportation projects in the Klang Valley, ie, Bus Rapid Transit (BRT) Sunway Line, Light Rail Transit (LRT) Kelana Jaya Line extension, and Mass Rapid Transit Line 1 (MRT1). Preferred contractor Outstanding order book of RM3.8bn is equivalent to 2x FY14 revenue, providing good earnings visibility. In addition, SCGB has been pre-qualified to bid for work packages for the RM16bn MRT2 above-ground works, RM16.1bn Pan-Borneo Highway (PBH) Sarawak portion, RM5.3bn Sungai Besi-Ulu Klang Expressway (SUKE), and RM4.2bn Damansara-Shah Alam Highway (DASH) projects. We assume that SCGB clinches RM2bn worth of new contracts in FY16 compared to RM2.6bn in FY15. Strong financial position SCGB had net cash of RM199bn or RM0.15/share (11% of its current market capitalization) as at 30 September 2015. Its net cash position also supports the company’s dividend policy to maintain a pay out of at least 35% of net profit. Assuming a 50% dividend payout, we forecast net yield of 3.7% in FY15E and 4% in FY16E. BUY for pure construction exposure In the current cyclical upturn for the construction sector, pure construction plays like SCGB are preferred to ride the potential strong earnings growth from a growing order book. Its precast concrete division (contributes 51% of net profit) also benefits from the weak Ringgit as it derives SGD revenue. SCGB is added as one of our top sector BUYs. Key risks are public infrastructure project implementation delays and cost overruns. Earnings & Valuation Summary FYE 31 Dec 2013 2014 2015E 2016E 2017E Revenue (RMm) 1,839.6 1,880.7 1,791.2 1,843.3 2,290.1 EBITDA (RMm) 120.8 172.3 188.9 203.8 261.6 Pretax profit (RMm) 89.8 151.3 149.4 169.1 225.5 Net profit (RMm) 66.9 124.8 129.5 142.0 175.9 EPS (sen) 5.2 9.7 10.0 11.0 13.6 PER (x) 26.1 14.0 13.5 12.3 9.9 Core net profit (RMm) 98.4 130.1 133.1 142.0 175.9 Core EPS (sen) 7.6 10.1 10.3 11.0 13.6 Core EPS growth (%) 38.8 32.2 2.3 6.7 23.8 Core PER (x) 17.7 13.4 13.1 12.3 9.9 Net DPS (sen) 0.0 0.0 5.0 5.5 6.5 Dividend Yield (%) 0.0 0.0 3.7 4.1 4.8 EV/EBITDA (x) 13.9 9.3 7.7 7.0 5.2 Chg in EPS (%) new new new Affin/Consensus (x) 1.0 1.0 1.2 Source: Company, Affin Hwang estimates Initiation of Coverage Sunway Construction SCGB MK Sector: Construction RM1.35 @ 18 January 2016 BUY (initiation) Upside 30% Price Target: RM1.76 Previous Target: - 1.00 1.05 1.10 1.15 1.20 1.25 1.30 1.35 1.40 1.45 1.50 Jul-15 Aug-15 Sep-15 Oct-15 Nov-15 Dec-15 (RM) Price Performance 1M 3M 12M Absolute -2.2% +7.1% N/A Rel to KLCI -0.9% +13.4% N/A Stock Data Issued shares (m) 1,292.9 Mkt cap (RMm)/(US$m) 1,745.4/397.1 Avg daily vol - 6mth (m) N/A 52-wk range (RM) 0.98-1.45 Est free float 45.6% BV per share (RM) 0.33 P/BV (x) 4.1 Net cash/ (debt) (RMm) (3Q15) 198.6 ROE (2015F) 30.9% Derivatives Nil Shariah Compliant Yes Key Shareholder Sunway Bhd 54.4% Source: Affin Hwang, Bloomberg Loong Chee Wei CFA (603) 2148 7548 [email protected]
Transcript
18 January 2016
Affin Hwang Investment Bank Bhd (14389-U) (Formerly known as HwangDBS Investment Bank Bhd)
Page 1 of 17
One-stop contractor We initiate coverage on Sunway Construction Group (SCGB) with a
BUY call and target price of RM1.76, based on 10% discount to
RNAV. SCGB is in a strong position to win civil work packages worth
more than RM3bn for several large-scale infrastructure projects to be
rolled out in 2016. SCGB is distinctive, offering a pure construction
company exposure as it is not involved in property development and
other non-related businesses compared to peers. Suncon’s current
ex-cash FY16E PER of 11x and net yield of 4% are attractive.
Strong track record
SCGB is an integrated construction and precast concrete manufacturer that has a strong track record. It is one of the few contractors to be involved in all three major public transportation projects in the Klang Valley, ie, Bus Rapid Transit (BRT) Sunway Line, Light Rail Transit (LRT) Kelana Jaya Line extension, and Mass Rapid Transit Line 1 (MRT1).
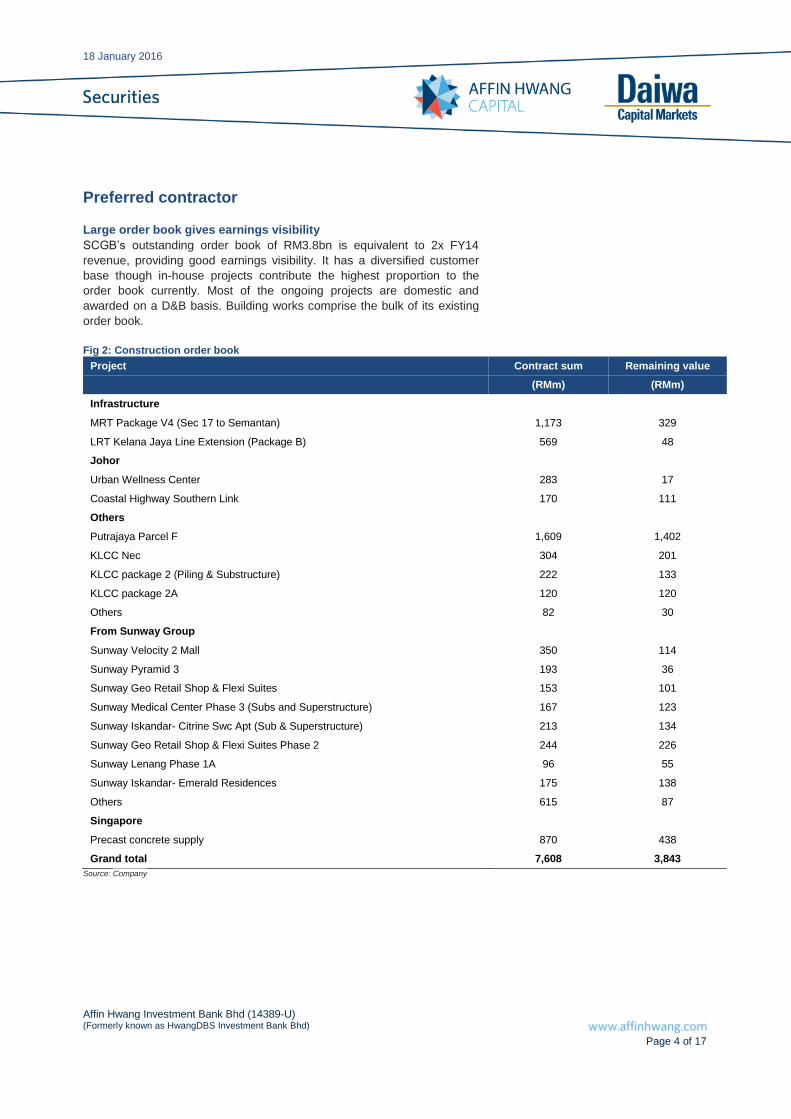
Preferred contractor
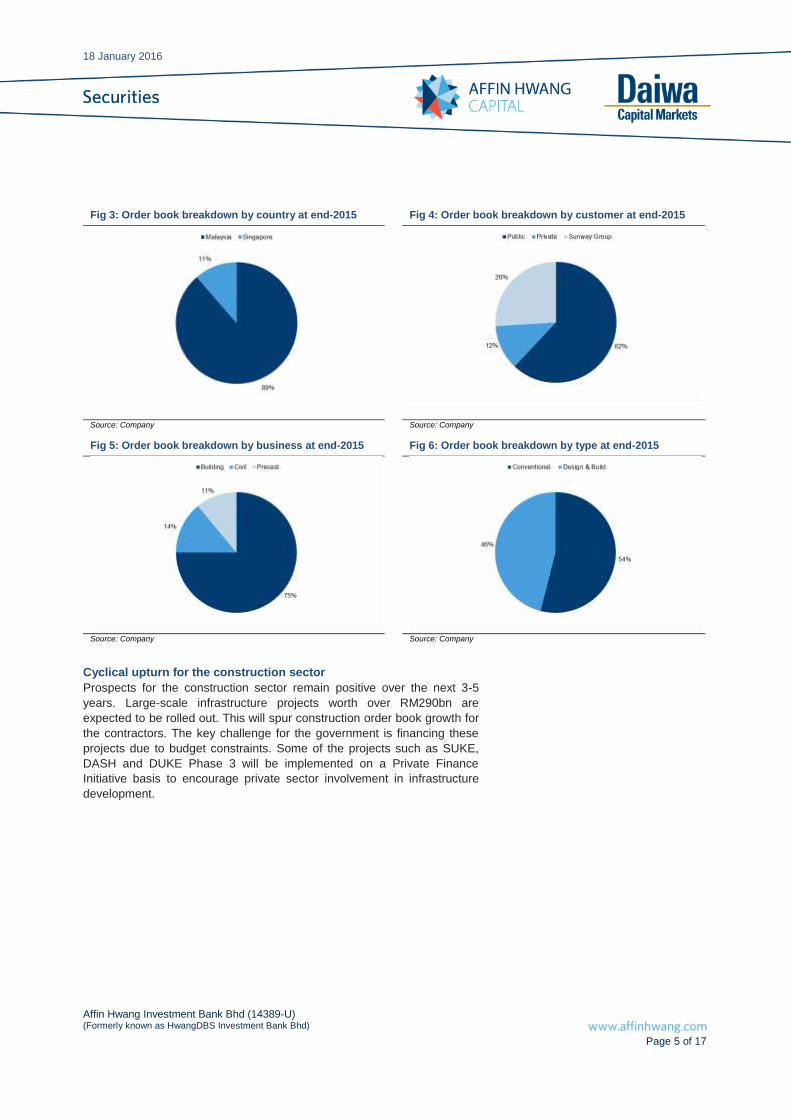
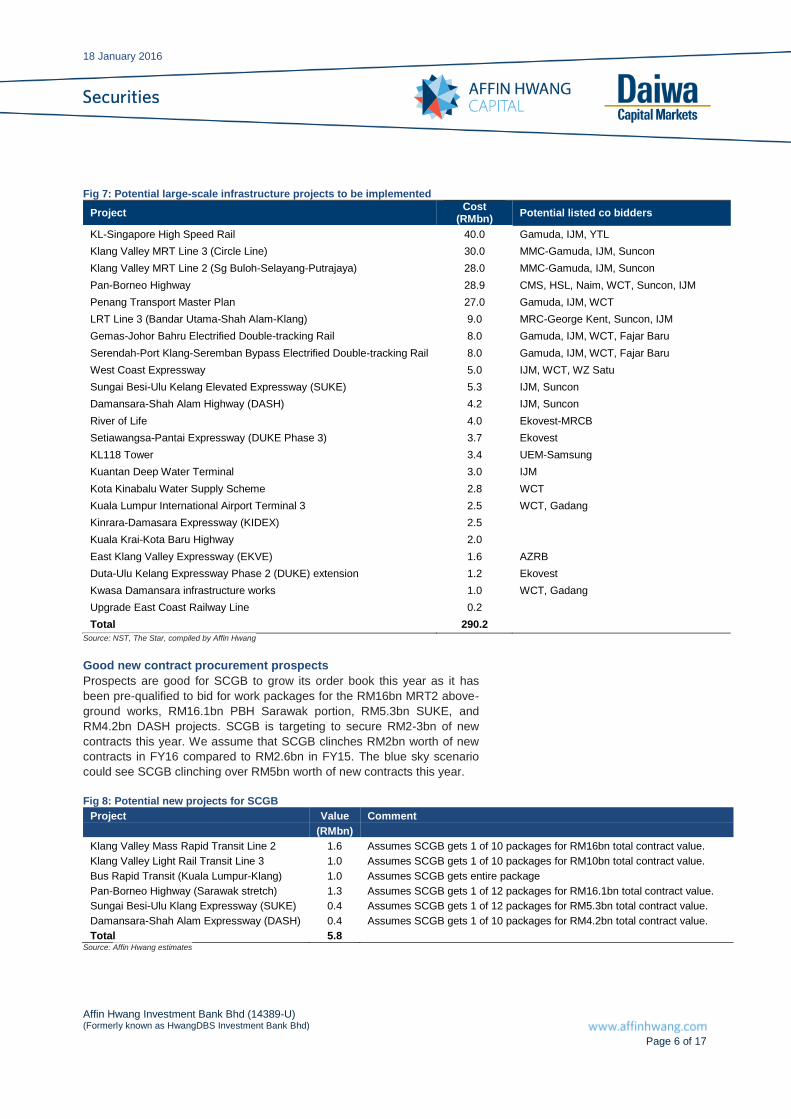
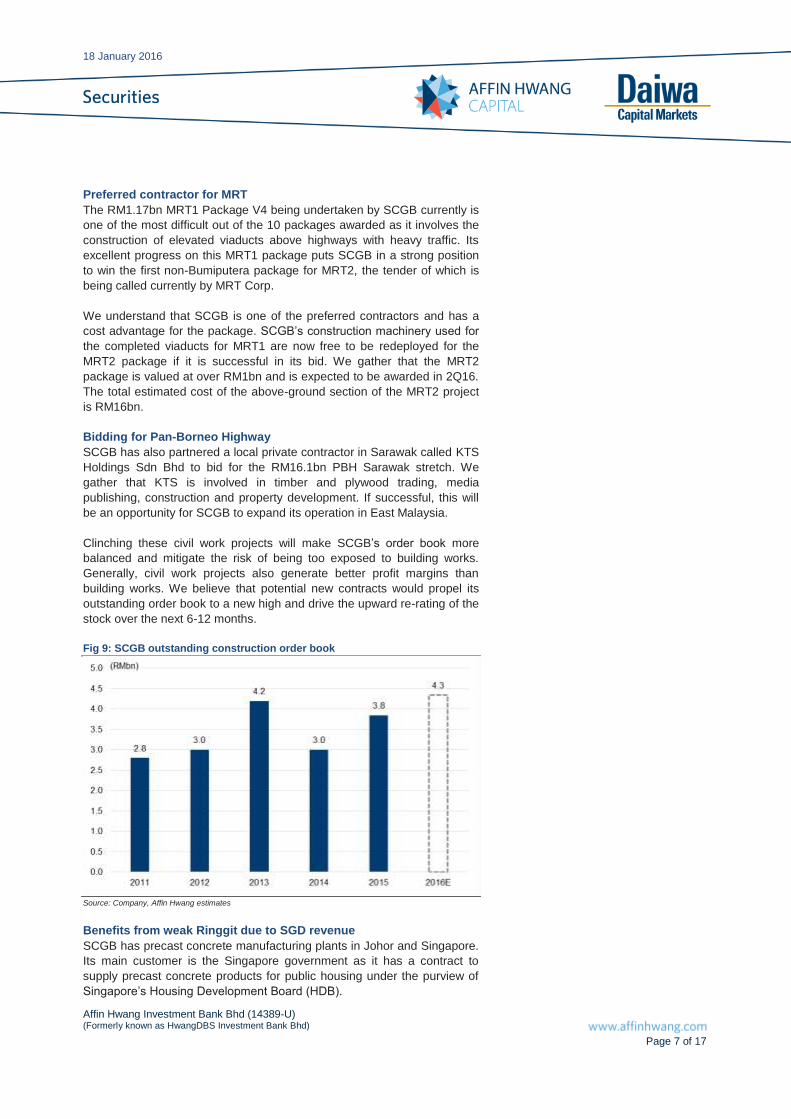
Outstanding order book of RM3.8bn is equivalent to 2x FY14 revenue, providing good earnings visibility. In addition, SCGB has been pre-qualified to bid for work packages for the RM16bn MRT2 above-ground works, RM16.1bn Pan-Borneo Highway (PBH) Sarawak portion, RM5.3bn Sungai Besi-Ulu Klang Expressway (SUKE), and RM4.2bn Damansara-Shah Alam Highway (DASH) projects. We assume that SCGB clinches RM2bn worth of new contracts in FY16 compared to RM2.6bn in FY15. Strong financial position
SCGB had net cash of RM199bn or RM0.15/share (11% of its current market capitalization) as at 30 September 2015. Its net cash position also supports the company’s dividend policy to maintain a pay out of at least 35% of net profit. Assuming a 50% dividend payout, we forecast net yield of 3.7% in FY15E and 4% in FY16E. BUY for pure construction exposure
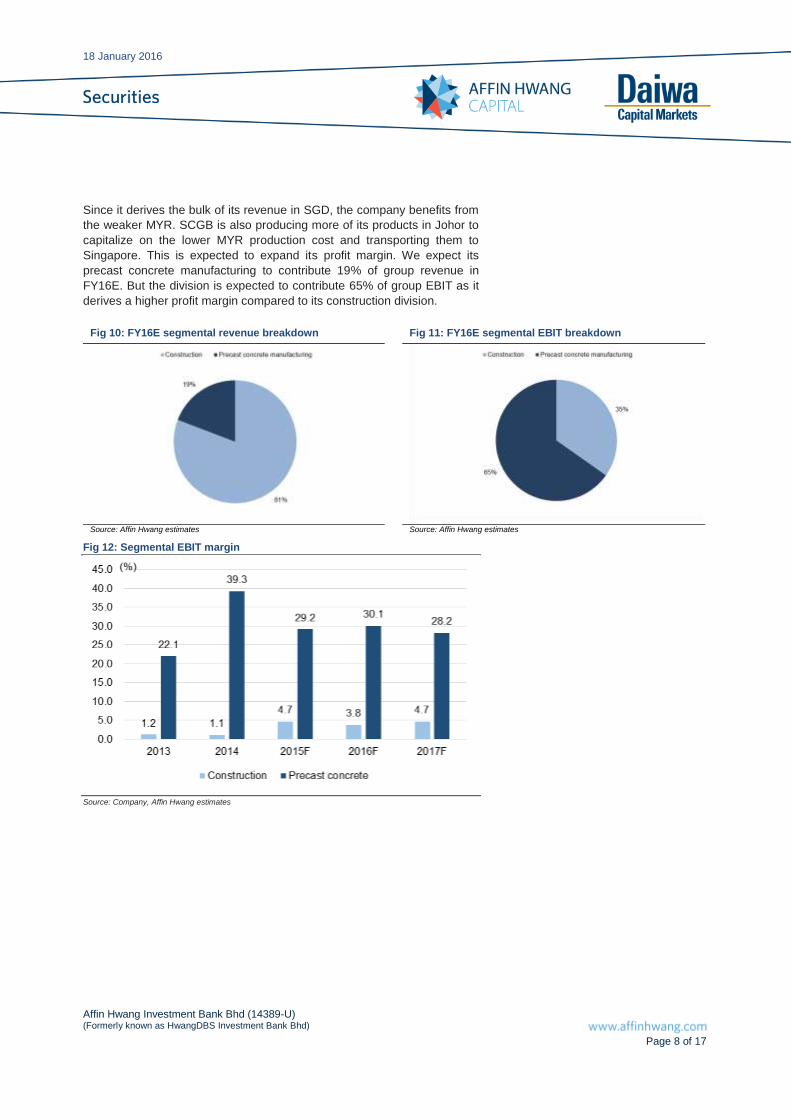
In the current cyclical upturn for the construction sector, pure construction plays like SCGB are preferred to ride the potential strong earnings growth from a growing order book. Its precast concrete division (contributes 51% of net profit) also benefits from the weak Ringgit as it derives SGD revenue. SCGB is added as one of our top sector BUYs. Key risks are public infrastructure project implementation delays and cost overruns. Earnings & Valuation Summary
Affin Hwang Investment Bank Bhd (14389-U) (Formerly known as HwangDBS Investment Bank Bhd)
Page 9 of 17
Strong financial position Net cash is 11% of market cap
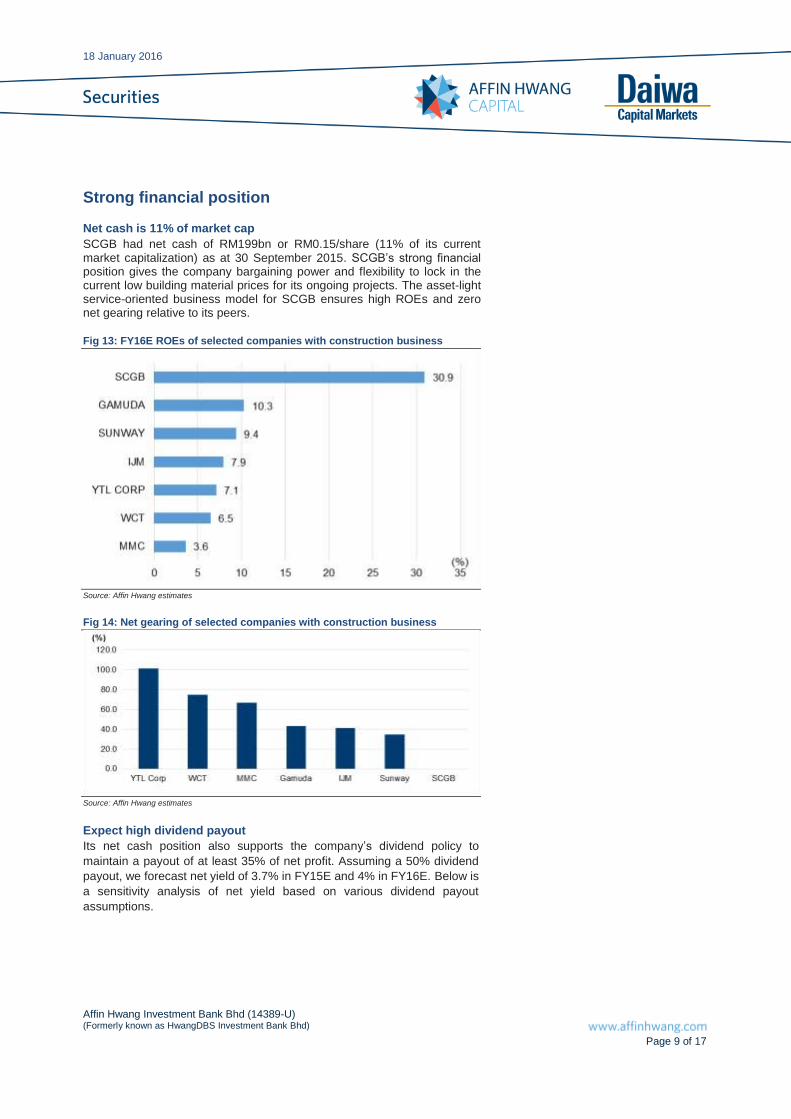
SCGB had net cash of RM199bn or RM0.15/share (11% of its current market capitalization) as at 30 September 2015. SCGB’s strong financial position gives the company bargaining power and flexibility to lock in the current low building material prices for its ongoing projects. The asset-light service-oriented business model for SCGB ensures high ROEs and zero net gearing relative to its peers. Fig 13: FY16E ROEs of selected companies with construction business
Source: Affin Hwang estimates
Fig 14: Net gearing of selected companies with construction business
Source: Affin Hwang estimates
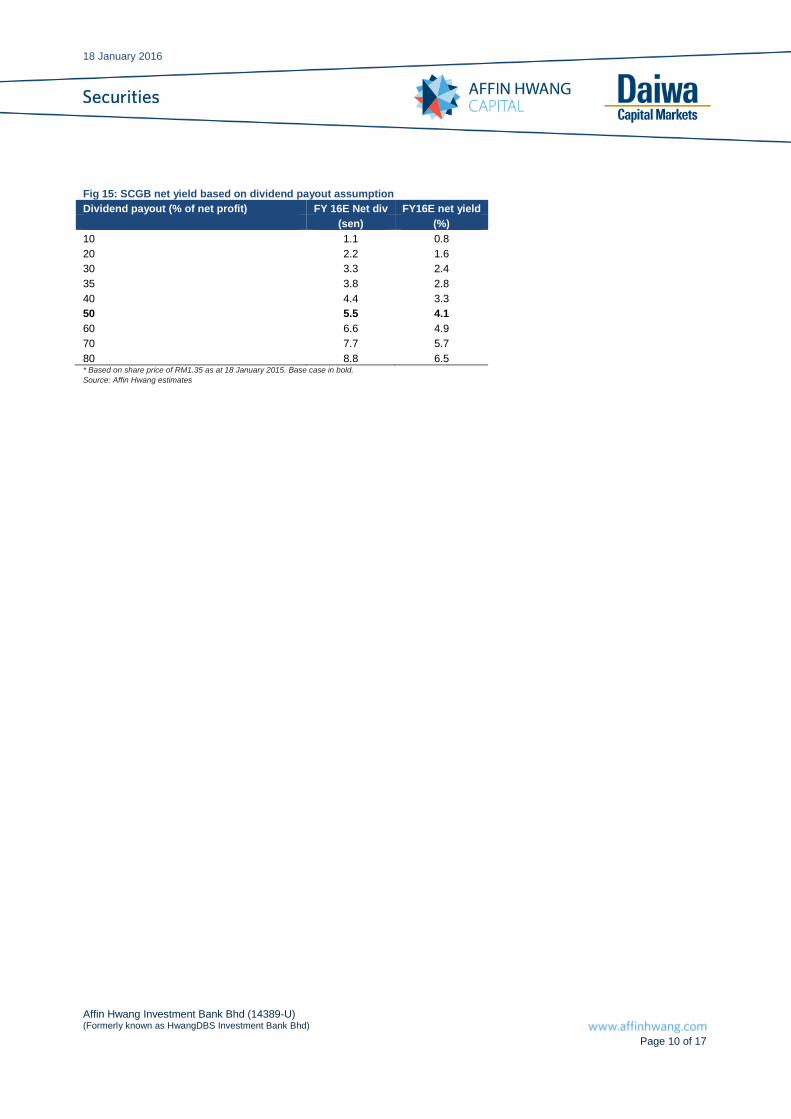
Expect high dividend payout
Its net cash position also supports the company’s dividend policy to
maintain a payout of at least 35% of net profit. Assuming a 50% dividend
payout, we forecast net yield of 3.7% in FY15E and 4% in FY16E. Below is
a sensitivity analysis of net yield based on various dividend payout
assumptions.
18 January 2016
Affin Hwang Investment Bank Bhd (14389-U) (Formerly known as HwangDBS Investment Bank Bhd)
Page 10 of 17
Fig 15: SCGB net yield based on dividend payout assumption
Dividend payout (% of net profit) FY 16E Net div FY16E net yield
(sen) (%)
10 1.1 0.8
20 2.2 1.6
30 3.3 2.4
35 3.8 2.8
40 4.4 3.3
50 5.5 4.1
60 6.6 4.9
70 7.7 5.7
80 8.8 6.5 * Based on share price of RM1.35 as at 18 January 2015. Base case in bold.
Source: Affin Hwang estimates
18 January 2016
Affin Hwang Investment Bank Bhd (14389-U) (Formerly known as HwangDBS Investment Bank Bhd)
Page 11 of 17
BUY for pure construction exposure
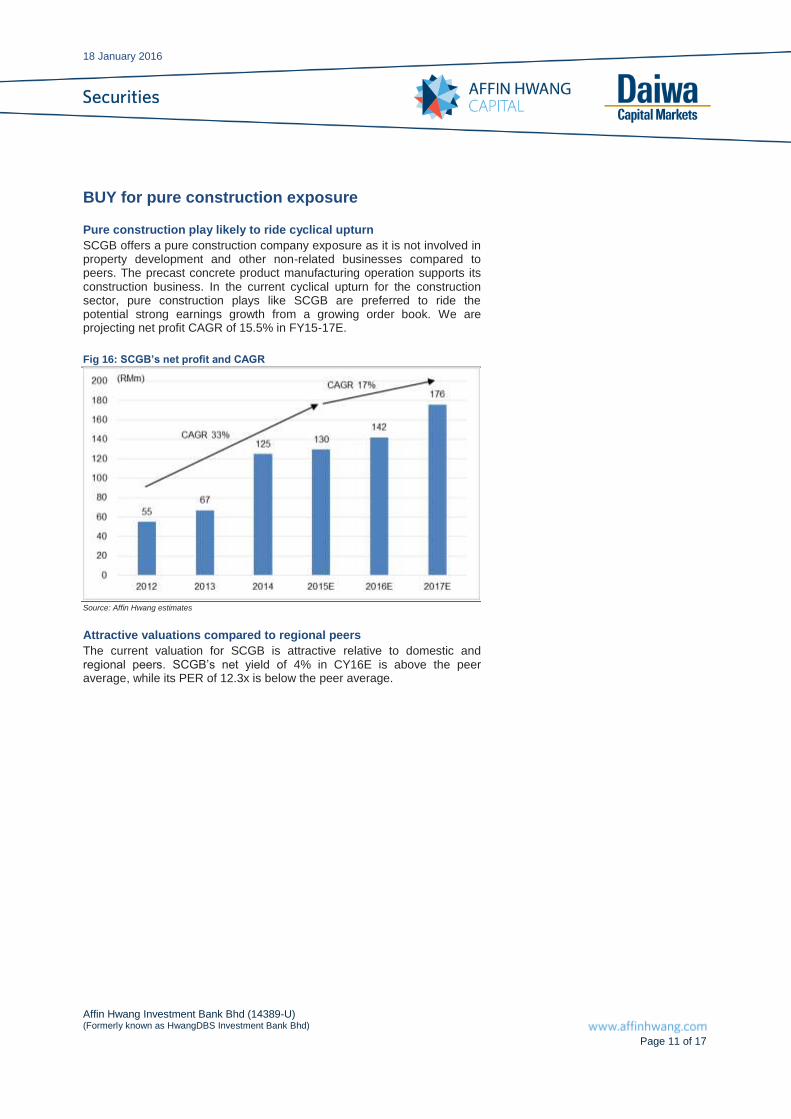
Pure construction play likely to ride cyclical upturn
SCGB offers a pure construction company exposure as it is not involved in property development and other non-related businesses compared to peers. The precast concrete product manufacturing operation supports its construction business. In the current cyclical upturn for the construction sector, pure construction plays like SCGB are preferred to ride the potential strong earnings growth from a growing order book. We are projecting net profit CAGR of 15.5% in FY15-17E.
Fig 16: SCGB’s net profit and CAGR
Source: Affin Hwang estimates
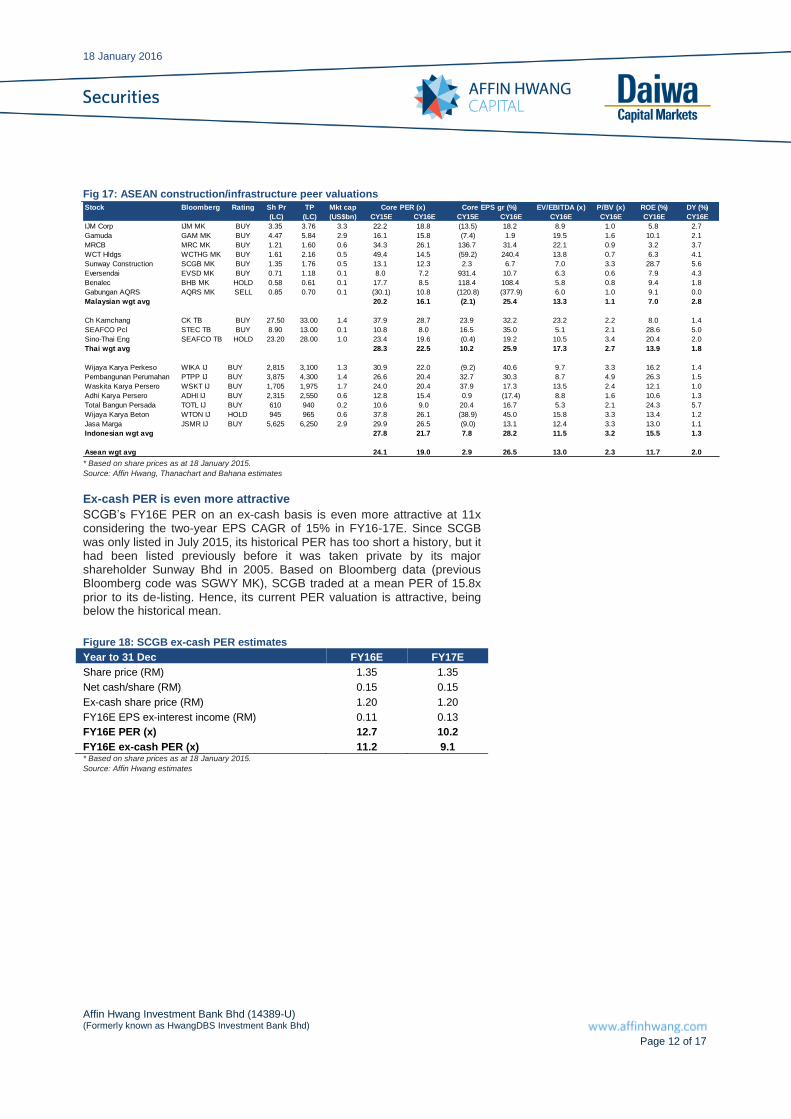
Attractive valuations compared to regional peers
The current valuation for SCGB is attractive relative to domestic and regional peers. SCGB’s net yield of 4% in CY16E is above the peer average, while its PER of 12.3x is below the peer average.
18 January 2016
Affin Hwang Investment Bank Bhd (14389-U) (Formerly known as HwangDBS Investment Bank Bhd)
Page 12 of 17
Fig 17: ASEAN construction/infrastructure peer valuations Stock Bloomberg Rating Sh Pr TP Mkt cap EV/EBITDA (x) P/BV (x) ROE (%) DY (%)
Source: Affin Hwang, Thanachart and Bahana estimates
Ex-cash PER is even more attractive
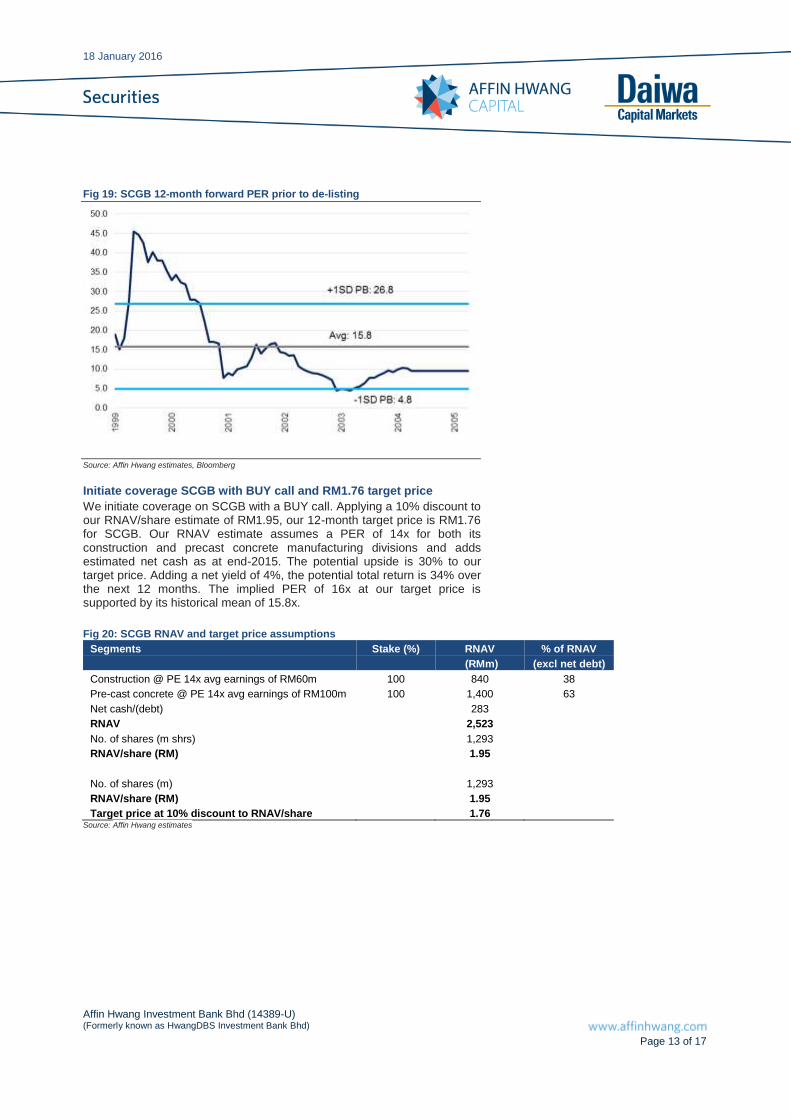
SCGB’s FY16E PER on an ex-cash basis is even more attractive at 11x considering the two-year EPS CAGR of 15% in FY16-17E. Since SCGB was only listed in July 2015, its historical PER has too short a history, but it had been listed previously before it was taken private by its major shareholder Sunway Bhd in 2005. Based on Bloomberg data (previous Bloomberg code was SGWY MK), SCGB traded at a mean PER of 15.8x prior to its de-listing. Hence, its current PER valuation is attractive, being below the historical mean.
Figure 18: SCGB ex-cash PER estimates
Year to 31 Dec FY16E FY17E
Share price (RM) 1.35 1.35
Net cash/share (RM) 0.15 0.15
Ex-cash share price (RM) 1.20 1.20
FY16E EPS ex-interest income (RM) 0.11 0.13
FY16E PER (x) 12.7 10.2
FY16E ex-cash PER (x) 11.2 9.1 * Based on share prices as at 18 January 2015.
Source: Affin Hwang estimates
18 January 2016
Affin Hwang Investment Bank Bhd (14389-U) (Formerly known as HwangDBS Investment Bank Bhd)
Page 13 of 17
Fig 19: SCGB 12-month forward PER prior to de-listing
Source: Affin Hwang estimates, Bloomberg
Initiate coverage SCGB with BUY call and RM1.76 target price
We initiate coverage on SCGB with a BUY call. Applying a 10% discount to our RNAV/share estimate of RM1.95, our 12-month target price is RM1.76 for SCGB. Our RNAV estimate assumes a PER of 14x for both its construction and precast concrete manufacturing divisions and adds estimated net cash as at end-2015. The potential upside is 30% to our target price. Adding a net yield of 4%, the potential total return is 34% over the next 12 months. The implied PER of 16x at our target price is supported by its historical mean of 15.8x.
Fig 20: SCGB RNAV and target price assumptions
Segments Stake (%) RNAV % of RNAV
(RMm) (excl net debt)
Construction @ PE 14x avg earnings of RM60m 100 840 38
Pre-cast concrete @ PE 14x avg earnings of RM100m 100 1,400 63
Net cash/(debt)
283 RNAV
2,523
No. of shares (m shrs)
1,293 RNAV/share (RM)
1.95
No. of shares (m)
1,293 RNAV/share (RM)
1.95
Target price at 10% discount to RNAV/share 1.76 Source: Affin Hwang estimates
18 January 2016
Affin Hwang Investment Bank Bhd (14389-U) (Formerly known as HwangDBS Investment Bank Bhd)
Page 14 of 17
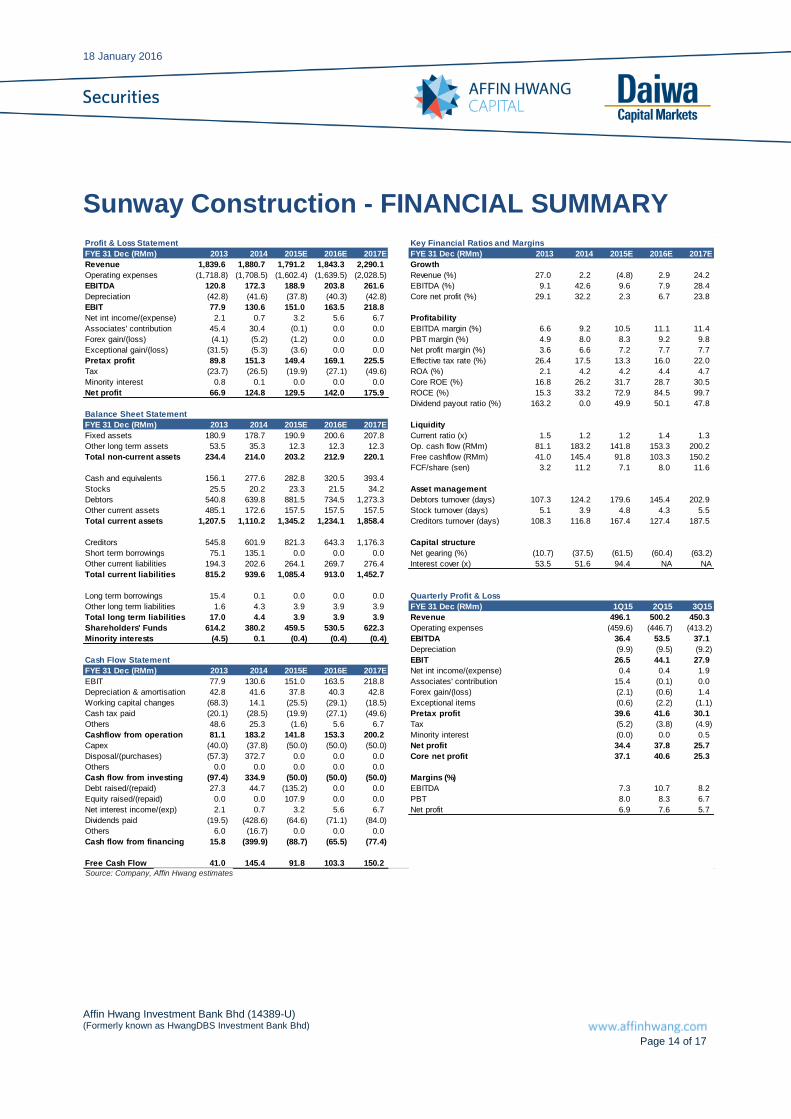
Sunway Construction - FINANCIAL SUMMARY
Profit & Loss Statement Key Financial Ratios and Margins
FYE 31 Dec (RMm) 2013 2014 2015E 2016E 2017E FYE 31 Dec (RMm) 2013 2014 2015E 2016E 2017E
Cash flow from financing 15.8 (399.9) (88.7) (65.5) (77.4)
Free Cash Flow 41.0 145.4 91.8 103.3 150.2
Source: Company, Affin Hwang estimates
18 January 2016
Affin Hwang Investment Bank Bhd (14389-U) (Formerly known as HwangDBS Investment Bank Bhd)
Page 15 of 17
Important Disclosures and Disclaimer This publication is prepared by Affin Hwang Investment Bank Berhad (“Affin Hwang”) and reviewed by Daiwa Securities Group Inc. and/or its non-U.S. affiliates (collectively, “Daiwa”), and is distributed and/or originated from outside Malaysia by Daiwa Securities Group Inc. and/or its non-U.S. affiliates, except to the extent expressly provided herein. The role of Daiwa Securities Group Inc. and/or its non-U.S. affiliates in connection with this publication is solely limited to the review and distribution of this publication ; and Daiwa Securities Group Inc. and/or its non-U.S. affiliates are not involved in the preparation of this publication in any other way. This research is for Daiwa clients only and the publication and the contents hereof are intended for information purposes only, and may be subject to change without further notice. Other than disclosures relating to Daiwa, this research is based on current public information that Affin Hwang and Daiwa consider reliable, but we do not represent it is accurate or complete, and it should not be relied on as such. The analysts named in this report may have from time to time discussed with clients, including Daiwa’s salespersons and traders, or may discuss in this report, trading strategies that reference catalysts or events that may have a near-term impact on the market price of the equity securities discussed in this report, which impact may be directionally counter to the analysts' published price target expectations for such stocks. Any such trading strategies are distinct from and do not affect the analysts' fundamental equity rating for such stocks, which rating reflects a stock's return potential relative to its coverage group as described herein. Any use, disclosure, distribution, dissemination, copying, printing or reliance on this publication for any other purpose without our prior consent or approval is strictly prohibited. Neither Affin Hwang ,Daiwa Securities Group Inc. nor any of its or their respective parent, holding, subsidiaries or affiliates, nor any of its or their respective directors, officers, servants and employees, represent nor warrant the accuracy or completeness of the information contained herein or as to the existence of other facts which might be significant, and will not accept any responsibility or liability whatsoever for any use of or reliance upon this publication or any of the contents hereof. Neither this publication, nor any content hereof, constitute, or are to be construed as, an offer or solicitation of an offer to buy or sell any of the securities or investments mentioned herein in any country or jurisdiction where such an offer or solicitation would be illegal nor, unless expressly provided, any recommendation or investment opinion or advice. Any view, recommendation, opinion or advice expressed in this publication constitutes the views of the analyst(s) named herein and does not necessarily reflect those of Affin Hwang, Daiwa Securities Group Inc. and/or its affiliates nor any of its respective directors, officers, servants and employees except where the publication states otherwise. This research report is not to be relied upon by any person in making any investment decision or otherwise advising with respect to, or dealing in, the securities mentioned, as it does not take into account the specific investment objectives, financial situation and particular needs of any person. Clients should consider whether any advice or recommendation in this research is suitable for their particular circumstances and, if appropriate, seek professional advice, including tax advice. The price and value of investments referred to in this research and the income from them may fluctuate. Past performance is not a guide to future performance, future returns are not guaranteed, and a loss of original capital may occur. Fluctuations in exchange rates could have adverse effects on the value or price of, or income derived from, certain investments. Certain transactions, including those involving futures, options, and other derivatives, give rise to substantial risk and are not suitable for all investors. Investors should review current options disclosure documents in relation to such investments. All research reports are disseminated and available to our clients simultaneously through electronic publication to our internal client websites. Not all research content is redistributed to our clients or available to third-party aggregators, nor is Daiwa and Affin Hwang responsible for the redistribution of our research by third party aggregators. Affin Hwang, Daiwa Securities Group Inc., its subsidiaries and affiliates, and its or their respective directors, officers and employees, from time to time may have trades as principals, or may have positions in, or have other interests in the securities of the company under research including market making activities, derivatives in respect of such securities or may have also performed investment banking and other services for the issuer of such securities. The following are additional disclosures. Ownership of Securities For “Ownership of Securities” information, please visit BlueMatrix disclosure link at https://daiwa3.bluematrix.com/sellside/Disclosures.action. Investment Banking Relationship For “Investment Banking Relationship”, please visit BlueMatrix disclosure link at https://daiwa3.bluematrix.com/sellside/Disc losures.action.
Japan
Disclosure of Interest of Daiwa Securities Group Inc.
Investment Banking Relationship
Within the preceding 12 months, the subsidiaries and/or affiliates of Daiwa Securities Group Inc. * has lead-managed public offerings and/or secondary offerings (excluding straight bonds) of the securities of the following companies: Modern Land (China) Co. Ltd (1107 HK); econtext Asia Ltd (1390 HK); Accordia Golf Trust (AGT SP); GF Securities Co Ltd (1776 HK); Mirae Asset Life Insurance Co Ltd (085620 KS); China Reinsurance Group Corporation (1508 HK).
*Subsidiaries of Daiwa Securities Group Inc. for the purposes of this section shall mean any one or more of: Daiwa Capital Markets Hong Kong Limited (大和資本市場香港有限公
司), Daiwa Capital Markets Singapore Limited, Daiwa Capital Markets Australia Limited, Daiwa Capital Markets India Private Limited, Daiwa-Cathay Capital Markets Co., Ltd.,
Daiwa Securities Capital Markets Korea Co., Ltd.
This research may only be distributed in Japan to “qualified institutional investors”, as defined in the Financial Instruments and Exchange Act (Article 2 (3) (i)), as amended from time to time.
Disclosure of Interest of Affin Hwang Investment Bank -
Hong Kong
This research is distributed in Hong Kong by Daiwa Capital Markets Hong Kong Limited (大和資本市場香港有限公司) (“DHK”) which is regulated by the Hong Kong Securities and
Futures Commission. Recipients of this research in Hong Kong may contact DHK in respect of any matter arising from or in connection with this research. Relevant Relationship (DHK) DHK may from time to time have an individual employed by or associated with it serves as an officer of any of the companies under its research coverage.
Singapore
This research is distributed in Singapore by Daiwa Capital Markets Singapore Limited and it may only be distributed in Singapore to accredited investors, expert investors and institutional investors as defined in the Financial Advisers Regulations and the Securities and Futures Act (Chapter 289), as amended from time to time. By virtue of distribution to these category of investors, Daiwa Capital Markets Singapore Limited and its representatives are not required to comply with Section 36 of the Financial Advisers Act (Chapter 110) (Section 36 relates to disclosure of Daiwa Capital Markets Singapore Limited’s interest and/or its representative’s interest in securities). Recipients of this research in Singapore may contact Daiwa Capital Markets Singapore Limited in respect of any matter arising from or in connection with the research.
Australia
This research is distributed in Australia by Daiwa Capital Markets Stockbroking Limited and it may only be distributed in Australia to wholesale investors within the meaning of the Corporations Act. Recipients of this research in Australia may contact Daiwa Capital Markets Stockbroking Limited in respect of any matter arising from or in connection with the research.
India
This research is distributed in India to Institutional Clients only by Daiwa Capital Markets India Private Limited (Daiwa India) which is an intermediary registered with Securities & Exchange Board of India as a Stock Broker, Merchant Bank and Research Analyst. Daiwa India, its Research Analyst and their family members and its associates do not have any financial interest save as disclosed or other undisclosed material conflict of interest in the securities or derivatives of any companies under coverage. Daiwa India and i ts associates may have received compensation for any products other than Investment Banking (as disclosed) or brokerage services from the subject company in this report during the past 12 months. Unless otherwise stated in BlueMatrix disclosure link at https://daiwa3.bluematrix.com/sellside/Disclosures.action, Daiwa India and its associates do not hold more than 1% of any companies covered in this research report.
There is no material disciplinary action against Daiwa India by any regulatory authority impacting equity research analysis activities as of the date of this report.
18 January 2016
Affin Hwang Investment Bank Bhd (14389-U) (Formerly known as HwangDBS Investment Bank Bhd)
Page 16 of 17
Taiwan
This research is distributed in Taiwan by Daiwa-Cathay Capital Markets Co., Ltd and it may only be distributed in Taiwan to institutional investors or specific investors who have signed recommendation contracts with Daiwa-Cathay Capital Markets Co., Ltd in accordance with the Operational Regulations Governing Securities Firms Recommending Trades in Securities to Customers. Recipients of this research in Taiwan may contact Daiwa-Cathay Capital Markets Co., Ltd in respect of any matter arising from or in connection with the research.
Philippines
This research is distributed in the Philippines by DBP-Daiwa Capital Markets Philippines, Inc. which is regulated by the Philippines Securities and Exchange Commission and the Philippines Stock Exchange, Inc. Recipients of this research in the Philippines may contact DBP-Daiwa Capital Markets Philippines, Inc. in respect of any matter arising from or in connection with the research. DBP-Daiwa Capital Markets Philippines, Inc. recommends that investors independently assess, with a professional advisor, the specific financial risks as well as the legal, regulatory, tax, accounting, and other consequences of a proposed transaction. DBP-Daiwa Capital Markets Philippines, Inc. may have positions or may be materially interested in the securities in any of the markets mentioned in the publication or may have performed other services for the issuers of such securities.
For relevant securities and trading rules please visit SEC and PSE link at http://www.sec.gov.ph/irr/AmendedIRRfinalversion.pdf and http://www.pse.com.ph/ respectively.
United Kingdom
This research report is produced by Daiwa Securities Co. Ltd. and/or its affiliates and is distributed in the European Union, Iceland, Liechtenstein, Norway and Switzerland. Daiwa Capital Markets Europe Limited is authorised and regulated by The Financial Conduct Authority (“FCA”) and is a member of the London Stock Exchange and Eurex. This publication is intended for investors who are not Retail Clients in the United Kingdom within the meaning of the Rules of the FCA and should not therefore be distributed to such Retail Clients in the United Kingdom. Should you enter into investment business with Daiwa Capital Markets Europe’s affiliates outside the United Kingdom, we are obliged to advise that the protection afforded by the United Kingdom regulatory system may not apply; in particular, the benefits of the Financial Services Compensation Scheme may not be available. Daiwa Capital Markets Europe Limited has in place organisational arrangements for the prevention and avoidance of conflicts of interest. Our conflict management policy is available at http://www.uk.daiwacm.com/about-us/corporate-governance-regulatory.
Germany
This document is distributed in Germany by Daiwa Capital Markets Europe Limited, Niederlassung Frankfurt which is regulated by BaFin (Bundesanstalt fuer Finanzdienstleistungsaufsicht) for the conduct of business in Germany.
Bahrain
This research material is distributed in Bahrain by Daiwa Capital Markets Europe Limited, Bahrain Branch, regulated by The Central Bank of Bahrain and holds Investment Business Firm – Category 2 license and having its official place of business at the Bahrain World Trade Centre, South Tower, 7th floor, P.O. Box 30069, Manama, Kingdom of Bahrain. Tel No. +973 17534452 Fax No. +973 535113
United States
This report is distributed in the U.S. by Daiwa Capital Markets America Inc. (DCMA). It may not be accurate or complete and should not be relied upon as such. It reflects the preparer’s views at the time of its preparation, but may not reflect events occurring after its preparation; nor does it reflect DCMA’s views at any time. Neither DCMA nor the preparer has any obligation to update this report or to continue to prepare research on this subject. This report is not an offer to sell or the solicitation of any offer to buy securities. Unless this report says otherwise, any recommendation it makes is risky and appropriate only for sophisticated speculative investors able to incur significant losses. Readers should consult their financial advisors to determine whether any such recommendation is consistent with their own investment objectives, financial situation and needs. This report does not recommend to U.S. recipients the use of any of DCMA’s non-U.S. affiliates to effect trades in any security and is not supplied with any understanding that U.S. recipients of this report will direct commission business to such non-U.S. entities. Unless applicable law permits otherwise, non-U.S. customers wishing to effect a transaction in any securities referenced in this material should contact a Daiwa entity in their local jurisdiction. Most countries throughout the world have their own laws regulating the types of securities and other investment products which may be offered to their residents, as well as a process for doing so. As a result, the securities discussed in this report may not be eligible for sales in some jurisdictions. Customers wishing to obtain further information about this report should contact DCMA: Daiwa Capital Markets America Inc., Financial Square, 32 Old Slip, New York, New York 10005 (Tel no. 212-612-7000). Ownership of Securities For “Ownership of Securities” information please visit BlueMatrix disclosure link at https://daiwa3.bluematrix.com/sellside/Disclosures.action. Investment Banking Relationships For “Investment Banking Relationships” please visit BlueMatrix disclosure link at https://daiwa3.bluematrix.com/sellside/Disclosures.action. DCMA Market Making For “DCMA Market Making” please visit BlueMatrix disclosure link at https://daiwa3.bluematrix.com/sellside/Disclosures.action. Research Analyst Conflicts For updates on “Research Analyst Conflicts” please visit BlueMatrix disclosure link at https://daiwa3.bluematrix.com/sellside/Disclosures.action. The principal research analysts who prepared this report have no financial interest in securities of the issuers covered in the report, are not (nor are any members of their household) an officer, director or advisory board member of the issuer(s) covered in the report, and are not aware of any material relevant conflict of interest involving the analyst or DCMA, and did not receive any compensation from the issuer during the past 12 months except as noted: no exceptions. Research Analyst Certification For updates on “Research Analyst Certification” and “Rating System” please visit BlueMatrix disclosure link at https://daiwa3.bluematrix.com/sellside/Disclosures.action. The views about any and all of the subject securities and issuers expressed in this Research Report accurately reflect the personal views of the research analyst(s) primarily responsible for this report (or the views of the firm producing the report if no individual analysts[s] is named on the report); and no part of the compensation of such analyst(s) (or no part of the compensation of the firm if no individual analyst[s)] is named on the report) was, is, or will be directly or indirectly related to the specific recommendations or views contained in this Research Report.
For stocks and sectors in Malaysia covered by Affin Hwang, the following rating system is in effect:
Stocks:
BUY: Total return is expected to exceed +10% over a 12-month period
HOLD: Total return is expected to be between -5% and +10% over a 12-month period
SELL: Total return is expected to be below -5% over a 12-month period
NOT RATED: Affin Hwang Investment Bank Berhad does not provide research coverage or rating for this company. Report is intended as information only and not as a recommendation
Sectors:
OVERWEIGHT: Industry, as defined by the analyst’s coverage universe, is expected to outperform the KLCI benchmark over the next 12 months
NEUTRAL: Industry, as defined by the analyst’s coverage universe, is expected to perform inline with the KLCI benchmark over the next 12 months
UNDERWEIGHT: Industry, as defined by the analyst’s coverage universe is expected to under-perform the KLCI benchmark over the next 12 months
Conflict of Interest Disclosure
Ownership of Securities
For “Ownership of Securities” information, please visit BlueMatrix disclosure Link at https://daiwa3.bluematrix.com/sellside/Disclosures.action.
Affin Hwang Investment Bank Bhd (14389-U) (Formerly known as HwangDBS Investment Bank Bhd)
Page 17 of 17
Investment Banking Relationships
For “Investment Banking Relationship”, please visit BlueMatrix disclosure Link at https://daiwa3.bluematrix.com/sellside/Disclosures.action.
Relevant Relationships
Affin Hwang may from time to time have an individual employed by or associated with it serves as an officer of any of the companies under its research coverage.
Affin Hwang market making
Affin Hwang may from time to time make a market in securities covered by this research.
Additional information may be available upon request.
Japan - additional notification items pursuant to Article 37 of the Financial Instruments and Exchange Law
(This Notification is only applicable where report is distributed by Daiwa Securities Co. Ltd.) If you decide to enter into a business arrangement with us based on the information described in materials presented along with this document, we ask you to pay close attention to the following items.
In addition to the purchase price of a financial instrument, we will collect a trading commission* for each transaction as agreed beforehand with you. Since commissions may be included in the purchase price or may not be charged for certain transactions, we recommend that you confirm the commission for each transaction.
In some cases, we may also charge a maximum of ¥ 2 million (including tax) per year as a standing proxy fee for our deposit of your securities, if you are a non-resident of Japan.
For derivative and margin transactions etc., we may require collateral or margin requirements in accordance with an agreement made beforehand with you. Ordinarily in such cases, the amount of the transaction will be in excess of the required collateral or margin requirements.
There is a risk that you will incur losses on your transactions due to changes in the market price of financial instruments based on fluctuations in interest rates, exchange rates, stock prices, real estate prices, commodity prices, and others. In addition, depending on the content of the transaction, the loss could exceed the amount of the collateral or margin requirements.
There may be a difference between bid price etc. and ask price etc. of OTC derivatives handled by us.
Before engaging in any trading, please thoroughly confirm accounting and tax treatments regarding your trading in financial instruments with such experts as certified public accountants. *The amount of the trading commission cannot be stated here in advance because it will be determined between our company and you based on current market conditions and the content of each transaction etc.
When making an actual transaction, please be sure to carefully read the materials presented to you prior to the execution of agreement, and to take responsibility for your own decisions regarding the signing of the agreement with us. Corporate Name: Daiwa Securities Co. Ltd. Financial instruments firm: chief of Kanto Local Finance Bureau (Kin-sho) No.108 Memberships: Japan Securities Dealers Association, The Financial Futures Association of Japan Japan Investment Advisers Association Type II Financial Instruments Firms Association