Page 1
See important disclosures, including any required research certifications, beginning on page 65
Taiwan Industrials
16 May 2017
Taiwan Industrial Robotics
Initiation: You’re hired!
Demand outlook for industrial robots positive, on rising penetration and more diverse applications in different sectors
Industrial robot supply chain in Taiwan looks to have strong upside thanks to automation demand in China and the local electronics sector
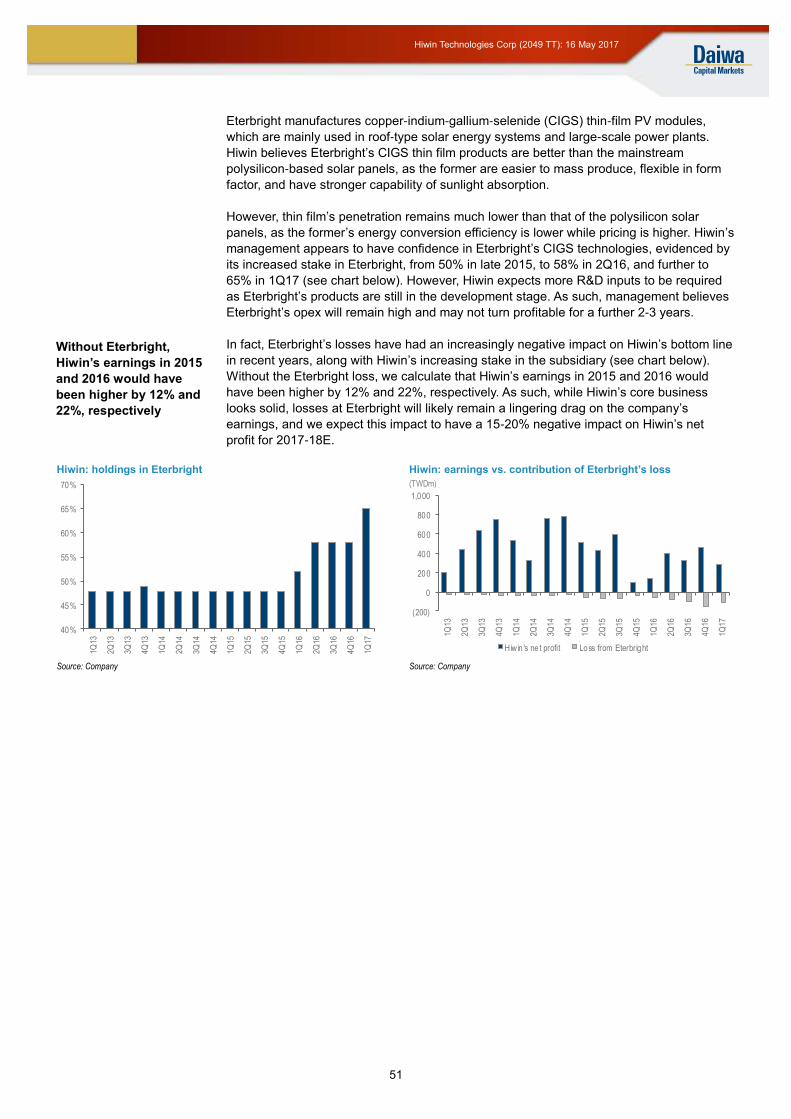
We favour Airtac and Delta for their market positions and earnings upside; cautious on Hiwin due to the drag from its subsidiary loss
Steven Tseng(886) 2 8758 6252
[email protected]
Elsa Cheng(886) 2 8758 6253
[email protected]
Page 2
See important disclosures, including any required research certifications, beginning on page 65
Taiwan Industrials
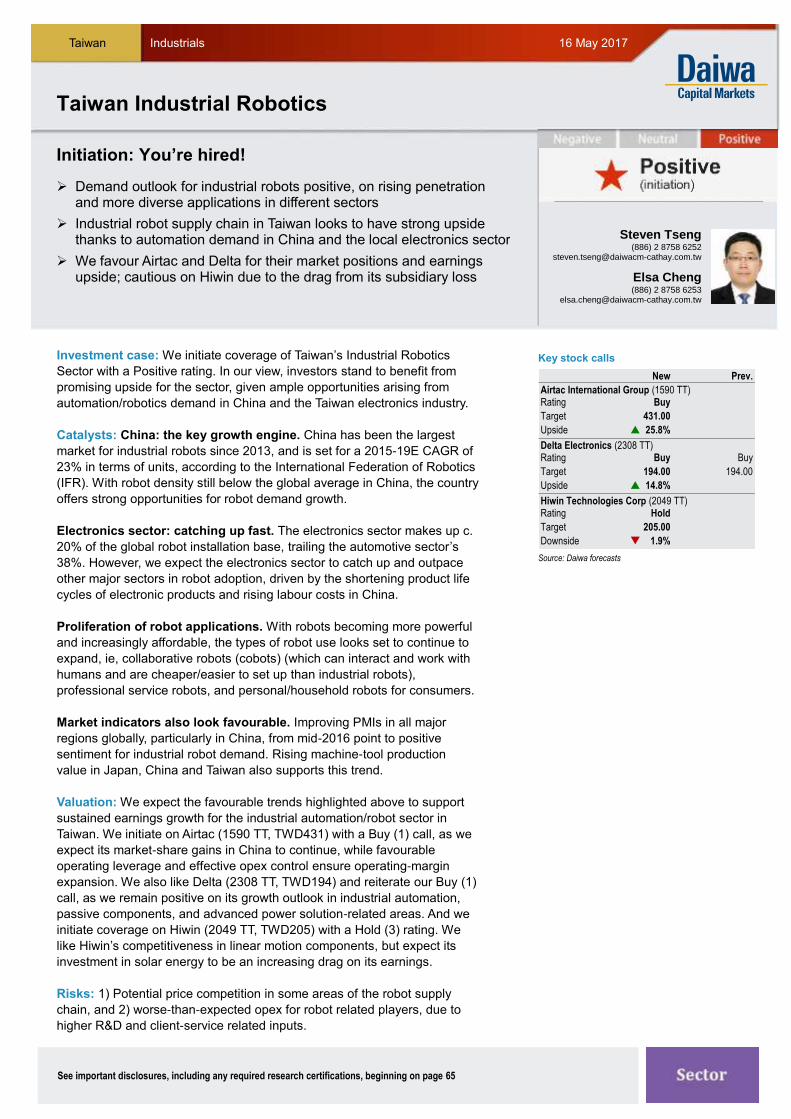
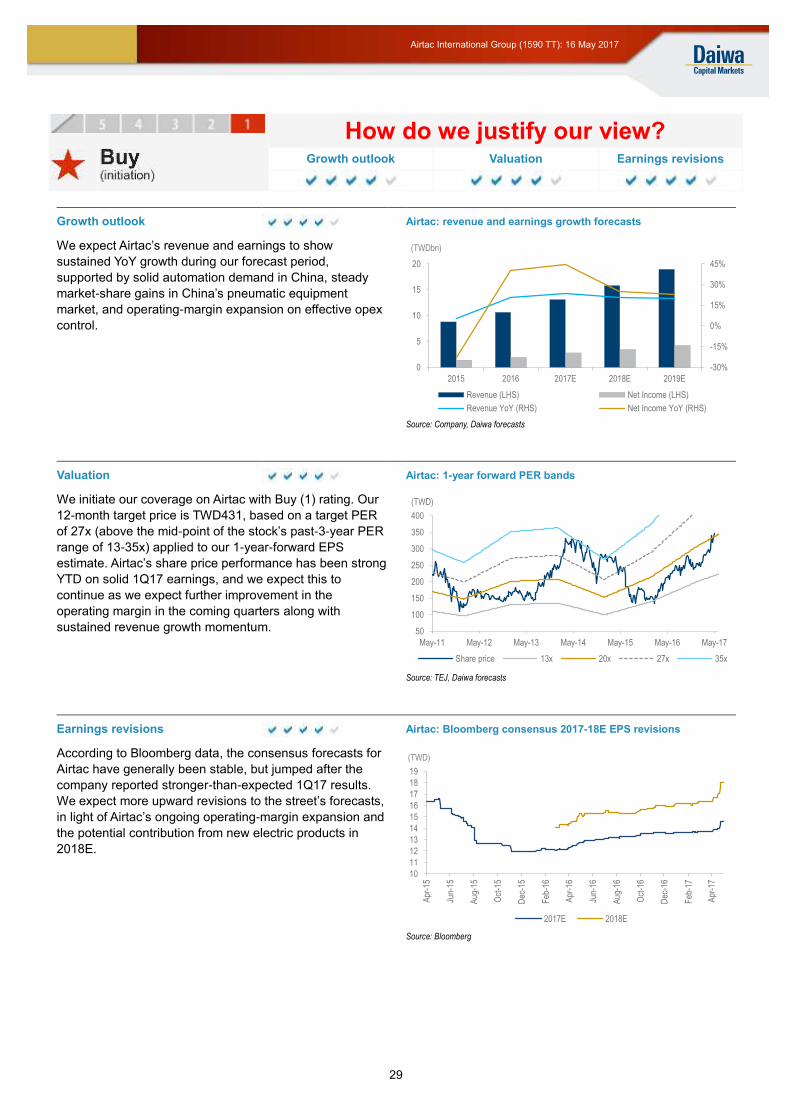
Investment case: We initiate coverage of Taiwan’s Industrial Robotics
Sector with a Positive rating. In our view, investors stand to benefit from
promising upside for the sector, given ample opportunities arising from
automation/robotics demand in China and the Taiwan electronics industry.
Catalysts: China: the key growth engine. China has been the largest
market for industrial robots since 2013, and is set for a 2015-19E CAGR of
23% in terms of units, according to the International Federation of Robotics
(IFR). With robot density still below the global average in China, the country
offers strong opportunities for robot demand growth.
Electronics sector: catching up fast. The electronics sector makes up c.
20% of the global robot installation base, trailing the automotive sector’s
38%. However, we expect the electronics sector to catch up and outpace
other major sectors in robot adoption, driven by the shortening product life
cycles of electronic products and rising labour costs in China.
Proliferation of robot applications. With robots becoming more powerful
and increasingly affordable, the types of robot use looks set to continue to
expand, ie, collaborative robots (cobots) (which can interact and work with
humans and are cheaper/easier to set up than industrial robots),
professional service robots, and personal/household robots for consumers.
Market indicators also look favourable. Improving PMIs in all major
regions globally, particularly in China, from mid-2016 point to positive
sentiment for industrial robot demand. Rising machine-tool production
value in Japan, China and Taiwan also supports this trend.
Valuation: We expect the favourable trends highlighted above to support
sustained earnings growth for the industrial automation/robot sector in
Taiwan. We initiate on Airtac (1590 TT, TWD431) with a Buy (1) call, as we
expect its market-share gains in China to continue, while favourable
operating leverage and effective opex control ensure operating-margin
expansion. We also like Delta (2308 TT, TWD194) and reiterate our Buy (1)
call, as we remain positive on its growth outlook in industrial automation,
passive components, and advanced power solution-related areas. And we
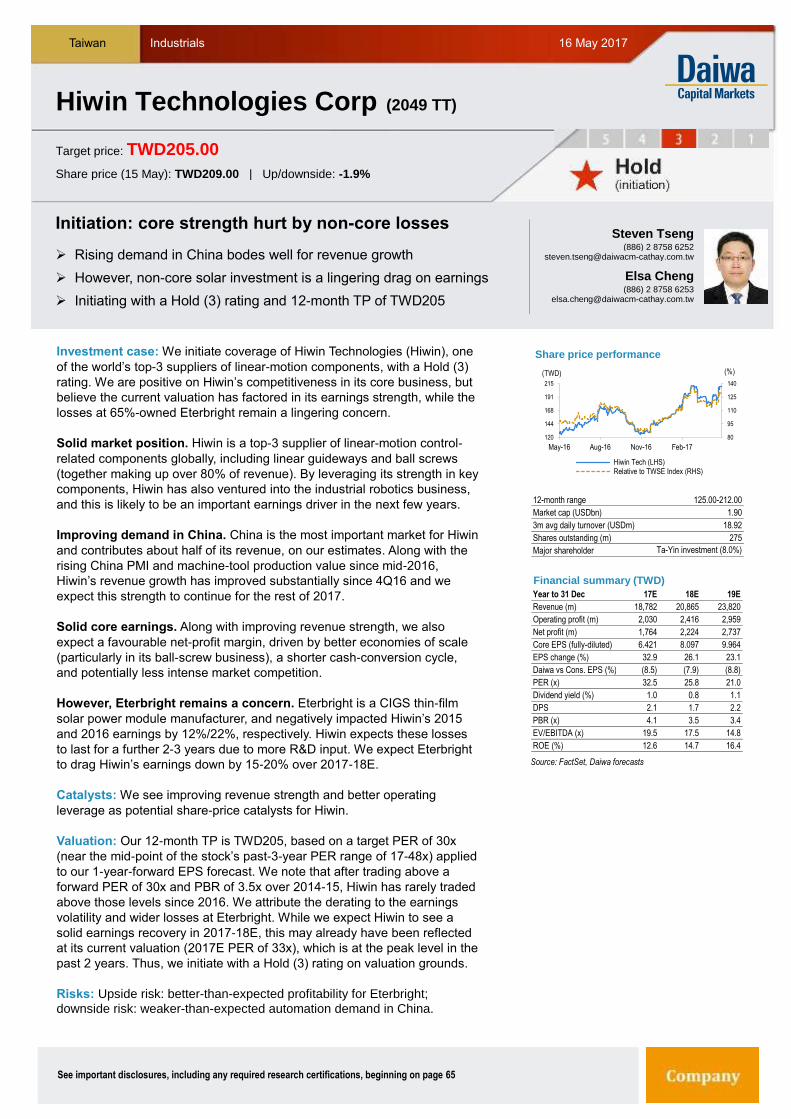
initiate coverage on Hiwin (2049 TT, TWD205) with a Hold (3) rating. We
like Hiwin’s competitiveness in linear motion components, but expect its
investment in solar energy to be an increasing drag on its earnings.
Risks: 1) Potential price competition in some areas of the robot supply
chain, and 2) worse-than-expected opex for robot related players, due to
higher R&D and client-service related inputs.
16 May 2017
Taiwan Industrial Robotics
Initiation: You’re hired!
Demand outlook for industrial robots positive, on rising penetration and more diverse applications in different sectors
Industrial robot supply chain in Taiwan looks to have strong upside thanks to automation demand in China and the local electronics sector
We favour Airtac and Delta for their market positions and earnings upside; cautious on Hiwin due to the drag from its subsidiary loss
Key stock calls
Source: Daiwa forecasts
Steven Tseng(886) 2 8758 6252
[email protected]
Elsa Cheng(886) 2 8758 6253
[email protected]
New Prev.
Airtac International Group (1590 TT)Rating Buy
Target 431.00
Upside p 25.8%
Delta Electronics (2308 TT)Rating Buy Buy
Target 194.00 194.00
Upside p 14.8%
Hiwin Technologies Corp (2049 TT)Rating Hold
Target 205.00
Downside q 1.9%
Page 3
3
Taiwan Industrial Robotics: 16 May 2017
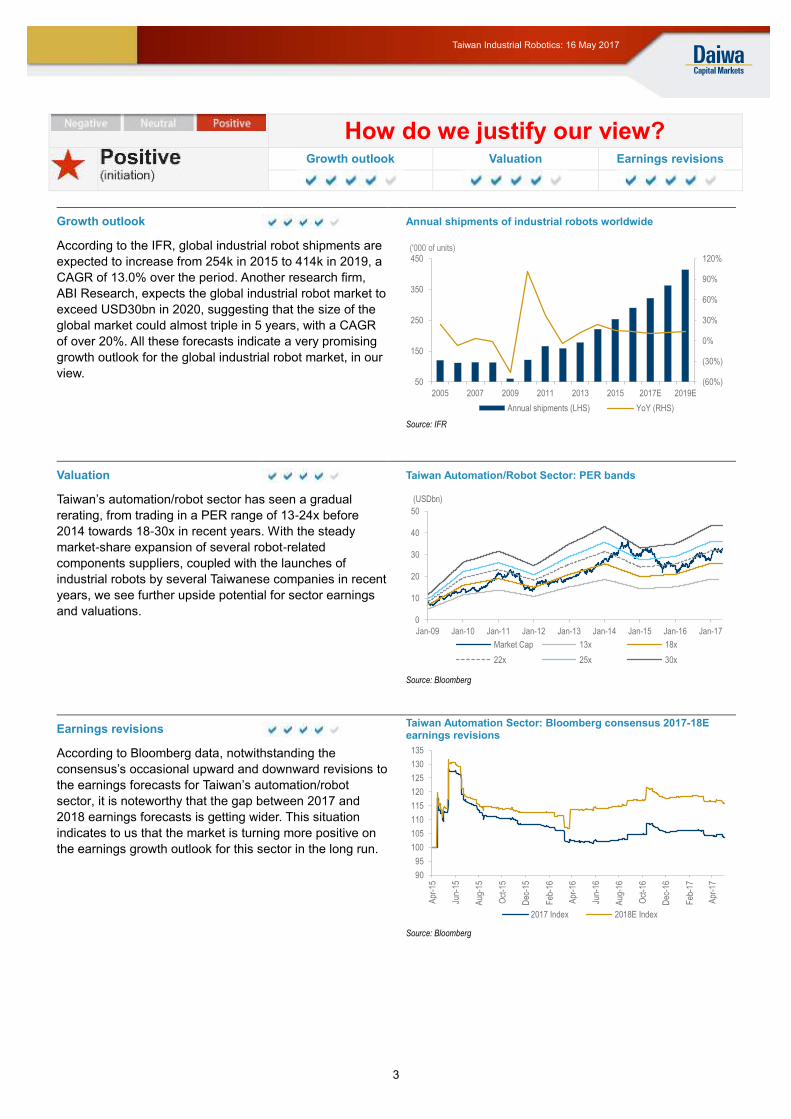
How do we justify our view?
Growth outlook Valuation Earnings revisions
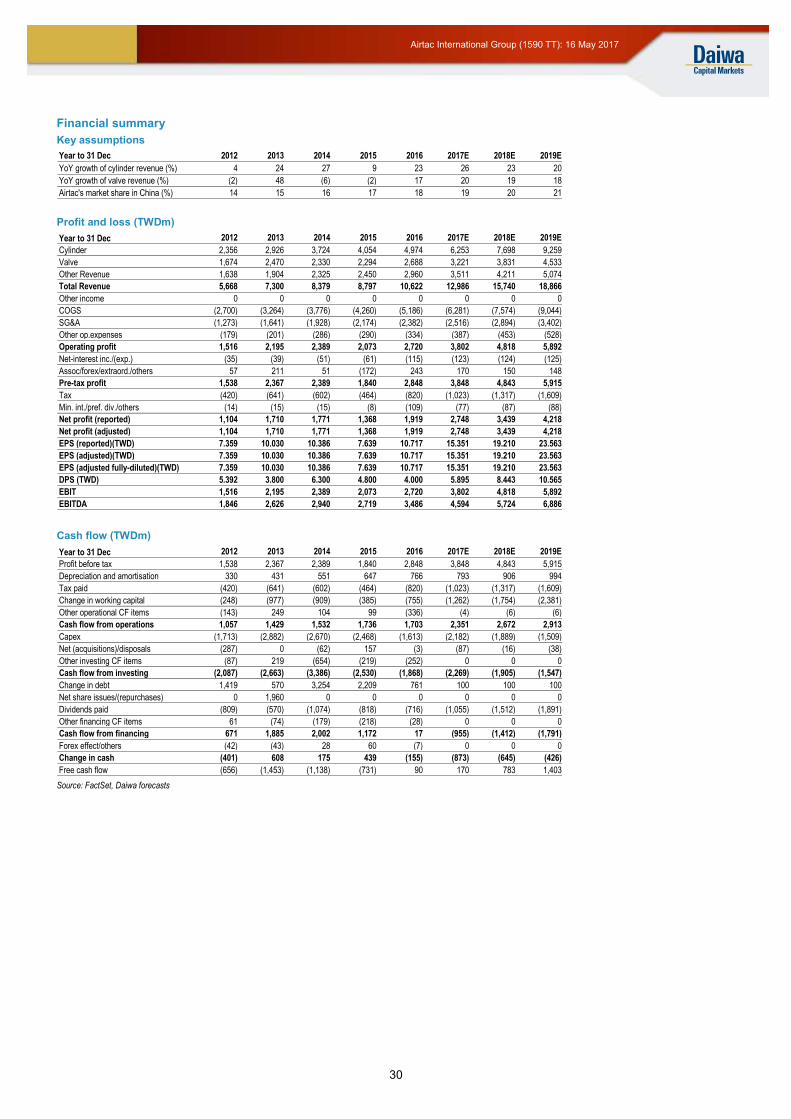
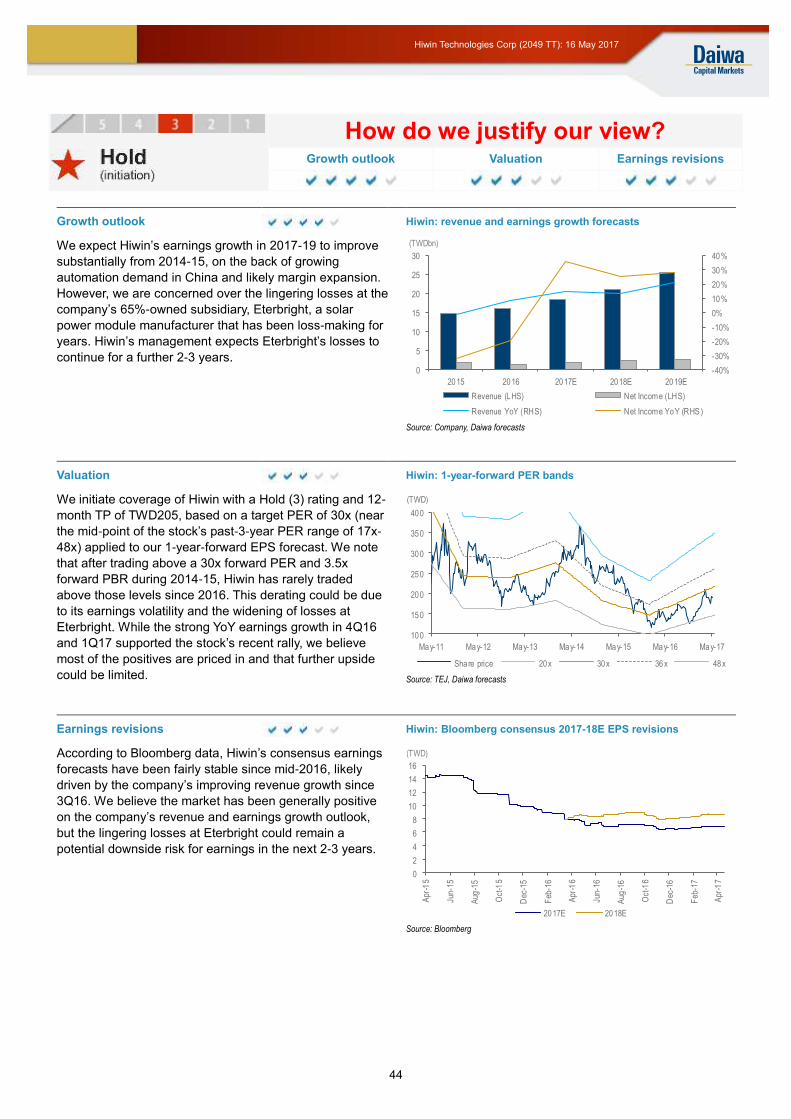
Growth outlook Annual shipments of industrial robots worldwide
According to the IFR, global industrial robot shipments are
expected to increase from 254k in 2015 to 414k in 2019, a
CAGR of 13.0% over the period. Another research firm,
ABI Research, expects the global industrial robot market to
exceed USD30bn in 2020, suggesting that the size of the
global market could almost triple in 5 years, with a CAGR
of over 20%. All these forecasts indicate a very promising
growth outlook for the global industrial robot market, in our
view.
Source: IFR
Valuation Taiwan Automation/Robot Sector: PER bands
Taiwan’s automation/robot sector has seen a gradual
rerating, from trading in a PER range of 13-24x before
2014 towards 18-30x in recent years. With the steady
market-share expansion of several robot-related
components suppliers, coupled with the launches of
industrial robots by several Taiwanese companies in recent
years, we see further upside potential for sector earnings
and valuations.
Source: Bloomberg
Earnings revisions Taiwan Automation Sector: Bloomberg consensus 2017-18E earnings revisions
According to Bloomberg data, notwithstanding the
consensus’s occasional upward and downward revisions to
the earnings forecasts for Taiwan’s automation/robot
sector, it is noteworthy that the gap between 2017 and
2018 earnings forecasts is getting wider. This situation
indicates to us that the market is turning more positive on
the earnings growth outlook for this sector in the long run.
Source: Bloomberg
(60%)
(30%)
0%
30%
60%
90%
120%
50
150
250
350
450
2005 2007 2009 2011 2013 2015 2017E 2019E
Annual shipments (LHS) YoY (RHS)
('000 of units)
0
10
20
30
40
50
Jan-09 Jan-10 Jan-11 Jan-12 Jan-13 Jan-14 Jan-15 Jan-16 Jan-17
(USDbn)
Market Cap 13x 18x
22x 25x 30x
90
95
100
105
110
115
120
125
130
135
Apr
-15
Jun-
15
Aug
-15
Oct
-15
Dec
-15
Feb
-16
Apr
-16
Jun-
16
Aug
-16
Oct
-16
Dec
-16
Feb
-17
Apr
-17
2017 Index 2018E Index
Page 4
4
Taiwan Industrial Robotics: 16 May 2017
Sector stocks: key indicators
Source: Bloomberg, Daiwa forecasts
Worldwide operational stock of industrial robots Annual shipments of industrial robots by region
Source: IFR Source: IFR
Annual shipments of industrial robots in China PMI of major regions worldwide
Source: IFR Source: Markit, ISM, China official
Worldwide operational stock of industrial robots by main industries
Source: IFR Note: percentages in the chart refer to the YoY growth in 2015
Share
Company Name Stock code Price New Prev. New Prev. % chg New Prev. % chg New Prev. % chg
Airtac International Group 1590 TT 342.50 Buy 431.00 15.351 19.210
Delta Electronics 2308 TT 169.00 Buy Buy 194.00 194.00 0.0% 8.286 8.286 0.0% 9.681 9.681 0.0%
Hiwin Technologies Corp 2049 TT 209.00 Hold 205.00 6.421 8.097
Rating Target price (local curr.) FY1
EPS (local curr.)
FY2
0
500
1,000
1,500
2,000
2,500
3,000
1973
1983
1990
1995
2000
2005
2010
2014
2015
2016
E
2019
E
('000 of units)
0
50
100
150
200
250
300
350
2014 2015 2016E 2017E 2018E 2019E
Asia/Australia Europe America
('000 of units)
0%
5%
10%
15%
20%
25%
30%
35%
40%
45%
0
30
60
90
120
150
180
2010 2011 2012 2013 2014 2015 2016E 2017E 2018E 2019E
Annual shipments (LHS) China % to the world (RHS)
('000 of units)
30
35
40
45
50
55
60
65
Jan-
07
Jul-0
7
Jan-
08
Jul-0
8
Jan-
09
Jul-0
9
Jan-
10
Jul-1
0
Jan-
11
Jul-1
1
Jan-
12
Jul-1
2
Jan-
13
Jul-1
3
Jan-
14
Jul-1
4
Jan-
15
Jul-1
5
Jan-
16
Jul-1
6
Jan-
17
US China Eurozone
(Index)
0 100 200 300 400 500 600 700
Not specifled by industries
Others
Food
Chemical and plastics
Metal
Electrical/ electronics
Automotive
2015 2014 2013
('000 of units)+10%
+18%
+16%
+11%
+13%
Page 5
5
Taiwan Industrial Robotics: 16 May 2017
Table of contents
Overview of the global industrial robot sector ...................................................... 6
Robots – a compelling driver of automation .......................................................................6
Key trend 1: China a key engine for global demand ...........................................................8
Key trend 2: Electronics sector should offer the best potential ......................................... 10
Key trend 3: Proliferation of robot applications ................................................................. 12
Key trend 4: Industry indicators show favourable trends .................................................. 14
Industrial robot supply chain in Taiwan ................................................................16
Not a big sector, but likely a hidden gem ......................................................................... 16
Overview of the industrial robot supply chain in Taiwan ................................................... 16
Taiwan’s strength and opportunities ................................................................................. 17
Valuation and recommendations ...........................................................................20
Solid sector outlook suggests more valuation upside ....................................................... 20
Stock recommendations .................................................................................................. 21
Appendix ..................................................................................................................23
Major components of industrial robots ............................................................................. 23
Major types of industrial robots ........................................................................................ 26
Company Section
Airtac International Group ................................................................................................ 28
Delta Electronics .............................................................................................................. 39
Hiwin Technologies Corp ................................................................................................. 43
Chieftek Precision ............................................................................................................ 55
Mirle Automation .............................................................................................................. 57
Quanta Storage ............................................................................................................... 59
Teco Electric and Machinery ............................................................................................ 61
Page 6
6
Taiwan Industrial Robotics: 16 May 2017
Overview of the global industrial robot sector
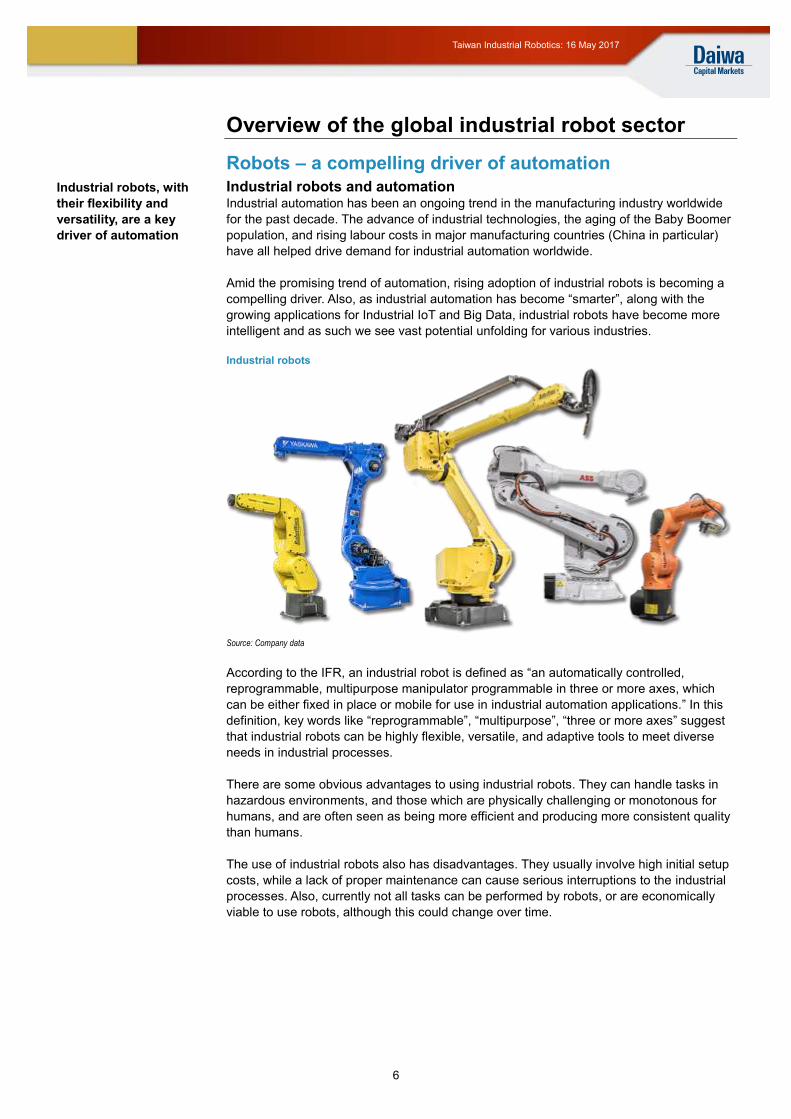
Robots – a compelling driver of automation
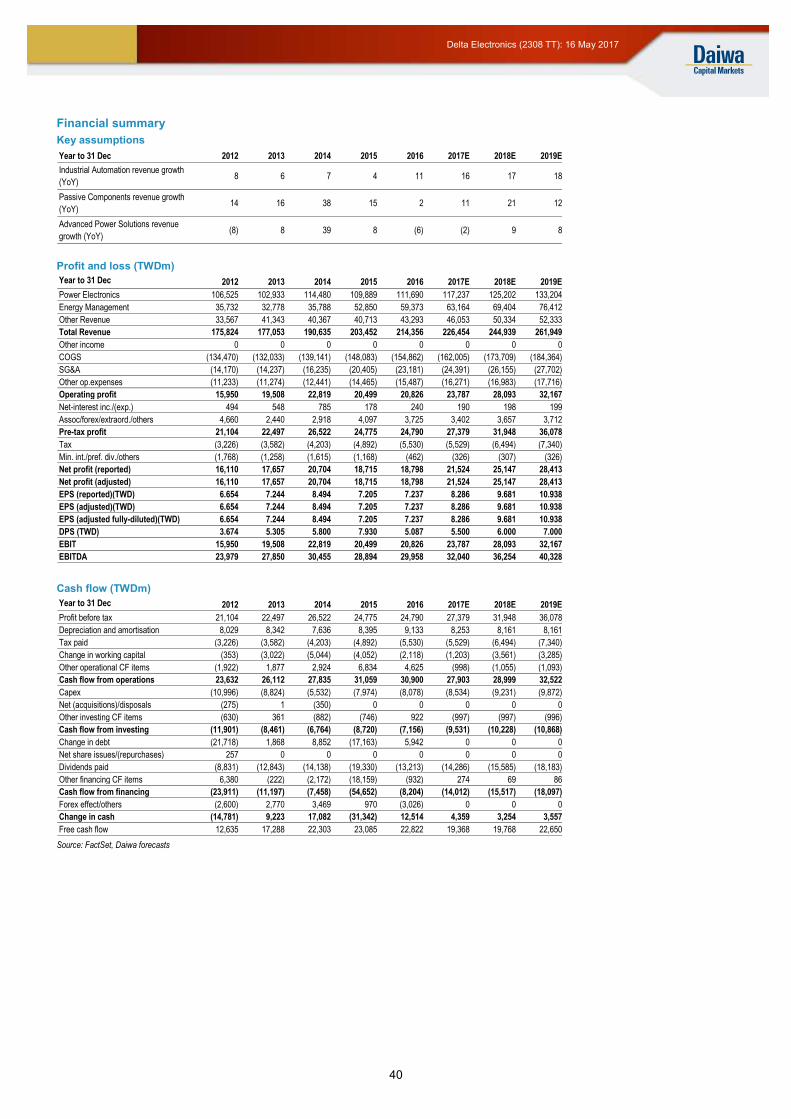
Industrial robots and automation Industrial automation has been an ongoing trend in the manufacturing industry worldwide
for the past decade. The advance of industrial technologies, the aging of the Baby Boomer
population, and rising labour costs in major manufacturing countries (China in particular)
have all helped drive demand for industrial automation worldwide.
Amid the promising trend of automation, rising adoption of industrial robots is becoming a
compelling driver. Also, as industrial automation has become “smarter”, along with the
growing applications for Industrial IoT and Big Data, industrial robots have become more
intelligent and as such we see vast potential unfolding for various industries.
Industrial robots
Source: Company data
According to the IFR, an industrial robot is defined as “an automatically controlled,
reprogrammable, multipurpose manipulator programmable in three or more axes, which
can be either fixed in place or mobile for use in industrial automation applications.” In this
definition, key words like “reprogrammable”, “multipurpose”, “three or more axes” suggest
that industrial robots can be highly flexible, versatile, and adaptive tools to meet diverse
needs in industrial processes.
There are some obvious advantages to using industrial robots. They can handle tasks in
hazardous environments, and those which are physically challenging or monotonous for
humans, and are often seen as being more efficient and producing more consistent quality
than humans.
The use of industrial robots also has disadvantages. They usually involve high initial setup
costs, while a lack of proper maintenance can cause serious interruptions to the industrial
processes. Also, currently not all tasks can be performed by robots, or are economically
viable to use robots, although this could change over time.
Industrial robots, with
their flexibility and
versatility, are a key
driver of automation
Page 7
7
Taiwan Industrial Robotics: 16 May 2017
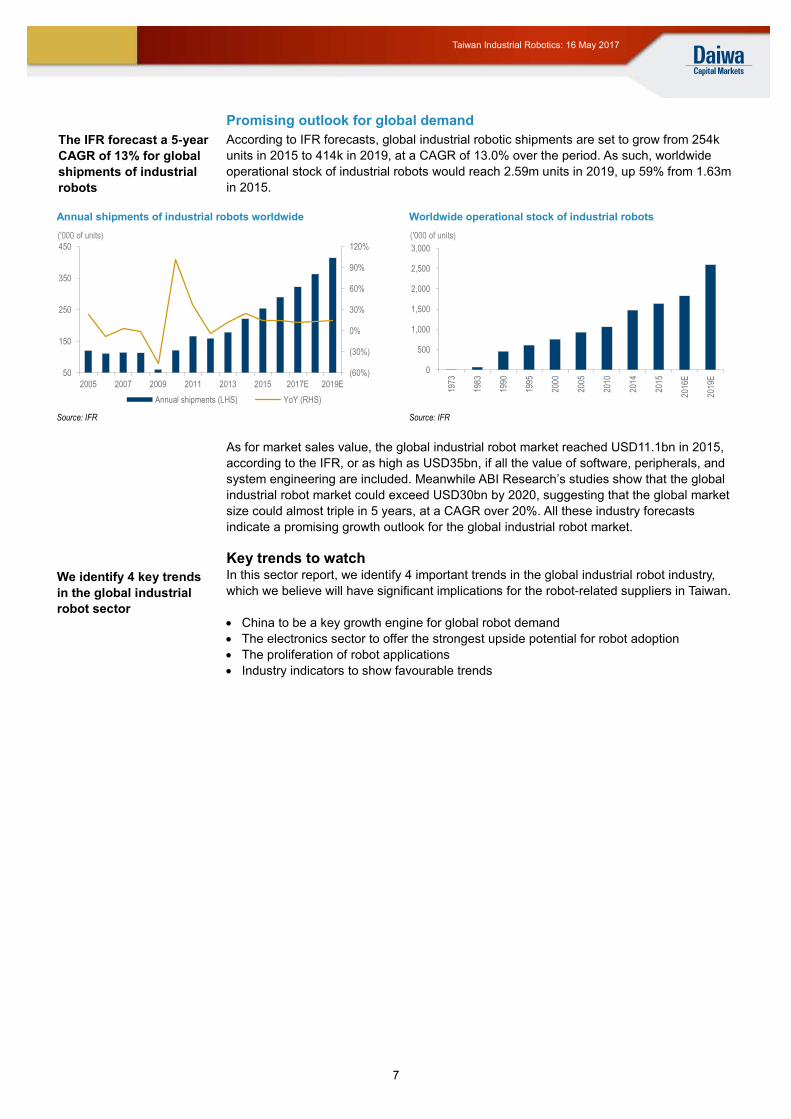
Promising outlook for global demand
According to IFR forecasts, global industrial robotic shipments are set to grow from 254k
units in 2015 to 414k in 2019, at a CAGR of 13.0% over the period. As such, worldwide
operational stock of industrial robots would reach 2.59m units in 2019, up 59% from 1.63m
in 2015.
Annual shipments of industrial robots worldwide Worldwide operational stock of industrial robots
Source: IFR Source: IFR
As for market sales value, the global industrial robot market reached USD11.1bn in 2015,
according to the IFR, or as high as USD35bn, if all the value of software, peripherals, and
system engineering are included. Meanwhile ABI Research’s studies show that the global
industrial robot market could exceed USD30bn by 2020, suggesting that the global market
size could almost triple in 5 years, at a CAGR over 20%. All these industry forecasts
indicate a promising growth outlook for the global industrial robot market.
Key trends to watch In this sector report, we identify 4 important trends in the global industrial robot industry,
which we believe will have significant implications for the robot-related suppliers in Taiwan.
China to be a key growth engine for global robot demand
The electronics sector to offer the strongest upside potential for robot adoption
The proliferation of robot applications
Industry indicators to show favourable trends
(60%)
(30%)
0%
30%
60%
90%
120%
50
150
250
350
450
2005 2007 2009 2011 2013 2015 2017E 2019E
Annual shipments (LHS) YoY (RHS)
('000 of units)
0
500
1,000
1,500
2,000
2,500
3,000
1973
1983
1990
1995
2000
2005
2010
2014
2015
2016
E
2019
E
('000 of units)
The IFR forecast a 5-year
CAGR of 13% for global
shipments of industrial
robots
We identify 4 key trends
in the global industrial
robot sector
Page 8
8
Taiwan Industrial Robotics: 16 May 2017
Key trend 1: China a key engine for global demand
Asia strength backed by China, Korea, and Japan According to IFR statistics, Asia is the world’s strongest growth market in terms of industrial
robot shipments. This region’s new robot shipments increased by 19% YoY in 2015,
followed by the Americas’ 17% and Europe’s 10%. In terms of individual countries, 5
countries represented 75% of total industrial robots sold globally in 2015 – China (27%),
South Korea (15%), Japan (14%), the US (11%), and Germany (8%) – while 3 Asian
countries make the top-5 list and together account for over half of global robot shipments.
China: the biggest market for industrial robots
China is a key reason behind the strength of Asia’s robotic demand. The country has been
the biggest market for industrial robots since 2013, with new robot shipments up 20% YoY
in 2015. In fact, IFR expects China to claim 40% of global robot demand by 2019, up from
27% in 2015, suggesting a CAGR of 23% in terms of units. South Korea and Japan are
also important drivers in Asia, with 2015 shipment growth reaching 55% YoY and 20% YoY,
respectively. Other Asian countries, like Taiwan (3% of global robot shipments in 2015) and
Thailand (1%), also provide meaningful contributions to global industrial robot demand.
Annual shipments of industrial robots by region Annual shipments of industrial robots in China
Source: IFR Source: IFR
Annual shipments of industrial robots by region/country
(Unit) 2014 2015 2016E 2019E
America 32,616 38,134 40,200 50,700 North America 31,029 36,444 38,000 46,000 Brazil 1,266 1,407 1,800 3,500 Rest of South America 321 283 400 1,200
Asia 134,444 160,558 190,200 285,700 China 57,096 68,556 90,000 160,000 Japan 29,297 35,023 38,000 43,000 South Korea 24,721 38,285 40,000 46,000 Taiwan 6,912 7,200 9,000 13,000 Thailand 3,657 2,556 3,000 4,500 India 2,126 2,065 2,600 6,000 Others 10,635 6,873 7,600 13,200
Europe 45,559 50,073 54,200 68,800 Germany 20,051 20,105 21,000 25,000 Italy 6,215 6,657 7,200 9,000 France 2,944 3,045 3,300 4,500 Spain 2,312 3,766 4,100 5,100 UK 2,094 1,645 1,800 2,500 Central/Eastern Europe 4,643 5,976 7,550 11,300 Others 7,300 8,879 9,250 11,400
Africa 428 348 400 800 Not specified by countries 7,524 4,635 5,000 8,000 Worldwide total 220,571 253,748 290,000 414,000
Source: IFR
0
50
100
150
200
250
300
350
2014 2015 2016E 2017E 2018E 2019E
Asia/Australia Europe America
('000 of units)
0%
5%
10%
15%
20%
25%
30%
35%
40%
45%
0
30
60
90
120
150
180
2010 2011 2012 2013 2014 2015 2016E 2017E 2018E 2019E
Annual shipments (LHS) China % to the world (RHS)
('000 of units)
Asia tops the world in
robot shipment growth
China set to claim 40%
of global robot demand
by 2019E (vs. 27% in
2015), according to IFR
Page 9
9
Taiwan Industrial Robotics: 16 May 2017
Robot density: a key parameter to watch
Simply comparing robot shipments in each region/country can be misleading, in our view,
as it fails to take into account the difference in size of the manufacturing segment in
different areas. As such, the IFR has come up with the concept of robot density, which is
defined as the number of industrial robots per 10,000 persons employed in the
manufacturing industry in a country/region.
According to the IFR, average robot density worldwide was 69 in 2015. Among all the
major regions, Europe had the highest average robot density at 92, followed by 86 in the
Americas and 57 in Asia. As mentioned earlier, Asia accounts for the highest growth than
other regions in terms of robot demand. Its lower robot density than other regions suggests
to us that such growth strength will continue in the next few years.
Robot density in major countries
Source: IFR (data as of 2015)
When we look at robot density by country, the most “automated” countries (ie, those with
high robot density) appear to be Korea, Singapore, Japan, and Germany, as shown in the
chart below. Robot density in China, the biggest market for industrial robots since 2013,
was only 49 in 2015.
As part of the targets set out in the China Government’s “Made in China 2025” strategy,
China aims to boost its robot density to 300 by 2025. If we assume no change in the
number of employees in China’s manufacturing sectors, the target robot density of 300
suggests a CAGR of nearly 20% for the number of industrial robots installed in China up to
2025. This figure reflects promising growth potential for China’s industrial robot market.
531
398
305 301
212 190 188 176 169 160 150 136 128 127 126 120 119 110 93 86 79 71 49
0
100
200
300
400
500
600
Kor
ea
Sin
gapo
re
Japa
n
Ger
man
y
Sw
eden
Tai
wan
Den
mar
k
US
Bel
gium Ita
ly
Spa
in
Can
ada
Aus
tria
Fra
nce
Fin
land
Net
herla
nds
Sw
itzed
land
Slo
veni
a
Cze
ch R
ep.
Aus
tral
ia
Slo
vaki
a
UK
Chi
na
(units per 10,000 employees)
Average robot density worldwide: 69
Asia’s lower robot
density suggests a
sustained strength of
robot demand
China’s robot density is
still much lower than the
global average level
Page 10
10
Taiwan Industrial Robotics: 16 May 2017
Key trend 2: Electronics sector should offer the best potential
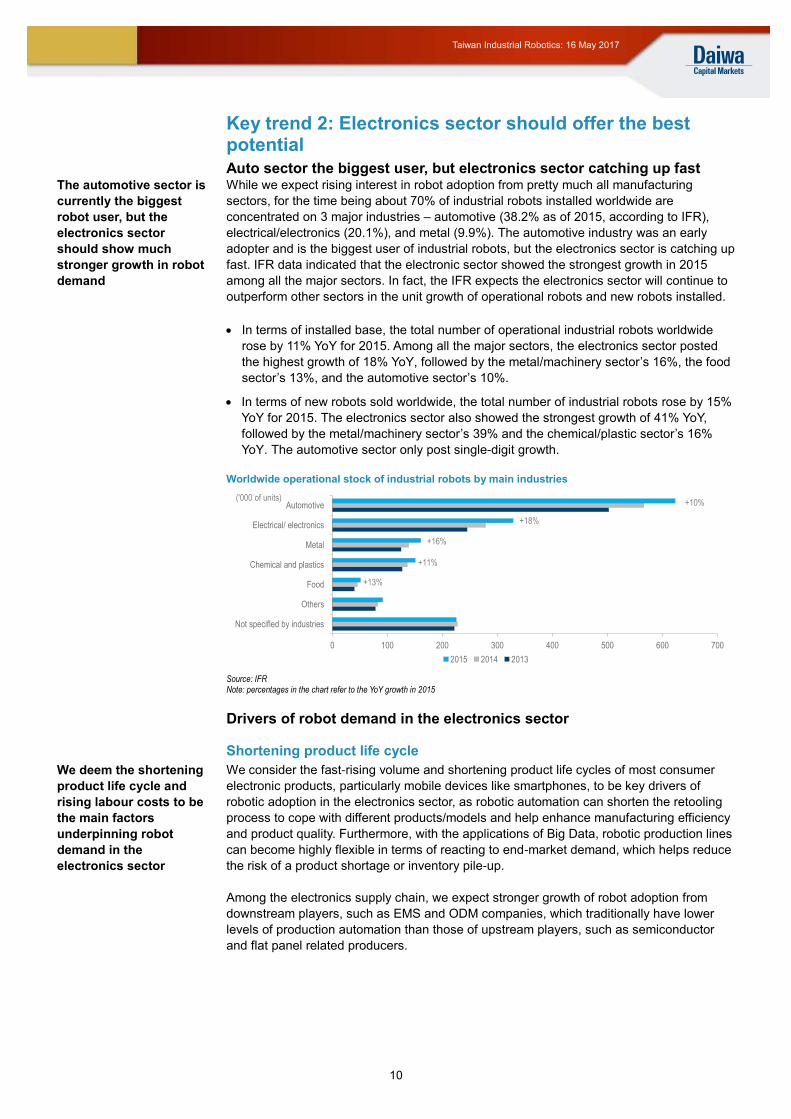
Auto sector the biggest user, but electronics sector catching up fast While we expect rising interest in robot adoption from pretty much all manufacturing
sectors, for the time being about 70% of industrial robots installed worldwide are
concentrated on 3 major industries – automotive (38.2% as of 2015, according to IFR),
electrical/electronics (20.1%), and metal (9.9%). The automotive industry was an early
adopter and is the biggest user of industrial robots, but the electronics sector is catching up
fast. IFR data indicated that the electronic sector showed the strongest growth in 2015
among all the major sectors. In fact, the IFR expects the electronics sector will continue to
outperform other sectors in the unit growth of operational robots and new robots installed.
In terms of installed base, the total number of operational industrial robots worldwide
rose by 11% YoY for 2015. Among all the major sectors, the electronics sector posted
the highest growth of 18% YoY, followed by the metal/machinery sector’s 16%, the food
sector’s 13%, and the automotive sector’s 10%.
In terms of new robots sold worldwide, the total number of industrial robots rose by 15%
YoY for 2015. The electronics sector also showed the strongest growth of 41% YoY,
followed by the metal/machinery sector’s 39% and the chemical/plastic sector’s 16%
YoY. The automotive sector only post single-digit growth.
Worldwide operational stock of industrial robots by main industries
Source: IFR Note: percentages in the chart refer to the YoY growth in 2015
Drivers of robot demand in the electronics sector
Shortening product life cycle
We consider the fast-rising volume and shortening product life cycles of most consumer
electronic products, particularly mobile devices like smartphones, to be key drivers of
robotic adoption in the electronics sector, as robotic automation can shorten the retooling
process to cope with different products/models and help enhance manufacturing efficiency
and product quality. Furthermore, with the applications of Big Data, robotic production lines
can become highly flexible in terms of reacting to end-market demand, which helps reduce
the risk of a product shortage or inventory pile-up.
Among the electronics supply chain, we expect stronger growth of robot adoption from
downstream players, such as EMS and ODM companies, which traditionally have lower
levels of production automation than those of upstream players, such as semiconductor
and flat panel related producers.
0 100 200 300 400 500 600 700
Not specifled by industries
Others
Food
Chemical and plastics
Metal
Electrical/ electronics
Automotive
2015 2014 2013
('000 of units)+10%
+18%
+16%
+11%
+13%
The automotive sector is
currently the biggest
robot user, but the
electronics sector
should show much
stronger growth in robot
demand
We deem the shortening
product life cycle and
rising labour costs to be
the main factors
underpinning robot
demand in the
electronics sector
Page 11
11
Taiwan Industrial Robotics: 16 May 2017
Cost consideration due to rising labour costs
Another main driver of robotic demand evolves around cost reduction. Ever-rising labour
costs in China in recent years (typically up 10-15% pa over the past decade; sometimes
higher) have forced most companies to look for alternatives for cost-savings, one of which
is automation. As a general rule of thumb, in developed countries, the cost of a robot is
roughly equivalent to one worker’s salary over 2 years, so rising labour costs imply a
shorter payback period for robot-related investments, hence attract more incentive for
robot adoption.
Hon Hai/Foxconn group, the largest EMS in the world, announced its ambition for factory
automation back in 2011. According to press reports, so far it has installed over 40,000
units of robots in China, and the ultimate goal is to set up “unmanned factories” at its major
manufacturing sites in Chengzhou, Kunshan and Shenzhen. We expect most of Hon Hai’s
EMS/ODM peers to follow suit, which implies promising demand for automation/robots
going forward.
Page 12
12
Taiwan Industrial Robotics: 16 May 2017
Key trend 3: Proliferation of robot applications
Improving cost/performance leads to widening robot applications According a study by The Boston Consulting Group (BCG) in 2015, prices of robotic
hardware and enabling software are expected to drop by more than 20% over the next
decade; meanwhile, the performance of robotic systems will improve by 5% each year.
This means that robots will become increasingly powerful but also more affordable at the
same time. Such a trend will attract a widening range of new applications for robots.
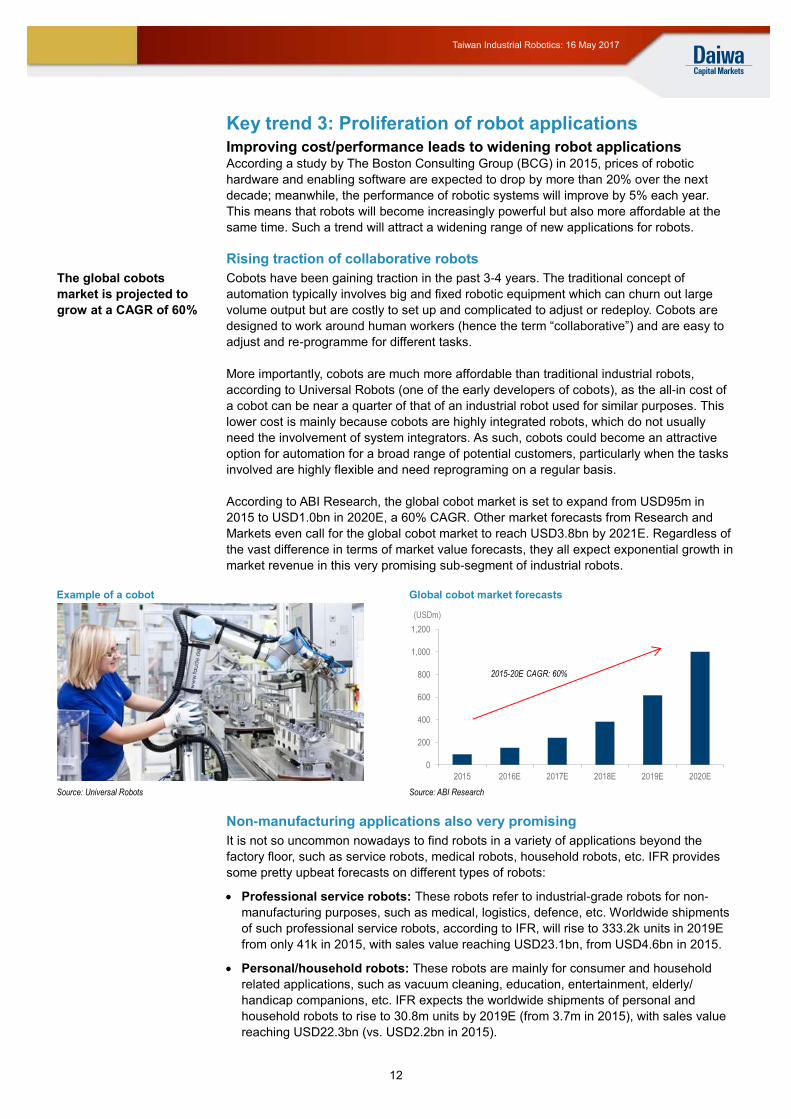
Rising traction of collaborative robots
Cobots have been gaining traction in the past 3-4 years. The traditional concept of
automation typically involves big and fixed robotic equipment which can churn out large
volume output but are costly to set up and complicated to adjust or redeploy. Cobots are
designed to work around human workers (hence the term “collaborative”) and are easy to
adjust and re-programme for different tasks.
More importantly, cobots are much more affordable than traditional industrial robots,
according to Universal Robots (one of the early developers of cobots), as the all-in cost of
a cobot can be near a quarter of that of an industrial robot used for similar purposes. This
lower cost is mainly because cobots are highly integrated robots, which do not usually
need the involvement of system integrators. As such, cobots could become an attractive
option for automation for a broad range of potential customers, particularly when the tasks
involved are highly flexible and need reprograming on a regular basis.
According to ABI Research, the global cobot market is set to expand from USD95m in
2015 to USD1.0bn in 2020E, a 60% CAGR. Other market forecasts from Research and
Markets even call for the global cobot market to reach USD3.8bn by 2021E. Regardless of
the vast difference in terms of market value forecasts, they all expect exponential growth in
market revenue in this very promising sub-segment of industrial robots.
Example of a cobot Global cobot market forecasts
Source: Universal Robots Source: ABI Research
Non-manufacturing applications also very promising
It is not so uncommon nowadays to find robots in a variety of applications beyond the
factory floor, such as service robots, medical robots, household robots, etc. IFR provides
some pretty upbeat forecasts on different types of robots:
Professional service robots: These robots refer to industrial-grade robots for non-
manufacturing purposes, such as medical, logistics, defence, etc. Worldwide shipments
of such professional service robots, according to IFR, will rise to 333.2k units in 2019E
from only 41k in 2015, with sales value reaching USD23.1bn, from USD4.6bn in 2015.
Personal/household robots: These robots are mainly for consumer and household
related applications, such as vacuum cleaning, education, entertainment, elderly/
handicap companions, etc. IFR expects the worldwide shipments of personal and
household robots to rise to 30.8m units by 2019E (from 3.7m in 2015), with sales value
reaching USD22.3bn (vs. USD2.2bn in 2015).
0
200
400
600
800
1,000
1,200
2015 2016E 2017E 2018E 2019E 2020E
2015-20E CAGR: 60%
(USDm)
The global cobots
market is projected to
grow at a CAGR of 60%
Page 13
13
Taiwan Industrial Robotics: 16 May 2017
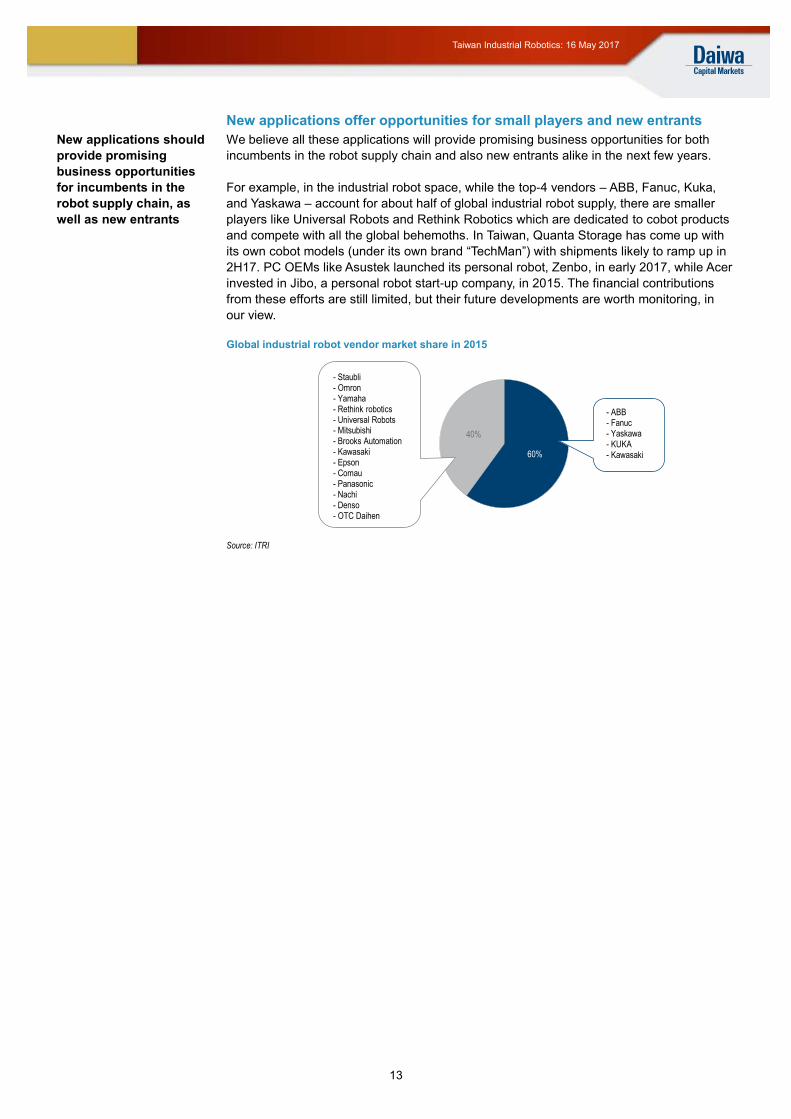
New applications offer opportunities for small players and new entrants
We believe all these applications will provide promising business opportunities for both
incumbents in the robot supply chain and also new entrants alike in the next few years.
For example, in the industrial robot space, while the top-4 vendors – ABB, Fanuc, Kuka,
and Yaskawa – account for about half of global industrial robot supply, there are smaller
players like Universal Robots and Rethink Robotics which are dedicated to cobot products
and compete with all the global behemoths. In Taiwan, Quanta Storage has come up with
its own cobot models (under its own brand “TechMan”) with shipments likely to ramp up in
2H17. PC OEMs like Asustek launched its personal robot, Zenbo, in early 2017, while Acer
invested in Jibo, a personal robot start-up company, in 2015. The financial contributions
from these efforts are still limited, but their future developments are worth monitoring, in
our view.
Global industrial robot vendor market share in 2015
Source: ITRI
60%
40%
- ABB- Fanuc- Yaskawa- KUKA- Kawasaki
- Staubli- Omron- Yamaha- Rethink robotics- Universal Robots- Mitsubishi- Brooks Automation- Kawasaki- Epson- Comau- Panasonic- Nachi- Denso- OTC Daihen
New applications should
provide promising
business opportunities
for incumbents in the
robot supply chain, as
well as new entrants
Page 14
14
Taiwan Industrial Robotics: 16 May 2017
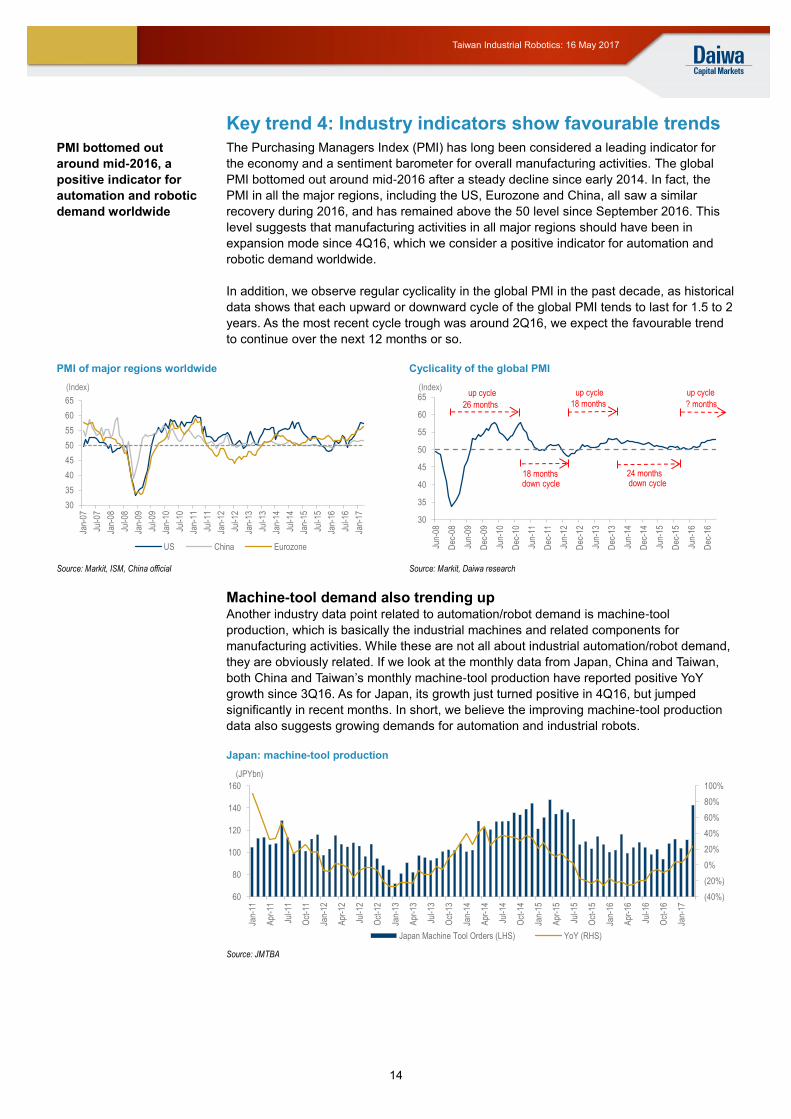
Key trend 4: Industry indicators show favourable trends
The Purchasing Managers Index (PMI) has long been considered a leading indicator for
the economy and a sentiment barometer for overall manufacturing activities. The global
PMI bottomed out around mid-2016 after a steady decline since early 2014. In fact, the
PMI in all the major regions, including the US, Eurozone and China, all saw a similar
recovery during 2016, and has remained above the 50 level since September 2016. This
level suggests that manufacturing activities in all major regions should have been in
expansion mode since 4Q16, which we consider a positive indicator for automation and
robotic demand worldwide.
In addition, we observe regular cyclicality in the global PMI in the past decade, as historical
data shows that each upward or downward cycle of the global PMI tends to last for 1.5 to 2
years. As the most recent cycle trough was around 2Q16, we expect the favourable trend
to continue over the next 12 months or so.
PMI of major regions worldwide Cyclicality of the global PMI
Source: Markit, ISM, China official Source: Markit, Daiwa research
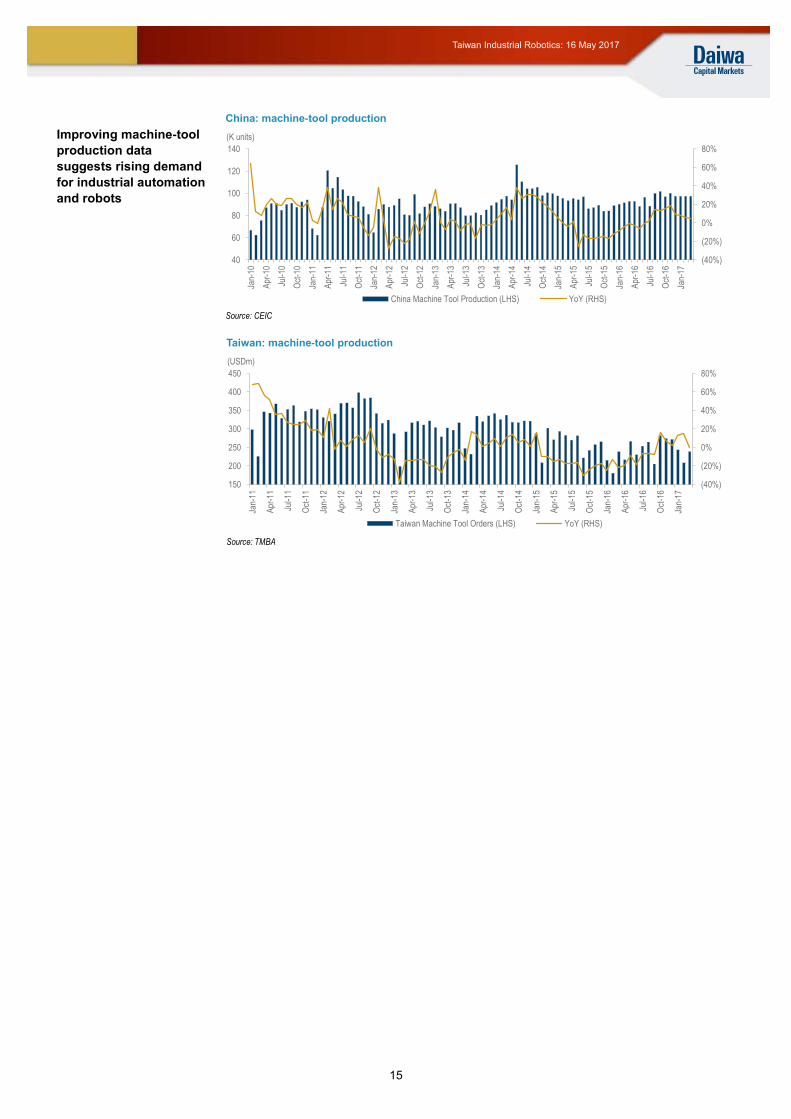
Machine-tool demand also trending up Another industry data point related to automation/robot demand is machine-tool
production, which is basically the industrial machines and related components for
manufacturing activities. While these are not all about industrial automation/robot demand,
they are obviously related. If we look at the monthly data from Japan, China and Taiwan,
both China and Taiwan’s monthly machine-tool production have reported positive YoY
growth since 3Q16. As for Japan, its growth just turned positive in 4Q16, but jumped
significantly in recent months. In short, we believe the improving machine-tool production
data also suggests growing demands for automation and industrial robots.
Japan: machine-tool production
Source: JMTBA
30
35
40
45
50
55
60
65
Jan-
07
Jul-0
7
Jan-
08
Jul-0
8
Jan-
09
Jul-0
9
Jan-
10
Jul-1
0
Jan-
11
Jul-1
1
Jan-
12
Jul-1
2
Jan-
13
Jul-1
3
Jan-
14
Jul-1
4
Jan-
15
Jul-1
5
Jan-
16
Jul-1
6
Jan-
17
US China Eurozone
(Index)
30
35
40
45
50
55
60
65
Jun-
08
Dec
-08
Jun-
09
Dec
-09
Jun-
10
Dec
-10
Jun-
11
Dec
-11
Jun-
12
Dec
-12
Jun-
13
Dec
-13
Jun-
14
Dec
-14
Jun-
15
Dec
-15
Jun-
16
Dec
-16
26 months
18 months
18 months
24 months
(Index)up cycle up cycle
down cycle down cycle
up cycle
? months
(40%)
(20%)
0%
20%
40%
60%
80%
100%
60
80
100
120
140
160
Jan-
11
Apr
-11
Jul-1
1
Oct
-11
Jan-
12
Apr
-12
Jul-1
2
Oct
-12
Jan-
13
Apr
-13
Jul-1
3
Oct
-13
Jan-
14
Apr
-14
Jul-1
4
Oct
-14
Jan-
15
Apr
-15
Jul-1
5
Oct
-15
Jan-
16
Apr
-16
Jul-1
6
Oct
-16
Jan-
17
Japan Machine Tool Orders (LHS) YoY (RHS)
(JPYbn)
PMI bottomed out
around mid-2016, a
positive indicator for
automation and robotic
demand worldwide
Page 15
15
Taiwan Industrial Robotics: 16 May 2017
China: machine-tool production
Improving machine-tool
production data
suggests rising demand
for industrial automation
and robots
Source: CEIC
Taiwan: machine-tool production
Source: TMBA
(40%)
(20%)
0%
20%
40%
60%
80%
40
60
80
100
120
140
Jan-
10
Apr
-10
Jul-1
0
Oct
-10
Jan-
11
Apr
-11
Jul-1
1
Oct
-11
Jan-
12
Apr
-12
Jul-1
2
Oct
-12
Jan-
13
Apr
-13
Jul-1
3
Oct
-13
Jan-
14
Apr
-14
Jul-1
4
Oct
-14
Jan-
15
Apr
-15
Jul-1
5
Oct
-15
Jan-
16
Apr
-16
Jul-1
6
Oct
-16
Jan-
17
China Machine Tool Production (LHS) YoY (RHS)
(K units)
(40%)
(20%)
0%
20%
40%
60%
80%
150
200
250
300
350
400
450
Jan-
11
Apr
-11
Jul-1
1
Oct
-11
Jan-
12
Apr
-12
Jul-1
2
Oct
-12
Jan-
13
Apr
-13
Jul-1
3
Oct
-13
Jan-
14
Apr
-14
Jul-1
4
Oct
-14
Jan-
15
Apr
-15
Jul-1
5
Oct
-15
Jan-
16
Apr
-16
Jul-1
6
Oct
-16
Jan-
17
Taiwan Machine Tool Orders (LHS) YoY (RHS)
(USDm)
Page 16
16
Taiwan Industrial Robotics: 16 May 2017
Industrial robot supply chain in Taiwan
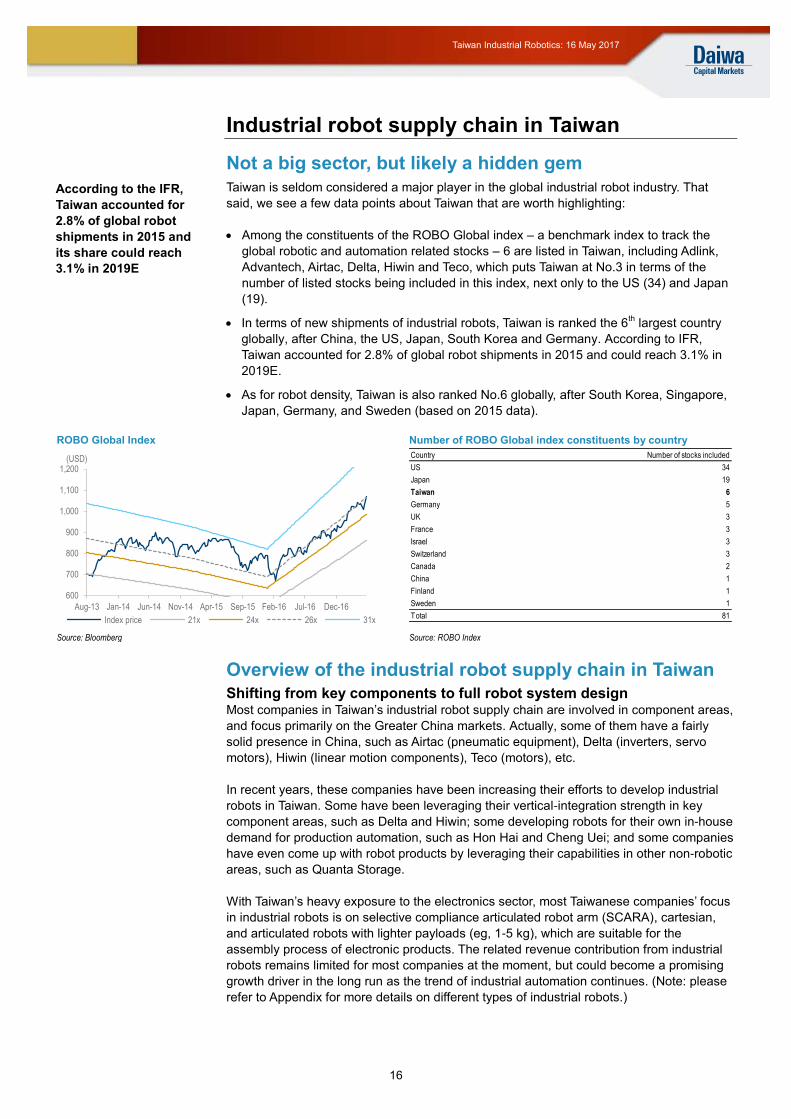
Not a big sector, but likely a hidden gem
Taiwan is seldom considered a major player in the global industrial robot industry. That
said, we see a few data points about Taiwan that are worth highlighting:
Among the constituents of the ROBO Global index – a benchmark index to track the
global robotic and automation related stocks – 6 are listed in Taiwan, including Adlink,
Advantech, Airtac, Delta, Hiwin and Teco, which puts Taiwan at No.3 in terms of the
number of listed stocks being included in this index, next only to the US (34) and Japan
(19).
In terms of new shipments of industrial robots, Taiwan is ranked the 6th largest country
globally, after China, the US, Japan, South Korea and Germany. According to IFR,
Taiwan accounted for 2.8% of global robot shipments in 2015 and could reach 3.1% in
2019E.
As for robot density, Taiwan is also ranked No.6 globally, after South Korea, Singapore,
Japan, Germany, and Sweden (based on 2015 data).
ROBO Global Index Number of ROBO Global index constituents by country
Source: Bloomberg Source: ROBO Index
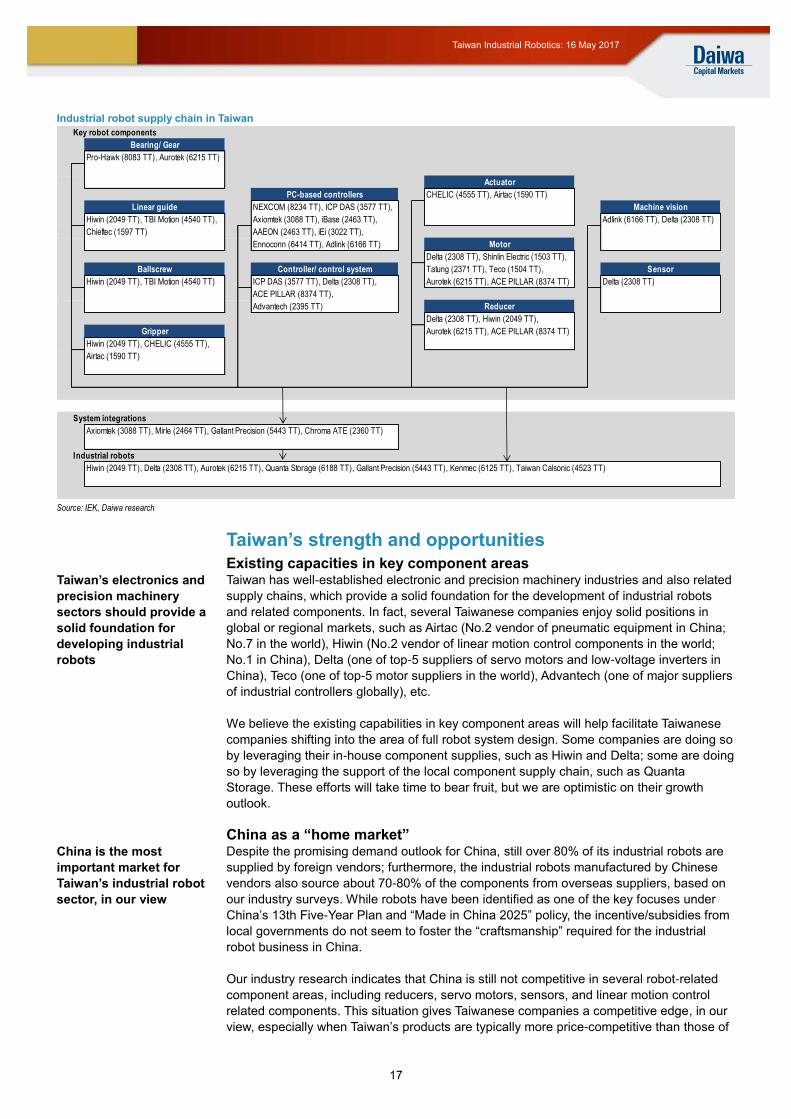
Overview of the industrial robot supply chain in Taiwan
Shifting from key components to full robot system design Most companies in Taiwan’s industrial robot supply chain are involved in component areas,
and focus primarily on the Greater China markets. Actually, some of them have a fairly
solid presence in China, such as Airtac (pneumatic equipment), Delta (inverters, servo
motors), Hiwin (linear motion components), Teco (motors), etc.
In recent years, these companies have been increasing their efforts to develop industrial
robots in Taiwan. Some have been leveraging their vertical-integration strength in key
component areas, such as Delta and Hiwin; some developing robots for their own in-house
demand for production automation, such as Hon Hai and Cheng Uei; and some companies
have even come up with robot products by leveraging their capabilities in other non-robotic
areas, such as Quanta Storage.
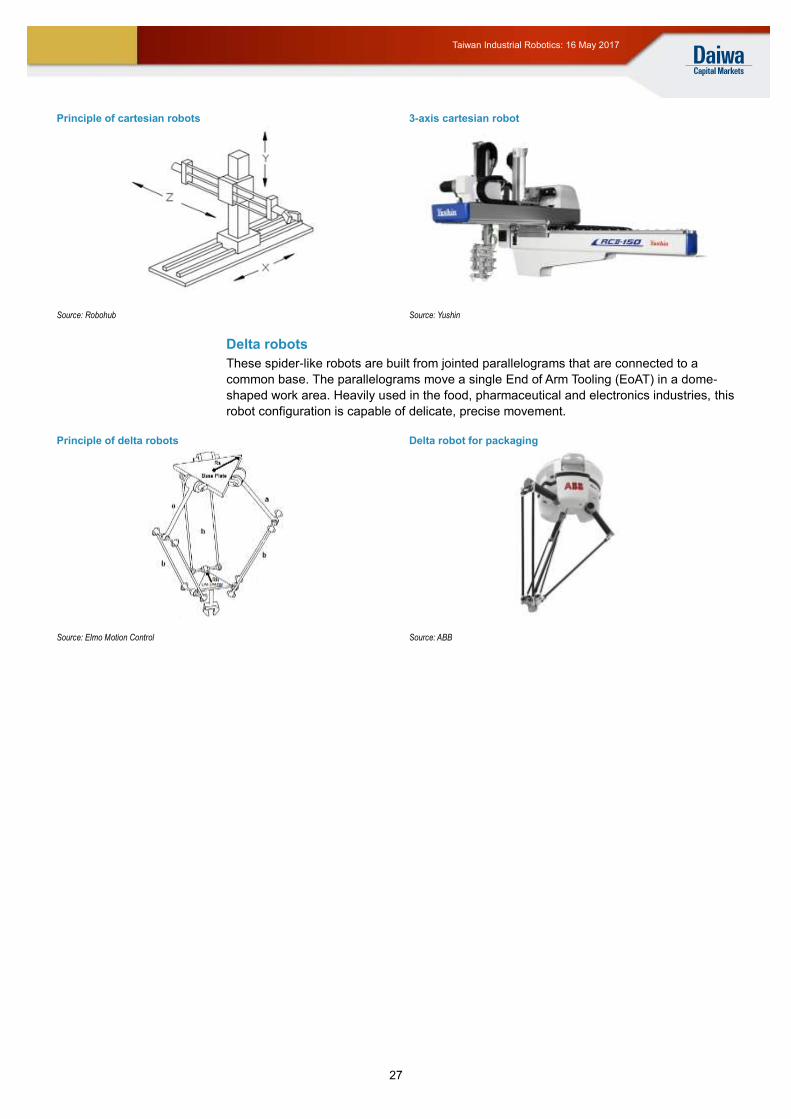
With Taiwan’s heavy exposure to the electronics sector, most Taiwanese companies’ focus
in industrial robots is on selective compliance articulated robot arm (SCARA), cartesian,
and articulated robots with lighter payloads (eg, 1-5 kg), which are suitable for the
assembly process of electronic products. The related revenue contribution from industrial
robots remains limited for most companies at the moment, but could become a promising
growth driver in the long run as the trend of industrial automation continues. (Note: please
refer to Appendix for more details on different types of industrial robots.)
600
700
800
900
1,000
1,100
1,200
Aug-13 Jan-14 Jun-14 Nov-14 Apr-15 Sep-15 Feb-16 Jul-16 Dec-16
Index price 21x 24x 26x 31x
(USD) Country Number of stocks included
US 34
Japan 19
Taiwan 6
Germany 5
UK 3
France 3
Israel 3
Switzerland 3
Canada 2
China 1
Finland 1
Sweden 1
Total 81
According to the IFR,
Taiwan accounted for
2.8% of global robot
shipments in 2015 and
its share could reach
3.1% in 2019E
Page 17
17
Taiwan Industrial Robotics: 16 May 2017
Industrial robot supply chain in Taiwan
Source: IEK, Daiwa research
Taiwan’s strength and opportunities
Existing capacities in key component areas Taiwan has well-established electronic and precision machinery industries and also related
supply chains, which provide a solid foundation for the development of industrial robots
and related components. In fact, several Taiwanese companies enjoy solid positions in
global or regional markets, such as Airtac (No.2 vendor of pneumatic equipment in China;
No.7 in the world), Hiwin (No.2 vendor of linear motion control components in the world;
No.1 in China), Delta (one of top-5 suppliers of servo motors and low-voltage inverters in
China), Teco (one of top-5 motor suppliers in the world), Advantech (one of major suppliers
of industrial controllers globally), etc.
We believe the existing capabilities in key component areas will help facilitate Taiwanese
companies shifting into the area of full robot system design. Some companies are doing so
by leveraging their in-house component supplies, such as Hiwin and Delta; some are doing
so by leveraging the support of the local component supply chain, such as Quanta
Storage. These efforts will take time to bear fruit, but we are optimistic on their growth
outlook.
China as a “home market” Despite the promising demand outlook for China, still over 80% of its industrial robots are
supplied by foreign vendors; furthermore, the industrial robots manufactured by Chinese
vendors also source about 70-80% of the components from overseas suppliers, based on
our industry surveys. While robots have been identified as one of the key focuses under
China’s 13th Five-Year Plan and “Made in China 2025” policy, the incentive/subsidies from
local governments do not seem to foster the “craftsmanship” required for the industrial
robot business in China.
Our industry research indicates that China is still not competitive in several robot-related
component areas, including reducers, servo motors, sensors, and linear motion control
related components. This situation gives Taiwanese companies a competitive edge, in our
view, especially when Taiwan’s products are typically more price-competitive than those of
Key robot components
Pro-Hawk (8083 TT), Aurotek (6215 TT)
CHELIC (4555 TT), Airtac (1590 TT)
NEXCOM (8234 TT), ICP DAS (3577 TT),
Hiwin (2049 TT), TBI Motion (4540 TT), Axiomtek (3088 TT), iBase (2463 TT), Adlink (6166 TT), Delta (2308 TT)
Chieftec (1597 TT) AAEON (2463 TT), iEi (3022 TT),
Ennoconn (6414 TT), Adlink (6166 TT)
Delta (2308 TT), Shinlin Electric (1503 TT),
Tatung (2371 TT), Teco (1504 TT),
Hiwin (2049 TT), TBI Motion (4540 TT) ICP DAS (3577 TT), Delta (2308 TT), Aurotek (6215 TT), ACE PILLAR (8374 TT) Delta (2308 TT)
ACE PILLAR (8374 TT),
Advantech (2395 TT)
Delta (2308 TT), Hiwin (2049 TT),
Aurotek (6215 TT), ACE PILLAR (8374 TT)
Hiwin (2049 TT), CHELIC (4555 TT),
Airtac (1590 TT)
System integrations
Axiomtek (3088 TT), Mirle (2464 TT), Gallant Precision (5443 TT), Chroma ATE (2360 TT)
Industrial robots
Hiwin (2049 TT), Delta (2308 TT), Aurotek (6215 TT), Quanta Storage (6188 TT), Gallant Precision (5443 TT), Kenmec (6125 TT), Taiwan Calsonic (4523 TT)
Bearing/ Gear
Linear guide
Ballscrew
PC-based controllers
Controller/ control system
Machine vision
Sensor
Gripper
Actuator
Motor
Reducer
Taiwan’s electronics and
precision machinery
sectors should provide a
solid foundation for
developing industrial
robots
China is the most
important market for
Taiwan’s industrial robot
sector, in our view
Page 18
18
Taiwan Industrial Robotics: 16 May 2017
overseas major vendors, but have consistently better quality than local suppliers in China.
We believe Taiwanese players stand a good chance of embracing the vast growth potential
in China, before the local supply chain in China starts to take shape.
Rising automation demand from local industries According to our industry surveys, the main target sectors in Taiwan’s industrial robot
supply chain include electronic, machinery, and auto parts. The electronics sector is no
doubt the most promising area, given Taiwan’s strong presence in the global IT industry
and the increasing automation demand for many technology companies.
Among all major sub-sectors in Taiwan’s electronics industry, we consider downstream
tech companies to be under more pressure to accelerate their automation, given their
lower penetration of production automation (than those of upstream tech companies) and
also the rising labour costs in China. The disclosure of these companies’ automation
roadmaps remains limited, but some companies appear more aggressive than others. For
example, Hon Hai’s chairman, Terry Guo, targets to achieve 30% automation by 2020,
while Delta aims to install 10-20k robot arms in China in the next 5 years, which could lead
to a 90% reduction in its workforce.
We conducted a quick estimate on the likely robot demand from these Taiwanese
downstream tech companies. If we assume all these companies achieve 10-20%
automation in the next 3 years, this could imply a 10-20% reduction in their workforces in
China. As a general rule of thumb in developed countries, the cost of a robotic arm is
equivalent to 2 workers’ full-year salaries. For our exercise we assumed the robot cost is
equivalent to 3 workers in China (although this might be a bit conservative give the ever-
rising labour costs there).
Potential robot demands from major EMS/ODM players in Taiwan
2016 revenue China workforce Likely robot demands in 3 years ('000 units)
Company (TWDbn) ('000 persons) 10% automation 20% automation
Hon Hai Precision 4,359 1,000 33.3 66.7 Pegatron 1,158 115 3.8 7.7 Quanta Computer 894 76 2.5 5.1 Delta Electronics 214 60 2.0 4.0 Compal Electronics 767 59 2.0 3.9 Wistron 660 36 1.2 2.4 Lite-On Technology 230 47 1.6 3.1 Inventec 428 15 0.5 1.0 Qisda Corp. 130 9 0.3 0.6 Total 47.2 94.5 Total robot demand in China from 2017E-19E (IFR forecast) 400.0 400.0 Contribution from Taiwan downstream tech companies 11.8% 23.6%
Source: Company data, Daiwa research
Based on these assumptions, as summarised in the table above, the major downstream
tech companies in Taiwan could create total robot arm demand of 47,200-94,500 units in
the next 3 years, equivalent to 11.8-23.6% of total industrial robot demand in China, based
on IFR’s forecast. While this is a rough estimate, it does represent a promising opportunity
for Taiwan’s industrial robot sector, in our view. In fact, the potential industrial robot
demand should be more substantial if we also include the potential demand from other
sub-segments in Taiwan’s electronic industry, as well as other industries like machinery,
auto parts and food & beverage.
New applications The new applications beyond traditional industrial automation related areas will also
provide growth opportunities, such as applications related to industrial IoT and Big Data, or
new types of robots like professional and personal robots (eg, robots for service, medical,
household related applications).
Nevertheless, all these new applications will require more than just robot-related know-
how. For IoT/Big Data related robotic solutions, they will involve a wide range of knowledge
(such as vertical domain know-how, big data software tools, etc), which could require
We expect downstream
tech to accelerate its
automation moves,
given its relatively low
penetration currently
and the rising labour
costs in China
New robot-related
applications could
benefit incumbents and
newcomers alike — but
new skills are required
too
Page 19
19
Taiwan Industrial Robotics: 16 May 2017
strategic alliances or even M&A. As for service/personal robots, aside from hardware
design, such businesses will require proper software support and feasible business
models. All these factors will mean that both newcomers and incumbents in the robot
supply chain will have a good chance of embracing the new opportunities, but they will also
need to develop/acquire the capabilities which they did not necessarily have in the first
place.
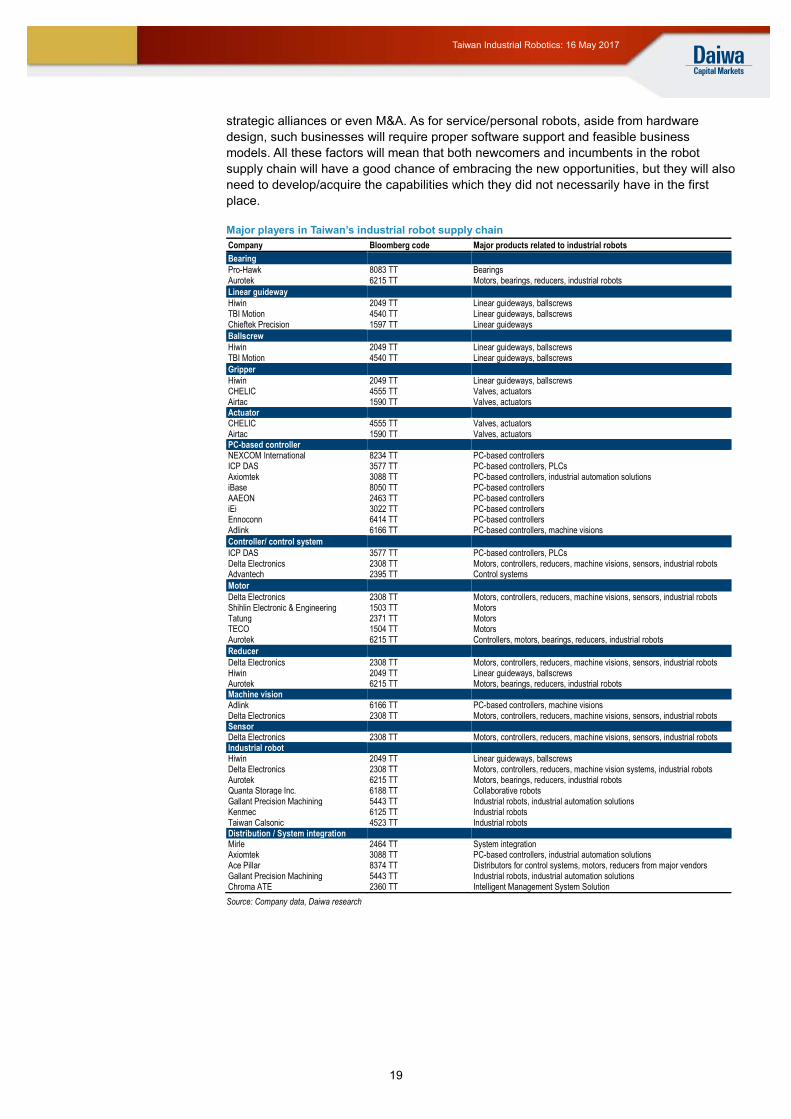
Major players in Taiwan’s industrial robot supply chain
Company Bloomberg code Major products related to industrial robots
Bearing
Pro-Hawk 8083 TT Bearings Aurotek 6215 TT Motors, bearings, reducers, industrial robots
Linear guideway
Hiwin 2049 TT Linear guideways, ballscrews TBI Motion 4540 TT Linear guideways, ballscrews Chieftek Precision 1597 TT Linear guideways
Ballscrew
Hiwin 2049 TT Linear guideways, ballscrews TBI Motion 4540 TT Linear guideways, ballscrews
Gripper
Hiwin 2049 TT Linear guideways, ballscrews CHELIC 4555 TT Valves, actuators Airtac 1590 TT Valves, actuators Actuator CHELIC 4555 TT Valves, actuators Airtac 1590 TT Valves, actuators PC-based controller NEXCOM International 8234 TT PC-based controllers ICP DAS 3577 TT PC-based controllers, PLCs Axiomtek 3088 TT PC-based controllers, industrial automation solutions iBase 8050 TT PC-based controllers AAEON 2463 TT PC-based controllers iEi 3022 TT PC-based controllers Ennoconn 6414 TT PC-based controllers Adlink 6166 TT PC-based controllers, machine visions
Controller/ control system
ICP DAS 3577 TT PC-based controllers, PLCs Delta Electronics 2308 TT Motors, controllers, reducers, machine visions, sensors, industrial robots Advantech 2395 TT Control systems
Motor
Delta Electronics 2308 TT Motors, controllers, reducers, machine visions, sensors, industrial robots Shihlin Electronic & Engineering 1503 TT Motors Tatung 2371 TT Motors TECO 1504 TT Motors Aurotek 6215 TT Controllers, motors, bearings, reducers, industrial robots
Reducer
Delta Electronics 2308 TT Motors, controllers, reducers, machine visions, sensors, industrial robots Hiwin 2049 TT Linear guideways, ballscrews Aurotek 6215 TT Motors, bearings, reducers, industrial robots Machine vision
Adlink 6166 TT PC-based controllers, machine visions Delta Electronics 2308 TT Motors, controllers, reducers, machine visions, sensors, industrial robots Sensor
Delta Electronics 2308 TT Motors, controllers, reducers, machine visions, sensors, industrial robots Industrial robot
Hiwin 2049 TT Linear guideways, ballscrews Delta Electronics 2308 TT Motors, controllers, reducers, machine vision systems, industrial robots Aurotek 6215 TT Motors, bearings, reducers, industrial robots Quanta Storage Inc. 6188 TT Collaborative robots Gallant Precision Machining 5443 TT Industrial robots, industrial automation solutions Kenmec 6125 TT Industrial robots Taiwan Calsonic 4523 TT Industrial robots Distribution / System integration
Mirle 2464 TT System integration Axiomtek 3088 TT PC-based controllers, industrial automation solutions Ace Pillar 8374 TT Distributors for control systems, motors, reducers from major vendors Gallant Precision Machining 5443 TT Industrial robots, industrial automation solutions Chroma ATE 2360 TT Intelligent Management System Solution
Source: Company data, Daiwa research
Page 20
20
Taiwan Industrial Robotics: 16 May 2017
Valuation and recommendations
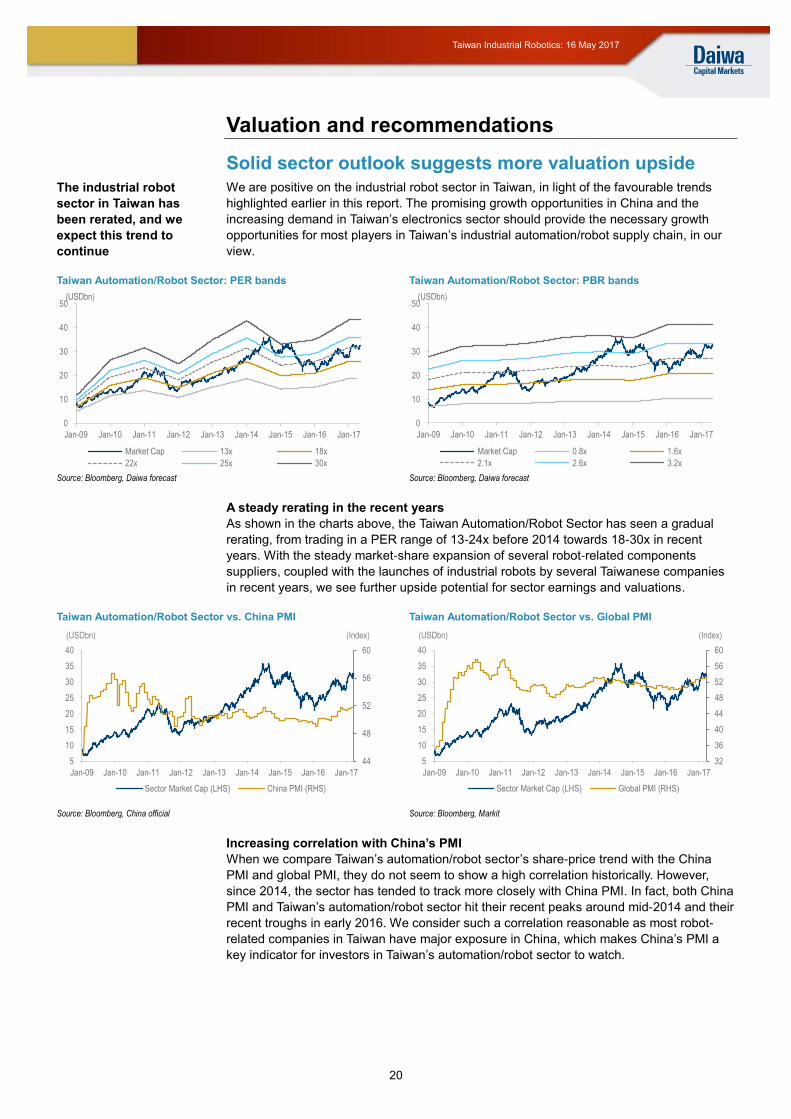
Solid sector outlook suggests more valuation upside
We are positive on the industrial robot sector in Taiwan, in light of the favourable trends
highlighted earlier in this report. The promising growth opportunities in China and the
increasing demand in Taiwan’s electronics sector should provide the necessary growth
opportunities for most players in Taiwan’s industrial automation/robot supply chain, in our
view.
Taiwan Automation/Robot Sector: PER bands Taiwan Automation/Robot Sector: PBR bands
Source: Bloomberg, Daiwa forecast Source: Bloomberg, Daiwa forecast
A steady rerating in the recent years
As shown in the charts above, the Taiwan Automation/Robot Sector has seen a gradual
rerating, from trading in a PER range of 13-24x before 2014 towards 18-30x in recent
years. With the steady market-share expansion of several robot-related components
suppliers, coupled with the launches of industrial robots by several Taiwanese companies
in recent years, we see further upside potential for sector earnings and valuations.
Taiwan Automation/Robot Sector vs. China PMI Taiwan Automation/Robot Sector vs. Global PMI
Source: Bloomberg, China official Source: Bloomberg, Markit
Increasing correlation with China’s PMI
When we compare Taiwan’s automation/robot sector’s share-price trend with the China
PMI and global PMI, they do not seem to show a high correlation historically. However,
since 2014, the sector has tended to track more closely with China PMI. In fact, both China
PMI and Taiwan’s automation/robot sector hit their recent peaks around mid-2014 and their
recent troughs in early 2016. We consider such a correlation reasonable as most robot-
related companies in Taiwan have major exposure in China, which makes China’s PMI a
key indicator for investors in Taiwan’s automation/robot sector to watch.
0
10
20
30
40
50
Jan-09 Jan-10 Jan-11 Jan-12 Jan-13 Jan-14 Jan-15 Jan-16 Jan-17
(USDbn)
Market Cap 13x 18x
22x 25x 30x
0
10
20
30
40
50
Jan-09 Jan-10 Jan-11 Jan-12 Jan-13 Jan-14 Jan-15 Jan-16 Jan-17
(USDbn)
Market Cap 0.8x 1.6x
2.1x 2.6x 3.2x
44
48
52
56
60
5
10
15
20
25
30
35
40
Jan-09 Jan-10 Jan-11 Jan-12 Jan-13 Jan-14 Jan-15 Jan-16 Jan-17
Sector Market Cap (LHS) China PMI (RHS)
(USDbn) (Index)
32
36
40
44
48
52
56
60
5
10
15
20
25
30
35
40
Jan-09 Jan-10 Jan-11 Jan-12 Jan-13 Jan-14 Jan-15 Jan-16 Jan-17
Sector Market Cap (LHS) Global PMI (RHS)
(USDbn) (Index)
The industrial robot
sector in Taiwan has
been rerated, and we
expect this trend to
continue
Page 21
21
Taiwan Industrial Robotics: 16 May 2017
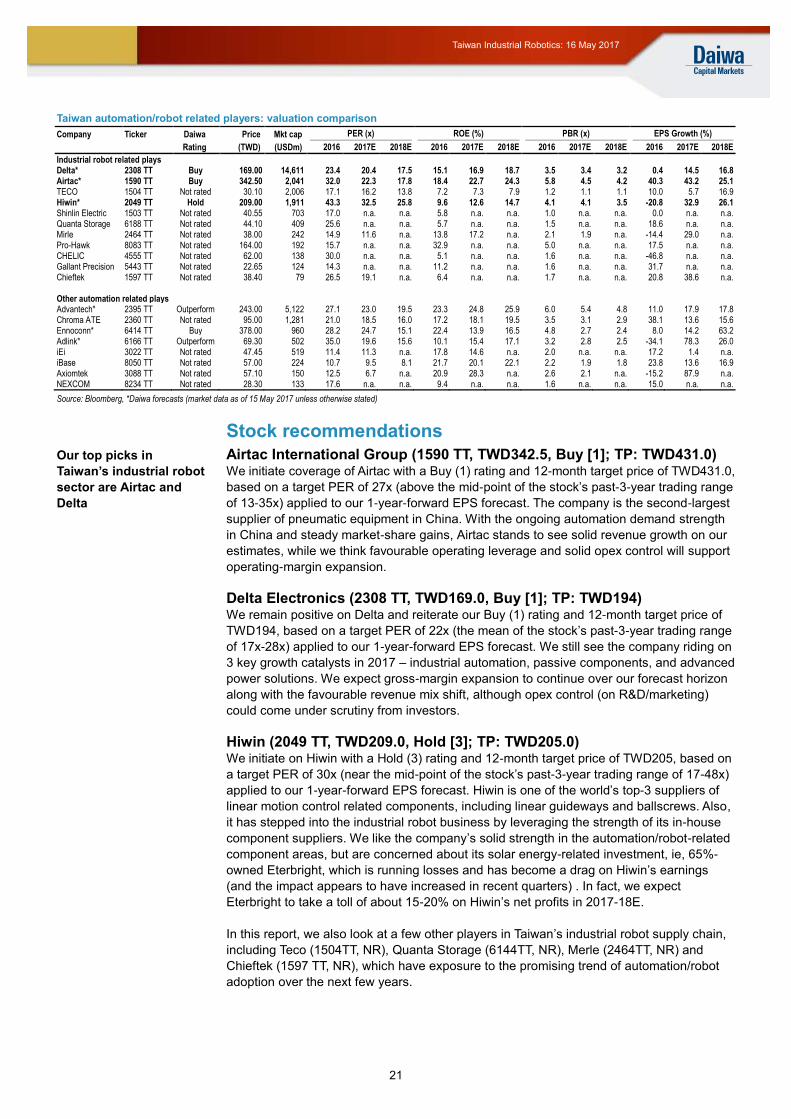
Taiwan automation/robot related players: valuation comparison
Company Ticker Daiwa Price Mkt cap PER (x) ROE (%) PBR (x) EPS Growth (%)
Rating (TWD) (USDm) 2016 2017E 2018E 2016 2017E 2018E 2016 2017E 2018E 2016 2017E 2018E
Industrial robot related plays Delta* 2308 TT Buy 169.00 14,611 23.4 20.4 17.5 15.1 16.9 18.7 3.5 3.4 3.2 0.4 14.5 16.8 Airtac* 1590 TT Buy 342.50 2,041 32.0 22.3 17.8 18.4 22.7 24.3 5.8 4.5 4.2 40.3 43.2 25.1 TECO 1504 TT Not rated 30.10 2,006 17.1 16.2 13.8 7.2 7.3 7.9 1.2 1.1 1.1 10.0 5.7 16.9 Hiwin* 2049 TT Hold 209.00 1,911 43.3 32.5 25.8 9.6 12.6 14.7 4.1 4.1 3.5 -20.8 32.9 26.1 Shinlin Electric 1503 TT Not rated 40.55 703 17.0 n.a. n.a. 5.8 n.a. n.a. 1.0 n.a. n.a. 0.0 n.a. n.a. Quanta Storage 6188 TT Not rated 44.10 409 25.6 n.a. n.a. 5.7 n.a. n.a. 1.5 n.a. n.a. 18.6 n.a. n.a. Mirle 2464 TT Not rated 38.00 242 14.9 11.6 n.a. 13.8 17.2 n.a. 2.1 1.9 n.a. -14.4 29.0 n.a. Pro-Hawk 8083 TT Not rated 164.00 192 15.7 n.a. n.a. 32.9 n.a. n.a. 5.0 n.a. n.a. 17.5 n.a. n.a. CHELIC 4555 TT Not rated 62.00 138 30.0 n.a. n.a. 5.1 n.a. n.a. 1.6 n.a. n.a. -46.8 n.a. n.a. Gallant Precision 5443 TT Not rated 22.65 124 14.3 n.a. n.a. 11.2 n.a. n.a. 1.6 n.a. n.a. 31.7 n.a. n.a. Chieftek 1597 TT Not rated 38.40 79 26.5 19.1 n.a. 6.4 n.a. n.a. 1.7 n.a. n.a. 20.8 38.6 n.a. Other automation related plays Advantech* 2395 TT Outperform 243.00 5,122 27.1 23.0 19.5 23.3 24.8 25.9 6.0 5.4 4.8 11.0 17.9 17.8 Chroma ATE 2360 TT Not rated 95.00 1,281 21.0 18.5 16.0 17.2 18.1 19.5 3.5 3.1 2.9 38.1 13.6 15.6 Ennoconn* 6414 TT Buy 378.00 960 28.2 24.7 15.1 22.4 13.9 16.5 4.8 2.7 2.4 8.0 14.2 63.2 Adlink* 6166 TT Outperform 69.30 502 35.0 19.6 15.6 10.1 15.4 17.1 3.2 2.8 2.5 -34.1 78.3 26.0 iEi 3022 TT Not rated 47.45 519 11.4 11.3 n.a. 17.8 14.6 n.a. 2.0 n.a. n.a. 17.2 1.4 n.a. iBase 8050 TT Not rated 57.00 224 10.7 9.5 8.1 21.7 20.1 22.1 2.2 1.9 1.8 23.8 13.6 16.9 Axiomtek 3088 TT Not rated 57.10 150 12.5 6.7 n.a. 20.9 28.3 n.a. 2.6 2.1 n.a. -15.2 87.9 n.a. NEXCOM 8234 TT Not rated 28.30 133 17.6 n.a. n.a. 9.4 n.a. n.a. 1.6 n.a. n.a. 15.0 n.a. n.a.
Source: Bloomberg, *Daiwa forecasts (market data as of 15 May 2017 unless otherwise stated)
Stock recommendations
Airtac International Group (1590 TT, TWD342.5, Buy [1]; TP: TWD431.0) We initiate coverage of Airtac with a Buy (1) rating and 12-month target price of TWD431.0,
based on a target PER of 27x (above the mid-point of the stock’s past-3-year trading range
of 13-35x) applied to our 1-year-forward EPS forecast. The company is the second-largest
supplier of pneumatic equipment in China. With the ongoing automation demand strength
in China and steady market-share gains, Airtac stands to see solid revenue growth on our
estimates, while we think favourable operating leverage and solid opex control will support
operating-margin expansion.
Delta Electronics (2308 TT, TWD169.0, Buy [1]; TP: TWD194) We remain positive on Delta and reiterate our Buy (1) rating and 12-month target price of
TWD194, based on a target PER of 22x (the mean of the stock’s past-3-year trading range
of 17x-28x) applied to our 1-year-forward EPS forecast. We still see the company riding on
3 key growth catalysts in 2017 – industrial automation, passive components, and advanced
power solutions. We expect gross-margin expansion to continue over our forecast horizon
along with the favourable revenue mix shift, although opex control (on R&D/marketing)
could come under scrutiny from investors.
Hiwin (2049 TT, TWD209.0, Hold [3]; TP: TWD205.0) We initiate on Hiwin with a Hold (3) rating and 12-month target price of TWD205, based on
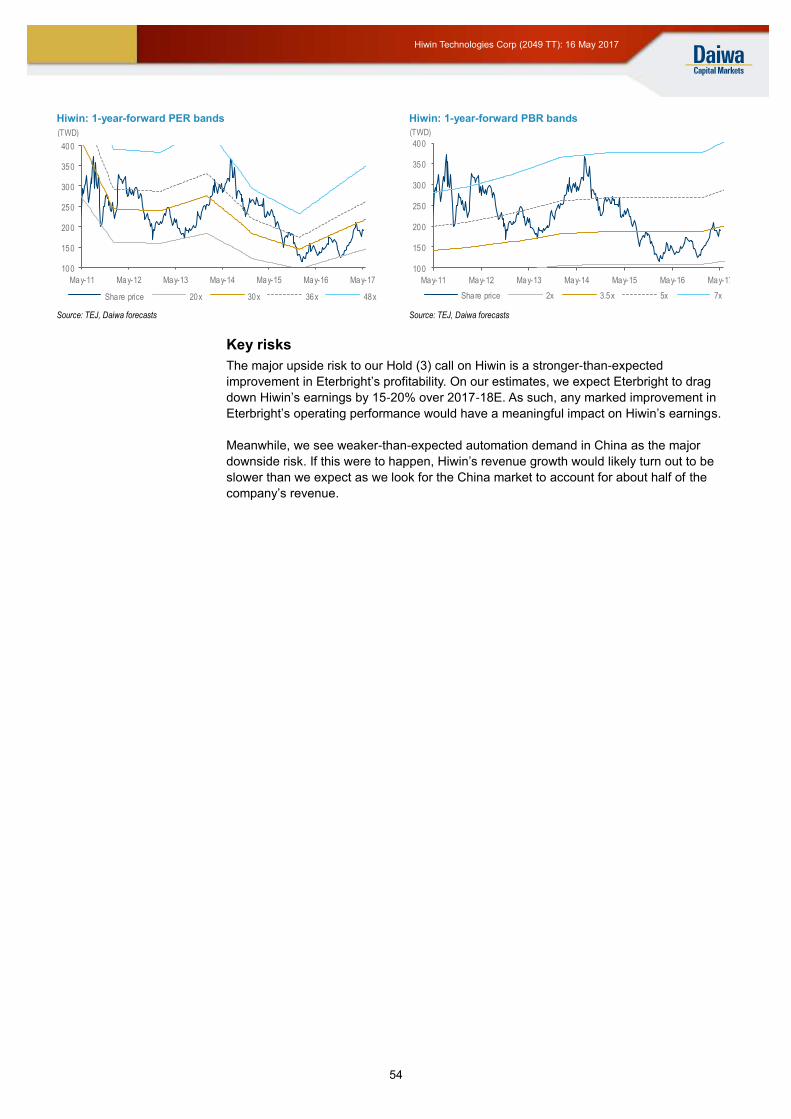
a target PER of 30x (near the mid-point of the stock’s past-3-year trading range of 17-48x)
applied to our 1-year-forward EPS forecast. Hiwin is one of the world’s top-3 suppliers of
linear motion control related components, including linear guideways and ballscrews. Also,
it has stepped into the industrial robot business by leveraging the strength of its in-house
component suppliers. We like the company’s solid strength in the automation/robot-related
component areas, but are concerned about its solar energy-related investment, ie, 65%-
owned Eterbright, which is running losses and has become a drag on Hiwin’s earnings
(and the impact appears to have increased in recent quarters) . In fact, we expect
Eterbright to take a toll of about 15-20% on Hiwin’s net profits in 2017-18E.
In this report, we also look at a few other players in Taiwan’s industrial robot supply chain,
including Teco (1504TT, NR), Quanta Storage (6144TT, NR), Merle (2464TT, NR) and
Chieftek (1597 TT, NR), which have exposure to the promising trend of automation/robot
adoption over the next few years.
Our top picks in
Taiwan’s industrial robot
sector are Airtac and
Delta
Page 22
22
Taiwan Industrial Robotics: 16 May 2017
Global automation/robot sector: valuation comparison
Company Ticker Daiwa Price Mkt cap PER (x) ROE (%) PBR (x) EPS Growth (%)
Rating (lc) (USDm) 2016 2017E 2018E 2016 2017E 2018E 2016 2017E 2018E 2016 2017E 2018E
Industrial robots ABB ABB SS Not-rated 218.40 54,794 191.4 176.6 156.9 13.6 18.8 20.5 32.5 34.1 32.8 -3.6 8.4 12.5 Denso 6902 JP Neutral 4882.00 34,125 15.9 18.8 17.1 7.6 6.6 7.1 1.2 1.2 1.2 -5.2 -15.7 10.3 FANUC* 6954 JP Outperform 22595.00 40,590 27.7 34.3 29.2 11.8 9.5 10.8 3.3 3.2 3.1 -23.0 -19.4 17.5 Krones KRN GR Not-rated 110.71 3,838 20.5 19.4 17.9 14.6 13.6 13.5 2.8 2.6 2.3 12.3 5.5 8.4 Kawasaki Heavy Industries* 7012 JP Neutral 339.00 4,986 12.3 21.6 13.0 10.7 6.0 9.6 1.3 1.3 1.2 -10.8 -43.0 65.6 Nachi* 6474 JP Neutral 606.00 1,329 32.8 30.8 n.a. 3.9 4.9 n.a. 1.5 1.5 n.a. -60.6 6.5 n.a. Panasonic* 6752 JP Neutral 1341.50 28,968 16.1 20.9 16.5 11.0 - 10.3 1.8 1.8 1.6 7.4 -22.9 26.7 Omron 6645 JP Not-rated 4535.00 8,541 20.7 21.8 19.8 10.1 9.7 10.0 2.2 2.0 1.9 -22.9 -5.0 10.1 Mitsubishi Heavy Industries* 7011 JP Neutral 453.50 13,468 23.8 17.4 14.4 3.7 5.1 5.9 0.9 0.9 0.8 -42.2 37.2 21.1 Siasun 300024 CH Not-rated 18.18 4,121 69.1 54.4 41.0 7.6 10.9 10.6 5.1 4.5 4.1 -3.6 27.0 32.6 Brooks Automation BRKS US Not-rated 28.34 1,974 60.3 25.8 23.1 -11.7 11.0 11.1 3.5 3.3 3.1 4.4 134.0 11.5 KUKA KU2 GR Not-rated 113.13 4,938 39.1 36.2 29.9 11.0 14.1 15.6 5.4 4.8 4.2 13.5 8.1 21.1 Yaskawa* 6506 JP Neutral 2190.00 5,141 25.9 33.5 30.8 12.7 9.3 9.5 3.2 3.0 2.8 -14.0 -22.9 8.7 Service robots iRobot IRBT US Not-rated 92.37 2,533 58.5 48.1 32.4 10.4 14.1 12.8 6.5 5.9 5.2 7.0 21.7 48.6 Intuitive Surgical ISRG US Not-rated 850.67 31,339 45.9 35.9 31.4 14.6 15.0 17.4 5.7 6.3 5.7 17.5 27.7 14.4 Toyota* 7203 JP Outperform 6009.00 172,600 8.1 9.9 10.2 13.8 10.5 9.5 1.1 1.0 0.9 7.8 -18.3 -2.3 Panasonic* 6752 JP Neutral 1341.50 28,968 16.1 20.9 16.5 11.0 - 10.3 1.8 1.8 1.6 7.4 -22.9 26.7 Honda* 7267 JP Neutral 3194.00 50,930 16.7 9.3 9.9 5.0 8.8 7.7 0.9 0.8 0.7 -34.1 79.0 -5.9 Samsung Electronics* 005930 KS Buy 2305000.00 288,454 14.8 8.4 7.4 12.5 19.0 17.9 1.9 1.6 1.3 22.7 76.1 13.1 MSI 2377 TT Not-rated 71.40 2,008 12.3 10.9 9.7 18.6 19.4 20.3 2.2 2.1 2.0 31.9 13.6 12.1 ASUSTek* 2357 TT Hold 280.00 6,922 10.8 11.7 11.2 11.0 9.6 9.7 1.1 1.1 1.1 12.3 -7.4 4.2 Actuators SMC* 6273 JP Outperform 33660.00 19,962 24.5 20.0 20.1 9.9 10.5 10.5 2.4 2.2 2.0 -15.8 22.7 -0.5 Yaskawa* 6506 JP Neutral 2190.00 5,141 25.9 33.5 30.8 12.7 9.3 9.5 3.2 3.0 2.8 -14.0 -22.9 8.7 IMI Plc IMI LN Not-rated 1270.00 4,459 21.4 20.6 18.4 24.0 27.6 29.0 6.7 5.9 5.3 26.9 4.0 11.5 Rotork ROR LN Not-rated 234.40 2,633 23.4 21.9 19.9 16.0 19.3 20.0 4.7 4.5 4.1 -3.8 7.0 10.3 Flowserve FLS US Not-rated 49.68 6,489 22.7 28.0 21.9 8.8 12.7 14.9 3.9 3.7 3.5 -28.7 -19.0 28.1 Omron 6645 JP Not-rated 4535.00 8,541 20.7 21.8 19.8 10.1 9.7 10.0 2.2 2.0 1.9 -22.9 -5.0 10.1 Siemens SIE GR Not-rated 129.94 121,209 20.2 16.0 15.2 15.9 17.7 17.3 3.1 2.7 2.5 0.6 26.6 5.4 Sensors Olympus* 7733 JP Neutral 4360.00 13,152 23.8 19.1 27.6 17.0 19.3 11.6 3.9 3.3 3.0 n.a. 24.9 -30.9 Sensata ST US Not-rated 39.74 6,800 13.8 12.7 11.7 14.5 22.9 19.6 3.5 2.9 2.5 5.1 8.6 8.4 Keyence 6861 JP Not-rated 48710.00 52,142 43.1 34.0 30.3 14.0 13.8 13.7 5.7 4.4 3.9 13.3 26.6 12.4 Delta* 2308 TT Buy 169.00 14,611 23.4 20.4 17.5 15.1 16.9 18.7 3.5 3.6 3.4 0.4 14.5 16.8 Rockwell Automation ROK US Not-rated 158.02 20,359 26.6 23.7 22.0 34.3 39.6 42.0 10.2 9.4 9.3 -7.3 12.3 7.8 Omron 6645 JP Not-rated 4535.00 8,541 20.7 21.8 19.8 10.1 9.7 10.0 2.2 2.0 1.9 -22.9 -5.0 10.1 Robot arms and end-effectors Yamaga Motor* 7272 JP Outperform 2807.00 8,646 15.5 11.7 10.2 12.3 14.9 15.2 1.8 1.6 1.5 5.2 33.0 14.3 ABB ABB SS Not-rated 218.40 54,794 191.4 176.6 156.9 13.6 18.8 20.5 32.5 34.1 32.8 -3.6 8.4 12.5 Omron 6645 JP Not-rated 4535.00 8,541 20.7 21.8 19.8 10.1 9.7 10.0 2.2 2.0 1.9 -22.9 -5.0 10.1 FANUC* 6954 JP Outperform 22595.00 40,590 27.7 34.3 29.2 11.8 9.5 10.8 3.3 3.2 3.1 -23.0 -19.4 17.5 Yaskawa* 6506 JP Neutral 2190.00 5,141 25.9 33.5 30.8 12.7 9.3 9.5 3.2 3.0 2.8 -14.0 -22.9 8.7 Controllers Omron 6645 JP Non-rated 4535.00 8,541 20.7 21.8 19.8 10.1 9.7 10.0 2.2 2.0 1.9 -22.9 -5.0 10.1 Kawasaki Heavy Industries* 7012 JP Neutral 339.00 4,986 12.3 21.6 13.0 10.7 6.0 9.6 1.3 1.3 1.2 -10.8 -43.0 65.6 Epson* 6724 JP Outperform 2329.00 8,193 18.2 17.0 13.7 9.5 10.1 11.8 1.8 1.7 1.6 -59.3 6.9 23.9 IMI Plc IMI LN Not-rated 1270.00 4,459 21.4 20.6 18.4 24.0 27.6 29.0 6.7 5.9 5.3 26.9 4.0 11.5 Sulzer SUN SW Not-rated 114.50 3,936 32.6 27.2 20.9 3.1 7.5 10.5 2.5 2.5 2.4 -10.6 19.8 30.3 Olympus* 7733 JP Neutral 4360.00 13,152 23.8 19.1 27.6 17.0 19.3 11.6 3.9 3.3 3.0 n.a. 24.9 -30.9 Hollysys HOLI US Not-rated 16.62 994 8.2 11.7 8.8 18.9 11.6 13.1 1.5 1.3 1.2 17.4 -29.6 33.2 Sensata ST US Not-rated 39.74 6,800 13.8 12.7 11.7 14.5 22.9 19.6 3.5 2.9 2.5 5.1 8.6 8.4 Schneider SU FP Not-rated 70.58 46,011 18.7 18.0 16.4 8.5 10.4 11.1 2.0 1.9 1.8 1.1 3.8 10.1 Rockwell Automation ROK US Not-rated 158.02 20,359 26.6 23.7 22.0 34.3 39.6 42.0 10.2 9.4 9.3 -7.3 12.3 7.8 Siemens SIE GR Not-rated 129.94 121,209 20.2 16.0 15.2 15.9 17.7 17.3 3.1 2.7 2.5 0.6 26.6 5.4 Advantech* 2395 TT Outperform 243.00 5,122 27.1 23.0 19.5 23.3 24.8 25.9 6.0 5.4 4.8 11.0 17.9 17.8 Yaskawa* 6506 JP Neutral 2190.00 5,141 25.9 33.5 30.8 12.7 9.3 9.5 3.2 3.0 2.8 -14.0 -22.9 8.7 Linear motion THK* 6481 JP Neutral 3015.00 3,553 28.1 22.8 18.9 5.5 6.7 7.8 1.5 1.5 1.4 -40.2 23.3 20.7 NSK* 6471 JP Buy 1465.00 7,109 12.1 17.0 12.4 14.3 9.9 12.8 1.7 1.7 1.5 10.6 -29.1 37.4 Danaher DHR US Not-rated 83.28 57,806 23.1 21.2 19.4 10.9 10.8 10.7 2.5 2.2 2.0 -16.0 8.8 9.3 Hiwin* 2049 TT Hold 209.00 1,911 43.3 32.5 25.8 9.6 12.6 14.7 4.1 4.1 3.5 -20.8 32.9 26.1 System Integration FANUC* 6954 JP Outperform 22595.00 40,590 27.7 34.3 29.2 11.8 9.5 10.8 3.3 3.2 3.1 -23.0 -19.4 17.5 ABB ABB SS Not-rated 218.40 54,794 191.4 176.6 156.9 13.6 18.8 20.5 32.5 34.1 32.8 -3.6 8.4 12.5 Emerson EMR US Not-rated 58.34 37,599 19.6 22.5 20.4 20.9 21.3 23.1 5.0 5.0 4.9 -6.0 -12.9 10.3 Rotork ROR LN Not-rated 234.40 2,633 23.4 21.9 19.9 16.0 19.3 20.0 4.7 4.5 4.1 -3.8 7.0 10.3 Yokogawa* 6841 JP Neutral 1919.00 4,538 16.8 19.9 22.2 13.2 10.4 8.7 2.1 2.0 1.9 70.5 -15.4 -10.4 Omron 6645 JP Not-rated 4535.00 8,541 20.7 21.8 19.8 10.1 9.7 10.0 2.2 2.0 1.9 -22.9 -5.0 10.1 Hollysys HOLI US Not-rated 16.62 994 8.2 11.7 8.8 18.9 11.6 13.1 1.5 1.3 1.2 17.4 -29.6 33.2 GE GE US Not-rated 28.18 244,714 18.9 17.2 15.0 9.4 18.3 21.8 3.2 3.3 3.2 13.7 9.8 15.2 Siemens SIE GR Not-rated 129.94 121,209 20.2 16.0 15.2 15.9 17.7 17.3 3.1 2.7 2.5 0.6 26.6 5.4 Motors Ametek AME US Not-rated 59.72 13,742 26.0 24.1 22.0 15.7 16.5 16.6 4.2 3.8 3.6 -9.8 7.6 9.9 Teco 1504 TT Not-rated 30.10 2,006 17.1 16.2 13.8 7.2 7.3 7.9 1.2 1.1 1.1 10.0 5.7 16.9 Delta* 2308 TT Buy 169.00 14,611 23.4 20.4 17.5 15.1 16.9 18.7 3.5 3.6 3.4 0.4 14.5 16.8 Machine vision 16.9 18.7 3.5 3.6 3.4 0.4 14.5 16.8 Cognex CGNX US Not-rated 91.65 7,941 53.3 46.0 39.0 16.7 18.0 18.4 8.2 7.3 6.4 41.0 15.8 18.0 Keyence 6861 JP Not-rated 48710.00 52,142 43.1 34.0 30.3 14.0 13.8 13.7 5.7 4.4 3.9 13.3 26.6 12.4 Delta* 2308 TT Buy 169.00 14,611 23.4 20.4 17.5 15.1 16.9 18.7 3.5 3.6 3.4 0.4 14.5 16.8 Valves Airtac* 1590 TT Buy 342.50 2,041 32.0 22.3 17.8 18.4 22.7 24.3 5.8 4.5 4.2 40.3 43.2 25.1 Flowserve FLS US Not-rated 49.68 6,489 22.7 28.0 21.9 8.8 12.7 14.9 3.9 3.7 3.5 -28.7 -19.0 28.1 Idex IEX US Not-rated 104.19 7,951 27.8 25.5 23.6 18.2 18.7 17.9 5.2 4.4 3.8 5.6 8.8 8.3 Roper ROP US Not-rated 222.40 22,692 33.9 24.5 22.3 11.9 13.1 13.9 3.9 3.5 3.2 -1.6 38.3 9.6 IMI Plc IMI LN Not-rated 1270.00 4,459 21.4 20.6 18.4 24.0 27.6 29.0 6.7 5.9 5.3 26.9 4.0 11.5 Rotork ROR LN Not-rated 234.40 2,633 23.4 21.9 19.9 16.0 19.3 20.0 4.7 4.5 4.1 -3.8 7.0 10.3
Source: Bloomberg, *Daiwa forecasts (market data as of 15 May 2017 unless otherwise stated)
Page 23
23
Taiwan Industrial Robotics: 16 May 2017
Appendix
Major components of industrial robots
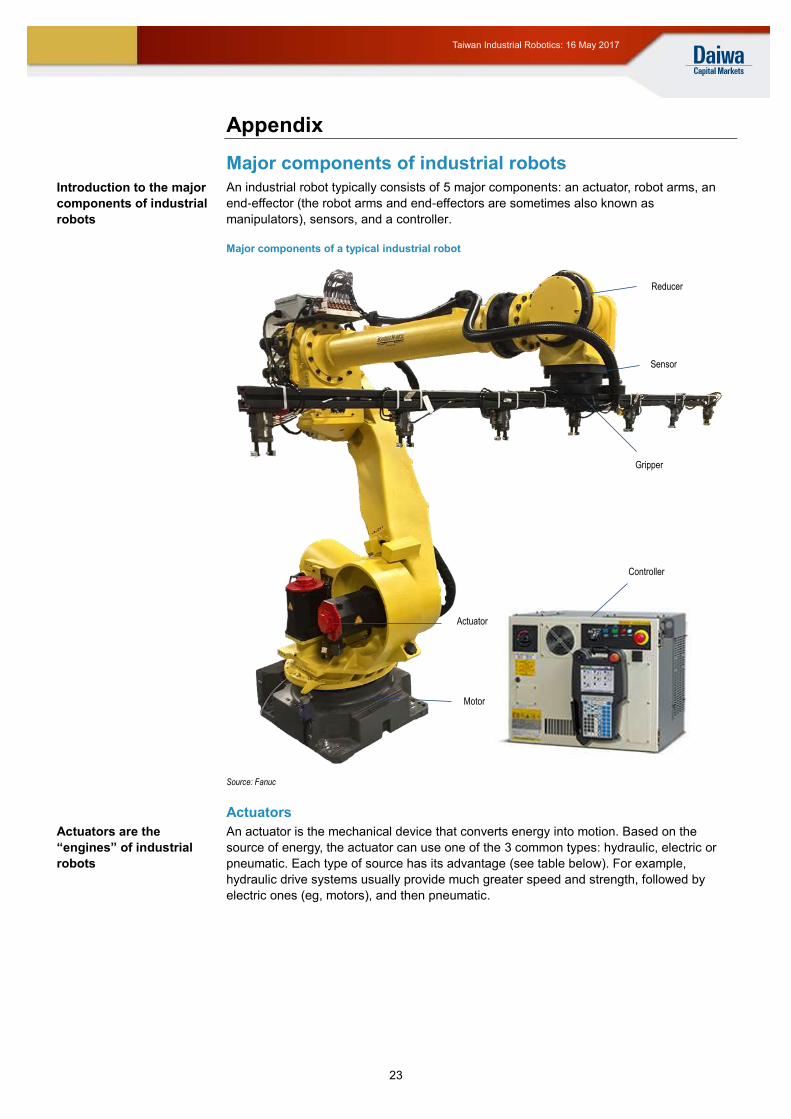
An industrial robot typically consists of 5 major components: an actuator, robot arms, an
end-effector (the robot arms and end-effectors are sometimes also known as
manipulators), sensors, and a controller.
Major components of a typical industrial robot
Source: Fanuc
Actuators
An actuator is the mechanical device that converts energy into motion. Based on the
source of energy, the actuator can use one of the 3 common types: hydraulic, electric or
pneumatic. Each type of source has its advantage (see table below). For example,
hydraulic drive systems usually provide much greater speed and strength, followed by
electric ones (eg, motors), and then pneumatic.
Actuator
Motor
Gripper
Sensor
Reducer
Controller
Introduction to the major
components of industrial
robots
Actuators are the
“engines” of industrial
robots
Page 24
24
Taiwan Industrial Robotics: 16 May 2017
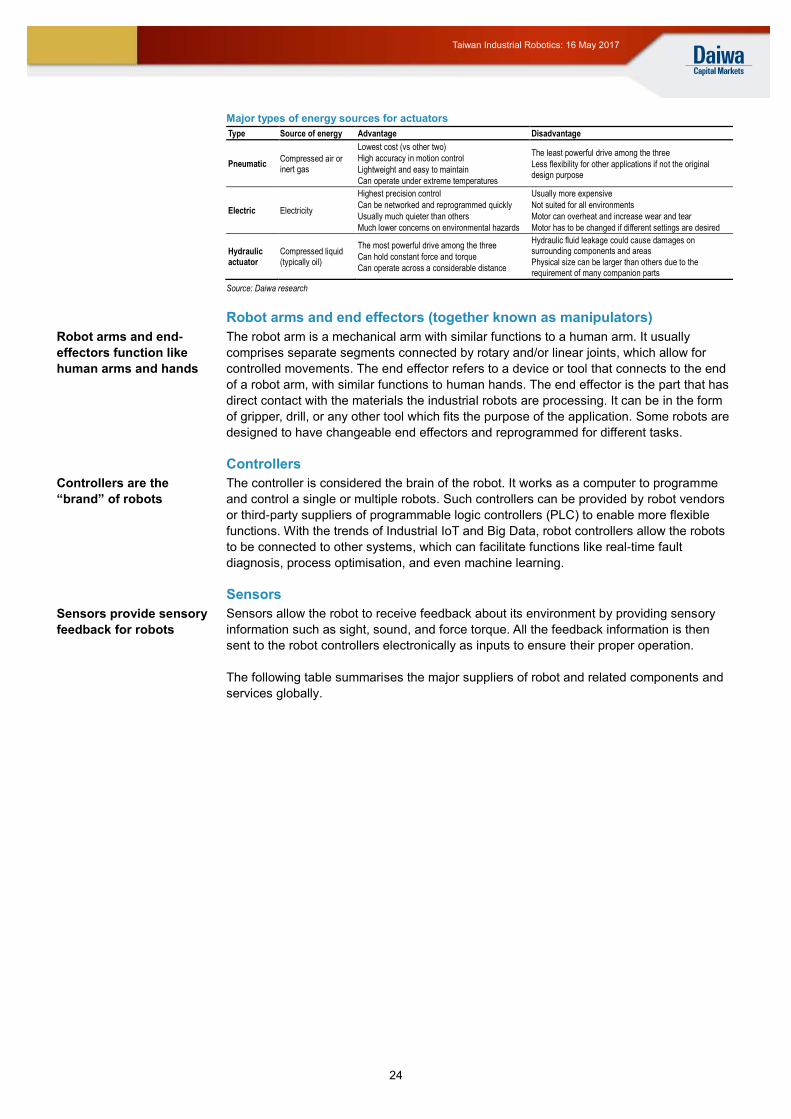
Major types of energy sources for actuators
Type Source of energy Advantage Disadvantage
Pneumatic Compressed air or inert gas
Lowest cost (vs other two)
High accuracy in motion control
Lightweight and easy to maintain
Can operate under extreme temperatures
The least powerful drive among the three
Less flexibility for other applications if not the original design purpose
Electric Electricity
Highest precision control
Can be networked and reprogrammed quickly
Usually much quieter than others
Much lower concerns on environmental hazards
Usually more expensive
Not suited for all environments
Motor can overheat and increase wear and tear
Motor has to be changed if different settings are desired
Hydraulic actuator
Compressed liquid (typically oil)
The most powerful drive among the three
Can hold constant force and torque
Can operate across a considerable distance
Hydraulic fluid leakage could cause damages on surrounding components and areas
Physical size can be larger than others due to the requirement of many companion parts
Source: Daiwa research
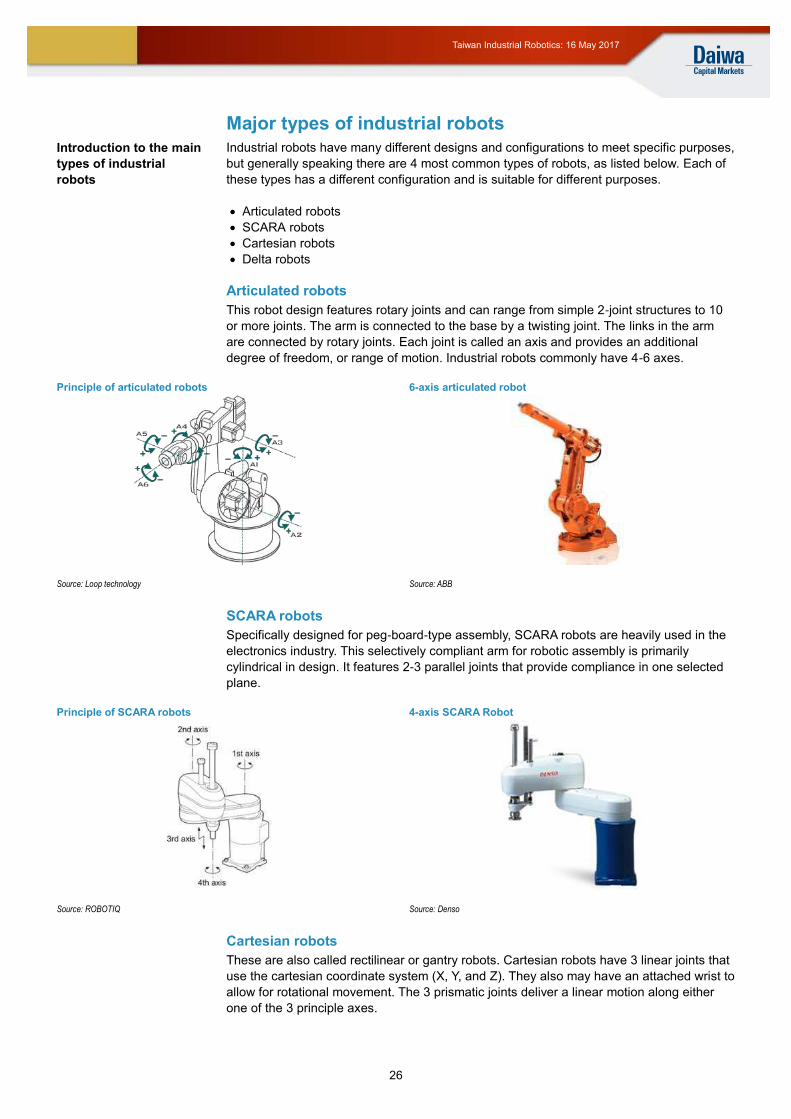
Robot arms and end effectors (together known as manipulators)
The robot arm is a mechanical arm with similar functions to a human arm. It usually
comprises separate segments connected by rotary and/or linear joints, which allow for
controlled movements. The end effector refers to a device or tool that connects to the end
of a robot arm, with similar functions to human hands. The end effector is the part that has
direct contact with the materials the industrial robots are processing. It can be in the form
of gripper, drill, or any other tool which fits the purpose of the application. Some robots are
designed to have changeable end effectors and reprogrammed for different tasks.
Controllers
The controller is considered the brain of the robot. It works as a computer to programme
and control a single or multiple robots. Such controllers can be provided by robot vendors
or third-party suppliers of programmable logic controllers (PLC) to enable more flexible
functions. With the trends of Industrial IoT and Big Data, robot controllers allow the robots
to be connected to other systems, which can facilitate functions like real-time fault
diagnosis, process optimisation, and even machine learning.
Sensors
Sensors allow the robot to receive feedback about its environment by providing sensory
information such as sight, sound, and force torque. All the feedback information is then
sent to the robot controllers electronically as inputs to ensure their proper operation.
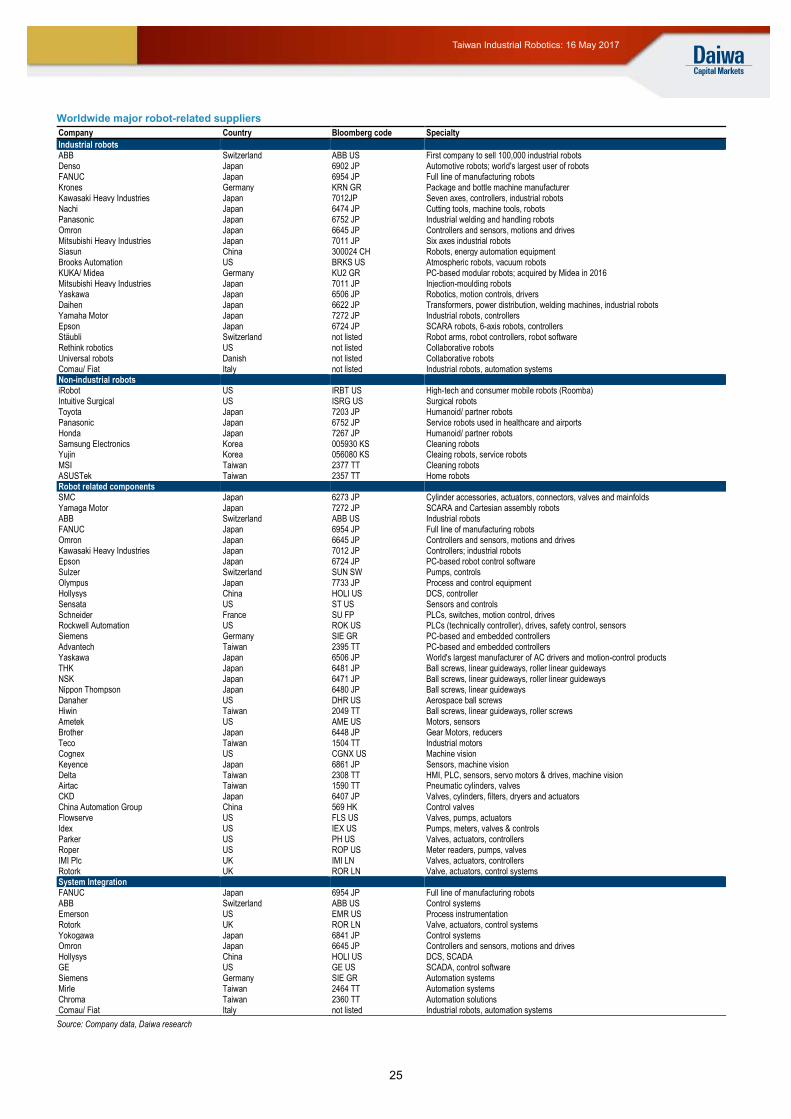
The following table summarises the major suppliers of robot and related components and
services globally.
Robot arms and end-
effectors function like
human arms and hands
Controllers are the
“brand” of robots
Sensors provide sensory
feedback for robots
Page 25
25
Taiwan Industrial Robotics: 16 May 2017
Worldwide major robot-related suppliers
Company Country Bloomberg code Specialty
Industrial robots ABB Switzerland ABB US First company to sell 100,000 industrial robots Denso Japan 6902 JP Automotive robots; world's largest user of robots FANUC Japan 6954 JP Full line of manufacturing robots Krones Germany KRN GR Package and bottle machine manufacturer Kawasaki Heavy Industries Japan 7012JP Seven axes, controllers, industrial robots Nachi Japan 6474 JP Cutting tools, machine tools, robots Panasonic Japan 6752 JP Industrial welding and handling robots Omron Japan 6645 JP Controllers and sensors, motions and drives Mitsubishi Heavy Industries Japan 7011 JP Six axes industrial robots Siasun China 300024 CH Robots, energy automation equipment Brooks Automation US BRKS US Atmospheric robots, vacuum robots KUKA/ Midea Germany KU2 GR PC-based modular robots; acquired by Midea in 2016 Mitsubishi Heavy Industries Japan 7011 JP Injection-moulding robots Yaskawa Japan 6506 JP Robotics, motion controls, drivers Daihen Japan 6622 JP Transformers, power distribution, welding machines, industrial robots Yamaha Motor Japan 7272 JP Industrial robots, controllers Epson Japan 6724 JP SCARA robots, 6-axis robots, controllers Stäubli Switzerland not listed Robot arms, robot controllers, robot software Rethink robotics US not listed Collaborative robots Universal robots Danish not listed Collaborative robots Comau/ Fiat Italy not listed Industrial robots, automation systems Non-industrial robots iRobot US IRBT US High-tech and consumer mobile robots (Roomba) Intuitive Surgical US ISRG US Surgical robots Toyota Japan 7203 JP Humanoid/ partner robots Panasonic Japan 6752 JP Service robots used in healthcare and airports Honda Japan 7267 JP Humanoid/ partner robots Samsung Electronics Korea 005930 KS Cleaning robots Yujin Korea 056080 KS Cleaing robots, service robots MSI Taiwan 2377 TT Cleaning robots ASUSTek Taiwan 2357 TT Home robots Robot related components SMC Japan 6273 JP Cylinder accessories, actuators, connectors, valves and mainfolds Yamaga Motor Japan 7272 JP SCARA and Cartesian assembly robots ABB Switzerland ABB US Industrial robots FANUC Japan 6954 JP Full line of manufacturing robots Omron Japan 6645 JP Controllers and sensors, motions and drives Kawasaki Heavy Industries Japan 7012 JP Controllers; industrial robots Epson Japan 6724 JP PC-based robot control software Sulzer Switzerland SUN SW Pumps, controls Olympus Japan 7733 JP Process and control equipment Hollysys China HOLI US DCS, controller Sensata US ST US Sensors and controls Schneider France SU FP PLCs, switches, motion control, drives Rockwell Automation US ROK US PLCs (technically controller), drives, safety control, sensors Siemens Germany SIE GR PC-based and embedded controllers Advantech Taiwan 2395 TT PC-based and embedded controllers Yaskawa Japan 6506 JP World's largest manufacturer of AC drivers and motion-control products THK Japan 6481 JP Ball screws, linear guideways, roller linear guideways NSK Japan 6471 JP Ball screws, linear guideways, roller linear guideways Nippon Thompson Japan 6480 JP Ball screws, linear guideways Danaher US DHR US Aerospace ball screws Hiwin Taiwan 2049 TT Ball screws, linear guideways, roller screws Ametek US AME US Motors, sensors Brother Japan 6448 JP Gear Motors, reducers Teco Taiwan 1504 TT Industrial motors Cognex US CGNX US Machine vision Keyence Japan 6861 JP Sensors, machine vision Delta Taiwan 2308 TT HMI, PLC, sensors, servo motors & drives, machine vision Airtac Taiwan 1590 TT Pneumatic cylinders, valves CKD Japan 6407 JP Valves, cylinders, filters, dryers and actuators China Automation Group China 569 HK Control valves Flowserve US FLS US Valves, pumps, actuators Idex US IEX US Pumps, meters, valves & controls Parker US PH US Valves, actuators, controllers Roper US ROP US Meter readers, pumps, valves IMI Plc UK IMI LN Valves, actuators, controllers Rotork UK ROR LN Valve, actuators, control systems System Integration FANUC Japan 6954 JP Full line of manufacturing robots ABB Switzerland ABB US Control systems Emerson US EMR US Process instrumentation Rotork UK ROR LN Valve, actuators, control systems Yokogawa Japan 6841 JP Control systems Omron Japan 6645 JP Controllers and sensors, motions and drives Hollysys China HOLI US DCS, SCADA GE US GE US SCADA, control software Siemens Germany SIE GR Automation systems Mirle Taiwan 2464 TT Automation systems Chroma Taiwan 2360 TT Automation solutions Comau/ Fiat Italy not listed Industrial robots, automation systems
Source: Company data, Daiwa research
Page 26
26
Taiwan Industrial Robotics: 16 May 2017
Major types of industrial robots
Industrial robots have many different designs and configurations to meet specific purposes,
but generally speaking there are 4 most common types of robots, as listed below. Each of
these types has a different configuration and is suitable for different purposes.
Articulated robots
SCARA robots
Cartesian robots
Delta robots
Articulated robots
This robot design features rotary joints and can range from simple 2-joint structures to 10
or more joints. The arm is connected to the base by a twisting joint. The links in the arm
are connected by rotary joints. Each joint is called an axis and provides an additional
degree of freedom, or range of motion. Industrial robots commonly have 4-6 axes.
Principle of articulated robots 6-axis articulated robot
Source: Loop technology Source: ABB
SCARA robots
Specifically designed for peg-board-type assembly, SCARA robots are heavily used in the
electronics industry. This selectively compliant arm for robotic assembly is primarily
cylindrical in design. It features 2-3 parallel joints that provide compliance in one selected
plane.
Principle of SCARA robots 4-axis SCARA Robot
Source: ROBOTIQ Source: Denso
Cartesian robots
These are also called rectilinear or gantry robots. Cartesian robots have 3 linear joints that
use the cartesian coordinate system (X, Y, and Z). They also may have an attached wrist to
allow for rotational movement. The 3 prismatic joints deliver a linear motion along either
one of the 3 principle axes.
Introduction to the main
types of industrial
robots
Page 27
27
Taiwan Industrial Robotics: 16 May 2017
Principle of cartesian robots 3-axis cartesian robot
Source: Robohub Source: Yushin
Delta robots
These spider-like robots are built from jointed parallelograms that are connected to a
common base. The parallelograms move a single End of Arm Tooling (EoAT) in a dome-
shaped work area. Heavily used in the food, pharmaceutical and electronics industries, this
robot configuration is capable of delicate, precise movement.
Principle of delta robots Delta robot for packaging
Source: Elmo Motion Control Source: ABB
Page 28
See important disclosures, including any required research certifications, beginning on page 65
Taiwan Industrials
Investment case: We initiate coverage of Airtac International Group
(Airtac), the second-largest vendor of pneumatic equipment in China, with a
Buy (1) rating. We are positive on the company sustaining its market-share
gains in China, as well as favourable operating-margin trends driven by
increasing operating leverage and effective opex control.
China the key growth driver. About 90% of Airtac’s revenue comes from
China. This benefits Airtac in 2 ways: 1) the company is able to ride on
solid automation demand in China, and 2) as China’s automation
penetration remains low, pneumatic equipment, due to its cost advantages,
is an ideal choice as the first step towards automation for SME companies.
Sustained market-share gains. With a steady expansion in distribution
networks, constant introduction of new products, and competitive pricing,
Airtac competes with its main rival SMC (6273 JP, JPY33,660, Outperform
[2]), the No.1 pneumatic vendor globally and in China, and has made
steady market-share gains in China (about 1pp per year on average since
2010) at the expense of smaller players.
Favourable margin trend. We expect Airtac’s operating margin to rise on
the back of: 1) increasing operating leverage due to revenue growth, 2)
effective opex control, particularly due to the company’s streamlining efforts
in distribution channels in China. The healthy pricing environment in China
should also help Airtac’s margin sustainability, in our view.
Catalysts: We expect Airtac’s sustained revenue growth and expanding
operating margin to be the major catalysts for the share price.
Valuation: We initiate our coverage with a Buy (1) rating. Our 12-month
target price is TWD431, based on a target PER of 27x (above the mid-point
of the stock’s past-3-year PER range of 13-35x) applied to our 1-year-
forward EPS forecast. Airtac’s share-price performance has been strong
YTD on solid 1Q17 earnings, and we expect this to continue as we expect
further improvement in the operating margin in the coming quarters, while
new electric products (likely to be unveiled in 2018E) could bring upside to
our earnings forecasts over the longer term.
Risks: 1) weaker-than-expected automation demand in China, and 2)
worse-than-expected price competition with SMC.
16 May 2017
Airtac International Gr oup
Initiation: pumping up the gains
Sustained market share gains in China to be the main revenue driver
Margin expansion on rising operating leverage and opex control
Initiating with Buy (1) rating and 12-month TP of TWD431
Source: FactSet, Daiwa forecasts
Airtac International Group (1590 TT)
Target price: TWD431.00
Share price (15 May): TWD342.50 | Up/downside: +25.8%
Steven Tseng(886) 2 8758 6252
[email protected]
Elsa Cheng(886) 2 8758 6253
[email protected]
90
104
118
131
145
200
240
280
320
360
May-16 Aug-16 Nov-16 Feb-17
Share price performance
ATIG (LHS) Relative to TWSE Index (RHS)
(TWD) (%)
12-month range 206.50-356.00
Market cap (USDbn) 2.03
3m avg daily turnover (USDm) 8.67
Shares outstanding (m) 179
Major shareholder Ding Kan Invest Ltd. (14.9%)
Financial summary (TWD)
Year to 31 Dec 17E 18E 19E
Revenue (m) 12,986 15,740 18,866
Operating profit (m) 3,802 4,818 5,892
Net profit (m) 2,748 3,439 4,218
Core EPS (fully-diluted) 15.351 19.210 23.563
EPS change (%) 43.2 25.1 22.7
Daiwa vs Cons. EPS (%) 3.2 3.6 5.2
PER (x) 22.3 17.8 14.5
Dividend yield (%) 1.7 2.5 3.1
DPS 5.9 8.4 10.6
PBR (x) 4.5 4.2 3.9
EV/EBITDA (x) 14.9 12.1 10.1
ROE (%) 22.7 24.3 27.8
Page 29
29
Airtac International Group (1590 TT): 16 May 2017
How do we justify our view?
Growth outlook Valuation Earnings revisions
Growth outlook Airtac: revenue and earnings growth forecasts
We expect Airtac’s revenue and earnings to show
sustained YoY growth during our forecast period,
supported by solid automation demand in China, steady
market-share gains in China’s pneumatic equipment
market, and operating-margin expansion on effective opex
control.
Source: Company, Daiwa forecasts
Valuation Airtac: 1-year forward PER bands
We initiate our coverage on Airtac with Buy (1) rating. Our
12-month target price is TWD431, based on a target PER
of 27x (above the mid-point of the stock’s past-3-year PER
range of 13-35x) applied to our 1-year-forward EPS
estimate. Airtac’s share price performance has been strong
YTD on solid 1Q17 earnings, and we expect this to
continue as we expect further improvement in the
operating margin in the coming quarters along with
sustained revenue growth momentum.
Source: TEJ, Daiwa forecasts
Earnings revisions Airtac: Bloomberg consensus 2017-18E EPS revisions
According to Bloomberg data, the consensus forecasts for
Airtac have generally been stable, but jumped after the
company reported stronger-than-expected 1Q17 results.
We expect more upward revisions to the street’s forecasts,
in light of Airtac’s ongoing operating-margin expansion and
the potential contribution from new electric products in
2018E.
Source: Bloomberg
-30%
-15%
0%
15%
30%
45%
0
5
10
15
20
2015 2016 2017E 2018E 2019E
Revenue (LHS) Net Income (LHS)
Revenue YoY (RHS) Net Income YoY (RHS)
(TWDbn)
50
100
150
200
250
300
350
400
May-11 May-12 May-13 May-14 May-15 May-16 May-17
Share price 13x 20x 27x 35x
(TWD)
10
11
12
13
14
15
16
17
18
19
Apr
-15
Jun-
15
Aug
-15
Oct
-15
Dec
-15
Feb
-16
Apr
-16
Jun-
16
Aug
-16
Oct
-16
Dec
-16
Feb
-17
Apr
-17
2017E 2018E
(TWD)
Page 30
30
Airtac International Group (1590 TT): 16 May 2017
Financial summary
Key assumptions
Profit and loss (TWDm)
Cash flow (TWDm)
Source: FactSet, Daiwa forecasts
Year to 31 Dec 2012 2013 2014 2015 2016 2017E 2018E 2019E
YoY growth of cylinder revenue (%) 4 24 27 9 23 26 23 20
YoY growth of valve revenue (%) (2) 48 (6) (2) 17 20 19 18
Airtac's market share in China (%) 14 15 16 17 18 19 20 21
Year to 31 Dec 2012 2013 2014 2015 2016 2017E 2018E 2019E
Cylinder 2,356 2,926 3,724 4,054 4,974 6,253 7,698 9,259
Valve 1,674 2,470 2,330 2,294 2,688 3,221 3,831 4,533
Other Revenue 1,638 1,904 2,325 2,450 2,960 3,511 4,211 5,074
Total Revenue 5,668 7,300 8,379 8,797 10,622 12,986 15,740 18,866
Other income 0 0 0 0 0 0 0 0
COGS (2,700) (3,264) (3,776) (4,260) (5,186) (6,281) (7,574) (9,044)
SG&A (1,273) (1,641) (1,928) (2,174) (2,382) (2,516) (2,894) (3,402)
Other op.expenses (179) (201) (286) (290) (334) (387) (453) (528)
Operating profit 1,516 2,195 2,389 2,073 2,720 3,802 4,818 5,892
Net-interest inc./(exp.) (35) (39) (51) (61) (115) (123) (124) (125)
Assoc/forex/extraord./others 57 211 51 (172) 243 170 150 148
Pre-tax profit 1,538 2,367 2,389 1,840 2,848 3,848 4,843 5,915
Tax (420) (641) (602) (464) (820) (1,023) (1,317) (1,609)
Min. int./pref. div./others (14) (15) (15) (8) (109) (77) (87) (88)
Net profit (reported) 1,104 1,710 1,771 1,368 1,919 2,748 3,439 4,218
Net profit (adjusted) 1,104 1,710 1,771 1,368 1,919 2,748 3,439 4,218
EPS (reported)(TWD) 7.359 10.030 10.386 7.639 10.717 15.351 19.210 23.563
EPS (adjusted)(TWD) 7.359 10.030 10.386 7.639 10.717 15.351 19.210 23.563
EPS (adjusted fully-diluted)(TWD) 7.359 10.030 10.386 7.639 10.717 15.351 19.210 23.563
DPS (TWD) 5.392 3.800 6.300 4.800 4.000 5.895 8.443 10.565
EBIT 1,516 2,195 2,389 2,073 2,720 3,802 4,818 5,892
EBITDA 1,846 2,626 2,940 2,719 3,486 4,594 5,724 6,886
Year to 31 Dec 2012 2013 2014 2015 2016 2017E 2018E 2019E
Profit before tax 1,538 2,367 2,389 1,840 2,848 3,848 4,843 5,915
Depreciation and amortisation 330 431 551 647 766 793 906 994
Tax paid (420) (641) (602) (464) (820) (1,023) (1,317) (1,609)
Change in working capital (248) (977) (909) (385) (755) (1,262) (1,754) (2,381)
Other operational CF items (143) 249 104 99 (336) (4) (6) (6)
Cash flow from operations 1,057 1,429 1,532 1,736 1,703 2,351 2,672 2,913
Capex (1,713) (2,882) (2,670) (2,468) (1,613) (2,182) (1,889) (1,509)
Net (acquisitions)/disposals (287) 0 (62) 157 (3) (87) (16) (38)
Other investing CF items (87) 219 (654) (219) (252) 0 0 0
Cash flow from investing (2,087) (2,663) (3,386) (2,530) (1,868) (2,269) (1,905) (1,547)
Change in debt 1,419 570 3,254 2,209 761 100 100 100
Net share issues/(repurchases) 0 1,960 0 0 0 0 0 0
Dividends paid (809) (570) (1,074) (818) (716) (1,055) (1,512) (1,891)
Other financing CF items 61 (74) (179) (218) (28) 0 0 0
Cash flow from financing 671 1,885 2,002 1,172 17 (955) (1,412) (1,791)
Forex effect/others (42) (43) 28 60 (7) 0 0 0
Change in cash (401) 608 175 439 (155) (873) (645) (426)
Free cash flow (656) (1,453) (1,138) (731) 90 170 783 1,403
Page 31
31
Airtac International Group (1590 TT): 16 May 2017
Financial summary continued …
Balance sheet (TWDm)
Key ratios (%)
Source: FactSet, Daiwa forecasts
As at 31 Dec 2012 2013 2014 2015 2016 2017E 2018E 2019E
Cash & short-term investment 1,086 1,591 2,494 3,092 3,688 2,815 2,170 1,744
Inventory 1,079 1,543 1,847 1,964 2,158 2,581 3,071 3,667
Accounts receivable 1,620 2,288 2,903 3,073 3,811 4,091 4,916 5,892
Other current assets 144 100 185 278 199 199 199 199
Total current assets 3,929 5,521 7,430 8,407 9,856 9,687 10,357 11,503
Fixed assets 5,628 8,106 10,430 12,083 11,769 14,867 15,715 15,751
Goodwill & intangibles 184 69 103 108 77 77 77 77
Other non-current assets 410 819 974 859 1,261 1,353 1,375 1,420
Total assets 10,152 14,517 18,937 21,456 22,963 25,984 27,524 28,750
Short-term debt 3,232 3,044 5,391 6,426 7,812 7,912 8,012 8,112
Accounts payable 543 774 769 776 1,123 1,150 1,386 1,655
Other current liabilities 279 362 479 884 887 887 887 887
Total current liabilities 4,054 4,179 6,639 8,086 9,821 9,948 10,285 10,654
Long-term debt 236 993 1,900 2,636 2,035 2,035 2,035 2,035
Other non-current liabilities 181 300 340 325 354 354 354 354
Total liabilities 4,471 5,473 8,879 11,047 12,211 12,338 12,674 13,043
Share capital 1,500 1,705 1,705 1,790 1,790 1,790 1,790 1,790
Reserves/R.E./others 4,034 7,194 8,200 8,468 8,850 11,744 12,947 13,804
Shareholders' equity 5,534 8,899 9,905 10,259 10,640 13,534 14,738 15,594
Minority interests 147 144 152 150 112 112 112 112
Total equity & liabilities 10,152 14,517 18,937 21,456 22,963 25,984 27,524 28,749
EV 63,845 63,906 66,265 67,436 67,587 68,559 69,304 69,830
Net debt/(cash) 2,382 2,446 4,796 5,970 6,159 7,131 7,876 8,402
BVPS (TWD) 36.891 52.196 58.096 57.303 59.434 75.598 82.322 87.105
Year to 31 Dec 2012 2013 2014 2015 2016 2017E 2018E 2019E
Sales (YoY) 0.5 28.8 14.8 5.0 20.7 22.3 21.2 19.9
EBITDA (YoY) (10.0) 42.2 11.9 (7.5) 28.2 31.8 24.6 20.3
Operating profit (YoY) (15.0) 44.8 8.8 (13.2) 31.2 39.8 26.7 22.3
Net profit (YoY) (18.2) 54.9 3.5 (22.8) 40.3 43.2 25.1 22.7
Core EPS (fully-diluted) (YoY) (18.2) 36.3 3.5 (26.4) 40.3 43.2 25.1 22.7
Gross-profit margin 52.4 55.3 54.9 51.6 51.2 51.6 51.9 52.1
EBITDA margin 32.6 36.0 35.1 30.9 32.8 35.4 36.4 36.5
Operating-profit margin 26.7 30.1 28.5 23.6 25.6 29.3 30.6 31.2
Net profit margin 19.5 23.4 21.1 15.5 18.1 21.2 21.8 22.4
ROAE 20.3 23.7 18.8 13.6 18.4 22.7 24.3 27.8
ROAA 11.8 13.9 10.6 6.8 8.6 11.2 12.9 15.0
ROCE 18.2 19.7 15.7 11.3 13.6 17.2 19.9 23.2
ROIC 15.6 16.4 13.6 9.9 11.6 14.8 16.1 18.3
Net debt to equity 43.0 27.5 48.4 58.2 57.9 52.7 53.4 53.9
Effective tax rate 27.3 27.1 25.2 25.2 28.8 26.6 27.2 27.2
Accounts receivable (days) 98.4 97.7 113.1 124.0 118.3 111.1 104.4 104.6
Current ratio (x) 1.0 1.3 1.1 1.0 1.0 1.0 1.0 1.1
Net interest cover (x) 43.8 56.8 46.8 33.9 23.7 30.9 38.7 47.3
Net dividend payout 59.9 51.6 62.8 46.2 52.4 55.0 55.0 44.8
Free cash flow yield n.a. n.a. n.a. n.a. 0.1 0.3 1.3 2.3
Company profile
Founded in 1988, Airtac is the second-largest manufacturer of pneumatic components in China,
with a 17% market share based on sales volume for 2015. Its key products include cylinder, valves,
and filters, regulators & lubricators (FRL). The company sells all the products under its own product
brand, AirTAC, and also provides after-sales services that include installation, maintenance, etc.
Page 32
32
Airtac International Group (1590 TT): 16 May 2017
Pumping up the strength
Airtac: a major supplier of pneumatic equipment
Airtac International Group (Airtac) supplies pneumatic equipment and related components.
Pneumatic equipment uses compressed air to produce mechanical motion. Compared with
other actuator drivers (including hydraulic and electric), a pneumatic actuator is more cost-
effective, easier to maintain, and can operate under harsh conditions, such as extreme
temperatures or in the presence of flammable gases/fluids.
We are positive on Airtac’s earnings growth outlook, driven by 3 factors:
a solid position in the pneumatic equipment market in China
sustained market-share gains
favourable operating-margin trends
Pneumatic equipment in operation Airtac: revenue breakdown by products
Source: Company Note: FRL – filter regulator lubricator
Source: Company, Daiwa forecasts
Worldwide major suppliers of pneumatic equipment
Source: Company, Daiwa
Solid position in China pneumatic equipment market
China: a key market for automation
According to the research firm Technavio, the global pneumatic equipment market is set to
increase at a 5% CAGR during 2016-20. Asia-Pacific is likely to lead the growth due to
increasing industrialisation and rapid urbanisation in the region, and will become the most
important market by 2020, making up 42% of global demand.
We consider this market trend as positive for Airtac, as it derives about 90% of revenue
from China, the biggest market for global automation/robot demand. In addition, pneumatic
equipment has a cost advantage compared with other actuator alternatives (for example,
the cost is only about one-tenth the price of electric equipment with similar specs), and is
considered a compelling choice of SME companies in their first step towards production
automation.
Airtac: the second-largest pneumatic player in China
While Airtac is ranked the seventh-largest pneumatic vendor globally (in terms of annual
sales), it mainly focuses on the Greater China market and is currently the second-largest
40% 44% 46% 47% 48% 49%
34% 28% 26% 25% 25% 24%
11% 9% 8% 8% 7% 7%
15% 19% 20% 20% 20% 20%
0%
20%
40%
60%
80%
100%
2013 2014 2015 2016 2017E 2018E
Cylinder Valve FRL Others
Airtac is a pneumatic
equipment manufacturer,
ranked No.7 globally
based on sales and No.2
in China
Companies Country Stock ticker Details
SMC Japan 6273 JP No.1 vendor globally (30-35% market share); also No.1 in China
Festo Germany Unlisted No.2 vendor globally (20-25% market share); No. 3 in China
Parker Hannifin US PH US A supplier of motion and control related products
CKD Japan 6407 JP A supplier of automatic machinery and related components
Aventics Germany Unlisted Formerly a division of Bosch; privatised in 2013
IMI Precision Engineering UK IMI LN Formerly known as Norgren; became a division under IMI group in 2015
Airtac Taiwan 1590 TT No. 2 vendor in China; No. 7 globally
China is the most
important market for
Airtac
Page 33
33
Airtac International Group (1590 TT): 16 May 2017
vendor in China (17% market share, as of 2015 data), behind SMC (33% market share),
the global leader in this field. With a well-recognised brand, solid product quality and strong
after-sales service, Airtac has a strong market position in China, in our view.
Airtac: revenue breakdown by region Airtac: revenue breakdown by client segment
Source: Company Source: Company
Sustained market-share gains in China pneumatic market
According to management, Airtac’s aims to outgrow the China pneumatic market by 5-
10pp each year. The company appears well placed to achieve such a target, as evidenced
by its steady market share gain over the past few years – typically around 1pp share gain
per year on average. While we believe Airtac is benefiting from consolidation in the
industry as clients prefer to work with leading vendors in the market, the company’s steady
expansion of its distribution network in China and constant introduction of new product is
also helping it gain market share at the expense of smaller competitors in China.
Major pneumatic vendors in China Airtac: number of sales offices in China
Source: Company
Source: Company Note: Branch offices take care of more functions, including sales, service, logistics and
sometimes even warehousing. Representative offices only handle sales.
Competition with SMC
Competition with SMC in China has been one of the key variables for Airtac’s financial
performance over the past few years, particularly during 2014-15. There was intense price
competition between the 2 companies in China in 2014-2015, which hurt both companies
materially. Fortunately, the price war came to an end in 2H15, with sales growth and profit
margin for both companies recovering from 2016.
According to Airtac, prior to 2014, product prices were at a 20-30% discount to SMC’s
equivalent products, but the gap narrowed to a single-digit percentage after 2015. Both
companies have since rationalised their pricing strategies, helping to create a healthy
market environment, in our view. In fact, according to Airtac, SMC may raise its pricing in
China in order to enhance profitability. While we have not seen actual evidence of such a
price adjustment, this implies favourable market demand and bodes well for Airtac’s
profitability, should the price hike materialise.
China90%
Taiwan4%
Other6%
0%5%
10%15%20%25%30%35%40%
Ele
ctro
nic
equi
pmen
t
Gen
eral
mac
hine
ry
Pac
kagi
ng
Aut
omak
er
Bat
tery
Con
stru
ctio
n
Mac
hine
tool
Oth
ers
2014 2015 2016
30% 31% 31% 31% 32% 33%
11% 12% 14% 15% 16% 17%10% 9% 9% 10% 11% 10%4% 4% 4% 4%
5% 5%19% 19% 19% 19%19% 20%
26% 25% 23% 21% 17% 15%
0%
20%
40%
60%
80%
100%
2010 2011 2012 2013 2014 2015
SMC Airtac Festo Taiwan/Korea brands Other foreign brands Domestic brands
3140
55 60 6255
48
2319
85 4
26 38
0
20
40
60
80
100
2010 2011 2012 2013 2014 2015 2016
Branch office Representative office
Airtac has steadily
gained around 1pp pa
market share in the
China pneumatic
equipment market since
2010
Price competition
between SMC and Airtac
has become less intense
in China since 2016
Page 34
34
Airtac International Group (1590 TT): 16 May 2017
Airtac: YoY sales growth vs SMC Asia ex-Japan Airtac: operating margin vs SMC Asia ex-Japan
Source: Company Source: Company
Historically, investors believed that the JPY exchange rate was a critical factor for
competition between Airtac and SMC, as a cheaper JPY should imply lower prices for
SMC, and hence be negative for Airtac, or vice versa. However, as most of SMC’s China
products are now made locally, this means that SMC China and Airtac should have a
similar currency mix in their cost structure, in which exposure to the CNY is much bigger
than the JPY. As such, the impact from the JPY exchange rate alone is not as critical as
before, in our view.
Favourable operating-margin trend
Gross margin likely to remain solid
Airtac’s gross margin typically stays above 50%, which we believe can be attributed to its
product customisation and vertical integration (ie, in-house component supplies) which
enables much better controls on both cost and quality.
A potential gross margin upside could come from a shift in the company’s client segment
mix (as opposed to product mix), as some sectors such as electronic, auto, medical, and
environmental, tend to involve more complicated or advanced applications, and hence are
likely to lead to better gross margin for Airtac.
Another potential driver for gross-margin expansion is Airtac’s new electric product, an
electric cylinder, which management expects to be unveiled in 2018. This is later than the
company’s original launch date in 2H17, as strong demand for pneumatic equipment has
led to much higher capacity utilisation. Hence, the company has decided to delay the new
product launch to 2018. Airtac believes its electric cylinder is very competitive in terms of
pricing as most of the components can be made in-house. In addition, the product can be
sold to its existing client base as many clients use multiple types of actuators in their
automation facilities for various purposes (as each type of actuator has its pros and cons).
Our current forecast has not factored in the contribution from this new business, and
implies a potential upside to our forecasts from 2018 onwards.
Opex under effective management
Airtac’s opex ratio has shown consistent improvement in recent years, from 28% in 2015 to
25.6% in 2016. In 1Q17, the company’s opex ratio was 22.3%, the lowest level since 2012.
As gross margin is likely to remain generally stable, we consider the lower opex ratio a key
catalyst for Airtac’s operating-margin expansion. We see 2 major drivers for a lower opex
ratio going forward:
Operating leverage. Along with sustained revenue growth, Airtac will continue to enjoy
improving operating leverage, which helps to bring down its opex ratio.
Distribution optimisation. Airtac’s constant efforts in streamlining its distribution
efficiency in China also help opex control, in our view. In fact, the company’s sales
expenses in 2016 fell to 14.5% of revenue, down from 16.6% in 2015; in 1Q17 the ratio
(30%)
(20%)
(10%)
0%
10%
20%
30%
40%
50%
60%
1Q13
2Q13
3Q13
4Q13
1Q14
2Q14
3Q14
4Q14
1Q15
2Q15
3Q15
4Q15
1Q16
2Q16
3Q16
4Q16
1Q17
Airtac SMC Asia (ex-Japan)
10%
15%
20%
25%
30%
35%
1Q13
2Q13
3Q13
4Q13
1Q14
2Q14
3Q14
4Q14
1Q15
2Q15
3Q15
4Q15
1Q16
2Q16
3Q16
4Q16
1Q17
Airtac SMC Asia (ex-Japan)
We expect Airtac’s
operating margin to rise
on likely expansion of
gross margin and
effective opex control
Page 35
35
Airtac International Group (1590 TT): 16 May 2017
further declined to 12.5%. Airtac has been centralising its service/logistic/warehouse
functions in regional distribution centres, and downsizing most of its branch offices to
representative offices which only focus on sales. Hence, Airtac has managed to improve
its sales expense controls. Airtac has implemented the strategy in Eastern China, and
expects to adopt the same strategy in Southern China going forward. Thus, opex
improvement should continue in 2017, in our opinion.
Airtac: gross and operating margins Airtac: operating expenses
Source: Company, Daiwa forecasts Source: Company, Daiwa forecasts
0%
10%
20%
30%
40%
50%
60%
2013 2014 2015 2016 2017E 2018E
Gross maring Operating margin
15%
18%
21%
24%
27%
30%
0
1
2
3
4
2013 2014 2015 2016 2017E 2018E
Operating expenses Opex ratio (RHS)
(TWDbn)
Page 36
36
Airtac International Group (1590 TT): 16 May 2017
Financials and valuation
Financial update
Near-term outlook
2Q17 outlook remains positive after strong 1Q17 results
Airtac reported 1Q17 EPS of TWD3.50, up 89% QoQ and 43% YoY, respectively. The
strong results were due to solid revenue growth (1Q17 revenue grew 6% QoQ and 24%
YoY) and a much improved operating margin of 29.2% (vs. 25.3% in 4Q16 and 22.8% in
1Q16). This was driven largely by a lower opex ratio, on the back of favourable operating
leverage and lower sales expenses, as mentioned earlier.
For 2Q17, management expects YoY revenue growth to remain similar to 1Q17 and
operating margin to further improve QoQ on better operating leverage. For 2017, the
company now expects over 20% YoY revenue growth, with operating margin of over 27%.
We expect Airtac to beat its 2017 guidance in light of its current business momentum.
Improving inventory
The pneumatic equipment business tends to have a long inventory period. In Airtac’s case,
the typical number of inventory days is about 5-6 months, which includes 2 months of
finished goods inventory, 2 months of work in process, and 1-2 months of raw materials. As
a comparison, SMC, the global leader, has an even higher inventory period of about 300
days.
Due to tighter inventory controls and improving market demands, Airtac’s days in inventory
has shown steady improvement since 2015. This helps Airtac’s cash flow and should bode
well for its profitability due to likely fewer inventory provisions.
Airtac: historical inventory days by quarter
Source: Company
Rights issue in 3Q17E
Airtac had previously stated that it is planning a rights issue of up to 10m new shares, or
about 5.5% of total shares outstanding. The company expects to file the application in
May, get approval by end-2Q17, and complete the issuance in 3Q17. According to
management, the proceeds from the rights issue will finance its capex in Tainan and also
be used for loan repayments.
100
120
140
160
180
200
220
1Q12 2Q12 3Q12 4Q12 1Q13 2Q13 3Q13 4Q13 1Q14 2Q14 3Q14 4Q14 1Q15 2Q15 3Q15 4Q15 1Q16 2Q16 3Q16 4Q16 1Q17
(Day)
For 2017, Airtac expects
over 20% YoY revenue
growth, with operating
margin likely above 27%
Page 37
37
Airtac International Group (1590 TT): 16 May 2017
Airtac: revenue and earnings forecasts and comparisons vs. consensus
(Consolidated) 2017E 2018E 2019E
(TWDm) Daiwa forecast Consensus Daiwa forecast Consensus Daiwa forecast Consensus
Revenue 12,986 12,734 15,740 15,165 18,866 17,751
Diff (%) 2.0% 3.8% 6.3%
Gross Margin (%) 51.6% 51.6% 51.9% 51.8% 52.1% 52.0%
Operating profit 3,802 3,600 4,818 4,529 5,892 5,470
Op Margin (%) 29.3% 28.3% 30.6% 29.9% 31.2% 30.8%
Net profit 2,748 2,662 3,439 3,320 4,218 4,010
EPS (TWD) 15.35 14.87 19.21 18.54 23.56 22.40
Diff (%) 3.2% 3.6% 5.2%
Source: Bloomberg, Daiwa forecasts
Airtac: quarterly and annual P&L statement
2016 2017
(TWDm) 1Q 2Q 3Q 4Q 1Q 2QE 3QE 4QE 2016 2017E 2018E
Net Revenue 2,270 2,926 2,773 2,653 2,814 3,566 3,374 3,232
10,622 12,986 15,740
COGS (1,134) (1,430) (1,341) (1,281) (1,366) (1,723) (1,631) (1,561)
(5,186) (6,281) (7,574)
Gross profit 1,136 1,496 1,432 1,371 1,448 1,843 1,742 1,671 5,435 6,704 8,166
Operating expenses (618) (700) (697) (701) (627) (788) (756) (731) (2,716) (2,902) (3,348)
Operating profit 518 795 736 671 820 1,055 987 940
2,720 3,802 4,818
Non-operating profit 94 25 229 (219) 17 9 10 11
128 47 25
Pre-tax profit 612 820 965 452 837 1,063 997 951 2,848 3,848 4,843
Income taxes (171) (215) (315) (119) (210) (287) (269) (257) (929) (1,100) (1,404)
Net profit 439 604 544 331 627 749 694 679
1,919 2,748 3,439
Net EPS (TWD) 2.45 3.38 3.04 1.85 3.50 4.18 3.88 3.79
10.72 15.35 19.21
Operating Ratios
Gross margin 50.0% 51.1% 51.7% 51.7% 51.4% 51.7% 51.6% 51.7%
51.2% 51.6% 51.9%
Operating margin 22.8% 27.2% 26.5% 25.3% 29.2% 29.6% 29.2% 29.1%
25.6% 29.3% 30.6%
Pre-tax margin 26.9% 28.0% 34.8% 17.0% 29.7% 29.8% 29.5% 29.4%
26.8% 29.6% 30.8%
Net margin 19.4% 20.7% 19.6% 12.5% 22.3% 21.0% 20.6% 21.0%
18.1% 21.2% 21.8%
YoY (%)
Net revenue 22% 20% 19% 23% 24% 22% 22% 22%
21% 22% 21%
Gross profit 13% 18% 22% 26% 27% 23% 22% 22%
20% 23% 22%
Operating profit 25% 22% 34% 47% 58% 33% 34% 40%
31% 40% 27%
Pre-tax profit 67% 16% 133% 29% 37% 30% 3% 111%
55% 35% 26%
Net profit 78% 9% 110% 8% 43% 24% 27% 105%
40% 43% 25%
QoQ (%)
Net revenue 5% 29% -5% -4% 6% 27% -5% -4%
Gross profit 4% 32% -4% -4% 6% 27% -5% -4%
Operating profit 13% 54% -8% -9% 22% 29% -6% -5%
Pre-tax profit 75% 34% 18% -53% 85% 27% -6% -5%
Net profit 43% 38% -10% -39% 89% 20% -7% -2%
Source: Company, Daiwa forecasts
Valuation and recommendation
Initiating with a Buy (1) rating
We initiate coverage on Airtac with a Buy (1) rating. Our 12-month target price is set at
TWD431, based on a target PER of 27x (above the mid-point of the stock’s past-3-year
PER range of 13-35x) applied to our 1-year-forward EPS estimate.
Airtac’s share price performance has been strong YTD, and we expect this to continue, as
operating margin expansion is likely to continue in the coming quarters, while the new
electric products (to be introduced in 2018E) could bring more upside to future earnings.
Initiating with a Buy (1)
rating and 12-month TP
of TWD431
Page 38
38
Airtac International Group (1590 TT): 16 May 2017
Airtac: 1-year-forward PER bands Airtac: 1-year-forward PBR bands
Source: TEJ, Daiwa forecasts Source: TEJ, Daiwa forecasts
Risks to our call
The key risk to our positive view on Airtac would be weaker-than-expected automation
demand in China. We note that China continues to outgrow the rest of the world in terms of
industrial automation/robotics demand.
The secondary risk would be potential price competition with SMC. We note that SMC’s
aggressive pricing in the past did not help much in gaining market share. In fact, both SMC
and Airtac have become more rational and disciplined in their pricing after the price war in
2014-15.
50
100
150
200
250
300
350
400
May-11 May-12 May-13 May-14 May-15 May-16 May-17
Share price 13x 20x 27x 35x
(TWD)
0
50
100
150
200
250
300
350
400
450
May-11 May-12 May-13 May-14 May-15 May-16 May-17
Share price 2.3x 3.6x 4.9x 6.1x
(TWD)
Weaker-than-expected
automation demand in
China is the key risk to
our call
Page 39
See important disclosures, including any required research certifications, beginning on page 65
Taiwan Information Technology
What's new: While Delta Electronics’ 1Q17 earnings came in below our
and consensus expectations on weaker operating leverage, we continue to
believe that its key growth drivers – industrial automation, passive
components, and advanced power solutions – remain solid.
What's the impact: 1Q17 results miss on weaker operating leverage.
Delta’s 1Q17 net profit was TWD3.92bn (EPS of TWD1.51), missing our
forecast (TWD4.36bn) and the Bloomberg consensus (TWD4.25bn). A
lower operating margin (8.1%, vs 9.4% in 4Q16) was likely the main
reason. While 1Q17 opex was down 8% QoQ, revenue fell by more (-14%
QoQ), which led to unfavourable operating leverage. Excluding the impact
of a stronger TWD (vs USD), Delta noted that its 1Q17 revenue would be
down only 9% QoQ and up 9% YoY (vs. the reported 3% YoY).
Updates on growth catalysts. At the results briefing, management gave an
update on the main growth drivers for the year. 1) Industrial automation:
Delta remains positive on double-digit YoY sales growth in 2017, with China
seen as the key growth area. 2) Passive components: Cyntec (a passive
component manufacturing subsidiary) announced capex of USD121m in late
March, which, according to Delta, is for mobile products, with shipments to
start in 3Q17. We believe the products are mini power chokes for the new
iPhones, though Delta also indicated that it had new client wins in China and
Korea. Delta expects that the number of power chokes per unit to be 20%
more in its clients’ new products. We believe this a positive driver of revenue
growth in 2H17. 3) Advanced power solutions: Delta is still positive on its
EV and data-centre related power businesses. Eltek (a telecom power
subsidiary) reported weaker profit in 1Q17 due to a client project delay, but
management believes the business should recover in 2Q17 and Delta
remains positive on Eltek’s 2017 profitability.
What we recommend: Our unchanged 12-month TP of TWD194 is based
on 1-year forward earnings (2Q17-1Q18 EPS) on an unchanged target
PER of 22x (the mean of its past-3-year trading range of 17-28x). Despite
forex uncertainty, we believe Delta’s major growth drivers remain intact,
and its passive component business could bring better-than-expected
revenue/earnings in 2H17. As Delta continues to shift towards solution-
based businesses, we expect its gross margin to expand. We reiterate our
Buy (1) call. Going forward, opex control (on R&D/marketing) will likely be
under scrutiny from investors. Key risks: weaker-than-expected industrial
demand and higher-than-expected opex.
How we differ: Our 2018E EPS is 4% above the Bloomberg consensus,
given our positive margin expectations driven by a product-mix shift.
16 May 2017
Delta El ectr onics
Growth drivers remain solid despite 1Q17 miss
Despite its 1Q17 results miss on weaker operating leverage…
…momentum in high-margin businesses looks to be intact
Reiterating Buy (1) and target price of TWD194
Source: Daiwa forecasts
Source: FactSet, Daiwa forecasts
Delta Electronics (2308 TT)
Target price: TWD194.00 (from TWD194.00)
Share price (15 May): TWD169.00 | Up/downside: +14.8%
Steven Tseng(886) 2 8758 6252
[email protected]
Elsa Cheng(886) 2 8758 6253
[email protected]
Forecast revisions (%)Year to 31 Dec 17E 18E 19E
Revenue change - - -
Net profit change - - -
Core EPS (FD) change - - -
90
96
103
109
115
135
146
158
169
180
May-16 Aug-16 Nov-16 Feb-17 May-17
Share price performance
Delta Ele (LHS)Relative to TWSE Index (RHS)
(TWD) (%)
12-month range 138.00-176.00
Market cap (USDbn) 14.57
3m avg daily turnover (USDm) 19.23
Shares outstanding (m) 2,598
Major shareholder Hsiang Ta International (10.3%)
Financial summary (TWD)
Year to 31 Dec 17E 18E 19E
Revenue (m) 226,454 244,939 261,949
Operating profit (m) 23,787 28,093 32,167
Net profit (m) 21,524 25,147 28,413
Core EPS (fully-diluted) 8.286 9.681 10.938
EPS change (%) 14.5 16.8 13.0
Daiwa vs Cons. EPS (%) (1.8) 4.1 12.0
PER (x) 20.4 17.5 15.5
Dividend yield (%) 3.3 3.6 4.1
DPS 5.5 6.0 7.0
PBR (x) 3.4 3.2 3.0
EV/EBITDA (x) 12.6 11.1 9.9
ROE (%) 16.9 18.7 19.9
Page 40
40
Delta Electronics (2308 TT): 16 May 2017
Financial summary
Key assumptions
Profit and loss (TWDm)
Cash flow (TWDm)
Source: FactSet, Daiwa forecasts
Year to 31 Dec 2012 2013 2014 2015 2016 2017E 2018E 2019E
Industrial Automation revenue growth
(YoY)8 6 7 4 11 16 17 18
Passive Components revenue growth
(YoY)14 16 38 15 2 11 21 12
Advanced Power Solutions revenue
growth (YoY)(8) 8 39 8 (6) (2) 9 8
Year to 31 Dec 2012 2013 2014 2015 2016 2017E 2018E 2019E
Power Electronics 106,525 102,933 114,480 109,889 111,690 117,237 125,202 133,204
Energy Management 35,732 32,778 35,788 52,850 59,373 63,164 69,404 76,412
Other Revenue 33,567 41,343 40,367 40,713 43,293 46,053 50,334 52,333
Total Revenue 175,824 177,053 190,635 203,452 214,356 226,454 244,939 261,949
Other income 0 0 0 0 0 0 0 0
COGS (134,470) (132,033) (139,141) (148,083) (154,862) (162,005) (173,709) (184,364)
SG&A (14,170) (14,237) (16,235) (20,405) (23,181) (24,391) (26,155) (27,702)
Other op.expenses (11,233) (11,274) (12,441) (14,465) (15,487) (16,271) (16,983) (17,716)
Operating profit 15,950 19,508 22,819 20,499 20,826 23,787 28,093 32,167
Net-interest inc./(exp.) 494 548 785 178 240 190 198 199
Assoc/forex/extraord./others 4,660 2,440 2,918 4,097 3,725 3,402 3,657 3,712
Pre-tax profit 21,104 22,497 26,522 24,775 24,790 27,379 31,948 36,078
Tax (3,226) (3,582) (4,203) (4,892) (5,530) (5,529) (6,494) (7,340)
Min. int./pref. div./others (1,768) (1,258) (1,615) (1,168) (462) (326) (307) (326)
Net profit (reported) 16,110 17,657 20,704 18,715 18,798 21,524 25,147 28,413
Net profit (adjusted) 16,110 17,657 20,704 18,715 18,798 21,524 25,147 28,413
EPS (reported)(TWD) 6.654 7.244 8.494 7.205 7.237 8.286 9.681 10.938
EPS (adjusted)(TWD) 6.654 7.244 8.494 7.205 7.237 8.286 9.681 10.938
EPS (adjusted fully-diluted)(TWD) 6.654 7.244 8.494 7.205 7.237 8.286 9.681 10.938
DPS (TWD) 3.674 5.305 5.800 7.930 5.087 5.500 6.000 7.000
EBIT 15,950 19,508 22,819 20,499 20,826 23,787 28,093 32,167
EBITDA 23,979 27,850 30,455 28,894 29,958 32,040 36,254 40,328
Year to 31 Dec 2012 2013 2014 2015 2016 2017E 2018E 2019E
Profit before tax 21,104 22,497 26,522 24,775 24,790 27,379 31,948 36,078
Depreciation and amortisation 8,029 8,342 7,636 8,395 9,133 8,253 8,161 8,161
Tax paid (3,226) (3,582) (4,203) (4,892) (5,530) (5,529) (6,494) (7,340)
Change in working capital (353) (3,022) (5,044) (4,052) (2,118) (1,203) (3,561) (3,285)
Other operational CF items (1,922) 1,877 2,924 6,834 4,625 (998) (1,055) (1,093)
Cash flow from operations 23,632 26,112 27,835 31,059 30,900 27,903 28,999 32,522
Capex (10,996) (8,824) (5,532) (7,974) (8,078) (8,534) (9,231) (9,872)
Net (acquisitions)/disposals (275) 1 (350) 0 0 0 0 0
Other investing CF items (630) 361 (882) (746) 922 (997) (997) (996)
Cash flow from investing (11,901) (8,461) (6,764) (8,720) (7,156) (9,531) (10,228) (10,868)
Change in debt (21,718) 1,868 8,852 (17,163) 5,942 0 0 0
Net share issues/(repurchases) 257 0 0 0 0 0 0 0
Dividends paid (8,831) (12,843) (14,138) (19,330) (13,213) (14,286) (15,585) (18,183)
Other financing CF items 6,380 (222) (2,172) (18,159) (932) 274 69 86
Cash flow from financing (23,911) (11,197) (7,458) (54,652) (8,204) (14,012) (15,517) (18,097)
Forex effect/others (2,600) 2,770 3,469 970 (3,026) 0 0 0
Change in cash (14,781) 9,223 17,082 (31,342) 12,514 4,359 3,254 3,557
Free cash flow 12,635 17,288 22,303 23,085 22,822 19,368 19,768 22,650
Page 41
41
Delta Electronics (2308 TT): 16 May 2017
Financial summary continued …
Balance sheet (TWDm)
Key ratios (%)
Source: FactSet, Daiwa forecasts
As at 31 Dec 2012 2013 2014 2015 2016 2017E 2018E 2019E
Cash & short-term investment 52,470 59,806 74,188 51,811 56,313 60,672 63,926 67,483
Inventory 15,461 18,042 21,572 23,912 25,953 26,083 27,967 29,682
Accounts receivable 38,192 44,305 46,696 50,639 52,564 54,514 58,964 63,058
Other current assets 15,767 4,349 5,376 5,791 3,572 3,572 3,572 3,572
Total current assets 121,890 126,503 147,832 132,153 138,402 144,841 154,429 163,796
Fixed assets 34,908 37,195 36,815 41,891 40,558 40,558 40,558 40,558
Goodwill & intangibles 11,733 10,858 11,706 25,425 30,919 30,919 30,919 30,919
Other non-current assets 13,357 22,741 24,080 26,806 25,236 26,410 27,465 28,558
Total assets 181,889 197,296 220,433 226,276 235,115 242,727 253,371 263,830
Short-term debt 5,037 4,562 5,801 11,110 12,539 12,539 12,539 12,539
Accounts payable 38,436 32,816 33,749 35,882 37,514 38,391 41,164 43,689
Other current liabilities 15,222 21,990 25,074 29,360 31,210 31,163 31,163 31,163
Total current liabilities 58,695 59,368 64,624 76,352 81,264 82,093 84,867 87,392
Long-term debt 16,492 18,828 26,468 3,994 8,514 8,514 8,514 8,514
Other non-current liabilities 7,298 11,306 13,672 16,377 16,328 16,328 16,328 16,328
Total liabilities 82,485 89,501 104,764 96,723 106,106 106,936 109,709 112,234
Share capital 24,212 24,375 24,375 25,975 25,975 25,975 25,975 25,975
Reserves/R.E./others 59,454 69,193 78,546 98,395 98,139 104,922 112,792 120,727
Shareholders' equity 83,666 93,568 102,921 124,370 124,114 130,897 138,768 146,702
Minority interests 15,738 14,227 12,747 5,183 4,894 4,894 4,894 4,894
Total equity & liabilities 181,889 197,296 220,433 226,276 235,115 242,727 253,371 263,830
EV 423,782 416,794 409,813 407,460 408,620 404,261 401,006 397,450
Net debt/(cash) (30,941) (36,417) (41,918) (36,708) (35,259) (39,619) (42,873) (46,429)
BVPS (TWD) 34.556 38.386 42.223 47.880 47.781 50.393 53.423 56.477
Year to 31 Dec 2012 2013 2014 2015 2016 2017E 2018E 2019E
Sales (YoY) 2.2 0.7 7.7 6.7 5.4 5.6 8.2 6.9
EBITDA (YoY) 42.5 16.1 9.4 (5.1) 3.7 6.9 13.2 11.2
Operating profit (YoY) 54.6 22.3 17.0 (10.2) 1.6 14.2 18.1 14.5
Net profit (YoY) 37.0 9.6 17.3 (9.6) 0.4 14.5 16.8 13.0
Core EPS (fully-diluted) (YoY) 36.0 8.9 17.3 (15.2) 0.4 14.5 16.8 13.0
Gross-profit margin 23.5 25.4 27.0 27.2 27.8 28.5 29.1 29.6
EBITDA margin 13.6 15.7 16.0 14.2 14.0 14.1 14.8 15.4
Operating-profit margin 9.1 11.0 12.0 10.1 9.7 10.5 11.5 12.3
Net profit margin 9.2 10.0 10.9 9.2 8.8 9.5 10.3 10.8
ROAE 20.0 19.9 21.1 16.5 15.1 16.9 18.7 19.9
ROAA 8.6 9.3 9.9 8.4 8.1 9.0 10.1 11.0
ROCE 12.5 15.5 16.4 14.0 14.1 15.5 17.5 19.1
ROIC 20.0 23.5 26.5 19.7 17.3 20.0 22.7 24.9
Net debt to equity net cash net cash net cash net cash net cash net cash net cash net cash
Effective tax rate 15.3 15.9 15.8 19.7 22.3 20.2 20.3 20.3
Accounts receivable (days) 80.1 85.0 87.1 87.3 87.9 86.3 84.5 85.0
Current ratio (x) 2.1 2.1 2.3 1.7 1.7 1.8 1.8 1.9
Net interest cover (x) n.a. n.a. n.a. n.a. n.a. n.a. n.a. n.a.
Net dividend payout 75.1 79.7 80.1 93.4 70.6 76.0 72.4 72.3
Free cash flow yield 2.9 3.9 5.1 5.3 5.2 4.4 4.5 5.2
Company profile
Founded in 1971, Delta Electronics has been the global leader in switching power supply solutions
since 2002 and DC brushless fans since 2006. Its business covers 3 key areas: power electronics
(eg, power supplies, thermal management products and passive components), energy management
(eg, industrial automation, datacentre power solutions and electric vehicle charging systems), and
smart green life (eg, smart grid, networking and display products).
Page 42
42
Delta Electronics (2308 TT): 16 May 2017
Delta: quarterly and annual P&L statement
2016 2017E
(TWDm) 1Q 2Q 3Q 4Q 1Q 2QE 3QE 4QE 2016 2017E 2018E
Net revenue 47,607 52,666 57,068 57,014 48,925 54,536 61,029 61,965
214,356 226,454 244,939
COGS (34,781) (37,893) (40,716) (41,473) (35,616) (39,118) (43,197) (44,074)
(154,862) (162,005) (173,709)
Gross profit 12,827 14,773 16,352 15,541 13,309 15,417 17,832 17,891 59,494 64,449 71,231
Operating expenses (8,957) (9,570) (9,974) (10,167) (9,341) (9,980) (10,497) (10,844) (38,668) (40,662) (43,138)
Operating profit 3,869 5,203 6,378 5,375 3,967 5,437 7,335 7,047
20,826 23,787 28,093
Non-operating profit 1,366 638 776 1,184 999 728 1,021 843
3,964 3,592 3,855
Pretax profit 5,235 5,841 7,154 6,559 4,967 6,166 8,356 7,890 24,790 27,379 31,948
Income taxes (1,189) (1,475) (1,377) (1,489) (993) (1,449) (1,588) (1,499) (5,530) (5,529) (6,494)
Net profit 3,887 4,293 5,666 4,952 3,919 4,627 6,675 6,302
18,798 21,524 25,147
Net EPS (TWD) 1.50 1.65 2.18 1.91 1.51 1.78 2.57 2.43
7.24 8.29 9.68
Operating Ratios
Gross margin 26.9% 28.1% 28.7% 27.3% 27.2% 28.3% 29.2% 28.9%
27.8% 28.5% 29.1%
Operating margin 8.1% 9.9% 11.2% 9.4% 8.1% 10.0% 12.0% 11.4%
9.7% 10.5% 11.5%
Pre-tax margin 11.0% 11.1% 12.5% 11.5% 10.2% 11.3% 13.7% 12.7%
11.6% 12.1% 13.0%
Net margin 8.2% 8.2% 9.9% 8.7% 8.0% 8.5% 10.9% 10.2%
8.8% 9.5% 10.3%
YoY (%)
Net revenue 10% 8% 2% 3% 3% 4% 7% 9%
5% 6% 8%
Gross profit 9% 7% 1% 3% 4% 4% 9% 15%
7% 8% 11%
Operating profit 14% 12% 4% 2% 3% 4% 15% 31%
2% 14% 18%
Pretax profit 3% 6% -6% 0% -5% 6% 17% 20%
0% 10% 17%
Net profit 1% 13% -4% -4% 1% 8% 18% 27%
0% 15% 17%
QoQ (%)
Net revenue -14% 11% 8% 0% -14% 11% 12% 2%
Gross profit -16% 15% 11% -5% -14% 16% 16% 0%
Operating profit -28% 34% 23% -16% -26% 37% 35% -4%
Pretax profit -20% 12% 22% -8% -24% 24% 36% -6%
Net profit -25% 10% 32% -13% -21% 18% 44% -6%
Source: Company, Daiwa forecasts
Delta: 1-year-forward PER bands Delta: revenue breakdown by product
Source: TEJ, Daiwa forecasts Source: Company, Daiwa forecasts
0
50
100
150
200
250
May-08 May-09 May-10 May-11 May-12 May-13 May-14 May-15 May-16 May-17
Share price 9x 15x 21x 28x
(TWD)
58% 60% 54% 52% 52%
19% 19% 26% 28% 28%
20% 19% 19% 19% 19%
4% 2% 1% 1% 2%
0%
20%
40%
60%
80%
100%
2013 2014 2015 2016 2017E
Power Electronics Energy Management Smart Green Life Others
Page 43
See important disclosures, including any required research certifications, beginning on page 65
Taiwan Industrials
Investment case: We initiate coverage of Hiwin Technologies (Hiwin), one
of the world’s top-3 suppliers of linear-motion components, with a Hold (3)
rating. We are positive on Hiwin’s competitiveness in its core business, but
believe the current valuation has factored in its earnings strength, while the
losses at 65%-owned Eterbright remain a lingering concern.
Solid market position. Hiwin is a top-3 supplier of linear-motion control-
related components globally, including linear guideways and ball screws
(together making up over 80% of revenue). By leveraging its strength in key
components, Hiwin has also ventured into the industrial robotics business,
and this is likely to be an important earnings driver in the next few years.
Improving demand in China. China is the most important market for Hiwin
and contributes about half of its revenue, on our estimates. Along with the
rising China PMI and machine-tool production value since mid-2016,
Hiwin’s revenue growth has improved substantially since 4Q16 and we
expect this strength to continue for the rest of 2017.
Solid core earnings. Along with improving revenue strength, we also
expect a favourable net-profit margin, driven by better economies of scale
(particularly in its ball-screw business), a shorter cash-conversion cycle,
and potentially less intense market competition.
However, Eterbright remains a concern. Eterbright is a CIGS thin-film
solar power module manufacturer, and negatively impacted Hiwin’s 2015
and 2016 earnings by 12%/22%, respectively. Hiwin expects these losses
to last for a further 2-3 years due to more R&D input. We expect Eterbright
to drag Hiwin’s earnings down by 15-20% over 2017-18E.
Catalysts: We see improving revenue strength and better operating
leverage as potential share-price catalysts for Hiwin.
Valuation: Our 12-month TP is TWD205, based on a target PER of 30x
(near the mid-point of the stock’s past-3-year PER range of 17-48x) applied
to our 1-year-forward EPS forecast. We note that after trading above a
forward PER of 30x and PBR of 3.5x over 2014-15, Hiwin has rarely traded
above those levels since 2016. We attribute the derating to the earnings
volatility and wider losses at Eterbright. While we expect Hiwin to see a
solid earnings recovery in 2017-18E, this may already have been reflected
at its current valuation (2017E PER of 33x), which is at the peak level in the
past 2 years. Thus, we initiate with a Hold (3) rating on valuation grounds.
Risks: Upside risk: better-than-expected profitability for Eterbright;
downside risk: weaker-than-expected automation demand in China.
16 May 2017
Hiwin Technol ogies Cor p
Initiation: core strength hurt by non-core losses
Rising demand in China bodes well for revenue growth
However, non-core solar investment is a lingering drag on earnings
Initiating with a Hold (3) rating and 12-month TP of TWD205
Source: FactSet, Daiwa forecasts
Hiwin Technologies Corp (2049 TT)
Target price: TWD205.00
Share price (15 May): TWD209.00 | Up/downside: -1.9%
Steven Tseng(886) 2 8758 6252
[email protected]
Elsa Cheng(886) 2 8758 6253
[email protected]
80
95
110
125
140
120
144
168
191
215
May-16 Aug-16 Nov-16 Feb-17
Share price performance
Hiwin Tech (LHS)Relative to TWSE Index (RHS)
(TWD) (%)
12-month range 125.00-212.00
Market cap (USDbn) 1.90
3m avg daily turnover (USDm) 18.92
Shares outstanding (m) 275
Major shareholder Ta-Yin investment (8.0%)
Financial summary (TWD)
Year to 31 Dec 17E 18E 19E
Revenue (m) 18,782 20,865 23,820
Operating profit (m) 2,030 2,416 2,959
Net profit (m) 1,764 2,224 2,737
Core EPS (fully-diluted) 6.421 8.097 9.964
EPS change (%) 32.9 26.1 23.1
Daiwa vs Cons. EPS (%) (8.5) (7.9) (8.8)
PER (x) 32.5 25.8 21.0
Dividend yield (%) 1.0 0.8 1.1
DPS 2.1 1.7 2.2
PBR (x) 4.1 3.5 3.4
EV/EBITDA (x) 19.5 17.5 14.8
ROE (%) 12.6 14.7 16.4
Page 44
44
Hiwin Technologies Corp (2049 TT): 16 May 2017
How do we justify our view?
Growth outlook Valuation Earnings revisions
Growth outlook Hiwin: revenue and earnings growth forecasts
We expect Hiwin’s earnings growth in 2017-19 to improve
substantially from 2014-15, on the back of growing
automation demand in China and likely margin expansion.
However, we are concerned over the lingering losses at the
company’s 65%-owned subsidiary, Eterbright, a solar
power module manufacturer that has been loss-making for
years. Hiwin’s management expects Eterbright’s losses to
continue for a further 2-3 years.
Source: Company, Daiwa forecasts
Valuation Hiwin: 1-year-forward PER bands
We initiate coverage of Hiwin with a Hold (3) rating and 12-
month TP of TWD205, based on a target PER of 30x (near
the mid-point of the stock’s past-3-year PER range of 17x-
48x) applied to our 1-year-forward EPS forecast. We note
that after trading above a 30x forward PER and 3.5x
forward PBR during 2014-15, Hiwin has rarely traded
above those levels since 2016. This derating could be due
to its earnings volatility and the widening of losses at
Eterbright. While the strong YoY earnings growth in 4Q16
and 1Q17 supported the stock’s recent rally, we believe
most of the positives are priced in and that further upside
could be limited.
Source: TEJ, Daiwa forecasts
Earnings revisions Hiwin: Bloomberg consensus 2017-18E EPS revisions
According to Bloomberg data, Hiwin’s consensus earnings
forecasts have been fairly stable since mid-2016, likely
driven by the company’s improving revenue growth since
3Q16. We believe the market has been generally positive
on the company’s revenue and earnings growth outlook,
but the lingering losses at Eterbright could remain a
potential downside risk for earnings in the next 2-3 years.
Source: Bloomberg
-40%
-30%
-20%
-10%
0%
10%
20%
30%
40%
0
5
10
15
20
25
30
2015 2016 2017E 2018E 2019E
Revenue (LHS) Net Income (LHS)
Revenue YoY (RHS) Net Income YoY (RHS )
(TWDbn)
100
150
200
250
300
350
400
May-11 May-12 May-13 May-14 May-15 May-16 May-17
Share price 20x 30x 36x 48x
(TWD)
0
2
4
6
8
10
12
14
16
Apr
-15
Jun-
15
Aug
-15
Oct
-15
Dec
-15
Feb
-16
Apr
-16
Jun-
16
Aug
-16
Oct
-16
Dec
-16
Feb
-17
Apr
-17
2017E 2018E
(TWD)
Page 45
45
Hiwin Technologies Corp (2049 TT): 16 May 2017
Financial summary
Key assumptions
Profit and loss (TWDm)
Cash flow (TWDm)
Source: FactSet, Daiwa forecasts
Year to 31 Dec 2012 2013 2014 2015 2016 2017E 2018E 2019E
YoY growth of linear guideway revenue
(%)(8) (5) 26 (6) 11 10 11 13
YoY growth of ball screw revenue (%) (38.2) 7.7 17.4 (2.5) (8.0) 25.4 12.7 13.5
YoY growth of industrial robot revenue
(%)8 19 (5) 2 35 21 20 23
Year to 31 Dec 2012 2013 2014 2015 2016 2017E 2018E 2019E
Ball screw 3,174 3,418 4,013 3,912 3,599 4,513 5,087 5,776
Linear Guideway 7,765 7,411 9,322 8,808 9,759 10,713 11,902 13,420
Other Revenue 1,433 1,614 1,752 2,161 2,760 3,556 3,875 4,623
Total Revenue 12,372 12,443 15,087 14,881 16,118 18,782 20,865 23,820
Other income 0 0 0 0 0 0 0 0
COGS (7,639) (7,835) (9,297) (9,547) (10,816) (12,630) (13,943) (15,950)
SG&A (1,568) (1,682) (2,135) (2,532) (2,919) (3,006) (3,282) (3,605)
Other op.expenses (391) (557) (807) (899) (932) (1,116) (1,224) (1,306)
Operating profit 2,774 2,369 2,848 1,903 1,451 2,030 2,416 2,959
Net-interest inc./(exp.) (106) (146) (158) (152) (144) (132) (133) (134)
Assoc/forex/extraord./others (80) 282 221 84 (117) (79) 121 223
Pre-tax profit 2,588 2,504 2,911 1,834 1,190 1,820 2,404 3,048
Tax (662) (591) (644) (440) (229) (439) (551) (688)
Min. int./pref. div./others 77 109 138 248 366 383 372 376
Net profit (reported) 2,003 2,022 2,405 1,642 1,327 1,764 2,224 2,737
Net profit (adjusted) 2,003 2,022 2,405 1,642 1,327 1,764 2,224 2,737
EPS (reported)(TWD) 8.129 7.965 9.199 6.099 4.831 6.421 8.097 9.964
EPS (adjusted)(TWD) 8.129 7.965 9.199 6.099 4.831 6.421 8.097 9.964
EPS (adjusted fully-diluted)(TWD) 8.129 7.965 9.199 6.099 4.831 6.421 8.097 9.964
DPS (TWD) 5.500 2.700 2.700 3.200 2.100 2.135 1.691 2.247
EBIT 2,774 2,369 2,848 1,903 1,451 2,030 2,416 2,959
EBITDA 3,715 3,442 3,954 3,278 2,970 3,596 4,006 4,738
Year to 31 Dec 2012 2013 2014 2015 2016 2017E 2018E 2019E
Profit before tax 2,588 2,504 2,911 1,834 1,190 1,820 2,404 3,048
Depreciation and amortisation 941 1,073 1,107 1,375 1,520 1,565 1,590 1,780
Tax paid (662) (591) (644) (440) (229) (439) (551) (688)
Change in working capital (2,617) (269) (623) (1,234) 1,897 (1,691) (889) (1,016)
Other operational CF items (489) (98) 480 (490) 51 (10) (10) (10)
Cash flow from operations (239) 2,618 3,231 1,046 4,429 1,246 2,543 3,115
Capex (3,513) (2,681) (1,323) (2,866) (4,082) (2,817) (2,086) (2,382)
Net (acquisitions)/disposals (20) (24) 0 (26) 0 (12) (9) (12)
Other investing CF items (74) (209) (317) (147) 570 (5) 0 0
Cash flow from investing (3,607) (2,914) (1,640) (3,039) (3,511) (2,835) (2,096) (2,394)
Change in debt 4,972 631 (3) 1,911 (36) 800 0 0
Net share issues/(repurchases) 0 0 0 0 0 0 0 0
Dividends paid (1,291) (665) (685) (837) (565) (575) (464) (617)
Other financing CF items 285 194 384 370 243 0 0 0
Cash flow from financing 3,966 160 (304) 1,445 (359) 225 (464) (617)
Forex effect/others (12) 4 (12) (61) (66) 0 0 0
Change in cash 108 (131) 1,274 (610) 493 (1,364) (17) 104
Free cash flow (3,751) (62) 1,908 (1,820) 347 (1,572) 457 733
Page 46
46
Hiwin Technologies Corp (2049 TT): 16 May 2017
Financial summary continued …
Balance sheet (TWDm)
Key ratios (%)
Source: FactSet, Daiwa forecasts
As at 31 Dec 2012 2013 2014 2015 2016 2017E 2018E 2019E
Cash & short-term investment 1,317 1,186 2,460 1,610 2,108 744 727 830
Inventory 3,766 3,961 4,067 5,524 4,458 5,882 6,494 7,342
Accounts receivable 4,591 4,868 5,674 5,480 4,604 5,917 6,574 7,374
Other current assets 315 371 764 959 498 498 498 498
Total current assets 9,988 10,385 12,965 13,573 11,668 13,042 14,293 16,045
Fixed assets 14,557 13,903 15,258 15,931 17,796 18,170 19,545 19,269
Goodwill & intangibles 16 0 14 192 192 192 192 192
Other non-current assets 748 3,323 2,090 3,070 3,310 3,382 3,400 3,402
Total assets 25,309 27,611 30,328 32,766 32,967 34,787 37,430 38,908
Short-term debt 4,335 5,121 4,360 6,130 4,721 5,021 5,021 5,021
Accounts payable 2,682 2,738 3,267 3,053 2,966 4,014 4,393 5,025
Other current liabilities 1,720 1,960 2,347 2,344 2,969 2,969 2,969 2,969
Total current liabilities 8,737 9,819 9,974 11,527 10,656 12,004 12,383 13,016
Long-term debt 5,952 5,631 6,281 6,270 7,051 7,551 7,551 7,551
Other non-current liabilities 242 366 400 468 459 459 459 459
Total liabilities 14,931 15,815 16,655 18,265 18,167 20,014 20,393 21,026
Share capital 2,464 2,538 2,614 2,693 2,747 2,747 2,747 2,747
Reserves/R.E./others 7,435 8,694 10,314 10,953 11,355 11,171 13,592 14,281
Shareholders' equity 9,899 11,232 12,928 13,646 14,102 13,918 16,338 17,027
Minority interests 479 564 744 855 698 855 698 855
Total equity & liabilities 25,309 27,611 30,328 32,766 32,967 34,787 37,430 38,908
EV 66,854 67,534 66,330 69,049 67,767 70,088 69,949 70,002
Net debt/(cash) 8,970 9,566 8,181 10,790 9,664 11,829 11,846 11,742
BVPS (TWD) 40.170 44.251 49.451 50.676 51.341 50.671 59.484 61.994
Year to 31 Dec 2012 2013 2014 2015 2016 2017E 2018E 2019E
Sales (YoY) (21.8) 0.6 21.3 (1.4) 8.3 16.5 11.1 14.2
EBITDA (YoY) (29.5) (7.3) 14.9 (17.1) (9.4) 21.0 11.4 18.3
Operating profit (YoY) (39.2) (14.6) 20.2 (33.2) (23.7) 39.9 19.0 22.5
Net profit (YoY) (47.4) 0.9 19.0 (31.7) (19.2) 32.9 26.1 23.1
Core EPS (fully-diluted) (YoY) (49.9) (2.0) 15.5 (33.7) (20.8) 32.9 26.1 23.1
Gross-profit margin 38.3 37.0 38.4 35.8 32.9 32.8 33.2 33.0
EBITDA margin 30.0 27.7 26.2 22.0 18.4 19.1 19.2 19.9
Operating-profit margin 22.4 19.0 18.9 12.8 9.0 10.8 11.6 12.4
Net profit margin 16.2 16.2 15.9 11.0 8.2 9.4 10.7 11.5
ROAE 20.9 19.1 19.9 12.4 9.6 12.6 14.7 16.4
ROAA 8.7 7.6 8.3 5.2 4.0 5.2 6.2 7.2
ROCE 15.6 11.0 12.2 7.4 5.4 7.5 8.5 9.9
ROIC 12.4 8.9 10.3 6.1 4.7 6.0 6.7 7.8
Net debt to equity 90.6 85.2 63.3 79.1 68.5 85.0 72.5 69.0
Effective tax rate 25.6 23.6 22.1 24.0 19.2 24.1 22.9 22.6
Accounts receivable (days) 123.2 138.7 127.5 136.8 114.2 102.2 109.3 106.9
Current ratio (x) 1.1 1.1 1.3 1.2 1.1 1.1 1.2 1.2
Net interest cover (x) 26.2 16.2 18.1 12.5 10.1 15.4 18.1 22.1
Net dividend payout 33.9 33.2 33.9 34.8 34.4 44.2 26.3 22.6
Free cash flow yield n.a. n.a. 3.3 n.a. 0.6 n.a. 0.8 1.3
Company profile
Established in 1989, Hiwin Technologies Corp is the second-biggest linear-motion component
vendor worldwide in terms of revenue, next only to THK in Japan. Its major products include ball
screws, linear guides, and industrial robots. The company’s customers come from a number of
industries, including the machine tool, semiconductor, smartphone, medical, flat panel display,
printed circuit board, automobile, and surface-mount technology equipment segments.
Page 47
47
Hiwin Technologies Corp (2049 TT): 16 May 2017
Solid core business
Improving market demand in China
Hiwin: one of the top-3 linear motion component players globally
Hiwin is a linear-motion-control-related mechanical component supplier, with major
products including linear guideways and ball screws together contributing over 80% of
revenue. Simply put, a ball screw is a mechanical device which translates rotational motion
into linear motion with little friction, while a linear guideway consists of a block and rail
mechanism which enables the smooth linear motion of applications.
As one of the major players worldwide, Hiwin mainly competes with Japanese suppliers
including THK (the No.1 supplier globally) and NSK. By leveraging its strength in
mechanical components, Hiwin began venturing into the industrial robotics business in
2011, although the revenue contribution remains limited. In terms of regions, Asia is the
largest revenue contributor (mainly China, on our estimates), followed by Europe and the
US.
Hiwin: ball screws Hiwin: linear guideways
Source: Company Source: Company
Hiwin: revenue breakdown by product Hiwin: revenue breakdown by region
Source: Company, Daiwa forecasts Source: Company, Daiwa forecasts
Hiwin’s revenue has been rising since mid-2016, when monthly revenue turned positive in
May 2016 following 10 consecutive months of YoY declines. Accordingly, both 4Q16 and
1Q17 revenue were up 44% YoY, much stronger than the 8% YoY growth recorded for
2016 revenue and the -1% YoY decline for 2015.
26% 22% 25% 27% 29%
59%61% 56% 49% 45%
6% 8% 9%11% 12%
8% 9% 9% 13% 13%
0%
20%
40%
60%
80%
100%
2015 2016 2017E 2018E 2019E
Ball screw Linear Gu ideway Industrial Robot Others
55% 56% 58% 59%
24% 24% 21% 22%
6% 6% 6% 6%
15% 15% 14% 13%
0%
20%
40%
60%
80%
100%
2013 2014 2015 2016
Asia Europe US Taiwan
Hiwin’s major products
include linear guideways
and ball screws,
together generating over
80% of its revenue
Page 48
48
Hiwin Technologies Corp (2049 TT): 16 May 2017
Hiwin: monthly revenue and YoY growth
Hiwin’s monthly revenue
growth turned positive
in mid-2016 on
improving demand
Source: Company
While Hiwin’s management attributed the revenue strength in recent months to improving
demand (including rush orders) from its industrial automation clients, smartphone, and
transportation related segments, we see evidence which also suggests an overall market
demand recovery, namely:
China’s PMI has been trending above 50 since August 2016 and has largely remained
on the rise, suggesting the overall manufacturing segment in China is expanding. Also,
China machine-tool production has been showing positive YoY growth since July 2016.
We consider these trends as favourable for Hiwin, as the company derives about half of
its revenue from China, on our forecasts.
Both Taiwan and Japan’s machine-tool exports to China have been improving from mid-
2016. Japan data shows a slower recovery than Taiwan, but its YoY growth has
accelerated substantially in 2017, rising by 171% YoY for March alone.
THK, Hiwin’s main competitor, began reporting YoY growth in its China orders from
2Q16.
China: PMI China: machine-tool production
Source: National Bureau of Statistics of China Source: CEIC
Taiwan: machine-tool exports to China Japan: machine-tool exports to China
Source: TMBA Source: JMTBA
(60%)
(40%)
(20%)
0%
20%
40%
60%
80%
100%
120%
0.0
0.2
0.4
0.6
0.8
1.0
1.2
1.4
1.6
1.8
Jan-11 Jul-11 Jan-12 Jul-12 Jan-13 Jul-13 Jan-14 Jul-14 Jan-15 Jul-15 Jan-16 Jul-16 Jan-17
Monthly Sales (LHS) YoY (RHS)
(TWDbn)
46
48
50
52
54
56
58
Jan-
10
Jul-1
0
Jan-
11
Jul-1
1
Jan-
12
Jul-1
2
Jan-
13
Jul-1
3
Jan-
14
Jul-1
4
Jan-
15
Jul-1
5
Jan-
16
Jul-1
6
Jan-
17
(40%)
(20%)
0%
20%
40%
60%
80%
40
50
60
70
80
90
100
110
120
130
140
Jan-
10
Ma
y-10
Sep
-10
Jan-
11
Ma
y-11
Sep
-11
Jan-
12
Ma
y-12
Sep
-12
Jan-
13
Ma
y-13
Sep
-13
Jan-
14
Ma
y-14
Sep
-14
Jan-
15
Ma
y-15
Sep
-15
Jan-
16
Ma
y-16
Sep
-16
Jan-
17
China Machine Tool Product ion (LHS) YoY (RHS)
(K units)
(70%)
(40%)
(10%)
20%
50%
80%
110%
40
60
80
100
120
140
160
180
Jan-
11
Jul-1
1
Jan-
12
Jul-1
2
Jan-
13
Jul-1
3
Jan-
14
Jul-1
4
Jan-
15
Jul-1
5
Jan-
16
Jul-1
6
Jan-
17
Taiwan Machine Tool Orders to China (LHS) YoY (RHS)
(USDm)
(80%)
(30%)
20%
70%
120%
170%
220%
5
10
15
20
25
30
35
40
Jan-
11
Jul-1
1
Jan-
12
Jul-1
2
Jan-
13
Jul-1
3
Jan-
14
Jul-1
4
Jan-
15
Jul-1
5
Jan-
16
Jul-1
6
Jan-
17
Japan Mach ine Tool Orders to China (LHS ) YoY (RHS)
(JPYbn)
Page 49
49
Hiwin Technologies Corp (2049 TT): 16 May 2017
THK: orders to China Hiwin: monthly revenue vs. China machine-tool production
Source: Company Source: Company, CEIC
All these data points indicate that the overall demand for machine tools in China has been
on the rise, which has supported the revenue growth of Hiwin in the recent quarters, and
we expect that to continue for the rest of 2017.
Core earnings growth on the right track
We expect the improving market demand to support favourable growth of Hiwin’s operating
earnings. Apart from better economies of scale and operating leverage, we believe there
are 3 main factors that affect Hiwin’s core earnings: product mix, cash cycle, and
competition.
Product mix
Among Hiwin’s major product lines, the gross margin on ball screws is higher, but also
sensitive to the scale of production, while that for linear guideways is lower but relatively
stable.
Ball screws – This product line typically offers a high gross margin (35-40%, on our
estimates) as most of the orders are highly customised for clients in the machine-tool
sector. However, the gross margin is subject to capacity utilisation and can be volatile at
times when order flows become unstable or weak. As such, this business can be a swing
factor for Hiwin’s gross margin.
Linear guideways – As the biggest revenue contributor for Hiwin, linear guideways’
order flows tend to be relatively stable, as its broad range of applications result in a
diverse customer base. The products here are mostly standardised, so the gross margin
is typically slightly below the company average level. That said, this also means the
capacity utilisation is easier to manage, so the margin volatility is lower, although
economies of scale will still affect the gross margin here, in our view.
Industrial robots – the revenue contribution from this product line remains small for now
but the future upside could be substantial, in our view. Due to in-house supplies of
several key components (eg, linear motion control components, motors, etc.), Hiwin is
confident about its product quality and price competitiveness. So far, the robot business
is still running at a loss, due to the ongoing development of new models (for different
applications, eg, medical) and lack of sufficient client base. Management expects the
loss to shrink over time as robot shipments continue to rise.
-60%
-40%
-20%
0%
20%
40%
60%
80%
0
100
200
300
400
500
600
2Q12 4Q12 2Q13 4Q13 2Q14 4Q14 2Q15 4Q15 2Q16
THK's Ch ina Orders (LHS) YoY (RHS)
(CNYm)
(50%)
0%
50%
100%
150%
200%
250%
Jan-
10
Jul-1
0
Jan-
11
Jul-1
1
Jan-
12
Jul-1
2
Jan-
13
Jul-1
3
Jan-
14
Jul-1
4
Jan-
15
Jul-1
5
Jan-
16
Jul-1
6
Jan-
17
Hiwin 's Monthly Revenue YoY Growth
China Machine Tool Product ion YoY Growth
Product mix, cash cycle
and competition are the
main factors that affect
Hiwin’s core earnings
Page 50
50
Hiwin Technologies Corp (2049 TT): 16 May 2017
Hiwin: revenue YoY growth vs. operating margin Hiwin: revenue YoY growth vs. cash conversion cycle
Source: Company
Source: Company
Cash-conversion cycle
Hiwin has a relatively long cash-conversion cycle, which ranged between 142 and 289
days during 2013-16. Its cash-conversion cycle is long due partially to the company’s high
inventories of standardised linear guideways, which are standardised products, and hence
carry little obsolete risk, so Hiwin’s production scale typically remains constant to avoid
volatility in utilisation. As such, if the revenue growth for linear guideways turns stronger, it
would bring down inventory levels resulting in a shorter cash-conversion cycle, which
would help reduce the company’s short-term financing costs and be positive for
profitability.
Competition dynamics
THK is Hiwin’s major competitor, particularly in China. Both companies tend to show similar
trends in terms of revenue growth and operating margins. Their pricing strategies in China
can be similar at times, which sometimes leads to intense price competition. In fact, as
shown in the charts below, both Hiwin and THK China suffered weaker sales momentum in
2H15, and both companies turned aggressive in pricing, which accelerated the operating
margin contraction during the same period. That said, the situation appears to have
improved from early 2016 and both companies have started posting improved revenue and
operating margins. With favourable market demand currently, as indicated earlier, we do
not expect any particular pricing pressure in the next 1-2 quarters at least.
Revenue YoY growth: Hiwin vs. THK China Operating margins: Hiwin vs. THK China
Source: Company Source: Company
Losses from the solar subsidiary: a lingering concern
Eterbright: a drag on earnings
While we are positive on Hiwin’s core earnings and revenue growth over our forecast
period, we consider Eterbright, Hiwin’s 65%-owned subsidiary and one of the consolidated
entities of Hiwin, a drag on the company’s earnings.
-10%
0%
10%
20%
30%
40%
(60%)
(30%)
0%
30%
60%
90%
120%
150%
1Q09
3Q09
1Q10
3Q10
1Q11
3Q11
1Q12
3Q12
1Q13
3Q13
1Q14
3Q14
1Q15
3Q15
1Q16
3Q16
1Q17
Revenue YoY growth (LHS) Operating margin (RHS)
0
50
100
150
200
250
300
350
-60%
-30%
0%
30%
60%
90%
120%
150%
1Q09
3Q09
1Q10
3Q10
1Q11
3Q11
1Q12
3Q12
1Q13
3Q13
1Q14
3Q14
1Q15
3Q15
1Q16
3Q16
1Q17
Revenue YoY growth (LHS) Cash conversion cycle
(Day)
(40%)
(20%)
0%
20%
40%
60%
80%
100%
1Q13
2Q13
3Q13
4Q13
1Q14
2Q14
3Q14
4Q14
1Q15
2Q15
3Q15
4Q15
1Q16
2Q16
3Q16
4Q16
Hiwin THK in China
(30%)
(20%)
(10%)
0%
10%
20%
30%
1Q12
2Q12
3Q12
4Q12
1Q13
2Q13
3Q13
4Q13
1Q14
2Q14
3Q14
4Q14
1Q15
2Q15
3Q15
4Q15
1Q16
2Q16
3Q16
4Q16
Hiwin THK in China
Hiwin’s inventories of
linear guideways can be
high from time to time
Price competition
between Hiwin and THK
in China has become
much less intense since
2016
Page 51
51
Hiwin Technologies Corp (2049 TT): 16 May 2017
Eterbright manufactures copper-indium-gallium-selenide (CIGS) thin-film PV modules,
which are mainly used in roof-type solar energy systems and large-scale power plants.
Hiwin believes Eterbright’s CIGS thin film products are better than the mainstream
polysilicon-based solar panels, as the former are easier to mass produce, flexible in form
factor, and have stronger capability of sunlight absorption.
However, thin film’s penetration remains much lower than that of the polysilicon solar
panels, as the former’s energy conversion efficiency is lower while pricing is higher. Hiwin’s
management appears to have confidence in Eterbright’s CIGS technologies, evidenced by
its increased stake in Eterbright, from 50% in late 2015, to 58% in 2Q16, and further to
65% in 1Q17 (see chart below). However, Hiwin expects more R&D inputs to be required
as Eterbright’s products are still in the development stage. As such, management believes
Eterbright’s opex will remain high and may not turn profitable for a further 2-3 years.
In fact, Eterbright’s losses have had an increasingly negative impact on Hiwin’s bottom line
in recent years, along with Hiwin’s increasing stake in the subsidiary (see chart below).
Without the Eterbright loss, we calculate that Hiwin’s earnings in 2015 and 2016 would
have been higher by 12% and 22%, respectively. As such, while Hiwin’s core business
looks solid, losses at Eterbright will likely remain a lingering drag on the company’s
earnings, and we expect this impact to have a 15-20% negative impact on Hiwin’s net
profit for 2017-18E.
Hiwin: holdings in Eterbright Hiwin: earnings vs. contribution of Eterbright’s loss
Source: Company
Source: Company
40%
45%
50%
55%
60%
65%
70%
1Q13
2Q13
3Q13
4Q13
1Q14
2Q14
3Q14
4Q14
1Q15
2Q15
3Q15
4Q15
1Q16
2Q16
3Q16
4Q16
1Q17
(200)
0
200
400
600
800
1,000
1Q13
2Q13
3Q13
4Q13
1Q14
2Q14
3Q14
4Q14
1Q15
2Q15
3Q15
4Q15
1Q16
2Q16
3Q16
4Q16
1Q17
Hiwin 's ne t profit Loss from Eterbright
(TWDm)
Without Eterbright,
Hiwin’s earnings in 2015
and 2016 would have
been higher by 12% and
22%, respectively
Page 52
52
Hiwin Technologies Corp (2049 TT): 16 May 2017
Financials and valuation
Financial update
Near-term outlook
Hiwin’s 1Q17 EPS came in at TWD1.04, down 38% QoQ but up 95% YoY. The substantial
QoQ decline was mainly a result of the FX loss (TWD189m, on CNY appreciation vs. the
USD), as its operating profit in 1Q17 actually grew by 33% QoQ on a better product mix
(ie, more contribution from higher-margined ball screws) and lower opex. The loss posted
by Eterbright was also lower QoQ in 1Q17 due mainly to seasonal weakness in revenue,
as the company’s profit margins remain negative.
2017 outlook
After the solid 1Q17 results, management remains positive on the business outlook and
expects the capacity tightness to drag into 3Q17 at least, given that the new capacities will
not become operational until late 2017. According to management, market demand is
positive and Hiwin still cannot fulfil all its client orders on time. In terms of segments, the
demand from machine-tool clients has been strong since late-2016, but Hiwin expects
demand to soften in 2H17 due to the high base a year earlier. That said, the demand from
other segments, such as automation/robot, semiconductor, and LCD, still remains vibrant.
After Hiwin saw 2 consecutive years of earnings declines (ie, -32% YoY in 2015 and -19%
YoY in 2016), we forecast its 2017E earnings to rise by 33% YoY on stronger revenue
momentum and improving operating leverage. While we remain concerned about the
losses at Eterbright, Hiwin’s core earnings strength should be able to offset the impact, on
our estimates.
Hiwin: Daiwa’s revenue and earnings forecasts vs. consensus
(Consolidated) 2017E 2018E 2019E
(TWDm) Daiwa forecast Consensus Daiwa forecast Consensus Daiwa forecast Consensus
Revenue 18,782 19,001 20,865 21,520 23,820 25,165
Diff (%) -1.2% -3.0% -5.3%
Gross Margin (%) 32.8% 34.0% 33.2% 34.7% 33.0% 34.8%
Operating profit 2,030 2,216 2,416 2,699 2,959 3,372
Op Margin (%) 10.8% 11.7% 11.6% 12.5% 12.4% 13.4%
Net profit 1,764 1,928 2,224 2,414 2,737 3,002
EPS (TWD) 6.42 7.02 8.10 8.79 9.96 10.93
Diff (%) -8.5% -7.9% -8.8%
Source: Bloomberg, Daiwa forecasts
Management expects the
capacity tightness to last
into 3Q17
Page 53
53
Hiwin Technologies Corp (2049 TT): 16 May 2017
Hiwin: quarterly and annual P&L highlights
2016 2017E
(TWDm) 1Q 2Q 3Q 4Q 1Q 2QE 3QE 4QE 2016 2017E 2018E
Net revenue 2,984 4,352 4,219 4,563 4,300 4,816 4,866 4,800
16,118 18,782 20,865
COGS (1,970) (2,864) (2,845) (3,137) (2,912) (3,206) (3,267) (3,245)
(10,816) (12,630) (13,943)
Gross profit 1,015 1,488 1,373 1,426 1,388 1,610 1,598 1,555 5,302 6,152 6,922
Operating expenses (866) (955) (946) (1,085) (936) (1,040) (1,056) (1,090) (3,851) (4,121) (4,506)
Operating profit 149 533 428 341 452 570 543 466
1,451 2,030 2,416
Non-operating profit (46) (90) (130) 5 (177) (17) (26) 9
(261) (211) (13)
Pre-tax profit 104 443 298 346 276 553 516 475 1,190 1,820 2,404
Income taxes (32) (125) (64) (7) (77) (144) (114) (104) (229) (439) (551)
Net profit 144 397 325 462 286 504 502 472
1,327 1,764 2,224
Net EPS (TWD) 0.53 1.47 1.18 1.68 1.04 1.84 1.83 1.72
4.83 6.42 8.10
Operating Ratios
Gross margin 34.0% 34.2% 32.6% 31.2% 32.3% 33.4% 32.9% 32.4%
32.9% 32.8% 33.2%
Operating margin 5.0% 12.2% 10.1% 7.5% 10.5% 11.8% 11.2% 9.7%
9.0% 10.8% 11.6%
Pre-tax margin 3.5% 10.2% 7.1% 7.6% 6.4% 11.5% 10.6% 9.9%
7.4% 9.7% 11.5%
Net margin 4.8% 9.1% 7.7% 10.1% 6.6% 10.5% 10.3% 9.8%
8.2% 9.4% 10.7%
YoY (%)
Net revenue -18% 1% 12% 44% 44% 11% 15% 5%
8% 17% 11%
Gross profit -29% -4% 8% 31% 37% 8% 16% 9%
-1% 16% 13%
Operating profit -78% -19% 7% 116% 203% 7% 27% 37%
-24% 40% 19%
Pre-tax profit -81% -22% -54% 462% 166% 25% 74% 37%
-35% 53% 32%
Net profit -72% -7% -46% 350% 99% 27% 55% 2%
-19% 33% 26%
QoQ (%)
Net revenue -6% 46% -3% 8% -6% 12% 1% -1%
Gross profit -7% 47% -8% 4% -3% 16% -1% -3%
Operating profit -5% 257% -20% -20% 33% 26% -5% -14%
Pre-tax profit 69% 327% -33% 16% -20% 101% -7% -8%
Net profit 40% 176% -18% 42% -38% 76% 0% -6%
Source: Company, Daiwa forecasts
Valuation and recommendation
Initiating coverage with a Hold (3) rating
We initiate coverage of Hiwin with a Hold (3) rating and 12-month target price of TWD205,
based on a target PER of 30x (near the mid-point of the stock’s past-3-year PER range of
17-48x), applied to our 1-year-forward EPS forecast.
Looking at the share price over past 6 years, the stock appears to have been derated in
recent years: in terms of forward PBR, it consistently traded above a 3.5x PBR before
2015, but has not traded above that level since mid-2015. In terms of forward PER, its
trading range in 2014-15 was typically above 30x, but mostly below 30x after 2015. While
this derating could partially be due to Hiwin’s earnings volatility in recent years, we also
consider Eterbright a culprit given it has been a constant drag on earnings.
On the back of the substantial YoY growth of revenue/earnings in both 4Q16 and 1Q17,
the stock has rallied over the past few months, and is trading currently at a 33x 2017E
PER, which is its past-2-year valuation peak. However, we believe the current valuation
level already reflects its improving earnings strength.
We initiate coverage of
Hiwin with a Hold (3)
rating, as we consider its
earnings strength to be
priced in
Page 54
54
Hiwin Technologies Corp (2049 TT): 16 May 2017
Hiwin: 1-year-forward PER bands Hiwin: 1-year-forward PBR bands
Source: TEJ, Daiwa forecasts Source: TEJ, Daiwa forecasts
Key risks
The major upside risk to our Hold (3) call on Hiwin is a stronger-than-expected
improvement in Eterbright’s profitability. On our estimates, we expect Eterbright to drag
down Hiwin’s earnings by 15-20% over 2017-18E. As such, any marked improvement in
Eterbright’s operating performance would have a meaningful impact on Hiwin’s earnings.
Meanwhile, we see weaker-than-expected automation demand in China as the major
downside risk. If this were to happen, Hiwin’s revenue growth would likely turn out to be
slower than we expect as we look for the China market to account for about half of the
company’s revenue.
100
150
200
250
300
350
400
May-11 May-12 May-13 May-14 May-15 May-16 May-17
Share price 20x 30x 36x 48x
(TWD)
100
150
200
250
300
350
400
May-11 May-12 May-13 May-14 May-15 May-16 May-17
Share price 2x 3.5x 5x 7x
(TWD)
Page 55
See important disclosures, including any required research certifications, beginning on page 65
Taiwan Information Technology
Background: Established in 1998, Chieftek is mainly in the business of
miniature linear guides (ie, below 15mm in size; 65% of 2016 sales) and
also supplies standard linear guides (ie, above 15mm; 33%) and linear
motors (3%). Chieftek believes it is ranked No.3 globally in miniature linear
guides, next only to THK and NSK. China and Taiwan are its main markets,
contributing 27% and 23%, respectively, of the company’s revenue in 2016.
Highlights: Miniature linear guides: the main earnings driver. The main
applications for Chieftek’s miniature linear guides include precision
measurement and inspection, semiconductor industry, electronic assembly
and other related electronic industries. Compared to THK and NSK,
Chieftek’s ASP is about 20-30% lower. With rising orders from the
equipment suppliers to the major Chinese smartphone brands (eg, Huawei,
OPPO and Vivo), Chieftek expects its capacities to remain tight in 1H17.
Along with higher capacity utilisation YTD (about 70%, vs. 50% last year),
management expects the gross margin on miniature linear guides to rise
this year (from 43% in 2016), which would bode well for Chieftek’s blended
gross margin.
Standard linear guides and linear motors: solid gross margins. The
main application for Chieftek’s standard linear guides and linear motors is
for machine tools. For standard linear guides, competitors include Hiwin
(2049 TT, TWD209, Hold [3]) and TBI Motion (4540 TT, not rated). Being a
smaller player, Chieftek is unable to price as flexibly as Hiwin, so this is not
a specific focus for Chieftek. However, as the company has seen a
substantial inventory digestion over the past few years, with inventory days
declining from the peak of 240 days in 2012 to 134 days in 2016, the gross
margin on standard linear guides improved to 22% in 2016 (vs. 12% in
2015). With the inventory level being healthy, management targets to
maintain its gross margin in 2017. As for linear motors, this is a highly
customised business, and the gross margin can reach 48% (in 2016), much
higher than the corporate average. Even though the revenue contribution
may be limited, Chieftek still expects the revenue for this business to reach
at least TWD80m in 2017 (vs. TWD25m in 2016).
2017 guidance. Chieftek targets 2017 revenue to rise by 20% YoY, while
1Q17 revenue increased by 18% YoY. This is better than the 4% decline in
2016. With better utilisation and revenue scale, management is positive on
the profit margin outlook for 2017.
Valuation: The stock is trading at 18x 2017E PER, based on Bloomberg
consensus. In the past 3 years, its historical PER and PBR ranges have
been 19-122x and 0.9-2.2x. There is no Bloomberg consensus for 2018E.
16 May 2017
Chieftek Pr ecisi on
Devoted to miniature linear guides
The third-largest supplier of miniature linear guides globally
Management aims for 20% sales growth in 2017 (vs -4% in 2016)
Profit margins also likely to rise on better utilisation and scale benefits
Source: FactSet, Daiwa forecasts
Chieftek Precision (1597 TT )
Target price: n.a.
Share price (15 May): TWD38.40 | Up/downside: -
Steven Tseng(886) 2 8758 6252
[email protected]
Elsa Cheng(886) 2 8758 6253
[email protected]
90
104
118
131
145
24
28
32
35
39
May-16 Aug-16 Nov-16 Feb-17 May-17
Share price performance
Chieftek (LHS) Relative to TWOTCI (RHS)
(TWD) (%)
12-month range 24.86-39.00
Market cap (USDbn) 0.08
3m avg daily turnover (USDm) 0.70
Page 56
56
Chieftek Precision (1597 TT ): 16 May 2017
Chieftek: quarterly and annual P&L statement
2015 2016 2017
(TWDm) 2Q 3Q 4Q 1Q 2Q 3Q 4Q 1Q 2014 2015 2016
Net revenue 276 249 256 217 267 240 258 256 1,017 1,022 983
Gross profit 86 75 84 74 98 88 94 95
241 306 355
Operating profit 34 24 28 21 43 35 26 39
39 96 124
Non-operating profit -8 30 -5 3 -6 -20 4 -14
-7 -15 -19
Pre-tax profit 26 54 23 24 37 15 30 15
32 81 105
Tax / minority int. -1 -10 -2 -4 -4 -4 -8 -3
-11 -11 -20
Net profit 25 44 21 20 33 11 22 12
21 71 86
Net EPS (TWD) 0.40 0.71 0.33 0.32 0.53 0.17 0.36 0.20
0.33 1.14 1.38
Operating Ratios
Gross margin 31.0% 30.0% 32.8% 34.0% 36.7% 36.7% 36.7% 37.0%
23.7% 30.0% 36.1%
Operating margin 12.2% 9.5% 11.1% 9.5% 15.9% 14.6% 10.1% 15.2%
3.9% 9.4% 12.7%
Pre-tax margin 9.4% 21.7% 9.0% 10.9% 13.7% 6.1% 11.8% 5.8%
3.1% 8.0% 10.7%
Net margin 9.0% 17.7% 8.1% 9.1% 12.2% 4.4% 8.7% 4.7%
2.0% 6.9% 8.7%
YoY (%)
Net revenue 0% -9% 7% -10% -3% -3% 1% 18%
8% 0% -4%
Gross profit 5% 2% 69% 18% 15% 18% 13% 28%
-1% 27% 16%
Operating profit -13% 15% n.m. 96% 27% 48% -8% 88%
-17% 146% 29%
Pre-tax profit 42% 307% 357% n.m. 40% -73% 32% -38%
-60% 156% 29%
Net profit 96% 389% 686% n.m. 32% -76% 8% -39%
-65% 241% 21%
QoQ (%)
Net revenue 14% -10% 3% -15% 23% -10% 7% -1%
Gross profit 37% -13% 12% -12% 33% -10% 7% 0%
Operating profit 218% -30% 20% -27% 106% -18% -26% 50%
Pre-tax profit n.m. 107% -57% 3% 54% -60% 107% -51%
Net profit n.m. 77% -53% -4% 65% -68% 111% -46%
Source: Company
Chieftek: historical PER trading range Chieftek: historical PBR trading range
Source: TEJ, Bloomberg Source: TEJ
Chieftek: main product Chieftek: revenue breakdown by region
Source: Company Source: Company
20
30
40
50
60
70
80
90
100
May12 Nov12 May13 Nov13 May14 Nov14 May15 Nov15 May16 Nov16 May17
(TWD)
Share price 19x 25x 28x 122x
20
40
60
80
100
May12 Nov12 May13 Nov13 May14 Nov14 May15 Nov15 May16 Nov16 May17
(TWD)
Share price 1x 1.3x 1.7x 3.4x
59% 54% 49% 44% 48%
20%19%
23%19%
23%
14%17% 16%
24%16%
6% 9% 12% 13% 13%
0%
20%
40%
60%
80%
100%
2012 2013 2014 2015 2016
Asia Taiwan Europe US
Page 57
See important disclosures, including any required research certifications, beginning on page 65
Taiwan Industrials
Background: Established in 1989, Mirle started out as a spinoff from the
Industrial Technology Research Institute in Taiwan (ITRI, a government-
backed institution specialising in R&D of industrial-related technologies).
The company focused on logistics/warehousing related automation facilities
before expanding into the distribution of enterprise IT and robot products,
as well as the related system integration (SI) business.
Highlights: Growth drivers: automation, robots. Mirle sees automation
systems (rising capex in the flat panel sector) and robot application
systems (rising demand in China) as key revenue-growth drivers in 2017.
Automation systems (47% of 2016 sales; 40% for flat panel sector) –
Mirle supplies transporters and automated material handling systems
(AMHS) for the flat panel sector, which has been this business’ major
client since 2015. Given active capex plans related to LCD panels and
touch panels in Taiwan and China, Mirle expects the demand to be
sustained in 2017-18, with the sales contribution likely to exceed 40% in
2017. The gross margin in this segment ranges from 18% to 36%,
subject to the designs and locations (eg, in China it tends to be lower).
Robot application systems (8%) – Mirle is the sole agent for Yaskawa’s
robot arms in Greater China area, and acts as SI to offer automation-
related total solutions. Its clients are mainly involved in the flat panel,
auto parts, and other manufacturing sectors in China. Although sales
were weaker YoY in 2016, Mirle expects its robotic revenue to return to
growth in 2017 in light of the improving economy in China and Yaskawa’s
target to boost its industry robot shipments by 20% YoY this year. As the
gross margin here is 20%-plus, growth should support margin expansion.
IT products/services (35%) – Mirle acts as a sales agent and SI for IBM’s
enterprise IT products (also logistics/warehouse related). TSMC is the
biggest client and Mirle sees the relationship as secure. Though revenue is
stable, gross margin is in the single digits due to competition.
Industrial controllers (8%) – The applications here are mainly for water
treatment and injection-moulding-related facilities. The gross margin is
nearly 30%, as all the controllers are custom-made and carry Mirle’s own
brand. However, demand has been weak in the past 2 years and it
remains unclear to Mirle if demand will recover in 2017.
2017 outlook. 1Q17 revenue was up by 14% YoY but Mirle saw a TWD47m
net loss due to forex impact. It is confident of seeing revenue growth in 2017
as orders on hand exceed TWD8bn (to be delivered in 6-18 months).
Valuation: The stock is trading at 12x 2017E PER (no Bloomberg forecasts
for 2018E). Its past-3-year PER range is 8-18x.
16 May 2017
Mirle Automati on
Automation system integrator
Specialises in logistics/transportation-related automation solutions
Positive on capex in flat panel sector and robot demand in China
Orders on hand look promising; forex volatility has impact on earnings
Source: FactSet, Daiwa forecasts
Mirle Automation (2464 TT)
Target price: n.a.
Share price (15 May): TWD38.00 | Up/downside: -
Steven Tseng(886) 2 8758 6252
[email protected]
Elsa Cheng(886) 2 8758 6253
[email protected]
90
103
115
128
140
30
36
43
49
55
May-16 Aug-16 Nov-16 Feb-17 May-17
Share price performance
Mirle Auto (LHS)Relative to TWSE Index (RHS)
(TWD) (%)
12-month range 32.40-50.80
Market cap (USDbn) 0.24
3m avg daily turnover (USDm) 4.74
Page 58
58
Mirle Automation (2464 TT): 16 May 2017
Mirle: quarterly and annual P&L statement
2015 2016 2017
(TWDm) 1Q 2Q 3Q 4Q 1Q 2Q 3Q 4Q 1Q 2014 2015 2016
Net revenue 1,769 1,907 2,111 2,532 2,238 2,192 2,024 2,412 2,558 6,864 8,319 8,866
Gross profit 330 361 408 448 393 371 342 383 388
1,214 1,547 1,490
Operating profit 133 144 180 185 169 113 142 113 123
385 642 537
Non-operating profit 2 (5) 24 8 (29) 14 (38) 58 (169)
61 29 5
Pre-tax profit 136 139 204 192 140 127 104 171 (47)
446 671 542
Tax / minority int. (21) (20) (26) (33) (29) 6 (24) (6) (0)
(65) (100) (53)
Net profit 115 119 178 159 112 133 80 164 (47)
381 571 489
Net EPS (TWD) 0.60 0.62 0.93 0.83 0.58 0.69 0.42 0.86 -0.25
1.99 2.98 2.55
Operating Ratios
Gross margin 18.6% 19.0% 19.3% 17.7% 17.6% 16.9% 16.9% 15.9% 15.2%
17.7% 18.6% 16.8%
Operating margin 7.5% 7.5% 8.5% 7.3% 7.5% 5.2% 7.0% 4.7% 4.8%
5.6% 7.7% 6.1%
Pre-tax margin 7.7% 7.3% 9.7% 7.6% 6.3% 5.8% 5.1% 7.1% -1.8%
6.5% 8.1% 6.1%
Net margin 6.5% 6.2% 8.4% 6.3% 5.0% 6.1% 4.0% 6.8% -1.8%
5.6% 6.9% 5.5%
YoY (%)
Net revenue 16% 9% 21% 38% 26% 15% -4% -5% 14%
4% 21% 7%
Gross profit 37% 17% 21% 37% 19% 3% -16% -14% -1%
13% 27% -4%
Operating profit 57% 20% 64% 161% 27% -21% -21% -39% -27%
8% 67% -16%
Pre-tax profit 40% 23% 58% 79% 3% -8% -49% -11% n.m.
14% 50% -19%
Net profit 37% 33% 59% 66% -3% 12% -55% 4% n.m.
10% 50% -14%
QoQ (%)
Net revenue -3% 8% 11% 20% -12% -2% -8% 19% 6%
Gross profit 1% 10% 13% 10% -12% -6% -8% 12% 1%
Operating profit 89% 8% 26% 2% -8% -33% 26% -21% 9%
Pre-tax profit 26% 2% 47% -6% -27% -9% -18% 64% n.m.
Net profit 20% 3% 50% -11% -30% 19% -40% 105% n.m.
Source: Company
Mirle: historical PER Mirle: revenue breakdown by region
Source: TEJ Source: TEJ
Mirle: main product lines
Source: Company
10
20
30
40
50
60
May11 May12 May13 May14 May15 May16 May17
(TWD)
Share price 8x 13x 16x 18x
78%72%
60% 65%
22%28%
40% 35%
0%
20%
40%
60%
80%
100%
2012 2013 2014 2015
Taiwan China
FPD transportaion system Robot application Controller
Page 59
See important disclosures, including any required research certifications, beginning on page 65
Taiwan Information Technology
Background: Founded in 1999, Quanta Storage Inc (QSI) is a subsidiary
of Quanta Computer (2382 TT, TWD64.8, Hold [3]) and started as a maker
of optical drives. As demand dwindled, QSI shifted to storage products (eg,
SSD, NAS and DAS), which generated over 90% of its 2016 revenue. Also,
it started to develop industrial robots under the brand “TechMan”, with the
first model, “TM5”, launched in 2016 after 5 years of in-house R&D efforts.
Highlights: Robots – real potential ahead. QSI identifies robots as a key
focus because: 1) its capability in integrating optical, mechanical and
electronic technologies for optical drives can also be applied to robot
design, 2) 2 management team members (including the CEO and robot
business-unit head) have strong academic backgrounds in robotics
technology. As a latecomer, QSI focuses on collaborative robots (cobots), a
relatively new segment of the robot market.
A cobot is a robot designed to assist/interact with human workers in a
shared workspace. Cobots are easier to set up/adjust and much less
expensive than typical industrial robots (can be only 1/3 or 1/4 of all-in-
costs), as they are highly integrated robots that don’t need the involvement
of system integrators. The global cobot market, per ABI Research, will grow
from USD95m in 2015 to USD1.0bn in 2020 (a 60% CAGR).
Cobots offer opportunities for smaller robot players, like Universal Robots
and Rethink Robotics, to compete with global behemoths like ABB, Fanuc,
Kuka and Yaskawa. QSI is the first and only cobot vendor based in Greater
China. Currently its clients are all Taiwanese, but it sees good potential in
China. QSI’s cobots (2 models: TM5-700 and TM5-900) are 6-axis cobots
with payloads of 4-6kg, which are suited to tasks like electronic assembly
and material handling. QSI has been allying with distributors (E-Con and
Panasonic) and peripheral suppliers (eg, grippers, automated guided
vehicles) to come up with ready-to-use solutions to promote its cobots.
Storage – still the bread and butter. Storage became QSI’s core
business after it shut down its optical-drive business in 1Q16. Its SSD and
NAS products target the commercial market and also data centre clients,
on both an ODM (mostly) and own-brand basis. QSI expects this business
to be stable and looks for single-digit YoY revenue growth for 2017.
2017 outlook. Management targets 2017 sales to rise modestly, following
4% YoY growth in 1Q17. It believes the cobot business can grow strongly
off a low base. QSI expects profit margins in 2017 to be stable, but sees
upside should its cobot business expand more strongly than expected.
Valuation: Over the past 3 years, the stock has traded at historical PER
and PBR ranges of 7-25x and 0.5-1.4x. There is no Bloomberg consensus.
16 May 2017
Quanta Stor age
A self-study developer of collaborative robots
The first and only vendor of cobots based in the Greater China area
Storage products the bread and butter; targets modest top-line growth
Management sees cobot business providing earnings upside in 2017
Source: FactSet, Daiwa forecasts
Quanta Storage (6188 TT)
Target price: n.a.
Share price (15 May): TWD44.10 | Up/downside: -
Steven Tseng(886) 2 8758 6252
[email protected]
Elsa Cheng(886) 2 8758 6253
[email protected]
90
113
135
158
180
15
22
30
37
45
May-16 Aug-16 Nov-16 Feb-17 May-17
Share price performance
Quanta St (LHS)Relative to TWSE Index (RHS)
(TWD) (%)
12-month range 20.00-44.10
Market cap (USDbn) 0.41
3m avg daily turnover (USDm) 8.88
Page 60
60
Quanta Storage (6188 TT): 16 May 2017
Quanta Storage: quarterly and annual P&L statement
2015 2016 2017
(TWDm) 2Q 3Q 4Q 1Q 2Q 3Q 4Q 1Q 2014 2015 2016
Net revenue 2,567 2,638 2,557 1,846 1,802 1,837 2,139 1,914 15,770 10,655 7,623
Gross profit 377 334 377 365 426 405 470 443
1,997 1,446 1,666
Operating profit 72 37 178 72 193 151 226 203
567 342 642
Non-operating profit 100 78 (62) 46 (47) (52) 46 (108)
830 206 (6)
Pre-tax profit 172 115 117 118 147 100 272 96
1397 548 636
Tax / minority int. (58) (19) (15) (24) (32) (22) (80) (25)
(324) (145) (158)
Net profit 114 95 102 93 115 77 192 71
1,072 403 477
Net EPS (TWD) 0.41 0.34 0.37 0.33 0.41 0.28 0.69 0.25
3.85 1.45 1.72
Operating Ratios
Gross margin 14.7% 12.7% 14.8% 19.8% 23.6% 22.0% 22.0% 23.2%
12.7% 13.6% 21.8%
Operating margin 2.8% 1.4% 7.0% 3.9% 10.7% 8.2% 10.5% 10.6%
3.6% 3.2% 8.4%
Pre-tax margin 6.7% 4.3% 4.6% 6.4% 8.1% 5.4% 12.7% 5.0%
8.9% 5.1% 8.3%
Net margin 4.5% 3.6% 4.0% 5.1% 6.4% 4.2% 9.0% 3.7%
6.8% 3.8% 6.3%
YoY (%)
Net revenue -37% -33% -29% -36% -30% -30% -16% 4%
3% -32% -28%
Gross profit -27% -32% -17% 2% 13% 21% 25% 22%
40% -28% 15%
Operating profit -61% -75% 364% 28% 170% 314% 27% 184%
148% -40% 87%
Pre-tax profit -51% -71% -61% -19% -15% -13% 133% -18%
12% -61% 16%
Net profit -59% -68% -52% 2% 0% -19% 89% -24%
11% -62% 19%
QoQ (%)
Net revenue -11% 3% -3% -28% -2% 2% 16% -11%
Gross profit 5% -11% 13% -3% 17% -5% 16% -6%
Operating profit 28% -49% 387% -60% 170% -22% 49% -10%
Pre-tax profit 19% -33% 2% 1% 25% -32% 173% -65%
Net profit 25% -16% 7% -8% 23% -32% 149% -63%
Source: Company
Quanta Storage: historical PER Quanta Storage: historical PBR
Source: TEJ Source: TEJ
Quanta Storage: main product lines Global cobot market size in 2015-20E
Source: Company Source: ABI Research Notes: SSD – solid state drive; NAS – network access storage, DAS – direct attached storage
10
20
30
40
50
May11 May12 May13 May14 May15 May16 May17
(TWD)
Share price 7x 13x 21x 25x
10
20
30
40
50
May11 May12 May13 May14 May15 May16 May17
(TWD)
Share price 0.5x 1x 1.2x 1.4x
Storage Robot
0
200
400
600
800
1,000
1,200
2015 2016E 2017E 2018E 2019E 2020E
2015-20E CAGR: 60%
(USDm)
Page 61
See important disclosures, including any required research certifications, beginning on page 65
Taiwan Industrials
Background: Established in 1956, TECO started as a supplier of motors
(44% of 2016 sales) and then diversified into other businesses including
home appliances (17%), system automation (10%), telecom (8%; via 64%-
owned Tecom), etc. TECO believes it is ranked No.3 globally in large
motors (ie, motors over 300hp) and No.5 in small motors (ie, below 300hp).
Highlights: Motors: key earnings contributor. Motors enjoy a higher
gross margin (34-35% in 2016) than TECO’s other business lines and
contributed 80% of operating profit in 2016. This business consists of 3
segments: 1) Large motors – main applications include power generation,
oil & gas, and mining. The gross margin is high (40-50%) as most of large
motors are custom-made. Despite a 10%+ sales decline in 2016, TECO
aims for low-teen growth in 2017, in light of the oil-price recovery. 2) Small
motors – the gross margin is lower (c.25%) as half of small motors are
standardised items. TECO targets 10% sales growth, on industrial/
household demand in China/Taiwan as well as a low base in the US. 3)
Motovario (based in ltaly and acquired by TECO in 2015) – Motovario
derives 70-80% of revenue from Europe, with major products including
gear reducers and motors (gross margin of 35-36%). TECO expects high-
single digit growth for this business as it helps Motovario move into Asia.
Home appliances and system automation: also look positive. Home
appliance products include commercial A/C, household A/C, and others
(eg, refrigerators, washing machines, TVs). The blended gross margin was
c.24% in 2016, with 25-28% for commercial A/Cs and 30%+ for household
A/Cs. TECO believes the new Cooling Seasonal Performance Factor
(CSPF) standard for air-conditioners in Taiwan, effective in 2017, will lead
to replacement demand for household A/Cs in the next 2-3 years and aid
margin expansion. As for system automation, the gross margin was 23-
24% in 2016, with 80% of the sales coming from inverters and servos, in
which TECO offers own-branded products and is also the sales agent for
Yaskawa in Taiwan. TECO expects its own-brand inverters and servos, with
a higher gross margin of 30-35%, to be the main growth drivers in 2017,
which should also help the margins for the automation business.
2017 outlook. While 1Q17 revenue (TWD11.9bn) rose by only 2% YoY,
TECO targets high-single-digit YoY sales growth for 2017, driven by motors
(over 10%), home appliances (5-10% YoY) and system automation (10%+).
As all these drivers offer above-average gross margins, TECO expects
over 10% YoY earnings growth in 2017 on margin expansion.
Valuation: The stock is trading at 14-16x PERs for 2017-18E (Bloomberg
forecasts). Its past-3-year trading range was 13-22x.
16 May 2017
Teco El ectric and Machi ner y
A motor expert
TECO is one of top-5 motor vendors globally
Motors, with their higher margins, are the key earnings contributor
Management sees margin expansion on favourable product mix shift
Source: FactSet, Daiwa forecasts
Teco Electric and Machinery (1504 TT)
Target price: n.a.
Share price (15 May): TWD30.10 | Up/downside: -
Steven Tseng(886) 2 8758 6252
[email protected]
Elsa Cheng(886) 2 8758 6253
[email protected]
96
101
106
110
115
24
26
28
30
32
May-16 Aug-16 Nov-16 Feb-17
Share price performance
Teco Elect (LHS)Relative to TWOTCI (RHS)
(TWD) (%)
12-month range 24.40-31.70
Market cap (USDbn) 2.00
3m avg daily turnover (USDm) 3.53
Page 62
62
Teco Electric and Machinery (1504 TT): 16 May 2017
Teco: quarterly and annual P&L statement
2015 2016 2017
(TWDm) 2Q 3Q 4Q 1Q 2Q 3Q 4Q 1Q 2014 2015 2016
Net revenue 12,160 12,248 12,475 11,678 12,814 12,004 13,428 11,916 53,748 48,599 49,924
Gross profit 3,069 3,089 3,186 3,171 3,454 3,106 3,404 2,993
13,392 12,396 13,136
Operating profit 903 962 936 1,033 1,186 870 1,100 899
4,423 3,788 4,189
Non-operating profit 378 413 (137) 28 263 298 154 (55)
1277 776 744
Pre-tax profit 1280 1375 799 1062 1449 1168 1255 844
5700 4563 4933
Tax / minority int. (367) (419) (228) (379) (414) (269) (390) (308)
(1637) (1386) (1452)
Net profit 913 956 571 683 1,035 899 865 536
4,063 3,177 3,481
Net EPS (TWD) 0.46 0.48 0.29 0.34 0.52 0.45 0.44 0.27
2.05 1.60 1.76
Operating Ratios
Gross margin 25.2% 25.2% 25.5% 27.2% 27.0% 25.9% 25.4% 25.1%
24.9% 25.5% 26.3%
Operating margin 7.4% 7.9% 7.5% 8.8% 9.3% 7.2% 8.2% 7.5%
8.2% 7.8% 8.4%
Pre-tax margin 10.5% 11.2% 6.4% 9.1% 11.3% 9.7% 9.3% 7.1%
10.6% 9.4% 9.9%
Net margin 7.5% 7.8% 4.6% 5.8% 8.1% 7.5% 6.4% 4.5%
7.6% 6.5% 7.0%
YoY (%)
Net revenue -14% -9% -1% 0% 5% -2% 8% 2%
-5% -10% 3%
Gross profit -15% -9% 3% 4% 13% 1% 7% -6%
-1% -7% 6%
Operating profit -34% -12% 19% 5% 31% -10% 18% -13%
-4% -14% 11%
Pre-tax profit -36% -3% -16% -4% 13% -15% 57% -21%
5% -20% 8%
Net profit -38% -8% -18% -7% 13% -6% 51% -22%
8% -22% 10%
QoQ (%)
Net revenue 4% 1% 2% -6% 10% -6% 12% -11%
Gross profit 1% 1% 3% 0% 9% -10% 10% -12%
Operating profit -8% 7% -3% 10% 15% -27% 27% -18%
Pre-tax profit 15% 7% -42% 33% 36% -19% 7% -33%
Net profit 24% 5% -40% 20% 52% -13% -4% -38%
Source: Company
Teco: revenue breakdown by product Teco: 1-year-forward PER
Source: Company Source: TEJ, Bloomberg
Teco: main product lines
Source: Company
49% 50% 45% 44% 44% 44%
18% 15%14% 17% 17% 17%
13% 11%11% 12% 12% 10%
4% 13% 11% 8% 8%
8% 7% 6% 6% 6% 6%
12% 12% 12% 11% 12% 14%
0%
20%
40%
60%
80%
100%
2011 2012 2013 2014 2015 2016
Motor Home Appliance System Automation Tecom M & E Construction Others
10
20
30
40
50
May11 May12 May13 May14 May15 May16 May17
(TWD)
Share price 9x 13x 16x 22x
Motor System Automation Home Appliance
Page 63
63
Taiwan Industrial Robotics: 16 May 2017
Daiwa’s Asia Pacific Research Directory
HONG KONG
Takashi FUJIKURA (852) 2848 4051 [email protected]
Regional Research Head
Jiro IOKIBE (852) 2773 8702 [email protected]
Co-head of Asia Pacific Research
John HETHERINGTON (852) 2773 8787 [email protected]
Co-head of Asia Pacific Research
Kevin LAI (852) 2848 4926 [email protected]
Chief Economist for Asia ex-Japan; Macro Economics (Regional)
Olivia XIA (852) 2773 8736 [email protected]
Macro Economics (Hong Kong/China)
Kelvin LAU (852) 2848 4467 [email protected]
Head of Automobiles; Transportation and Industrial (Hong Kong/China)
Leon QI (852) 2532 4381 [email protected]
Banking; Diversified financials; Insurance (Hong Kong/China)
Yan LI (852) 2773 8822 [email protected]
Banking (China)
Anson CHAN (852) 2532 4350 [email protected]
Consumer (Hong Kong/China)
Adrian CHAN (852) 2848 4427 [email protected]
Consumer (Hong Kong/China)
Jamie SOO (852) 2773 8529 [email protected]
Gaming and Leisure (Hong Kong/China)
John CHOI (852) 2773 8730 [email protected]
Head of Hong Kong and China Internet; Regional Head of Small/Mid Cap
Alex LIU (852) 2848 4976 [email protected]
Internet (Hong Kong/China)
Carlton LAI (852) 2532 4349 [email protected]
Small/Mid Cap (Hong Kong/China)
Dennis IP (852) 2848 4068 [email protected]
Power; Utilities; Renewables and Environment (Hong Kong/China)
Jonas KAN (852) 2848 4439 [email protected]
Head of Hong Kong and China Property
Cynthia CHAN (852) 2773 8243 [email protected]
Property (China)
Thomas HO (852) 2773 8716 [email protected]
Custom Products Group
PHILIPPINES
Micaela ABAQUITA (63) 2 737 3021 [email protected]
Property
SOUTH KOREA
Sung Yop CHUNG (82) 2 787 9157 [email protected]
Pan-Asia Co-head/Regional Head of Automobiles and Components; Automobiles; Shipbuilding; Steel
Mike OH (82) 2 787 9179 [email protected]
Banking; Capital Goods (Construction and Machinery)
Iris PARK (82) 2 787 9165 [email protected]
Consumer/Retail
SK KIM (82) 2 787 9173 [email protected]
IT/Electronics – Semiconductor/Display and Tech Hardware
Thomas Y KWON (82) 2 787 9181 [email protected]
Pan-Asia Head of Internet & Telecommunications; Software – Internet/On-line Games
TAIWAN
Rick HSU (886) 2 8758 6261 [email protected]
Head of Regional Technology; Head of Taiwan Research; Semiconductor/IC Design (Regional)
Nora HOU (886) 2 8758 6249 [email protected]
Banking; Diversified financials; Insurance
Steven TSENG (886) 2 8758 6252 [email protected]
IT/Technology Hardware (PC Hardware)
Kylie HUANG (886) 2 8758 6248 [email protected]
IT/Technology Hardware (Handsets and Components)
Helen CHIEN (886) 2 8758 6254 [email protected]
Small/Mid Cap
INDIA
Punit SRIVASTAVA (91) 22 6622 1013 [email protected]
Head of India Research; Strategy; Banking/Finance
Saurabh MEHTA (91) 22 6622 1009 [email protected]
Capital Goods; Utilities
SINGAPORE
Ramakrishna MARUVADA (65) 6499 6543 [email protected]
Head of Singapore Research; Telecommunications (China/ASEAN/India)
David LUM (65) 6329 2102 [email protected]
Banking; Property and REITs
Royston TAN (65) 6321 3086 [email protected]
Oil and Gas; Capital Goods
Shane GOH (65) 64996546 [email protected]
Property and REITs; Small/Mid Cap (Singapore)
Jame OSMAN (65) 6321 3092 [email protected]
Transportation – Road and Rail; Pharmaceuticals and Healthcare; Consumer (Singapore)
Page 64
64
Taiwan Industrial Robotics: 16 May 2017
Daiwa’s Offices
Office / Branch / Affiliate Address Tel Fax
DAIWA SECURITIES GROUP INC
HEAD OFFICE Gran Tokyo North Tower, 1-9-1, Marunouchi, Chiyoda-ku, Tokyo, 100-6753 (81) 3 5555 3111 (81) 3 5555 0661
Daiwa Securities Trust Company One Evertrust Plaza, Jersey City, NJ 07302, U.S.A. (1) 201 333 7300 (1) 201 333 7726
Daiwa Securities Trust and Banking (Europe) PLC (Head Office) 5 King William Street, London EC4N 7JB, United Kingdom (44) 207 320 8000 (44) 207 410 0129
Daiwa Europe Trustees (Ireland) Ltd Level 3, Block 5, Harcourt Centre, Harcourt Road, Dublin 2, Ireland (353) 1 603 9900 (353) 1 478 3469
Daiwa Capital Markets America Inc. New York Head Office Financial Square, 32 Old Slip, New York, NY10005, U.S.A. (1) 212 612 7000 (1) 212 612 7100
Daiwa Capital Markets America Inc. San Francisco Branch 555 California Street, Suite 3360, San Francisco, CA 94104, U.S.A. (1) 415 955 8100 (1) 415 956 1935
Daiwa Capital Markets Europe Limited, London Head Office 5 King William Street, London EC4N 7AX, United Kingdom (44) 20 7597 8000 (44) 20 7597 8600
Daiwa Capital Markets Europe Limited, Frankfurt Branch Neue Mainzer Str. 1, 60311 Frankfurt/Main, Germany (49) 69 717 080 (49) 69 723 340
Daiwa Capital Markets Europe Limited, Paris Representative Office 17, rue de Surène 75008 Paris, France (33) 1 56 262 200 (33) 1 47 550 808
Daiwa Capital Markets Europe Limited, Geneva Branch 50 rue du Rhône, P.O.Box 3198, 1211 Geneva 3, Switzerland (41) 22 818 7400 (41) 22 818 7441
Daiwa Capital Markets Europe Limited, Moscow Representative Office
Midland Plaza 7th Floor, 10 Arbat Street, Moscow 119002, Russian Federation
(7) 495 641 3416 (7) 495 775 6238
Daiwa Capital Markets Europe Limited, Bahrain Branch 7th Floor, The Tower, Bahrain Commercial Complex, P.O. Box 30069, Manama, Bahrain
(973) 17 534 452 (973) 17 535 113
Daiwa Capital Markets Hong Kong Limited Level 28, One Pacific Place, 88 Queensway, Hong Kong (852) 2525 0121 (852) 2845 1621
Daiwa Capital Markets Singapore Limited 6 Shenton Way #26-08, OUE Downtown 2, Singapore 068809, Republic of Singapore
(65) 6220 3666 (65) 6223 6198
Daiwa Capital Markets Australia Limited Level 34, Rialto North Tower, 525 Collins Street, Melbourne, Victoria 3000, Australia
(61) 3 9916 1300 (61) 3 9916 1330
DBP-Daiwa Capital Markets Philippines, Inc 18th Floor, Citibank Tower, 8741 Paseo de Roxas, Salcedo Village, Makati City, Republic of the Philippines
(632) 813 7344 (632) 848 0105
Daiwa-Cathay Capital Markets Co Ltd 14/F, 200, Keelung Road, Sec 1, Taipei, Taiwan, R.O.C. (886) 2 2723 9698 (886) 2 2345 3638
Daiwa Securities Capital Markets Korea Co., Ltd. 20 Fl.& 21Fl. One IFC, 10 Gukjegeumyung-Ro, Yeongdeungpo-gu, Seoul, Korea
(82) 2 787 9100 (82) 2 787 9191
Daiwa Securities Co. Ltd., Beijing Representative Office Room 301/302,Kerry Center,1 Guanghua Road,Chaoyang District,
Beijing 100020, People’s Republic of China
(86) 10 6500 6688 (86) 10 6500 3594
Daiwa (Shanghai) Corporate Strategic Advisory Co. Ltd. 44/F, Hang Seng Bank Tower, 1000 Lujiazui Ring Road, Pudong, Shanghai China 200120 , People’s Republic of China
(86) 21 3858 2000 (86) 21 3858 2111
Daiwa Securities Co. Ltd., Bangkok Representative Office 18th Floor, M Thai Tower, All Seasons Place, 87 Wireless Road,
Lumpini, Pathumwan, Bangkok 10330, Thailand (66) 2 252 5650 (66) 2 252 5665
Daiwa Capital Markets India Private Ltd 10th Floor, 3 North Avenue, Maker Maxity, Bandra Kurla Complex, Bandra East, Mumbai – 400051, India
(91) 22 6622 1000 (91) 22 6622 1019
Daiwa Securities Co. Ltd., Hanoi Representative Office Suite 405, Pacific Palace Building, 83B, Ly Thuong Kiet Street, Hoan Kiem Dist. Hanoi, Vietnam
(84) 4 3946 0460 (84) 4 3946 0461
DAIWA INSTITUTE OF RESEARCH LTD
HEAD OFFICE 15-6, Fuyuki, Koto-ku, Tokyo, 135-8460, Japan (81) 3 5620 5100 (81) 3 5620 5603
MARUNOUCHI OFFICE Gran Tokyo North Tower, 1-9-1, Marunouchi, Chiyoda-ku, Tokyo, 100-6756 (81) 3 5555 7011 (81) 3 5202 2021
New York Research Center 11th Floor, Financial Square, 32 Old Slip, NY, NY 10005-3504, U.S.A. (1) 212 612 6100 (1) 212 612 8417
London Research Centre 3/F, 5 King William Street, London, EC4N 7AX, United Kingdom (44) 207 597 8000 (44) 207 597 8550
Page 65
65
Taiwan Industrial Robotics: 16 May 2017
Important Disclosures and Disclaimer
This publication is produced by Daiwa Securities Group Inc. and/or its non-U.S. affiliates, and distributed by Daiwa Securities Group Inc. and/or its non-U.S. affiliates, except to the extent expressly provided herein. This publication and the contents hereof are intended for information purposes only, and may be subject to change without further notice. Any use, disclosure, distribution, dissemination, copying, printing or reliance on this publication for any other purpose without our prior consent or approval is strictly prohibited. Neither Daiwa Securities Group Inc. nor any of its respective parent, holding, subsidiaries or affiliates, nor any of its respective directors, officers, servants and employees, represent nor warrant the accuracy or completeness of the information contained herein or as to the existence of other facts which might be significant, and will not accept any responsibility or liability whatsoever for any use of or reliance upon this publication or any of the contents hereof. Neither this publication, nor any content hereof, constitute, or are to be construed as, an offer or solicitation of an offer to buy or sell any of the securities or investments mentioned herein in any country or jurisdiction nor, unless expressly provided, any recommendation or investment opinion or advice. Any view, recommendation, opinion or advice expressed in this publication may not necessarily reflect those of Daiwa Securities Group Inc., and/or its affiliates nor any of its respective directors, officers, servants and employees except where the publication states otherwise. This research report is not to be relied upon by any person in making any investment decision or otherwise advising with respect to, or dealing in, the securities mentioned, as it does not take into account the specific investment objectives, financial situation and particular needs of any person. Daiwa Securities Group Inc., its subsidiaries or affiliates, or its or their respective directors, officers and employees from time to time have trades as principals, or have positions in, or have other interests in the securities of the company under research including market making activities, derivatives in respect of such securities or may have also performed investment banking and other services for the issuer of such securities. The following are additional disclosures.
Ownership of Securities
For “Ownership of Securities” information, please visit BlueMatrix disclosure link at https://daiwa3.bluematrix.com/sellside/Disclosures.action.
Investment Banking Relationship
For “Investment Banking Relationship”, please visit BlueMatrix disclosure link at https://daiwa3.bluematrix.com/sellside/Disclosures.action.
Japan
Daiwa Securities Co. Ltd. and Daiwa Securities Group Inc.
Daiwa Securities Co. Ltd. is a subsidiary of Daiwa Securities Group Inc.
Investment Banking Relationship
Within the preceding 12 months, the subsidiaries and/or affiliates of Daiwa Securities Group Inc. * has lead-managed public offerings and/or secondary offerings (excluding straight bonds) of the securities of the following companies: Neo Solar Power Corp (3576 TT), Acushnet Holdings Corp (GOLF US), No Va Land Investment Group Corporation (NVL VN).
*Subsidiaries of Daiwa Securities Group Inc. for the purposes of this section shall mean any one or more of: Daiwa Capital Markets Hong Kong Limited (大和資本市場香港有限公司), Daiwa
Capital Markets Singapore Limited, Daiwa Capital Markets Australia Limited, Daiwa Capital Markets India Private Limited, Daiwa-Cathay Capital Markets Co., Ltd., Daiwa Securities Capital Markets Korea Co., Ltd.
Hong Kong
This research is distributed in Hong Kong by Daiwa Capital Markets Hong Kong Limited (大和資本市場香港有限公司) (“DHK”) which is regulated by the Hong Kong Securities and Futures
Commission. Recipients of this research in Hong Kong may contact DHK in respect of any matter arising from or in connection with this research. Relevant Relationship (DHK)
DHK may from time to time have an individual employed by or associated with it serves as an officer of any of the companies under its research coverage.
Singapore
This research is distributed in Singapore by Daiwa Capital Markets Singapore Limited and it may only be distributed in Singapore to accredited investors, expert investors and institutional investors as defined in the Financial Advisers Regulations and the Securities and Futures Act (Chapter 289), as amended from time to time. By virtue of distribution to these category of investors, Daiwa Capital Markets Singapore Limited and its representatives are not required to comply with Section 36 of the Financial Advisers Act (Chapter 110) (Section 36 relates to disclosure of Daiwa Capital Markets Singapore Limited’s interest and/or its representative’s interest in securities). Recipients of this research in Singapore may contact Daiwa Capital Markets Singapore Limited in respect of any matter arising from or in connection with the research.
Australia
This research is distributed in Australia by Daiwa Capital Markets Australia Limited and it may only be distributed in Australia to wholesale investors within the meaning of the Corporations Act. Recipients of this research in Australia may contact Daiwa Capital Markets Stockbroking Limited in respect of any matter arising from or in connection with the research.
India
This research is distributed in India to Institutional Clients only by Daiwa Capital Markets India Private Limited (Daiwa India) which is an intermediary registered with Securities & Exchange Board of India as a Stock Broker, Merchant Bank and Research Analyst. Daiwa India, its Research Analyst and their family members and its associates do not have any financial interest save as disclosed or other undisclosed material conflict of interest in the securities or derivatives of any companies under coverage. Daiwa India and its associates, may have received compensation for any products other than Investment Banking (as disclosed)or brokerage services from the subject company in this report or from any third party during the past 12 months. Daiwa India and its associates may have debt holdings in the subject company. For information on ownership of equity, please visit BlueMatrix disclosure Link at https://daiwa3.bluematrix.com/sellside/Disclosures.action. There is no material disciplinary action against Daiwa India by any regulatory authority impacting equity research analysis activities as of the date of this report.
Associates of Daiwa India, registered with Indian regulators, include Daiwa Capital Markets Singapore Limited and Daiwa Portfolio Advisory (India) Private Limited.
Taiwan
This research is solely for reference and not intended to provide tailored investment recommendations. This research is distributed in Taiwan by Daiwa-Cathay Capital Markets Co., Ltd. and it may only be distributed in Taiwan to specific customers who have signed recommendation contracts with Daiwa-Cathay Capital Markets Co., Ltd. and non-customers including (i) professional institutional investors, (ii) TWSE or TPEx listed companies, upstream and downstream vendors, and specialists that offer or seek advice, and (iii) potential customers with an actual need for business development in accordance with the Operational Regulations Governing Securities Firms Recommending Trades in Securities to Customers. Recipients of this research including non-customer recipients of this research shall not provide it to others or engage in any activities in connection with this research which may involve conflicts of interests. Neither Daiwa-Cathay Capital Markets Co., Ltd. nor its personnel who writes or reviews the research report has any conflict of interest in this research. Since Daiwa-Cathay Capital Markets Co., Ltd. does not operate brokerage trading business in foreign markets, this research is “without recommendation” to any foreign securities and Daiwa-Cathay Capital Markets Co., Ltd. does not accept
orders from customers to trade in such securities that are without recommendation. Recipients of this research in Taiwan may contact Daiwa-Cathay Capital Markets Co., Ltd. in respect of any matter arising from or in connection with the research.
Philippines This research is distributed in the Philippines by DBP-Daiwa Capital Markets Philippines, Inc. which is regulated by the Philippines Securities and Exchange Commission and the Phil ippines Stock Exchange, Inc. Recipients of this research in the Philippines may contact DBP-Daiwa Capital Markets Philippines, Inc. in respect of any matter arising from or in connection with the research. DBP-Daiwa Capital Markets Philippines, Inc. recommends that investors independently assess, with a professional advisor, the specific financial risks as well as the legal, regulatory, tax, accounting, and other consequences of a proposed transaction. DBP-Daiwa Capital Markets Philippines, Inc. may have positions or may be materially interested in the securities in any of the markets mentioned in the publication or may have performed other services for the issuers of such securities.
For relevant securities and trading rules please visit SEC and PSE links at http://www.sec.gov.ph and http://www.pse.com.ph/ respectively.
Thailand
This research is distributed to only institutional investors in Thailand primarily by Thanachart Securities Public Company Limited (“TNS”).
This report is prepared by analysts who are employed by Daiwa Securities Group Inc. and/or its non-U.S. affiliates. This report is provided to you for informational purposes only and it is not, and is not to be construed as, an offer or an invitation to make an offer to sell or buy any securities. Neither Thanachart Securities Public Company Limited, Daiwa Securities Group Inc. nor any of their respective parent, holding, subsidiaries or affiliates, nor any of their respective directors, officers, servants and employees accept any liability whatsoever for any direct or consequential loss arising from any use of this research or its contents.
The information and opinions contained herein have been compiled or arrived at from sources believed to be reliable. However, Thanachart Securities Public Company Limited, Daiwa Securities Group Inc. nor any of their respective parent, holding, subsidiaries or affiliates, nor any of their respective directors, officers, servants and employees make no representation or warranty, express or implied, as to their accuracy or completeness. Expressions of opinion herein are subject to change without notice. The use of any information, forecasts and opinions contained in this report shall be at the sole discretion and risk of the user.
Daiwa Securities Group Inc. and/or its non-U.S. affiliates perform and seek to perform business with companies covered in this research. Thanachart Securities Public Company Limited, Daiwa Securities Group Inc., their respective parent, holding, subsidiaries or affiliates, their respective directors, officers, servants and employees may have positions and financial interest in securities mentioned in this research. Thanachart Securities Public Company Limited, Daiwa Securities Group Inc., their respective parent, holding, subsidiaries or affiliates may from time to time perform investment banking or other services for, or solicit investment banking or other business from, any entity mentioned in this research. Therefore, investors should be aware of conflict of interest that may affect the objectivity of this research.
Page 66
66
Taiwan Industrial Robotics: 16 May 2017
United Kingdom This research report is produced by Daiwa Securities Co. Ltd. and/or its affiliates and is distributed in the European Union, Iceland, Liechtenstein, Norway and Switzerland. Daiwa Capital Markets Europe Limited is authorised and regulated by The Financial Conduct Authority (“FCA”) and is a member of the London Stock Exchange and Eurex. This publication is intended for investors who are not Retail Clients in the United Kingdom within the meaning of the Rules of the FCA and should not therefore be distributed to such Retail Clients in the United Kingdom. Should you enter into investment business with Daiwa Capital Markets Europe’s affiliates outside the United Kingdom, we are obliged to advise that the protection afforded by the United Kingdom regulatory system may not apply; in particular, the benefits of the Financial Services Compensation Scheme may not be available.
Daiwa Capital Markets Europe Limited has in place organisational arrangements for the prevention and avoidance of conflicts of interest. Our conflict management policy is available at http://www.uk.daiwacm.com/about-us/corporate-governance-regulatory.
Germany
This document is distributed in Germany by Daiwa Capital Markets Europe Limited, Niederlassung Frankfurt which is regulated by BaFin (Bundesanstalt fuer Finanzdienstleistungsaufsicht) for the conduct of business in Germany.
Bahrain
This research material is distributed in Bahrain by Daiwa Capital Markets Europe Limited, Bahrain Branch, regulated by The Central Bank of Bahrain and holds Investment Business Firm – Category 2 license and having its official place of business at the Bahrain World Trade Centre, South Tower, 7th floor, P.O. Box 30069, Manama, Kingdom of Bahrain. Tel No. +973 17534452 Fax No. +973 535113
United States
This report is distributed in the U.S. by Daiwa Capital Markets America Inc. (DCMA). It may not be accurate or complete and should not be relied upon as such. It reflects the preparer’s v iews at the time of its preparation, but may not reflect events occurring after its preparation; nor does it reflect DCMA’s views at any time. Neither DCMA nor the preparer has any obligation to update this report or to continue to prepare research on this subject. This report is not an offer to sell or the solicitation of any offer to buy securities. Unless this report says otherwise, any recommendation it makes is risky and appropriate only for sophisticated speculative investors able to incur significant losses. Readers should consult their financial advisors to determine whether any such recommendation is consistent with their own investment objectives, financial situation and needs. This report does not recommend to U.S. recipients the use of any of DCMA’s non-U.S. affiliates to effect trades in any security and is not supplied with any understanding that U.S. recipients of this report will direct commission business to such non-U.S. entities. Unless applicable law permits otherwise, non-U.S. customers wishing to effect a transaction in any securities referenced in this material should contact a Daiwa entity in their local jurisdiction. Most countries throughout the world have their own laws regulating the types of securities and other investment products which may be offered to their residents, as well as a process for doing so. As a result, the securities discussed in this report may not be eligible for sales in some jurisdictions. Customers wishing to obtain further information about this report should contact DCMA: Daiwa Capital Markets America Inc., Financial Square, 32 Old Slip, New York, New York 10005 (Tel no. 212-612-7000).
Ownership of Securities
For “Ownership of Securities” information please visit BlueMatrix disclosure link at https://daiwa3.bluematrix.com/sellside/Disclosures.action.
Investment Banking Relationships
For “Investment Banking Relationships” please visit BlueMatrix disclosure link at https://daiwa3.bluematrix.com/sellside/Disclosures.action.
DCMA Market Making
For “DCMA Market Making” please visit BlueMatrix disclosure link at https://daiwa3.bluematrix.com/sellside/Disclosures.action.
Research Analyst Conflicts
For updates on “Research Analyst Conflicts” please visit BlueMatrix disclosure link at https://daiwa3.bluematrix.com/sellside/Disclosures.action. The principal research analysts who prepared this report have no financial interest in securities of the issuers covered in the report, are not (nor are any members of their household) an officer, director or advisory board member of the issuer(s) covered in the report, and are not aware of any material relevant conflict of interest involving the analyst or DCMA, and did not receive any compensation from the issuer during the past 12 months except as noted: no exceptions.
Research Analyst Certification
For updates on “Research Analyst Certification” and “Rating System” please visit BlueMatrix disclosure link at https://daiwa3.bluematrix.com/sellside/Disclosures.action. The views about any and all of the subject securities and issuers expressed in this Research Report accurately reflect the personal views of the research analyst(s) primarily responsible for this report (or the views of the firm producing the report if no individual analyst is named on the report); and no part of the compensation of such analyst (or no part of the compensation of the firm if no individual analyst is named on the report) was, is, or will be directly or indirectly related to the specific recommendations or views contained in this Research Report.
The following explains the rating system in the report as compared to relevant local indices, unless otherwise stated, based on the beliefs of the author of the report.
"1": the security could outperform the local index by more than 15% over the next 12 months. "2": the security is expected to outperform the local index by 5-15% over the next 12 months. "3": the security is expected to perform within 5% of the local index (better or worse) over the next 12 months. "4": the security is expected to underperform the local index by 5-15% over the next 12 months. "5": the security could underperform the local index by more than 15% over the next 12 months. Disclosure of investment ratings
Rating Percentage of total
Buy* 66.8%
Hold** 20.9%
Sell*** 12.2%
Source: Daiwa
Notes: data is for single-branded Daiwa research in Asia (ex Japan) and correct as of 31 March 2017. * comprised of Daiwa’s Buy and Outperform ratings. ** comprised of Daiwa’s Hold ratings. *** comprised of Daiwa’s Underperform and Sell ratings. Additional information may be available upon request.
Japan - additional notification items pursuant to Article 37 of the Financial Instruments and Exchange Law
(This Notification is only applicable where report is distributed by Daiwa Securities Co. Ltd.)
If you decide to enter into a business arrangement with us based on the information described in materials presented along with this document, we ask you to pay close attention to the following items.
In addition to the purchase price of a financial instrument, we will collect a trading commission* for each transaction as agreed beforehand with you. Since commissions may be included in the purchase price or may not be charged for certain transactions, we recommend that you confirm the commission for each transaction.
In some cases, we may also charge a maximum of ¥ 2 million (including tax) per year as a standing proxy fee for our deposit of your securities, if you are a non-resident of Japan.
For derivative and margin transactions etc., we may require collateral or margin requirements in accordance with an agreement made beforehand with you. Ordinarily in such cases, the amount of the transaction will be in excess of the required collateral or margin requirements.
There is a risk that you will incur losses on your transactions due to changes in the market price of financial instruments based on fluctuations in interest rates, exchange rates, stock prices, real estate prices, commodity prices, and others. In addition, depending on the content of the transaction, the loss could exceed the amount of the collateral or margin requirements.
There may be a difference between bid price etc. and ask price etc. of OTC derivatives handled by us.
Before engaging in any trading, please thoroughly confirm accounting and tax treatments regarding your trading in financial instruments with such experts as certified public accountants. *The amount of the trading commission cannot be stated here in advance because it will be determined between our company and you based on current market conditions and the content of each transaction etc.
When making an actual transaction, please be sure to carefully read the materials presented to you prior to the execution of agreement, and to take responsibility for your own decisions regarding the signing of the agreement with us.
Corporate Name: Daiwa Securities Co. Ltd. Financial instruments firm: chief of Kanto Local Finance Bureau (Kin-sho) No.108 Memberships: Japan Securities Dealers Association, The Financial Futures Association of Japan Japan Securities Investment Advisers Association Type II Financial Instruments Firms Association