OSWER Directive 9285.7-25A EPA 540/R-97/028 PB97-963239 May 1997 SUPERFUND PROGRAM REPRESENTATIVE SAMPLING GUIDANCE VOLUME 3: BIOLOGICAL INTERIM FINAL Environmental Response Team Center Office of Emergency and Remedial Response Office of Solid Waste and Emergency Response U.S. Environmental Protection Agency Washington, DC 20460
Transcript
OSWER Directive 9285.7-25A
EPA 540/R-97/028PB97-963239
May 1997
SUPERFUND PROGRAM
REPRESENTATIVE SAMPLING GUIDANCE
VOLUME 3: BIOLOGICAL
INTERIM FINAL
Environmental Response Team Center
Office of Emergency and Remedial ResponseOffice of Solid Waste and Emergency Response
U.S. Environmental Protection AgencyWashington, DC 20460
ii
Notice
The policies and procedures established in this document are intended solely for the guidance of governmentpersonnel, for use in the Superfund Program. They are not intended, and cannot be relied upon, to create any rights,substantive or procedural, enforceable by any party in litigation with the United States. The Agency reserves the rightto act at variance with these policies and procedures and to change them at any time without public notice.
For more information on Biological Sampling procedures, refer to the Compendium of ERT Toxicity TestingProcedures, OSWER Directive 9360-4-08, EPA/540/P-91/009 (U.S. EPA 1991a). Topics covered in thiscompendium include: toxicity testing; and surface water and sediment sampling.
Please note that the procedures in this document should only be used by individuals properly trained and certifiedunder a 40 Hour Hazardous Waste Site Training Course that meets the requirements set forth in 29 CFR1910.120(e)(3). It should not be used to replace or supersede any information obtained in a 40 Hour Hazardous WasteSite Training Course.
Questions, comments, and recommendations are welcomed regarding the Superfund Program RepresentativeSampling Guidance, Volume 3 -- Biological. Send remarks to:
U.S. EPA - Environmental Response Center (ERC)Building 18, MS-101
2890 Woodbridge AvenueEdison, NJ 08837-3679
For additional copies of the Superfund Program Representative Sampling Guidance, Volume 3 -- Biological,contact:
National Technical Information Services5285 Port Royal RoadSpringfield, VA 22161Phone (703) 487-4650
U.S. EPA employees can order a copy by calling the ERC at (908) 321-4212
iii
Disclaimer
This document has been reviewed in accordance with U.S. Environmental Protection Agency policy and approvedfor publication. Mention of trade names or commercial products does not constitute endorsement or recommendationfor use.
The following trade names are mentioned in this document:
Havahart® - Allcock Manufacturing Co., Lititz, PA
Longworth - Longworth Scientific Instrument Company, Ltd., England
Museum Special - Woodstream Corporation, Lititz, PA
TABLE 1 - Reference List of Standard Operating Procedures -- Ecological Sampling Methods . . . . . . . . . . . . 20
ix
Preface
This document is third in a series of guidance documents designed to assist Superfund Program Site Managers suchas On-Scene Coordinators (OSCs), Site Assessment Managers (SAMs), and other field staff in obtainingrepresentative samples at Superfund sites. It is intended to assist Superfund Program personnel in evaluating anddocumenting environmental threat in support of management decisions, including whether or not to pursue a responseaction. This document provides general guidance for collecting representative biological samples (i.e., measurementendpoints) once it has been determined by the Site Manager that additional sampling will assist in evaluating thepotential for ecological risk. In addition, this document will:
Assist field personnel in representative biological sampling within the objectives and scope of the SuperfundProgram
Facilitate the use of ecological assessments as an integral part of the overall site evaluation process
Assist the Site Manager in determining whether an environmental threat exists and what methods areavailable to assess that threat
This document is intended to be used in conjunction with other existing guidance documents, most notably,Ecological Risk Assessment Guidance for Superfund: Process for Designing and Conducting Ecological RiskAssessments, OSWER, EPA 540-R-97/006.
The objective of representative sampling is to ensure that a sample or a group of samples accurately characterizes siteconditions. Biological information collected in this manner complements existing ecological assessment methods.Representative sampling within the objectives of the Superfund Program is used to:
promote awareness of biological and ecological issuesdefine the parameters of concern and the data quality objectives (DQOs)develop a biological sampling plandefine biological sampling methods and equipmentidentify and collect suitable quality assurance/quality control (QA/QC) samplesinterpret and present the analytical and biological data
The National Contingency Plan (NCP) requires that short-term response (removal) actions contribute to the efficientperformance of any long-term site remediation, to the extent applicable. Use of this document will help determineif biological sampling should be conducted at a site, and if so, what samples will assist program personnel in thecollection of information required to make such a determination.
Identification and assessment of potential environmental threats are important elements for the Site Manager tounderstand. These activities can be accomplished through ecological assessments such as biological sampling. Thisdocument focuses on the performance of ecological assessment screening approaches, more detailed ecologicalassessment approaches, and biological sampling methods.
1
1.0 INTRODUCTION
1.1 OBJECTIVE AND SCOPE
This document is intended to assist SuperfundProgram personnel in evaluating and documentingenvironmental threat in support of managementdecisions. It presents ecological assessment andsampling as tools in meeting the objectives of theSuperfund Program, which include:
Determine threat to public health, welfare,and the environment
Determine the need for long-term action
Develop containment and control strategies
Determine appropriate treatment and disposaloptions
Document attainment of clean-up goals
This document is intended to assist SuperfundProgram personnel in obtaining scientifically validand defensible environmental data for the overalldecision-making process of site actions. Both theComprehensive Environmental Response,Compensation, and Liability Act (CERCLA)[§104(a)(1)], as amended by the SuperfundAmendments and Reauthorization Act (SARA), andthe NCP [§300.400(a)(2)], require that the UnitedStates Environmental Protection Agency (U.S. EPA)"protect human health and the environment."
Environmental threats may be independent of humanhealth threats, whether they co-exist at a site or are theresult of the same causative agents. It is thereforeimportant to determine and document potential,substantial, and/or imminent threats to theenvironment separately from threats to human health.
Representative sampling ensures that a sample or agroup of sample accurately characterizes siteconditions.Representative biological sampling and ecological riskassessment include, but are not limited to, thecollection of site information and the collection ofsamples for chemical or toxicological analyses.Biological sampling is dependent upon specific siterequirements during limited response actions or inemergency response situations. Applying the methods
of collecting environmental information, as outlined inthis document, can facilitate the decision-makingprocess (e.g., during chemical spill incidents).
The collection of representative samples is critical tothe site evaluation process since all data interpretationassumes proper sample collection. Samples collectedwhich inadvertently or intentionally direct thegenerated data toward a conclusion are biased andtherefore not representative.
This document provides Superfund Program personnelwith general guidance for collecting representativebiological samples (i.e., measurement endpoints, [seeSection 1.2 for the definition of measurementendpoint]). Representative biological sampling isconducted once the Site Manager has determined thatadditional sampling may assist in evaluating thepotential for ecological risk. This determinationshould be made in consultation with a trainedecologist or biologist. The topics covered in thisdocument include sampling methods and equipment,QA/QC, and data analysis and interpretation.
The appendices in this document provide several typesof assistance. Appendix A provides a checklist forinitial ecological assessment and sampling. AppendixB provides an example flow diagram for thedevelopment of a conceptual site model. Appendix Cprovides examples of how the checklist for ecologicalassessment/sampling is used to formulate a conceptualsite model that leads up to the design of a siteinvestigation.
This document is intended to be used in conjunctionwith other existing guidance documents, most notably,Ecological Risk Assessment Guidance for Superfund:Process for Designing and Conducting EcologicalRisk Assessments, EPA 540-R-97/006 (U.S. EPA1997).
1.2 R I S K A S S E S S M E N TOVERVIEW
The term ecological risk assessment (ERA), as used inthis document, and as defined in Ecological RiskAssessment Guidance for Superfund: Process forDesigning and Conducting Ecological RiskAssessments, OSWER, EPA 540-R-97/006 (U.S. EPA1997) refers to:
2
"... a qualitative and/or quantitativeappraisal of the actual or potentialimpacts of a hazardous waste siteon plants and animals other thanhumans and domesticated species."
Risk assessments are an integral part of the Superfundprocess and are conducted as part of the baseline riskassessment for the remedial investigation andfeasibility study (RI/FS). The RI is defined by acharacterization of the nature and extent ofcontamination, and ecological and human health riskassessments. The nature and extent of contaminationdetermines the chemicals present on the site. Theecological and human health risk assessmentsdetermine if the concentrations threaten theenvironment and human health.
An ecological risk assessment is a formal process thatintegrates knowledge about an environmentalcontaminant (i.e., exposure assessment) and itspotential effects to ecological receptors (i.e., hazardassessment). The process evaluates the likelihood thatadverse ecological effects may occur or are occurringas a result of exposure to a stressor. As defined byU.S. EPA (1992), a stressor is any physical, chemicalor biological entity that can induce an adverseecological response. Adverse responses can rangefrom sublethal chronic effects in an individualorganism to a loss of ecosystem function.
Although stressors can be biological (e.g., introducedspecies), in the Superfund Program substancesdesignated as hazardous under CERCLA are usuallythe stressors of concern. A risk does not exist unless(1) the stressor has the ability to cause one or moreadverse effects, and (2) it co-occurs with or contactsan ecological component long enough and at sufficientintensity to elicit the identified adverse effect.
The risk assessment process also involves theidentification of assessment and measurementendpoints. Assessment endpoints are explicitexpressions of the actual environmental values (e.g.,ecological resources) that are to be protected. Ameasurement endpoint is a measurable biologicalresponse to a stressor that can be related to the valuedcharacteristic chosen as the assessment endpoint (U.S.EPA 1997). Biological samples are collected from asite to represent these measurement endpoints. SeeSection 2.2 for a detailed discussion of assessmentand measurement endpoints.
Except where required under other regulations, issuessuch as restoration, mitigation, and replacement areimportant to the program but are reserved forinvestigations that may or may not be included in theRI phase. During the management decision process ofselecting the preferred remedial option leading to theRecord of Decision (ROD), mitigation and restorationissues should be addressed. Note that these issues arenot necessarily issues within the baseline ecologicalrisk assessment.
Guidelines for human health risk assessment havebeen established; however, comparable protocols forecological risk assessment do not currently exist.Ecological Risk Assessment Guidance for Superfund:Process for Designing and Conducting EcologicalRisk Assessments.” (U.S. EPA 1997) providesconceptual guidance and explains how to design andconduct ecological risk assessments for a CERCLARI/FS. The Framework for Ecological RiskAssessment (U.S. EPA 1992) provides an Agency-wide structure for conducting ecological riskassessments and describes the basic elements forevaluating site-specific adverse effects of stressors onthe environment. These documents should be referredto for specific information regarding the riskassessment process.
While the ecological risk assessment is a necessaryfirst step in a “natural resource damage assessment”to provide a causal link, it is not a damage evaluation.A natural resource damage assessment may beconducted at any Superfund site at the discretion ofthe Natural Resource Trustees. The portion of thedamage assessment beyond the risk assessment is theresponsibility of the Natural Resource Trustees, not ofthe U.S. EPA. Therefore, natural resource damageassessment is not addressed in this guidance.
1.3 CONCEPTUAL SITE MODEL
A conceptual site model is an integral part of a siteinvestigation and/or ecological risk assessment as itprovides the framework from which the study designis structured. The conceptual site model followscontaminants from their sources, through transport andfate pathways (air, soil, surface water, groundwater),to the ecological receptors. The conceptual model isa strong tool in the development of a representativesampling plan and is a requirement when conductingan ecological risk assessment. It assists the SiteManager in evaluating the interaction of different sitefeatures (e.g., drainage systems and the surrounding
3
topography), thereby ensuring that contaminant Potential Migration Pathwayssources, pathways, and ecological or human receptorsthroughout the site have been considered beforesampling locations, techniques, and media are chosen.
Frequently, a conceptual model is created as a sitemap (Figure 1) or flow diagram that describes thepotential movement of contaminants to site receptors(see Appendix B). Important considerations whencreating a conceptual model are:
The state(s) (or chemical form) of eachcontaminant and its potential mobilitythrough various mediaSite topographical features Meteorological conditions (e.g., climate,precipitation, humidity, winddirection/speed) Wildlife area utilization.
Preliminary and historical site information mayprovide the identification of the contaminant(s) ofconcern and the level(s) of the contamination. Asampling plan should be developed from theconceptual model based on the selected assessmentendpoints.
The conceptual site model (Figure 1) is applied to thisdocument, Representative Sampling GuidanceVolume 3: Biological. Based on the model, you canapproximate:
Potential Sourceshazardous waste site (waste pile, lagoon,emissions), drum dump (runoff, leachate),agricultural (runoff, dust, and particulates)
Potential Exposure Pathways - ingestion
waste contained in the pile on thehazardous waste site; soil particles nearthe waste pile; drum dump; or area ofagricultural activity
- inhalationdust and particulates from waste pile,drum dump, or area of agriculturalactivity
- absorption/direct contactsoil near waste pile, drum dump, or areaof agricultural activity and surface waterdownstream of sources
- air (particulates and gases) from drumdump and area of agricultural activity
- soil (runoff) from the hazardous waste site,drum dump, and agricultural runoff
- surface water (river & lake) from hazardouswaste site and agricultural runoff
if suspected to be in contact with potentiallycontaminated soil and surface water
- riverine vegetation/aquatic organisms ifsuspected to be in contact with potentiallycontaminated surface water and soil
- lake vegetation/mammals/aquatic organismsif suspected to be in contact with potentiallycontaminated surface water and leachate.
1.4 DATA QUALITY OBJECTIVES
Data quality objectives (DQOs) state the level ofuncertainty that is acceptable from data collectionactivities. DQOs also define the data qualitynecessary to make a certain decision. Consider thefollowing when establishing DQOs for a particularproject:
• Decision(s) to be made or question(s) to beanswered;
• Why environmental data are needed and howthe results will be used;
• Time and resource constraints on datacollection;
• Descriptions of the environmental data to becollected;
• Applicable model or data interpretationmethod used to arrive at a conclusion;
• Detection limits for analytes of concern; and
• Sampling and analytical error.
In addition to these considerations, the qualityassurance components of precision, accuracy (bias),completeness, representativeness, and comparability
4
should also be considered. Quality assurance In this document, it is assumed that technicalcomponents are defined as follows: specialists are available to assist Site Managers and
• Precision -- measurement of variability in the to ecological assessment. This assistance ensures thatdata collection process. all approaches are up-to-date and that best
• Accuracy (bias) -- measurement of bias in Appendix A for more information.the analytical process. The term "bias"throughout this document refers to the Support in designing and evaluating ecologicalQA/QC accuracy component. assessments is currently available from regional
• Completeness -- percentage of sampling Technical Assistance Groups (BTAGs). Support ismeasurements which are judged to be valid. also available from the Environmental Response Team
• Representativeness -- degree to which each region.sample data accurately and preciselyrepresent the characteristics of the sitecontaminants and their concentrations.
• Comparability -- evaluation of the similarityof conditions (e.g., sample depth, samplehomogeneity) under which separate sets ofdata are produced.
Many of the DQOs and quality assuranceconsiderations for soil, sediment, and water samplingare also applicable to biological sampling. However,there are also additional considerations that arespecific to biological sampling.
• Is biological data needed to answer thequestion(s) and, if so, how will the data beused;
• Seasonal, logistical, resource, and legalconstraints on biological specimencollection;
• What component of the biological systemwill be collected or evaluated (i.e., tissuesamples, whole organisms, population data,community data, habitat data);
• The specific model or interpretation schemeto be utilized on the data set;
• The temporal, spatial, and behavioralvariability inherent in natural systems.
Quality assurance/quality control (QA/QC) objectivesare discussed further in Chapter 4.
1.5 TECHNICAL ASSISTANCE
other site personnel in determining the best approach
professional judgment is exercised. Refer to
technical assistance groups such as Biological
Center (ERTC) as well as from other sources within
5
6
2.0 BIOLOGICAL/ECOLOGICAL ASSESSMENT APPROACHES
2.1 INTRODUCTION are described in further detail next.
Biological assessments vary in their level of effort,components, and complexity, depending upon theobjectives of the study and specific site conditions.An assessment may consist of literature-based riskevaluations and/or site-specific studies (e.g.,population/community studies, toxicitytests/bioassays, and tissue residue analyses).
Superfund Program personnel (RPMs and OSCs) maybe limited to completing the ecological checklist(Appendix A) during the Preliminary Site Evaluationsand to consulting an ecological specialist if it isdetermined that additional field data are required. Thechecklist is designed to be completed by one personduring an initial site visit. The checklist providesbaseline data, is useful in designing samplingobjectives, and requires a few hours to complete inthe field.
When the Site Manager determines that additionaldata collection is needed at a response site, thepersonnel and other resources required depends on theselected approach and the site complexity.
To determine which biological assessment approachor combination of approaches is appropriate for agiven site or situation, several factors must beconsidered. These include what managementdecisions will ultimately need to be made based on thedata; what are the study objectives; and what shouldbe the appropriate level of effort to obtain knowledgeof contaminant fate/ transport and ecotoxicity.
2.2 RISK EVALUATION
Three common approaches to evaluatingenvironmental risk to ecological receptors are (1) theuse of literature screening values (e.g., literaturetoxicity values) for comparison to site-specificcontaminant levels, (2) a "desk-top" risk assessmentwhich can model existing site-specific contaminantdata to ecological receptors for subsequentcomparison to literature toxicity values, and (3) fieldinvestigation/laboratory analysis that involves a siteinvestigation (which may utilize existing contaminantdata for support) and laboratory analysis ofcontaminant levels in media and/or experimentationusing bioassay procedures. These three approaches
2.2.1 Literature Screening Values
To determine the environmental effects ofcontaminants at a hazardous waste site, the levels ofcontaminants found may be compared to literaturetoxicity screening values or established screeningcriteria. These values should be derived from studiesthat involve testing of the same matrix and a similarorganism of concern. Most simply stated, if thecontaminant levels on the site are above theestablished criteria, further evaluation of the site maybe necessary to determine the presence of risk. Sitecontaminant levels that are lower than establishedcriteria may indicate that no further evaluation isnecessary at the site for that contaminant.
2.2.2 Risk Calculations
The "desk-top" risk calculation approach comparessite contaminants to information from studies found intechnical literature. This type of evaluation can serveas a screening assessment or as a tier in a morecomplex evaluation. Since many assumptions must bemade due to limited site-specific information, riskcalculations are necessarily conservative. Thecollection and inclusion of site-specific field data canreduce the number and/or the magnitude of these"conservative" assumptions, thereby generating amore realistic calculation of potential risk. (SeeChapter 5.0 for a complete discussion on riskcalculations.)
2.2.3 Standard Field Studies
Two important aspects of conducting a field study thatwarrant discussion are the selection of a reference areaand the selection of the receptors of concern. Theseare important to establish prior to conducting a fieldstudy.
2.2.3.1 Reference Area Selection
A reference area is defined in this document as an areathat is outside the chemical influence of the site butpossesses similar characteristics (e.g., habitat,substrate type) that allows for the comparison of databetween the impacted area (i.e., the site) and the
7
unimpacted area (i.e., the reference area). Reference endpoints. Establishing these endpoints will ensureareas can provide information regarding naturally (1) that the proper receptor will be selected to bestoccurring compounds and the existence of any answer the questions raised by the assessment andregional contamination independent of the site. They measurement endpoints, and (2) that the focus of thecan help determine if contaminants are ubiquitous in study remains on the component of the environmentthe area and can separate site-related issues from non- that may be used as the basis for decision. site related issues.
The reference area must be of similar habitat type and when selecting a target species. The behavioral habitssupport a species composition similar to the study and lifestyle of the species must be consistent with thearea. The collection and analysis of samples from a environmental fate and transport of the contaminantsreference area can support site-specific decisions of interest as well as pathways of exposure to receptorregarding uptake, body burden, and accumulation of species. For example, if the contaminants of concernchemicals and toxicity. at the site are PCBs that are bioaccumulative, a
The reference area should be outside the area of study since this species is documented to be sensitiveinfluence of the site and if possible, in an area of to the bioaccumulation of PCBs. The mink in thisminimal contamination or disturbance. Location of case has been selected to be used for establishing thereference areas in urban or industrial areas is measurement endpoint that is representative offrequently difficult, but an acceptable reference area piscivorous mammals. However, it may not beis usually critical to the successful use of ecological feasible to collect mink for study due to their lowassessment methods. availability in a given area. Therefore, the food items
2.2.3.2 Receptor Selection
The selection of a receptor is dependent upon theobjectives of the study and the contaminants present.The first step is to determine the toxicitycharacteristics of the contaminants (i.e., acute,chronic, bioaccumulative, or non-persistent). Thenext step is to determine the exposure route of thechemical (i.e., dermal, ingestion, inhalation).
Selection of the receptor or group of receptors is acomponent of establishing the measurement endpointin the study design. When discussing the termmeasurement endpoint, it is useful to first define arelated concept, the assessment endpoint. Anassessment endpoint is defined as “an explicitexpression of the environmental value that is to beprotected.” For example, “maintaining aquaticcommunity composition and structure downstream ofa site similar to that upstream of the site” is an explicitassessment endpoint. Inherent in this assessmentendpoint is the process of receptor selection thatwould most appropriately answer the question that theendpoint raises. Related to this assessment endpointis the measurement endpoint which is defined as “ameasurable ecological characteristic that is related tothe valued characteristic chosen as the assessmentendpoint.” For example, measurements of biologicaleffects such as mortality, reproduction, or growth ofan invertebrate community are measurement
There are a number of factors that must be considered
mammal such as a mink could be selected for the
of the mink (e.g., small mammals, aquatic vertebratesand invertebrates) may be collected and analyzed forPCBs as an alternative means of evaluating the risk tomink. The resulting residue data may be utilized toproduce a dose model. From this model, a referencedose value may be determined from which theprobable effects to mink calculated.
The movement patterns of a measurement endpointare also important during the receptor selectionprocess. Species that are migratory or that have largefeeding ranges are more difficult to link to siteexposure than those which are sessile, territorial, orhave limited movement patterns.Ecological field studies offer direct or corroborativeevidence of a link between contamination andecological effects. Such evidence includes:
Reduction in population sizes of species thatcan not be otherwise explained by naturallyoccurring population cyclesAbsence of species normally occurring in thehabitat and geographical distributionDominance of species associated primarilywith stressed habitatChanges in community diversity or trophicstructure relative to a reference locationHigh incidence of lesions, tumors, or otherpathologiesDevelopment of exposure responserelationships.
8
Ecologists usually compare data of observed adverseeffects to information obtained from a reference areanot affected by site contamination. To accomplishthis, chemical and biological data should be collectedsimultaneously and then compared to determine if acorrelation exists between contaminant concentrationsand ecological effects (U.S. EPA 1991b). Thesimultaneous collection of the data is important inreducing the effect of temporal variability as a factorin the correlation analysis.
The type of field study selected is directed by thecontaminants present linked to the assessmentendpoint. Prior to choosing a specific study approach,the site contaminant must be determined usinginformation about known or suspected sitecontaminants and how the nature of thesecontaminants may be modified by severalenvironmental and ecotoxicological factors. Inaddition, evaluation of chemical fate and transportinformation is necessary to determine the appropriatematrix and technique.
Contaminants can be a food chain threat, a lethalthreat, a direct non-lethal toxicant, indirect toxicant, orsome combination of the four. Chemical residuestudies are appropriate if the contaminant of concern(COC) will bioaccumulate. Ecotoxicologicalinformation can provide insight about contaminantsthat are expected to accumulate in organisms. It canalso provide information about which organismsprovide the best data for the study objectives. Forexample, the species-specific bioaccumulation ratemust be considered along with analytical detectionlimits; the bioaccumulated levels need to be above theanalytical detection limits. In contrast, population/community studies or toxicity testing may be moreappropriate if the contaminants cause direct lethality.
2.2.3.3 Exposure - Response Relationships
The relationship between the exposure (or dose) of acontaminant and the response that it elicits is afundamental concept in toxicology (Timbrell 1989).The simplest response to observe is death. Someexamples of other responses that vary in terms of easeof measurement include pathological lesions, cellnecrosis, biochemical changes, and behavioralchanges. It is this foundation of exposure-responserelationships upon which the concept of chemicalresidue studies, population/community studies, andtoxicity testing/bioassays are built upon.
2.2.3.4 Chemical Residue Studies
Residue studies are appropriate to use when there isconcern about the accumulation of contaminants in thetissues of indigenous species. Residue studies areconducted by collecting organisms of one or morespecies and comparing the contaminantbioaccumulation data to those organisms collectedfrom a reference area.
Chemical residue studies require field collection ofbiota and subsequent tissue analysis. A representativeorganism for collection and analysis is selected basedon the study objectives and the site habitat. Generallythe organism should be abundant, sessile (or withlimited home range), and easy to capture. Theseattributes help to provide a sufficient number ofsamples for analysis thereby strengthening the linkageto the site. A number of organism- and contaminant-specific factors should also be considered whendesigning residue studies (see Philips [1977] and[1978] for additional information). The subsequentchemical analysis may be conducted on specific targettissues or the whole body. In most cases, whole-bodyanalysis is the method of choice to support biologicalassessments. This is because most prey species areeaten in entirety by the predator.
In designing residue analysis studies, it is important toevaluate the exposure pathway carefully. If theorganisms analyzed are not within the site-specificexposure pathway, the information generated will notrelate to the environmental threat. Evaluation of theexposure pathway may suggest that a species otherthan the one of direct concern might provide a betterevaluation of potential threat or bioaccumulation.
Because there are different data needs for eachobjective, the study objective needs to be determinedprior to the collection of organisms. In these studiesthe actual accumulation (dependent upon thebioavailability) of the contaminants is evaluated ratherthan assumed from literature values. The informationcollected then allows for site-specific evaluation ofthe threat and reduces the uncertainty associated withthe use of literature bioavailability values. Thesefactors may be applied for specific areas ofuncertainty inherent from the extrapolation ofavailable data (e.g., assumptions of 100 percentbioaccumulation, variations in sensitive populations).
As stated previously, because site conditions as wellas the bioavailability can change over time, it is
9
important that exposure medium (soil, sediment, or for the use of a particular test. Factors to consider arewater) samples and biological samples are collected the test species, physical/chemical factors of thesimultaneously and analyzed for the same parameters contaminated media, acclimation of test organisms,to allow for the comparison of environmental necessity for laboratory versus field testing, testcontaminant levels in the tissue and the exposure duration, and selection of test endpoints (e.g.,medium. This is critical in establishing a site-specific mortality or growth). A thorough understanding of thelinkage that must be determined on a case-by-case interaction of these and other factors is necessary tobasis. determine if a toxicity test meets the study objectives.
2.2.3.5 Population/CommunityResponse Studies
The fundamental approach to population orcommunity response studies is to systematicallysample an area, documenting the organisms of thepopulation or community. Individuals are typicallyidentified and enumerated, and calculations are madewith respect to the number, and species present.These calculated values (e.g., indices or metrics) areused to compare sampling locations and referenceconditions. Some population and community metricsinclude the number of individuals, speciescomposition, density, diversity, and communitystructure.
2.2.3.6 Toxicity Testing/Bioassays
A third common assessment approach is to utilizetoxicity tests or bioassays. A toxicity test may bedesigned to measure the effects from acute (short-term) or chronic (long-term) exposure to acontaminant. An acute test attempts to expose theorganism to a stimulus that is severe enough toproduce a response rapidly. The duration of an acutetoxicity test is short relative to the organism’s lifecycle and mortality is the most common responsemeasured. In contrast, a chronic test attempts toinduce a biological response of relatively slowprogress through continuous, long-term exposure to acontaminant.
In designing a toxicity test, it is critical to understandthe fate, transport, and mechanisms of toxicity of thecontaminants to select the test type and conditions.The toxicity test must be selected to match the siteand its conditions rather than modify the site matrix
The selection of the best toxicity test, including thechoice of test organism, depends on several factors:
The decisions that will be based on theresults of the studyThe ecological setting of the siteThe contaminant(s) of concern
Toxicity testing can be conducted on a variety ofsample matrices, including water (or an aqueouseffluent), sediment, and soil. Soil and sedimenttoxicity tests can be conducted on the parent material(solid-phase tests) or on the elutriate (a water extractof the soil or sediment). Solid-phase sediment andsoil tests are currently the preferred tests since theyevaluate the toxicity of the matrix of interest to thetest organisms, thereby providing more of a realisticsite-specific exposure scenario.
As stated previously, one of the most frequently usedendpoints in acute toxicity testing is mortality (alsoreferred to as lethality) because it is one of the mosteasily measured parameters.
In contrast, some contaminants do not cause mortalityin test organisms but rather they affect the rate orsuccess of reproduction or growth in test organisms.In this case, the environmental effect of a contaminantmay be that it causes reproductive failure but does notcause mortality in the existing population. In eithercase, the population will either be eliminated ordrastically reduced.
The use of control as well as reference groups isnormally required. Laboratory toxicity tests includea control that evaluates the laboratory conditions, andthe health and response of the test organisms.Laboratory controls are required for all valid toxicitytests. A reference provides information on how thetest organisms respond to the exposure mediumwithout the site contaminants. Therefore, the referenceis necessary for interpretation of the test results in thecontext of the site (i.e., sample data is compared to thereference data). It is not uncommon for conditionsother than contamination to induce a response in a
10
toxicity test. With proper reference and control tests,toxicity tests can be used to establish a link betweencontaminants results and adverse effects.
Within the Superfund Program, conducting toxicitytests typically involves collecting field samples(water, sediment, soil) and transferring the materialsto a laboratory. In situ (field conducted) tests can berun if field conditions permit. There are benefits andlimitations associated with each approach. The mostnotable benefit of laboratory testing is that exposureconditions are controlled, but this leads to its mostnotable limitation, a reduction of realism. With in situtests, the reality of the exposure situation is increased,but there is a reduction of test controls. See U.S.EPA's Compendium of ERT Toxicity TestingProcedures, OSWER Directive 9360.4-08,EPA/540/P-91/009 (U.S. EPA 1991a), for descriptionsof nine common toxicity tests and Standard Guide forConducting Sediment Toxicity Tests with FreshwaterInvertebrates, ASTM Standard E1383, October 1990.
Species Selection for Toxicity Testing
Selection of the test organism is critical in designinga study using toxicity testing. The species selectedshould be representative relative to the assessmentendpoint, typically an organism found within theexposure pathway expected in the field. To be usefulin evaluating risk, the test organism must respond tothe contaminant(s) of concern. This can be difficult toachieve since the species and tests available arelimited. Difficult choices and balancing of factors arefrequently necessary.
11
3.0 BIOLOGICAL SAMPLING METHODS
Once a decision has been made that additional data need to target a "class" of individuals within aare required to assess the biological threat posed by a population for collection. For example, in a specificsite, an appropriate sampling plan must be developed. study it may be desirable to collect only males of theThe selection of ecological sampling methods and species or to collect fish of consumable size.equipment is dependent upon the field assessmentapproach, as discussed in Chapters 1 and 2. Thus, the Some receptors of concern (ROCs) cannot beselection of an assessment approach is the initial step collected and analyzed directly because of lowin the collection process. This chapter does not numbers of individuals in the study area, or otherpresent step-by-step instructions for a particular technical or logistical reasons. Exposure levels formethod, nor does it present an exhaustive list of these receptors can be estimated by collectingmethods or equipment. Rather, it presents specific organisms that are preyed upon by the ROC. Forexamples of the most commonly used methods and example, if the ROC is a predatory bird, the speciesassociated equipment. Table 4.1 (at the end of this collected for contaminant level measurements may bechapter) lists some of the standard operating one of several small mammals or fish that the ROC isprocedures (SOPs) used by the U.S. EPA's known to eat.Environmental Response Team Center (ERTC).
Because of the complex process required forselecting the proper assessment approach for aparticular site, consultation with anecologist/biologist experienced in conductingecological risk assessments is stronglyrecommended.
3.1 CHEMICAL RESIDUE STUDIES
Chemical residue studies are a commonly usedapproach that can address the bioavailability ofcontaminants in media (e.g., soil, sediment, water).They are often called tissue residue studies becausethey measure the contaminant body burden in siteorganisms.
When collecting organisms for tissue analyses, it iscritical that the measured levels of contaminants in theorganism are attributable to a particular location andcontaminant level within the site. Collection It should be noted that any applicable state permitstechniques must be evaluated for their potential to bias should be acquired before any biological samplingthe generated data. Collection methods can result in event. States requirements on organism, method,some form of biased data either by the size, sex, or sampling location, and data usage differ widely andindividual health of the organism. Collection may change from year to year. techniques are chosen based on the habitat present andthe species of interest. When representative The techniques used to collect different organisms areapproaches are not practical, the potential bias must specific to the study objectives. All techniques arebe identified and considered when drawing selective to some extent for certain species, sizes,conclusions from the data. The use of a particular habitat, or sexes of animals. Therefore, the potentialcollection technique should not be confused with the biases associated with each technique should be
As noted previously, it is critical to link theaccumulated contaminants both to the site and to anexposure medium. Subsequently, the collection andanalysis of representative soil, sediment, or watersamples from the same location are critical. Arealistic site-specific Bioaccumulation Factor (BAF)or Bioconcentration Factor (BCF) may then becalculated for use in the site exposure models.
"Bioconcentration is usually considered to be thatprocess by which toxic substances enter aquaticorganisms, by gill or epithelial tissue from the water.Bioaccumulation is a broader term in the sense that itusually includes not only bioconcentration but alsoany uptake of toxic substances through theconsumption of one organism." (Brungs and Mount1978).
3.1.1 Collection Methods
12
determined prior to the study. If the biases are Grid methodrecognized prior to collection, the sampling may bedesigned to minimize effect of the bias. For example, When using the sign/best set method, an experiencedlarge traps are not effective for trapping small animals field technical specialist searches for fresh mammalsince small mammals are not heavy enough to trigger signs (e.g., tacks, scat, feeding debris) to determinethe trap or may escape through minute trap openings. where the trap should be positioned. This method
In determining environmental threat, the target species methods, however, this method is biased and isgenerally consist of prey species such as earthworms, therefore generally used to determine what species aresmall mammals, or fish. Residue data from these present at the site.organisms can be used to evaluate the risk to highertrophic level organisms, which may be difficult to The paceline method involves placement of traps atcapture or analyze. regular intervals along a transect. A starting point is
3.1.1.1 Comparability Considerations
There are two issues that directly affect fieldcollection. First, organisms such as benthicmacroinvertebrates tend to have a patchy or non-uniform distribution in the environment due to microhabitats and other factors. Therefore, professionalevaluation in matching habitat for sampling is criticalin the collection of a truly representative sample of thecommunity. Second, variability in sampling effortand effectiveness needs to be considered.
3.1.1.2 Mammals
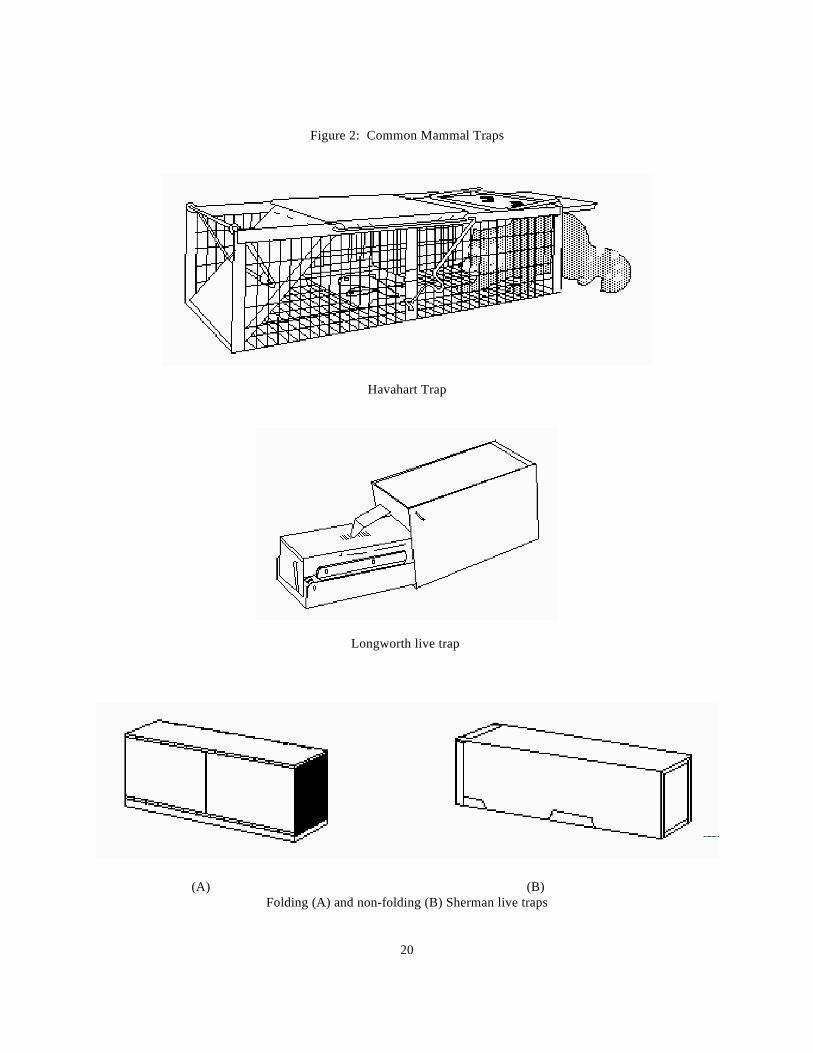
Trapping is the most common method for thecollection of mammals. The selection of traps isdetermined by the species targeted and the habitatpresent. Both live trap or kill trap methods may beacceptable for residue studies, but consideration ofother data uses (e.g., histopathology) or concern forinjury or death of non-target species can influence theuse of certain trap types. Several trap methods are available for collecting smallmammals. Commonly used traps include MuseumSpecial, Havahart, Longworth, and Sherman traps(Figure 3). Although somewhat labor-intensive,pitfall trap arrays may also be established to includemammals that are not regularly trapped using othertechniques (e.g., shrews).
Trap placement is a key element when collectingsamples. Various methods of trap placement can beutilized. These include, but are not limited to:
Sign method/Best set method Paceline method
typically produces higher trapping success than other
selected and marked, a landmark is identified toindicate the direction of the transect, and as the fieldmember walks the transect, the traps are placed atregular intervals along it.
The grid method is similar to the paceline method butinvolves a group of evenly spaced parallel transects ofequal lengths to create a grid. Traps are placed ateach grid node. The size of the grid is dependent onthe species to be captured and the type of study. Gridsof between 500 to 1,000 square meters containingapproximately 100 traps are common. If a grid isestablished in a forest interior, additional paralleltrapping lines may be established to cover the edgehabitat.
Regardless of the type of trapping used, habitatdisturbance should be kept to a minimum to achievemaximum trapping success. In most areas, a trappingsuccess of 10 percent is considered maximum but isoftentimes significantly lower (e.g., 2 to 5 percent).Part of this reduced trapping success is due to habitatdisturbance. Therefore, abiotic media samples (e.g.,soil, sediment, water) should be collected well inadvance of trapping efforts or after all trapping iscompleted. Trapping success also varies with timebut may increase over time with diminishing returns.In other words, extending the trapping period overseveral days may produce higher trapping success byallowing mammals that were once peripheral to thetrapping area to immigrate into the now mammal-depauperate area. These immigrants would not berepresentative of the trapping area. Therefore, atrapping period of 3 days is typically used to minimizethis situation.
Trapping success will also vary widely based on theavailable habitat, targeted species, season, and
13
geographical location of the site. When determiningtrap success objectives, it is important to keep in mindthe minimum sample mass/volume requirements forchemical residue studies.
3.1.1.3 Fish
Electrofishing, gill nets, trawl nets, seine nets, andminnow traps are common methods used for thecollection of fish. The selection of which technique touse is dependent on the species targeted for collectionand the system being sampled. In addition, there areother available fish netting and trapping techniquesthat may be more appropriate in specific areas. Aswith mammal trapping, disturbance in the area beingsampled should be kept to a minimum to ensurecollection success.
Electrofishing uses electrical currents to gather, slowdown, or immobilize fish for capture. An electricalfield is created between and around two submergedelectrodes that stuns the fish or alters their swimmingwithin or around the field. Depending on theelectrical voltage, the electrical pulse frequency, andthe fish species, the fish may swim towards one of theelectrodes, swim slowly enough to capture, or may bestunned to the point of immobilization. Thistechnique is most effective on fish with swimbladdersand/or shallow water since these fish will float to thesurface for easy capture.
Electrofishing can be done using a backpack-mountedelectroshocker unit, a shore-based unit, or from a boatusing either type. Electrofishing does not work insaline waters and can be ineffective in very soft water.Electrofishing is less effective in deep water wherethe fish can avoid the current. In turbid waters, it maybe difficult to see the stunned fish.
Gill netting is a highly effective passive collectiontechnique for a wide range of habitats. Because of itslow visibility under water, a gill net captures fish byentangling their gill plates as they attempt to swimthrough the area in which the gill net has been placedin. Unfortunately, this may result in fish to be injuredor killed due to further entanglement, predation, orfatigue. The size and shape of fish captured is relative to thesize and kind of mesh used in the net thus creatingbias towards a certain sized fish. These nets aretypically used in shallow waters, but may extend todepths exceeding 50 meters. The sampling areashould be free of obstructions and floating debris, and
14
provide little to no current. (Hurbert 1983) prior to establishing a sampling protocol.
Otter trawl netting is an active collection technique Sampling of herbaceous plants should be conductedthat utilizes the motion of a powered boat to drag a during the growing season of the species of interest.pocket-shaped net through a body of water. The net is Sampling of woody plants may be conducted duringsecured to the rear of a boat and pulled to gather any the growing or dormant season, however, most plantsorganisms that are within the opening of the pocket. translocate materials from the aboveground portionsThis pocket is kept open through the use of of the plant to the roots prior to dormancy. underwater plates on either side of the net that act askeels, spreading the mouth of the net open. Collection methods and sampling specifics may be
Seining is another active netting technique that trapsfish by encircling them with a long wall of netting.The top of the net is buoyed by floats and the bottomof the net is weighed down by lead weights or chains.Seine nets are effective in open or shallow waters withunobstructed bottoms. Beach or haul seines are usedin shallow water situations where the net extends tothe bottom. Purse seines are designed for applicationsin open water and do not touch the bottom (Hayes1983).
The use of minnow traps is a passive collectiontechnique for minnow-sized fish. The trap itself is ametal or plastic cage that is secured to a stationarypoint and baited to attract fish. Small funnel-shapedopenings on either end of the trap allow fish to swimeasily into it, but are difficult to locate for exit. Cage“extenders” or “spacers” that are inserted to lengthenthe cage, allow larger organisms such as eels, or for alarger mass of fish to be collected.
3.1.1.4 Vegetation
Under certain conditions, the analysis of the chemicalresidue in plants may be a highly effective method ofassessing the impacts of a site. The bioaccumulativepotential of plants varies greatly however, amongcontaminants, contaminant species, soil/sedimenttexture and chemistry, plant condition, and geneticcomposition of the plant. In addition to thisvariability, plants can translocate specificcontaminants to different parts of the plant. Forexample, one contaminant may tend to accumulate inthe roots of a plant, whereas a second contaminantmay tend to accumulate in the fruit of the same plant.In this scenario, the collection and analysis of a plantpart that normally does not receive translocatedmaterials would not result in a useful sample.Therefore, it is crucial to conduct a literature review
found in U.S. EPA/ERT SOP #2037, Terrestrial PlantCommunity Sampling; others are provided in Table4.1.
3.1.2 Sample Handling andPreparation
The animals or plants collected should be identified tospecies level or the lowest practical taxonomic level.Appropriate metrics (e.g., weight, animal body length,plant height) and the presence of any externalanomalies, parasites, and external pathologies shouldbe recorded. If compositing of the sample material isnecessary, it should be performed in accordance withthe study design.
Depending upon the study objectives, it may benecessary to isolate the contaminant levels in animaltissue from the contaminant levels in the food orabiotic matrices (e.g., sediment) entrained in thedigestive tract of the organism. This is an importantprocess in that it separates the contribution of twodistinct sources of contaminants to the next trophiclevel, thereby allowing the data user to recognize therelative importance of the two sources.
Clearing of the digestive tract (i.e., depuration) of theorganism must then be accomplished prior to thechemical analysis. The specific depuration procedureswill vary with each type of organism but all involveallowing the organism to excrete waste products in amanner in which the products may not be reingested,absorbed, or deposited back onto the organism.
Biological samples should be handled with caution toavoid personal injury, exposure to disease, parasites,or sample contamination. Personal protection such asgloves should be worn when handling animals andtraps to reduce the transfer of scents or oils from thehand to the trap, which could cause an avoidance
15
reaction in the targeted animals. if a problem exists. It should be noted that standard
Samples collected for biological evaluation must be often not adequate for tissue samples. Chapter 4.0treated in the same manner as abiotic samples (i.e., the provides details on detection limits and other QA/QCsame health and safety guidelines, decontamination parameters.protocols, and procedures for preventing cross-contamination must be adhered to). Biological The tissue analysis can consist of whole body residuesamples do require some extra caution in handling to analysis or analysis of specific tissues (i.e., fishavoid personal injury and exposure to disease, fillets). Although less frequently used in Superfund,parasites, and venoms/resins. The selection of tissues such as organs (e.g., kidney or liver) may besample containers and storage conditions (e.g., wet analyzed. The study endpoints will determineice) should follow the same protocols as abiotic whether whole body, fillet, or specific organ samplessamples. Refer to Chapter 4.0 for determination of are to be analyzed.holding times and additional quality assurance/qualitycontrol (QA/QC) handling procedures. Concurrent analyses should include a determination of
3.1.3 Analytical Methods
Chemical analytical methods for tissue analysis aresimilar to those for abiotic matrices (e.g., soil andwater), however, the required sample preparationprocedures (e.g., homogenization and subsampling) ofbiological samples are frequently problematic. Forexample, large bones, abundant hair, or high cellulosefiber content may result in difficult homogenization ofmammals and plants. Extra steps may be requiredduring sample cleanup due to high lipid (fat) levels inanimals tissue or high resin content in plant tissue.
Most tissue samples can be placed in a laboratoryblender with dry ice and homogenized at high speeds.The sample material is then left to sit to allow for thesublimation of the dry ice. Aliquots of thehomogenate may then be removed for the requiredanalyses.
The requirement for split samples or other QAsamples must be determined prior to sampling toensure a sufficient volume of sample is collected.Chapter 4.0 discusses the selection and use of QA/QCsamples.
The detection limits of the analytical parametersshould be established prior to the collection ofsamples. Detection limits are selected based on thelevel of analytical resolution that is needed to interpretthe data against the study objectives. For example, ifthe detection limit for a compound is 10 mg/kg but theconcentration in tissue which causes effects is 1mg/kg, the detection limit is not adequate to determine
laboratory detection limits for abiotic matrices are
percent lipids and percent moisture. Percent lipidsmay be used to normalize the concentration of non-polar organic contaminant data. In addition, the lipidcontent of the organisms analyzed can be used toevaluate the organism’s health. Percent moisturedeterminations allow the expression of contaminantlevels on the basis of wet or dry weight. Wet weightconcentration data are frequently used in food chainaccumulation models, and dry weight basis data arefrequently reported between sample locationcomparisons.
Histopathological Analysis
Histopathological analysis can be an effectivemechanism for establishing causative relationshipsdue to contaminants since some contaminants cancause distinct pathological effects. For example,cadmium causes visible kidney damage providingcausal links between contaminants and effects. Theseanalyses may be performed on organisms collected forresidue analysis. A partial necropsy performed on theanimal tissue may indicate the presence of internalabnormalities or parasites. The time frame andobjectives of the study determine if histopathologicalanalysis is warranted.
3.2 POPULATION/COMMUNITYRESPONSE STUDIES
Population/community response studies are acommonly utilized field assessment approach. Thedecision to conduct a population/community responsestudy is based on the type(s) of contaminants, the timeavailable to conduct the study, the type of
16
communities potentially present at the site, and the evaluation of the community structure may be used totime of year of the study. These studies are most assess overall water quality, evaluate the integrity ofcommonly conducted on non-time-critical or long- watersheds, or suggest the presence of an influence ofterm remediation-type site activities. During limited the community structure that is independent of watertime frame responses, however, a quality and habitat conditions. population/community survey or screening level studymay be useful for providing information about Because BMIs are a primary food source for manypotential impacts associated with a site. fish and other organisms, threats beyond the benthic
3.2.1 Terrestrial Vertebrate Surveys
Methods for determining adverse effects on terrestrialvertebrate communities are as follows: censusing orpopulation estimates, sex-age ratio determinations,natality/mortality estimations, and diversity studies.
True or accurate censuses are usually not feasible formost terrestrial vertebrate populations due to logisticaldifficulties. Estimations can be derived by countinga subset of organisms or counting and evaluating signssuch as burrows, nests, tracks, feces, and carcasses.Capture-recapture studies may be used to estimatepopulation size but are labor-intensive and usuallyrequire multiple-season sampling. If conductedimproperly, methods for marking captured organismsmay cause irritation or injury or interfere with thespecies’ normal activities.
Age ratios provide information on natality and rearingsuccess, age-specific reproductive rates, and mortalityand survival rates. Sex ratios indicate whether sexesare present in sufficient numbers and proportions fornormal reproductive activity.
Community composition (or diversity) can be assessedby species frequency, species per unit area, spatialdistribution of individuals, and numerical abundanceof species (Hair 1980).
3.2.2 Benthic MacroinvertebrateSurveys
Benth ic macroinvertebrate (BMI)population/community evaluations in small- tomedium- sized streams have been successfully usedfor approximately 100 years to document injury to theaquatic systems. There are many advantages to usingBMI populations to determine the potential ecologicalimpact associated with a site. Sampling is relativelyeasy, and equipment requirements are minimal. An
community can be inferred from the evaluation ofBMIs. Techniques such as rapid bioassessmentprotocols may be used as a tool to support this type offinding and inference. A more comprehensivediscussion of general benthological surveys may befound in U.S. EPA (1990).
Rapid bioassessment protocols are an inexpensivescreening tool used for determining if a stream issupporting or not supporting a designated aquatic lifeuse. The rapid bioassessment protocols advocate anintegrated assessment, comparing habitat andbiological measures with empirically definedreference conditions (U.S. EPA 1989a).
The three major components of a rapid bioassessmentessential for determining ecological impact are:
Biological survey Habitat assessment Physical and chemical measurements
As with all population/community evaluations, thehabitat assessment is of particular concern withrespect to representative sampling. Care must betaken to prevent bias during collection of the benthiccommunity resulting from sampling dissimilarhabitats. Similar habitats must be sampled to makevalid comparisons between locations. In addition tohabitat similarity, the sampling technique and level ofeffort at each location must be uniform to achieve anaccurate interpretation of results.
In the U.S. EPA Rapid Bioassessment Protocol(RBP), various components of the community andhabitat are evaluated, a numerical score is calculated,and the score is compared to predetermined values. Areview of the scores, together with habitat assessment
17
and the physical and chemical data, support a The selection of the most appropriate samplingdetermination of impact. U.S. EPA Reference (May, equipment for a particular site is based primarily on1989a) presents the calculation and interpretation of the habitat being sampled. This subsection is a briefscores. overview of the equipment available for the collection
Standard protocols, including the RBP, have been this document. For additional information, refer to thedeveloped to facilitate surveying BMIs to determine SOPs and methods manuals provided in Table 4.1, orimpact rapidly. These protocols use a standard consult an ecologist/biologist experienced in this typeapproach to reduce the amount of time spent of field collection.collecting and analyzing samples. Protocols rangefrom a quick survey of the benthos (Protocol I) to a Long-handled nets or a Surber sampler with a 0.5-detailed laboratory classification analysis (Protocol millimeter (mm) size mesh are common sampling netsIII). Protocol I may be conducted in several hours; for the collection of macroinvertebrates from a riffleProtocol II is more intensive and focuses on major area of a stream. Samples to be collected from deeptaxonomic levels; and Protocol III may require water gravel, sand, or soft bottom habitats such asnumerous hours to process each sample to a greater ponds, lakes, or rivers are more often sampled usinglevel of taxonomic and community assessment a small Ponar or Ekman dredge. Artificial substratesresolution. These protocols are used to determine are used in varying habitats when habitat matching iscommunity health and biological condition via problematic and/or native substrate sampling wouldtolerance values and matrices. They also create and not be effective. The most common types of artificialamend a historical data base that can be used for substrate samplers are multiple-plate samplers orfuture site evaluation. barbecue basket samplers.
3.2.2.2 General Benthological Surveys
Benthological surveys can be conducted with methodsother than those discussed in the RBP protocolsutilizing techniques discussed in the literature. Theoverall concept is generally the same as that used inthe RBP, but the specific sampling technique changesdepending on the habitat or community sampled.
3.2.2.3 Reference Stations
The use of a reference station is essential to determinepopulation/community effects attributable to a site.The use of a reference station within the study area ispreferable (upstream or at a nearby location otherwiseoutside the area of site influence). In some cases thisis not possible due to regional impacts, area-widehabitat degradation, or lack of a similar habitat. Inthese cases the use of population/community studiesshould be re-evaluated within the context of the siteinvestigation. If the choice is made to include thepopulation/community study, regional reference or aliterature-based evaluation of the community may beoptions.
3.2.2.4 Equipment for Benthic Surveys
of BMIs. Detailed procedures are not discussed in
The organisms to be taken to the laboratory foridentification or retained for archival purposes may beplaced in wide-mouthed plastic or glass jars (for easein removing contents) and preserved in 70 percent 2-propanol (isopropyl alcohol) or ethyl alcohol(ethanol), 30 percent formalin, or Kahle's solution.Refer to methods manuals for detailed information onsample handling and preservation.
3.2.3 Fish Biosurveys
3.2.3.1 Rapid Bioassessment Protocolsfor Fish Biosurveys
RBPs IV and V are two levels of fish biosurveyanalyses. Protocol IV consists of a questionnaire tobe completed with the aid of local and state fisheriesexperts. Protocol V is a rigorous analysis of the fishcommunity through careful species collection,identification, and enumeration. This level iscomparable to the macroinvertebrate Protocol III (seeSection 3.2.2.1) in effort. Detailed information onboth protocols can be found in Rapid BioassessmentsProtocols for Use In Streams and Rivers (U.S. EPA1989a).
3.3 TOXICITY TESTS
18
Toxicity tests evaluate the relative threat of exposure observed mortality in the site soil treatments isto contaminated media (e.g., soil, sediment, water) in statistically compared to control and site referencea controlled setting. These tests are most often treatments, inferences regarding the toxicity of theconducted in the laboratory, although they may be contaminant concentrations in the site soil treatmentsconducted in the field as well. These tests provide an may be drawn.estimate of the relationship between the contaminatedmedium, the level of contaminant, and the severity of Example No. 2 (surface water)adverse effects under specific test parameters.Toxicity tests are categorized by several parameterswhich include duration of the test, test species, lifestage of the organism, test end points, and othervariables.
The collection of the actual samples on which the testsare to be conducted follow the same protocols ascollection of representative samples for chemicalanalyses. Typically, a subsample of the mediacollected for toxicity testing is submitted for chemicalanalyses. The use of a concentration gradient fortoxicity testing is frequently desired to establish aconcentration gradient within the test. This alsoeliminates the need to sample all the locations at asite. The specific methods to be followed for toxicitytests are described in detail in U.S. EPA'sCompendium of ERT Toxicity Testing Procedures,OSWER Directive 9360.4-08, EPA/540/P-91-009(U.S. EPA 1991a), as well as existing SOPs listed inTable 4.1. These published procedures addresssample preservation, handling and storage, equipmentand apparatus, reagents, test procedures, calculations,QA/QC, and data validation. The practical uses ofvarious toxicity tests, including examples of acute andchronic tests, are described next. Each sectionincludes an example toxicity test.
3.3.1 Examples Of Acute ToxicityTests
Example No. 1 (solid-phase soil)
Laboratory-raised earthworms are placed 30 perreplicate into test chambers containing site soil. Alaboratory control and a site reference treatment areestablished to provide a means for comparison of theresulting data set. Depending on the anticipatedcontaminant concentrations in the site soil, the soilmay be used in its entirety or diluted with control orsite reference soil. The test chambers are examineddaily for an exposure period of 14 days and thenumber dead organisms is tabulated. When the
Fathead minnows (Pimephales promelas) are exposedfor 96 hours in aerated test vessels containing surfacewater from sampling locations representing aconcentration gradient. The mortality of theorganisms is recorded at the end of the exposureperiod and statistically compared to control and sitereference treatments. Statistically significantdifferences between treatments may be attributed tothe varying contaminant concentrations.
3.3.2 Examples of ChronicToxicity Tests
Example No. 1 (surface water)
Fathead minnow larvae (Pimephales promelas) areexposed for 7 days to surface water collected fromsampling locations that represent a concentrationgradient. Each replicate consists of 20 individuals ofthe same maturity level. The test vessels are aeratedand the water is replaced daily. The fish, whichshould have remained alive throughout the exposureperiod, are harvested and measured for body lengthand body weight. These results represent growth ratesand are statistically compared to the control and sitereference treatments to infer the toxicological effectsof the contaminant concentrations.
Example No. 2 (sediment)
Midge (Chironomus sp.) larvae are exposed for 10days to sediment, overlain with site reference water,and collected from sampling locations that representa concentration gradient. Each replicate consists of200 individuals of the same maturity level (1st instar).The test vessels are aerated and the water is replaced
19
daily. At the end of the exposure period, the larvaeare removed from the test vessels and measured forbody length and body weight.
The organisms are then returned to the test vessels andallowed to mature to the adult stage. An emergencetrap is placed over the test vessel and the number ofemerging adults is recorded. These results, as well asthe length and weight results, are statisticallycompared to the control and site reference treatmentsto infer the toxicological effects of the contaminantconcentrations.
20
Figure 2: Common Mammal Traps
Havahart Trap
Longworth live trap
(A) (B)Folding (A) and non-folding (B) Sherman live traps
21
TABLE 1Reference List of Standard Operating Procedures -- Ecological Sampling Methods
SOP/Method No. Source Procedure/Method Title Publication No.
SOP No. 1820 ERTC Tissue Homogenization Procedure (in development)
SOP No. 1821 ERTC Semi-Volatiles Analysis of Tissue Samples by GC/MS (in development)
SOP No. 1822 ERTC Pesticides/PCB Analysis of Tissue Samples by GC/ECD (in development)
SOP No. 1823 ERTC Microwave Digestion and Metals Analysis of Tissue Samples (in development)
SOP No. 2020 ERTC OSWER EPA/540/P-91/0097-Day Standard Reference Toxicity Test Using Larval Fathead Minnows Pimephales promelas
SOP No. 2021 ERTC OSWER EPA/540/P-91/00924-Hour Range Finding Test Using Daphnia magna or Daphnia pulex
SOP No. 2022 ERTC OSWER EPA/540/P-91/00996-Hour Acute Toxicity Test Using Larval Pimephales promelas
SOP No. 2023 ERTC OSWER EPA/540/P-91/00924-Hour Range Finding Test Using Larval Pimephales promelas
SOP No. 2024 ERTC OSWER EPA/540/P-91/00948-Hour Acute Toxicity Test Using Daphnia magna or Daphnia pulex
SOP No. 2025 ERTC OSWER EPA/540/P-91/0097-Day Renewal Toxicity Test Using Ceriodaphnia dubia
SOP No. 2026 ERTC OSWER EPA/540/P-91/0097-Day Static Toxicity Test Using Larval Pimephales promelas
SOP No. 2027 ERTC OSWER EPA/540/P-91/00996-Hour Static Toxicity Test Using Selenastrum capricornutum
SOP No. 2028 ERTC OSWER EPA/540/P-91/00910-Day Chronic Toxicity Test Using Daphnia magna or Daphnia pulex
SOP No. I-001 ERTC (in development)15-Day Solid Phase Toxicity Test Using Chironomus tentans
SOP No. I-002 ERTC (in development)28-Day Solid Phase Toxicity Test Using Hyalella azteca
Greene et al.(1989) - EPA 600/3-88-02914-Day Acute Toxicity Test Using adult Eisenia andrei (earthworms)
SOP No. I-005 ERTC Field Processing of Fish (in development)
SOP No. 2029 ERTC Small Mammal Sampling and Processing (in development)
SOP No. 2032 ERTC Benthic Sampling (in development)
SOP No. 2033 ERTC Plant Protein Determination (in development)
SOP No. 2034 ERTC Plant Biomass Determination (in development)
SOP No. 2035 ERTC Plant Peroxidase Activity Determination (in development)
SOP No. 2036 ERTC Tree Coring and Interpretation (in development)
SOP No. 2037 ERTC Terrestrial Plant Community Sampling (in development)
22
4.0 QUALITY ASSURANCE/QUALITY CONTROL
4.1 INTRODUCTION
The goal of representative sampling is to yieldquantitative data that accurately depict site conditionsin a given period of time. QA/QC measures specifiedin the sampling procedures minimize and quantify theerror introduced into the data.
Many QA/QC measures are dependant on QA/QCsamples submitted with regular field samples.QA/QC samples evaluate the three following types ofinformation: (1) the degree of site variation; (2)whether samples were cross-contaminated duringsampling and sample handling procedures; and (3)whether a discrepancy in sample results is attributableto field handling, laboratory handling, or analysis. Foradditional information on QA objectives, refer to U.S.EPA Quality Assurance/Quality Control (QA/QC)Guidance for Removal Activities, EPA/540/G-90/004,April 1990.
4.2 DATA CATEGORIES
The U.S. EPA has established a process of dataquality objectives (DQOs) which establish what type,quantity, and quality of environmental data areappropriate for their intended application. In its DQOprocess, U.S. EPA has defined two broad categoriesof data: screening and definitive.
Screening data are generated by rapid, less precisemethods of analysis with less rigorous samplepreparation. Sample preparation steps may berestricted to simple procedures such as dilution witha solvent, rather than an elaborate extraction/digestionand cleanup. At least 10 percent of the screening dataare confirmed using the analytical methods andQA/QC procedures and criteria associated with The initial selection of a habitat is a potential sourcedefinitive data. Screening data without associated of bias in biological sampling, which might eitherconfirmation data are not considered to be data of exaggerate or mask the effects of hazardousknown quality. To be acceptable, screening data must substances in the environment. In a representativeinclude the following: sampling scheme, habitat characteristics such as plant
chain of custody degree of shading should be similar at all locations,initial and continuing calibration including the reference location. The same individualanalyte identification should select both the test site and the control andanalyte quantification background site to minimize error in comparing site
Streamlined QC requirements are the definingcharacteristic of screening data.
Definitive data are generated using rigorous analyticalmethods (e.g., approved U.S. EPA referencemethods). These data are analyte-specific, withconfirmation of analyte identity and concentration.Methods produce tangible raw data (e.g.,chromatograms, spectra, digital values) in the form ofhard-copy printouts or computer-generated electronicfiles. Data may be generated at the site or at an off-site location as long as the QA/QC requirements aresatisfied. For the data to be definitive, eitheranalytical or total measurement error must bedetermined. QC measures for definitive data containall the elements associated with screening data, butalso include trip, method, and rinsate blanks; matrixspikes; performance evaluation samples; and replicateanalyses for error determination.
For more details on these data categories, refer toU.S. EPA Data Quality Objectives Process ForSuperfund, EPA/540/R-93/071, Sept 1993.
4.3 SOURCES OF ERROR
The four most common potential sources of data errorin biological sampling:
conditions. contamination, sample containers must be compatible
Standardized procedures for habitat assessment andselection also help minimize design error. Theselection of an inappropriate species may introducean error into the representative sampling design. Thiserror can be minimized by selecting a species that isrepresentative of the habitat and whose life-cycle iscompatible with the timing of the study. In addition,migratory or transient species should be avoided.
4.3.2 Sampling Methodology
Sampling methodology and sample handling homogenized as a whole. Homogenization proceduresprocedures may contain possible sources of error such may vary by site objective. Tissue homogenatesas unclean sample containers, improper sample should be stored away from light and kept frozen at -handling, and improper shipment procedures. 20 C. Tissue homogenates are prepared in theProcedures for sample collection and handling should laboratory and could be subject to cross-be standardized to allow easier identification of contamination.potential error. Follow SOPs or establishedprocedures to ensure that all sampling techniques areperformed consistently despite different samplingteams, dates, or locations. Use QA/QC samples(Section 4.4) to evaluate errors due to impropersampling methodology and sample handlingprocedures. These guidelines should apply tobiological as well as soil, sediment, and watersampling.
During fishing operations, the sampling crew canprevent habitat disturbance by staying out of the waterbody near the sampling locations. The use of anyparticular technique may introduce judgment error intothe sampling regimen if done improperly. For alltechniques, sampling should be conducted from thedownstream location to the upstream location to avoidcontamination of the upstream stations. Datacomparability is maintained by using similarcollection methods and sampling efforts at all stations.
Rapid bioassessments in the field should include twoQA/QC procedures: 1) collection of replicate samplesat stations to check on the accuracy of the collectioneffort, and 2) repeat a portion (typically 10%) recountand reidentification for accuracy.
For tissue analyses, tools and other samplingequipment should be dedicated to each sample, ormust be decontaminated between uses. To avoid
with the intended tissue matrix and analysis.
4.3.3 Sample Heterogeneity
Tissues destined for chemical analysis should behomogenized. Ideally, tissue sample homogenatesshould consist of organisms of the same species, sex,and development stage and size since these variablesall affect chemical uptake. There is no universal SOPfor tissue homogenization; specific proceduresdepend on the size and type of the organism. Forexample, tissues must be cut from fur and shell-bearing organisms as they cannot be practically
Refer to U.S. EPA/ERT SOP #1820, TissueHomogenization Procedures for further details ontissue homogenization procedures.
4.3.4 Sample Analysis
Analytical procedures may introduce errors fromlaboratory cross-contamination, extraction difficulties,and inappropriate methodology. Fats naturally presentin tissues may interfere with sample analysis orextraction and elevate detection limits. Detectionlimits in the tissue samples must be the same as in thebackground tissue samples if a meaningfulcomparison is to be made. To minimize thisinterference, select an extraction or digestionprocedure applicable to tissue samples.
Because many compounds (e.g., chlorinatedhydrocarbons) concentrate in fatty tissues, a percentlipid analysis is necessary to normalize results amongsamples. Lipid recoveries vary among differentanalytical methods; percent lipid results for samplesto be normalized and compared must be generated bythe same analytical method. Select a lipid analysisbased on the objective of the study (see referencesHerbes and Allen [1983] and Bligh and Dyer 1959).Sample results may be normalized on a wet-weightbasis. If sample results are to be reported on a dry-weight basis, instruct the analytical laboratory to
24
report the percent moisture content for each sample. replicates for biological samples, however, biological
Appropriate sample preservation prevents loss of referred to as replicates. In this case, the biologicalcompounds and decomposition of tissues before replicates are used to determine the variabilityanalysis. Consult the appropriate SOP, analytical associated with heterogeneity within a biologicalmethod, or designated laboratory contact to confirm population. Field replicates may be sent to two orholding times for tissue samples. more laboratories or to the same laboratory as unique
Tissue samples destined for sorting and identification(e.g., benthic macroinvertebrates, voucher fish) should Field replicates may be used to determine total errorbe preserved in isopropyl or ethyl alcohol, formalin, or for critical samples with contaminant concentrationsKahle's solution. Preservation in these solvents near the level that determines environmental impact.precludes any chemical analysis. To determine error, a minimum of eight replicate
4.4 QA/QC SAMPLES
QA/QC samples are collected at the site as preparedby the laboratory. Analysis of the QA/QC samplesprovides information on the variability and usability ofbiological sampling data, indicates possible fieldsampling or laboratory error, and provides a basis forfuture validation and usability of the analytical data.The most common field QA/QC samples are fieldreplicates, reference, and rinsate blank samples. Themost common laboratory QA/QC samples areperformance evaluation (PE), matrix spike (MS), andmatrix spike duplicate (MSD) samples. QA/QCresults may suggest the need for modifying samplecollection, preparation, handling, or analyticalprocedures if the resultant data do not meet site-specific quality assurance objectives.
Refer to data validation procedures in U.S. EPAQuality Assurance/Quality Control (QA/QC)Guidance for Removal Activities, EPA/540/G-90/004,April 1990, for guidelines on utilizing QA/QCsamples.
4.4.1 Replicate Samples
Field Replicates
Field replicates for solid media are samples obtainedfrom one sampling point that are homogenized,divided into separate containers, and treated asseparate samples throughout the remaining samplehandling and analytical processes. Field replicates foraqueous samples are samples obtained from onelocation that are homogenized and divided intoseparate containers. There are no "true" field
samples collected from the same station are typically
samples.
samples is recommended for valid statistical analysis.For total error determination, samples should beanalyzed by the same laboratory. The higherdetection limit associated with composite samplesmay limit the usefulness of error determination.
NOTE: A replicate biological sample may consist ofmore than a single organism in those cases where thespecies mass is less than the mass required by theanalytical procedure to attain required detection limits.This variability in replicate biological samples isindependent of the variability in analytical procedures.
Toxicity Testing Replicates
For sediment samples, at least 3 replicate treatmentsshould be conducted to determine variability betweentests. The function of these replicates is to determinethe variability of the test organism population withineach treatment. This assumes the sample matrixexhibits a uniform concentration of the contaminantsof concern within each treatment. Large variabilitymay indicate a problem with the test procedures ororganisms or lack of contaminant homogeneity withinthe sample matrix.
Site-Specific Examples of the Use of Replicates
Example No. 1
Two contaminant sources were identified at an activecopper smelting facility. The first area was a slag pilecontaining high levels of copper suspected ofmigrating into the surrounding surface runoffpathways, subsequently leaching into the surfacewater of a surrounding stream system. The secondarea was the contaminated creek sediment that was
25
present in the drainage pathway of the slag pile. location) and evaluated for various quantitative
Whole-phase sediment toxicity tests were selected to were to determine the spatial variability in the streamevaluate the toxicity associated with the copper levels among the three areas within each sampling location.in the stream sediments. Sediment was collected at Community structure, diversity indices, taxonomiceach sampling location (six locations total) to provide evenness, an evaluation of the function feedingthe testing laboratory with sufficient sample volume groups, and statistical analyses were performed on theto perform these evaluations. Ten-day static renewal data set.tests using the amphipod, Hyalella azteca, and themidge, Chironomus tentans, were chosen. Thetoxicity test utilized four “replicates” per samplinglocation (or treatment), each replicate containingfifteen organisms. The purpose of these replicateswas to determine the variability within the testorganism population within each treatment.
The results reported mean survival for Hyalella aztecain the contaminated sediment (8 to 50 percent) to besignificantly lower than survival in theuncontaminated reference sediment (85 percent).Similarly, mean survival for Chironomus tentans inthe contaminated sediment (0 to 63 percent) wassignificantly lower than survival in theuncontaminated reference sediment (83 percent).
Example No. 2
An inactive manufacturing facility had stored its stockcompounds in unprotected piles for a number of years,resulting in DDT contamination of the adjacentwatershed. DDT contamination in a stream locatedadjacent to the site extended from the manufacturingfacility to approximately 27 miles downstream.
A field study was designed to quantitatively determineif the levels of DDT in the water and sediment in thisstream were resulting in an adverse ecological impact.This was accomplished through the examination ofseveral in situ environmental variables in conjunctionwith laboratory analyses. Water, sediment, andresident biota were collected and submitted forvarious physical and chemical determinations.Additional sediments were secured and utilized fortoxicity testing with three surrogate species. Finally,the benthic invertebrate community was sampled andthe structure and function of this segment of theaquatic ecosystem evaluated.
Benthic invertebrates were collected from three areasat each sampling location (i.e., three “replicates” per
community metrics. The purpose of these replicates
Qualitative and statistical comparison of the resultsbetween the contaminated areas and theuncontaminated reference indicated that the benthicinvertebrate community was adversely affecteddownstream of the site compared to the upstreamreference. Taxonomic and functional diversity variedinversely with DDT levels in sediment and water.These results were further substantiated by thetoxicity evaluation results.
Example No. 3
Phase I and II Remedial Investigation and FeasibilityStudies (RIFS) have indicated that the soilssurrounding an industrial and municipal wastedisposal site were contaminated with PCBs. Apreliminary site survey revealed the presence of smallmammal habitat and mammal signs in the naturalareas adjacent to the site as well as an area thatappeared to be outside of the site’s influence (i.e., apotential reference area). A site investigation wassubsequently conducted to determine the levels ofPCBs accumulating into the resident mammalcommunity from contact with the PCB-contaminatedsoil.
Three small mammal trapping areas were identifiedfor this site. Two areas were located in PCB-contaminated areas, the third area was a reference.Trapping grids were established in each areaconsisting of 100 traps of various design. Six soilsamples were also collected from each trapping areato characterize the levels of PCBs associated with theanticipated captured mammals.
A total of 32 mammals were collected at this site.Twelve were collected from each on-site area and sixwere collected from the reference area. All capturedmammals were submitted for whole body analysis ofPCBs. Mean PCB concentrations in the mammalswere as follows: on-site areas (1250 and 1340 g/kg,wet weight); reference area (490 g/kg, wet weight).
26
A one-way analysis of variance was conducted on the samples collected that day. When dedicated cuttingdata set treating each animal in an area as a tools or other sampling equipment are not used,“replicate” (i.e., 12 replicates from each on-site area collect one rinsate blank per device per day. and 6 replicates from the reference). The results of thestatistical analyses indicated that there was astatistically significant difference between on-site andreference area PCB levels in the mammals (p<0.10).Therefore, in this example, there were no analyticalreplicates since each individual mammal wasanalyzed. However, each mammal represented astatistical replicate within each trapping area.
4.4.2 Collocated Samples
A collocated sample is collected from an areaadjoining a field sample to determine variability of thematrix and contaminants within a small area of thesite. For example, collocated samples for chemistryanalysis split from the sample collected for thetoxicity test are collected about one-half to three feetaway from the field sample location. Plants collectedfrom within the same sampling plot may beconsidered collocated. Collocated samples areappropriate for assessing variability only in a smallarea, and should not be used to assess variabilityacross the entire site or for assessing error.
4.4.3 Reference Samples
Reference biological samples may be taken from areference area outside the influence of the site.Comparison of results from actual samples andsamples from the reference area may indicate uptake,body burden, or accumulation of chemicals on the site.The reference area should be close to the site. Itshould have habitats, size and terrain similar to thesite under investigation. The reference site need notbe pristine. Biological reference samples should be ofthe same species, sex, and developmental stage as thefield site sample.
4.4.4 Rinsate Blank Samples
A rinsate blank is used to assess cross-contaminationfrom improper equipment decontaminationprocedures. Rinsate blanks are samples obtained byrunning analyte-free water over decontaminatedsampling equipment. Any residual contaminationshould appear in the rinsate data. Analyze the rinsateblank for the same analytical parameters as the field
4.4.5 Field Blank Samples
Field blanks are samples prepared in the field usingcertified clean water or sand that are then submitted tothe laboratory for analysis. A field blank is used toevaluate contamination or error associated withsampl ing methodology, preservation,handling/shipping, and laboratory procedures. Ifappropriate for the test, submit one field blank perday.
4.4.6 Trip Blank Samples
Trip blanks are samples prepared prior to going intothe field. They consist of certified clean water orsand, and they are not opened until they reach thelaboratory. Use trip blanks when samples are beinganalyzed for volatile organics. Handle, transport, andanalyze trip blanks in the same manner as the othervolatile organic samples collected that day. Tripblanks are used to evaluate error associated withsampling methodology, shipping and handling, andanalytical procedures, since any volatile organiccontamination of a trip blank would have to beintroduced during one of those procedures.
A performance evaluation (PE) sample evaluates theoverall error from the analytical laboratory and detectsany bias in the analytical method being used. PEsamples contain known quantities of target analytesmanufactured under strict quality control. They areusually prepared by a third party under a U.S. EPAcertification program. The samples are usuallysubmitted "blind" to analytical laboratories (thesampling team knows the contents of the samples, butthe laboratory does not). Laboratory analytical error(usually bias) may be evaluated by the percentrecoveries and correct identification of thecomponents in the PE sample.
4.4.8 Controls
27
Analytical Laboratory Control Samples are analyzed, the data obtained may also be used to
A chemical analytical laboratory control sample Analyze one MS/MSD pair to assess bias for every 10(LCS) contains quantities of target analytes known to samples, and use the average percent recovery for thethe laboratory and are used to monitor "controlled" pair. To assess precision, analyze at least eight matrixconditions. LCSs are analyzed under the same sample spike replicates from the same sample, and determinepreparation, reagents, and analytical methods as the the standard deviation and the coefficient of variation.field samples. LCS results can show bias and/orvariability in analytical results.
Toxicity Testing Control Groups
In toxicity tests, a laboratory reference toxicanttreatment and a control treatment are both typicallyutilized in addition to a site reference treatment. Thistest involves exposing the test organism population toa standardized reference toxicant at a standardizeddose, then comparing the response to historicallaboratory records for that culture. The mortalityresults of the newly conducted reference toxicant testshould be similar to the historical results. This isconducted to reveal if the generation(s) in the presentculture is viable for use in the toxicity test, or if theculture has grown resistant or intolerant to the toxicantover time. Therefore, a laboratory reference toxicanttest should be conducted prior to the testing of the sitematrices.
In contrast, a laboratory control test is conductedsimultaneously with the testing of the site matrices.This treatment identifies mortality factors that areunrelated to site contaminants. This is accomplishedby exposing the test organism population to a cleandilution water and/or a clean laboratory substrate.
4.4.9 Matrix Spike/Matrix SpikeDuplicate Samples
Matrix spike and matrix spike duplicate samples(MS/MSDs) are supplemental volumes of field-collected samples that are spiked in the laboratorywith a known concentration of a target analyte todetermine matrix interference. Matrix interference isdetermined as a function of the percent analyterecovery in the sample extraction. The percentrecovery from MS/MSDs indicates the degree towhich matrix interferences will affect theidentification and/or quantitation of a substance.MS/MSDs can also be used to monitor laboratoryperformance. When two or more pairs of MS/MSDs
evaluate error due to laboratory bias and precision.
See the U.S. EPA Quality Assurance/ Quality Control(QA/QC) Guidance for Removal Activities (April1990) for directions on calculating analytical error.
MS/MSDs are a required QA/QC element of thedefinitive data objectives. MS/MSDs shouldaccompany every 10 samples. Since the MS/MSDsare spiked field samples, sufficient volume for threeseparate analyses must be provided. Organic analysisof tissue samples is frequently subject to matrixinterferences which causes biased analytical results.Matrix spike recoveries are often low or show poorprecision in tissue samples. The matrix interferenceswill be evident in the matrix spike results. Althoughmetals analysis of tissue samples is usually notsubject to these interferences, MS/MSD samplesshould be utilized to monitor method and laboratoryperformance. Some analytical parameters such aspercent lipids, organic carbon, and particle-sizedistribution are exempt from MS/MSD analyses.
4.4.10 Laboratory DuplicateSamples
A laboratory duplicate is a sample that undergoespreparation and analysis twice. The laboratory takestwo aliquots of one sample and treats them as if theywere separate samples. Comparison of data from thetwo analyses provides a measure of analyticalreproducibility within a sample set. Discrepancies induplicate analyses may indicate poor homogenizationin the field or other sample preparation error, whetherin the field or in the laboratory. However, duplicateanalyses are not possible with most tissue samplesunless a homogenate of the sample is created.
4.5 Data Evaluation
4.5.1 Evaluation of AnalyticalError
Analytical error becomes significant in decision-
28
making as sample results approach the level ofenvironmental impact. The acceptable level of erroris determined by the intended use of the data andlitigation concerns. To be definitive, analytical datamust have quantitative measurement of analyticalerror with PE samples and replicates. The QAsamples identified in this section can indicate avariety of qualitative and quantitative sampling errors.Due to matrix interferences, causes of error may bedifficult to determine in organic analysis of tissuesamples.
4.5.2 Data Validation
Data from tissue sample analysis may be validatedaccording to the Contract Laboratory ProgramNational Functional Guidelines (U.S. EPA 1994) andaccording to U.S. EPA Quality Assurance/QualityControl (QA/QC) Guidance for Removal Activities,EPA/540/G-90/004, April 1990. Validation of organicdata may require an experienced chemist due tocomplexity of tissue analysis.
29
5.0 DATA ANALYSIS AND INTERPRETATION
5.1 INTRODUCTION
The main objective of biological surveys conducted atSuperfund sites is the assessment of site-related threator effect. For many types of biological data (e.g.,levels of contaminants in organisms collected on siteand from a reference location), hypotheses are testedto determine the presence or absence of an effect. Forsome biological tests (e.g., benthic macroinvertebratestudies, toxicity tests), the data analysis andinterpretation process is outlined in existingdocuments (U.S. EPA November 1990, U.S. EPAMay 1996). For many Superfund ecologicalassessments, a weight-of-evidence approach is used tointerpret the results of different studies or testsconducted at a site.
The statistical tests and methods that will be Large data sets are often summarized using a fewemployed should be based on the objective of the data descriptive statistics. Two important features of a setevaluation. These components should be outlined in of data are the central tendency and the spread.the Work Plan or Sampling and Analysis Plan. This Statistics used to describe central tendency include theprocess will help focus the study to ensure that the arithmetic mean, median, mode and geometric mean.appropriate type and number of samples are collected. Spread or dispersion in a data set refers to the
5.2 DATA PRESENTATION ANDANALYSIS
5.2.1 D a t a P r e s e n t a t i o nTechniques
In many cases, before descriptive statistics arecalculated from a data set, it is useful to try variousgraphical displays of the raw data. The graphicaldisplays help guide the choice of any necessarytransformations of the data set and the selection ofappropriate statistics to summarize the data. Sincemost statistical procedures require summary statisticscalculated from a data set, it is important that thesummary statistics represent the entire data set. Forexample, the median may be a more appropriatemeasure of central tendency than the mean for a dataset that contains outliers. Graphical display of a dataset could indicate the need to log transform data sothat symmetry indicates a normal distribution. Four ofthe most useful graphical techniques are describednext.
A histogram is a bar graph that displays thedistribution of a data set, and provides informationregarding the location of the center of the sample,amount of dispersion, extent of symmetry, andexistence of outliers. Stem and leaf plots are similarto histograms in that they provide information on thedistribution of a data set; however they also containinformation on the numeric values in the data set.Box and whisker plots can be used to compare two ormore samples of the same characteristic (e.g., streamIBI values for two or more years). Scatter plots are auseful method for examining the relationship betweentwo sets of variables. Figure 4 illustrates the fourgraph techniques described previously.
5.2.2 Descriptive Statistics
variability in the observations about the center of thedistribution. Statistics used to describe datadispersion include range and standard deviation.Methods for calculating descriptive statistics can befound in any statistics textbook, and many softwareprograms are available for statistical calculations.
5.2.3 Hypothesis Testing
Biological studies are conducted at Superfund sites todetermine adverse effects due to site-related factors.For many types of biological data, hypothesis testingis the statistical procedure used to evaluate data.Hypothesis testing involves statistically evaluating aparameter of concern, such as the mean or median, ata specified probability for incorrectly interpreting theanalysis results. In conventional statistical analysis,hypothesis testing for a trend or effect is based on anull hypothesis. Typically, the null hypothesis ispresumed when there is no trend or effect present. Totest this hypothesis, data are collected to estimate aneffect. The data are used to provide a sample estimateof a test statistic, and a table for the test statistic isconsulted to determine how unlikely the observed
30
value of the statistic is if the null hypothesis is true. Preliminary screening value results are interpreted byIf the observed value of the test statistic is unlikely, comparison of historical and/or new site analyticalthe null hypothesis is rejected. In ecological risk data against literature toxicity values. Thisassessment, a hypothesis is a question about the comparison will suggest if the probability of riskrelationship among assessment endpoints and their exists and whether additional evaluation is desired.predicted responses when exposed to contaminants.The most basic hypothesis that is applicable tovirtually all Superfund sites is that site-related If the evaluation is pursued to an ecological riskcontaminants are causing adverse effects of the assessment, mathematical models, such as the Hazardassessment endpoint(s). Quotient method, are used to evaluate the site data
5.3 DATA INTERPRETATION
5.3.1 Chemical Residue Studies
Chemical residue data may be evaluated in two ways.First, the contaminant concentrations by themselvesprovide evidence of bioaccumulation and probablefood chain transfer of the contaminants, and an overallpicture of the distribution of contaminants in thebiological community. Second, the residue data maybe evaluated against literature residue values that areknown to cause no effect or an adverse effect in theorganism.
5.3.2 Populat ion/CommunityStudies
The interpretation of population/community data isextensive, therefore, the reader is referred to a detailedtreatment in U.S. EPA (November 1990), U.S. EPA(1989a), Karr et al. (1986), and other literature.
5.3.3 Toxicity Testing
Measurement endpoints obtained in toxicity tests aregenerally compared to results from a laboratorycontrol and a reference location sample to determinewhether statistically significant differences exist. Ifsignificant effects (e.g., mortality, decreasedreproduction) are observed, additional statisticalanalyses can be run to determine whether observedeffects correlate with measured contaminant levels.The reader is referred to a detailed treatment in ASTM(1992), U.S. EPA (May 1988), U.S. EPA (March1989b).
5.3.4 Risk Calculation
against literature toxicity values. Based on the type ofmodel used, the results can be extrapolated to suggestthe presence of ecological risk.
APPENDIX A - CHECKLIST FOR ECOLOGICAL ASSESSMENT/SAMPLING
Introduction
The checklist that follows provides guidance in making observations for an ecological assessment. It is not intendedfor limited or emergency response actions (e.g., removal of a few drums) or for purely industrial settings with nodischarges. The checklist is a screening tool for preliminary site evaluation and may also be useful in planning moreextensive site investigations. It must be completed as thoroughly as time allows. The results of the checklist willserve as a starting point for the collection of appropriate biological data to be used in developing a response action.It is recognized that certain questions in this checklist are not universally applicable and that site-specific conditionswill influence interpretation. Therefore, a site synopsis is requested to facilitate final review of the checklist by atrained ecologist.
Checklist
The checklist has been divided into sections that correspond to data collection methods and ecosystem types. Thesesections are:
I. Site Description
IA. Summary of Observations and Site Setting
II. Terrestrial Habitat Checklist
IIA. Wooded IIB. Shrub/Scrub IIC. Open Field IID. Miscellaneous
III. Aquatic Habitat Checklist -- Non-Flowing Systems
IV. Aquatic Habitat Checklist -- Flowing Systems
V. Wetlands Habitat Checklist
33
Checklist for Ecological Assessment/Sampling
I. SITE DESCRIPTION
1. Site Name: ____________________________________________________
3. What is the approximate area of the site? __________________________________________
4. Is this the first site visit? yes no If no, attach trip report of previous site visit(s), if available.
Date(s) of previous site visit(s):________________________________________.
5. Please attach to the checklist USGS topographic map(s) of the site, if available.
6. Are aerial or other site photographs available? yes no If yes, please attach any available photo(s) to thesite map at the conclusion of this section.
34
7. The land use on the site is: The area surrounding the site is: ____________________ mile radius
8. Has any movement of soil taken place at the site? yes no. If yes, please identify the most likely causeof this disturbance:
_____ Agricultural Use _____ Heavy Equipment _____ Mining
_____ Natural Events _____ Erosion _____ Other
Please describe:
35
9. Do any potentially sensitive environmental areas exist adjacent to or in proximity to the site, e.g., Federal andState parks, National and State monuments, wetlands, prairie potholes? Remember, flood plains andwetlands are not always obvious; do not answer "no" without confirming information.
Please provide the source(s) of information used to identify these sensitive areas, and indicate their generallocation on the site map.
10. What type of facility is located at the site?
Chemical Manufacturing Mixing Waste disposal
Other (specify)_____________________________________________________
11. What are the suspected contaminants of concern at the site? If known, what are the maximum concentrationlevels?
12. Check any potential routes of off-site migration of contaminants observed at the site:
Swales Depressions Drainage ditches
Runoff Windblown particulates Vehicular traffic
Other (specify)__________________________________________________________________
13. If known, what is the approximate depth to the water table?_________________________________
14. Is the direction of surface runoff apparent from site observations? yes no If yes, to which of thefollowing does the surface runoff discharge? Indicate all that apply.
Surface water Groundwater Sewer Collection impoundment
15. Is there a navigable waterbody or tributary to a navigable waterbody? yes no
36
16. Is there a waterbody anywhere on or in the vicinity of the site? If yes, also complete Section III: AquaticHabitat Checklist -- Non-Flowing Systems and/or Section IV: Aquatic Habitat Checklist -- Flowing Systems.
yes (approx. distance____________________) no
17. Is there evidence of flooding? yes no Wetlands and flood plains are not always obvious; do notanswer "no" without confirming information. If yes, complete Section V: Wetland Habitat Checklist.
18. If a field guide was used to aid any of the identifications, please provide a reference. Also, estimate the timespent identifying fauna. [Use a blank sheet if additional space is needed for text.]
19. Are any threatened and/or endangered species (plant or animal) known to inhabit the area of the site? yes no If yes, you are required to verify this information with the U.S. Fish and Wildlife Service. If species'
identities are known, please list them next.
20. Record weather conditions at the time this checklist was prepared:
DATE:____________________
______________ Temperature ( C/ F) ______________ Normal daily high temperature
Site Manager_________________________________________________________________________________
Date________________________
38
II. TERRESTRIAL HABITAT CHECKLIST
IIA. WOODED
1. Are there any wooded areas at the site? yes no If no, go to Section IIB: Shrub/Scrub.
2. What percentage or area of the site is wooded? (_____% _____ acres). Indicate the wooded area on the sitemap which is attached to a copy of this checklist. Please identify what information was used to determinethe wooded area of the site.
3. What is the dominant type of vegetation in the wooded area? (Circle one: Evergreen/Deciduous/ Mixed)Provide a photograph, if available.
Dominant plant, if known:________________________________________
4. What is the predominant size of the trees at the site? Use diameter at breast height.
0-6 in. 6-12 in. > 12 in.
5. Specify type of understory present, if known. Provide a photograph, if available.
IIB. SHRUB/SCRUB
1. Is shrub/scrub vegetation present at the site? yes no If no, go to Section IIC: Open Field.
2. What percentage of the site is covered by scrub/shrub vegetation? ( _____% _____ acres). Indicate the areasof shrub/scrub on the site map. Please identify what information was used to determine this area.
3. What is the dominant type of scrub/shrub vegetation, if known? Provide a photograph, if available.
4. What is the approximate average height of the scrub/shrub vegetation?
0-2 ft. 2-5 ft. > 5 ft.
39
5. Based on site observations, how dense is the scrub/shrub vegetation?
Dense Patchy Sparse
IIC. OPEN FIELD
1. Are there open (bare, barren) field areas present at the site? yes no If yes, pleaseindicate the type below:
Prairie/plains Savannah Old field Other (specify)____________________
2. What percentage of the site is open field? ( _____% _____ acres). Indicate the open fields on the site map.
3. What is/are the dominant plant(s)? Provide a photograph, if available.
4. What is the approximate average height of the dominant plant?____________________
5. Describe the vegetation cover: Dense Sparse Patchy
IID. MISCELLANEOUS
1. Are other types of terrestrial habitats present at the site, other than woods, scrub/shrub, and open field? yes no If yes, identify and describe them below.
2. Describe the terrestrial miscellaneous habitat(s) and identify these area(s) on the site map.
40
3. What observations, if any, were made at the site regarding the presence and/or absence of insects, fish, birds,mammals, etc.?
4. Review the questions in Section I to determine if any additional habitat checklists should be completed forthis site.
41
III. AQUATIC HABITAT CHECKLIST -- NON-FLOWING SYSTEMS
Note: Aquatic systems are often associated with wetland habitats. Please refer to Section V, WetlandHabitat Checklist.
1. What type of open-water, non-flowing system is present at the site?
Natural (pond, lake) Artificially created (lagoon, reservoir, canal, impoundment)
2. If known, what is the name(s) of the waterbody(ies) on or adjacent to the site?
3. If a waterbody is present, what are its known uses (e.g.: recreation, navigation, etc.)?
4. What is the approximate size of the waterbody(ies)? ______________ acre(s).
5. Is any aquatic vegetation present? yes no If yes, please identify the type of vegetation present ifknown.
Emergent Submergent Floating
6. If known, what is the depth of the water? ______________________________________________
7. What is the general composition of the substrate? Check all that apply.
Bedrock Sand (coarse) Muck (fine/black)
Boulder (>10 in.) Silt (fine) Debris
Cobble (2.5-10 in.) Marl (shells) Detritus
Gravel (0.1-2.5 in.) Clay (slick) Concrete
Other (specify)____________________________________________________________
8. What is the source of water in the waterbody?
River/Stream/Creek Groundwater Other (specify)____________________
Industrial discharge Surface runoff
42
9. Is there a discharge from the site to the waterbody? yes no If yes, please describe this discharge and its path.
10. Is there a discharge from the waterbody? yes no If yes, and the information is available, identify fromthe list below the environment into which the waterbody discharges.
11. Identify any field measurements and observations of water quality that were made. For those parameters forwhich data were collected provide the measurement and the units of measure below:
_________ Area
__________ Depth (average)
_________ Temperature (depth of the water at which the reading was taken) ____________
12. Describe observed color and area of coloration.
13. Mark the open-water, non-flowing system on the site map attached to this checklist.
43
14. What observations, if any, were made at the waterbody regarding the presence and/or absence of benthicmacroinvertebrates, fish, birds, mammals, etc.?
44
IV. AQUATIC HABITAT CHECKLIST -- FLOWING SYSTEMS
Note: Aquatic systems are often associated with wetland habitats. Please refer to Section V, WetlandHabitat Checklist.
1. What type(s) of flowing water system(s) is (are) present at the site?
River Stream Creek Dry wash Arroyo Brook Artificially Intermittent Stream Channeling
created Other (specify)____________________ (ditch, etc.)
2. If known, what is the name of the waterbody?______________________________________
3. For natural systems, are there any indicators of physical alteration (e.g., channeling, debris, etc.)? yes no If yes, please describe indicators that were observed.
4. What is the general composition of the substrate? Check all that apply.
Bedrock Sand (coarse) Muck ( fine/black)
Boulder (>10 in.) Silt (fine) Debris
Cobble (2.5-10 in.) Marl (shells) Detritus
Gravel (0.1-2.5 in.) Clay (slick) Concrete
Other (specify)____________________
5. What is the condition of the bank (e.g., height, slope, extent of vegetative cover)?
6. Is the system influenced by tides? yes no What information was used to make this determination?
45
7. Is the flow intermittent? yes no If yes, please note the information that was used in making thisdetermination.
8. Is there a discharge from the site to the waterbody? yes no If yes, please describe the discharge and itspath.
9. Is there a discharge from the waterbody? yes no If yes, and the information is available, please identifywhat the waterbody discharges to and whether the discharge is on site or off site.
10. Identify any field measurements and observations of water quality that were made. For those parameters forwhich data were collected, provide the measurement and the units of measure in the appropriate space below:
_____ Temperature (depth of the water at which the reading was taken_________________)
_____ pH
_____ Dissolved oxygen
_____ Salinity
_____ Turbidity (clear, slightly turbid, turbid, opaque)(Secchi disk depth _______________)
_____ Other (specify)________________________________________
46
11. Describe observed color and area of coloration.
12. Is any aquatic vegetation present? yes no If yes, please identify the type of vegetation present, ifknown.
Emergent Submergent Floating
13. Mark the flowing water system on the attached site map.
14. What observations were made at the waterbody regarding the presence and/or absence of benthicmacroinvertebrates, fish, birds, mammals, etc.?
47
V. WETLAND HABITAT CHECKLIST
1. Based on observations and/or available information, are designated or known wetlands definitely present atthe site? yes no
Please note the sources of observations and information used (e.g., USGS Topographic Maps, NationalWetland Inventory, Federal or State Agency, etc.) to make this determination.
2. Based on the location of the site (e.g., along a waterbody, in a floodplain) and site conditions (e.g., standingwater; dark, wet soils; mud cracks; debris line; water marks), are wetland habitats suspected?
yes no If yes, proceed with the remainder of the wetland habitat identification checklist.
3. What type(s) of vegetation are present in the wetland?
Submergent Emergent Scrub/Shrub Wooded
Other (specify)____________________
4. Provide a general description of the vegetation present in and around the wetland (height, color, etc.). Provide a photograph of the known or suspected wetlands, if available.
5. Is standing water present? yes no If yes, is this water: Fresh BrackishWhat is the approximate area of the water (sq. ft.)?____________________Please complete questions 4, 11, 12 in Checklist III - Aquatic Habitat -- Non-Flowing Systems.
6. Is there evidence of flooding at the site? What observations were noted?
Buttressing Water marks Mud cracks
Debris line Other (describe below)
48
7. If known, what is the source of the water in the wetland?
Stream/River/Creek/Lake/Pond Groundwater
Flooding Surface Runoff
8. Is there a discharge from the site to a known or suspected wetland? yes no If yes, please describe.
9. Is there a discharge from the wetland? yes no. If yes, to what waterbody is discharge released?
Surface Stream/River Groundwater Lake/Pond Marine
10. If a soil sample was collected, describe the appearance of the soil in the wetland area. Circle or write in thebest response.
Color (blue/gray, brown, black, mottled) __________________________________________
Water content (dry, wet, saturated/unsaturated) __________________________
11. Mark the observed wetland area(s) on the attached site map.
49
APPENDIX B -- Example of Flow Diagram For Conceptual Site Model
Figure B-1
50
Figure B-2
51
Figure B-3
52
APPENDIX C - EXAMPLE SITES
Example sites are presented in this document to demonstrate how information from the checklist for ecologicalassessment/sampling is used in conjunction with representative biological sampling to meet the study objectives. A general history for each site is presented first, then additional preliminary information
I. SITE HISTORIES
Site A -- Copper Site
This is a former municipal landfill located in an upland area of the mid-Atlantic plain. Residential, commercial,and industrial refuse were disposed at the site from 1961 to 1980. Large amounts of copper wire were alsodisposed at this site. Minimal grass cover has been placed over the fill. Terrestrial ecosystems in the vicinity ofthe landfill include upland forest, successional fields, agricultural land, and residential and commercial areas. The surface of the landfill has deteriorated in several locations. Leachate seeps have been noted on the slope ofthe landfill, several of which discharge to a 5-acre pond down-gradient of the site.
Site B -- Stream DDT Site
This is a former chemical production facility located adjacent to a stream. The facility manufactured andpackaged dichlorodiphenyltrichloroethane (DDT). Due to poor storage practices, several DDT spills haveoccurred.
Site C -- Terrestrial PCB Site
This site is a former waste oil recycling facility located in a remote area. Oils contaminated with polychlorinatedbiphenyl compounds (PCBs) were disposed in a lagoon. The lagoon is not lined and the substrate is composedmostly of sand. Oils contaminated with PCBs have migrated through the soil and contaminated a wide areaadjacent to the site.
II. USE OF THE CHECKLIST FOR ECOLOGICAL ASSESSMENT/SAMPLING
Site A -- Copper Site
A preliminary site visit was conducted, and the checklist indicated the following: 1) the pond has an organicsubstrate, 2) emergent vegetation including cattail and Phragmites occurs along the shore near the leachate seeps,and 3) the pond reaches a depth of five feet toward the middle. Several species of sunfish, minnows, and carpwere observed. A diverse benthic macroinvertebrate community also has been noted in the pond. The pondappears to function as a valuable habitat for fish and other wildlife.
Preliminary sampling indicated elevated copper levels in the seep as well as elevated base cations, total organiccarbon (TOC), and depressed pH levels (pH 5.7).
Copper can cause toxic effects in both aquatic plants and invertebrates at relatively low water concentrations,thereby affecting the pond's ability to support macroinvertebrate and fish communities, as well as the wildlife thatfeed at the pond. Terrestrial ecosystems do not need to be evaluated because the overland flow of the seeps islimited to short gullies. Thus, the area of concern has been identified as the 5-acre pond and the associatedleachate seeps.
53
A review of the literature on the ecotoxicity of copper to aquatic biota and plants, both algae and vascular, wasconducted. In general it was found that young organisms are more sensitive to copper with decreasing sensitivityas body weight increases. The toxicity of copper in water is influenced by water hardness, alkalinity, and pH.
Site B -- Stream DDT Site
The ecological checklist was completed as part of the preliminary site visit. The information gathered indicatesthat surface water drainage from the site flows through several drainage swales toward a small unnamed creek. This creek is a second order stream containing riffle-run areas and small pools. The stream substrate is composedof sand and gravel in the pools with some small depositional areas in the backwater areas, and primarily cobble inthe riffles. Previous sampling efforts have indicated the presence of DDT and its metabolites in the streamsediments at a concentration of 230 milligrams per kilogram (mg/kg). A variety of wildlife, especiallypiscivorous birds, utilize this area for feeding. Many species of minnow have been noted in this stream. DDT iswell known for its tendency to bioaccumulate and biomagnify in food chains, and available evidence indicatesthat it can cause reproductive failure in birds due to eggshell thinning.
In freshwater systems, DDT can have direct effects on animals, particularly insects. A literature review of theaquatic toxicity of DDT was conducted, and a no observed adverse effects level (NOAEL) was identified foraquatic insects. Aquatic plants are not affected by DDT. Additional information on the effects of DDT on birdsidentified decreased reproductive success due to eggshell thinning.
Site C -- Terrestrial PCB Site
During a preliminary site visit, the ecological checklist was completed. Most of the habitat is upland forest, oldfield, and successional terrestrial areas. Biological surveys at this site have noted a variety of small mammals,and red-tailed hawks were also observed. The area of concern has been identified as the 10-acre area surroundingthe site. PCBs have been shown to reduce reproductive success in mammals or target liver functions. PCBs arenot highly volatile, so inhalation of PCBs would not be an important exposure pathway. However, PCBs havebeen shown to biomagnify indicating that the ingestion exposure route needs evaluation. Shrews and/or voleswould be appropriate mammalian receptors to evaluate for this exposure route. Potential reproductive effects onpredators that feed on small mammals would also be important to evaluate. The literature has indicated thatexposure to PCBs through the food chain can cause chronic toxicity to predatory birds.
Limited information was available on the effects of PCBs to red-tailed hawks. Studies on comparable specieshave indicated decreased sperm concentration that may affect reproductive success.
III. CONCEPTUAL SITE MODEL FORMULATION
Site A -- Copper Site
The assessment endpoint for this site was identified as the maintenance of pond fish and invertebrate communitycomposition similar to that of other ponds in the area of similar size and characteristics. Benthicmacroinvertebrate community studies may be relatively labor-intensive and potentially an insensitive measure inthis type of system. Measuring the fish community would also be unsuitable due to the limited size of the pondand the expected low diversity of fish species. In addition, copper is not strongly food-chain transferrable.Therefore, direct toxicity testing was selected as an appropriate measurement endpoint. Toxicity was defined as astatistically significant decrease in survival or juvenile growth rates in a population exposed to water orsediments, as compared to a population from the reference sites.
One toxicity test selected was a 10-day solid-phase sediment toxicity test using early life-stage Hyalella azteca. The measurement endpoints for the test are mortality and growth rates (measured as length and weight changes).
54
Two water-column toxicity tests were selected: a 7-day test using the alga Selenastrum capricornutum (growthtest) and a 7-day larval fish test using Pimephales promelas (mortality and growth endpoints).
55
Five sediment samples were collected from the pond bottom at intervals along an identified concentrationgradient. Reference sediment was also collected. A laboratory control was utilized in addition to the referencesediment in this toxicity test. The study design specified that sediment for the toxicity tests was collected fromthe leachate seeps known to be at the pond edge, and from four additional locations transecting the pond atequidistance locations. A pre-sampling visit was required to confirm that the seep was flowing due to theintermittent nature of leachate seeps.
Site B -- Stream DDT Site
A conceptual model was developed to evaluate the environmental pathways for DDT that could result inecological impacts. DDT in the sediments can be released to the water column during natural resuspension andredistribution of the sediments. Some diffusion of DDT to the water column from the sediment surface may alsooccur. The benthic macroinvertebrate community would be an initial receptor for the DDT in sediments. Fishthat feed on the benthic macroinvertebrates could be exposed to the DDT both in the water column and in theirfood. Piscivorous birds would be exposed to the DDT that has accumulated in the fish. For example, beltedkingfishers are known to feed in the stream. Given the natural history of this species, it is possible that theyforage entirely in the contaminated area. From this information, the assessment endpoint was identified to be theprotection of piscivorous birds from eggshell thinning due to DDT exposure. From this assessment endpoint,eggshell thinning in the belted kingfisher was selected as the measurement endpoint.
Existing information identified a DDT gradient in the stream sediments. Forage fish (e.g., creek chub) wereselected to measure exposure levels for kingfishers. The study design for measuring DDT residue levelsspecified that 10 creek chub of the same size and sex will be collected at each location for chemical residueanalysis. Although analytical data for the stream sediment exists, new co-located sediment samples werespecified to be collected to provide a stronger link between the present state of contamination in the sediment andin the fish.
Site C -- Terrestrial PCB Site
A conceptual model was prepared to determine the exposure pathways by which predatory birds could be exposedto PCBs originating in the soil at the site. The prey of red-tailed hawks includes voles, deer mice, and variousinsects. Voles are herbivorous and prevalent at the site. However, PCBs do not strongly accumulate in plants,thus voles may not represent a strong exposure pathway to hawks. Deer mice are omnivorous and may be morelikely than voles to be exposed to PCBs. The assessment endpoint for this site was identified to be the protectionof reproductive success in high trophic level species exposed to PCBs via diet.
Initially, a sampling feasibility study was conducted to confirm sufficient numbers of the deer mice. Two surveylines of 10 live traps were set for deer mice in the area believed to contain the desired concentration gradient forthe study design. Previous information indicated a gradient of decreasing PCB concentration with increasingdistance from the unlined lagoon. Three locations were selected along this gradient to measure PCBconcentrations in prey. Co-located soil and water samples were also collected. The analytical results of thesematrices were utilized as variables in a food chain accumulation model which predicted the amount ofcontaminant in the environment that may travel through the food chain, ultimately to the red-tailed hawk.
56
REFERENCES
ASTM. 1992. Standard Guide for Conducting Early Life-Stage Toxicity Tests with Fishes. American Society forTesting and Materials. E1241-92.
Bligh, E.G., W.J. Dyer. 1959. Lipid Extraction and Purification. Canadian Journal of Biochemistry andPhysiology. Vol 37. pp. 912-917
Brungs, W.A. and D.I. Mount. 1978. Introduction to a Discussion of the Use of Aquatic Toxicity Tests forEvaluation of the Effects of Toxic Substances. Cairns, J. Jr., K.L. Dickson and A.W. Makei (eds.) Estimating theHazard of Chemical Substances to Aquatic Life. ASTM 657. Amer. Soc. Test. Materials, Philadelphia, PA. p.1526.
Green, J.C., C.L. Bartels, W.J. Warren-Hicks, B.R. Parkhurst, G.L. Linder, S.A. Peterson, and W.E. Meiller. 1989. Protocol for Short Term Toxicity Screening of Hazardous Waste. U.S. Environmental Protection Agency,Environmental Research Laboratory, Corvallis, OR. EPA 600/3-88/029.
Hair, J.D. 1980. Measurement of ecological diversity. in S.D. Schemnitz, ed. Wildlife Management TechniquesManual. Fourth Edition. The Wildlife Society, Washington, D.C. pp269-275.
Hayes, M.L. 1983. Active Fish Capture Methods, Chapter 7 in Fisheries Techniques. American FisheriesSociety. pp. 123-145.
Herbes, S.E. and C.P. Allen. 1983. Lipid Quantification of Freshwater Invertebrates: Method Modification forMicroquantitation. Canadian Journal of Fisheries and Aquatic Sciences. 40(8). pp. 1315-1317.
Hurbert, W.A. 1983. Passive Capture Methods, Chapter 6 in Fisheries Techniques. American Fisheries Society.pp. 95-122.05
Karr, J.R., K.D. Fausch, P.L. Angermeier, P.R. Yant, and I.J. Schlosser. 1986. Assessing Biological Integrity inRunning Waters: A Method and Its Rationale. Special Publication 5. Illinois Natural History Survey.
Philips, D.J.H. 1977. The Use of Biological Indicator Organisms to Monitor Trace Metal Pollution In Marine andEstuarine Environments-A Review. Environmental Poll. 13, pp. 281-317.
Philips, D.J.H. 1978. Use of Biological Indicator Organisms to Quantitate Organochlorine Pollutants in AquaticEnvironments-A Review. Environmental Poll. 16, pp. 167-229.
Timbrell, J.A. 1989. Introduction to Toxicology. Taylor and Francis, London. 155p.
U.S. EPA (Environmental Protection Agency). 1997. Ecological Risk Assessment Guidance for Superfund:Process for Designing and Conducting Ecological Risk Assessments. Office of Solid Waste and EmergencyResponse. EPA 540-R-97/006.
U.S. EPA (Environmental Protection Agency). 1994. CLP National Functional Guidelines for Inorganic DataReview. Office of Solid Waste and Emergency Response. Publication 9240.1-05
U.S. EPA (Environmental Protection Agency). January 1991. Compendium of ERT Toxicity Testing Procedures. OSWER Directive 9360.4-08.
57
U.S. EPA (Environmental Protection Agency). 1992. Framework for Ecological Risk Assessment. EPA/630/R-92/001.
U.S. EPA (Environmental Protection Agency). December 1991b. ECO Update. Volume 1, Number 2,Publication 9345.0-05I. Office of Emergency and Remedial Response, Hazardous Site Evaluation Division (OS-230).
U.S. EPA (Environmental Protection Agency). April 1990. Quality Assurance/Quality Control (QA/QC)Guidance for Removal Activities, Sampling QA/QC Plan and Data Validation Procedures. EPA/540/G-90/004.
U.S. EPA (Environmental Protection Agency). November 1990. Macroinvertebrate Field and LaboratoryMethods for Evaluating the Biological Integrity of Surface Waters. Aquatic Biology Branch and Developmentand Evaluation Branch, Quality Assurance Research Division, Environmental Monitoring Systems Laboratory,Cincinnati, Ohio, EPA/600/4-90/030.
U.S. EPA (Environmental Protection Agency). March 1989b. Short-Term Methods for Estimating the ChronicToxicity of Effluents and Receiving Waters to Freshwater Organisms. EPA/600/4-89/001.
U.S. Environmental Protection Agency. May 1989a. Rapid Bioassessment Protocols For Use In Streams AndRivers: Benthic Macroinvertebrates and Fish. EPA/444/4-89-001.
U.S. Environmental Protection Agency. May 1988. Short-Term Methods for Estimating the Chronic Toxicity ofEffluents and Receiving Waters to Marine and Estuarine Organisms. EPA/600/4-87/028.