154 World 10-1 Statistics Definitions and Representative Sampling Match the definition with the correct term provided below ________________________: all people or items that one wants to study. ________________________: collects information on every member of the population being studied. ________________________: a statistical survey where experts in the field are questioned ________________________: a systematic way of collecting data from a small sample the population. ________________________: causes of prejudice in favour or against a thing, person, or group. census source of bias population poll study Methods of Sampling and Variables _______________________________: Used to select individuals to form a small group to represent the population to be studied elements are randomly chosen. _______________________________: the population is ordered and every n th person is selected. Ex. the 10 th , 20 th , 30 th , …… person is questioned, _______________________________: the population being survey is mainly homogeneous and split into groups called “clusters” which are subsets of the population. A few clusters are chosen to form the sample group. _______________________________: used for populations which are mainly heterogeneous and divided into categories (called strata) ._______________________________: the variable that expresses a quantity and uses numerical values. ._______________________________: the variable that expresses a quality and does not use numerical values. Ex. eye colour, or poor, good, excellent. ._______________________________: a set of values that can only take on integers or whole numbers. Ex. digital clocks only show minutes 1,2,3,4 _______________________________: a set of values that can be any real number. Ex. a hand watch discreet variable continuous variable qualitative cluster sampling simple random sampling quantitative systematic sampling stratified sampling
Transcript
! 154!
World 10-1 Statistics Definitions and Representative Sampling Match the definition with the correct term provided below ________________________: all people or items that one wants to study. ________________________: collects information on every member of the population being studied. ________________________: a statistical survey where experts in the field are questioned ________________________: a systematic way of collecting data from a small sample the population. ________________________: causes of prejudice in favour or against a thing, person, or group. census source of bias population poll study Methods of Sampling and Variables _______________________________: Used to select individuals to form a small group to represent the
population to be studied elements are randomly chosen. _______________________________: the population is ordered and every nth person is selected. Ex. the 10th, 20th, 30th, …… person is questioned, _______________________________: the population being survey is mainly homogeneous and split into
groups called “clusters” which are subsets of the population. A few clusters are chosen to form the sample group.
_______________________________: used for populations which are mainly heterogeneous and divided into categories (called strata) ._______________________________: the variable that expresses a quantity and uses numerical
values. ._______________________________: the variable that expresses a quality and does not use
numerical values. Ex. eye colour, or poor, good, excellent.
._______________________________: a set of values that can only take on integers or whole numbers. Ex. digital clocks only show minutes 1,2,3,4 _______________________________: a set of values that can be any real number. Ex. a hand watch discreet variable continuous variable qualitative cluster sampling simple random sampling quantitative systematic sampling stratified sampling
! 155!
Representative Sampling 1) The number of students who attended D’Arcy McGee in 1979 are polled about their school experience. The data is organized by their post-secondary degrees. 300 people are to be surveyed.
Grade Boys Girls Social Sciences 300 150 Sciences 250 200 Arts Programs 200 150
a) How many boys who studied Arts Programs will be surveyed? b) How many girls in Sciences will be surveyed? c) How many boys in Social Sciences will be surveyed?
2) The following table shows the distribution of the 15 000 voters in a given town.
Area Women Men Women Surveyed
Men Surveyed
Downtown 1200 1100 South End 1500 1500 East End 1000 1200 North End 2800 1200 West End 1700 1800
A sample of 750 people is required. This sample must be representative of the population distribution shown in the above. Complete the table 3) A consultant from the government is looking into how news organizations gather information. The number of companies is shown below from each different sector.
Business News Paper Online Television
Number of companies 250 200 50 The survey will be fore 40 companies. How many Oline companies will he survey if it is to be a representative sample? 4) Air Bud 4: the Return of Buddy Holly, received horrible reviews in theatres. The following people who walked out of the theatre during the film are shown below. 24 of them were polled as a representative sample. Which statement is true?
Dog Owners Cat Owners
Turtle Owners
Total
Population 32 24 8 64 Sample 24
a) 14 dog owners are surveyed b) 13 cat owners are surveyed c) 40 people were surveyed d) 3 turtle owners are surveyed
! 156!
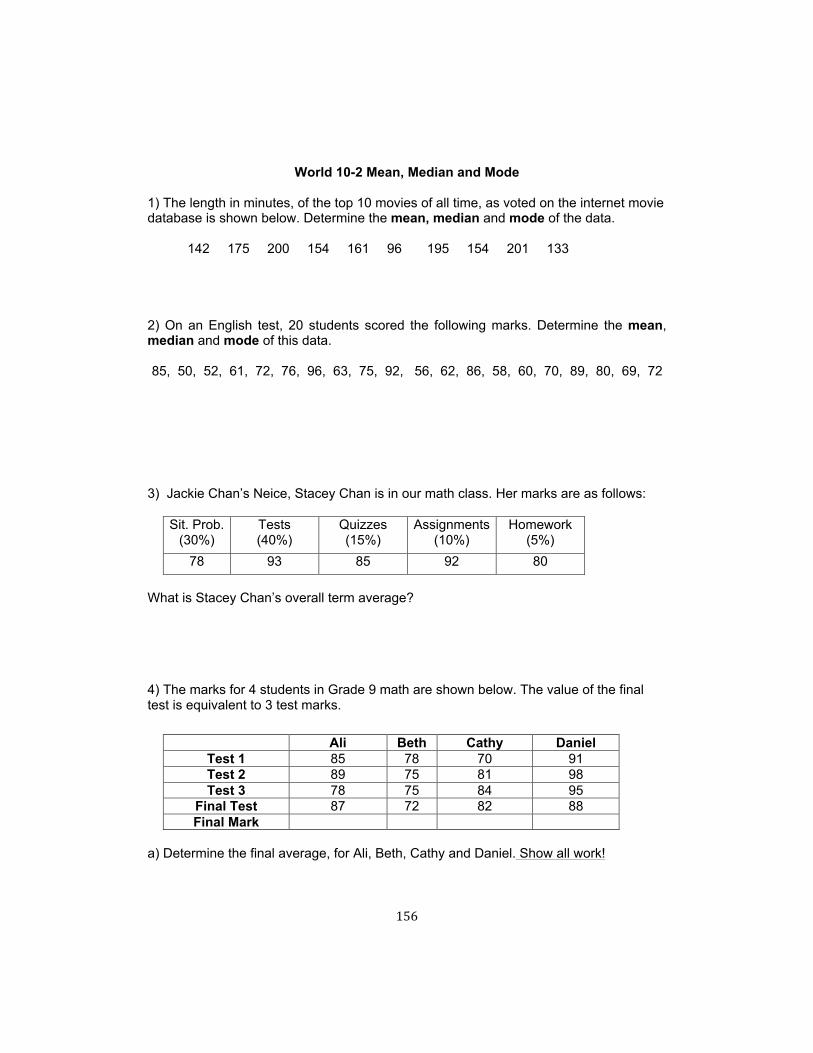
World 10-2 Mean, Median and Mode 1) The length in minutes, of the top 10 movies of all time, as voted on the internet movie database is shown below. Determine the mean, median and mode of the data. 142 175 200 154 161 96 195 154 201 133 2) On an English test, 20 students scored the following marks. Determine the mean, median and mode of this data. 85, 50, 52, 61, 72, 76, 96, 63, 75, 92, 56, 62, 86, 58, 60, 70, 89, 80, 69, 72
3) Jackie Chan’s Neice, Stacey Chan is in our math class. Her marks are as follows:
Sit. Prob. (30%)
Tests (40%)
Quizzes (15%)
Assignments (10%)
Homework (5%)
78 93 85 92 80 What is Stacey Chan’s overall term average? 4) The marks for 4 students in Grade 9 math are shown below. The value of the final test is equivalent to 3 test marks.
Ali Beth Cathy Daniel Test 1 85 78 70 91 Test 2 89 75 81 98 Test 3 78 75 84 95
Final Test 87 72 82 88 Final Mark
a) Determine the final average, for Ali, Beth, Cathy and Daniel. Show all work!
! 157!
b) If Beth had earned 100% on his final test would he have gotten a “A” (90% or higher) in the class? 5) To earn a “B” in Geometry, Abby must get a grade average of at least 80%. Abby’s test scores are 85, 90, and 75. Her final exam score counts as three test scores in the average. Abby got a grade of 78 on the final exam. What was her final grade average? Did she get a “B”? 6) Kim ordered dinner for a party of 15 people. 5 people ordered steak $12.95, 6 people ordered a chicken plate, $9.25 and 1 person ordered lobster $22.55. Determine the mean cost. 7) During a karate tournament at the Cobra Kai dojo, two of your ten scores were lost
when the computer network crashed. Your results are shown in the tables below.
Your score Mean of the 10 scores 8.69
8.5 ? 8.8 8.5 8.4 Median of the 10 scores 8.7
8.8 9.0 ? 9.2 8.6 Mode of the 10 scores 8.8 Finds the missing scores to return justice to your name 8) In Chemistry class, Isacc Netwon averaged a 78. One score is missing from the list.
90 95 75 80 85 65 70 80 60 What was the missing score?
! 158!
World 10-3 Frequency Charts and Histograms 1) The students of Eyemafast High School organized a race to raise funds for their sports activities. The table below shows the distribution of runners over the number of laps run.
Number of laps
Number of
runners
[30, 40[
5
[40, 50[
15
[50, 60[
35
[60, 70[
40
[70, 80[
20
[80, 90[
10
Construct a histogram to represent this distribution. 2) A Secondary III class did a survey of students to find the number of minutes it takes each student to get to school. They surveyed 40 students and recorded the results below:
Complete the Frequency Chart and Construct a histogram
Time Frequency
[0, 10 [
Total:
Heights Of Basketball Players
! 159!
3) Star Trek 3: The Movie Date The newest Star Trek movie just came out and you are there on a date at a small pre-showing of the film. You’d like to impress your date with your math skills.
Attendance in the Theatre
Age (yrs) Frequency Central C x F [0-10[ 2
[10-20[ 4 [20-30[ 6 [30-40[ 3 [40-50[ 5 Sum
a) Mean b) Median c) Mode
4) Sheldon and his friends almost always order take-out for dinner. Sheldon decided to track his friends’ total meal expenses every day for the entire month of May, and he put his results into a histogram, below.
a) Use the histogram to fill out the grouped data table above. Use an amplitude of 20. b) What is the modal cost? ___________________ c) What is the median cost? ____________________ d) What is the mean cost per meal? _______________
Cost Per Meal Frequency
Total: 20 40 60 80 100
! 160!
5) The Cracker Factory: Government workers in Aylmer did a survey to determine the number of people visiting the local cracker factory. The age ranges were broken down into classes:
Age (yrs) Frequency [0-20[ 15
[20-40[ 44
[40-60[ 38
[60-80[ 24
[80-100[ 9
Totals
a) What is the modal class?
b) What is the median class?
c) What is the range?
d) What is the mean?
e) construct a histrogram of the classed data.
6) The height of 32 basketball players is shown below. Complete the frequency table, the histogram and answer the following questions. 145 176 180 190 195 183 172 199 145 160 167 172 147 169 174 176 171 168 184 186 183 173 165 171 179 198 197 100 131 119 140 156
Age (yrs) Frequency
[100-120[
Totals
a) What is the modal height? b) What is the median height? c) What is the range? d) What is the mean?
Heights Of Basketball Players
Heights Of Basketball Players
! 161!
World 10-4 Box and Whisker Plots Ex. 1: Ruler Reaction Time from Explore Learning.com
Boys Data: Girls Data:
Mean Median Mode Range Boys Girls
Ex. 2 Odd Number of Items: (a) The number of visits to GOOGLE.CA on a given day, in the millions, is shown below over the last 11 days. Construct a box and whisker plot. 1 3 5 8 10 14 15 18 19 19 20
Ex. 3 Odd Number of Items: (b) The number of visits to GOOGLE.CO.UK on a given day, in the millions, is shown below over the last 9 days. Construct a box and whisker plot. 8 10 14 17 22 23 31 33 34
! 162!
8 10 14 17 22 23 31 33 34
Ex. 4 Even Number of Items: (a) The distance a cat can fall safely from a building (m) 3.5 4.5 5.0 6.0 7.5 8.0 8.0 9.5 9.5 15.0
Ex. 5 Even Number of Items: (b) Number of times a dog barks in a day 0 0 12 15 18 20 25 26
! 163!
Box and Whisker Plot Homework Problems 1) A Physics teacher recorded the marks that his 21 students obtained on a test worth 60 marks. The results obtained by the student are presented below. Construct a box-and-whisker plot to illustrate this distribution.
2) The test results of a group of twenty mathematics 416 students are recorded below:
85 63 73 93 60 86 85 100 95 69 71
78
73
86
93
92
63
69
85
88
Draw the box-and-whisker plot that illustrates this distribution. 3) Multiple Choice: The following box-and-whisker plot represents the annual salary of realistate agents in Aylmer.
Which of the following statements is definitely TRUE? a) The mean salary is $30 000 b) Half the employees earn between $24000 and $42 000 c) The greatest concentration of salary lies between the second and third quartiles. d) There are more employees who earn over $42 000 than employees who earn unber $24 000.
12 000 24 000 30 000 42 000 72 000
! 164!
4) A Zen master and Mr. Singfield meet while taking a nature walk. The Zen master claims to have seen many deer, beavers and birds on his many excursions. Mr. Singfield says he has also seen many animals.
# of Animals Mr. Singfield sees in the forest on a typical nature walk 2 5 6 6 8 12 15 19 21
# of Animals a Zen Master sees
3 5 5 8 10 11 18 18 18 20 Draw two box and whisker plots comparing the # of animals Mr. Singfield sees to that of the Zen Master. Include an appropriate scale, Q1, Q2, Q3 and Min/Max labeled 5) A statistical distribution consisting of the exam marks of 30 students has the following characteristics; Q3 has a greater dispersion than Q1 and Two of the quartiles are symmetrical Which one of the following box-and-whisker plots could represent this statistical distribution? a)
48 68 78 88 100
b)
48 68 74 87 100
c)
48 61 74 80 100
d)
48 60 70 80 100
! 165!
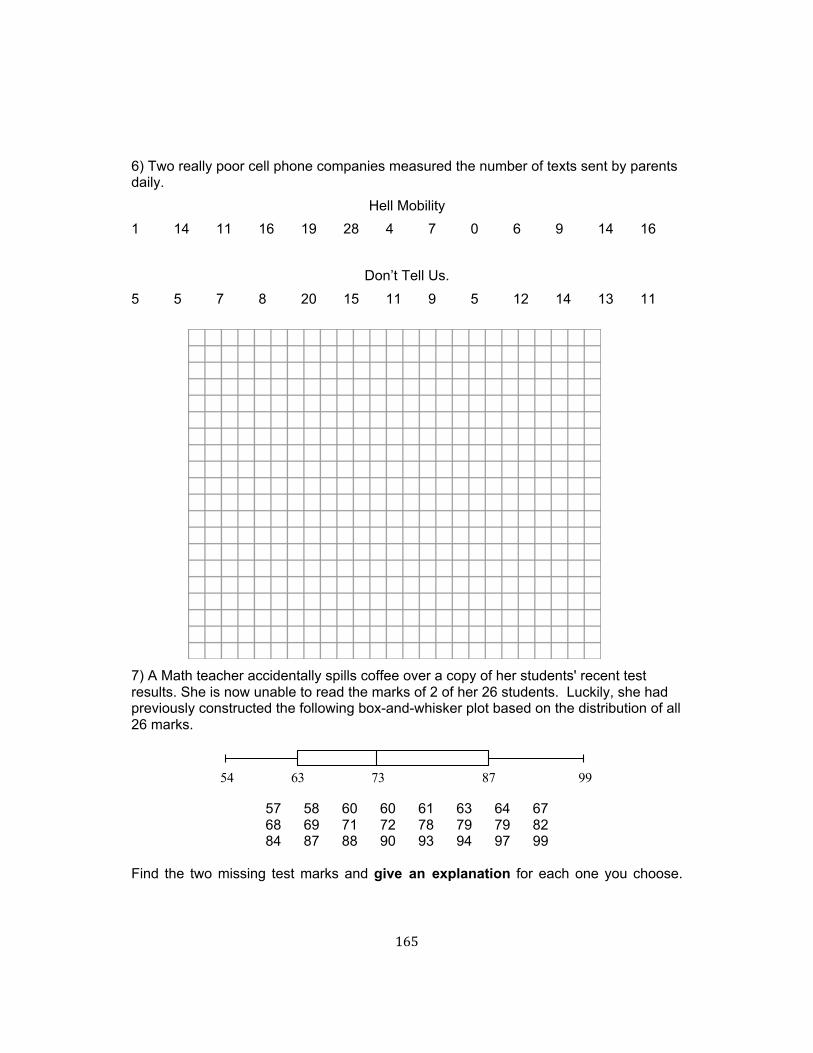
6) Two really poor cell phone companies measured the number of texts sent by parents daily.
Hell Mobility 1 14 11 16 19 28 4 7 0 6 9 14 16
Don’t Tell Us.
5 5 7 8 20 15 11 9 5 12 14 13 11 7) A Math teacher accidentally spills coffee over a copy of her students' recent test results. She is now unable to read the marks of 2 of her 26 students. Luckily, she had previously constructed the following box-and-whisker plot based on the distribution of all 26 marks.
Find the two missing test marks and give an explanation for each one you choose.
54 63 73 87 99
! 166!
World 10-5 OTTAWA SENATORS
AND THE STANLEY CUP PLAYOFFS
Name:______________________________ Date:_________________ !The Ottawa Senators are now in the 2nd round of the Stanley Cup Playoffs and attempting the make their way to the finals. Last time they made it to the finals was in the 2006-2007 season, the Sens made there, by beating the Pittsburg Penguins. Let’s see if they can do it again. You are given the role of a newly hired statistician of the Sens. Your first assignment from the NHL commission is to solve some hockey and math related problems. Good luck! 1. SENS GAME 5 ATTENDANCE Tickets to game 5 of the Senators vs Montreal in Ottawa were selling for as much as $250 a ticket! Your first objective for the NHL commission is collect statistics about the age of people attending the game in Ottawa. You are to determine the mean, median and mode for the age group classed data shown below.
2. PLAYOFF POINTS LEADERS Table 1 Sens 2012-2013 Regular Season Table 2 Pens 2012-2013 Regular Season
Name Goals Assists Points Name Goals Assists Points K. Turris 12 17 29 S. Crosby 15 41 56
S. Gonchar 3 24 27 C. Kunitz 22 30 52 D. Alfredsson 10 16 26 P. Dupuis 20 18 38 M. Zibanejad 7 13 20 K. Letang 5 33 38 C. Greening 8 11 19 J. Neal 21 15 36 P. Wiercioch 5 14 19 E. Malkin 9 24 33 J. Silfverberg 10 9 19 P. Martin 6 17 23
Z. Smith 4 11 15 M. Cooke 8 13 21 C. Phillips. 5 9 14 B. Sutter 11 8 19
M. Michalek 4 10 14 B. Morrow 6 8 14 E. Karlsson 6 8 14 M. Niskanen 4 10 14
C. Neil 4 8 12 B. Bennett 3 11 14 E. Condra 4 8 12 J. Iginla 5 6 11
Your second task as an NHL statistician is to compare the distributions of the points total for the top 13 points scorers from the Senators vs. the Pengiuns from this years regular season. The commission would like you to create two box-and-whisker plots for the total points in each playoff year. One for the players of the Senators Points and the other for the players of the Penguins Points. Include a scale in your report so that the two plots can be easily compared. *Use a scale of 1 block = 3 points. State two significant observations that can be made from the box-and-whiskers plots when comparing these two teams?
! 168!
3. POWER SHOT Sydney Crosby (in black) takes a slap shot from a distance of 8.92 m away from the net. The puck is going into the top corner! Craig Anderson of the Ottawa Senators is in goal. The distance of Sydney’s shot with respect to time is shown in the table below. The solution (x) to Anderson’s Relfex Equation is the time in seconds it takes him make the save. Will Anderson be fast enough to save the shot before the puck goes into the net? Syndney’s Slap Shot Data Anderson’s Relfex Equation
Time
(s)
Puck Distance
from net (m)
0.1 6.3 0.2 3.6
€
15x 4 −10x 3 + 5x 2
5x 2 + 2x − 4( ) 3x + 7( ) =−291(y 3)4 (x 6)2
y 8y 4x10
! 169!
4. BREAK-A-WAY PASS Ottawa Senators goalie Craig Anderson passes the puck from his defensive zone at (-10,-6). The puck moves along the linear path going through point (0,-1). This is a breakaway pass intended for Daniel Alfredsson. Alfredsson skates furiously to reach the puck as he moves along the path described by the function
€
y = −12x + 5.
At what coordinate will Alfredsson receive the pass? Is this puck in zone 1, 2 or 3?
! !1!
Zone 2 Zone 3 Zone 1
170
Total C
riteria 1 0
8 16
24 32
40
C
riteria 2 0
8 16
24 32
40
Criteria 3 &
4 0
4 8
12 16
20
SITU
ATIO
NA
L PRO
BLEM
#11 B
AC
K TO
THE
FUTU
RE
: PA
RT III
Doc B
rown and M
arty McFly are stuck in the past. Their tim
e m
achine, a DeLorean, ran out of fuel and the type of fuel they
need to get back to the future does not exist yet! The only w
ay to get the tim
e machine up to the speed required for tim
e travel, is by pushing it w
ith a train.
Unfortunately, the m
aximum
speed of a train on traditional fuel is 85 km
/hr and they need to reach 144 km/hr for tim
e travel. D
oc has developed 3 different coloured fuel rods; a green, a yellow
and a red. These fuel rods will be placed in the train’s
engine increasing the train’s speed. The straight track required for this journey goes from
Bandit’s R
ock all the way to C
layton R
avine. If the time m
achine does not reach 144 km/hr before
they reach the ravine, they may not be so fortunate and their
bodies will rem
ain in the past forever…
Green Fuel This fuel w
ill be used between B
andit’s Rock and the
Sw
itch Station. The distance travelled depends on the volum
e of the rod. D
ata for two know
n volumes of different green fuel rods
and the distance they moved the train is show
n in Table 1 along w
ith the dimensions of this green fuel rod.
Yellow
Fuel Used betw
een the Sw
itch Station to the P
oint of No
Return. The distance this fuel w
ill cause the train to move is
unknown. The m
ost likely distance will be the w
hole number that
is between the m
ean and the median from
the data below.
P
redicted Distance for Train to Travel in km
26 29 34 36 36 37
Red Fuel This last rod is used to get the train up to 144 km
/hr and is used after the P
oint of No R
eturn. The graph below show
s the relationship betw
een the speed of the train and its distance from
the Bandit’s R
ock. .
Will the tim
e machine reach 144 km
per hour before falling into the C
layton Ravine? If so how
m
any metres are rem
aining?
Train
Time M
achine
€
32⋅ (x
4y3)2(x
−16y−10) 1/2
x−2y
Table 1 - Green Fuel R
od Data
! 171!
Practice Test #6 Statistics
Name: Date: Part A Multiple Choice (4 marks each) 1] Jenny Chan, Jackie’s cousin receives a breakdown of her term. Whatis her average?
Sit. Prob. (30%)
Tests (40%)
Quizzes (15%)
Assignments (10%)
Homework (5%)
81 92 73 80 100 a) 91.6 b) 84.5 c) 87.5 d) 85.1 2] Roberto Sanchez test average is 74. He’s missing one test mark. Given the 5 other test marks are shown below, what was the mark he got on the missing test? 75 99 85 96 87 a) 98 b) 83 c) 71 d) 76 3] The following box-and-whisker plot represents the term marks for 120 Secondary III students at D’Arcy McGee in Science class. Which of the following statements about this distribution is TRUE? a) The mean mark is 79 b) At least 30 students earned a mark of 87 or higher c) The inter-quartile range is 38 d) The greatest concentration of marks is in the first
quarter 4] Mr. Mac runs a series of lap times to prepare for the upcoming Ottawa race weekend half-marathon. The mean of the laps is 64 seconds and the range is 7. a) 60, 61, 63, 63, 64, 66 , 71 b) 61, 61, 62, 63, 66, 67, 68 c) 57, 67, 61, 61, 67, 60, 75 d) 67, 61, 60, 66, 61, 65, 64
! 172!
Part B Long Answers SHOW ALL OF YOUR WORK 1] The following is a list of random numbers blurted out by a math obsessed student in class.
50, 60, 70, 60, 40, 100, 80, 50, 50, 80
Another female student secretly writes down a second distribution made up of 5 numbers. It has the same mode, the same median and the same mean as the first distribution It has a range of 50 and the mode is the largest number? What are the 5 secret numbers she wrote down? 2] a) The data below consists of 14 positive whole numbers less than 10, of which three are unknown.
4, 3, 5, 4, 4, 8, 6, 7, 5, 6, 7, ?, ?, ?. The data has a mode of 4, a mean and a median of 5, and a range of 6. What are the three missing numbers of this set of data?
b) The data below are arranged in increasing order: 2x, -x + 19, 4x + 4, 6x − 1, -2x + 43 The median of this distribution is 24.
What is the value of the mean of this distribution?
! 173!
3] The heights of 50 basketball players are recorded in the grouped data table to the right. a) Construct a histogram of this distribution on the graph below. Label the axes. !
!!!!
!!!b) What is the modal class? c) What is the mean? Show ALL work.
4] Below is the age distribution of students from D’Arcy McGee who decided to have a water balloon fight in the field. The Classes are broken down by the students overall academic average. Determine the mean, median and mode for this data. (8 marks) Overall
Average Frequency
[50-60[ 10 [60-70[ 26 [70-80[ 42 [80-90[ 14
[90-100[ 8 Total
Heights of players (cm)
Number of players
[175, 180[ 3
[180, 185[ 6
[185, 190[ 9
[190, 195[ 9
[195, 200[ 10
[200, 205[ 13
Heights Of Basketball Players
! 174!
5] Andrew did a survey at some local pizza restaurant to record the amount of time it took between the time an order was placed, and the time the pizza was ready. The numbers below are in minutes: MacEwen’s Pizza: 5, 7, 7, 8, 9, 10, 11, 11, 13, 14, 17, 20, 20 1 for 1 Pizza: 8, 9, 9, 10, 10, 11, 11, 12, 12, 14 a) Draw two box and whisker plots comparing the preparation time for the two pizza
restaurants. Include an appropriate scale, Q1, Q2, Q3 and Min/Max labelled (8 marks)
b) If you had to make a decision based only on the box-and-whisker graphs, which
restaurant is more reliable for preparing their orders quickly? Make TWO arguments based on the box-and-whisker plots to receive full credit for your answer. (2 marks)