98
Supervisor USER MANUAL v.1.3 Supervisor version: 1.2.2 November 2013

Supervisor
USER MANUAL
v.1.3
Supervisor version: 1.2.2
November 2013

© SVANTEK - 1 - Supervisor User Manual
CONTENTS
1 INTRODUCTION ........................................................................................ 3
1.1. ABOUT SUPERVISOR ............................................................................................................................. 3
1.2. SYSTEM REQUIREMENTS ...................................................................................................................... 4
1.3. SOFTWARE INSTALLATION ................................................................................................................... 4
1.4. HOW TO USE SUPERVISOR ................................................................................................................... 4
2 COMMUNICATION WITH SVANTEK INSTRUMENTS ................................... 6
2.1. ESTABLISHING CONNECTION ................................................................................................................ 6
2.2. MANAGING SVANTEK INSTRUMENTS .................................................................................................. 6
2.2.1. INSTRUMENT INVENTORY ............................................................................................................................................ 6
2.2.2. CALIBRATION REPORTS ............................................................................................................................................... 10
2.3. EDITING THE INSTRUMENTS’ SETTINGS ............................................................................................. 11
2.3.1. DOWNLOADING SETTINGS ......................................................................................................................................... 12
2.3.2. EDITING SETTINGS ...................................................................................................................................................... 14
2.3.3. APPLYING SETTINGS ................................................................................................................................................... 15
2.3.4. USING PRESETS ........................................................................................................................................................... 17
3 MANAGING MEASUREMENT DATA ......................................................... 19
3.1. DOWNLOADING FILES ........................................................................................................................ 19
3.1.1. DOWNLOADING MEASUREMENT RESULTS................................................................................................................. 19
3.1.2. DOWNLOADING AUDIO COMMENTS.......................................................................................................................... 22
3.2. DATA BROWSER.................................................................................................................................. 22
3.2.1. FILE MANAGER ........................................................................................................................................................... 23
3.2.2. FILE DETAILS ............................................................................................................................................................... 25
3.2.3. PREVIEW ..................................................................................................................................................................... 28
3.3. USING ASSIGNMENTS ......................................................................................................................... 29
3.3.1. ASSIGNING INFORMATION TO FILES ........................................................................................................................... 29
3.3.2. MANAGING ASSIGNMENTS ........................................................................................................................................ 32
3.3.3. USING ASSIGNED INFORMATION TO SEARCH FILES .................................................................................................... 32
3.3.4. SUMMARY REPORTS ................................................................................................................................................... 33
4 SESSIONS AND REPORTING ..................................................................... 36
4.1. SESSIONS ............................................................................................................................................ 36
4.1.1. CREATING AND MANAGING SESSIONS ....................................................................................................................... 36
4.1.2. SESSION DATA ............................................................................................................................................................ 38
4.1.3. TOOLBAR .................................................................................................................................................................... 39
4.1.4. GENERATING REPORTS FROM SESSIONS .................................................................................................................... 40
4.1.5. LAYOUT TEMPLATES ................................................................................................................................................... 41
4.2. BASIC PANELS ..................................................................................................................................... 43
4.2.1. SESSION HEADER ........................................................................................................................................................ 45
4.2.2. INSTRUMENT CONFIGURATION .................................................................................................................................. 45
4.2.3. LOGGER RESULTS ........................................................................................................................................................ 45
4.2.4. SUMMARY RESULTS .................................................................................................................................................... 46
© SVANTEK - 2 - Supervisor User Manual
4.2.5. LOGGER COMBINED RESULTS ..................................................................................................................................... 47
4.2.6. LOGGER STATISTICS .................................................................................................................................................... 47
4.2.7. LN SPECTRA ................................................................................................................................................................ 48
4.2.8. LOGGER SPECTRAL RESULTS ....................................................................................................................................... 48
4.2.9. SPECTRAL RESULTS ..................................................................................................................................................... 49
4.2.10. TIME INTERSECTION ................................................................................................................................................... 50
4.2.11. MARKED PERIODS TOTALS .......................................................................................................................................... 50
4.2.12. TEXT ............................................................................................................................................................................ 51
4.3. DISPLAY MODES ................................................................................................................................. 51
4.3.1. TABLE MODE............................................................................................................................................................... 52
4.3.2. PLOT MODE ................................................................................................................................................................ 56
4.3.3. SPECTROGRAM MODE ................................................................................................................................................ 65
4.3.4. TEXT MODE ................................................................................................................................................................. 67
4.4. VIEW CONFIGURATOR ........................................................................................................................ 67
4.4.1. USING THE VIEW CONFIGURATOR .............................................................................................................................. 68
4.4.2. SAVING SETTINGS ....................................................................................................................................................... 70
4.4.3. SPECIAL CASES ............................................................................................................................................................ 70
5 DATA ANALYSIS ....................................................................................... 72
5.1. CONVERSION OF UNITS ...................................................................................................................... 72
5.2. ZOOM AND AGGREGATION ................................................................................................................ 72
5.3. ACCELERATION, VELOCITY AND DISPLACEMENT................................................................................ 74
5.4. EXPOSURE LEVEL CALCULATOR .......................................................................................................... 75
5.4.1. NOISE EXPOSURE ........................................................................................................................................................ 75
5.4.2. HAND-ARM VIBRATION EXPOSURE ............................................................................................................................ 80
5.4.3. WHOLE-BODY VIBRATION EXPOSURE ......................................................................................................................... 81
5.5. HEARING PROTECTORS ....................................................................................................................... 81
5.5.1. PROTECTORS DATABASE ............................................................................................................................................. 82
5.5.2. CLASSIFICATION OF PROTECTORS............................................................................................................................... 84
5.5.3. HML ADJUSTMENT ..................................................................................................................................................... 85
5.6. WHAT IF .............................................................................................................................................. 86
5.7. MARKERS ............................................................................................................................................ 88
5.7.1. CREATING MARKERS ................................................................................................................................................... 88
5.7.2. VIEWING MARKERS .................................................................................................................................................... 89
5.7.3. EDITING MARKERS ...................................................................................................................................................... 90
5.7.4. SPECIAL MARKERS ...................................................................................................................................................... 92
5.8. LOGGER DOSE CALCULATOR .............................................................................................................. 92
5.8.1. CALCULATION OF DOSIMETRIC FUNCTIONS ............................................................................................................... 92
5.8.2. DISPLAYING THE RESULTS OF CALCULATION .............................................................................................................. 93
5.8.3. PREDICTING DOSIMETRIC FUNCTIONS FOR SIMULATED DATA................................................................................... 94
5.8.4. MODIFYING PARAMETERS OF CALCULATION ............................................................................................................. 94
6 OTHER FEATURES .................................................................................... 96
6.1. DATABASE BACKUP AND EXCHANGE ................................................................................................. 96
6.2. QUICK ACCESS TOOLBAR .................................................................................................................... 96

© SVANTEK - 3 - Supervisor User Manual
1 INTRODUCTION
The Supervisor software is designed to extend the functionality of the Svantek instruments for Health and Safety professionals. The Supervisor base module is available for all users free of charge. 1.1. ABOUT SUPERVISOR
General characteristics:
Easy to use, intuitive interface
Easy measurement database management and browsing
Very convenient and fast generation of reports with templates and by free hand
Powerful tools for data analysis
Easy installation including sample measurement files
Available in English, German, Portuguese, Spanish*
Contextual help *coming soon. Main applications:
Noise dosimetry o Exceedance data presentation from measurement files o Noise exposure recalculations in accordance with ISO 9612 o Hearing protection adjustment in accordance with ISO 4869-2 o What-if analysis to simulate effects of noise source insulation
Sound level meters o Time history logger-based recalculations with possibility of break-time and
disturbance removal o 1/1 and 1/3 octave band sound analysis
Vibration dosimetry o Hand-Arm dose recalculations in accordance with ISO 5349-2 o Whole-Body dose recalculations in accordance with ISO 2631-1
Measurement instruments management:
Easy access to instrument configuration and data
Quick measurement data download
Clear setup editor with presets for compliance with health & safety legislation
Inventory management with calibration certificate validity notifications Analysis tools:
Wide range of available charts for adjustable data presentation in plot and table
Quick in-blocks recalculations on time history data
Time history data shifting, clipping and cutting
1/1 octave and 1/3 octave bar and spectrogram plots
Statistical levels presentation
© SVANTEK - 4 - Supervisor User Manual
Additional features:
Easy maintenance with assigning measurement data to locations, users and tasks
Summary reports across wide ranges of measurement data
Widely used intuitive drag-and-drop convention
Audio events, voice comments and WAVE files support 1.2. SYSTEM REQUIREMENTS
1.6 GHz CPU
1 GB RAM
1280×768 pixels color display
50 MB free disk space (more disk space may be necessary in the case of large databases)
MS Windows XP SP3, Vista, 7 or 8; 32- or 64-bit
(recommended) MS Word 2003 or newer for extended reporting capabilities Supervisor supports all Svantek instruments for Health and Safety professionals: SVAN 971, SV 104, SV 106, SVAN 977, SV 102, SV 101, SV 100. 1.3. SOFTWARE INSTALLATION
USB Drivers The USB drivers installation package can be found on the CD received on purchase of a Svantek instrument, or it can be downloaded from the Svantek website. Open the installation file and follow the installation instructions. To complete the installation of the USB drivers it is necessary to connect the instrument after system reboot and to select automatic USB driver installation. It may be necessary to repeat this last step for all USB ports. Note: Installation of USB drivers requires the user to have administrator privileges. Supervisor In order to install Supervisor, open the installation file which can be found on the CD provided with a Svantek instrument. You can also download the installation file from the Svantek website. After opening it, follow the installation instructions. You will be asked whether to install Supervisor for yourself, or for anyone who uses the computer on which Supervisor is being installed. This choice determines the area in which Supervisor settings and shortcuts are stored and hence its availability to users sharing the workstation. 1.4. HOW TO USE SUPERVISOR
Supervisor can be used in three modes:
Instrument,
Data Browser,
Sessions. You can select the mode using the tabs located below the title bar (Fig.1-1). There can be multiple Sessions opened simultaneously, and a tab is created for each opened Session.

© SVANTEK - 5 - Supervisor User Manual
Fig.1-1 Buttons for the selection of modes in which Supervisor can be used.
The Instrument mode allows for:
Managing the Svantek instruments used with Supervisor,
Exchanging data (measurement results as well as the instruments’ settings) between Svantek instruments and PC.
The Data Browser allows for:
Viewing and organizing the database of measurement results downloaded from Svantek instruments,
Creating Sessions. The Sessions serve for displaying the measurement results downloaded from Svantek instruments, stored in the Supervisor’s database, and using them for reporting. More details on using Supervisor for each of these tasks can be found in subsequent sections of this manual, as well as in the contextual HTML help available after pressing F1 when using Supervisor.

© SVANTEK - 6 - Supervisor User Manual
2 COMMUNICATION WITH SVANTEK INSTRUMENTS
2.1. ESTABLISHING CONNECTION
Supervisor supports the USB interface for direct communication. It requires appropriate drivers being installed, as described in Section 1.3. Supervisor will automatically detect a Svantek instrument when it is connected to the PC by USB. 2.2. MANAGING SVANTEK INSTRUMENTS
2.2.1. INSTRUMENT INVENTORY
When a connected Svantek instrument is detected by Supervisor, it is added to the Inventory—a database of all Svantek instruments you use with Supervisor. The Inventory is displayed at the top of the Instrument window (Fig.2-1). Instruments in the Inventory are grouped according to their types (SV 106, SV 104 etc.). To select an instrument type, use the list located on the left side of the window (Fig.2-1). The currently selected instrument is highlighted in orange. The list can be ordered in a custom way; to change the position of an instrument type on the list, drag-and-drop it to another position.
Fig.2-1 The Inventory and the list of instrument types in the Instrument window.
By default, the Inventory is displayed in reduced mode, containing only one row of the table. It can be expanded by clicking on the Inventory button in order to display five rows (Fig.2-2). In both modes all the instruments of the selected type are accessible using the scrollbar, located at the right hand side of the Inventory panel.
List of instrument
types
Inventory

© SVANTEK - 7 - Supervisor User Manual
Fig.2-2 The Inventory in expanded mode.
The columns of the Inventory table contain information about the Svantek instruments. You can customize the table in order to display only selected information. To do so, click with the right mouse button on the header to display the context menu, then check the options you want to show in the Inventory and uncheck the ones you want to hide. The available columns are:
Name – the instrument’s name; only available for SV 104 instruments.
Clock – the date and time set in the real-time clock of the Svantek instrument; you can
adjust it to match the PC’s date and time by pressing the button. You can also click with the right mouse button on the row corresponding to the selected instrument in order to open a context menu, allowing to specify the date and time manually.
Free memory – the amount of free space on the instrument’s SD card in percent. This option is available only for selected types of Svantek instruments.
Firmware version – the version number of firmware installed on the instrument.
Last setup upload date – the date and time when the last setup file was uploaded from Supervisor to the Svantek instrument.
Last uploaded setup name – the name of the last setup file uploaded from Supervisor to the Svantek instrument.
Last setup activation date – the date and time when the last setup file was activated (applied) in the Svantek instrument using Supervisor.
Last activated setup name – the name of the last setup file activated (applied) in the the Svantek instrument using Supervisor. Note: The information about the last uploaded / activated setup files concerns only the setup files uploaded from Supervisor installed on the particular PC, so the setup file in the Svantek instrument can be different (newer) than displayed if it was modified in any other way.
Instrument calibration certificate – the title of the calibration certificate.
Calibration validity date – date of calibration certificate’s validity.
Calibrator Serial Number – serial number of the instrument’s calibrator. Note: The information about calibration can be specified by clicking with the right mouse button on the table row containing a particular Svantek instrument and, in the context menu, selecting the Edit calibration info command (Fig.2-3).
Instrument Calibration Report and Calibrator Calibration Report – for details, see Section 2.2.2 below.
Press this button to expand the Inventory.

© SVANTEK - 8 - Supervisor User Manual
Fig.2-3 Editing calibration information.
The calibration validity date in the Inventory panel is colored according to the time remaining until the validity period is exceeded. By default, the colors mean the following:
Black means that there are at least 90 days left;
Yellow means that there are at least 14, but less than 90 days left;
Orange means that there are less than 14 days left;
Red means that the calibration validity period is already exceeded. These periods can be modified in the General settings in the Main Options dialog box.
Fig.2-4 The calibration validity date is colored according to the proximity of the end of the validity period.
In order to search for the latest firmware for your Svantek instrument in the Internet, click on the instrument’s name in the Inventory table with the right mouse button and, in the context menu, select the Look for new firmware command. In order to remove the device from the Inventory database, select the Remove from Inventory command in the same context menu. In order to unlock additional options or measurement functions of a SV 100, SV 101 or SV 104 instrument that are available on purchase, use the ‘Manage options/functions’ command in the instrument’s context menu. When you click on this command, Supervisor downloads a list of available functionalities from the connected instrument and displays it in the form of two lists: one for options and one for measurement functions (Fig.2-5).
Click with right mouse button

© SVANTEK - 9 - Supervisor User Manual
Fig.2-5 The Manage instrument options / functions dialog box.
The State column, located at the right hand side of each option / function, contains the ‘Enabled’ label for unlocked options / functions, and the ‘Unlock’ button for the ones that have not yet been unlocked. If you wish to unlock an option or function that you purchased, press the ‘Unlock’ button and enter the unlocking code in the window that appears. Note: If wrong code is entered three times since the instrument was last turned on, any later attempt to lock or unlock an option will fail (regardless on whether the entered code is correct or not) until the instrument is restarted.
Fig.2-6 Window allowing to enter code for unlocking an additional option or measurement function.
You can also lock again an unlocked option / function by clicking on its name with the right mouse button, selecting ‘Lock’ and entering the same code that was used for unlocking. In case of SV 104 instruments, the instrument’s name can be specified using the Edit name command, available in the menu opened by clicking with the right mouse button on the row of the Inventory table corresponding to the selected instrument (Fig.2-7).

© SVANTEK - 10 - Supervisor User Manual
Fig.2-7 Editing the name of a SV 104 instrument.
2.2.2. CALIBRATION REPORTS
Word documents and PDF documents, representative of the Svantek instrument’s calibration report and its calibrator’s calibration report, can be assigned to each instrument in the Inventory database. To add a calibration report, click with the right mouse button somewhere in the row of the Inventory table corresponding to the given Svantek instrument and, in the context menu, select the Add instrument calibration report or Add calibrator calibration report command. If the Instrument Calibration report or Calibrator calibration report columns are shown in the
Inventory table, you can also use the corresponding buttons (Fig.2-8). A dialog box will appear, allowing for the selection of file to be used as the calibration report.
Fig.2-8 Assigning calibration reports to a Svantek instrument.
Once a calibration report is added, you can:
open the assigned file—using the context menu or the button,
select another file to be assigned as the report—using the context menu or the button,
Click with right mouse button to open the context menu...
...or use these buttons
Click with the right mouse button to open the context menu.

© SVANTEK - 11 - Supervisor User Manual
remove the report—using the context menu. Note: In order for the described buttons to be available, you have to enable showing the columns corresponding to the calibration reports in the Inventory table. To do so, check the Instrument Calibration Report or Calibrator Calibration Report option in the context menu opened by clicking with the right mouse button on the header of one of the Inventory table’s columns. 2.3. EDITING THE INSTRUMENTS’ SETTINGS
The Setup Editor tool available in the Supervisor application enables one to acquire settings from a connected device and modify them using a clear graphical interface, as well as to store the setup on the PC for later use. In order to use the Setup Editor, open the Settings tab in the Instrument window (Fig.2-9).
Fig.2-9 The Settings tab in the Instrument window.
Svantek instruments’ settings can be edited in Supervisor only in the form of setup files (.svt), stored on the PC. That is, in order to modify the settings of a connected Svantek instrument, you first need to download the setup file. This can be done using the Instrument files / Local files panels. Once a setup file is stored on the PC, it can be opened in order to edit it using the Setup Editor, located on the right side of the screen, and then applied in a connected instrument. It is illustrated in Fig.2-10 and described in detail in the following subsections. Note (for SV 106): Most Svantek instruments store their settings in the form setup (text) files of the same structure as the ones used by Supervisor, but the SV 106 instruments do not. In the latter case, when acquiring settings, Supervisor actually sends a series of inquiries to the SV 106 and generates a setup file according to the provided data. Analogously, when “uploading” a setup file to a SV 106 instrument, in fact Supervisor sends it a series of commands, according to all the specified settings. Therefore, in case of SV 106 instruments, unlike other instruments, it is only possible to modify the current settings of the instrument, not to store multiple setups with different names in the instrument’s memory.

© SVANTEK - 12 - Supervisor User Manual
Fig.2-10 Using Supervisor to edit Svantek instruments’ settings.
2.3.1. DOWNLOADING SETTINGS
First, the type of Svantek instrument has to be selected in the Instruments list on the left side of the screen, and the particular Svantek instrument has to be selected in the Inventory. The list of setup files stored on the selected instrument will be displayed in the Instrument files panel. You can then select a setup file on the list and download it to the PC using the
button. All the downloaded files are displayed in the Local files panel.
Except of SVT files, the Instrument files list also contains the entry which represents the current settings of the device. When you choose to download it, a setup file is generated according to the current settings. If you wish to import setup files stored on the PC to the Supervisor Local files list (i.e. files which you downloaded not using Supervisor, e.g. using the SvanPC++ software, or acquired in any other way, e.g. copied from another PC), you can use the Import button, located below the Local files panel. On the other hand, by pressing the Export button after selecting setup a file in the Instrument files panel, you can store it in a selected location on the PC.
Setup files manager Setup Editor
Select a Svantek instrument to view and edit its settings.

© SVANTEK - 13 - Supervisor User Manual
Fig.2-11 Setup files manager.
The ‘Delete’ buttons located below both of the lists enable one to delete files selected on one of the lists from the connected instrument’s memory or from the local database. The ‘Delete all’ buttons enable one to delete all the files from the connected instrument’s memory or from the local database. By clicking with the right mouse button on a setup file in the Instrument files list you can open a context menu, allowing to perform several actions that are also accessible using the panel’s buttons (described in this and the subsequent sections), viz.: apply settings, download a setup file to the local database, export the settings to a selected location on the PC, and delete selected or all setup files (Fig.2-12).
Fig.2-12 The Instrument files context menu.
Setup files stored on the Svantek
instrument
Current settings of the Svantek
instrument
Setup files stored in the local database
(on the PC)
Press this button to download a selected setup file or the current settings.
Click with the right mouse button on
one of the files to open the menu.
© SVANTEK - 14 - Supervisor User Manual
2.3.2. EDITING SETTINGS
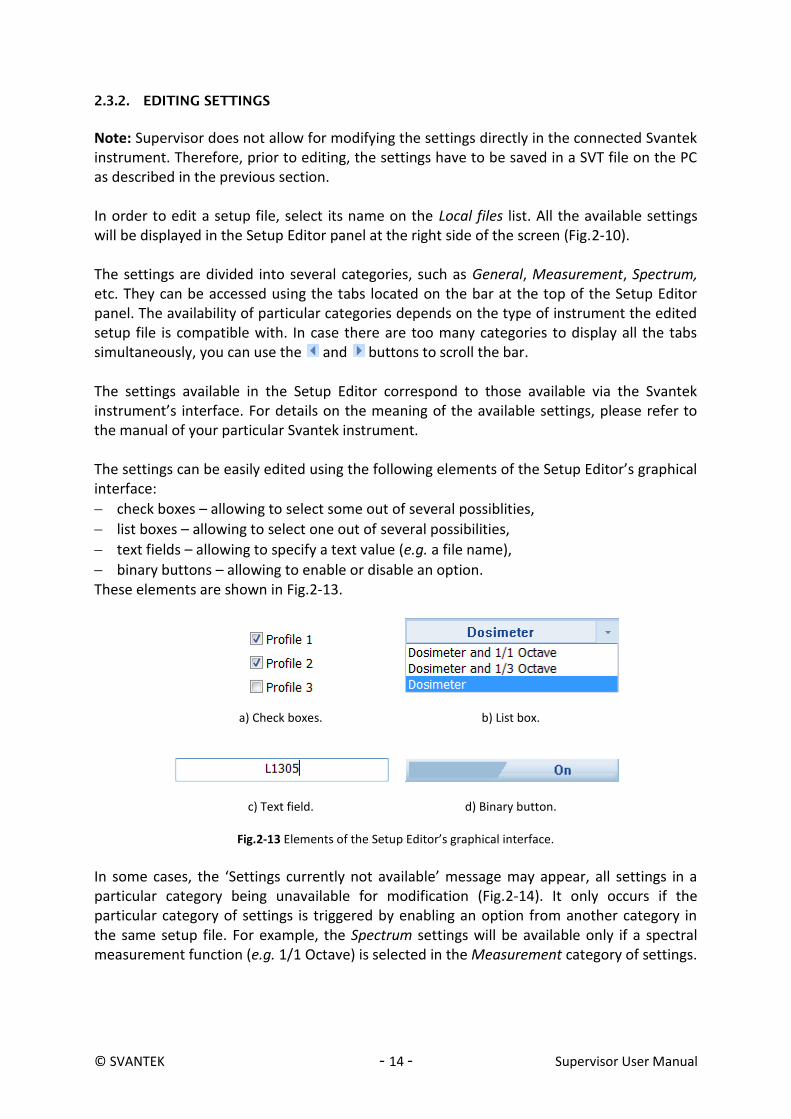
Note: Supervisor does not allow for modifying the settings directly in the connected Svantek instrument. Therefore, prior to editing, the settings have to be saved in a SVT file on the PC as described in the previous section. In order to edit a setup file, select its name on the Local files list. All the available settings will be displayed in the Setup Editor panel at the right side of the screen (Fig.2-10). The settings are divided into several categories, such as General, Measurement, Spectrum, etc. They can be accessed using the tabs located on the bar at the top of the Setup Editor panel. The availability of particular categories depends on the type of instrument the edited setup file is compatible with. In case there are too many categories to display all the tabs simultaneously, you can use the and buttons to scroll the bar. The settings available in the Setup Editor correspond to those available via the Svantek instrument’s interface. For details on the meaning of the available settings, please refer to the manual of your particular Svantek instrument. The settings can be easily edited using the following elements of the Setup Editor’s graphical interface:
check boxes – allowing to select some out of several possiblities,
list boxes – allowing to select one out of several possibilities,
text fields – allowing to specify a text value (e.g. a file name),
binary buttons – allowing to enable or disable an option. These elements are shown in Fig.2-13.
a) Check boxes.
b) List box.
c) Text field.
d) Binary button.
Fig.2-13 Elements of the Setup Editor’s graphical interface.
In some cases, the ‘Settings currently not available’ message may appear, all settings in a particular category being unavailable for modification (Fig.2-14). It only occurs if the particular category of settings is triggered by enabling an option from another category in the same setup file. For example, the Spectrum settings will be available only if a spectral measurement function (e.g. 1/1 Octave) is selected in the Measurement category of settings.

© SVANTEK - 15 - Supervisor User Manual
Fig.2-14 An example of a category of settings unavailable due to some other options in the same setup file being disabled.
Changes that are made in setup files using the Setup editor are not automatically saved. You can save the changes by pressing the Save button, located below the Local files panel. Supervisor also automatically proposes to save the changes every time you perform an action that remove the focus from the currently edited setup file, such as uploading the setup file, opening another one, etc. You can also perform several operations on a setup file, such as e.g. renaming or deleting, by clicking with the right mouse button on its name. The Export command can be used to save a copy of the setup file in a selected location or with a different file name. If you want to create a setup similar to one already stored in a file, but do not want to lose the original setup, you can use the Duplicate command available in the context menu (accessed by clicking with the right mouse button on the name of a selected setup file). Note: The asterisk (*) added at the beginning of a file name in the Local Files list indicates that the settings displayed in the Setup Editor differ from those stored in the file, i.e. changes have been made in the loaded settings but not yet saved. However, if you try to leave the Setup Editor without saving the changes, you will be asked for confirmation. Note: The list of setup files displayed in the Local files panel contains only the setup files compatible with the instrument type currently selected in the Inventory. 2.3.3. APPLYING SETTINGS
You can upload a setup file, selected in the Local files list, to a connected Svantek instrument
by pressing the button in the Setup files manager panel. The uploaded file will be stored in the instrument’s memory, but the settings will not be automatically applied. In order to apply a setup file (causing the instrument’s settings to become same as specified in the file), press the Apply button located below the Instrument files list (see Fig.2-16), or use the Apply command in the menu opened by clicking with the right mouse button on a file in the Instrument files list. Note: A setup file with filename ‘Settings’ is automatically applied after upload. Note (for SV 106): As mentioned in the Note for SV 106 at the beginning of Section 2.3, uploading any setup files to a connected SV 106 instrument is always equivalent to configuring the instrument’s settings by sending a series of commands. Therefore, each
© SVANTEK - 16 - Supervisor User Manual
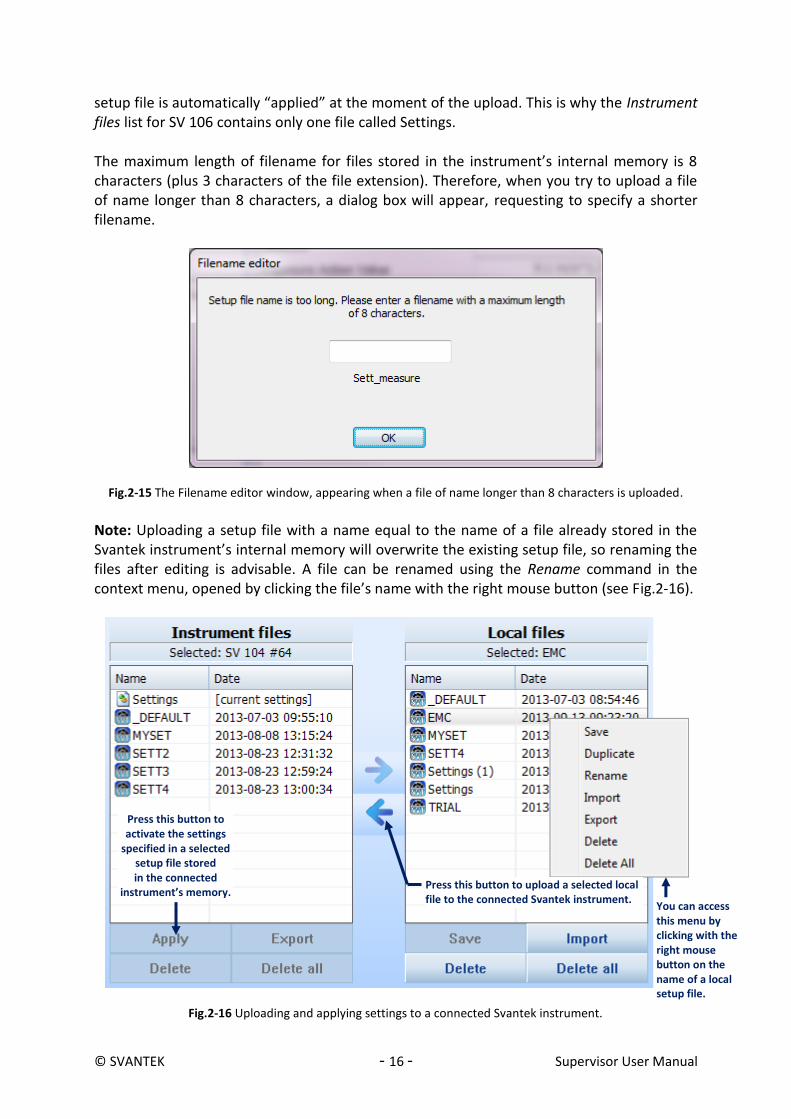
setup file is automatically “applied” at the moment of the upload. This is why the Instrument files list for SV 106 contains only one file called Settings. The maximum length of filename for files stored in the instrument’s internal memory is 8 characters (plus 3 characters of the file extension). Therefore, when you try to upload a file of name longer than 8 characters, a dialog box will appear, requesting to specify a shorter filename.
Fig.2-15 The Filename editor window, appearing when a file of name longer than 8 characters is uploaded.
Note: Uploading a setup file with a name equal to the name of a file already stored in the Svantek instrument’s internal memory will overwrite the existing setup file, so renaming the files after editing is advisable. A file can be renamed using the Rename command in the context menu, opened by clicking the file’s name with the right mouse button (see Fig.2-16).
Fig.2-16 Uploading and applying settings to a connected Svantek instrument.
Press this button to upload a selected local file to the connected Svantek instrument.
You can access this menu by clicking with the right mouse button on the name of a local setup file.
Press this button to activate the settings
specified in a selected setup file stored in the connected
instrument’s memory.

© SVANTEK - 17 - Supervisor User Manual
During the upload, Supervisor automatically checks the compatibility of the Svantek instrument’s firmware version and the firmware version for which the uploaded setup file was created. If the versions differ, the settings that are incompatible will be converted to match the instrument’s firmware. You can choose whether or not you want to be asked to confirm the upload every time the setup file is incompatible with the instrument’s firmware. To do so, use the Ask to confirm uploading setups with different firmware versions checkbox in the General tab in the Main Options dialog box. 2.3.4. USING PRESETS
In case of some types of Svantek instruments, the dosimetric profiles (available in the Dosimeter category of settings in the Setup editor) can be configured using so-called presets. A presets is a set of values of parameters related to the dosimetric profile, such as e.g. Filter or Detector. There are two types of presets: predefined and user-defined. The five predefined presets are provided with Supervisor by default and are compliant with the following health and safety norms:
OSHA HC – Occupational Safety and Health Administration Hearing Conservation
OSHA PEL – Occupational Safety and Health Administration Permissible Exposure Level
MSHA HC – Mine Safety and Health Administration Hearing Conservation
MSHA PEL – Mine Safety and Health Administration Permissible Exposure Level
ACGIH – American Conference of Governmental Industrial Hygienists Except for these predefined presets, you can create up to three user-defined presets, consisting of the values of parameters which you can specify.
Fig.2-17 Configuration of dosimetric profiles using presets.
Different presets can be selected for each profile independently. In order to configure one of the profiles according to a preset, use the Preset list-box (see Fig.2-17). The first preset on the list, marked as [Current], represents the profile configuration currently saved in the edited setup file. It is provided so you can reset the changes you made in Setup Editor by
Current profile settings
Predefined presets
User-defined presets
Parameters whose values are specified
in presets
A parameter unaffected by
presets
Use these buttons to select presets.
Press this button to change the name of the selected preset.
© SVANTEK - 18 - Supervisor User Manual
selecting it. If you make any changes in the Current preset, its name will be cleared (the currently selected preset will be called None). When you select one of the predefined presets, the elements of the interface related to the parameters whose values are specified by the preset will be disabled. In order to change the values of those parameters, you need to select the current preset or a user-defined preset. Note that the presets do not specify the values of all parameters; the parameters whose modification remains possible after selecting a predefined preset do not belong to the presets. These parameters are separated from the ones belonging to presets with a blank row. You can create a user-defined preset by selecting one of the three last presets on the list and configuring the profile in a way you want it to be stored in the preset. The changes are automatically remebered by Supervisor. You can change the name of the preset using the
button. Note: The three user-defined presets correspond only to the currently selected type of Svantek instrument. Different three presets are stored for each instrument type.

© SVANTEK - 19 - Supervisor User Manual
3 MANAGING MEASUREMENT DATA
3.1. DOWNLOADING FILES
In order to download files from a connected Svantek instrument, open the Download tab in the Instrument window (Fig.3-1).
Fig.3-1 The Download tab in the Instrument window.
3.1.1. DOWNLOADING MEASUREMENT RESULTS
The Download panel contains a list of files stored in the connected Svantek instrument’s memory in the form of a table. Various types of files are displayed there, e.g. measurement files, voice comment files, etc. The first three columns of the table contain basic information about the files: filename, size in bytes and date of creation. The last three columns contain additional information (concerning location, users and tasks) assigned to the files; it is described in detail in Section 3.3.1. Files that have not yet been downloaded are displayed with bold font. Note: Only files stored on the instrument selected in the Inventory are displayed. For details on using the Inventory, see Section 2.2.1.
Fig.3-2 Downloading files from a Svantek instrument using Supervisor.
Files that have not yet been downloaded are displayed with bold font.
Select files on this list and press this button to download files from the connected instrument to the Supervisor’s database.

© SVANTEK - 20 - Supervisor User Manual
To download files, use the Download button located below the files table on the left side of the Download panel. If one or more files are selected in the table, pressing the Download button will cause the download of the selected files. Otherwise, pressing this button will cause the download of all of the files stored on the connected instrument. Note: You can select files by clicking the a row of the table. Clicking with the CTRL or SHIFT button pressed allows to select multiple files. If you check the Delete file(s) after downloading box, located under the Download button (see Fig.3-3), all the downloaded files will automatically be deleted from the instrument’s memory after downloading to Supervisor.
Fig.3-3 The Delete file(s) after downloading checkbox.
The buttons located at the right side of the Download panel enable one to perform some basic operations concerning the files stored on the connected instrument:
Refresh – updates the list of files, so that all the files created after you entered the Download panel will also be shown.
Change dir – opens the Change folder dialog box, allowing to select a directory in the Svantek instrument’s memory from which files are displayed in the Download panel (Fig.3-4). Note: It is not available for some types of Svantek instruments.
Delete – deletes a selected file from the Svantek instrument’s memory.
Delete all – deletes all result, logger, and WAVE files in the instrument’s current working directory.
Select all – selects all files in the table.
Deselect all – clears the selection. Note: In case of the SV 100, SV 101, SV 102 and SV 106 instruments, it is not possible to delete a single logger file. In this case, when only logger files are selected on the list, the Delete button is disabled; pressing Delete when results files and logger files are selected will only delete the results files; downloading logger files with the Delete file(s) after downloading option enabled will not cause the deletion of the logger files.

© SVANTEK - 21 - Supervisor User Manual
Fig.3-4 The dialog box allowing to select the directory in the Svantek instrument’s memory
from which files are displayed in the Download panel.
Note: Every time the list of files is refreshed, a new “downloading session” begins, i.e. a new subdirectory is created for the downloaded files. This is why sometimes the overwrite warning does not appear even though two files of the same name are downloaded—after beginning a new downloading session, the file will be stored in a different location, thus eliminating the possibility of overwriting. By clicking with the right mouse button in the list of files stored on the connected Svantek instrument, you can open a context menu allowing to perform several actions on the selected files: download them to the local database, export to a selected location on the PC, or delete them from the instrument’s memory, as well as delete all the files stored on the connected Svantek instrument.
Fig.3-5 The context menu available for the list of files in the Download panel.
All the downloaded files are stored in the Supervisor’s database and they can be viewed and processed using the Data Browser, which is described in the following section. The Data Browser is automatically opened each time files are downloaded from a connected Svantek instrument.

© SVANTEK - 22 - Supervisor User Manual
3.1.2. DOWNLOADING AUDIO COMMENTS
SVAN 971 and SV 104 instruments support attaching audio comments, in the form of .WAV files, to logger measurement files. Such audio files are, by default, not shown in the files list of the Download panel. Furthermore, the are also (by default) downloaded automatically when the logger file to which they are attached is downloaded. However, you can modify this settings in order to treat the audio comments files in the same way as all the other types of files downloaded from connected Svantek instruments. To do so, go to the General settings in the Main Options dialog box and use the following checkboxes:
Download associated audio comments after downloading logger(s) – if this option is enabled, the audio comments will be downloaded automatically when the logger file to which they are attached is downloaded.
Hide audio comments in Download panel – if this option is enabled, audio comment files will not be displayed in the files list of the Download panel.
Fig.3-6 Settings of the downloading of audio comments in the Main Options.
Playback of the downloaded audio comments is described in Section 3.2.2. 3.2. DATA BROWSER
In order to view all the files downloaded from Svantek instruments and stored in the Supervisor’s database, open the Data Browser using the button located in the top-left corner of the Supervisor window.
Click on the Svantek icon to open the menu.
Options related to downloading audio
comments

© SVANTEK - 23 - Supervisor User Manual
Fig.3-7 Button for opening the Data Browser.
The Data Browser is composed of three panels:
on the left side of the window, the File manager panel contains a list of all files stored in Supervisor’s database and allows to select a group of files to be displayed in detail.
on the right side of the window, the File details panel contains a more detailed list of files belonging to a selected group and allows to open a file for further processing.
below the File details panel, the Preview panel enables to preview data contained in a selected file.
Fig.3-8 The Data Browser window.
3.2.1. FILE MANAGER
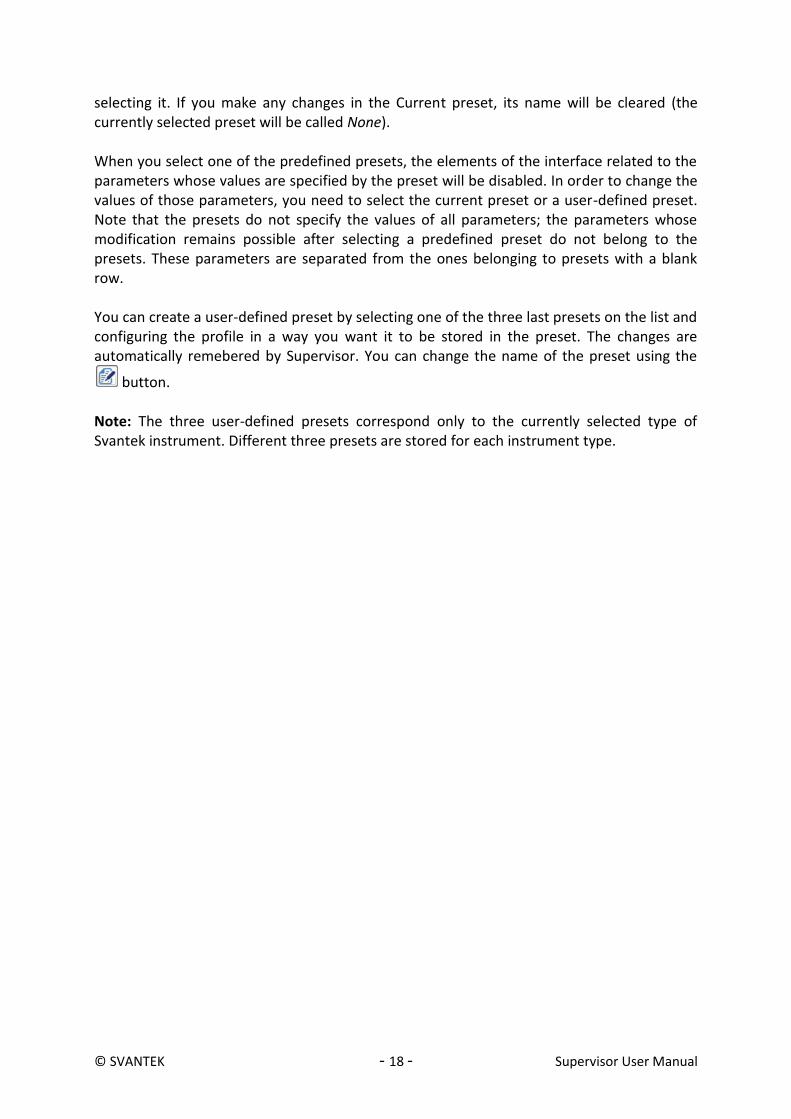
The File manager panel can be used to select a group of files to be displayed in detail. It is divided into six sub-panels: Library, Archived sessions, Summary reports, Locations, Users, and Tasks. Each of them can be accessed by pressing the horizontal bar with the respective name (see Fig.3-9).
File details
Preview
File manager
© SVANTEK - 24 - Supervisor User Manual
Fig.3-9 The File manager.
Library The Library sub-panel lists all the files stored in the database using a tree view. It contains four base items:
The Sample files item contain some sample files provided with Supervisor, grouped further according to the type of measurement they refer to.
The Catalogue item contains all the files downloaded from instruments. You can arrange the Catalogue in any way by adding, deleting, moving and renaming files and folders. You can easily move files and folders, as well as add them to the database from any location on the PC, using the drag & drop technique. You can also use the context menu, opened by clicking with the right mouse button, for various operations on files and folders. Note: It is also possible to export files from the Supervisor’s database using the drag & drop technique outside the application window (dropping files into Windows Explorer).
The Recent item contains two sub-items: Flagged, which is a folder for grouping a number of selected files—in order to add a file to this group, you have to set its flag, which can be done in the File details panel; and Last downloaded, which contains a list of files downloaded since the last launch of Supervisor.
The Assigned item contains all files to which additional information about location, user, and task performed during measurement have been assigned. For details on assigning additional information to files, see Section 3.3.
Archived sessions The Archived sessions sub-panel contains a list of all the sessions that have been moved to archive. You can use this list to restore an archived session for viewing and processing it again, or to use files which have been used to create that session. In case many sessions are archived, you can use filters to display only some of them (see Fig.3-10). Sessions are described in detail in Section 4.
Press one of these horizontal bars to select a sub-panel of
the Files manager.

© SVANTEK - 25 - Supervisor User Manual
Fig.3-10 Filtering archived sessions.
Summary reports The Summary reports sub-panel contains a list of Summary reports that you have created. The Summary reports can be used to gather selected measurement results according to additional information that has been assigned to them. It is treated in more detail in Section 3.3.4. Locations, Users and Tasks The last three sub-panels of the File manager contain files listed according to additional information assigned to them. Such assignments are treated in more detail in Section 3.3. 3.2.2. FILE DETAILS
The File details panel contains a table in which files corresponding to the selected item of the File manager are described. The files corresponding to all sub-items of the selected item are also shown in the Files details panel. The files can be further processed by using them to create a session. In order to create a session, select one or more files, open the context menu by clicking with the right mouse button and select New session. If you want to create a session starting with only one file, you can do it by double-clicking with the left mouse button the row of the table corresponding to that file. Sessions are described in Section 4.
In order to filter archived sessions use the context menu opened by clicking with the right mouse button . . .
. . . or use this button.

© SVANTEK - 26 - Supervisor User Manual
Note: You cannot create a session using files shown by the Other filter.
Fig.3-11. The File details panel.
Customizing the table The table in the center of the File details panel contains some information about the displayed files. The contents of this table can be customized by selecting columns to be shown. In order to do so, click with the right mouse button on one of the columns’ headers, and use the checkboxes in the context menu to show or hide particular columns (Fig.3-12).
Fig.3-12 Customizing the File details table.
You can also rearrange the order of the columns by clicking on a column’s header and dragging it to another place.
File filters
Use this command to create a session using the selected file (you can also double-click the file).
Use these buttons to add selected files to the Flagged group.
Click with the right mouse button on the column’s header in order to open the menu.
Use the checkboxes to select information to be shown.

© SVANTEK - 27 - Supervisor User Manual
Filtering the list of files Buttons at the top of the File details panel serve for filtering the list of files. Buttons in the first row correspond to different file types (such as WAVE files) or types of measurement (such as hand-arm vibration dosimetry or noise dosimetry). After clicking one of these buttons, only the files of the selected type or related to the selected type of measurement are displayed on the list. The Other filter serves for accessing files other than measurement files coming from Svantek instruments supported by Supervisor, e.g. *.jpeg or *.doc files. Note: Files which are hidden because of different filters being enabled (such as S/N, date, filename) will remain hidden when the Other filter is enabled. Buttons in the second row correspond to different types of filters, related with the date of measurement, serial number of the instrument used for measurement, and filename. To set such filter, enable it by clicking on its name and set its value in the field next to the name. You can also use the Show logger files button to enable / disable showing logger files on the list (which is applicable for instruments that store main results and time history buffer separately). All these filters can be disabled by pressing the Clear filters button (all files will be shown after doing it). Note: The Filename filter supports the MS-DOS wildcard characters, i.e. the question mark (“?”) can be used to substitute for any single character, and the asterisk (“*”) can be used to substitute for any sequence of characters.
Fig.3-13 Using a filter to show only the results of measurement performed using an instrument of specified serial number. Other filters can be used in a similar way.
Setting flags
By pressing the button located in the first column at the left side of the File details table you can set a flag for a selected file. As a result, the file will be accessible in the File manager in the Recent → Flagged group. You can flag several files in order to get a quick and easy access to them. Audio comments In case there are audio comments attached to a logger file, the Notes column of the file
details table will contain the button in the row corresponding to that logger file. Pressing this button will open a menu, containing a list of all comments attached to the selected logger file (Fig.3-14). Selecting one of the comments will start its playback.
1. Press to enable filtering.
2. Specify the filter’s value.

© SVANTEK - 28 - Supervisor User Manual
Note: In order to see the Notes column and enable playback of audio comments, you have to check the appropriate option in the File details table’s context menu (see paragraph Customizing the table, above).
Fig.3-14 Playback of the audio comments.
You can adjust the audio playback settings, such as the device used for playback and the length of the buffer, in the Audio Playback panel of the Main Options dialog box. Dragging files outside Supervisor You can easily export files from the Supervisor’s database to a selected location on the PC using the drag & drop technique outside of the application window.
Fig.3-15 Using the drag & drop technique to export files outside the Supervisor’s database.
Note: Exporting measurement files with comments (e.g. WAVE files) attached to them automatically exports the comment files too. In order to export a single file without the attached comments, use the drag & drop technique with the CTRL button pressed. 3.2.3. PREVIEW
The panel below the File details table provides a short preview of the data stored in the selected file, giving an initial idea of the time history of the measurement results (Fig.3-8). In case multiple files are selected, the file which is actually used as source of displayed data is specified in the top left corner of the preview panel.
Press this button to show the list of audio comments attached to this logger file.
Select one of the audio comments to start its playback.

© SVANTEK - 29 - Supervisor User Manual
You can specify the kind of data (and the order of their priority) to be displayed in the Preview panel using the Preview settings in the Main Options dialog box. Different kinds of data are available for different applications, such as Hand-arm vibration dosimetry, Whole-body vibration dosimetry, SLM and Noise dosimetry. To choose the application, use the list box at the top of the Preview settings panel. It is possible to select different kinds of data for the Parameters & results panel (on the left hand side of the Preview panel, displaying data in numerical form) and for the Plot panel (on the right hand side of the Preview panel, displaying data in graphical form).
Fig.3-16 The Preview settings in the Main Options dialog box.
3.3. USING ASSIGNMENTS
Three types of additional information can be assigned to each file downloaded from a Svantek instrument:
Location (where the measurement was carried out),
User (whom the measurement concerned),
Task (which was being performed by the user during the measurement). This information can then be used to facilitate searching for particular measurement results and to generate summary reports. 3.3.1. ASSIGNING INFORMATION TO FILES
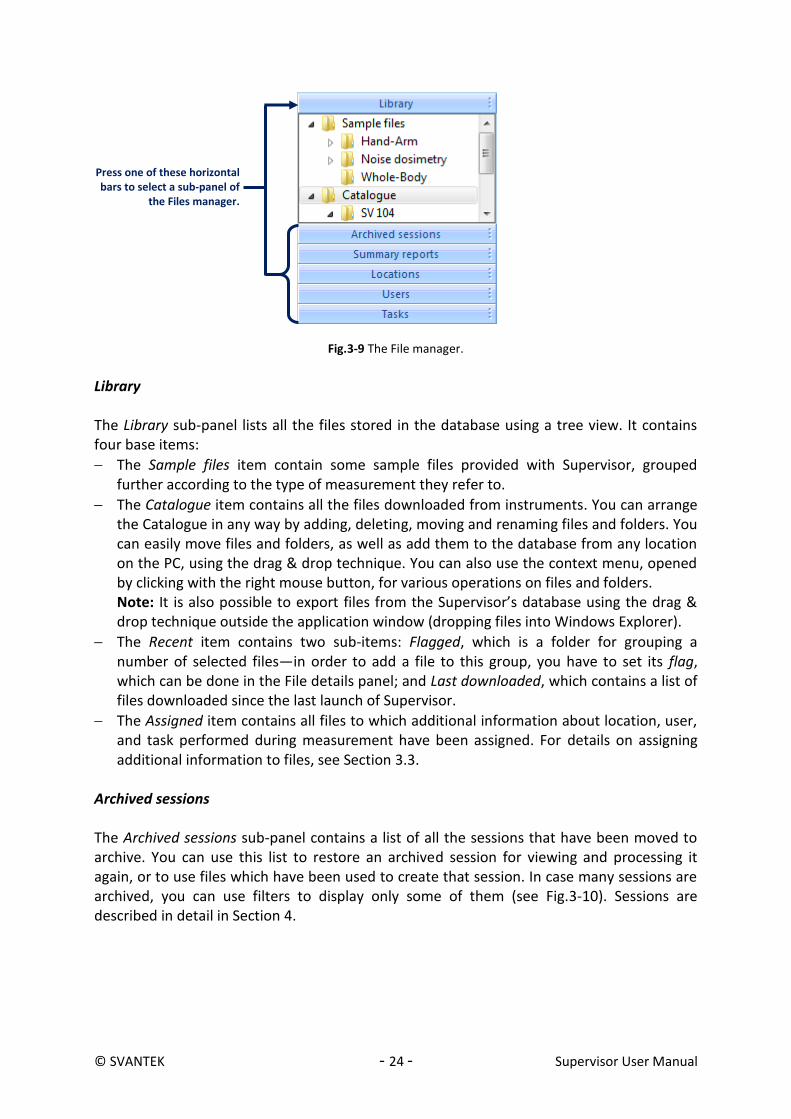
You can assign this additional information to the files when you download them from the connected instrument. In order to do so, in the Instrument → Download panel (described in Section 3.1), select one or more files, select the location / user / task in the respective list-box located at the bottom-right corner of the window and press Apply (Fig.3-17). If you want to add a new location, user or task, in the list-box select [new...]. If you want to erase
Click on the Svantek icon to open the menu.
Select Preview on the list of available settings
© SVANTEK - 30 - Supervisor User Manual
information already assigned, select [none]. Chosen values will be assigned upon downloading files to the Supervisor’s database.
Fig.3-17 Assigning additional information to downloaded files in the Instrument → Download panel.
You can also assign additional information to files in several ways using the Data Browser. In the File details table, click with the left mouse button on the Location / User / Task field corresponding to a selected file, and select a value from the menu.
Fig.3-18 Assigning User information to a file in the File details table.
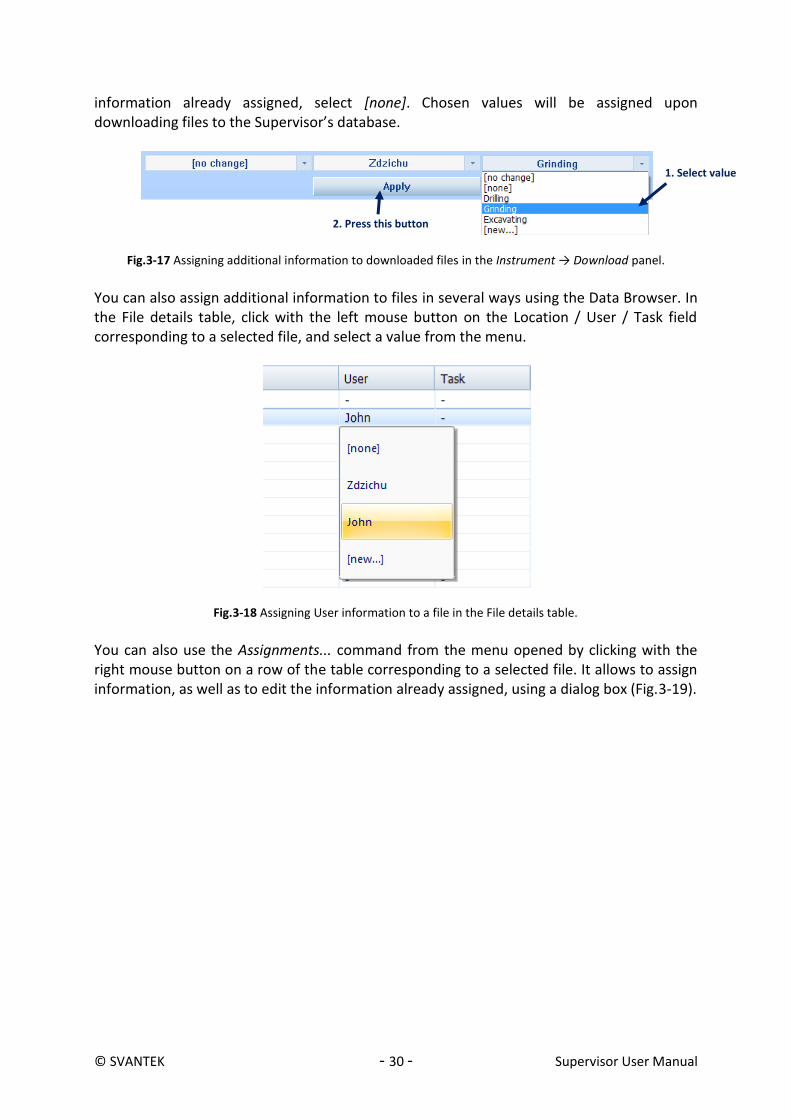
You can also use the Assignments... command from the menu opened by clicking with the right mouse button on a row of the table corresponding to a selected file. It allows to assign information, as well as to edit the information already assigned, using a dialog box (Fig.3-19).
1. Select value
2. Press this button
© SVANTEK - 31 - Supervisor User Manual
Fig.3-19 Assigning additional information to files using the Assignments dialog box.
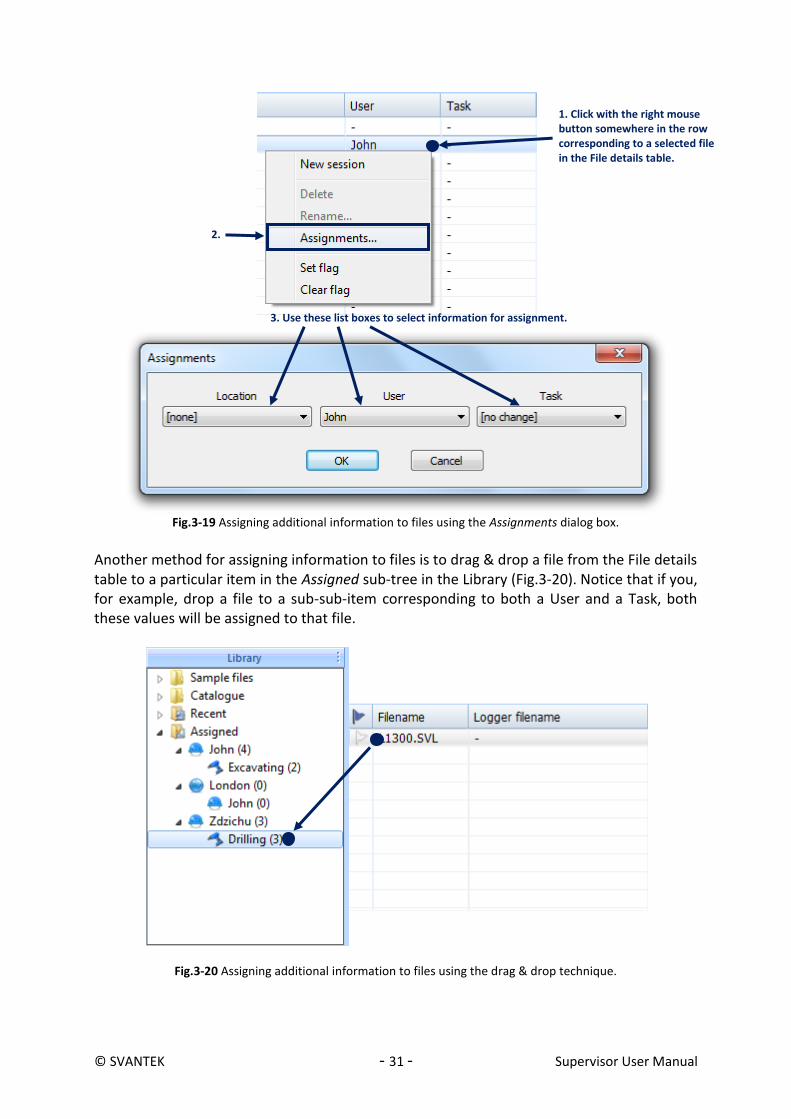
Another method for assigning information to files is to drag & drop a file from the File details table to a particular item in the Assigned sub-tree in the Library (Fig.3-20). Notice that if you, for example, drop a file to a sub-sub-item corresponding to both a User and a Task, both these values will be assigned to that file.
Fig.3-20 Assigning additional information to files using the drag & drop technique.
1. Click with the right mouse button somewhere in the row corresponding to a selected file in the File details table.
2.
3. Use these list boxes to select information for assignment.
© SVANTEK - 32 - Supervisor User Manual
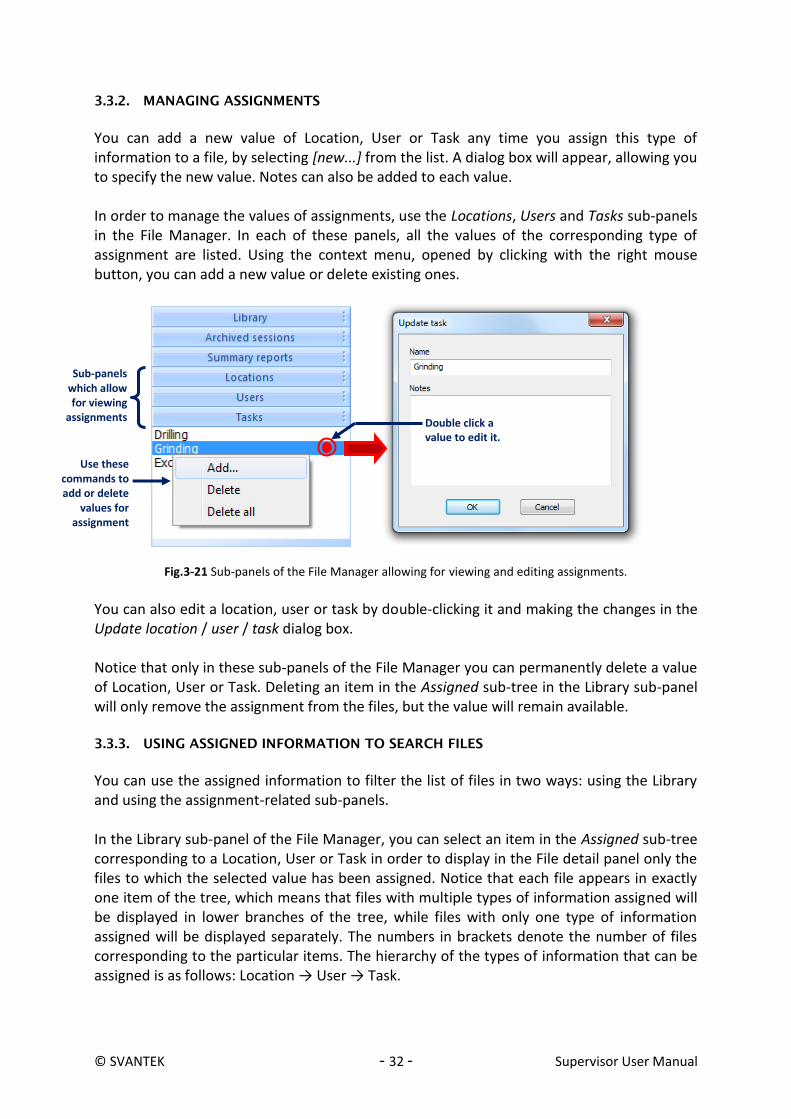
3.3.2. MANAGING ASSIGNMENTS
You can add a new value of Location, User or Task any time you assign this type of information to a file, by selecting [new...] from the list. A dialog box will appear, allowing you to specify the new value. Notes can also be added to each value. In order to manage the values of assignments, use the Locations, Users and Tasks sub-panels in the File Manager. In each of these panels, all the values of the corresponding type of assignment are listed. Using the context menu, opened by clicking with the right mouse button, you can add a new value or delete existing ones.
Fig.3-21 Sub-panels of the File Manager allowing for viewing and editing assignments.
You can also edit a location, user or task by double-clicking it and making the changes in the Update location / user / task dialog box. Notice that only in these sub-panels of the File Manager you can permanently delete a value of Location, User or Task. Deleting an item in the Assigned sub-tree in the Library sub-panel will only remove the assignment from the files, but the value will remain available. 3.3.3. USING ASSIGNED INFORMATION TO SEARCH FILES
You can use the assigned information to filter the list of files in two ways: using the Library and using the assignment-related sub-panels. In the Library sub-panel of the File Manager, you can select an item in the Assigned sub-tree corresponding to a Location, User or Task in order to display in the File detail panel only the files to which the selected value has been assigned. Notice that each file appears in exactly one item of the tree, which means that files with multiple types of information assigned will be displayed in lower branches of the tree, while files with only one type of information assigned will be displayed separately. The numbers in brackets denote the number of files corresponding to the particular items. The hierarchy of the types of information that can be assigned is as follows: Location → User → Task.
Sub-panels which allow for viewing
assignments
Use these commands to add or delete
values for assignment
Double click a value to edit it.

© SVANTEK - 33 - Supervisor User Manual
Fig.3-22 The Assigned sub-tree in the Library.
On the contrary, in the Locations, Users and Tasks sub-panels, the lists of files with the respective types of information assigned are generated independently of the other types of information, i.e. when the Excavating task is selected in the Tasks sub-panel, all the files with this task assigned will be shown, regardless of whether they do or not have an assigned Location or User. The Remove empty locations/users/tasks command deletes all items that do not contain any files from the list. It can be accessed by clicking with the right mouse button on the ‘Assigned’ item.
Fig.3-23 The Remove empty locations/users/tasks command.
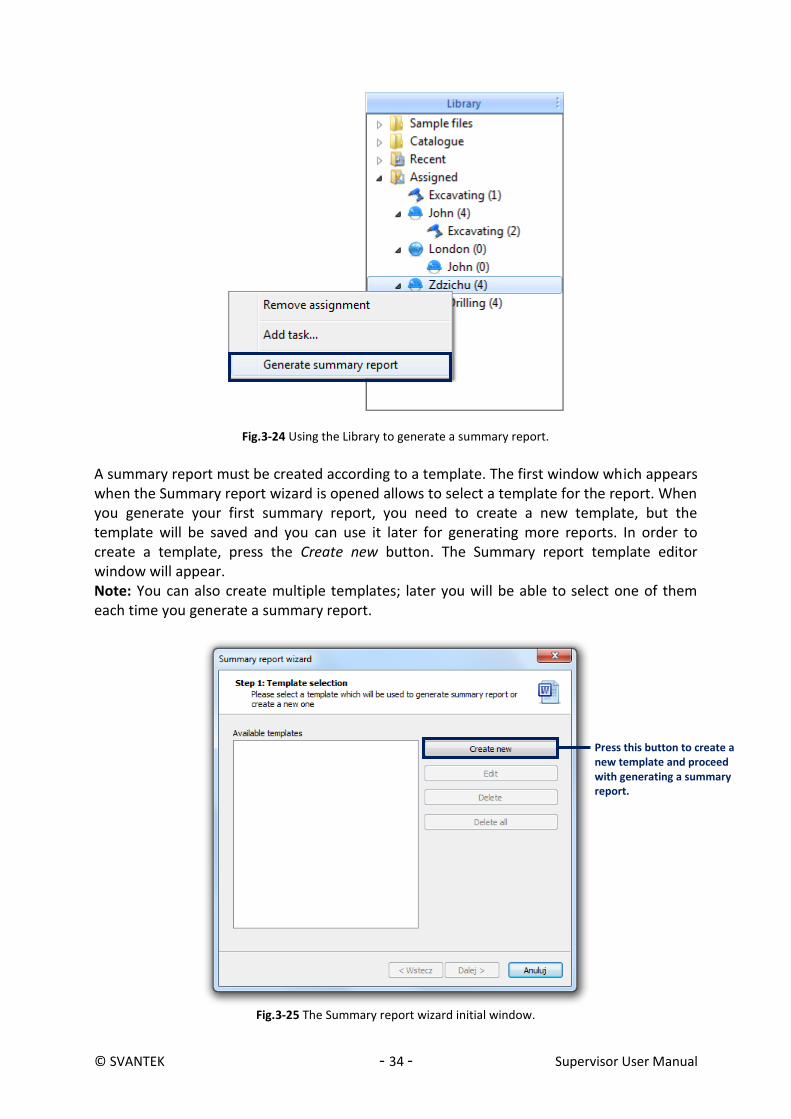
3.3.4. SUMMARY REPORTS
The summary reports can be used to gather measurement results related to a particular location or user in the form of MS Word documents. In order to create a summary report, click with the right mouse button on an item corresponding to a location or user in the Assigned sub-tree in the Library sub-panel of the File Manager and select Generate summary report (Fig.3-24). This command opens the Summary report wizard.
Files to which the Excavating task is assigned, but with no information
about location or user. Files to which Excavating and John are assigned, but w ith no information about location. Such items are deleted from
the Assigned list after using the Remove empty locations /
users / tasks command.
Click on the ‘Assigned’ item with the right mouse button.
© SVANTEK - 34 - Supervisor User Manual
Fig.3-24 Using the Library to generate a summary report.
A summary report must be created according to a template. The first window which appears when the Summary report wizard is opened allows to select a template for the report. When you generate your first summary report, you need to create a new template, but the template will be saved and you can use it later for generating more reports. In order to create a template, press the Create new button. The Summary report template editor window will appear. Note: You can also create multiple templates; later you will be able to select one of them each time you generate a summary report.
Fig.3-25 The Summary report wizard initial window.
Press this button to create a new template and proceed with generating a summary report.

© SVANTEK - 35 - Supervisor User Manual
A template of the summary report consists of a set of parameters (i.e. the parameters of the Svantek instrument, parameters of the measurement, and measured quantities) to be displayed in numerical form, and another set of parameters to be displayed on a plot. In order to create a template, first specify the application you intend to use it for, since it determines the availability of particular parameters. The application can be specified using the list box in the top-right corner of the window. Next, select the parameters to be included in the report using the template editor, as presented in Fig.3-26.
Fig.3-26 The summary report template editor dialog box.
After you have created a report template, you can select it on the list of the Summary report wizard and press the Continue button to proceed. In the second step of generating the summary report, you can select the time interval from which results will be included. After specifying the minimum and maximum date, press Finish to generate the report.
Add / remove a parameter to be
displayed in numerical form
Arrange the order of parameters displayed in numerical form
Specify the application for your summary report (determines the availability of parameters)
Add / remove a parameter to be displayed on a plot
Choose whether the scale of the Y axis in the generated plots should be adjusted automatically or set manually.
Select filters and logger display mode

© SVANTEK - 36 - Supervisor User Manual
4 SESSIONS AND REPORTING
In Supervisor, the sessions can be used to work with data downloaded from Svantek instruments and to create reports containing these data. Note: An interactive guide showing how to use Supervisor as a tool for quick reporting is available on the Svantek website. 4.1. SESSIONS
4.1.1. CREATING AND MANAGING SESSIONS
To create a session, go to Data Browser. In the File Details table, select the files which contain the data you wish to work with, click with the right mouse button and select New session. You can create a session with one or multiple files.
Fig.4-1 Creating a new session using the Data Browser.
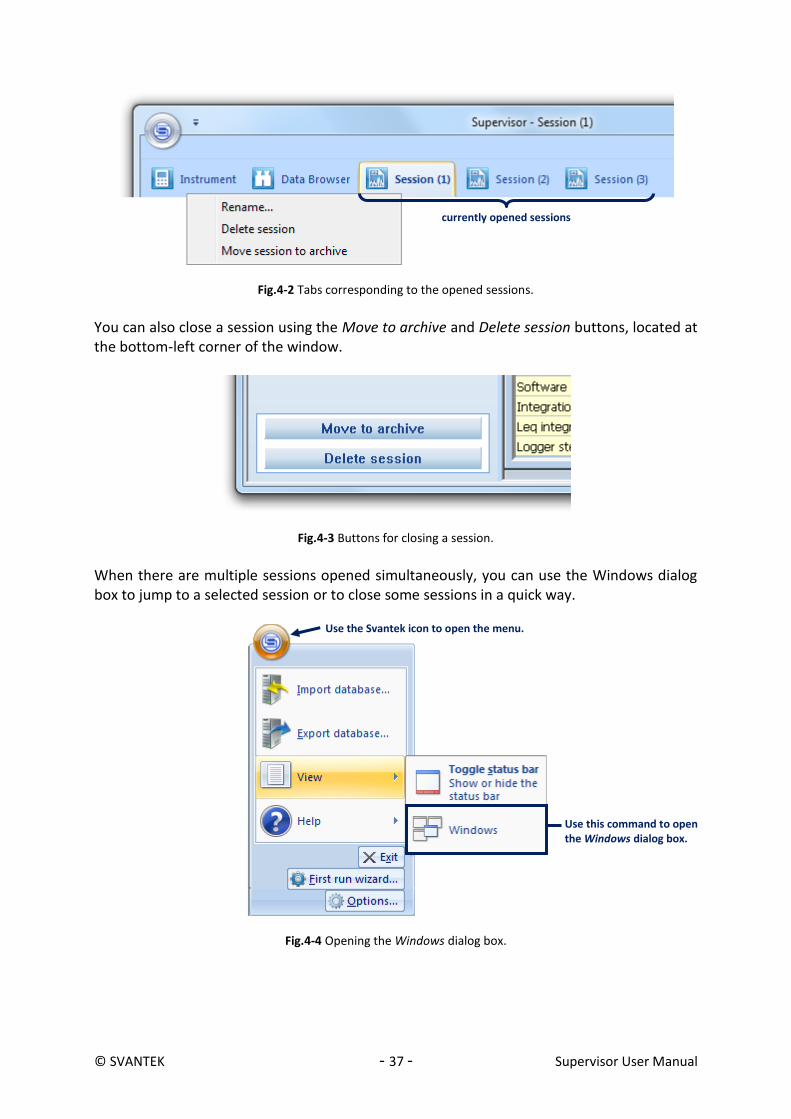
For each new session a tab is created on the bar at the top of the application window (Fig.4-2). To open a session, click on the tab with the left mouse button. By clicking on a tab with the right mouse button you can open a context menu, allowing to specify a custom name for a session or to close it. You can close a session in two ways: by deleting it (permanently), or by moving it to the archive, which will allow you to later work with that session again. Deleting a session does not cause measurement files to be deleted. The archived sessions are available in the Data Browser, in the Archived sessions sub-panel of the File Manager (see Section 3.2.1).
Open the Data Browser
© SVANTEK - 37 - Supervisor User Manual
Fig.4-2 Tabs corresponding to the opened sessions.
You can also close a session using the Move to archive and Delete session buttons, located at the bottom-left corner of the window.
Fig.4-3 Buttons for closing a session.
When there are multiple sessions opened simultaneously, you can use the Windows dialog box to jump to a selected session or to close some sessions in a quick way.
Fig.4-4 Opening the Windows dialog box.
currently opened sessions
Use this command to open the Windows dialog box.
Use the Svantek icon to open the menu.

© SVANTEK - 38 - Supervisor User Manual
Fig.4-5 The Windows dialog box, allowing to manage multiple sessions.
4.1.2. SESSION DATA
The measurement data used to create sessions are contained in files, stored in Supervisor’s local database (more details about downloading and storing measurement data can be found in Section 3). Several files can be used to create a single session. A list of files which have been used to create the currently opened session is displayed in the Session data panel at the top-left corner of the window.
Fig.4-6 The Session data panel, containing a list of files which have been used to create the current session.
Once a session is created, you cannot modify its data source. If you want to use different files in a session, you must create a new session with these files. You can configure the way data will be displayed in the report using the so-called panels. Various types of panels are available, each of which serves for displaying different type of data. More details about the panels can be found in Section 4.2.
Click on the bar to hide the panel.
Press this button to jump to the session selected on the list.
List of currently opened sessions

© SVANTEK - 39 - Supervisor User Manual
4.1.3. TOOLBAR
The Toolbar consists of a set of useful buttons, located at the top of the panels area (see Fig.4-12). The effect of each of the Toolbar buttons is described in Table 4-1.
Fig.4-7 The Toolbar.
Table 4-1 Toolbar buttons.
Icon Effect
Generates a new report according to the configuration of panels in the current session and opens it in Microsoft Word.
Generates a report preview.
Opens the Report options dialog box (see Section 4.1.4).
Opens the Manage templates dialog box (see Section 4.1.5).
Increases the zoom.
Decreases the zoom.
Enables to select the sound unit.
Enables to select the vibration unit.
Increases the font size for panels displayed in Table mode.
Decreases the font size for panels displayed in Table mode.
Sets the default font size for panels displayed in Table mode.

© SVANTEK - 40 - Supervisor User Manual
4.1.4. GENERATING REPORTS FROM SESSIONS
You can easily generate a report containing measurement data displayed in the same way as
in the current session by clicking the button, located on the Toolbar. The report can be created in one of the following formats:
DOC (if Microsoft Word 2003 or newer is installed),
PDF (if Microsoft Word 2007 or newer is installed),
RTF. You can select the format, as well as the paper size, using the First run wizard dialog box, opened via the main menu (see Fig.4-8).
Fig.4-8 The First run wizard dialog box.
The generated file will contain a start page and all the contents of the panels (in the same order and with the same graphical settings). All the reports created in the current session are listed in the Reports panel, located at the bottom-left corner of the window. By double-clicking a report’s name you can open it in MS Word. By clicking with the right mouse button you can open a context menu allowing for opening, renaming and deleting reports.
Fig.4-9 The Reports panel.
The start page and the style of the report can be customized using the Report options dialog
box, opened by clicking the button. Instead of customizing the start page, you can also disable adding it to the reports at all.
Click on the bar to hide this panel.
Double-click to open the report in MS Word, or right-click to access the context menu.
© SVANTEK - 41 - Supervisor User Manual
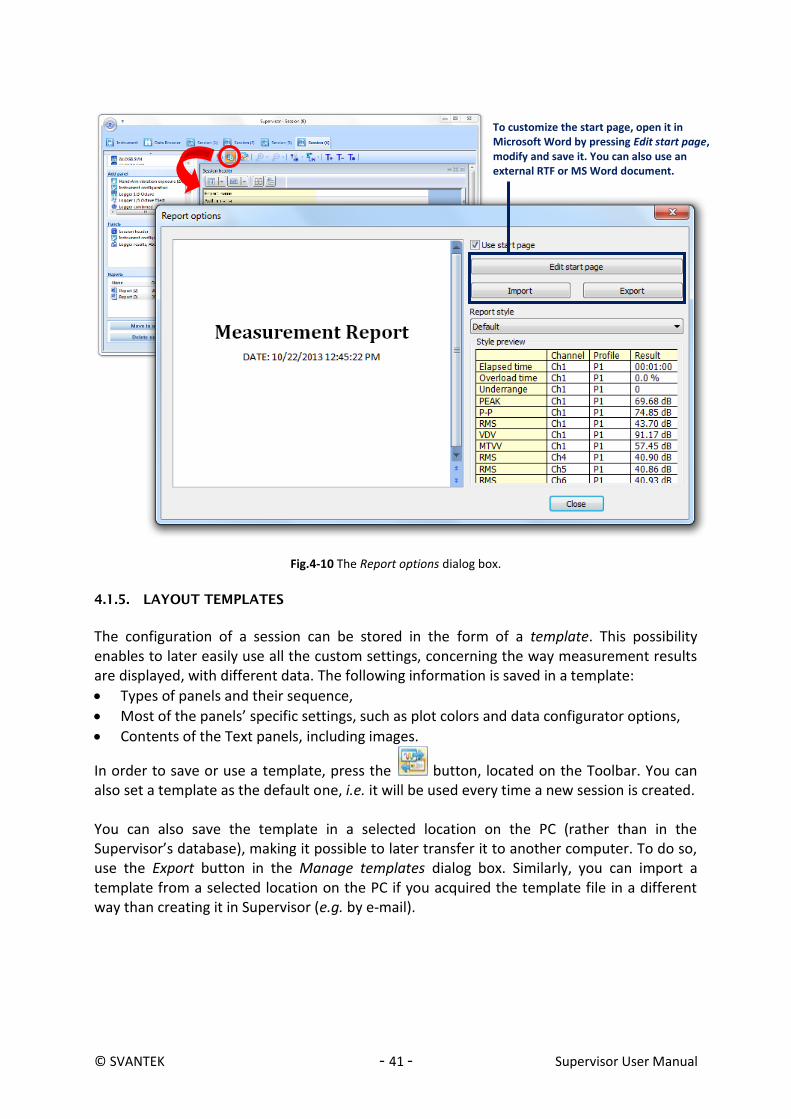
Fig.4-10 The Report options dialog box.
4.1.5. LAYOUT TEMPLATES
The configuration of a session can be stored in the form of a template. This possibility enables to later easily use all the custom settings, concerning the way measurement results are displayed, with different data. The following information is saved in a template:
Types of panels and their sequence,
Most of the panels’ specific settings, such as plot colors and data configurator options,
Contents of the Text panels, including images.
In order to save or use a template, press the button, located on the Toolbar. You can also set a template as the default one, i.e. it will be used every time a new session is created. You can also save the template in a selected location on the PC (rather than in the Supervisor’s database), making it possible to later transfer it to another computer. To do so, use the Export button in the Manage templates dialog box. Similarly, you can import a template from a selected location on the PC if you acquired the template file in a different way than creating it in Supervisor (e.g. by e-mail).
To customize the start page, open it in Microsoft Word by pressing Edit start page, modify and save it. You can also use an external RTF or MS Word document.
© SVANTEK - 42 - Supervisor User Manual
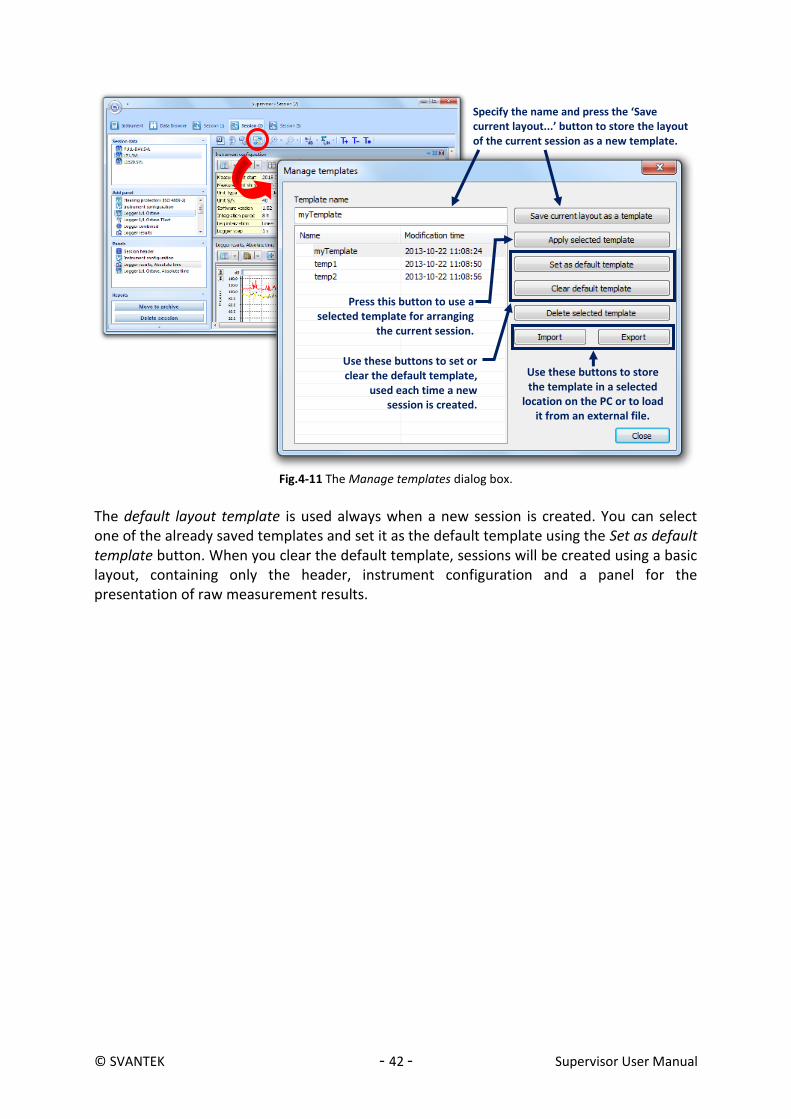
Fig.4-11 The Manage templates dialog box.
The default layout template is used always when a new session is created. You can select one of the already saved templates and set it as the default template using the Set as default template button. When you clear the default template, sessions will be created using a basic layout, containing only the header, instrument configuration and a panel for the presentation of raw measurement results.
Use these buttons to store the template in a selected
location on the PC or to load it from an external file.
Use these buttons to set or clear the default template,
used each time a new session is created.
Specify the name and press the ‘Save current layout...’ button to store the layout of the current session as a new template.
Press this button to use a selected template for arranging
the current session.

© SVANTEK - 43 - Supervisor User Manual
4.2. BASIC PANELS
Panels are the basic building blocks of the reports created using Supervisor’s sessions. They can be used to configure the way data will be displayed in the report.
Fig.4-12 Panels in the Session window.
The Add panel list (at the left side of the window) shows all the types of panels available for the current data. You can add a panel to the current session by clicking twice on its name in this list.
Fig.4-13 The Add panel list of all panels available for the current data.
You can add any number of panels you want, including multiple panels of the same types. All the panels added to the current session are listed in the Panels list, located at the left side of the window. You can use this list to jump to a selected panel by double-clicking it. You can also rename a panel by selecting it and clicking its name. To delete a panel, use the button located at its top-right corner. To make it fill the whole panels area, use the button. Panels are automatically scaled to fit the size of the panels area in horizontal direction. Their order in the vertical direction specifies the order in which data will be contained in the report. You can change the position of a panel using the drag & drop technique.
Click on the bar to hide this list.
Click twice to add a panel to the current session.
The panels area
Delete panel
List of all available panels
List of panels in the current session
The Toolbar
Maximize panel
Autosize columns

© SVANTEK - 44 - Supervisor User Manual
Fig.4-14 The Panels panel, containing a list of panels added to the current session.
The available types of panels are listed in Table 4-2. The following subsections are devoted to the description of several simple types of panels. Sections 5.5 and 5.4 are devoted to some special panels that constitute useful tools for the analysis of dosimetric data.
Table 4-2 Types of panels available in the Supervisor’s sessions.
Icon Name
Session header
Instrument configuration
Logger results
Summary results
Logger combined results
Logger statistics
Statistical results
Logger spectral results
Spectral results
Time intersection
Marked periods totals
Text
Hearing protectors
Noise exposure
Hand-arm vibration exposure
Whole-body vibration exposure
‘What if’
Double click to jump to the selected panel. OR: Select panel and click on its name to rename it.
Click on the bar to hide this panel.

© SVANTEK - 45 - Supervisor User Manual
4.2.1. SESSION HEADER
This type of panel contains general information about the report, such as project’s and author’s name. It can be viewed in Table and Text modes. Note: The Session header panel is editable only in the Table mode.
Fig.4-15 The Session header panel.
4.2.2. INSTRUMENT CONFIGURATION
This type of panel contains basic information about the measurement data used for creating the session, such as the device used for measurement, the instrument settings, measurement date and time. It can be viewed in Table or Text mode. Note: In case more than one file has been used to create the session and the instrument configuration differs in different files, the information is shown in several columns, one for each file; information that is identical in the files is shown only in the first column.
Fig.4-16 The Instrument configuration panel.
4.2.3. LOGGER RESULTS
This type of panel serves for displaying measurement results as a function of time. It can be displayed in Plot or Table mode. In the Logger results panel it is possible to modify the measurement data in three ways: deleting, clipping and shifting. The modifications concern all the data if no block selection has been made. If there is a block selection, the modifications only concern the selected data. The Delete tool affects all the functions in the selected time range, while the Clip and Shift tools only affect the visible functions (the ones selected in the View Configurator).

© SVANTEK - 46 - Supervisor User Manual
To delete data, select a range of time and press the button, or click with the right mouse button and select the Delete data command. There are two methods of deleting data: compressing the time domain to keep the signal continuous, or leaving an empty region, marked with the so-called Deleted data marker.
Clipping means truncating all data above a specified threshold; the truncated values are replaced with the threshold value. To clip data, enter the threshold in the field to the left
of the button and press this button. You can also click with the right mouse button, select the Clip data command and enter the threshold value in the dialog box which will appear.
Shifting means adding a constant positive or negative value to a range of data. To do so, first select a point or a range of data to be shifted using the main cursor or blocks of
selection. You can then enter the value to be added in the field to the left of the button and press this button, or you can click with the right mouse button, select the Shift data command and enter the value to be added in the dialog box which will appear.
All the modifications can be undone by pressing the button or selecting the Restore data to original command in the context menu.
Fig.4-17 The Logger results panel displayed in the Plot mode.
4.2.4. SUMMARY RESULTS
This type of panel contains the summary results of measurement, together with some additional information such as the instrument settings or time elapsed during measurement. It can be displayed in Table or Text mode. If cases when many results are to be displayed simultaneously, it is advisable to display the Summary results panel in transposed view; in
the Table mode, the transposition can be easily done by clicking on the button. For details, see Section 4.3.1: Table mode.
Controls for modifying measurement data

© SVANTEK - 47 - Supervisor User Manual
Fig.4-18 The Summary results panel.
4.2.5. LOGGER COMBINED RESULTS
Some types of results cannot be presented on a plot. The Combined results view enables to display all available results gathered together in the Table mode. It is useful if various types of measurements have been performed simultaneously in the Logger mode.
Fig.4-19 The Logger combined results panel.
4.2.6. LOGGER STATISTICS
The statistical data can be presented in two different modes: Histogram or LN. By default, Histogram is initially presented. To switch the presentation mode, the selector located on the panel’s toolbar can be used (Fig.4-20).
Transpose table

© SVANTEK - 48 - Supervisor User Manual
Fig.4-20 The Logger statistics panel.
4.2.7. LN SPECTRA
This type of panel allows for displaying the results of measurement in the form of LN spectra. It can be displayed in Table or Plot mode.
Fig.4-21 The LN spectra panel.
4.2.8. LOGGER SPECTRAL RESULTS
The name of a Logger spectral results panel contains the type of spectrum (1/1 Octave, 1/3 Octave or FFT), e.g. Logger 1/1 Octave panel. This panel can be displayed in Table mode, Plot mode, and Spectrogram mode.
Presentation mode selector

© SVANTEK - 49 - Supervisor User Manual
Fig.4-22 The Logger 1/1 Octave panel.
While displaying spectral data in Plot mode, the spectrum is displayed for a selected interval of time. The time history of the spectrum can be browsed using the buttons located on the panel’s toolbar, shown in Fig.4-23.
Fig.4-23. Buttons for browsing the time history of measured spectrum.
4.2.9. SPECTRAL RESULTS
This type of panel allows for displaying the results of measurement in the frequency domain, concerning the 1/1 Octave, 1/3 Octave and FFT measurement results. It can be displayed in Plot, Table or Text mode.
Fig.4-24 The Spectral results panel (an example for 1/3 Octave measurement results).
Previous sample Next sample
Scroll to the beginning Scroll to the end Current position

© SVANTEK - 50 - Supervisor User Manual
4.2.10. TIME INTERSECTION
The Time Intersection panel is available in case of data representative of the time history of the spectrum, such as Logger 1/1 Octave, 1/3 Octave or FFT results. It can be recognized by “TSect” added to the name of the panel. This type of panel allows to display data corresponding to one particular value of frequency
as a function of time. The displayed frequency can be selected using the / buttons, located on the panel’s toolbar.
Fig.4-25 The Time intersection panel.
In case of the Time Intersection panels, the Data Smoothing tool is available. You can enable / disable it using the Smoothing is ON / OFF button, located next to the frequency selection buttons. You can also set the size of the sample set used for smoothing using the list box located to the right of that button. Note: Selecting a point of the time domain in the Time intersection panel will automatically change the time point displayed in the corresponding spectral Logger results panel. 4.2.11. MARKED PERIODS TOTALS
This type of panel is available for results of measurement saved on integration period. When such results are viewed in the Table mode in a panel of type other than Marked periods totals, the values are repeated in multiple rows that belong to the same calculation period. The repeated values are displayed on grey background. In the Marked periods totals panel you can view all these results with their values displayed only once for each period, together with information about the period’s start time, duration and name. It can be displayed only in the Table mode. The Marked periods totals panel allows to sort the displayed periods by start time or by name. To do so, click with the right mouse button and in the pulldown menu choose the Sort by start time or Sort by name command.
Data smoothing Buttons for selection of frequency
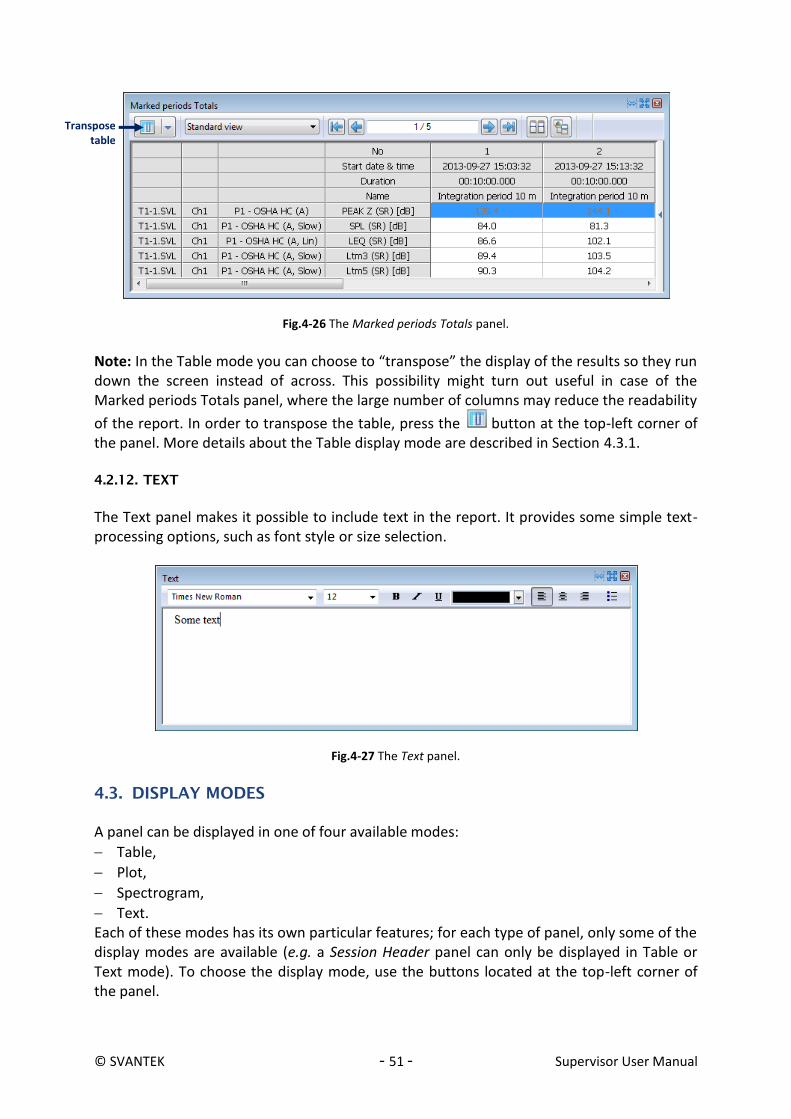
© SVANTEK - 51 - Supervisor User Manual
Fig.4-26 The Marked periods Totals panel.
Note: In the Table mode you can choose to “transpose” the display of the results so they run down the screen instead of across. This possibility might turn out useful in case of the Marked periods Totals panel, where the large number of columns may reduce the readability
of the report. In order to transpose the table, press the button at the top-left corner of the panel. More details about the Table display mode are described in Section 4.3.1. 4.2.12. TEXT
The Text panel makes it possible to include text in the report. It provides some simple text-processing options, such as font style or size selection.
Fig.4-27 The Text panel.
4.3. DISPLAY MODES
A panel can be displayed in one of four available modes:
Table,
Plot,
Spectrogram,
Text. Each of these modes has its own particular features; for each type of panel, only some of the display modes are available (e.g. a Session Header panel can only be displayed in Table or Text mode). To choose the display mode, use the buttons located at the top-left corner of the panel.
Transpose table

© SVANTEK - 52 - Supervisor User Manual
Fig.4-28 Buttons for choosing the display mode.
4.3.1. TABLE MODE
In the Table mode, numeric and text data are displayed in the form of a table. This mode is used for displaying the Session header or Instrument configuration, as well as for displaying measurement results such as Logger results in numeric form.
Fig.4-29. An example of panel displayed in Table mode.
Normal / Transposed view In general, when the Normal view is set, the table rows contain different time samples while columns contain results of different measurements or calculations. Switching to the Transposed view sets the inverse configuration. The Transposed view is particularly useful if you need to view many variables in few points of time. To enable the Transposed view you can do one of the following:
Click on the button – the view will switch to the other than currently set. Use the Table mode menu to choose one of the views.
Table Plot Spectrogram Text

© SVANTEK - 53 - Supervisor User Manual
Fig.4-30 Selecting the view in Table mode.
Copying with headers The Copy with headers tool is available in the context menu opened by clicking with the right mouse button. It copies the selected data to the clipboard together with headers describing it, located above and to the left of the selection.
Fig.4-31 The Copy with headers tool.
Cell types There are three different types of cells in Supervisor’s tables:
Cells with gray background contain headers, describing the current data, which will be copied when you use the Copy with headers tool.
Cells with yellow background also contain descriptions for the data values, but they are not copied by the Copy with headers tool.
Cells with white background contain the data values.
Press this button to switch mode.

© SVANTEK - 54 - Supervisor User Manual
Adjusting the view To configure the size of the fonts displayed in the panels in Table mode, you can use the following buttons, available on the Toolbar:
– increases the font size,
– reduces the font size,
– sets the default font size. The AutoSize Columns tool enables to set the width of the columns equal to the longest text string in each column. It can be activated using one of the following buttons:
– located on the panel’s toolbar,
– located at the top-right corner of the panel. You can easily convert the unit of displayed results in terms of the power prefix using the menu opened by clicking with the right mouse button on the header of a column in the normal view or of a row in the transposed view.
Fig.4-32 Converting units in a table in terms of the power prefix using the context menu.
Table view options Configuration of the Table mode settings is also available in the Table View tab of the Main Options dialog box. You can open the Main Options dialog box using the Options command, as shown in Fig.4-33. The Table view options are divided into 3 panels: The Font and colors panel enables to configure the way text is displayed in the Table view. To select the text font press the Choose button. A font selection window will appear, allowing to set the preferred font. To select the text color, press the color button. A color choice window will appear allowing to select the preferred color. The Display panel enables to configure the way functions are displayed in the Table view when viewing multiple functions of different steps. The continuously repeating values option
Click the header with the right mouse button to open
the unit conversion menu.
Select a power prefix from this menu to convert the unit of displayed results.

© SVANTEK - 55 - Supervisor User Manual
causes the fields where the values are not defined (because a function has a greater step than other displayed functions) to be filled with the last available value. The show single value at start time of greater step option causes to display values only at the beginning of a greater step, leaving the other fields empty. The Marker set of values panel enables to configure the way markers are displayed in the Table view. Markers contain ranges of the time domain specified by the user or created automatically. They can be displayed in the Table view as a function. You can select the value displayed in the table corresponding to data contained / not contained in the marker (Existence value / Not existence value).
Fig.4-33 The Table view options in the Main Options dialog box.
Click on the Svantek icon to open the menu.
Press this button to open the Main Options dialog box.

© SVANTEK - 56 - Supervisor User Manual
Limiting the time domain The Limit time domain tool enables to display only a limited range of the time domain, specified by a selected function or marker. In order to enable this option, you have to open the View Configurator, select the desired function / marker and press the Limit time domain button in the Options menu. In order to remove the limit, use the Clear time domain limit command.
Fig.4-34 Limiting the time domain in the Table mode.
Note: The View Configurator in described in detail in Section 4.4.
4.3.2. PLOT MODE
In the Plot mode, functions measured in the time or frequency domain, in panels such as e.g. Logger results or Logger 1/3 Octave, are presented in the form of a 2D plot.
Fig.4-35. An example of panel displayed in Plot mode.
1. Open the View Configurator.
2. Select a marker.
3. Press this button.
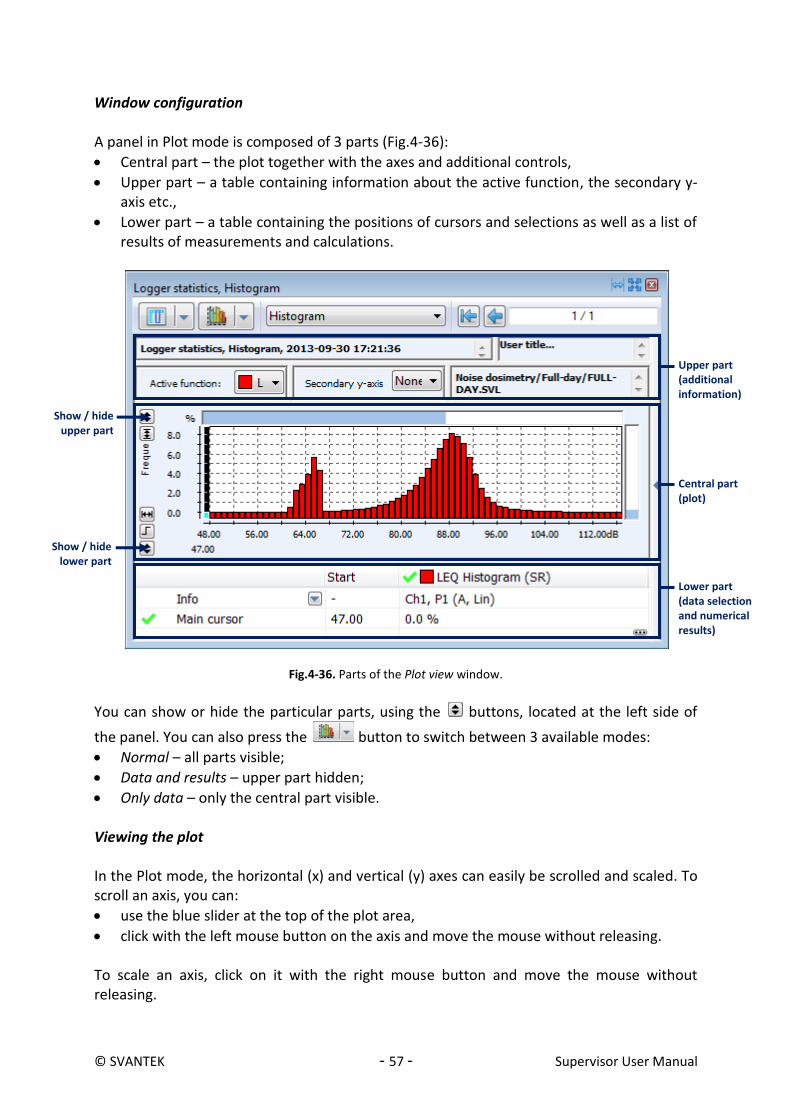
© SVANTEK - 57 - Supervisor User Manual
Window configuration A panel in Plot mode is composed of 3 parts (Fig.4-36):
Central part – the plot together with the axes and additional controls,
Upper part – a table containing information about the active function, the secondary y-axis etc.,
Lower part – a table containing the positions of cursors and selections as well as a list of results of measurements and calculations.
Fig.4-36. Parts of the Plot view window.
You can show or hide the particular parts, using the buttons, located at the left side of
the panel. You can also press the button to switch between 3 available modes:
Normal – all parts visible;
Data and results – upper part hidden;
Only data – only the central part visible. Viewing the plot In the Plot mode, the horizontal (x) and vertical (y) axes can easily be scrolled and scaled. To scroll an axis, you can:
use the blue slider at the top of the plot area,
click with the left mouse button on the axis and move the mouse without releasing. To scale an axis, click on it with the right mouse button and move the mouse without releasing.
Lower part (data selection and numerical results)
Central part (plot)
Upper part (additional information)
Show / hide upper part
Show / hide lower part

© SVANTEK - 58 - Supervisor User Manual
Axis auto scaling The Y-axis auto scaling tool serves to automatically scale the y-axis to make the function values fill the plot area. To enable the Y-axis auto scaling, use the / buttons, located at the left-hand side of a panel in Plot mode. Analogously, the X-axis auto scaling tool serves to automatically increase or decrease the number of pixels per sample (and aggregation degree for time history plots) to make all samples visible in the whole plot area. To enable the x-axis auto scaling, use the / buttons, located at the left-hand side of a panel in Plot mode. You can also automatically scale the x-axis so that only a selected interval of time is displayed using the ‘Auto scale x settings’ dialog box, accessed by selecting the ‘Auto scale x settings...’ command in the context menu opened by clicking with the right mouse button anywhere in the plot area. It also allows for expanding the range of measurement results in order for the x-axis to start at a selected hour.
Fig.4-37 The Auto scale x settings dialog box.
Clicking with the right mouse button in the plot area and selecting the ‘Auto scale x to selection’ command scales the x-axis according to the current block selection. Note: The displayed range of the time history may contain unselected fragments if the block selection is non-continuous. Note: If you manually scroll or scale an axis when the corresponding auto-scaling tool is enabled, it will be automatically disabled. Adjusting the view You can specify the way functions are drawn on the plot using the Drawing mode buttons / / located on the left side of the window.
Use this field to select the length of the time interval to be displayed.
If this option is enabled, the minimum value of
the x-axis will be as specified in these fields.

© SVANTEK - 59 - Supervisor User Manual
Fig.4-38. Controls for adjusting the view in the Plot mode.
All the functions displayed on the plot are listed in the table in the lower part of the Plot view window. Clicking on a function name in the list will highlight its plot in the plot area, so you can easily recognize it when many functions are plotted at once. The / buttons serve for showing / hiding the functions. Color used for plotting a function can be selected by clicking on the square located next to the function’s name. You can choose the currently active function, used to define the primary y-axis and the main cursor domain, as well as the parameter to be represented on the secondary y-axis, using the Active function selector and the Secondary y-axis selector, located in the upper part of the Plot view window. The contents of the table below the plot can be customized using the context menu, opened by clicking with the right mouse button anywhere in the table area. The menu contains the following commands:
Set font... – enables one to select the font used in the table below the plot,
Autosize columns [off / fit in window / fit in column] – enables one to automatically adjust the table columns’ width: the ‘fit in window’ option causes the columns to fill the whole width of the panel, while the ‘fit in column’ resizes the columns to fit exactly the width of the contained text. Anytime you manually resize a column, the ‘Autosize off’ option becomes automatically selected.
Show start / stop / duration – enables one to show or hide the columns of the table representative of the information about the time ranges specified by block and cursor selections and markers.
Show whole data / inside blocks / outside blocks / individual blocks – enables one to show or hide the rows of the table representative of various ranges of the time domain: ‘whole
Primary y-axis
selector
Drawing mode
Displayed functions list
Secondary y-axis selector
Click on the square to select color.
Export mode
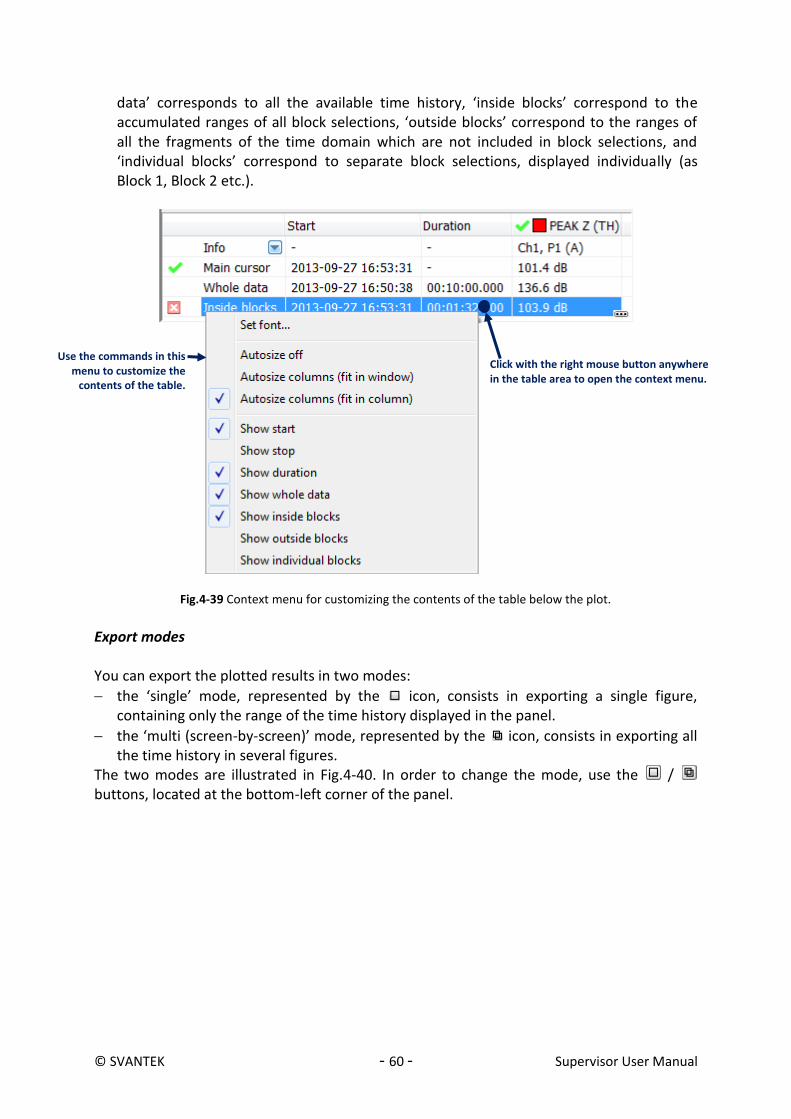
© SVANTEK - 60 - Supervisor User Manual
data’ corresponds to all the available time history, ‘inside blocks’ correspond to the accumulated ranges of all block selections, ‘outside blocks’ correspond to the ranges of all the fragments of the time domain which are not included in block selections, and ‘individual blocks’ correspond to separate block selections, displayed individually (as Block 1, Block 2 etc.).
Fig.4-39 Context menu for customizing the contents of the table below the plot.
Export modes You can export the plotted results in two modes:
the ‘single’ mode, represented by the icon, consists in exporting a single figure, containing only the range of the time history displayed in the panel.
the ‘multi (screen-by-screen)’ mode, represented by the icon, consists in exporting all the time history in several figures.
The two modes are illustrated in Fig.4-40. In order to change the mode, use the / buttons, located at the bottom-left corner of the panel.
Click with the right mouse button anywhere in the table area to open the context menu.
Use the commands in this menu to customize the
contents of the table.

© SVANTEK - 61 - Supervisor User Manual
Fig.4-40 Modes of exporting panels in Plot mode.
Local plot settings The graphic options of the Plot view can be configured in the Local Plot Settings dialog box, opened with the Local Plot Settings command, available in the context menu opened by clicking in the plot area with the right mouse button. Settings specified in this dialog box only apply to the particular panel for which it was opened. When you save the layout of the session (cf. Section 4.1.5), these settings are also saved. Note: Global settings of the same type can be configured in the Graph view tab of the Main Options dialog box.
16:50:38 16:51:42 16:52:46 16:53:50 16:54:54 Time
60.0
80.0
100.0
120.0
dB
Pre
ssure
PEAK Z (TH) MAX (TH) MIN (TH)
Info Ch1, P1 (A) Ch1, P1 (A, Slow) Ch1, P1 (A, Slow)
16:55:58 16:57:02 16:58:06 16:59:10 17:00:14 Time
60.0
80.0
100.0
120.0
dB
Pre
ssure
PEAK Z (TH) MAX (TH) MIN (TH)
Info Ch1, P1 (A) Ch1, P1 (A, Slow) Ch1, P1 (A, Slow)
In ‘single’ mode, only one figure is
exported.
In ‘multi’ mode, several figures are exported in order to present the whole time history.

© SVANTEK - 62 - Supervisor User Manual
Fig.4-41 The Local plot settings dialog box.
In the Cursors and selections colors panel you can choose one of three modes of drawing the vertical lines representative of the positions of cursors and blocks marking selected data:
Inverted – a line of inverted background color,
Solid – a line of a chosen color, drawn over the plotted functions,
Transparent – a line of a chosen color, not hiding the plotted functions below it. The selection of Draw mode is equivalent to what can be achieved using the / / buttons. The Total style concerns the way of displaying the Total results, drawn at the end of the x-axis in case of frequency domain functions. Trace current block – with this box option enabled, clicking with the main cursor on a block selection will automatically jump to the field containing the range of the selected block in the table below the plot area. Show extended – enabling / disabling this option will show / hide the extended x-axis description.

© SVANTEK - 63 - Supervisor User Manual
Selection of data To select data, you can use the cursors or block selections. Each cursor allows to select one element of the data at once, while blocks enable the selection of multiple elements at once. Main cursor When you open a window with the plot view, only the Main cursor is present. You can set its
position by clicking in the plot area, by using the left and right arrow keys or by using the
buttons located in the upper part of the Supervisor window. You can also switch the Main cursor off, clicking on the icon next to its name in the table below the plot. When passive, the cursor's icon turns to . By default, the position of the Main cursor is marked on the plot with a vertical line in inverted background color. Main cursor may be placed where the samples of active function exist. #1 and #2 (Block) cursors
There are two additional cursors available, named Block cursor #1 and #2. You can set their positions by clicking somewhere in the plot area with the right mouse button and choosing the Put #1 or Put #2 command in the pulldown menu, or by pressing CTRL+1 or CTRL+2 keys. The selected cursor position is then set at the current position of the Main cursor. In default settings, the positions of the additional cursors are marked on the plot with vertical lines in inverted background color with numbers written next to them. You can clear the selections of additional cursors by clicking on the icons next to their names in the table below the plot. Block selections
To set a block selection you have to click in the plot area and drag the mouse without releasing until all the elements you need are selected. When you select two different blocks, the selections will be added (previous selections are not removed). The selected area is represented with a gray background. To deselect blocks, click on the icons next to their names in the table below the plot, or click in the plot area with the right mouse button and choose the Deselect block(s) option. You can deselect the current (last selected) block or all blocks at once. You can also invert the block selection. Choosing this option removes the current selection and selects all the remaining data in the file. Additional features
The #1 and #2 cursors can be used for precise selection of blocks. When both Block cursors are located on the plot: o Pressing ENTER will create a new block selection between the two block cursors; o Pressing ESC will deselect the part of a block selection from between the cursors (if
the area between the cursors contains a fragment of a block).
When you click on a block with the main cursor, the slider in the table below the plot will be moved automatically to the field containing the range of the selected block. Note: This feature can be disabled in the Local plot settings dialog box.
Pressing ESC if the #1 and #2 cursors are not placed will remove a block selection containing the Main cursor. If the Main cursor is not located within any blocks, pressing ESC will remove all the selections (you will be asked for confirmation).
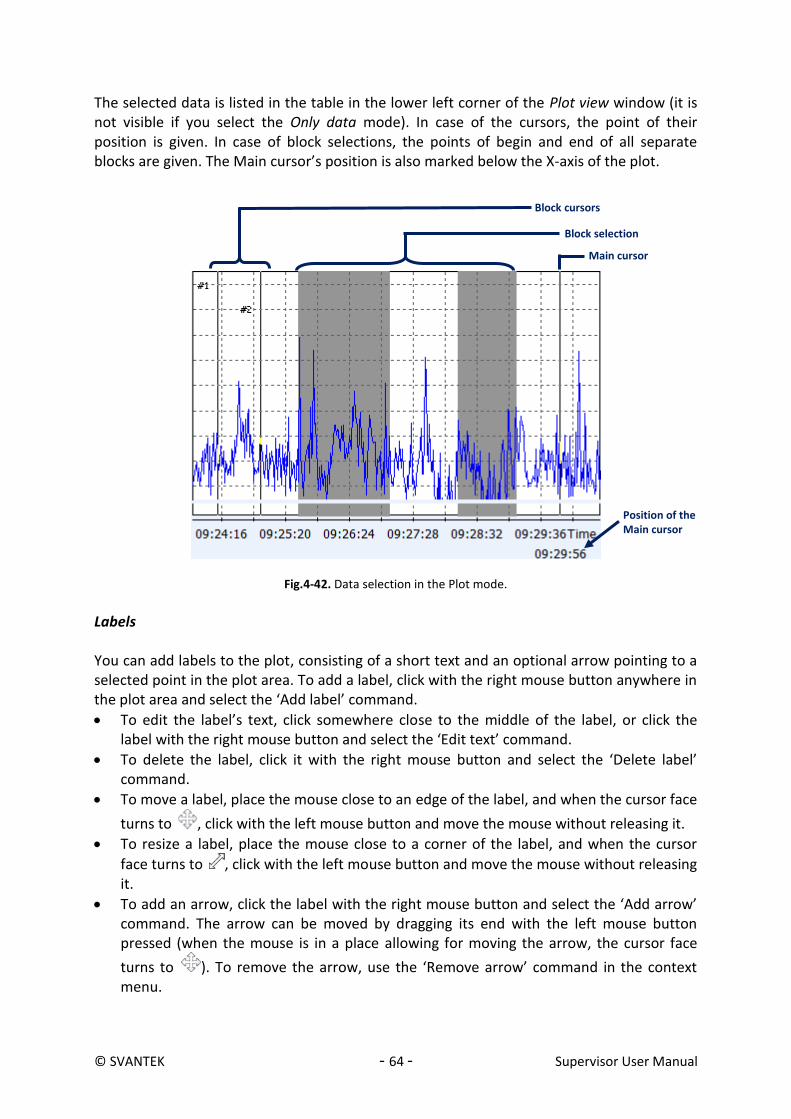
© SVANTEK - 64 - Supervisor User Manual
The selected data is listed in the table in the lower left corner of the Plot view window (it is not visible if you select the Only data mode). In case of the cursors, the point of their position is given. In case of block selections, the points of begin and end of all separate blocks are given. The Main cursor’s position is also marked below the X-axis of the plot.
Fig.4-42. Data selection in the Plot mode.
Labels You can add labels to the plot, consisting of a short text and an optional arrow pointing to a selected point in the plot area. To add a label, click with the right mouse button anywhere in the plot area and select the ‘Add label’ command.
To edit the label’s text, click somewhere close to the middle of the label, or click the label with the right mouse button and select the ‘Edit text’ command.
To delete the label, click it with the right mouse button and select the ‘Delete label’ command.
To move a label, place the mouse close to an edge of the label, and when the cursor face
turns to , click with the left mouse button and move the mouse without releasing it.
To resize a label, place the mouse close to a corner of the label, and when the cursor
face turns to , click with the left mouse button and move the mouse without releasing it.
To add an arrow, click the label with the right mouse button and select the ‘Add arrow’ command. The arrow can be moved by dragging its end with the left mouse button pressed (when the mouse is in a place allowing for moving the arrow, the cursor face
turns to ). To remove the arrow, use the ‘Remove arrow’ command in the context menu.
Main cursor
Block selection
Block cursors
Position of the Main cursor

© SVANTEK - 65 - Supervisor User Manual
Fig.4-43 Editing labels in a plot mode panel.
4.3.3. SPECTROGRAM MODE
The Spectrogram mode can be used to show the 3D variation of time, frequency and amplitude on a 2D plot. The x-axis represents the time domain, the y-axis represents the frequency domain and the color variation shows the amplitude domain of the currently selected function. The time scale is linear while the frequency scale is logarithmic. The range of the color scale is shown down the right hand side of the plot area.
Fig.4-44. An example of panel displayed in Spectrogram mode.
To scroll the time axis you can use the blue slider at the top of the spectrogram area, or click on the axis below the spectrogram area with the left mouse button and move the mouse without releasing. Scaling the x- and y-axis is not available in the Spectrogram mode. The configuration of different parts of panels in Spectrogram mode is analogous to the case of panels in Plot mode; for details, see Section 4.3.2. Adjusting the view
Click close to an edge and drag to move label
Click close to a corner and drag to resize label
You can open this context menu by clicking
the label with the right mouse button.
Click inside the label to edit text
Drag the end of the arrow to move it

© SVANTEK - 66 - Supervisor User Manual
You can choose the parameter displayed on the spectrogram by using the Active function selector in the upper part of the panel in Spectrogram mode. This selector is visible only in the Normal mode, it is hidden in Data and Results and Only Data modes. The selected function defines the values on the z-axis.
Fig.4-45. The Active function selector.
The Auto-scale z tool serves to scale the z-axis to fit the range of currently displayed data. When browsing the time domain, the scale will be modified automatically. When you disable the Auto-scale z option, the scale will remain constant.
Fig.4-46. The Auto-scale z checkbox in the panel’s toolbar.
You can modify the color profile to set the optimal dynamics for the range of data that you need. To do so, click on the color bar representing the z-axis, on the right side of the panel in Spectrogram mode. Then click on one of the displayed squares to move the range in which the chosen color will be displayed. You can set 4 points of the profile to adjust the color dynamics as needed. Modifying the color profile does not change the scale of the z-axis.
Fig.4-47. Examples of color profiles in the Spectrogram view.
Selection of data A point of the spectrogram can be selected using the Main cursor. To select a point, simply click somewhere in the spectrogram area. You can also modify the position of the cursor
using the arrow keys and the buttons above the Spectrogram view window.

© SVANTEK - 67 - Supervisor User Manual
The current position of the Main cursor is represented as the crossing point of grey lines. The table below the spectrogram area describes the position of the Main cursor in the time and frequency domains, as well as the value of the displayed function in the selected point. You can hide / show the Main cursor clicking on the / icon next to its name in the table below the spectrogram area. 4.3.4. TEXT MODE
The Text mode can be used for displaying measurement results and other information in the text form. Data is presented as simple text with additional descriptions (if available). The text can be copied with the use of the pulldown menu, opened by clicking with the right mouse button.
Fig.4-48. An example of panel displayed in Text mode.
4.4. VIEW CONFIGURATOR
The View Configurator enables to select the results to be displayed in the panel. It is located at the right hand side of each panel.

© SVANTEK - 68 - Supervisor User Manual
Fig.4-49. The View Configurator.
4.4.1. USING THE VIEW CONFIGURATOR
To show / hide the View Configurator, use the button, located on the panel’s toolbar. It can also be hidden using the Hide button in the upper-right corner of the View Configurator sub-panel. The results and functions displayed in Plot, Table or Text modes are selected in the View Configurator. Checking the control next to the name of a result / function adds it to the view. If you check a branch containing more than one result / function, all the data inside the selected branch will be displayed. If you select in this way more than 30 objects at once, you will be asked for confirmation. There are two other methods of selecting multiple objects simultaneously:
Selecting an object with the CTRL button pressed will cause the selection of all available objects of the same type, e.g. selecting the Time history MIN results in Profile 1 will also cause the selection of Time history MIN results in other profiles, as well as Summary MIN results in all profiles.
Selecting one object, and then selecting another object in the same subtree with the SHIFT button pressed will cause the selection of all objects in the subtree that are displayed between the two objects.
These two methods are illustrated in Fig.4-50.
The View Configurator
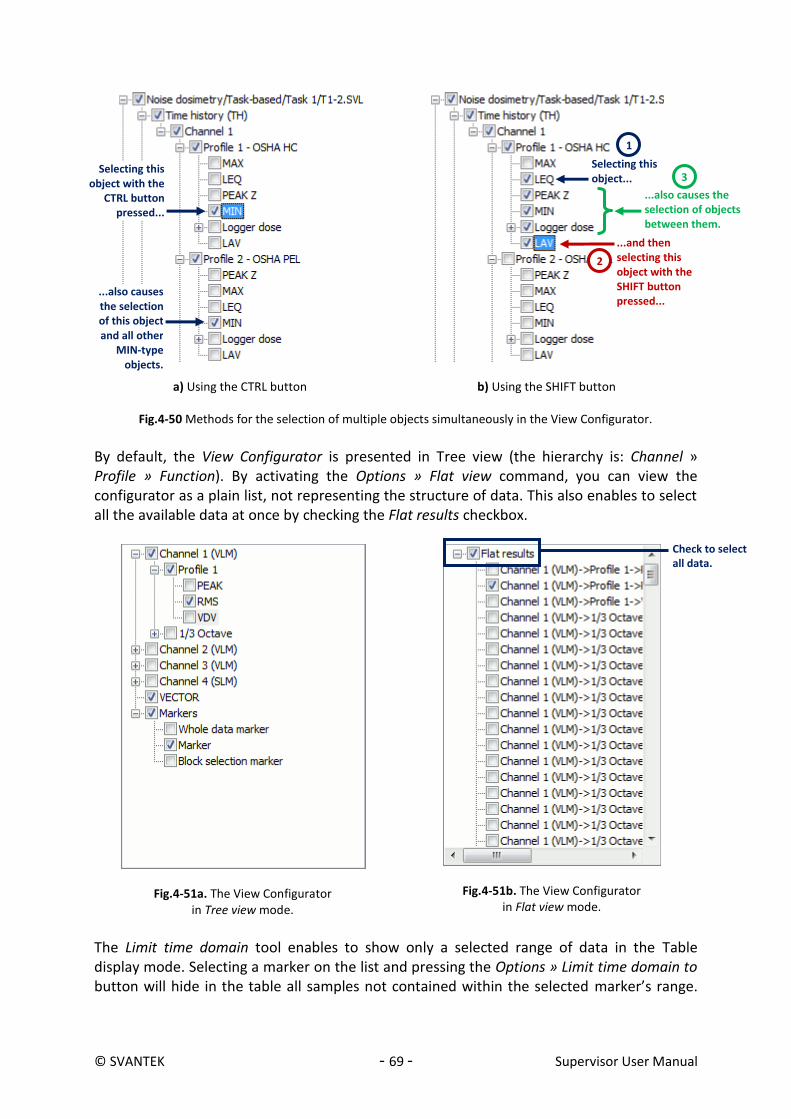
© SVANTEK - 69 - Supervisor User Manual
a) Using the CTRL button
b) Using the SHIFT button
Fig.4-50 Methods for the selection of multiple objects simultaneously in the View Configurator.
By default, the View Configurator is presented in Tree view (the hierarchy is: Channel » Profile » Function). By activating the Options » Flat view command, you can view the configurator as a plain list, not representing the structure of data. This also enables to select all the available data at once by checking the Flat results checkbox.
Fig.4-51a. The View Configurator in Tree view mode.
Fig.4-51b. The View Configurator in Flat view mode.
The Limit time domain tool enables to show only a selected range of data in the Table display mode. Selecting a marker on the list and pressing the Options » Limit time domain to button will hide in the table all samples not contained within the selected marker’s range.
Check to select all data.
Selecting this object with the
CTRL button pressed...
...also causes the selection of this object and all other
MIN-type objects.
Selecting this object...
...and then selecting this object with the SHIFT button pressed...
...also causes the selection of objects between them.
1
2
3

© SVANTEK - 70 - Supervisor User Manual
Pressing the Options » Clear time domain limit button resets the time domain, showing all the data once again. The time domain limit only affects the Table display mode. 4.4.2. SAVING SETTINGS
It is possible to save the View Configurator’s settings for later use. The settings are saved in a package including:
selection of data to be displayed,
colors of the plots. To save the current configuration, use the Save view settings command from the Options menu. All saved settings are available in the list box below the Options button. They can be loaded by selecting one of them in the list box, and deleted using the Delete selected view settings command in the Options menu. (Fig.4-52 and 4-53)
Fig.4-52 Commands for saving and deleting View Configurator settings.
Fig.4-53 List box for loading View Configurator settings.
4.4.3. SPECIAL CASES
The View Configurator only functions as described above in case of panels representing the measurement results, such as the Logger results panel. For some types of panels, such as Noise Exposure or Text, it is not available at all. For some other types of panels, such as:
Session header,
Instrument configuration,
‘What if’ it also enables to select information to be included, but it has a simpler form and does not allow for saving settings.

© SVANTEK - 71 - Supervisor User Manual
Fig.4-54 The View Configurator for the Session header panel.
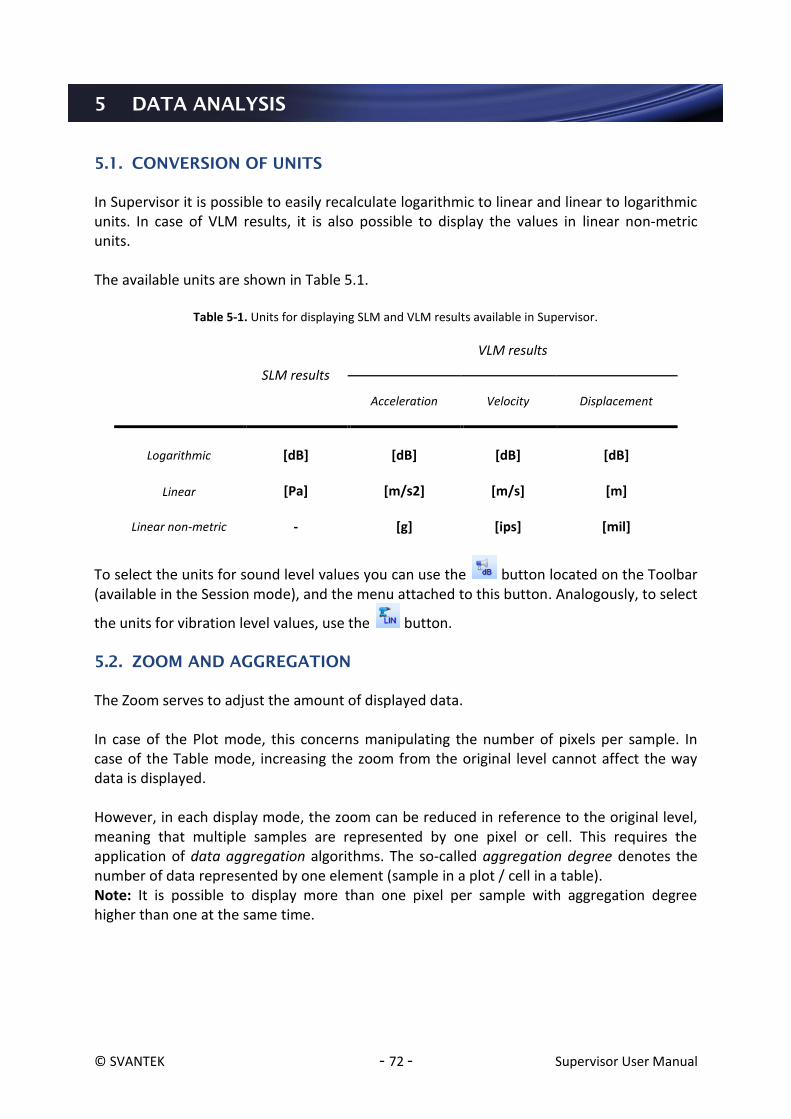
© SVANTEK - 72 - Supervisor User Manual
5 DATA ANALYSIS
5.1. CONVERSION OF UNITS
In Supervisor it is possible to easily recalculate logarithmic to linear and linear to logarithmic units. In case of VLM results, it is also possible to display the values in linear non-metric units. The available units are shown in Table 5.1.
Table 5-1. Units for displaying SLM and VLM results available in Supervisor.
SLM results
VLM results
Acceleration
Velocity
Displacement
Logarithmic
[dB]
[dB]
[dB]
[dB]
Linear
[Pa]
[m/s2]
[m/s]
[m]
Linear non-metric - [g] [ips] [mil]
To select the units for sound level values you can use the button located on the Toolbar (available in the Session mode), and the menu attached to this button. Analogously, to select
the units for vibration level values, use the button. 5.2. ZOOM AND AGGREGATION
The Zoom serves to adjust the amount of displayed data. In case of the Plot mode, this concerns manipulating the number of pixels per sample. In case of the Table mode, increasing the zoom from the original level cannot affect the way data is displayed. However, in each display mode, the zoom can be reduced in reference to the original level, meaning that multiple samples are represented by one pixel or cell. This requires the application of data aggregation algorithms. The so-called aggregation degree denotes the number of data represented by one element (sample in a plot / cell in a table). Note: It is possible to display more than one pixel per sample with aggregation degree higher than one at the same time.

© SVANTEK - 73 - Supervisor User Manual
Table 5-2. Relation between the aggregation degree and other parameters of data visualisation.
Aggregation degree
Samples per pixel
Range of visible data
Plot example
Lower
Less
Smaller
Fig.5-1a.
Higher
More
Larger
Fig. 5-1b.
Fig.5-1a. An example of Plot view with lower (64) aggregation level.
Fig.5-1b. An example of Plot view with higher (128) aggregation level.
To reduce / increase the aggregation degree, use the / buttons on the Toolbar. In case the Plot mode is currently active and aggregation is not applied, using these buttons you can increase / decrease the number of pixels per sample. You can also set the aggregation degree manually using the Set aggregation level command from the pulldown menu, opened by cliking on the button next to the Zoom Plus / Minus buttons. The aggregation degree can be then entered in the Set aggregation level dialog box. The maximum value of the aggregation degree equals the number of samples in the current data.
Peak 2 Peak 1
Peak 1 Peak 2

© SVANTEK - 74 - Supervisor User Manual
Another possibility is to set the aggregation degree by time interval. The degree will automatically be set to a value for which a single element (a pixel or a cell) will correspond to a selected time interval. For example, for measurement results in which each datum corresponds to measurement time of 1 second, selecting the aggregation time interval as 1 minute will set the aggregation degree to 60.
Fig.5-2. Setting the aggregation level by time interval.
Using the same pulldown menu, you can also decide whether aggregation should be applied to the time or frequency domain, if it is available in the currently viewed data. Aggregation can be applied to the currently viewed panel only (if ‘Apply time aggregation to active view only’ is checked), or to each panel generated using the same data as the currently viewed one (otherwise). 5.3. ACCELERATION, VELOCITY AND DISPLACEMENT
In case of VLM spectrometric data Supervisor allows for the recalculation of three quantities: Acceleration, Velocity, Displacement. To select the quantity you wish to display, use the pulldown menu opened next to the button for VLM units selection, located on the Toolbar (which is available in the Session mode).
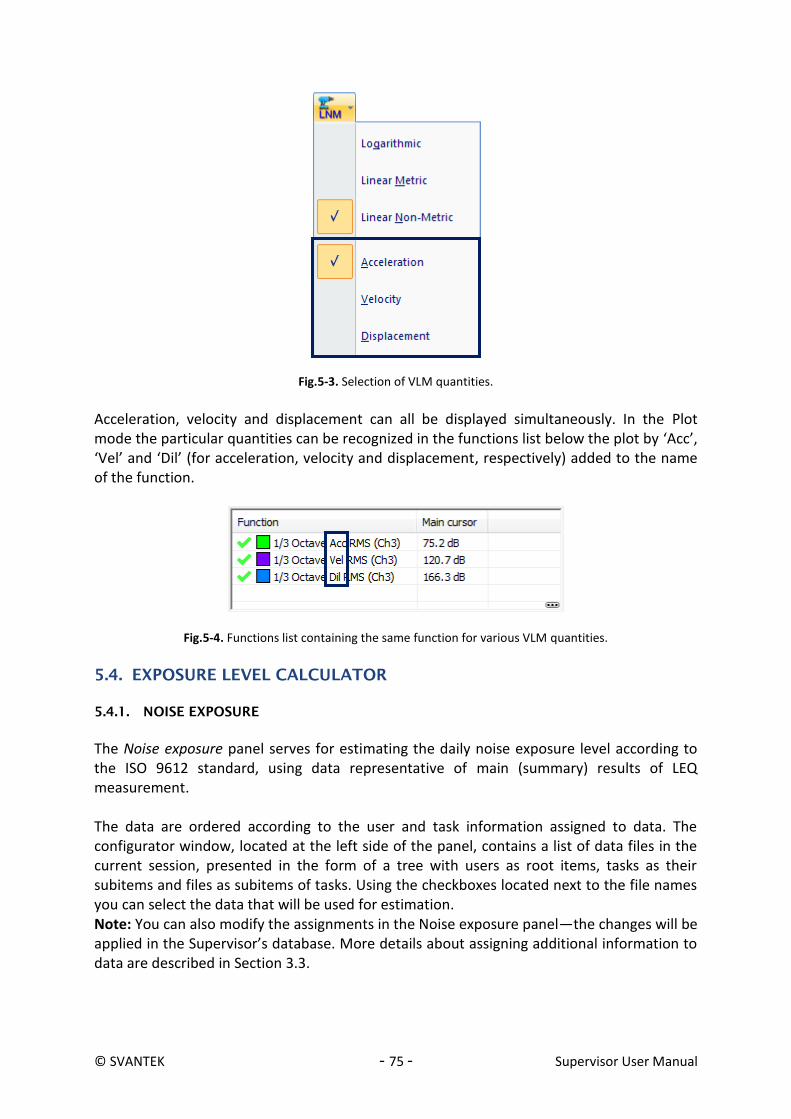
© SVANTEK - 75 - Supervisor User Manual
Fig.5-3. Selection of VLM quantities.
Acceleration, velocity and displacement can all be displayed simultaneously. In the Plot mode the particular quantities can be recognized in the functions list below the plot by ‘Acc’, ‘Vel’ and ‘Dil’ (for acceleration, velocity and displacement, respectively) added to the name of the function.
Fig.5-4. Functions list containing the same function for various VLM quantities.
5.4. EXPOSURE LEVEL CALCULATOR
5.4.1. NOISE EXPOSURE
The Noise exposure panel serves for estimating the daily noise exposure level according to the ISO 9612 standard, using data representative of main (summary) results of LEQ measurement. The data are ordered according to the user and task information assigned to data. The configurator window, located at the left side of the panel, contains a list of data files in the current session, presented in the form of a tree with users as root items, tasks as their subitems and files as subitems of tasks. Using the checkboxes located next to the file names you can select the data that will be used for estimation. Note: You can also modify the assignments in the Noise exposure panel—the changes will be applied in the Supervisor’s database. More details about assigning additional information to data are described in Section 3.3.

© SVANTEK - 76 - Supervisor User Manual
Fig.5-5 The data configurator in the Noise exposure panel.
If you created the session using files with no user / task information assigned, the configurator panel is empty; you need add the users and tasks using the buttons located at the top of the configurator panel, and assign files to them (Fig.5-6). One way to assign the files is clicking on a user or task with the right mouse button, pressing the ‘Add files...’ button and selecting the files in the ‘Add files...’ dialog box (Fig.5-6b); you can also use the drag & drop technique, dragging files from the Session data panel (Fig.5-6c).
Fig.5-6. a) Adding users / tasks to the Noise exposure panel using the buttons located at the top of the configurator.
Use these checkboxes to select data that will be used for estimation of
noise exposure level
Use these buttons to modify the user and task information assigned to the data.
Press this bar to hide the data configurator.
Use this panel to modify users or create new ones.
Close the window after all needed users have been added.
Press this button to add a user to the Noise
exposure panel.

© SVANTEK - 77 - Supervisor User Manual
b) Assigning files to users / tasks from the Session data panel using the ‘Add files...’ dialog box.
c) Assigning files to users / tasks from the Session data panel using the drag & drop technique.
The daily noise exposure level can be estimated using three different measurement strategies:
Task-based strategy,
Job-based strategy,
Full-day measurement-based strategy. You will be asked to choose a measurement strategy each time you add a Noise Exposure panel to a session. Task-based strategy The Task-based strategy consists in calculating the LEQ values for separate tasks and estimating the daily noise exposure level according to the declared duration of tasks. You can specify the total duration of a task—using a time-picker field—or the duration of separate samples. In the latter case the average time will be used for calculation. The duration of samples needs to be typed in the format: hh:mm;hh:mm;... where the ‘;’ sign
Select one or more files in this list . . .
. . . and press the ‘OK’ button.
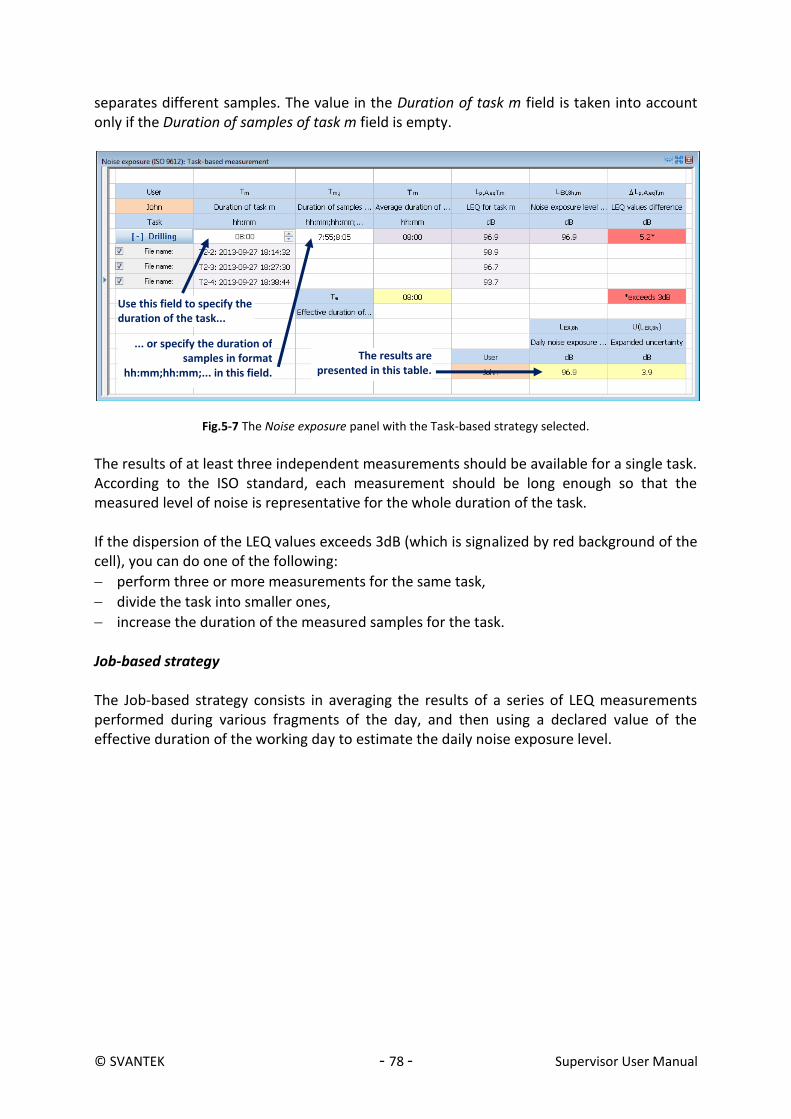
© SVANTEK - 78 - Supervisor User Manual
separates different samples. The value in the Duration of task m field is taken into account only if the Duration of samples of task m field is empty.
Fig.5-7 The Noise exposure panel with the Task-based strategy selected.
The results of at least three independent measurements should be available for a single task. According to the ISO standard, each measurement should be long enough so that the measured level of noise is representative for the whole duration of the task. If the dispersion of the LEQ values exceeds 3dB (which is signalized by red background of the cell), you can do one of the following:
perform three or more measurements for the same task,
divide the task into smaller ones,
increase the duration of the measured samples for the task. Job-based strategy The Job-based strategy consists in averaging the results of a series of LEQ measurements performed during various fragments of the day, and then using a declared value of the effective duration of the working day to estimate the daily noise exposure level.
Use this field to specify the duration of the task...
The results are presented in this table.
... or specify the duration of samples in format
hh:mm;hh:mm;... in this field.
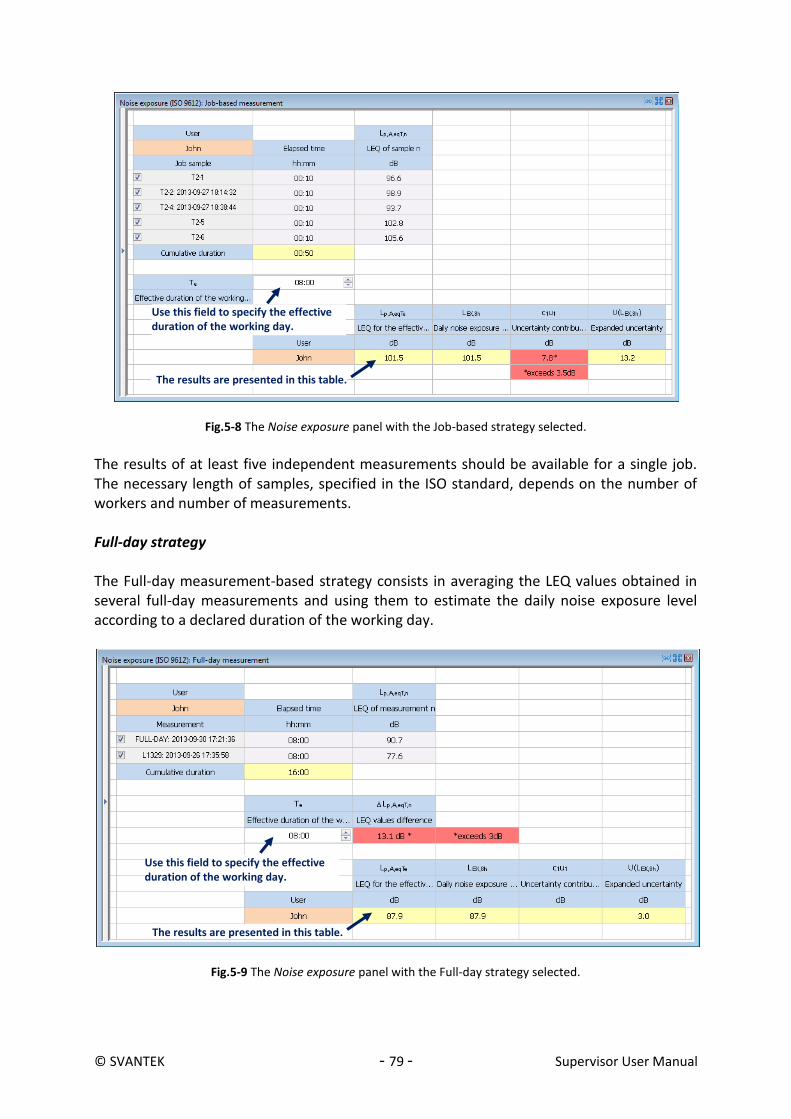
© SVANTEK - 79 - Supervisor User Manual
Fig.5-8 The Noise exposure panel with the Job-based strategy selected.
The results of at least five independent measurements should be available for a single job. The necessary length of samples, specified in the ISO standard, depends on the number of workers and number of measurements. Full-day strategy The Full-day measurement-based strategy consists in averaging the LEQ values obtained in several full-day measurements and using them to estimate the daily noise exposure level according to a declared duration of the working day.
Fig.5-9 The Noise exposure panel with the Full-day strategy selected.
Use this field to specify the effective duration of the working day.
The results are presented in this table.
Use this field to specify the effective duration of the working day.
The results are presented in this table.

© SVANTEK - 80 - Supervisor User Manual
The results of at least three full-day measurements should be available in order to use the Full-day strategy. The dispersion of data is also displayed, since if the dispersion is greater than 3 dB, two more full-day measurements should be performed. The expanded uncertainty of estimation is also calculated and displayed next to the results. The contribution of uncertainty due to sampling, i.e. caused by limited length of samples, is displayed separately. If it exceeds 3.5 dB, it is advisable to consider a modification of the measurement plan. 5.4.2. HAND-ARM VIBRATION EXPOSURE
The Hand-Arm vibration exposure panel serves for estimating the level of daily exposure to hand-arm vibration according to the ISO 5349-2 standard using vibration measurement results. The data are ordered according to the user and task information assigned to data. The methods for working with assignments are here the same as in the case of the Noise exposure panel; for details, see Section 5.4.1. Once data have been selected for calculation, you need to declare the exposure duration for each task and user. The daily exposure values for each of the users will then be displayed in the yellow cells at the bottom of the table.
Fig.5-10 The Hand-Arm vibration exposure panel.
The results can be presented as exposure levels or points. To switch the presentation mode, use the button located to the right of the ‘Show exposure’ label. You can also show / hide the detailed data for each task by pressing the button labeled with the task’s name.
Use this button to change the results presentation mode.
Show / hide detailed data
for this task
Declare exposure duration for this task / user
The results of calculation are displayed in cells with yellow background,

© SVANTEK - 81 - Supervisor User Manual
5.4.3. WHOLE-BODY VIBRATION EXPOSURE
The Whole-Body vibration exposure panel serves for estimating the level of daily exposure to whole-body vibration according to the ISO 2631-1 standard using vibration measurement results. The data are ordered according to the user and task information assigned to data. The methods for working with assignments are here the same as in the case of the Noise exposure panel; for details, see Section 5.4.1. Once data have been selected for calculation, you need to declare the exposure duration for each task and user. The daily exposure values for each of the users will then be displayed in the yellow cells at the bottom of the table.
Fig.5-11 The Whole-body vibration exposure panel.
The calculation can be performed in two different modes:
A(8) calculator,
VDV calculator. To select the calculator mode, use the button at the top-left corner of the table. In case of the A(8) calculator mode, the results can be presented as exposure levels or points. To switch the presentation mode, use the button located to the right of the ‘Show exposure’ label. You can show / hide the detailed data for each task by pressing the button labeled with the task’s name. 5.5. HEARING PROTECTORS
The Hearing protectors panel is designed to provide information about the type of hearing protectors recommended for a user, given the results of dose measurement. It can only be used with noise dosimetric data and is not applicable for vibration dosimetry.
Declare exposure duration for this task / user
Show / hide detailed data
for this task
The results of calculation are displayed in cells with yellow background,
Use this button to change the results presentation mode in case of A(8) calculator.
Use this button to select calculator mode.
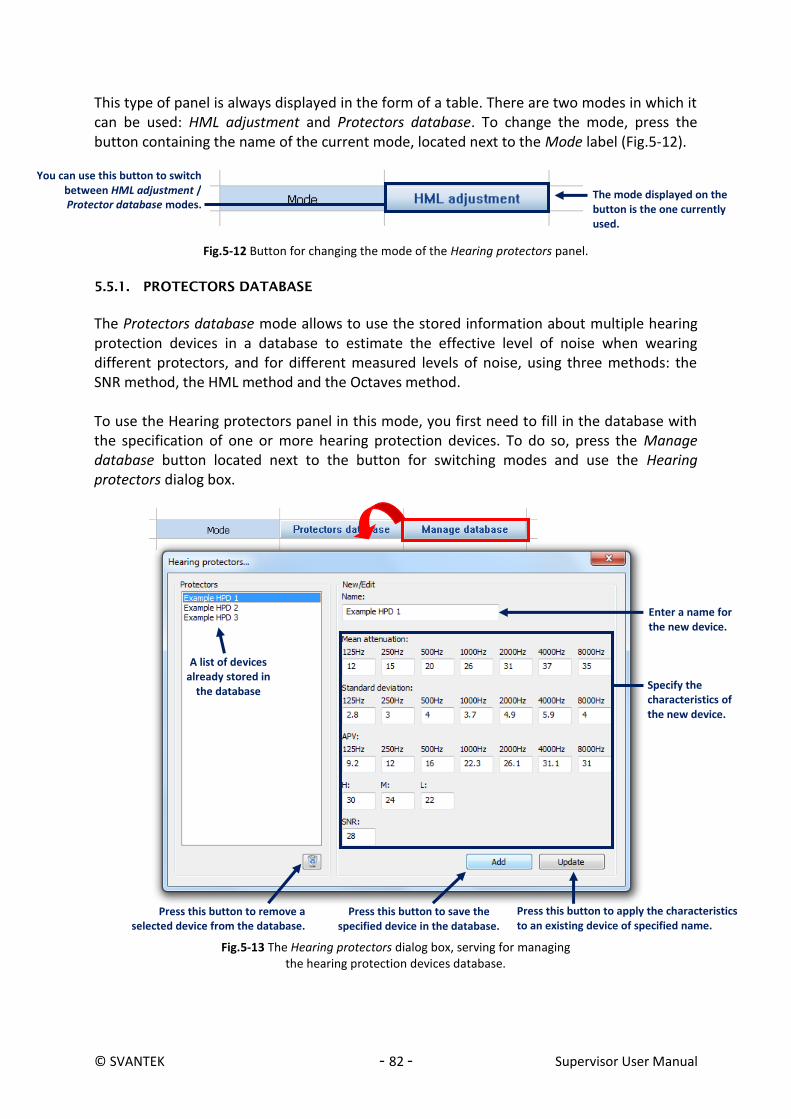
© SVANTEK - 82 - Supervisor User Manual
This type of panel is always displayed in the form of a table. There are two modes in which it can be used: HML adjustment and Protectors database. To change the mode, press the button containing the name of the current mode, located next to the Mode label (Fig.5-12).
Fig.5-12 Button for changing the mode of the Hearing protectors panel.
5.5.1. PROTECTORS DATABASE
The Protectors database mode allows to use the stored information about multiple hearing protection devices in a database to estimate the effective level of noise when wearing different protectors, and for different measured levels of noise, using three methods: the SNR method, the HML method and the Octaves method. To use the Hearing protectors panel in this mode, you first need to fill in the database with the specification of one or more hearing protection devices. To do so, press the Manage database button located next to the button for switching modes and use the Hearing protectors dialog box.
Fig.5-13 The Hearing protectors dialog box, serving for managing the hearing protection devices database.
You can use this button to switch between HML adjustment / Protector database modes.
The mode displayed on the button is the one currently used.
Press this button to remove a selected device from the database.
Press this button to save the specified device in the database.
Enter a name for the new device.
Specify the characteristics of the new device.
A list of devices already stored in
the database
Press this button to apply the characteristics to an existing device of specified name.

© SVANTEK - 83 - Supervisor User Manual
After you save one or more hearing protection devices in the database, you can use them together with dosimetric data to estimate the effective level of noise. It is not compulsory to fill in all the fields. The missing values will be treated as 0 (no attenuation).
Fig.5-14 The Hearing protectors panel in Protectors database mode.
You can choose which parameters of the hearing protector should be shown in the Octaves method part of the table. It can be specified in the Hearing protectors panel settings in the Main Options dialog box (Fig.5-15). The available parameters are:
Mean attenuation,
Standard deviation,
APV.
Use these buttons to show or hide
the results of estimation using
particular method.
Select a device from the
database.
Specify the data representative of
the measured noise level. Press this button
to open the Hearing protectors
dialog box.
The contents of this table can be configured using the Main Options dialog box (in the Hearing protectors panel category of settings).
Press this button to open the Hearing protectors classification dialog box.

© SVANTEK - 84 - Supervisor User Manual
Fig.5-15 Modifying the Hearing protectors preferences in the Main Options dialog box.
In calculation, the following data are used:
In case of methods which use the values of the parameters LA and LC: these values can be entered manually (when ‘[None]’ is selected in the ‘File’ field), or loaded from a selected file. In case of data acquired from some Svantek instruments, the difference LC−LA may be available instead of the LA or LC value; the remaining value is then automatically calculated using the difference and the other available value.
In case of methods which use octave spectra: the data is loaded from a file; if only 1/3 octave spectrum is available in the selected file, the octave spectrum is automatically calculated.
5.5.2. CLASSIFICATION OF PROTECTORS
Protectors are classified using the calculated effective level of noise according to the EN 458 standard. The result of classification is displayed next to the estimate of L’A in text form, and is also shown by the color of the table cells which contain the results. The possible classes are shown in Fig.5-16.
Fig.5-16 Classification of hearing protectors according to L’A.
Click on the Svantek icon to open the menu.
Press this button to open the Main Options
dialog box.
Select ‘Hearing protectors panel’
in the list of available settings.
You can use these checkboxes to choose parameters should be displayed together with the results of estimation using the Octaves method.
You can use this field to specify the value of the Action level, used for classification of hearing protectors.

© SVANTEK - 85 - Supervisor User Manual
Note: The classification is based on the value of the Action level, which can be specified in the Main Options dialog box (see Fig.5-15). The results of classification can also be viewed using the Hearing protectors classification dialog box. To open it, press the ‘Compare protectors’ button, located below the table cell which contains the classification result for the selected protector.
Fig.5-17. Button for opening the Hearing protectors classification dialog box.
The Hearing protectors classification dialog box contains lists of all protectors, stored in the database, which have been classified as Good or Acceptable (with the estimated effective noise level value either slightly higher or slightly lower than the optimal one) using the selected method of estimation.
Fig.5-18 The Hearing protectors classification dialog box.
5.5.3. HML ADJUSTMENT
The HML adjustment mode enables to check the performance of a hearing protector in some measured conditions by specifying the protector’s HML characteristics. At the bottom of the panel, the estimated effective level of noise when wearing the specified protector, together with a comparison to an expected level of noise, is displayed.
Press this button to view results of classification for all protectors stored in the database.
Result of classification for the currently selected protector
Lists of hearing protection devices, stored in the database, which have
been classified as Good or Acceptable
You can use this list box to select the method used for estimation of the effective level of noise.
Press this button to open the hearing protectors database.
After pressing the ‘OK’ button, the protector selected in one of the lists in this dialog box
will also become selected in the Hearing
protectors panel.
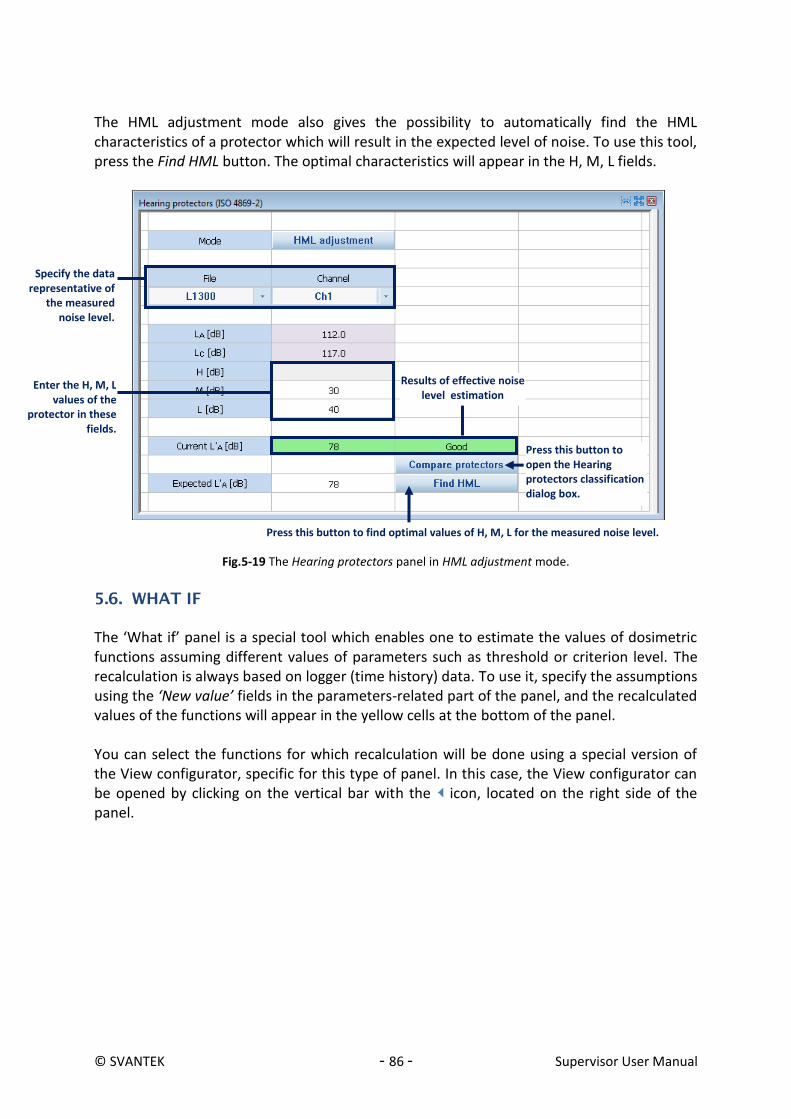
© SVANTEK - 86 - Supervisor User Manual
The HML adjustment mode also gives the possibility to automatically find the HML characteristics of a protector which will result in the expected level of noise. To use this tool, press the Find HML button. The optimal characteristics will appear in the H, M, L fields.
Fig.5-19 The Hearing protectors panel in HML adjustment mode.
5.6. WHAT IF
The ‘What if’ panel is a special tool which enables one to estimate the values of dosimetric functions assuming different values of parameters such as threshold or criterion level. The recalculation is always based on logger (time history) data. To use it, specify the assumptions using the ‘New value’ fields in the parameters-related part of the panel, and the recalculated values of the functions will appear in the yellow cells at the bottom of the panel. You can select the functions for which recalculation will be done using a special version of the View configurator, specific for this type of panel. In this case, the View configurator can be opened by clicking on the vertical bar with the icon, located on the right side of the panel.
Enter the H, M, L values of the
protector in these fields.
Results of effective noise level estimation
Press this button to find optimal values of H, M, L for the measured noise level.
Specify the data representative of
the measured noise level.
Press this button to open the Hearing protectors classification dialog box.
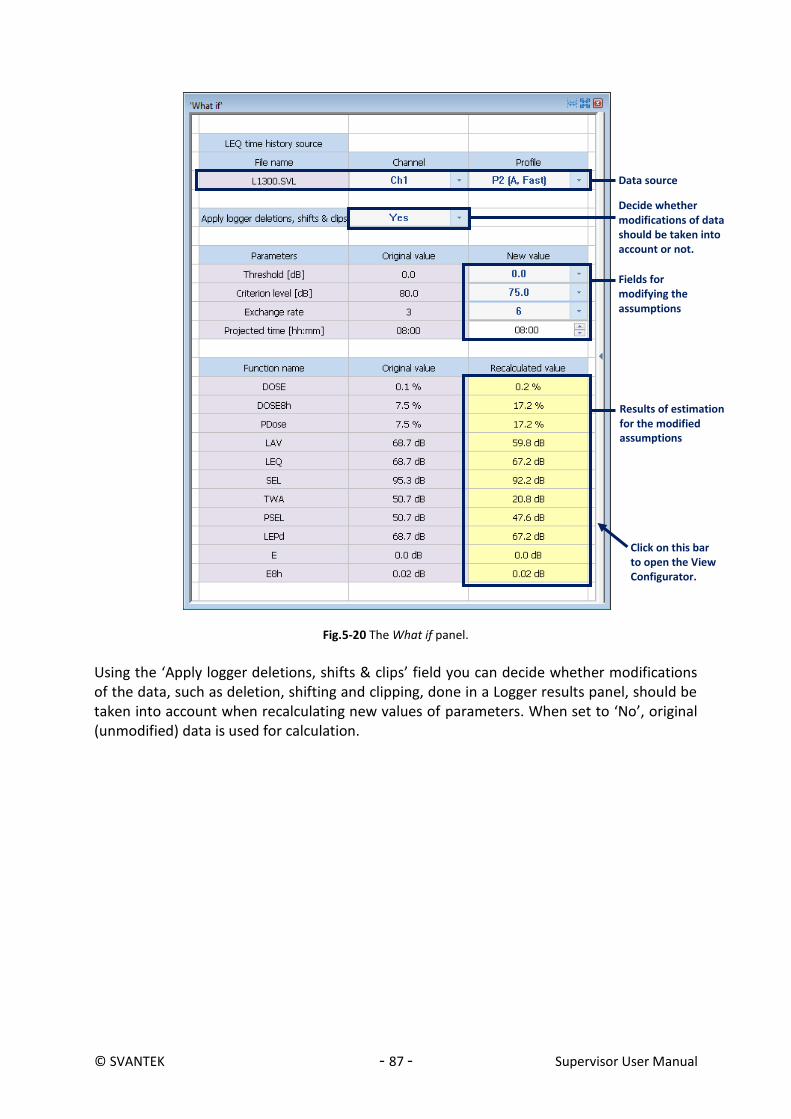
© SVANTEK - 87 - Supervisor User Manual
Fig.5-20 The What if panel.
Using the ‘Apply logger deletions, shifts & clips’ field you can decide whether modifications of the data, such as deletion, shifting and clipping, done in a Logger results panel, should be taken into account when recalculating new values of parameters. When set to ‘No’, original (unmodified) data is used for calculation.
Fields for modifying the assumptions
Results of estimation for the modified assumptions
Data source
Click on this bar to open the View Configurator.
Decide whether modifications of data should be taken into account or not.

© SVANTEK - 88 - Supervisor User Manual
Fig.5-21 The View Configurator specific for the ‘What if’ panel, serving for the selection of dosimetric functions to be recalculated.
5.7. MARKERS
The markers can be used as a tool for data classification. A marker denotes a certain range of data, specified automatically or selected by the user. Markers created by Svantek instruments and markers created in Supervisor are equivalent and can be used in the same way. 5.7.1. CREATING MARKERS
Markers divide into two types:
Block markers,
Point markers. The block markers contain a finite range of data, while point markers only contain one datum. To create a block marker: 1. Make a block selection in the plot area, simply clicking and moving the mouse with the
left button pressed. Note: A block marker does not have to be continuous, i.e. it can be composed of several separate ranges.
2. Press the right mouse button to open a context menu. 3. In the menu, select Edit markers » Use selected blocks » New marker. 4. Specify the desired name and color for the new marker in the Create New Marker dialog
box.
Click on this bar to hide the View
Configurator.

© SVANTEK - 89 - Supervisor User Manual
Fig.5-22 Creating a block marker.
In case of point markers, instead of making block selections in the plot area you only have to place the Main cursor at the desired location (clicking with the left mouse button in the plot area). The rest of the process is analogous to the creation of block markers, the only difference being the path in the pulldown menu: Edit markers » Point marker » New marker. 5.7.2. VIEWING MARKERS
Block markers are visible in the Plot mode as horizontal lines below the plot area, above the x-axis. In case of point markers, vertical lines are also drawn. Each marker has its own color. The markers are listed in the table below the plot. To show or hide markers, click on the /
icons, located next to their names on the list.
1
2
3
4

© SVANTEK - 90 - Supervisor User Manual
Fig.5-23. Visualization of markers in the Plot mode.
In the Table mode, markers are considered as one of the functions available for displaying. You can select the values displayed in the table for data contained / not contained within range of a marker using the Table view tab in the Main options dialog box. 5.7.3. EDITING MARKERS
To modify the ranges of markers, you can use the pulldown menu opened by clicking with the right mouse button somewhere in a plot area, when working with a panel in the Plot display mode. Following commands are available:
Edit markers » Use selected blocks » Add selection – adds the current block selection to a chosen marker.
Edit markers » Use selected blocks » Remove selection – subtracts the current block selection from a chosen marker.
Edit markers » Point marker » Add cursor position – adds the sample at the current position of the Main cursor to a chosen marker.
Edit markers » Point marker » Remove cursor position – subtracts the sample at the current position of the Main cursor from a chosen marker.
Edit markers » Delete marker – deletes a chosen block or point marker. Every time you modify or delete a marker, the Choose marker window will appear. It serves for selecting the marker you wish to modify or delete. You can select multiple markers, clicking on their names with CTRL pressed. You can also select several successive markers, clicking on the first one and then the last one with SHIFT pressed.
A block marker
A point marker
Buttons for showing / hiding markers
Visible markers
Hidden marker
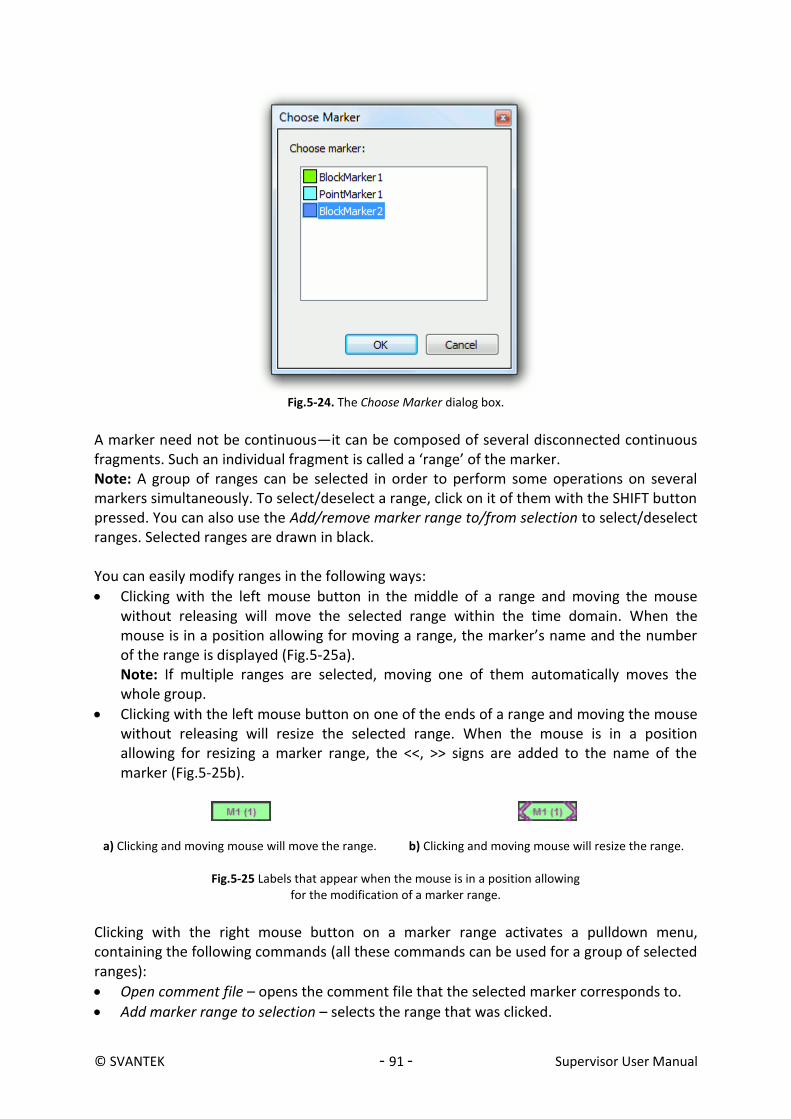
© SVANTEK - 91 - Supervisor User Manual
Fig.5-24. The Choose Marker dialog box.
A marker need not be continuous—it can be composed of several disconnected continuous fragments. Such an individual fragment is called a ‘range’ of the marker. Note: A group of ranges can be selected in order to perform some operations on several markers simultaneously. To select/deselect a range, click on it of them with the SHIFT button pressed. You can also use the Add/remove marker range to/from selection to select/deselect ranges. Selected ranges are drawn in black. You can easily modify ranges in the following ways:
Clicking with the left mouse button in the middle of a range and moving the mouse without releasing will move the selected range within the time domain. When the mouse is in a position allowing for moving a range, the marker’s name and the number of the range is displayed (Fig.5-25a). Note: If multiple ranges are selected, moving one of them automatically moves the whole group.
Clicking with the left mouse button on one of the ends of a range and moving the mouse without releasing will resize the selected range. When the mouse is in a position allowing for resizing a marker range, the <<, >> signs are added to the name of the marker (Fig.5-25b).
a) Clicking and moving mouse will move the range.
b) Clicking and moving mouse will resize the range.
Fig.5-25 Labels that appear when the mouse is in a position allowing for the modification of a marker range.
Clicking with the right mouse button on a marker range activates a pulldown menu, containing the following commands (all these commands can be used for a group of selected ranges):
Open comment file – opens the comment file that the selected marker corresponds to.
Add marker range to selection – selects the range that was clicked.
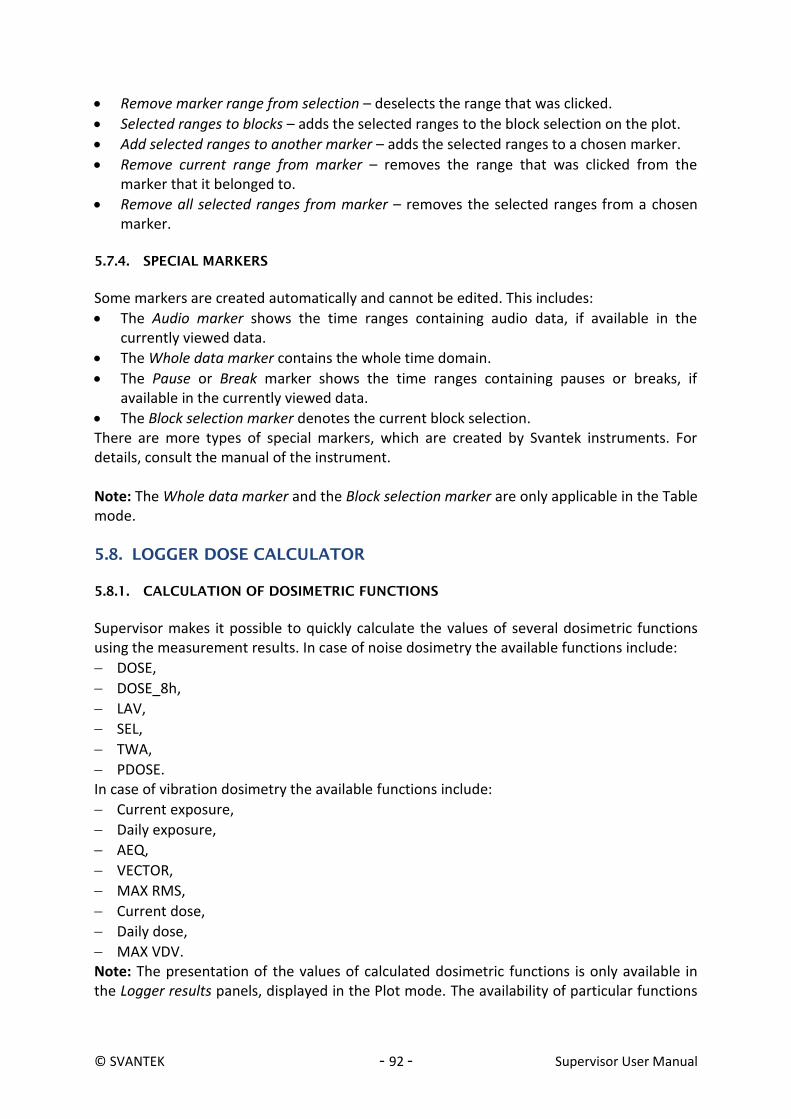
© SVANTEK - 92 - Supervisor User Manual
Remove marker range from selection – deselects the range that was clicked.
Selected ranges to blocks – adds the selected ranges to the block selection on the plot.
Add selected ranges to another marker – adds the selected ranges to a chosen marker.
Remove current range from marker – removes the range that was clicked from the marker that it belonged to.
Remove all selected ranges from marker – removes the selected ranges from a chosen marker.
5.7.4. SPECIAL MARKERS
Some markers are created automatically and cannot be edited. This includes:
The Audio marker shows the time ranges containing audio data, if available in the currently viewed data.
The Whole data marker contains the whole time domain.
The Pause or Break marker shows the time ranges containing pauses or breaks, if available in the currently viewed data.
The Block selection marker denotes the current block selection. There are more types of special markers, which are created by Svantek instruments. For details, consult the manual of the instrument. Note: The Whole data marker and the Block selection marker are only applicable in the Table mode. 5.8. LOGGER DOSE CALCULATOR
5.8.1. CALCULATION OF DOSIMETRIC FUNCTIONS
Supervisor makes it possible to quickly calculate the values of several dosimetric functions using the measurement results. In case of noise dosimetry the available functions include:
DOSE,
DOSE_8h,
LAV,
SEL,
TWA,
PDOSE. In case of vibration dosimetry the available functions include:
Current exposure,
Daily exposure,
AEQ,
VECTOR,
MAX RMS,
Current dose,
Daily dose,
MAX VDV. Note: The presentation of the values of calculated dosimetric functions is only available in the Logger results panels, displayed in the Plot mode. The availability of particular functions
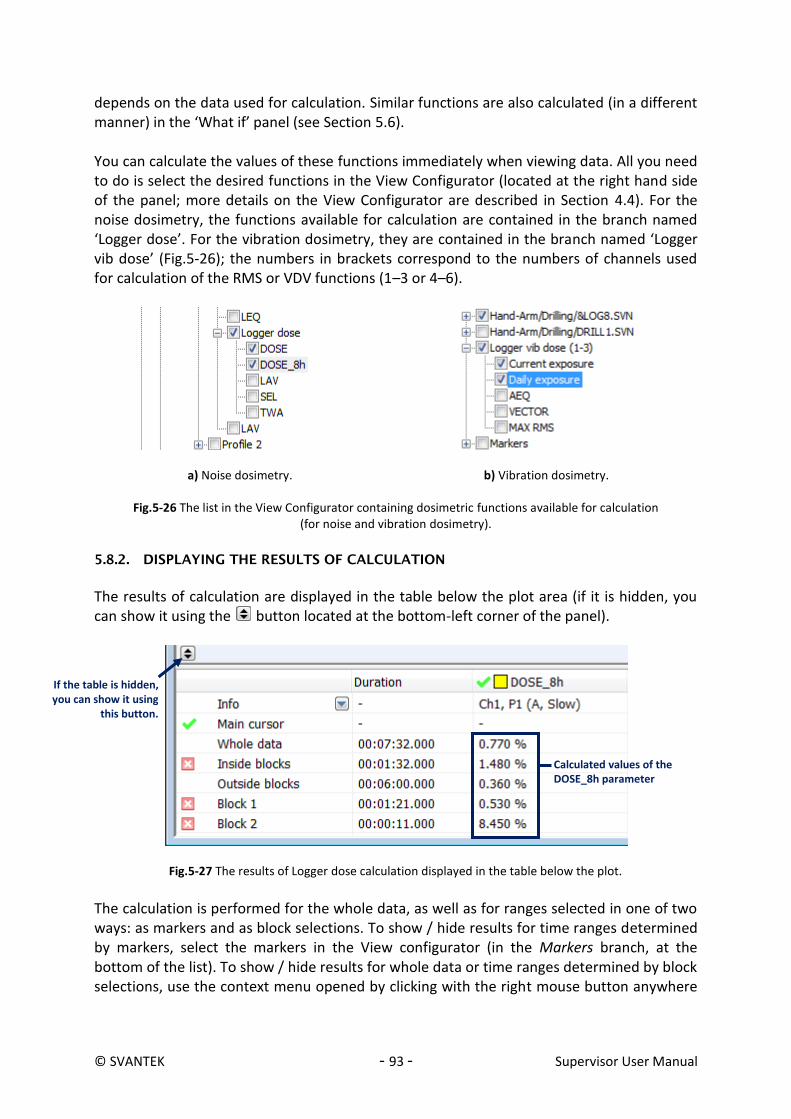
© SVANTEK - 93 - Supervisor User Manual
depends on the data used for calculation. Similar functions are also calculated (in a different manner) in the ‘What if’ panel (see Section 5.6). You can calculate the values of these functions immediately when viewing data. All you need to do is select the desired functions in the View Configurator (located at the right hand side of the panel; more details on the View Configurator are described in Section 4.4). For the noise dosimetry, the functions available for calculation are contained in the branch named ‘Logger dose’. For the vibration dosimetry, they are contained in the branch named ‘Logger vib dose’ (Fig.5-26); the numbers in brackets correspond to the numbers of channels used for calculation of the RMS or VDV functions (1–3 or 4–6).
a) Noise dosimetry.
b) Vibration dosimetry.
Fig.5-26 The list in the View Configurator containing dosimetric functions available for calculation (for noise and vibration dosimetry).
5.8.2. DISPLAYING THE RESULTS OF CALCULATION
The results of calculation are displayed in the table below the plot area (if it is hidden, you can show it using the button located at the bottom-left corner of the panel).
Fig.5-27 The results of Logger dose calculation displayed in the table below the plot.
The calculation is performed for the whole data, as well as for ranges selected in one of two ways: as markers and as block selections. To show / hide results for time ranges determined by markers, select the markers in the View configurator (in the Markers branch, at the bottom of the list). To show / hide results for whole data or time ranges determined by block selections, use the context menu opened by clicking with the right mouse button anywhere
Calculated values of the DOSE_8h parameter
If the table is hidden, you can show it using
this button.

© SVANTEK - 94 - Supervisor User Manual
in the table area. This context menu, as well as the selection of data and markers, are described in detail in Section 4.3.2, devoted to the description of the Plot display mode. 5.8.3. PREDICTING DOSIMETRIC FUNCTIONS FOR SIMULATED DATA
The Logger dose calculator tool can also turn out useful for viewing the values of dosimetric functions and manipulating the data simultaneously (using shifting, clipping and deletion of data, as described in Section 4.2.3). You can, for example, display the DOSE function and see how the dose reduces when a range of measured LEQ values is decreased by 10 dB. Such an exemplary procedure is illustrated in Fig.5-28.
Fig.5-28 Using the Logger dose calculator to predict the values of dosimetric functions for simulated data – an example: viewing how the value of DOSE
changes when the LEQ data in a selected range is shifted by −5dB.
5.8.4. MODIFYING PARAMETERS OF CALCULATION
The calculations can be performed according to the values of parameters loaded from the measurement file, or the values of the parameters can be specified manually. To manually modify the parameters values, use the Logger dose settings panel in the Main Options dialog box (Fig.5-29).
Select DOSE in the Logger dose branch in the View Configurator.
Select the range of data to be modified
Specify the shifting value and
press the ‘Shift data’ button
Check the new value of DOSE
1
2 3
4

© SVANTEK - 95 - Supervisor User Manual
Fig.5-29 Modifying the Logger dose calculation parameters in the Main Options dialog box.
Click on the Svantek icon to open the menu.
Select Logger dose on the list of available
settings.
Uncheck this box to enable manual
configuration of parameters.
Use the fields in this panel to manually specify the values of
parameters of calculation.
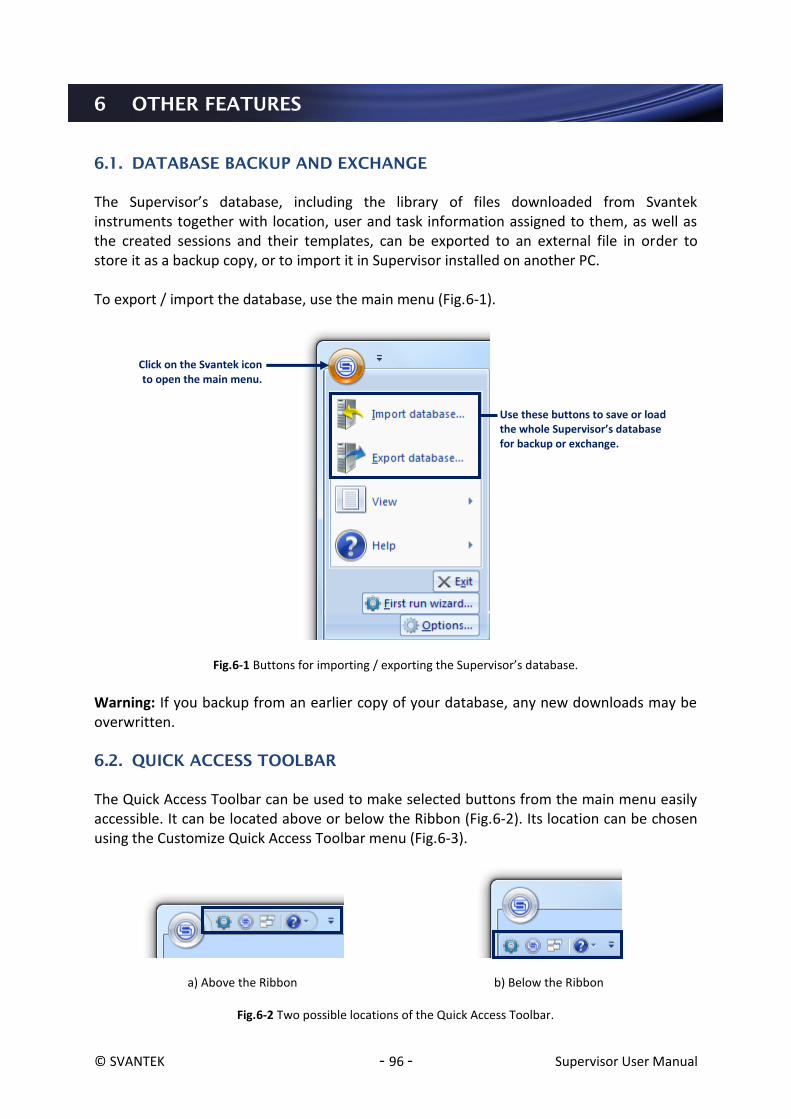
© SVANTEK - 96 - Supervisor User Manual
6 OTHER FEATURES
6.1. DATABASE BACKUP AND EXCHANGE
The Supervisor’s database, including the library of files downloaded from Svantek instruments together with location, user and task information assigned to them, as well as the created sessions and their templates, can be exported to an external file in order to store it as a backup copy, or to import it in Supervisor installed on another PC. To export / import the database, use the main menu (Fig.6-1).
Fig.6-1 Buttons for importing / exporting the Supervisor’s database.
Warning: If you backup from an earlier copy of your database, any new downloads may be overwritten. 6.2. QUICK ACCESS TOOLBAR
The Quick Access Toolbar can be used to make selected buttons from the main menu easily accessible. It can be located above or below the Ribbon (Fig.6-2). Its location can be chosen using the Customize Quick Access Toolbar menu (Fig.6-3).
a) Above the Ribbon
b) Below the Ribbon
Fig.6-2 Two possible locations of the Quick Access Toolbar.
Click on the Svantek icon to open the main menu.
Use these buttons to save or load the whole Supervisor’s database for backup or exchange.
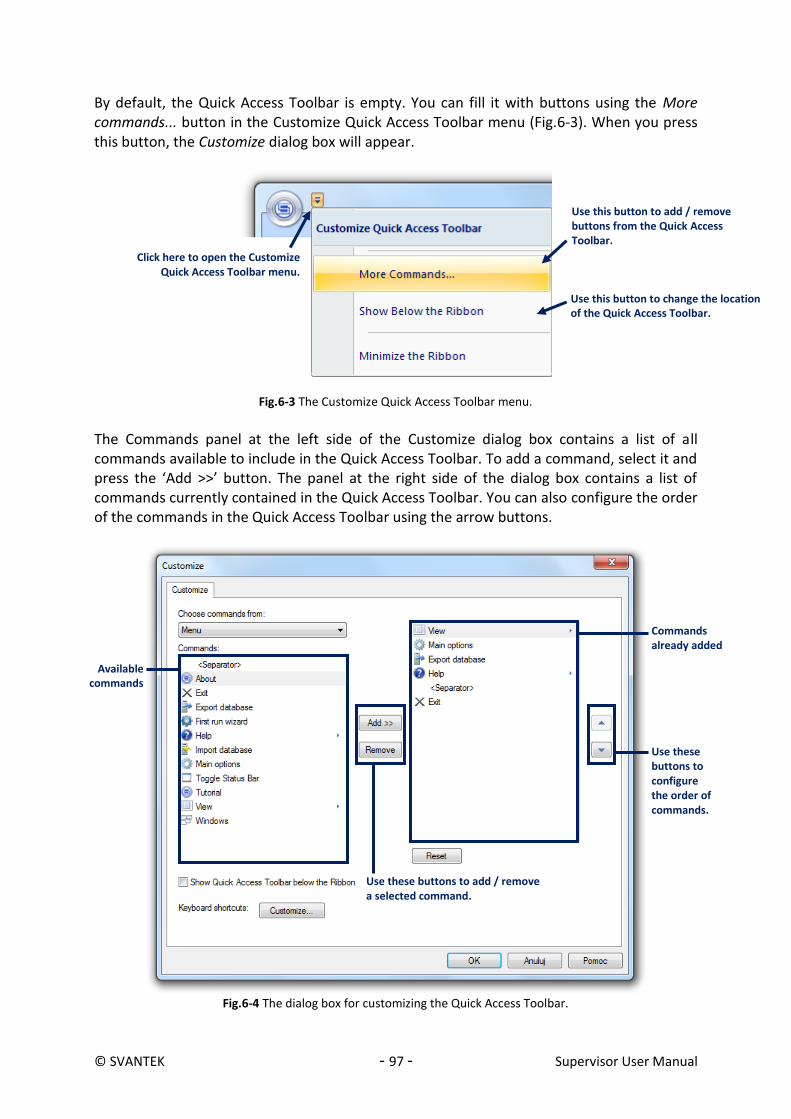
© SVANTEK - 97 - Supervisor User Manual
By default, the Quick Access Toolbar is empty. You can fill it with buttons using the More commands... button in the Customize Quick Access Toolbar menu (Fig.6-3). When you press this button, the Customize dialog box will appear.
Fig.6-3 The Customize Quick Access Toolbar menu.
The Commands panel at the left side of the Customize dialog box contains a list of all commands available to include in the Quick Access Toolbar. To add a command, select it and press the ‘Add >>’ button. The panel at the right side of the dialog box contains a list of commands currently contained in the Quick Access Toolbar. You can also configure the order of the commands in the Quick Access Toolbar using the arrow buttons.
Fig.6-4 The dialog box for customizing the Quick Access Toolbar.
Click here to open the Customize Quick Access Toolbar menu.
Use this button to add / remove buttons from the Quick Access Toolbar.
Use this button to change the location of the Quick Access Toolbar.
Available commands
Commands already added
Use these buttons to add / remove a selected command.
Use these buttons to configure the order of commands.


