Supplemental material Supplemental Methods Genotyping and linkage analysis Genomic DNA was isolated from lymphoblastoid cell lines or whole-blood samples, by phenol/chloroform extraction. The seven members of this French family affected by a T-cell deficit and persistent EV-HPV infections were genotyped with the Affymetrix Genome-wide SNP 6.0 array. Genotype calling was achieved with Affymetrix Power Tools (http://www.affymetrix.com/partners_programs/programs/developer/tools/powertools.affx ) for the seven family members, and for an additional sample of 200 individuals genotyped by the same platform, to improve the detection of genotype clusters. Relationships between members of the family affected by a T-cell deficit and persistent EV-HPV infections were confirmed by IBS calculation, with PLINK (1). We discarded monomorphic SNPs, SNPs with a call rate lower than 100% and SNPs presenting Mendelian inconsistencies in the family. SNPs were further filtered with population-based filters. We excluded SNPs displaying more than one Mendelian inconsistency. We then used about 94,000 high-quality SNP markers to carry out linkage analysis, assuming autosomal-recessive inheritance with complete penetrance. Parametric multipoint linkage analysis was carried out with the Merlin program (2). The French family founders and HapMap CEU trios were used to estimate allele frequencies and to define linkage clusters, with an r² threshold of 0.4. We searched for homozygous deletions in patients, with PennCNV-joint (3), correcting for waviness. Within linkage regions, patients presented no homozygous deletion encompassing known coding genes that were absent from the DGV database (http://projects.tcag.ca/variation/ ) (data not shown).
Transcript
Supplemental material
Supplemental Methods
Genotyping and linkage analysis
Genomic DNA was isolated from lymphoblastoid cell lines or whole-blood samples, by
phenol/chloroform extraction. The seven members of this French family affected by a T-cell
deficit and persistent EV-HPV infections were genotyped with the Affymetrix Genome-wide
SNP 6.0 array. Genotype calling was achieved with Affymetrix Power Tools
(http://www.affymetrix.com/partners_programs/programs/developer/tools/powertools.affx) for
the seven family members, and for an additional sample of 200 individuals genotyped by the
same platform, to improve the detection of genotype clusters. Relationships between members of
the family affected by a T-cell deficit and persistent EV-HPV infections were confirmed by IBS
calculation, with PLINK (1). We discarded monomorphic SNPs, SNPs with a call rate lower than
100% and SNPs presenting Mendelian inconsistencies in the family. SNPs were further filtered
with population-based filters. We excluded SNPs displaying more than one Mendelian
inconsistency. We then used about 94,000 high-quality SNP markers to carry out linkage
analysis, assuming autosomal-recessive inheritance with complete penetrance. Parametric
multipoint linkage analysis was carried out with the Merlin program (2). The French family
founders and HapMap CEU trios were used to estimate allele frequencies and to define linkage
clusters, with an r² threshold of 0.4. We searched for homozygous deletions in patients, with
PennCNV-joint (3), correcting for waviness. Within linkage regions, patients presented no
homozygous deletion encompassing known coding genes that were absent from the DGV
database (http://projects.tcag.ca/variation/) (data not shown).
eFluor780 (104) (eBioscience), anti-human/mouse integrin β7-PE (FIB504) (BioLegend) and
anti-human cutaneous lymphocyte antigen-FITC (BD Pharmingen) antibodies. Dead cells were
excluded from the analysis by additional staining with 4',6-diamidino-2-phenylindole (DAPI,
Sigma-Aldrich).
RT-qPCR
Total RNA was extracted from H. saimiri-transformed T cells in Trizol (Invitrogen).
RNA was reverse transcribed directly, with random hexamers and reverse transcriptase (TaqMan
RT reagents, Applied Biosystems). Quantitative PCR was carried out with the 7500 Fast Real-
Time PCR system (Applied Biosystems) and the RhoH Taqman gene expression assay probe
Hs00180265_m1. RHOH mRNA levels were normalized with respect to the endogenous control,
GUS (Hs99999908_m1, Applied Biosystems).
Determination of Vα, β, γ, δ gene usage and immunoscope analysis
Total RNA was extracted in Trizol (Invitrogen). RNA was reverse transcribed with
SuperScriptTM II Reverse Transcriptase (RT) (Invitrogen), according to the manufacturer’s
instructions. Vα, β, γ and δ gene usage was determined and immunoscope analysis was
performed on cDNA samples, as previously described (12). An aliquot of cDNA was subjected
to PCR amplification with each of the 24 TCR Vβ family-specific primers, together with a TCR
Cβ primer and a minor groove binder TaqMan probe (Applied Biosystems). Real-time
quantitative PCR was conducted in an ABI7300 device (Applied Biosystems). In a second
approach, we used 2 μl of each of these amplification reactions as a template in run-off reactions
with a nested fluorescent primer specific for the Cβ segment. In this reaction, all PCR products
were copied into fluorescently labeled single-stranded DNA fragments, irrespective of their TCR
Jβ usage or CDR3 sequence. These fluorescent products were separated on an ABI-PRISM 3730
DNA analyzer (Applied Biosystems). The size and intensity of each band were analyzed with
Immunoscope software. Fluorescence intensity was plotted in arbitrary units on the y-axis,
whereas the x-axis corresponds to CDR3 length in amino acids. The Gaussian distribution of the
various CDR3 lengths is characteristic of a normal Vβ repertoire. An identical protocol was used
to assess the α, γ and δ chains, with specific primers used for each family.
Flow cytometry on cryopreserved PBMCs, assessing naive and memory subsets
Cryopreserved PBMCs were thawed in 10% FBS in RPMI and centrifuged for 5 minutes
at 4°C and 450 x g. Cells were resuspended in staining buffer (SB: 0.1% BSA, 0.1% sodium
azide in PBS) and plated at a density of 1 x 10⁶ cells/well in a 96-well V-bottomed plate and
various antibodies against human cell surface markers were added. Cells were then incubated in
the dark, at 4°C, for 30 minutes, after which they were washed three times with SB. Cells stained
only at the surface were fixed in 1% formaldehyde. For additional intracellular staining, cells
were resuspended with 2% formaldehyde and incubated at room temperature for 15 minutes. The
cells were then washed with SB and resuspended in 0.5% saponin solution (0.5% saponin, 0.1%
BSA in PBS) supplemented with either granzyme B or perforin mAbs, and incubated at 4°C for
30 minutes. Cells were then washed three times with 0.5% saponin solution and resuspended in
SB. Samples were analyzed on a Canto-II machine (BD).
References
1. Purcell S, Neale B, Todd‐Brown K, Thomas L, Ferreira MA, Bender D, et al. PLINK: a tool set for whole‐genome association and population‐based linkage analyses. Am J Hum
3. Wang K, Chen Z, Tadesse MG, Glessner J, Grant SF, Hakonarson H, et al. Mogenetic inheritance of copy number variations. Nucleic Acids Res. 2008 Dec;36(24. Fleckenstein B, Ensser A. Herpesvirus saimiri transformation of human T lymphocytes. Curr Protoc Immunol. 2004 Nov;Chapter 7:Unit 7 21. 5. Tunnacliffe A, Olsson C, de la Hera A. The majority of human CD3 epitopes are conferred by the epsilon chain. Int Immunol. 1989;1(5):546‐50. 6. Andre‐Schmutz I, Le Deist F, Hacein‐Bey‐Abina S, Vitetta E, Schindler J, Chedeville G, et al. Immune reconstitution without graft‐versus‐host disease after haemopoietic stem‐cell transplantation: a phase 1/2 study. Lancet. 2002 Jul 13;360(9327):130‐7.
7. de Saint Basile G, Geissmann F, Flori E, Uring‐Lambert B, Soudais C, Cavazzana‐Calvo M, et al. Severe combined immunodeficiency caused by deficiency in either the delta or the epsilon subunit of CD3. J Clin Invest. 2004 Nov;114(10):1512‐7. 8. de Villartay JP, Lim A, Al‐Mousa H, Dupont S, Dechanet‐Merville J, Coumau‐Gatbois E, et al. A novel immunodeficiency associated with hypomorphic RAG1 mutations and CMV infection. J Clin Invest. 2005 Nov;115(11):3291‐9. 9. Avery DT, Deenick EK, Ma CS, Suryani S, Simpson N, Chew GY, et al. B cell‐intrinsic
alinsign g through IL‐21 receptor and STAT3 is required for establishing long‐lived antibody responses in humans. J Exp Med. 2010 Jan 18;207(1):155‐71. 10. Ma CS, Hare NJ, Nichols KE, Dupre L, Andolfi G, Roncarolo MG, et al. Impaired humoral immunity in X‐linked lymphoproliferative disease is associated with defective IL‐10 production by CD4+ T cells. J Clin Invest. 2005 Apr;115(4):1049‐59. 11. Nichols KE, Hom J, Gong SY, Ganguly A, Ma CS, Cannons JL, et al. Regulation of NKT cell development by SAP, the protein defective in XLP. Nat Med. 2005 Mar;11(3):340‐5. 12. Lim A, Baron V, Ferradini L, Bonneville M, Kourilsky P, Pannetier C. Combination of MHC‐peptide multimer‐based T cell sorting with the Immunoscope permits sensitive ex vivo quantitation and follow‐up of human CD8+ T cell immune responses. J Immunol Methods. 2002 Mar 1;261(1‐2):177‐94. 13. Kassu A, Tsegaye A, Petros B, Wolday D, Hailu E, Tilahun T, et al. Distribution of lymphocyte subsets in healthy human immunodeficiency virus‐negative adult Ethiopians from two geographic locales. Clin Diagn Lab Immunol. 2001 Nov;8(6):1171‐6. 14. Bisset LR, Lung TL, Kaelin M, Ludwig E, Dubs RW. Reference values for peripheral
nd. blood lymphocyte phenotypes applicable to the healthy adult population in SwitzerlaEur J Haematol. 2004 Mar;72(3):203‐12. 15. Gu Y, Chae HD, Siefring JE, Jasti AC, Hildeman DA, Williams DA. RhoH GTPase recruits and activates Zap70 required for T cell receptor signaling and thymocyte development. Nat Immunol. 2006 Nov;7(11):1182‐90. 16. Dorn T, Kuhn U, Bungartz G, Stiller S, Bauer M, Ellwart J, et al. RhoH is important for
itivepos thymocyte selection and T‐cell receptor signaling. Blood. 2007 Mar 15;109(6):2346‐55. 17. Porubsky S, Wang S, Kiss E, Dehmel S, Bonrouhi M, Dorn T, et al. Rhoh deficiency reduces peripheral T‐cell function and attenuates allogenic transplant rejection. Eur J Immunol. 2010 Jan;41(1):76‐88. 18. Arnaiz‐Villena A, Timon M, Corell A, Perez‐Aciego P, Martin‐Villa JM, Regueiro JR. Brief report: primary immunodeficiency caused by mutations in the gene encoding the
529‐CD3‐gamma subunit of the T‐lymphocyte receptor. N Engl J Med. 1992 Aug 20;327(8):33. 19. Fischer A, de Saint Basile G, Le Deist F. CD3 deficiencies. Curr Opin Allergy Clin Immunol. 2005 Dec;5(6):491‐5. 20. Recio MJ, Moreno‐Pelayo MA, Kilic SS, Guardo AC, Sanal O, Allende LM, et al. Differential biological role of CD3 chains revealed by human immunodeficiencies. J Immunol. 2007 Feb 15;178(4):2556‐64. 21. Pacheco‐Castro A, Alvarez‐Zapata D, Serrano‐Torres P, Regueiro JR. Signaling through a CD3 gamma‐deficient TCR/CD3 complex in immortalized mature CD4+ and CD8+ T lymphocytes. J Immunol. 1998 Sep 15;161(6):3152‐60.
22. Morgan NV, Goddard S, Cardno TS, McDonald D, Rahman F, Barge D, et al. Mutation in the TCRalpha subunit constant gene (TRAC) leads to a human immunodeficiency disorder characterized by a lack of TCRalphabeta+ T cells. J Clin Invest. 2011 Feb 1;121(2):695‐702. 23. Elder ME, Lin D, Clever J, Chan AC, Hope TJ, Weiss A, et al. Human severe combined
Jun immunodeficiency due to a defect in ZAP‐70, a T cell tyrosine kinase. Science. 1994 10;264(5165):1596‐9. 24. Roifman CM, Dadi H, Somech R, Nahum A, Sharfe N. Characterization of zeta‐associated protein, 70 kd (ZAP70)‐deficient human lymphocytes. J Allergy Clin Immunol. 2010 Dec;126(6):1226‐33 e1. 25. Katamura K, Tai G, Tachibana T, Yamabe H, Ohmori K, Mayumi M, et al. Existence of
vat 8 acti ed and memory CD4+ T cells in peripheral blood and their skin infiltration in CDdeficiency. Clin Exp Immunol. 1999 Jan;115(1):124‐30.
26. Fischer A, Picard C, Chemin K, Dogniaux S, le Deist F, Hivroz C. ZAP70: a masterregulator of adaptive immunity. Semin Immunopathol. 2010 Jun;32(2):107‐16. 27. Feske S, Picard C, Fischer A. Immunodeficiency due to mutations in ORAI1 and STIM1. Clin Immunol. 2010 May;135(2):169‐82. 28. Picard C, McCarl CA, Papolos A, Khalil S, Luthy K, Hivroz C, et al. STIM1 mutation associated with a syndrome of immunodeficiency and autoimmunity. N Engl J Med. 2009 May 7;360(19):1971‐80. 29. Byun M, Abhyankar A, Lelarge V, Plancoulaine S, Palanduz A, Telhan L, et al. Whole‐exome sequencing‐based discovery of STIM1 deficiency in a child with fatal classic Kaposi sarcoma. J Exp Med. 2010 Oct 25;207(11):2307‐12. 30. McCarl CA, Picard C, Khalil S, Kawasaki T, Rother J, Papolos A, et al. ORAI1 deficiency and lack of store‐operated Ca2+ entry cause immunodeficiency, myopathy, and ectodermal dysplasia. J Allergy Clin Immunol. 2009 Dec;124(6):1311‐8 e7. 31. Li FY, Chaigne‐Delalande B, Kanellopoulou C, Davis JC, Matthews HF, Douek DC, et al.
e. Second messenger role for Mg2+ revealed by human T‐cell immunodeficiency. Natur2011 Jul 28;475(7357):471‐6. 32. Su HC. Dedicator of cytokinesis 8 (DOCK8) deficiency. Curr Opin Allergy Clin Immunol. 2010 Dec;10(6):515‐20. 33. Randall KL, Chan SS, Ma CS, Fung I, Mei Y, Yabas M, et al. DOCK8 deficiency impairs CD8 T cell survival and function in humans and mice. J Exp Med. 2011 Oct 24;208(11):2305‐20. 34. Huck K, Feyen O, Niehues T, Ruschendorf F, Hubner N, Laws HJ, et al. Girls homozygous for an IL‐2‐inducible T cell kinase mutation that leads to protein deficiency develop fatal EBV‐associated lymphoproliferation. J Clin Invest. 2009 May;119(5):1350‐8. 35. Nehme NT, Pachlopnik Schmid J, Debeurme F, Andre‐Schmutz I, Lim A, Nitschke P, et l. MST1 mutations in autosomal recessive primary immunodeficiency characterized by efective naive T cells survival. Blood. 2011 Dec 14;10.1182/blood‐2011‐09‐378364. ad
Supplemental Figure legends
Supplemental Figure 1
(A, B) Histological features of flat wart-like lesions in patients P1 (A) and P2 (B). Haematoxylin
Eosin staining of wart sections shows (A) perinuclear vacuolization of spinous and granular
epidermal cells typical of HPV-3 productively infected cells, or (B) enlarged, homogeneously
pale-stained, cytoplasms of spinous and granular cells and abundant keratohyaline granules in
the upper granular layers typical of EV-HPV productively infected keratinocytes. (original
magnification, 40 X)
Supplemental Figure 2
(A, B, C) Multipoint linkage analysis for T-cell deficit with persistent EV-HPV infections and
chromosomes 2 (A), 4 (B) and 11 (C), with a full penetrance model. Only chromosomes
including regions with a maximal LOD score are shown. LOD scores (Y axis) are plotted against
chromosomal position (cM). The location of RHOH is indicated by an arrow.
Supplemental Figure 3
Human RhoH deficiency is not associated with impaired humoral immunity or low percentages
of NK and NKT cells. (A) Percentages of the various naive and memory B-cell subsets in the
CD20+ B-cell compartment, (B, C) Ig-expressing B cells within (B) the naive and (C) the
memory B-cell compartments were assessed by flow cytometry on cryopreserved PBMCs from
the two patients (P1 values are indicated by gray squares, P2 values are indicated by gray
diamonds) and 8 healthy controls (indicated by black circles). (D) NK, (E) NKT cell percentages
within (D) total lymphocytes, (E) CD3+ T cells were assessed by flow cytometry on
cryopreserved PBMCs from both patients and 8 healthy controls. Patients’ samples were tested
twice. There were no significant differences between healthy controls and patients for any of
these subsets. Mean values are represented by horizontal bars.
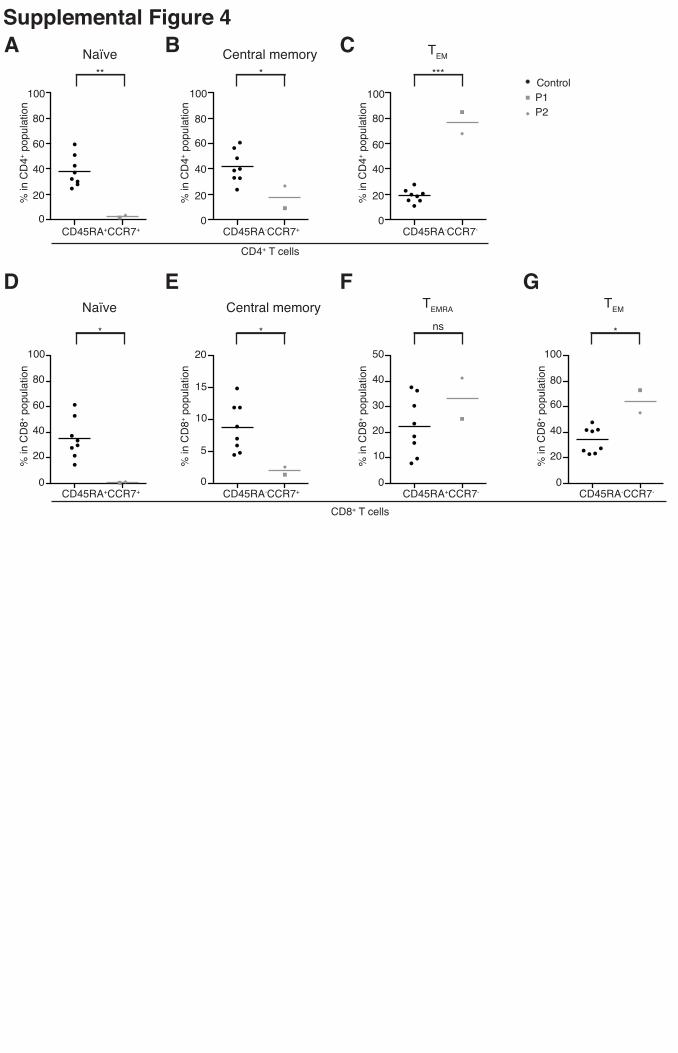
Supplemental Figure 4
Human RhoH deficiency is associated with a lack of naive T cells and an excess of effector
memory cells in both CD4+ and CD8+ populations. The frequencies of (A, D) naive
(CD45RA+CCR7+), (B, E) central memory (CD45RA-CCR7+), (F) TEMRA (CD45RA+CCR7-)
and (C, G) TEM (CD45RA-CCR7-) subsets of CD4+ T cells (A-C) and CD8+ T cells (D-G) in the
cryopreserved PBMCs of the patients (P1 values indicated by gray squares, P2 values indicated
by gray diamonds) and 8 healthy controls (indicated by black circles) were determined by flow
cytometry. Patients’ samples were tested twice. Mean values are represented by horizontal bars.
Similar results were obtained in the two experiments. (* = p <0.05; ** = p <0.005; *** = p
<0.0005; ns = non significant).
Supplemental Figure 5
Patients P1 and P2 have abnormal Vαβ and Vγδ distributions. Immunoscope profiles of (A)
TCRα, (B) TCRβ, (C) TCRγ (D) TCRδ for cDNAs obtained from the patients and controls
following RNA extraction from PBMCs. Only profiles for Vα, Vβ and TCRγδ differing between
the two patients and controls are shown, with a more oligoclonal pattern observed in the patients.
The x-axis indicates CDR3 length (number of amino acids) and the y-axis shows the fluorescence
intensity of the run-off products, in arbitrary units. The percentages indicate relative frequency of
usage.
Supplemental Figure 6
Human RhoH deficiency is associated with an excess of exhausted memory CD4+ and CD8+ T
cells. Frequencies of TEM (CD45RA-CCR7-) CD4+ (A-D) and CD8+ (E-H) T cells and
frequencies of TEMRA CD8+ T cells (CD45RA+CCR7-) (E-H) for the patients (P1 values
indicated by gray squares, P2 values indicated by gray diamonds) and 8 healthy controls
(indicated by black circles) expressing CD127 and 2B4 (A,E), CD27 and CD62L (B,F),
CX3CR1 and CD57 (C,G), granzyme and perforin (D,H). All subsets were assessed by flow
cytometry on cryopreserved PBMCs (* = p <0.05; **= p <0.005; ***= p <0.0005; ns = non
significant). Patients’ samples were tested twice. Mean values are represented by horizontal bars.
Similar results were obtained in the two experiments.
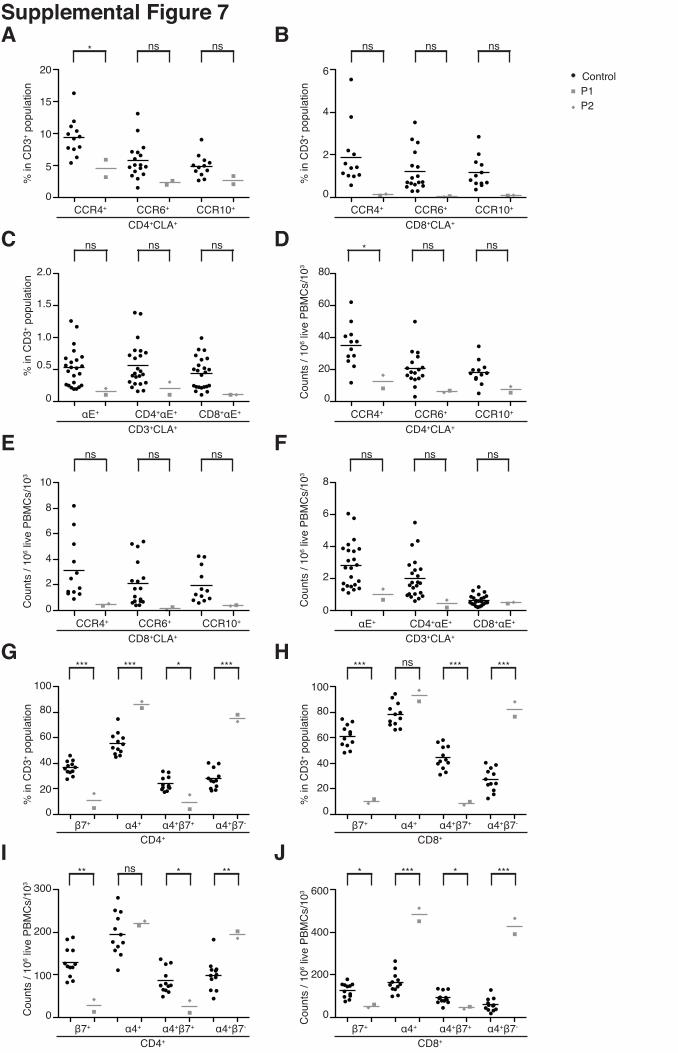
Supplemental Figure 7
Human RhoH deficiency leads to a severe decrease in the number of peripheral β7+ T cells,
particularly in the CD4+ T-cell subset. (A, B, D, E) Skin-homing CLA+CCR4+, CLA+CCR6+ and
CLA+CCR10+ subsets were assessed by flow cytometry on live CD3+ CD4+ and CD3+ CD8+
PBMCs from both patients and from 12, 17 and 12 healthy controls, respectively. (C, F)
αE+CLA+ cells were assessed by flow cytometry on live CD3+, CD3+CD4+ and CD3+CD8+
PBMCs from both patients and 23 healthy controls. (G, H, I, J) β7+, α4+, α4+β7+ and α4+β7-
subsets were assessed by flow cytometry on live CD3+CD4+ and CD3+CD8+ PBMCs from both
patients and 12 healthy controls. All assays were carried out on cryopreserved PBMCs. The
counts of the various subsets are expressed in (A, B, C, G, H) frequencies among CD3+ cells and
(D, E, F, I, J) counts per one million live PBMCs. P1 values are indicated by gray squares, P2
values are indicated by gray diamonds and healthy control values are indicated by black circles.
Viability rates of about 95% were recorded for all PBMC preparations. Patients’ samples were
tested at least twice, except for the chemokine receptors, which were assessed only once. Mean
values are represented by horizontal bars (* = P<0.05; **= P<0.005; ***= P<0.0005; ns = non
significant).
Supplemental Figure 8
Human and mouse RhoH deficiencies lead to an abnormal integrin expression pattern. (A, B, C,
D, E) Tissue-homing T-cell subsets were assessed on live CD3+-gated cryopreserved PBMCs
from the two patients (P1 values indicated by gray squares, P2 values indicated by gray
diamonds) and healthy controls (indicated by black circles), by flow cytometry (A) Skin-homing
CLA+ subsets were assessed on live CD3+, CD4+ and CD8+ gated PBMCs from both patients and
28 healthy controls. (B) CCR4+, CCR6+ and CCR10+ subsets were assessed for both patients and
12, 17 and 12 healthy controls, respectively. (C) Skin-homing CLA+CCR4+, CLA+CCR6+ and
CLA+CCR10+ subsets were assessed for both patients and for 12, 17 and 12 healthy controls,
respectively. (D) αE+β7+ cells were assessed on live CD3+, CD3+CD4+, CD3+CD8+ gated
PBMCs from both patients and 14 healthy controls. (E) β7+, α4+, α4+β7+ and α4+β7- subsets were
assessed for both patients and 12 healthy controls. The counts for the various subsets are
expressed in counts per one million live PBMCs. Viability rates were about 95% for all PBMC
preparations. Patients’ samples were tested at least twice, except for the chemokine receptors,
which were assessed only once. Mean values are represented by horizontal bars. The values
obtained in all experiments were similar. (F) Total counts of β7+, α4+, αE+β7+ and α4+β7+ cells
were assessed by flow cytometry on CD3+-gated peripheral blood cells from Rhoh+/+ (N=5) and
Rhoh-/- mice (mean +/- SEM, n=5 mice of mixed background) (* = p <0.05; ** = p <0.005; ***
= p <0.0005, ns = non significant).
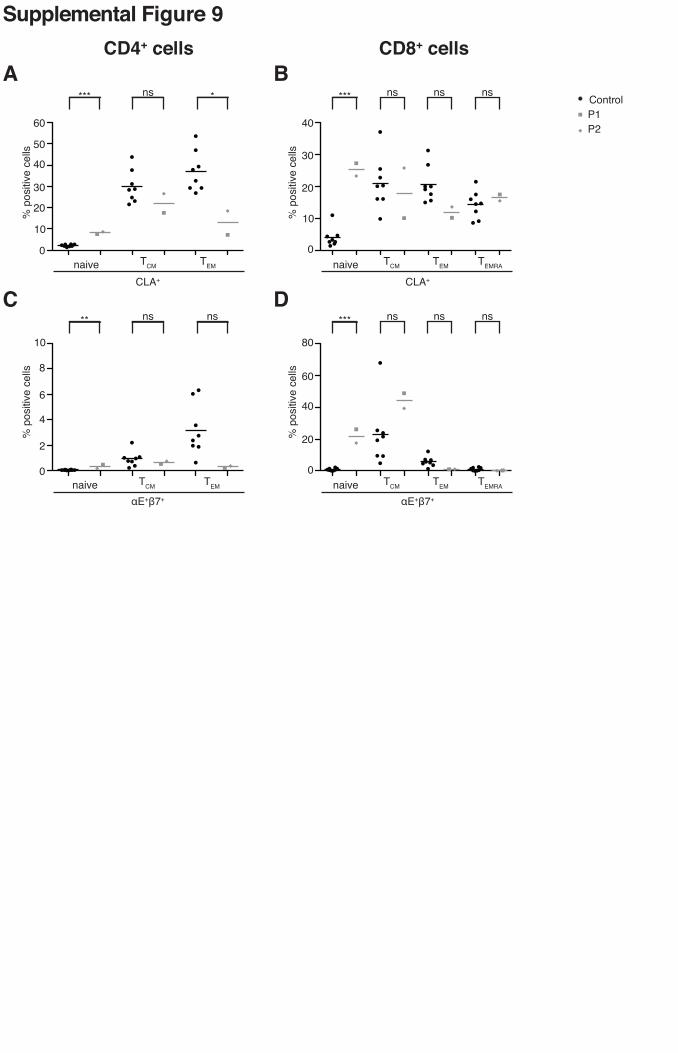
Supplemental Figure 9
RhoH deficiency is associated with an abnormal distribution of CLA and αEβ7 expression in the
various naive and memory T-cell compartments. (A, B) CLA+ cells were assessed in
cryopreserved PBMCs by flow cytometry on (A) CD4+ or (B) CD8+ gated naive and memory
subsets, using the CD45RA and CCR7 markers. (C, D) αE+β7+ cells were assessed by flow
cytometry on cryopreserved PBMCs on (C) CD4+ or (D) CD8+ gated naive and memory subsets,
using the CD45RA and CCR7 markers. Patients’ samples were tested twice. Mean values are
represented by horizontal bars. (* = p <0.05; ** = p <0.005; *** = p <0.0005; ns = non
significant).
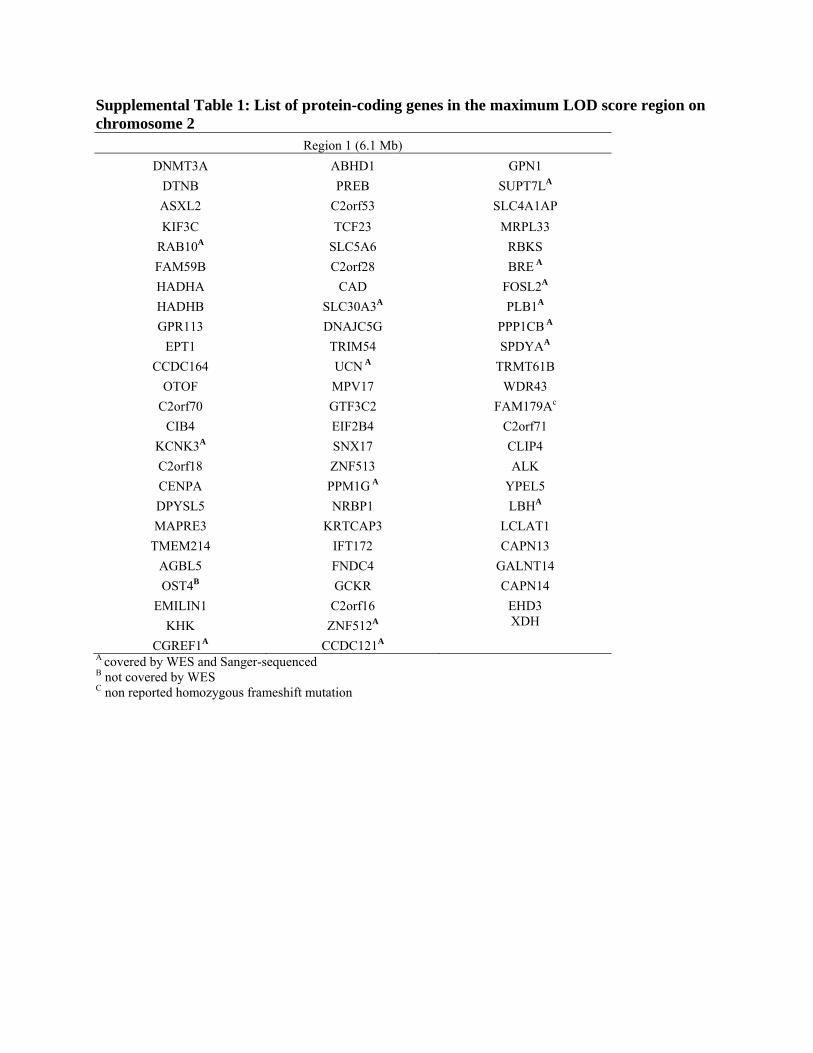
Supplemental Table 1: List of protein-coding genes in the maximum LOD score region on chromosome 2
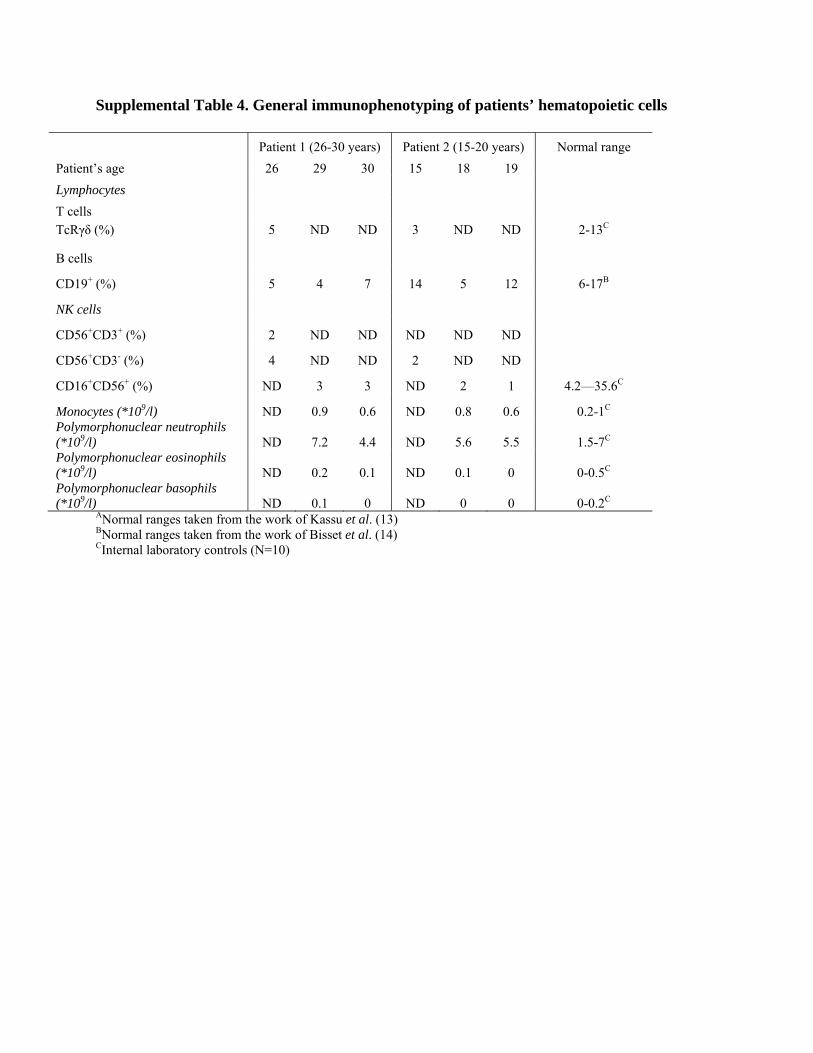
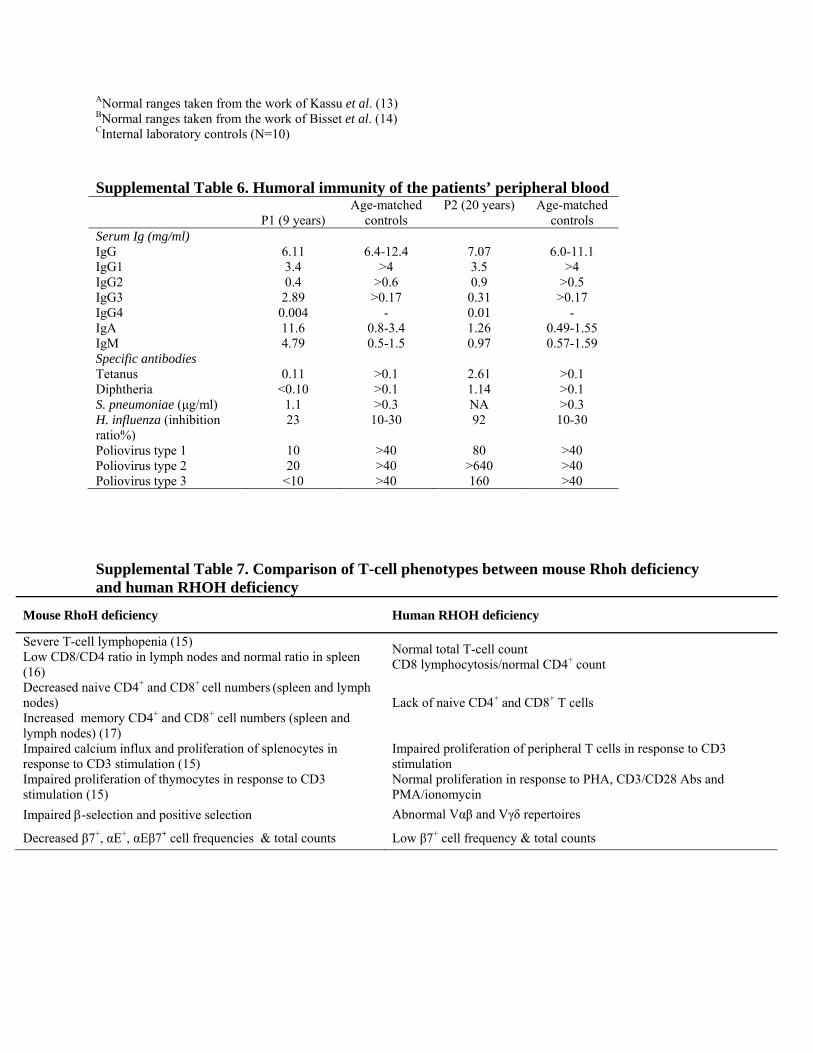
ANormal ranges taken from the work of Kassu et al. (13) BNormal ranges taken from the work of Bisset et al. (14) CInternal laboratory controls (N=10) Supplemental Table 6. Humoral immunity of the patients’ peripheral blood
Poliovirus type 1 10 >40 80 >40 Poliovirus type 2 20 >40 >640 >40 Poliovirus type 3 <10 >40 160 >40 Supplemental Table 7. Comparison of T-cell phenotypes between mouse Rhoh deficiency and human RHOH deficiency
Mouse RhoH deficiency Human RHOH deficiency
Severe T-cell lymphopenia (15) Low CD8/CD4 ratio in lymph nodes and normal ratio in spleen (16)
Normal total T-cell count CD8 lymphocytosis/normal CD4+ count
Decreased naive CD4+ and CD8+ cell numbers (spleen and lymph nodes) Increased memory CD4+ and CD8+ cell numbers (spleen and lymph nodes) (17)
Lack of naive CD4+ and CD8+ T cells
Impaired calcium influx and proliferation of splenocytes in response to CD3 stimulation (15) Impaired proliferation of thymocytes in response to CD3 stimulation (15)
Impaired proliferation of peripheral T cells in response to CD3 stimulation Normal proliferation in response to PHA, CD3/CD28 Abs and PMA/ionomycin
Impaired β-selection and positive selection Abnormal Vαβ and Vγδ repertoires
Decreased β7+, αE+, αEβ7+ cell frequencies & total counts Low β7+ cell frequency & total counts
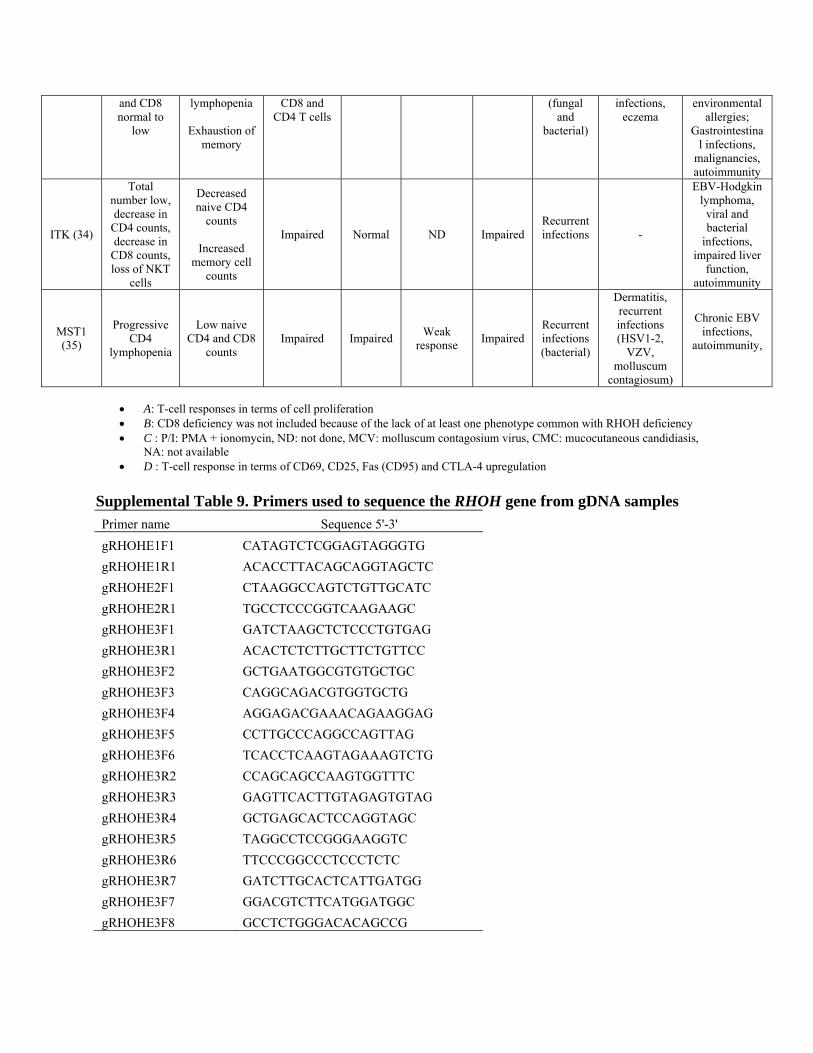
Supplemental Table 8. Comparison of RHOH deficiency with other PIDs involving T-cell defects
T-cell response to various stimuliA Clinical phenotype
• A: T-cell responses in terms of cell proliferation • B: CD8 deficiency was not included because of the lack of at least one phenotype common with RHOH deficiency • C : P/I: PMA + ionomycin, ND: not done, MCV: molluscum contagosium virus, CMC: mucocutaneous candidiasis,
NA: not available • D : T-cell response in terms of CD69, CD25, Fas (CD95) and CTLA-4 upregulation
Supplemental Table 9. Primers used to sequence the RHOH gene from gDNA samples Primer name Sequence 5'-3' gRHOHE1F1 CATAGTCTCGGAGTAGGGTG gRHOHE1R1 ACACCTTACAGCAGGTAGCTC gRHOHE2F1 CTAAGGCCAGTCTGTTGCATC gRHOHE2R1 TGCCTCCCGGTCAAGAAGC gRHOHE3F1 GATCTAAGCTCTCCCTGTGAG gRHOHE3R1 ACACTCTCTTGCTTCTGTTCC gRHOHE3F2 GCTGAATGGCGTGTGCTGC gRHOHE3F3 CAGGCAGACGTGGTGCTG gRHOHE3F4 AGGAGACGAAACAGAAGGAG gRHOHE3F5 CCTTGCCCAGGCCAGTTAG gRHOHE3F6 TCACCTCAAGTAGAAAGTCTG gRHOHE3R2 CCAGCAGCCAAGTGGTTTC gRHOHE3R3 GAGTTCACTTGTAGAGTGTAG gRHOHE3R4 GCTGAGCACTCCAGGTAGC gRHOHE3R5 TAGGCCTCCGGGAAGGTC gRHOHE3R6 TTCCCGGCCCTCCCTCTC gRHOHE3R7 GATCTTGCACTCATTGATGG gRHOHE3F7 GGACGTCTTCATGGATGGC gRHOHE3F8 GCCTCTGGGACACAGCCG


![Clinical & Cellular Skelton et al., Immunology migration into the graft, restriction of their Vβ-TCR repertoire [3], ... purified via positive T cell isolation kit using magnetic](https://static.documents.pub/doc/80x56/5ab499c17f8b9a7c5b8bf547/clinical-cellular-skelton-et-al-immunology-migration-into-the-graft-restriction.jpg)


![PSEUDO SECTION PLOTS MAPS FOR MAG IP SURV RPT PT 2 · MAGNETIC PROFILE 62000 ,T ] """" 1 em = 10000 nT 42000 nT 62000 nT ~~ BASE LEVEL: 52000 n T ~ CLG-02 ~~~,~.~ ahargeabllHy "e](https://static.documents.pub/doc/80x56/5f660a73d767e01853029019/pseudo-section-plots-maps-for-mag-ip-surv-rpt-pt-2-magnetic-profile-62000-t-.jpg)

