Supplementary appendix This appendix formed part of the original submission and has been peer reviewed. We post it as supplied by the authors. Supplement to: Holmer H, Lantz A, Kunjumen T, et al. Global distribution of surgeons, anaesthesiologists, and obstetricians. Lancet Glob Health 2015; 3: S9–11.
Transcript
Supplementary appendixThis appendix formed part of the original submission and has been peer reviewed. We post it as supplied by the authors.
Supplement to: Holmer H, Lantz A, Kunjumen T, et al. Global distribution of surgeons, anaesthesiologists, and obstetricians. Lancet Glob Health 2015; 3: S9–11.
1
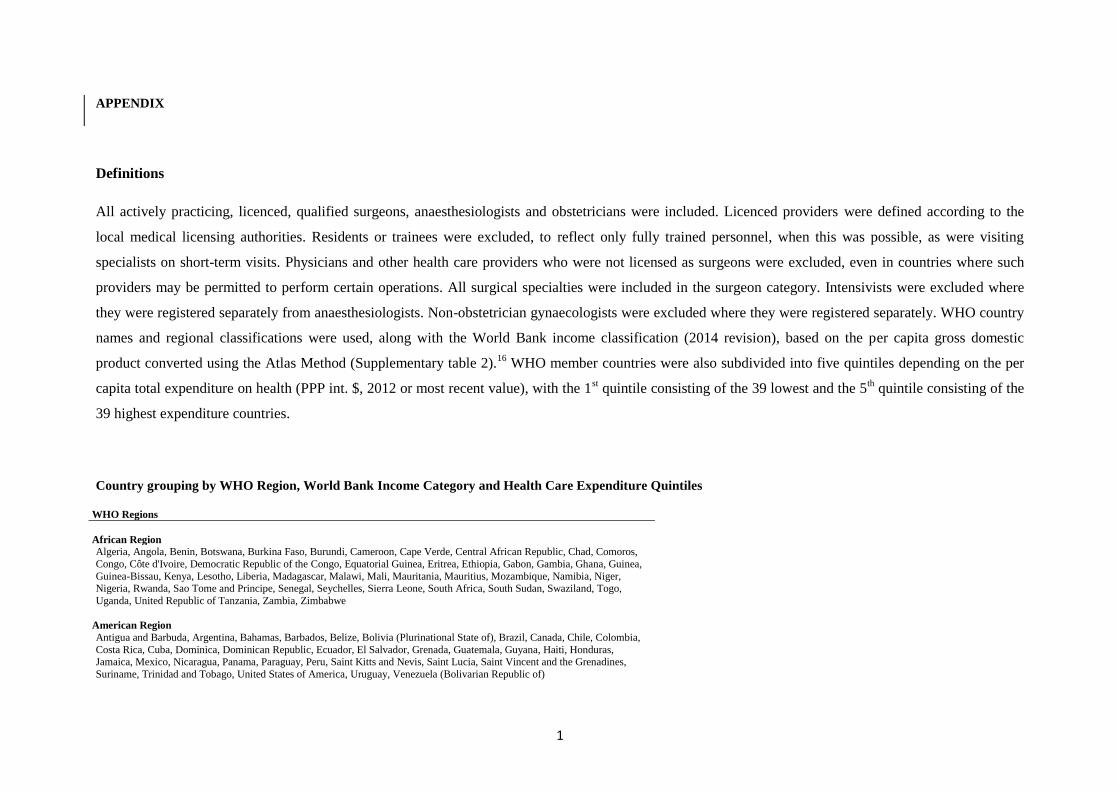
APPENDIX
Definitions
All actively practicing, licenced, qualified surgeons, anaesthesiologists and obstetricians were included. Licenced providers were defined according to the
local medical licensing authorities. Residents or trainees were excluded, to reflect only fully trained personnel, when this was possible, as were visiting
specialists on short-term visits. Physicians and other health care providers who were not licensed as surgeons were excluded, even in countries where such
providers may be permitted to perform certain operations. All surgical specialties were included in the surgeon category. Intensivists were excluded where
they were registered separately from anaesthesiologists. Non-obstetrician gynaecologists were excluded where they were registered separately. WHO country
names and regional classifications were used, along with the World Bank income classification (2014 revision), based on the per capita gross domestic
product converted using the Atlas Method (Supplementary table 2).16
WHO member countries were also subdivided into five quintiles depending on the per
capita total expenditure on health (PPP int. $, 2012 or most recent value), with the 1st quintile consisting of the 39 lowest and the 5
th quintile consisting of the
39 highest expenditure countries.
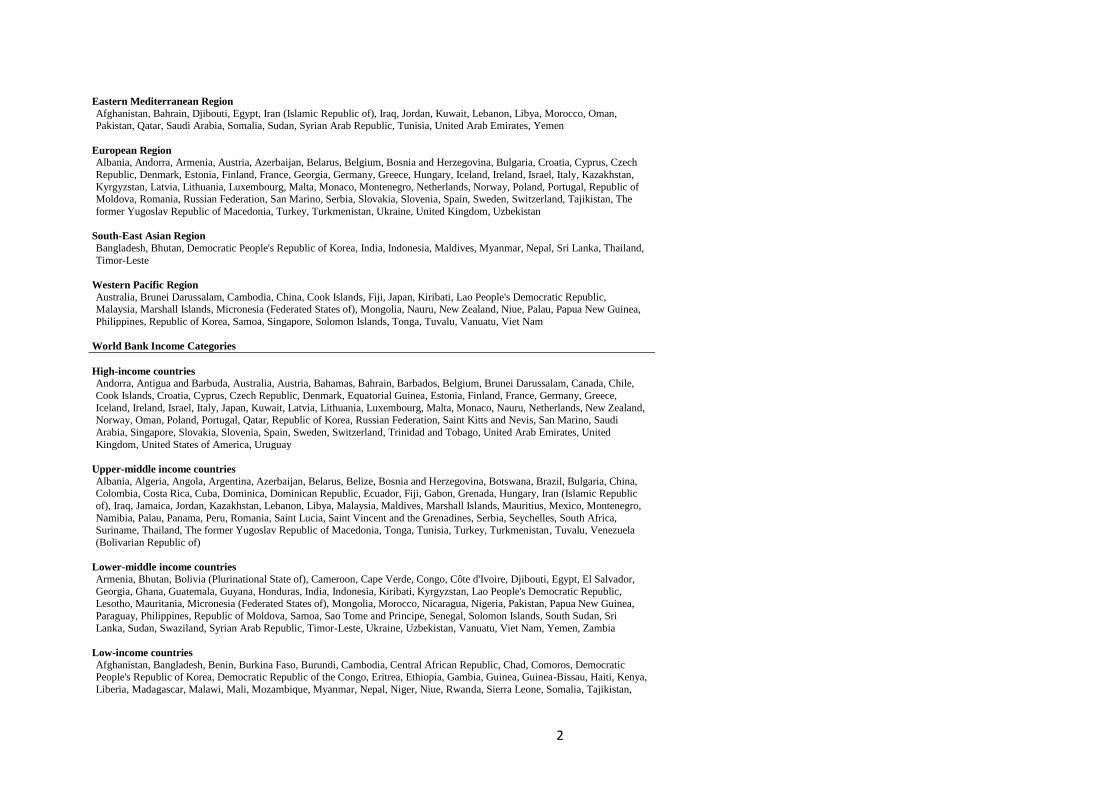
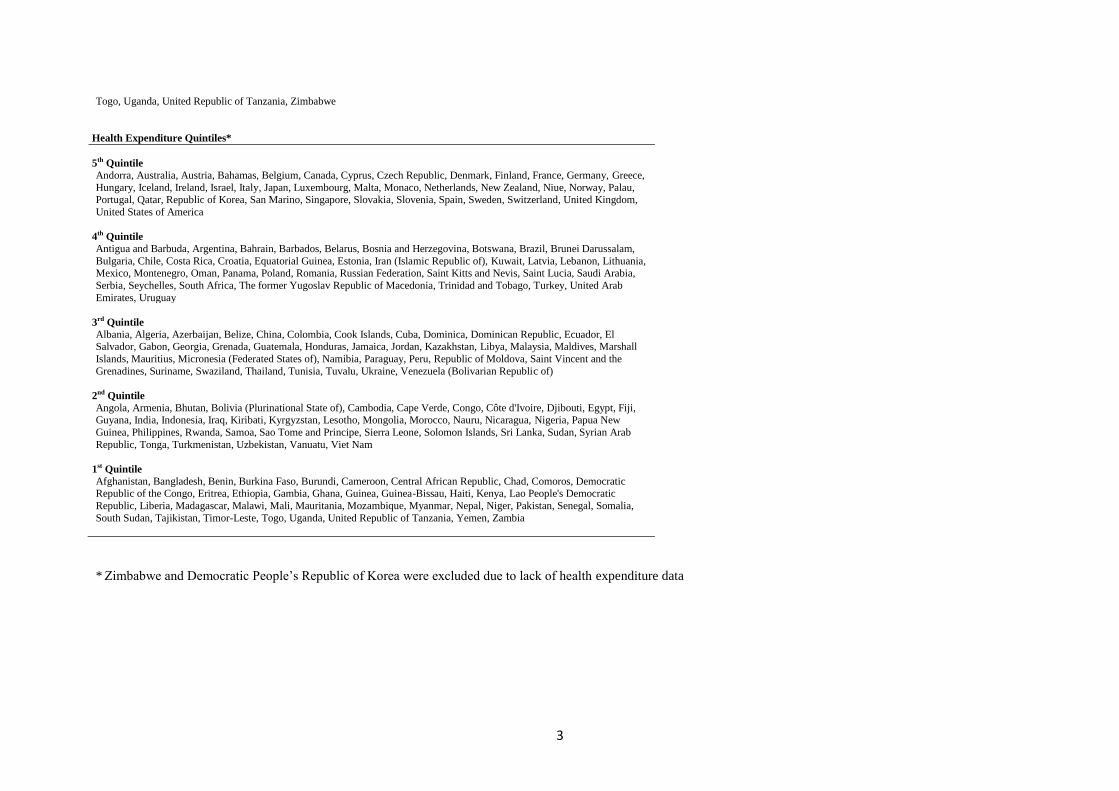
Country grouping by WHO Region, World Bank Income Category and Health Care Expenditure Quintiles
Congo, Côte d'Ivoire, Democratic Republic of the Congo, Equatorial Guinea, Eritrea, Ethiopia, Gabon, Gambia, Ghana, Guinea,
Guinea-Bissau, Kenya, Lesotho, Liberia, Madagascar, Malawi, Mali, Mauritania, Mauritius, Mozambique, Namibia, Niger, Nigeria, Rwanda, Sao Tome and Principe, Senegal, Seychelles, Sierra Leone, South Africa, South Sudan, Swaziland, Togo,
Uganda, United Republic of Tanzania, Zambia, Zimbabwe
American Region
Antigua and Barbuda, Argentina, Bahamas, Barbados, Belize, Bolivia (Plurinational State of), Brazil, Canada, Chile, Colombia,
Costa Rica, Cuba, Dominica, Dominican Republic, Ecuador, El Salvador, Grenada, Guatemala, Guyana, Haiti, Honduras, Jamaica, Mexico, Nicaragua, Panama, Paraguay, Peru, Saint Kitts and Nevis, Saint Lucia, Saint Vincent and the Grenadines,
Suriname, Trinidad and Tobago, United States of America, Uruguay, Venezuela (Bolivarian Republic of)
2
Eastern Mediterranean Region
Afghanistan, Bahrain, Djibouti, Egypt, Iran (Islamic Republic of), Iraq, Jordan, Kuwait, Lebanon, Libya, Morocco, Oman, Pakistan, Qatar, Saudi Arabia, Somalia, Sudan, Syrian Arab Republic, Tunisia, United Arab Emirates, Yemen
European Region
Albania, Andorra, Armenia, Austria, Azerbaijan, Belarus, Belgium, Bosnia and Herzegovina, Bulgaria, Croatia, Cyprus, Czech
Iceland, Ireland, Israel, Italy, Japan, Kuwait, Latvia, Lithuania, Luxembourg, Malta, Monaco, Nauru, Netherlands, New Zealand, Norway, Oman, Poland, Portugal, Qatar, Republic of Korea, Russian Federation, Saint Kitts and Nevis, San Marino, Saudi
Arabia, Singapore, Slovakia, Slovenia, Spain, Sweden, Switzerland, Trinidad and Tobago, United Arab Emirates, United
Kingdom, United States of America, Uruguay
Upper-middle income countries
Albania, Algeria, Angola, Argentina, Azerbaijan, Belarus, Belize, Bosnia and Herzegovina, Botswana, Brazil, Bulgaria, China, Colombia, Costa Rica, Cuba, Dominica, Dominican Republic, Ecuador, Fiji, Gabon, Grenada, Hungary, Iran (Islamic Republic
Namibia, Palau, Panama, Peru, Romania, Saint Lucia, Saint Vincent and the Grenadines, Serbia, Seychelles, South Africa, Suriname, Thailand, The former Yugoslav Republic of Macedonia, Tonga, Tunisia, Turkey, Turkmenistan, Tuvalu, Venezuela
(Bolivarian Republic of)
Lower-middle income countries
Armenia, Bhutan, Bolivia (Plurinational State of), Cameroon, Cape Verde, Congo, Côte d'Ivoire, Djibouti, Egypt, El Salvador,
Georgia, Ghana, Guatemala, Guyana, Honduras, India, Indonesia, Kiribati, Kyrgyzstan, Lao People's Democratic Republic,
Lesotho, Mauritania, Micronesia (Federated States of), Mongolia, Morocco, Nicaragua, Nigeria, Pakistan, Papua New Guinea,
Paraguay, Philippines, Republic of Moldova, Samoa, Sao Tome and Principe, Senegal, Solomon Islands, South Sudan, Sri
South Sudan, Tajikistan, Timor-Leste, Togo, Uganda, United Republic of Tanzania, Yemen, Zambia
* Zimbabwe and Democratic People’s Republic of Korea were excluded due to lack of health expenditure data
4
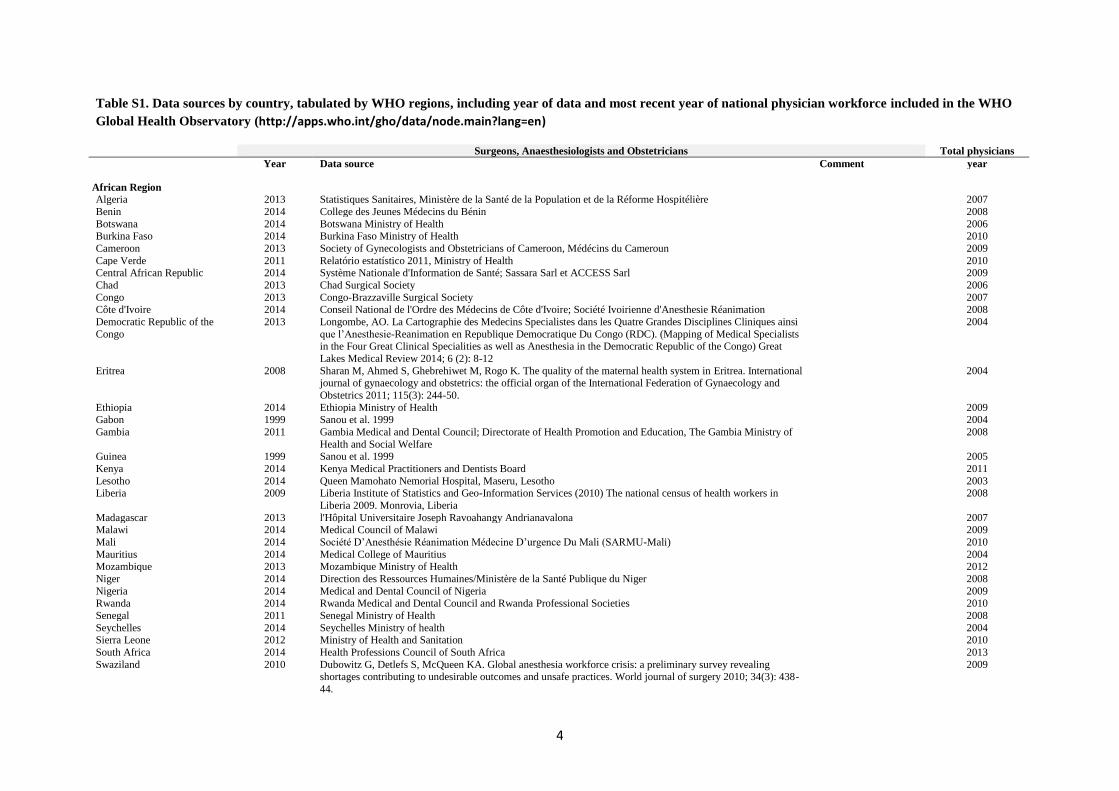
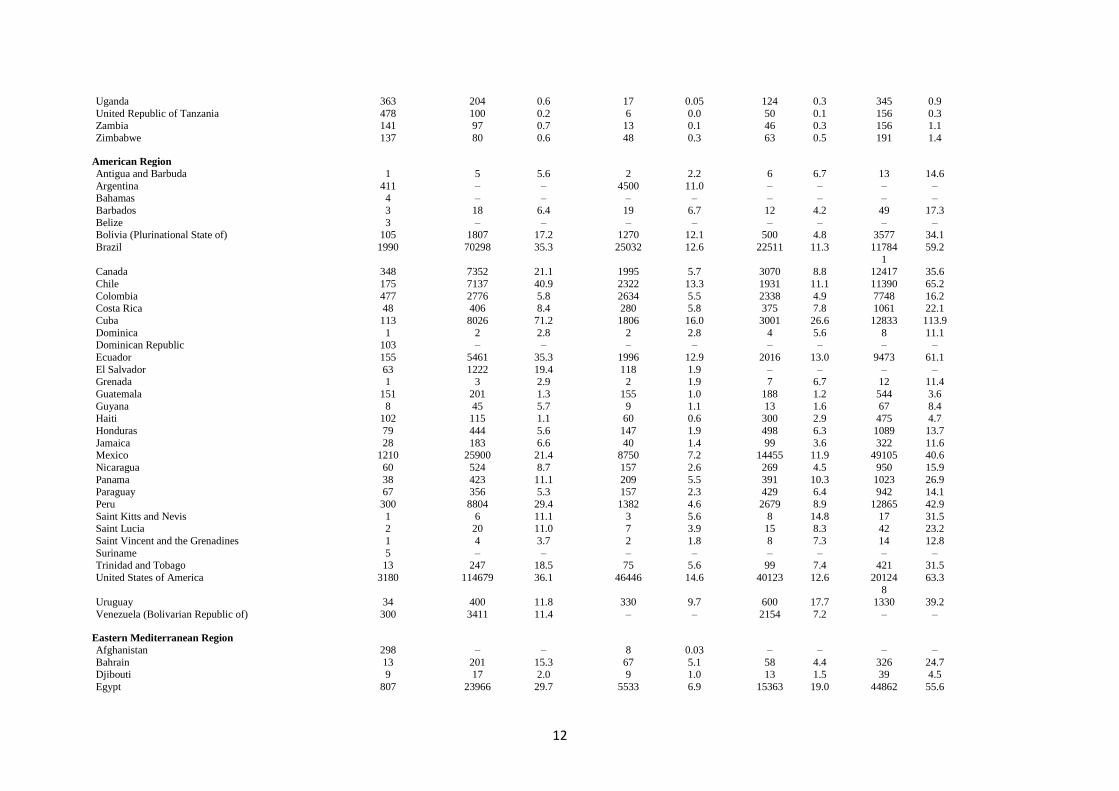
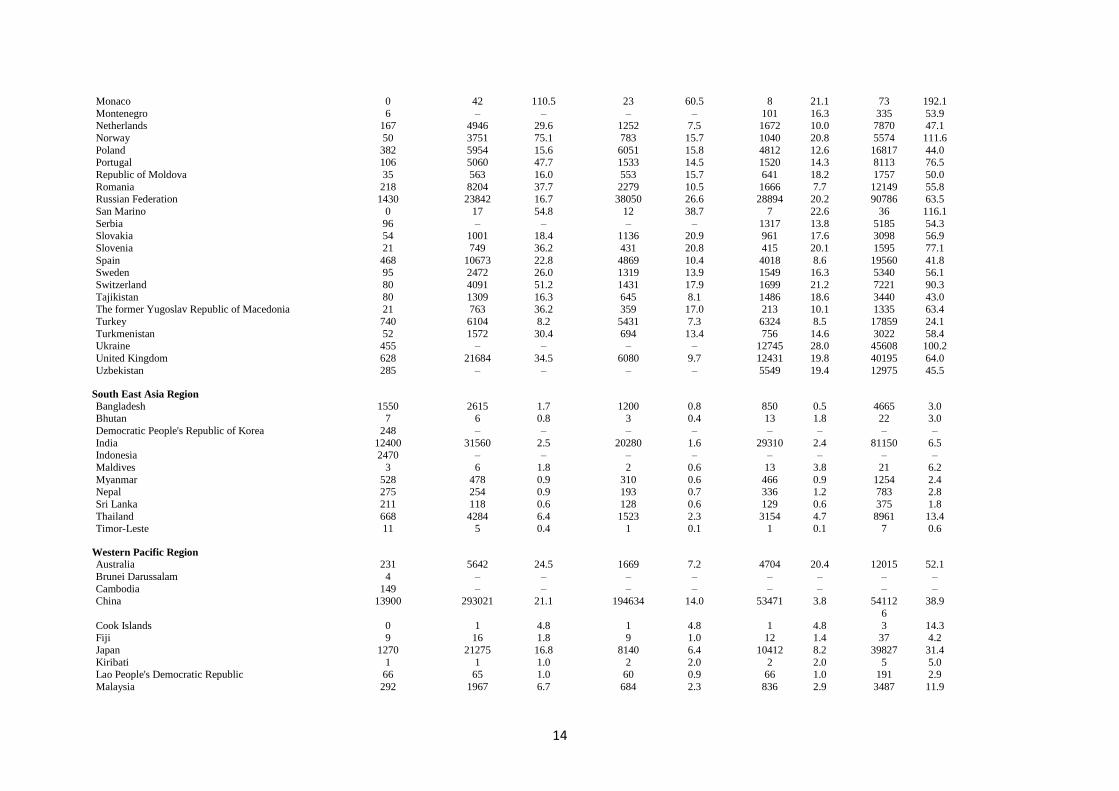
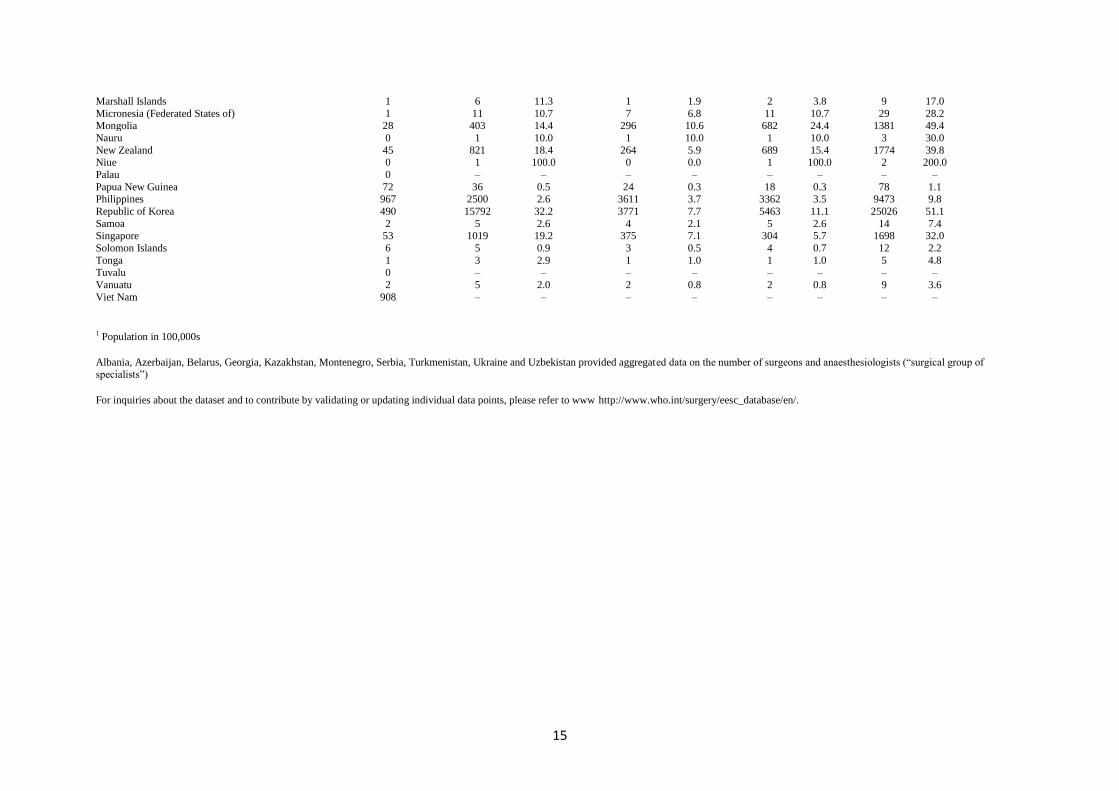
Table S1. Data sources by country, tabulated by WHO regions, including year of data and most recent year of national physician workforce included in the WHO
Global Health Observatory (http://apps.who.int/gho/data/node.main?lang=en)
Surgeons, Anaesthesiologists and Obstetricians Total physicians
Year Data source Comment year
African Region
Algeria 2013 Statistiques Sanitaires, Ministère de la Santé de la Population et de la Réforme Hospitélière 2007
Benin 2014 College des Jeunes Médecins du Bénin 2008
Botswana 2014 Botswana Ministry of Health 2006 Burkina Faso 2014 Burkina Faso Ministry of Health 2010
Cameroon 2013 Society of Gynecologists and Obstetricians of Cameroon, Médécins du Cameroun 2009
Cape Verde 2011 Relatório estatístico 2011, Ministry of Health 2010 Central African Republic 2014 Système Nationale d'Information de Santé; Sassara Sarl et ACCESS Sarl 2009
Chad 2013 Chad Surgical Society 2006
Congo 2013 Congo-Brazzaville Surgical Society 2007 Côte d'Ivoire 2014 Conseil National de l'Ordre des Médecins de Côte d'Ivoire; Société Ivoirienne d'Anesthesie Réanimation 2008
Democratic Republic of the
Congo
2013 Longombe, AO. La Cartographie des Medecins Specialistes dans les Quatre Grandes Disciplines Cliniques ainsi
que l’Anesthesie-Reanimation en Republique Democratique Du Congo (RDC). (Mapping of Medical Specialists in the Four Great Clinical Specialities as well as Anesthesia in the Democratic Republic of the Congo) Great
Lakes Medical Review 2014; 6 (2): 8-12
2004
Eritrea 2008 Sharan M, Ahmed S, Ghebrehiwet M, Rogo K. The quality of the maternal health system in Eritrea. International journal of gynaecology and obstetrics: the official organ of the International Federation of Gynaecology and
Obstetrics 2011; 115(3): 244-50.
2004
Ethiopia 2014 Ethiopia Ministry of Health 2009 Gabon 1999 Sanou et al. 1999 2004
Gambia 2011 Gambia Medical and Dental Council; Directorate of Health Promotion and Education, The Gambia Ministry of
Health and Social Welfare
2008
Guinea 1999 Sanou et al. 1999 2005
Kenya 2014 Kenya Medical Practitioners and Dentists Board 2011
Lesotho 2014 Queen Mamohato Nemorial Hospital, Maseru, Lesotho 2003 Liberia 2009 Liberia Institute of Statistics and Geo-Information Services (2010) The national census of health workers in
Liberia 2009. Monrovia, Liberia
2008
Madagascar 2013 l'Hôpital Universitaire Joseph Ravoahangy Andrianavalona 2007 Malawi 2014 Medical Council of Malawi 2009
Mali 2014 Société D’Anesthésie Réanimation Médecine D’urgence Du Mali (SARMU-Mali) 2010
Mauritius 2014 Medical College of Mauritius 2004 Mozambique 2013 Mozambique Ministry of Health 2012
Niger 2014 Direction des Ressources Humaines/Ministère de la Santé Publique du Niger 2008
Nigeria 2014 Medical and Dental Council of Nigeria 2009
Rwanda 2014 Rwanda Medical and Dental Council and Rwanda Professional Societies 2010
Senegal 2011 Senegal Ministry of Health 2008
Seychelles 2014 Seychelles Ministry of health 2004 Sierra Leone 2012 Ministry of Health and Sanitation 2010
South Africa 2014 Health Professions Council of South Africa 2013
Swaziland 2010 Dubowitz G, Detlefs S, McQueen KA. Global anesthesia workforce crisis: a preliminary survey revealing shortages contributing to undesirable outcomes and unsafe practices. World journal of surgery 2010; 34(3): 438-
Uganda 2012 Linden AF, Sekidde FS, Galukande M, Knowlton LM, Chackungal S, McQueen KA. Challenges of surgery in developing countries: a survey of surgical and anesthesia capacity in Uganda's public hospitals. World journal of
surgery 2012; 36(5): 1056-65.
2005
United Republic of Tanzania 2010 Ministry of Health of Tanzania 2006 Zambia 2012 The 2012 Annual Report; Health Professions Council of Zambia 2010
Zimbabwe 2014 The Medical and Dental Practitioners Council of Zimbabwe 2014 statistics
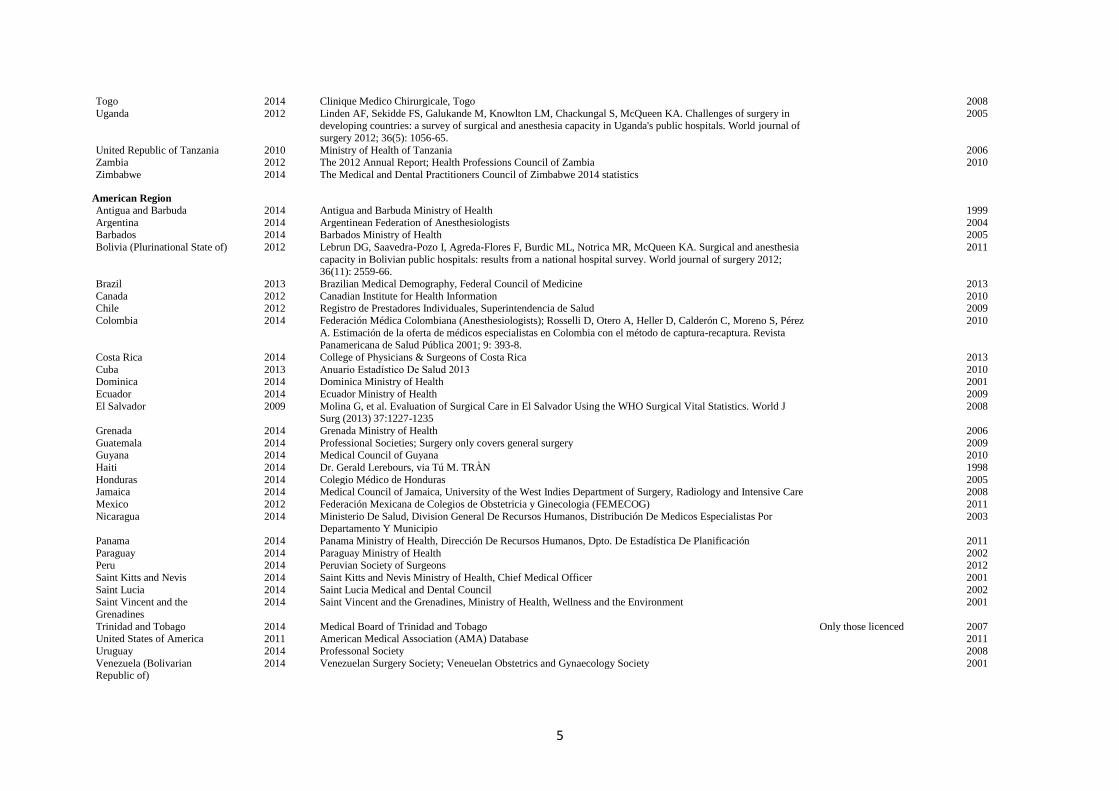
American Region
Antigua and Barbuda 2014 Antigua and Barbuda Ministry of Health 1999
Argentina 2014 Argentinean Federation of Anesthesiologists 2004 Barbados 2014 Barbados Ministry of Health 2005
Bolivia (Plurinational State of) 2012 Lebrun DG, Saavedra-Pozo I, Agreda-Flores F, Burdic ML, Notrica MR, McQueen KA. Surgical and anesthesia
capacity in Bolivian public hospitals: results from a national hospital survey. World journal of surgery 2012; 36(11): 2559-66.
2011
Brazil 2013 Brazilian Medical Demography, Federal Council of Medicine 2013
Canada 2012 Canadian Institute for Health Information 2010 Chile 2012 Registro de Prestadores Individuales, Superintendencia de Salud 2009
A. Estimación de la oferta de médicos especialistas en Colombia con el método de captura-recaptura. Revista Panamericana de Salud Pública 2001; 9: 393-8.
2010
Costa Rica 2014 College of Physicians & Surgeons of Costa Rica 2013
Cuba 2013 Anuario Estadistico De Salud 2013 2010 Dominica 2014 Dominica Ministry of Health 2001
Ecuador 2014 Ecuador Ministry of Health 2009
El Salvador 2009 Molina G, et al. Evaluation of Surgical Care in El Salvador Using the WHO Surgical Vital Statistics. World J Surg (2013) 37:1227-1235
2008
Grenada 2014 Grenada Ministry of Health 2006
Guatemala 2014 Professional Societies; Surgery only covers general surgery 2009 Guyana 2014 Medical Council of Guyana 2010
Haiti 2014 Dr. Gerald Lerebours, via Tú M. TRẦN 1998
Honduras 2014 Colegio Médico de Honduras 2005 Jamaica 2014 Medical Council of Jamaica, University of the West Indies Department of Surgery, Radiology and Intensive Care 2008
Mexico 2012 Federación Mexicana de Colegios de Obstetricia y Ginecologia (FEMECOG) 2011
Nicaragua 2014 Ministerio De Salud, Division General De Recursos Humanos, Distribución De Medicos Especialistas Por Departamento Y Municipio
2003
Panama 2014 Panama Ministry of Health, Dirección De Recursos Humanos, Dpto. De Estadística De Planificación 2011
Paraguay 2014 Paraguay Ministry of Health 2002 Peru 2014 Peruvian Society of Surgeons 2012
Saint Kitts and Nevis 2014 Saint Kitts and Nevis Ministry of Health, Chief Medical Officer 2001
Saint Lucia 2014 Saint Lucia Medical and Dental Council 2002
Saint Vincent and the
Grenadines
2014 Saint Vincent and the Grenadines, Ministry of Health, Wellness and the Environment 2001
Trinidad and Tobago 2014 Medical Board of Trinidad and Tobago Only those licenced 2007 United States of America 2011 American Medical Association (AMA) Database 2011
Uruguay 2014 Professonal Society 2008
Venezuela (Bolivarian Republic of)
2014 Venezuelan Surgery Society; Veneuelan Obstetrics and Gynaecology Society 2001
6
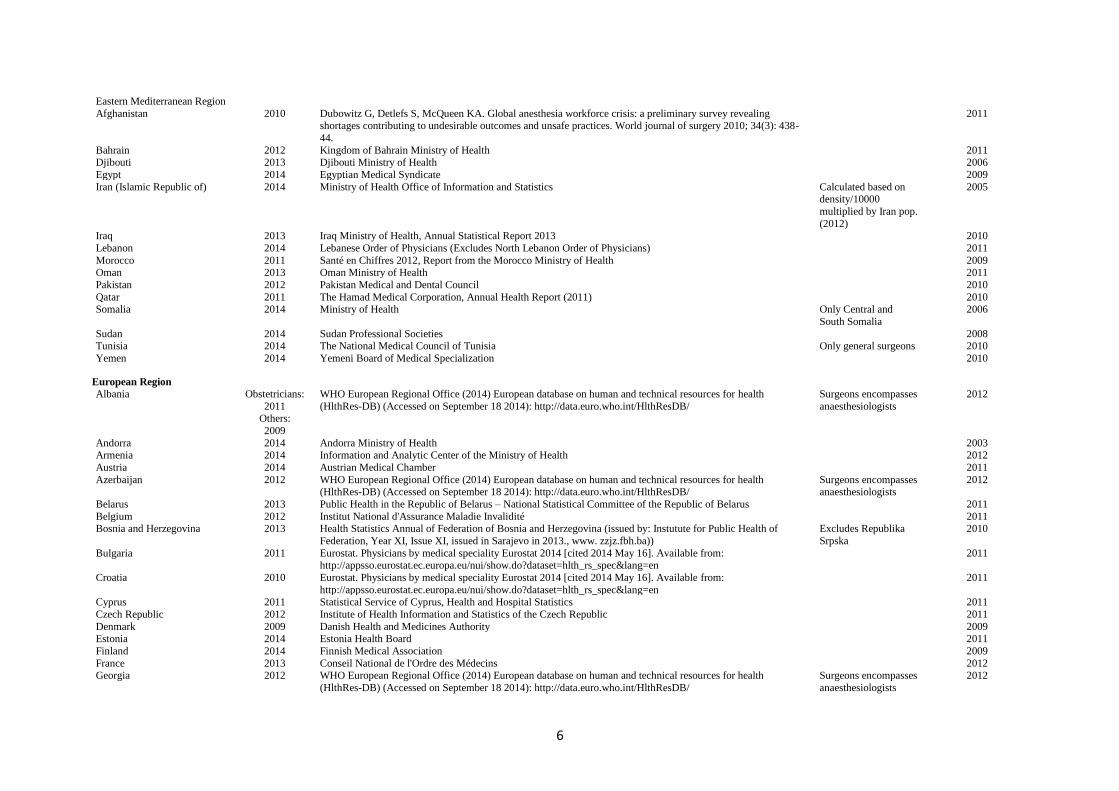
Eastern Mediterranean Region
Afghanistan 2010 Dubowitz G, Detlefs S, McQueen KA. Global anesthesia workforce crisis: a preliminary survey revealing shortages contributing to undesirable outcomes and unsafe practices. World journal of surgery 2010; 34(3): 438-
44.
2011
Bahrain 2012 Kingdom of Bahrain Ministry of Health 2011 Djibouti 2013 Djibouti Ministry of Health 2006
Egypt 2014 Egyptian Medical Syndicate 2009
Iran (Islamic Republic of) 2014 Ministry of Health Office of Information and Statistics Calculated based on density/10000
Lebanon 2014 Lebanese Order of Physicians (Excludes North Lebanon Order of Physicians) 2011
Morocco 2011 Santé en Chiffres 2012, Report from the Morocco Ministry of Health 2009 Oman 2013 Oman Ministry of Health 2011
Pakistan 2012 Pakistan Medical and Dental Council 2010
Qatar 2011 The Hamad Medical Corporation, Annual Health Report (2011) 2010 Somalia 2014 Ministry of Health Only Central and
South Somalia
2006
Sudan 2014 Sudan Professional Societies 2008 Tunisia 2014 The National Medical Council of Tunisia Only general surgeons 2010
Yemen 2014 Yemeni Board of Medical Specialization 2010
European Region
Albania Obstetricians:
2011 Others:
2009
WHO European Regional Office (2014) European database on human and technical resources for health
(HlthRes-DB) (Accessed on September 18 2014): http://data.euro.who.int/HlthResDB/
Surgeons encompasses
anaesthesiologists
2012
Andorra 2014 Andorra Ministry of Health 2003 Armenia 2014 Information and Analytic Center of the Ministry of Health 2012
Austria 2014 Austrian Medical Chamber 2011
Azerbaijan 2012 WHO European Regional Office (2014) European database on human and technical resources for health (HlthRes-DB) (Accessed on September 18 2014): http://data.euro.who.int/HlthResDB/
Surgeons encompasses anaesthesiologists
2012
Belarus 2013 Public Health in the Republic of Belarus – National Statistical Committee of the Republic of Belarus 2011
Belgium 2012 Institut National d'Assurance Maladie Invalidité 2011 Bosnia and Herzegovina 2013 Health Statistics Annual of Federation of Bosnia and Herzegovina (issued by: Instutute for Public Health of
Federation, Year XI, Issue XI, issued in Sarajevo in 2013., www. zzjz.fbh.ba))
Excludes Republika
Srpska
2010
Bulgaria 2011 Eurostat. Physicians by medical speciality Eurostat 2014 [cited 2014 May 16]. Available from: http://appsso.eurostat.ec.europa.eu/nui/show.do?dataset=hlth_rs_spec&lang=en
2011
Croatia 2010 Eurostat. Physicians by medical speciality Eurostat 2014 [cited 2014 May 16]. Available from:
Cyprus 2011 Statistical Service of Cyprus, Health and Hospital Statistics 2011
Czech Republic 2012 Institute of Health Information and Statistics of the Czech Republic 2011
Denmark 2009 Danish Health and Medicines Authority 2009 Estonia 2014 Estonia Health Board 2011
Finland 2014 Finnish Medical Association 2009
France 2013 Conseil National de l'Ordre des Médecins 2012 Georgia 2012 WHO European Regional Office (2014) European database on human and technical resources for health
(HlthRes-DB) (Accessed on September 18 2014): http://data.euro.who.int/HlthResDB/
Surgeons encompasses
anaesthesiologists
2012
7
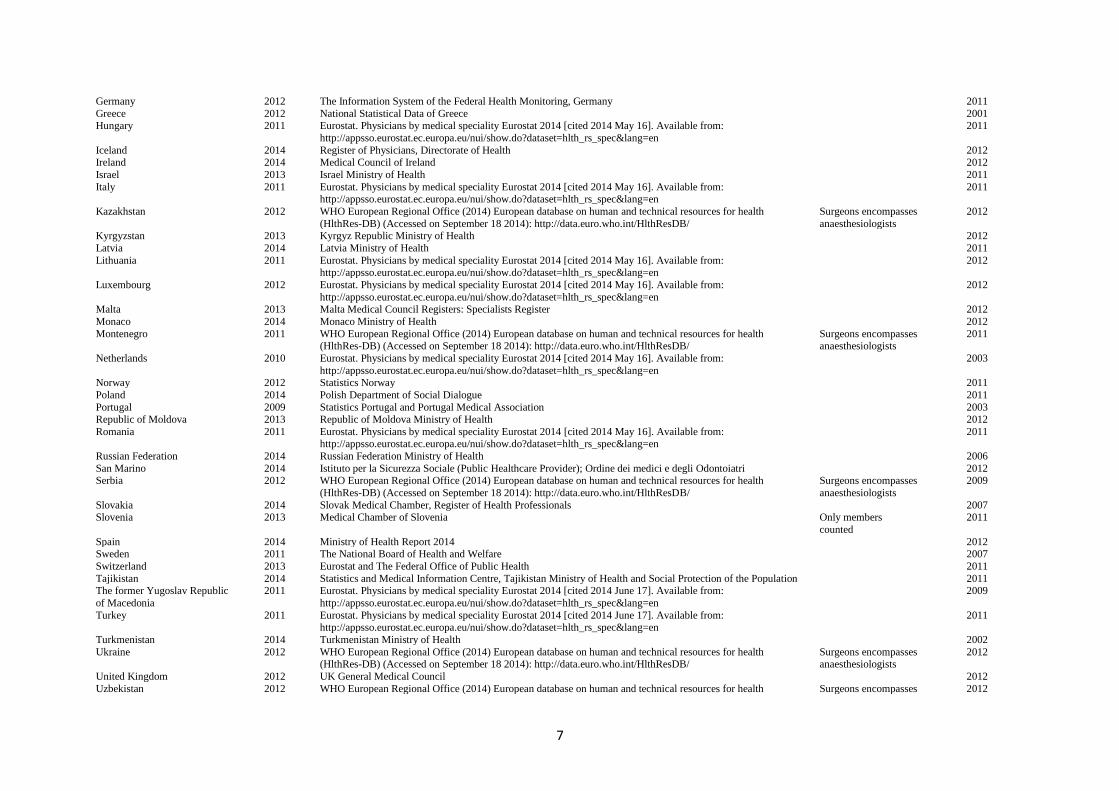
Germany 2012 The Information System of the Federal Health Monitoring, Germany 2011
Greece 2012 National Statistical Data of Greece 2001 Hungary 2011 Eurostat. Physicians by medical speciality Eurostat 2014 [cited 2014 May 16]. Available from:
Iceland 2014 Register of Physicians, Directorate of Health 2012 Ireland 2014 Medical Council of Ireland 2012
Israel 2013 Israel Ministry of Health 2011
Italy 2011 Eurostat. Physicians by medical speciality Eurostat 2014 [cited 2014 May 16]. Available from: http://appsso.eurostat.ec.europa.eu/nui/show.do?dataset=hlth_rs_spec&lang=en
2011
Kazakhstan 2012 WHO European Regional Office (2014) European database on human and technical resources for health
(HlthRes-DB) (Accessed on September 18 2014): http://data.euro.who.int/HlthResDB/
Surgeons encompasses
anaesthesiologists
2012
Kyrgyzstan 2013 Kyrgyz Republic Ministry of Health 2012
Latvia 2014 Latvia Ministry of Health 2011
Lithuania 2011 Eurostat. Physicians by medical speciality Eurostat 2014 [cited 2014 May 16]. Available from: http://appsso.eurostat.ec.europa.eu/nui/show.do?dataset=hlth_rs_spec&lang=en
2012
Luxembourg 2012 Eurostat. Physicians by medical speciality Eurostat 2014 [cited 2014 May 16]. Available from:
Malta 2013 Malta Medical Council Registers: Specialists Register 2012
Monaco 2014 Monaco Ministry of Health 2012
Montenegro 2011 WHO European Regional Office (2014) European database on human and technical resources for health (HlthRes-DB) (Accessed on September 18 2014): http://data.euro.who.int/HlthResDB/
Surgeons encompasses anaesthesiologists
2011
Netherlands 2010 Eurostat. Physicians by medical speciality Eurostat 2014 [cited 2014 May 16]. Available from:
Poland 2014 Polish Department of Social Dialogue 2011
Portugal 2009 Statistics Portugal and Portugal Medical Association 2003 Republic of Moldova 2013 Republic of Moldova Ministry of Health 2012
Romania 2011 Eurostat. Physicians by medical speciality Eurostat 2014 [cited 2014 May 16]. Available from: http://appsso.eurostat.ec.europa.eu/nui/show.do?dataset=hlth_rs_spec&lang=en
2011
Russian Federation 2014 Russian Federation Ministry of Health 2006
San Marino 2014 Istituto per la Sicurezza Sociale (Public Healthcare Provider); Ordine dei medici e degli Odontoiatri 2012 Serbia 2012 WHO European Regional Office (2014) European database on human and technical resources for health
(HlthRes-DB) (Accessed on September 18 2014): http://data.euro.who.int/HlthResDB/
Surgeons encompasses
anaesthesiologists
2009
Slovakia 2014 Slovak Medical Chamber, Register of Health Professionals 2007 Slovenia 2013 Medical Chamber of Slovenia Only members
counted
2011
Spain 2014 Ministry of Health Report 2014 2012 Sweden 2011 The National Board of Health and Welfare 2007
Switzerland 2013 Eurostat and The Federal Office of Public Health 2011
Tajikistan 2014 Statistics and Medical Information Centre, Tajikistan Ministry of Health and Social Protection of the Population 2011 The former Yugoslav Republic
of Macedonia
2011 Eurostat. Physicians by medical speciality Eurostat 2014 [cited 2014 June 17]. Available from:
Turkey 2011 Eurostat. Physicians by medical speciality Eurostat 2014 [cited 2014 June 17]. Available from: http://appsso.eurostat.ec.europa.eu/nui/show.do?dataset=hlth_rs_spec&lang=en
2011
Turkmenistan 2014 Turkmenistan Ministry of Health 2002
Ukraine 2012 WHO European Regional Office (2014) European database on human and technical resources for health (HlthRes-DB) (Accessed on September 18 2014): http://data.euro.who.int/HlthResDB/
Surgeons encompasses anaesthesiologists
2012
United Kingdom 2012 UK General Medical Council 2012
Uzbekistan 2012 WHO European Regional Office (2014) European database on human and technical resources for health Surgeons encompasses 2012
8
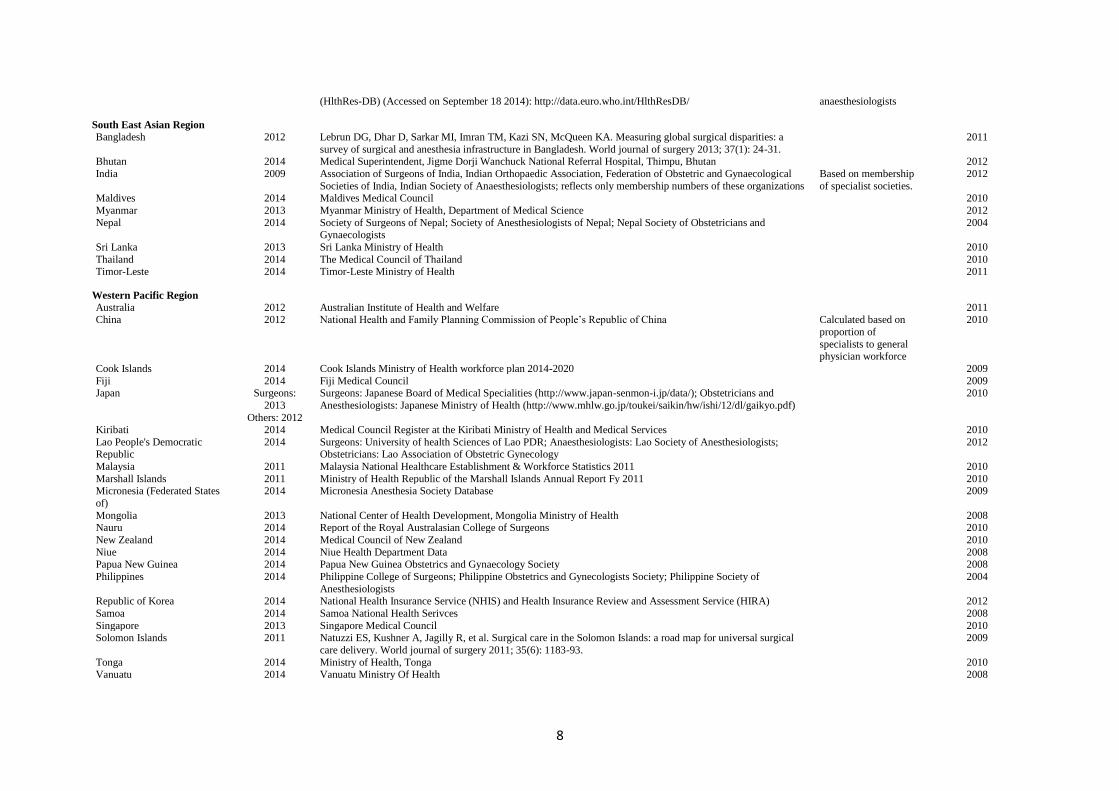
(HlthRes-DB) (Accessed on September 18 2014): http://data.euro.who.int/HlthResDB/ anaesthesiologists
South East Asian Region
Bangladesh 2012 Lebrun DG, Dhar D, Sarkar MI, Imran TM, Kazi SN, McQueen KA. Measuring global surgical disparities: a
survey of surgical and anesthesia infrastructure in Bangladesh. World journal of surgery 2013; 37(1): 24-31.
2011
Bhutan 2014 Medical Superintendent, Jigme Dorji Wanchuck National Referral Hospital, Thimpu, Bhutan 2012
India 2009 Association of Surgeons of India, Indian Orthopaedic Association, Federation of Obstetric and Gynaecological
Societies of India, Indian Society of Anaesthesiologists; reflects only membership numbers of these organizations
Based on membership
of specialist societies.
2012
Maldives 2014 Maldives Medical Council 2010
Myanmar 2013 Myanmar Ministry of Health, Department of Medical Science 2012
Nepal 2014 Society of Surgeons of Nepal; Society of Anesthesiologists of Nepal; Nepal Society of Obstetricians and Gynaecologists
2004
Sri Lanka 2013 Sri Lanka Ministry of Health 2010
Thailand 2014 The Medical Council of Thailand 2010 Timor-Leste 2014 Timor-Leste Ministry of Health 2011
Western Pacific Region
Australia 2012 Australian Institute of Health and Welfare 2011 China 2012 National Health and Family Planning Commission of People’s Republic of China Calculated based on
proportion of
specialists to general physician workforce
2010
Cook Islands 2014 Cook Islands Ministry of Health workforce plan 2014-2020 2009
Fiji 2014 Fiji Medical Council 2009 Japan Surgeons:
2013
Others: 2012
Surgeons: Japanese Board of Medical Specialities (http://www.japan-senmon-i.jp/data/); Obstetricians and
Anesthesiologists: Japanese Ministry of Health (http://www.mhlw.go.jp/toukei/saikin/hw/ishi/12/dl/gaikyo.pdf)
2010
Kiribati 2014 Medical Council Register at the Kiribati Ministry of Health and Medical Services 2010
Lao People's Democratic Republic
2014 Surgeons: University of health Sciences of Lao PDR; Anaesthesiologists: Lao Society of Anesthesiologists; Obstetricians: Lao Association of Obstetric Gynecology
2012
Malaysia 2011 Malaysia National Healthcare Establishment & Workforce Statistics 2011 2010
Marshall Islands 2011 Ministry of Health Republic of the Marshall Islands Annual Report Fy 2011 2010 Micronesia (Federated States
of)
2014 Micronesia Anesthesia Society Database 2009
Mongolia 2013 National Center of Health Development, Mongolia Ministry of Health 2008 Nauru 2014 Report of the Royal Australasian College of Surgeons 2010
New Zealand 2014 Medical Council of New Zealand 2010
Niue 2014 Niue Health Department Data 2008 Papua New Guinea 2014 Papua New Guinea Obstetrics and Gynaecology Society 2008
Philippines 2014 Philippine College of Surgeons; Philippine Obstetrics and Gynecologists Society; Philippine Society of
Anesthesiologists
2004
Republic of Korea 2014 National Health Insurance Service (NHIS) and Health Insurance Review and Assessment Service (HIRA) 2012
Samoa 2014 Samoa National Health Serivces 2008
Singapore 2013 Singapore Medical Council 2010 Solomon Islands 2011 Natuzzi ES, Kushner A, Jagilly R, et al. Surgical care in the Solomon Islands: a road map for universal surgical
care delivery. World journal of surgery 2011; 35(6): 1183-93.
2009
Tonga 2014 Ministry of Health, Tonga 2010 Vanuatu 2014 Vanuatu Ministry Of Health 2008
9
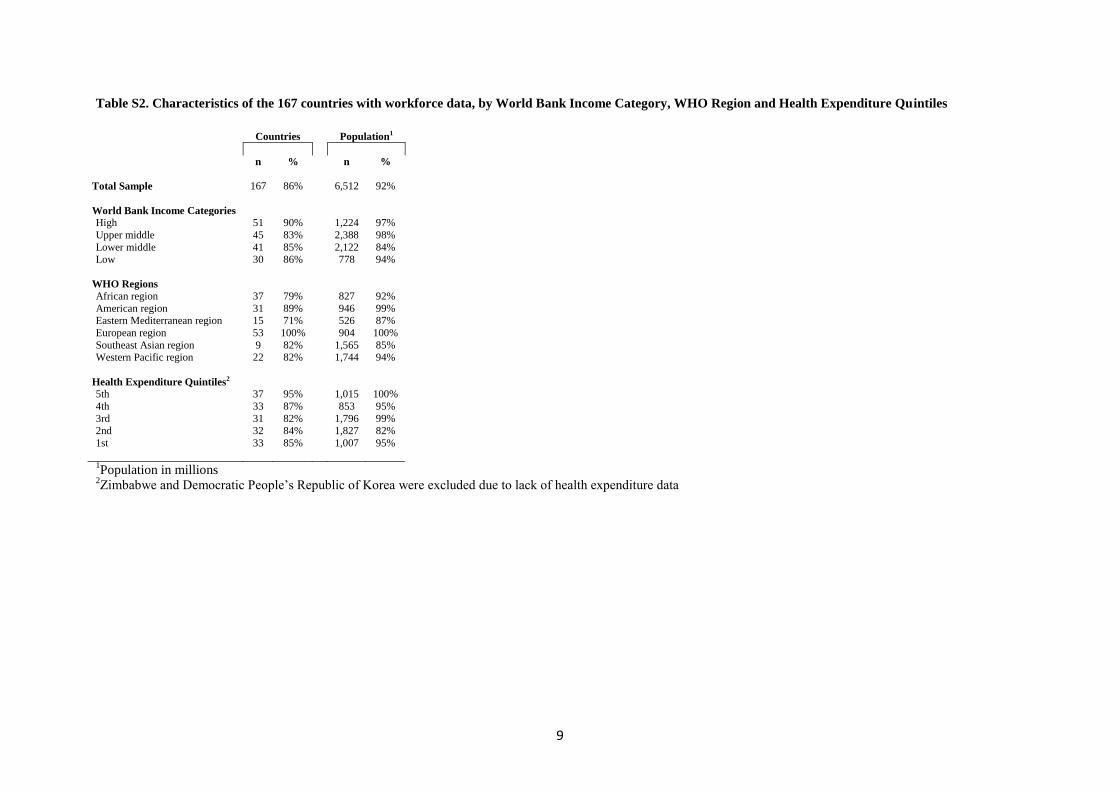
Table S2. Characteristics of the 167 countries with workforce data, by World Bank Income Category, WHO Region and Health Expenditure Quintiles
Countries Population1
n % n %
Total Sample 167 86% 6,512 92%
World Bank Income Categories
High 51 90% 1,224 97%
Upper middle 45 83% 2,388 98%
Lower middle 41 85% 2,122 84%
Low 30 86% 778 94%
WHO Regions
African region 37 79% 827 92%
American region 31 89% 946 99% Eastern Mediterranean region 15 71% 526 87%
European region 53 100% 904 100%
Southeast Asian region 9 82% 1,565 85% Western Pacific region 22 82% 1,744 94%
Health Expenditure Quintiles2
5th 37 95% 1,015 100%
4th 33 87% 853 95%
3rd 31 82% 1,796 99%
2nd 32 84% 1,827 82%
1st 33 85% 1,007 95%
1Population in millions
2Zimbabwe and Democratic People’s Republic of Korea were excluded due to lack of health expenditure data
10
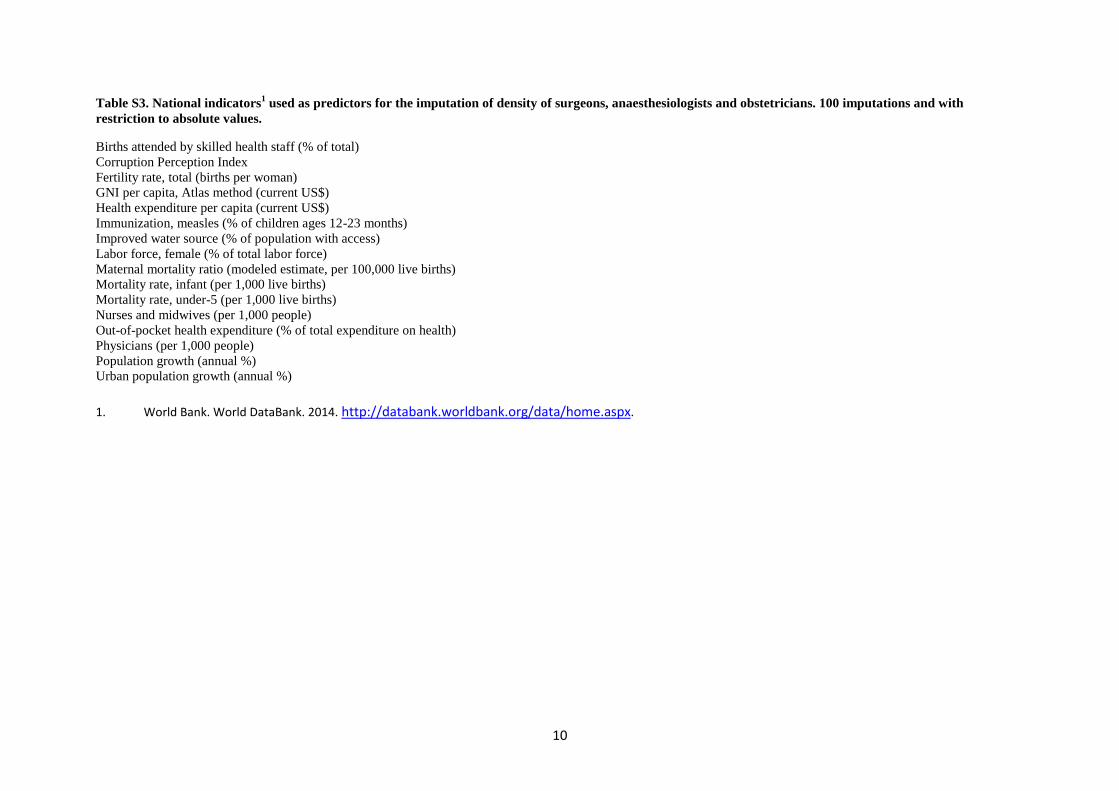
Table S3. National indicators1 used as predictors for the imputation of density of surgeons, anaesthesiologists and obstetricians. 100 imputations and with
restriction to absolute values.
Births attended by skilled health staff (% of total)
Corruption Perception Index
Fertility rate, total (births per woman)
GNI per capita, Atlas method (current US$)
Health expenditure per capita (current US$)
Immunization, measles (% of children ages 12-23 months)
Improved water source (% of population with access)
Labor force, female (% of total labor force)
Maternal mortality ratio (modeled estimate, per 100,000 live births)
Mortality rate, infant (per 1,000 live births)
Mortality rate, under-5 (per 1,000 live births)
Nurses and midwives (per 1,000 people)
Out-of-pocket health expenditure (% of total expenditure on health)
Physicians (per 1,000 people)
Population growth (annual %)
Urban population growth (annual %)
1. World Bank. World DataBank. 2014. http://databank.worldbank.org/data/home.aspx.
Albania, Azerbaijan, Belarus, Georgia, Kazakhstan, Montenegro, Serbia, Turkmenistan, Ukraine and Uzbekistan provided aggregated data on the number of surgeons and anaesthesiologists (“surgical group of specialists”)
For inquiries about the dataset and to contribute by validating or updating individual data points, please refer to www http://www.who.int/surgery/eesc_database/en/.
16
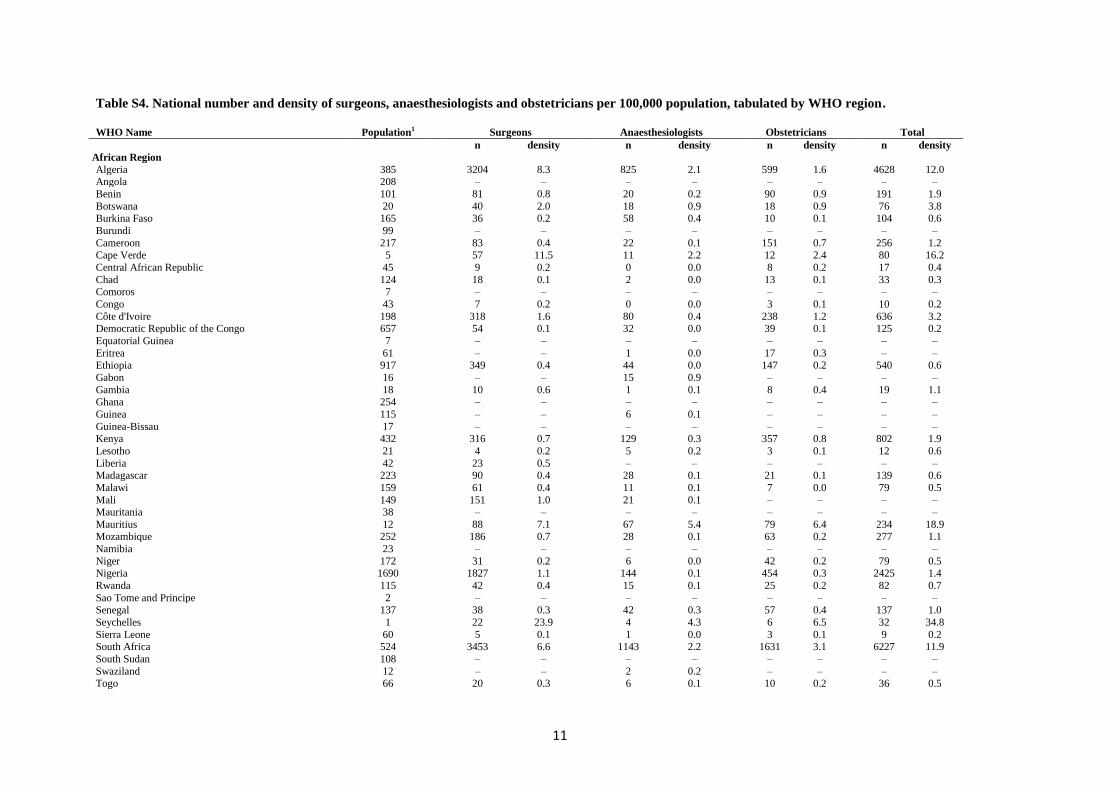
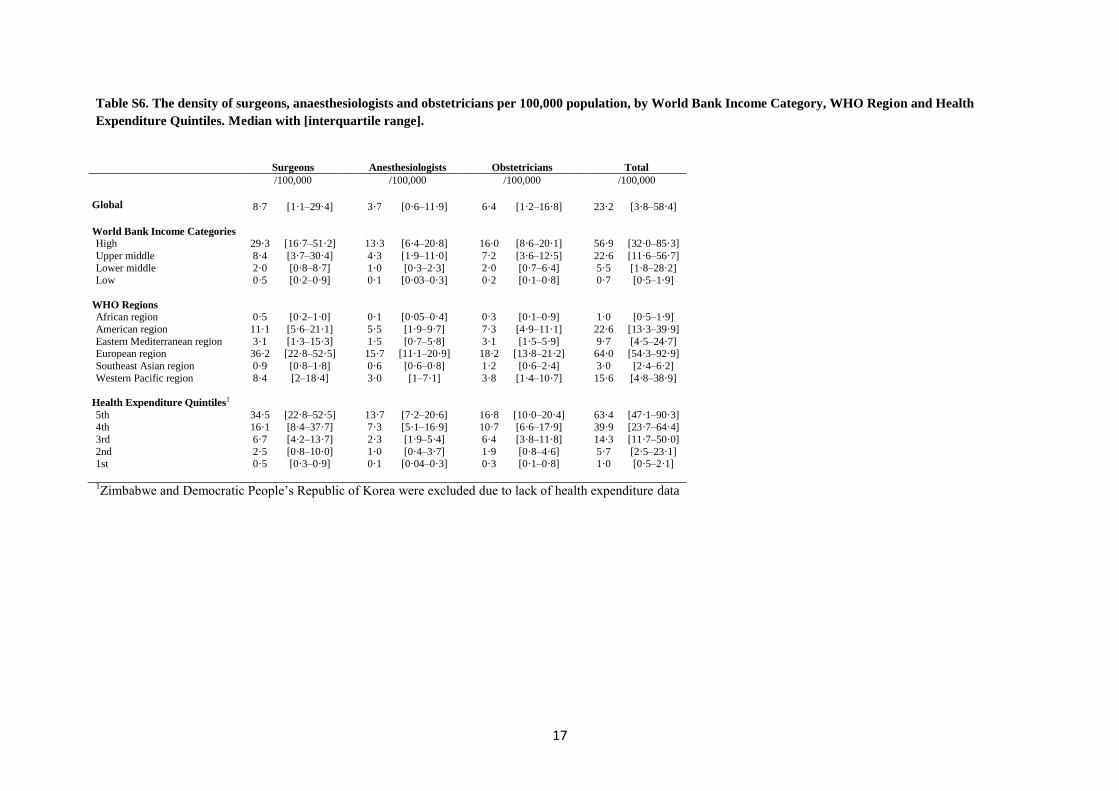
Table S5. The global distribution of surgeons, anaesthesiologists and obstetricians, by World Bank Income Category, WHO Region and Health Expenditure
Quintiles. Median with [interquartile range]. Based on collected and imputed values.