+ All Categories
Home > Documents > Supplementary Information An AAAA-DDDD Quadruple …...‘An AAAA-DDDD Quadruple Hydrogen Bond...

Supplementary Information An AAAA-DDDD Quadruple …...‘An AAAA-DDDD Quadruple Hydrogen Bond...

Date post: 11-Mar-2020
Category:
Upload: others
View: 8 times
Download: 0 times
Share this document with a friend
49
SUPPLEMENTARY INFORMATION DOI: 10.1038/NCHEM.987 NATURE CHEMISTRY | www.nature.com/naturechemistry 1 An AAAA-DDDD Quadruple Hydrogen Bond Array Barry A. Blight, 1 Christopher A. Hunter, 2 David A. Leigh* ,1 Hamish McNab 1 and Patrick I. T. Thomson 1 1 School of Chemistry, University of Edinburgh, The King’s Buildings, West Mains Road, Edinburgh EH9 JJ, United Kingdom. 2 Department of Chemistry, University of Sheffield, Sheffield S3 7HF, United Kingdom. Email: [email protected] © 2011 Macmillan Publishers Limited. All rights reserved.
Transcript

SUPPLEMENTARY INFORMATIONdoi: 10.1038/nchem.987

nature chemistry | www.nature.com/naturechemistry 1

SI ‘An AAAA-DDDD Quadruple Hydrogen Bond Array’ Blight et al… S1

Supplementary Information

An AAAA-DDDD Quadruple Hydrogen Bond Array

Barry A. Blight,1 Christopher A. Hunter,2 David A. Leigh*,1 Hamish McNab1 and

Patrick I. T. Thomson1

1 School of Chemistry, University of Edinburgh, The King’s Buildings, West Mains Road, Edinburgh

EH9 JJ, United Kingdom.

2 Department of Chemistry, University of Sheffield, Sheffield S3 7HF, United Kingdom.

Email: [email protected]

© 2011 Macmillan Publishers Limited. All rights reserved.

2 nature chemistry | www.nature.com/naturechemistry

SUPPLEMENTARY INFORMATION doi: 10.1038/nchem.987

SI ‘An AAAA-DDDD Quadruple Hydrogen Bond Array’ Blight et al… S2

1. Contents

1. Contents .........................................................................................................................................S2

2. Synthesis and characterisation of compounds ........................................................................S3

2.1 Synthetic procedures .............................................................................................................S3

2.2 1H and 13C NMR Spectra.......................................................................................................S7

3. Characterisation of complex 12·13 ..........................................................................................S18

3.1 1H NMR ..................................................................................................................................S18

3.2 Dimerization of 13.............................................................................................................S18

3.3 1H NMR of a 1:1 mixture of 12 and 13 ..........................................................................S19

3.4 Mass Spectrometry ..............................................................................................................S21

4. Electrostatic potential calculations ...........................................................................................S27

5. Evaluation of complex strength ................................................................................................S28

5.1 General Procedures .........................................................................................................S28

5.2 UV/Vis Experiments in CH2Cl2 .......................................................................................S28

5.2 UV/Vis Experiments in MeCN.........................................................................................S31

5.4 UV/Vis Experiments in 10% DMSO/CHCl3...................................................................S40

5.5 Repetitions of binding constant determinations...................................................................S43

5.6 Job Plots ............................................................................................................................S44

6. Other AADA-DDAD and AAAA-DDDD systems ....................................................................S46

8. References...................................................................................................................................S48

© 2011 Macmillan Publishers Limited. All rights reserved.

nature chemistry | www.nature.com/naturechemistry 3

SUPPLEMENTARY INFORMATIONdoi: 10.1038/nchem.987

SI ‘An AAAA-DDDD Quadruple Hydrogen Bond Array’ Blight et al… S3 2. Synthesis and characterisation of compounds

2.1 Synthetic procedures 1H and 13C NMR was carried out in CDCl3 at 500/125 or 400/100 MHz, and quaternary carbons have

been assigned by DEPT experiments. Dry flash chromatography was carried out on silica gel 60 (15-

40 µm, Merck) according to the procedure of Harwood.(S1) Low resolution mass spectra were

obtained with an Agilent Technologies 1200 LC system with 6130 single quadrupole MS detector.

APCI means that atmospheric pressure chemical ionisation was used. –ve and +ve refer to negative

ion detection and positive ion detection, respectively. High resolution mass spectra were obtained

with a Bruker 3.0 T Apex II Spectrometer. The following compounds were prepared according to

literature procedures: sodium tetrakis[(3,5-trifluoromethyl)phenyl]borate,(S2) 1,8-naphthyridine-2,7-

diamine.(S3,S4). All melting points were determined using a Sanyo Gallenkamp apparatus and are

uncorrected.

1,3-Bis-(1H-benzimidazol-2-yl)-thiourea (15)

2-Aminobenzimidazole 14 (50 mmol, 6.65 g) and CS2 (100 mmol, 6.11 mL) were dissolved in

pyridine (20 mL) and refluxed for 18 h. On cooling, a precipitate formed which was collected and

washed with CH2Cl2 to give the title compound as a colorless crystalline solid (6.28 g, 81%). mp:

272-274 °C. 1H NMR (500 MHz, DMSO-d6): δ 7.8-7.4 (br.s, 4H), 7.4-7.0 (br.s, 4H). MS: 308 (M+,

10%), 175 (100), 105 (18). M/z calcd for C15H12N6S 308.08387; found 308.08382.

N,N'-Bis-(1H-benzimidazol-2-yl)-guanidine (16)

The method of Ashworth et al. was used.(S5) Compound 15 (2.00 g, 6.5 mmol) was suspended in

CHCl3 (40 mL) and to this was added HgO (2.00 g, 9.2 mmol) and methanolic NH3 (2 M, 40 mL).

© 2011 Macmillan Publishers Limited. All rights reserved.

4 nature chemistry | www.nature.com/naturechemistry

SUPPLEMENTARY INFORMATION doi: 10.1038/nchem.987

SI ‘An AAAA-DDDD Quadruple Hydrogen Bond Array’ Blight et al… S4 The reaction mixture was stirred at r.t. for 3 h, filtered through celite and concentrated under reduced

pressure. The resulting solid was dissolved in acetic acid (2 M, 50 mL) and stirred for 1 h, then

filtered through celite and adjusted to pH 8.0 by addition of NaOH (10 M). The precipitate was

collected, washed with water and dried. The solid was suspended in Et2O:MeOH (7.5:1, 200 mL)

and then filtered and concentrated under reduced pressure to give the title compound as a pale tan

solid (944 mg, 50%). mp: 277 °C. 1H NMR (500 MHz, DMSO-d6): δ 12.5-12.0 (br.s, 2H), 9.5-9.0

(br.s, 2H), 7.34 (dd, J = 5.6 Hz, 3.1 Hz, 4H), 7.03 (dd, J = 5.6 Hz, 3.1 Hz, 4H). MS: 291 (M+, 95%),

133 (89), 78 (89), 63 (100). M/z calcd for C15H13N7 291.12269; found 291.12263.

N,N'-Bis-(1H-benzimidazol-2-yl)-guanidinium tetrakis[(3,5-trifluoro-

methyl)phenyl]borate (12)

NH

NH2+

NH

NH

NN

NH

CF3

CF3

-B

4

Compound 16 (300 mg, 1.03 mmol) was dissolved in aqueous acetic acid (8 M, 20 mL) and filtered.

To this was added a filtered solution of sodium tetrakis[(3,5-trifluoromethyl)phenyl]borate(S2) (1.00

g, 1.13 mmol) dissolved in the minimum amount of aqueous acetic acid (8 M) and the solution

stirred at room temperature until no further precipitate formed. The precipitate was collected on

celite and washed with copious water, then CH2Cl2. The organic washings were concentrated under

reduced pressure to give a foam which was dried in vacuo at 40 °C and 1 millibar for 18-72 h, until

no traces of acetic acid remained by 1H NMR spectroscopy to give the title compound as a colorless

solid (552 mg, 40%). mp: 87-91 °C. 1H NMR (500 MHz, CDCl3): δ 7.71 (s, 8H), 7.49 (s, 4H), 7.33

(m, 4H), 7.26 (m, 4H), 5.18 (br.s, 2H). 13C NMR (125 MHz, CDCl3): δ 161.0 (m, quat.), 150.64

(quat.), 134.74 (CH), 129.0 (m, quat.), 125.58 (quat.), 125.35 (CH), 123.41 (quat), 121.26 (quat.),

117.57 (CH), 111.56 (CH). MS (APCI –ve; atmospheric pressure chemical ionisation with negative

ion detection) 862 (M-, 23%), 863 ((M – Ar)- 100%), 864 (32). MS (APCI +ve; atmospheric pressure

chemical ionisation with positive ion detection): 292 (M+H, 100%), 149 (30). M/z calcd. For cation

C15H14N7+ 292.13052; found 292.13064. M/z calcd. for anion C32H12BF24

- 863.06543; found

863.06155.

3,6-Dibromo-1,8-naphthyridine-2,7-diamine (18)

© 2011 Macmillan Publishers Limited. All rights reserved.

nature chemistry | www.nature.com/naturechemistry 5

SUPPLEMENTARY INFORMATIONdoi: 10.1038/nchem.987

SI ‘An AAAA-DDDD Quadruple Hydrogen Bond Array’ Blight et al… S5

1,8-Naphthyridine-2,7-diamine(S3,S4) 17 (1.86 g, 11.6 mmol) was dissolved in dry DMF (25 mL). To

this was added dropwise over 1 h at -10 °C N-bromosuccinimide (4.23 g, 23.8 mmol) in DMF (25

mL). The mixture was then stirred at room temperature for 2 h, and the DMF removed under reduced

pressure. The resulting solid was stirred in CH2Cl2 (25 mL) for 16 h, and the title compound

collected by filtration as a dark brown solid (3.45 g, 94%). mp: >340 °C. 1H NMR (400 MHz,

DMSO-d6): δ 8.28 (s, 2H), 7.57 (br.s, 4H). 13C NMR (100 MHz, DMSO-d6): δ 179.88 (CH), 162.78

(quat.), 156.52 (quat.), 140.97 (quat.), 101.28 (quat.). MS: 316 (53), 318 (M+, 100), 320 (57), 158

(43), 99 (47). M/z calcd. for C8H679Br2N4: 315.89537; found 315.89526.

5-tert-butyl-2-formylboronic acid (19)(S6)

To a solution of N,N,N′-trimethylethylenediamine (17 mmol, 2.16 mL) in dry THF (40 mL) at -30 °C

was added n-BuLi (16 mmol, 1.6 M in hexanes, 10.0 mL) dropwise with stirring. After 30 min, 4-

tert-butylbenzaldehyde 20 (15 mmol, 2.50 mL) was added and the mixture stirred for a further 30

min. Further n-BuLi (45 mmol, 1.6 M in hexanes, 28 mL) was added and the reaction mixture

allowed to warm to room temperature overnight with stirring. The mixture was again cooled to -30

°C, anhydrous B(OMe)3 (90 mmol, 10 mL) was added and the mixture once more allowed to warm

to room temperature overnight with stirring. The reaction mixture was poured into cold stirred 2 M

HCl solution (100 mL) and stirred for 30 min, then extracted with diethyl ether (3 x 150 mL),

washed with brine, dried over MgSO4, filtered, and concentrated under reduced pressure to give the

crude product as a dark oil (2.91 g). This was purified by dry flash chromatography (15% acetone/i-

hexane v/v) to give the title compound as a dark solid (1.12 g, 36%). mp: 86-90 °C. 1H NMR (500

MHz, CDCl3): δ 9.87 (s, 1H), 8.35 (d, J = 1.9 Hz, 1H), 7.85 (d, J = 8.0 Hz, 1H), 7.71 (dd, J = 8.0 Hz,

J = 1.9 Hz, 1H), 7.31 (br.s, 2H), 1.39 (s, 9H). 13C NMR (125 MHz, CDCl3): δ 198.07 (quat.), 158.19

(quat.), 139.01 (CH), 137.49 (quat.), 136.14 (CH), 127.86 (CH), 35.84 (quat.), 30.96 (CH3) (C-

B(OH)2 not observed). MS: 206 (M+, 31%), 191 (100), 149 (66). M/z calcd. For C11H15BO3:

206.11088; found 206.11073.

© 2011 Macmillan Publishers Limited. All rights reserved.

6 nature chemistry | www.nature.com/naturechemistry

SUPPLEMENTARY INFORMATION doi: 10.1038/nchem.987

SI ‘An AAAA-DDDD Quadruple Hydrogen Bond Array’ Blight et al… S6

Hexacene (13)

A solution of 18 (185 mg, 0.58 mmol), 19 (240 mg, 1.16 mmol) in DME (5 mL) and an aqueous

solution of Na2CO3 (1.5 M, 5 mL) was degassed with nitrogen for 5 min. To this was added

Pd(PPh3)4 (0.06 mmol, 50 mg). The solution was refluxed for 90 min, and then diluted with Na2CO3

solution (1.5 M, 20 mL) and extracted with 3 x CH2Cl2 (20 mL). The combined extracts were dried

over MgSO4, filtered, concentrated under reduced pressure and purified by dry flash chromatography

(4% MeOH/CHCl3 v/v) to a yellow solid (70 mg, 27%). This was purified by trituration with CHCl3

followed by preparative TLC (84.5:15:0.5 EtOAc:MeOH:Et3N v/v, R.f. 0–0.2) to give the title

compound as a tan solid (25.4 mg, 10%). mp: >340 °C. 1H NMR (500 MHz, DMSO-d6): δ 10.33 (s,

2H), 9.68 (s, 2H), 8.97 (d, J = 1.0 Hz, 2H), 8.27 (d, J = 8.2 Hz, 2H), 8.04 (dd, J = 8.2 Hz, 1.0 Hz,

2H), 1.56 (s, 18H). 13C NMR (125 MHz, DMSO-d6): δ 161.73 (CH), 156.00 (quat), 155.90 (quat),

153.97 (quat), 135.02 (CH), 131.50 (quat), 129.61 (CH), 127.23 (CH), 123.39 (quat), 120.08 (quat),

119.02 (CH), 118.80 (quat), 35.38 (quat), 31.01 (CH3). MS (APCI): 445 (M+H, 100%). M/z calcd for

C30H28N4 444.23085; found 444.23021.

© 2011 Macmillan Publishers Limited. All rights reserved.

nature chemistry | www.nature.com/naturechemistry 7

SUPPLEMENTARY INFORMATIONdoi: 10.1038/nchem.987

SI ‘An AAAA-DDDD Quadruple Hydrogen Bond Array’ Blight et al… S7

2.2 1H and 13C NMR Spectra

© 2011 Macmillan Publishers Limited. All rights reserved.

8 nature chemistry | www.nature.com/naturechemistry

SUPPLEMENTARY INFORMATION doi: 10.1038/nchem.987

SI ‘An AAAA-DDDD Quadruple Hydrogen Bond Array’ Blight et al… S8

15

15, 1H N

MR

(500 MH

z, DM

SO-d

6 )

© 2011 Macmillan Publishers Limited. All rights reserved.

nature chemistry | www.nature.com/naturechemistry 9

SUPPLEMENTARY INFORMATIONdoi: 10.1038/nchem.987

SI ‘An AAAA-DDDD Quadruple Hydrogen Bond Array’ Blight et al… S9

16

16, 1H N

MR

(500 MH

z, DM

SO-d

6 )

© 2011 Macmillan Publishers Limited. All rights reserved.

10 nature chemistry | www.nature.com/naturechemistry

SUPPLEMENTARY INFORMATION doi: 10.1038/nchem.987

SI ‘An AAAA-DDDD Quadruple Hydrogen Bond Array’ Blight et al… S10

12

12, 1H N

MR

(500 MH

z, CD

Cl3 )

© 2011 Macmillan Publishers Limited. All rights reserved.

nature chemistry | www.nature.com/naturechemistry 11

SUPPLEMENTARY INFORMATIONdoi: 10.1038/nchem.987

SI ‘An AAAA-DDDD Quadruple Hydrogen Bond Array’ Blight et al… S11

12

12, 13C N

MR

(125 MH

z, CD

Cl3 )

© 2011 Macmillan Publishers Limited. All rights reserved.

12 nature chemistry | www.nature.com/naturechemistry

SUPPLEMENTARY INFORMATION doi: 10.1038/nchem.987

SI ‘An AAAA-DDDD Quadruple Hydrogen Bond Array’ Blight et al… S12

18

18, 1H N

MR

(500 MH

z, DM

SO-d

6 )

© 2011 Macmillan Publishers Limited. All rights reserved.

nature chemistry | www.nature.com/naturechemistry 13

SUPPLEMENTARY INFORMATIONdoi: 10.1038/nchem.987

SI ‘An AAAA-DDDD Quadruple Hydrogen Bond Array’ Blight et al… S13

18

18, 13C N

MR

(125 MH

z, DM

SO-d

6 )

© 2011 Macmillan Publishers Limited. All rights reserved.

14 nature chemistry | www.nature.com/naturechemistry

SUPPLEMENTARY INFORMATION doi: 10.1038/nchem.987

SI ‘An AAAA-DDDD Quadruple Hydrogen Bond Array’ Blight et al… S14

19

19, 1H N

MR

(500 MH

z, CD

Cl3 )

© 2011 Macmillan Publishers Limited. All rights reserved.

nature chemistry | www.nature.com/naturechemistry 15

SUPPLEMENTARY INFORMATIONdoi: 10.1038/nchem.987

SI ‘An AAAA-DDDD Quadruple Hydrogen Bond Array’ Blight et al… S15

19

19, 13C N

MR

(125 MH

z, CD

Cl3 )

© 2011 Macmillan Publishers Limited. All rights reserved.

16 nature chemistry | www.nature.com/naturechemistry

SUPPLEMENTARY INFORMATION doi: 10.1038/nchem.987

SI ‘An AAAA-DDDD Quadruple Hydrogen Bond Array’ Blight et al… S16

13

13, 1H N

MR

(500 MH

z, DM

SO-d

6 )

© 2011 Macmillan Publishers Limited. All rights reserved.

nature chemistry | www.nature.com/naturechemistry 17

SUPPLEMENTARY INFORMATIONdoi: 10.1038/nchem.987

SI ‘An AAAA-DDDD Quadruple Hydrogen Bond Array’ Blight et al… S17

13

13, 13C N

MR

(125 MH

z, DM

SO-d

6 )

© 2011 Macmillan Publishers Limited. All rights reserved.

18 nature chemistry | www.nature.com/naturechemistry

SUPPLEMENTARY INFORMATION doi: 10.1038/nchem.987SI ‘An AAAA-DDDD Quadruple Hydrogen Bond Array’ Blight et al… S18

3. Characterisation of complex 12·13

3.1 1H NMR

3.2 Dimerization of 13 In order to ensure that experiments evaluating the binding strength of 13 were not complicated by

additional equilibrium processes, we also evaluated the strength of 13·13 dimerization. An initial

solution of a known quantity of 13 in CDCl3 was successively diluted, and the chemical shift of the

peak at 9.78 ppm monitored*. The results are shown in Figure S1. The linear shape of the graph

indicates that the dimerization constant Kdim < 100 M-1. To confirm this, the general equation for 1H

NMR dimerization(S7) was modelled with parameters from our experiment at a variety of binding

constants with the results are shown in Figure S2 Significant deviation from linearity is evident for

Kdim > 100 M-1. In order to accurately quantify Kdim higher concentrations would need to be utilized,

however the limited solubility of 13 in CDCl3 prevented this.

9.76

9.78

9.8

9.82

9.84

9.86

9.88

0.00E+00 4.00E-04 8.00E-04 1.20E-03 1.60E-03 2.00E-03

Concentration (M)

Che

mic

al s

hift

(ppm

)

Figure S1: 1H NMR dilution of 13

The upfield shift of the signal at higher concentrations suggests that π-π-stacking may be occurring,

however, at the concentrations used in the heterocomplexation experiments the presence of 13·13 is

negligible.

* This peak displayed the largest change in chemical shift, but other protons showed similar effects.

© 2011 Macmillan Publishers Limited. All rights reserved.

nature chemistry | www.nature.com/naturechemistry 19

SUPPLEMENTARY INFORMATIONdoi: 10.1038/nchem.987 SI ‘An AAAA-DDDD Quadruple Hydrogen Bond Array’ Blight et al… S19

Figure S2: Observed (for 13·13;blue) and theoretical (turquoise, pink, green) chemical shifts for various dimerization constants.

3.3 1H NMR of a 1:1 mixture of 12 and 13 The 1H NMR spectrum of a 1:1 mixture of 12 and 13 in CD2Cl2 is shown in Figure S3. A through-

space correlation between 12 (proton d) and 13 (proton C) was observed in the ROESY spectrum

(Figure S4). Protons abc were in chemical exchange and could not be distinguished. Protons d/g and

e/f are equivalent in the spectrum of free 12, probably due to fast conversion between two rotamers

(Figure 3 and S4).

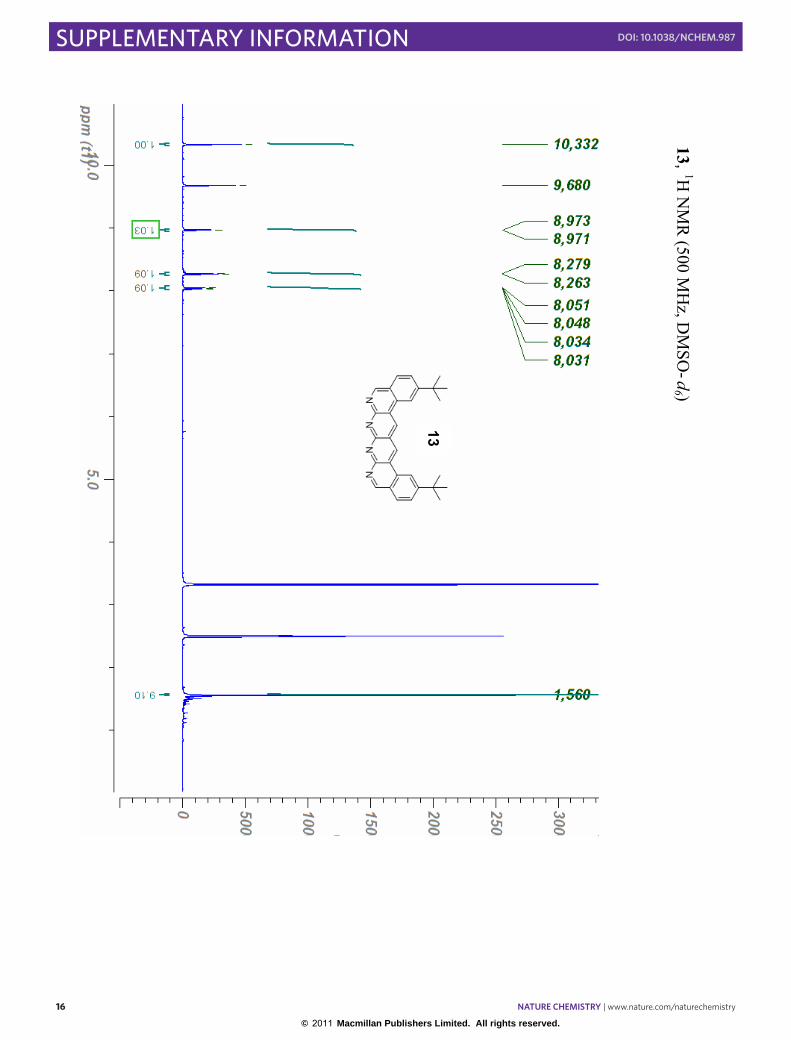
Figure S3: 1H NMR spectra (500 MHz, CD2Cl2, 298K) of 12 (top), 12·13 (middle), and 13 (bottom) showing the changes to 12 and 13 upon association to form 12·13.

© 2011 Macmillan Publishers Limited. All rights reserved.

20 nature chemistry | www.nature.com/naturechemistry

SUPPLEMENTARY INFORMATION doi: 10.1038/nchem.987

SI ‘An AAAA-DDDD Quadruple Hydrogen Bond Array’ Blight et al… S20

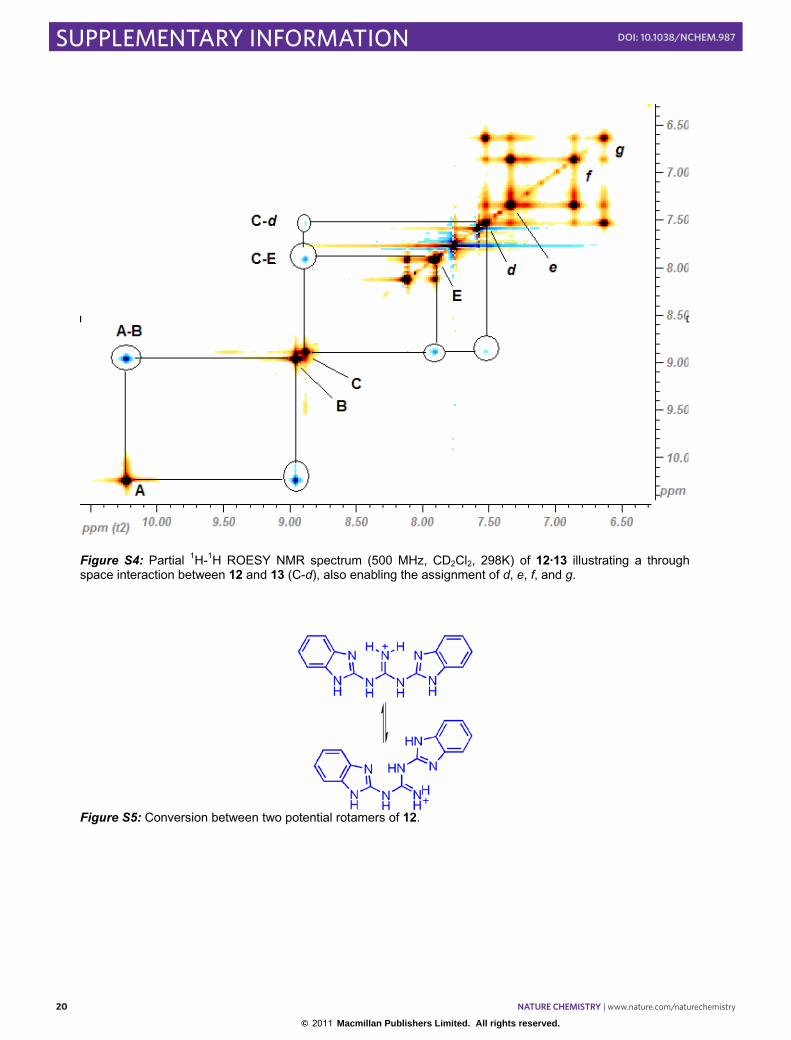
Figure S4: Partial 1H-1H ROESY NMR spectrum (500 MHz, CD2Cl2, 298K) of 12·13 illustrating a through space interaction between 12 and 13 (C-d), also enabling the assignment of d, e, f, and g.

Figure S5: Conversion between two potential rotamers of 12.

© 2011 Macmillan Publishers Limited. All rights reserved.

nature chemistry | www.nature.com/naturechemistry 21

SUPPLEMENTARY INFORMATIONdoi: 10.1038/nchem.987

SI ‘An AAAA-DDDD Quadruple Hydrogen Bond Array’ Blight et al… S21

3.4 Mass Spectrometry An ESI-MS experiment performed on a 1:1 mixture of 12·13 gave a peak corresponding to the 1:1

complex, which is positively charged and has a mass of 736.4 (Figure S6). Also present are signals

for 12+ (292), 12·5MeCN·Na+ (519), and 13·H+ (445). The isotopic pattern (Figure S7) is consistent

with theory (Figure S5), having an M+1 of ca. 50% intensity. Only the counter-ion is observed in

negative ion detection mode (Figure S8) and again, the isotopic distribution (Figure S9) is consistent

with theory (Figure S5).

Figure S6: Predicted isotopic distribution patterns for 12·13 and the BArF- counterion.

© 2011 Macmillan Publishers Limited. All rights reserved.

22 nature chemistry | www.nature.com/naturechemistry

SUPPLEMENTARY INFORMATION doi: 10.1038/nchem.987

SI ‘An AAAA-DDDD Quadruple Hydrogen Bond Array’ Blight et al… S22

Figure S7: ESI+ mass spectrum of 12·13 in an acetonitrile/dichloromethane matrix, M/z of 100-900.

12·5MeC

N·N

a+

12+·13

13•H+

12•H+

© 2011 Macmillan Publishers Limited. All rights reserved.

nature chemistry | www.nature.com/naturechemistry 23

SUPPLEMENTARY INFORMATIONdoi: 10.1038/nchem.987

SI ‘An AAAA-DDDD Quadruple Hydrogen Bond Array’ Blight et al… S23

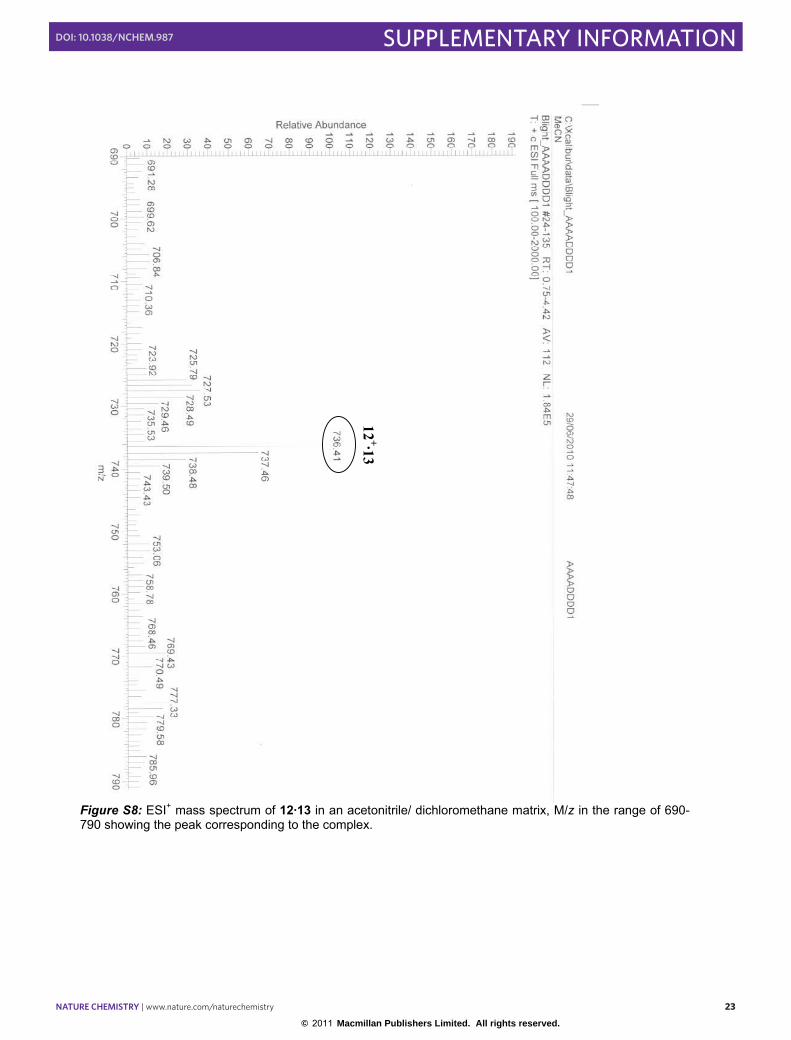
Figure S8: ESI+ mass spectrum of 12·13 in an acetonitrile/ dichloromethane matrix, M/z in the range of 690-790 showing the peak corresponding to the complex.

12+·13

© 2011 Macmillan Publishers Limited. All rights reserved.

24 nature chemistry | www.nature.com/naturechemistry

SUPPLEMENTARY INFORMATION doi: 10.1038/nchem.987

SI ‘An AAAA-DDDD Quadruple Hydrogen Bond Array’ Blight et al… S24

Figure S9: ESI- mass spectrum of 12·13 in an acetonitrile.dichloromethane matrix, M/z in the range of 100-2000 showing the peak corresponding to the BArF- counter ion. .

BA

rF-

© 2011 Macmillan Publishers Limited. All rights reserved.

nature chemistry | www.nature.com/naturechemistry 25

SUPPLEMENTARY INFORMATIONdoi: 10.1038/nchem.987

SI ‘An AAAA-DDDD Quadruple Hydrogen Bond Array’ Blight et al… S25

Figure S10: ESI- mass spectrum of 12·13 in an acetonitrile/dichloromethane matrix, M/z in the range of 820-920 showing the peak corresponding to the BArF- counter ion.

BA

rF-

© 2011 Macmillan Publishers Limited. All rights reserved.

26 nature chemistry | www.nature.com/naturechemistry

SUPPLEMENTARY INFORMATION doi: 10.1038/nchem.987

SI ‘An AAAA-DDDD Quadruple Hydrogen Bond Array’ Blight et al… S26 3.5 1H NMR Analysis of 2:1Complex 13·(12·13) in CD2Cl2.

Figure S11: Possible structure of 13·(12·13) in equilibrium with 12·13 in the presence of excess 13.

Figure S12: 1H NMR spectra (500 MHz, CD2Cl2, 298K) of 12 (top), 13·(12·13) (middle), and 13 (bottom) showing the changes to 12 and 13 upon complexation to form 13·(12·13). This experiment simulates an NMR titration at the point of adding 0.5 equivalents of 12 to 13 before reaching a 1:1 stoicheometry. Comparing to Fig. S3, Protons B and D of 13 shift upfield as the above 13·(12·13) complexed is reached before shifting back downfield to as the stoichiometry of the components becomes 1:1 (e.g. 12·13 in Fig. S3).

© 2011 Macmillan Publishers Limited. All rights reserved.

nature chemistry | www.nature.com/naturechemistry 27

SUPPLEMENTARY INFORMATIONdoi: 10.1038/nchem.987

SI ‘An AAAA-DDDD Quadruple Hydrogen Bond Array’ Blight et al… S27

4. Electrostatic potential calculations Density functional calculations (B3LYP, 6-31G*) were carried out on pyridinium 7 and guanidinium

12 in order to determine electrostatic potentials (ESP) of each participating hydrogen bond donor

site. As expected, the pyridinium NH proton of 7 (Figure S10a) carries the least electron density

(+667 kJ mol-1), while its amino-protons carry an ESP value of +605 kJ mol-1. The non-

intramolecularly H-bonded guanidinium protons of 12 (Figure S10b) have an ESP of +660 kJ mol-1,

similar to the pyridinium group, with the benzimidazole NH protons exhibiting the weakest hydrogen

bond donating character (+565 kJ mol-1). The differences in the ESPs may contribute to the

difference in binding between 7•6 and 12•6, as discussed in the manuscript.

Figure S5: Calculated (B3LYP, 6-31G*) electrostatic potential (ESP) surfaces for a, DDD+ 7, and b, DDDD+ 12. Comparisons of the ESP values between NH protons of pyridinium 7 and guanidinium 12 demonstrate that the hydrogen bond donating face of 7 exhibits less electron density (more hydrogen bond donating character) than that of 12.

© 2011 Macmillan Publishers Limited. All rights reserved.

28 nature chemistry | www.nature.com/naturechemistry

SUPPLEMENTARY INFORMATION doi: 10.1038/nchem.987

SI ‘An AAAA-DDDD Quadruple Hydrogen Bond Array’ Blight et al… S28

5. Evaluation of complex strength

UV/Vis Experiments

5.1 General Procedures All UV/Vis spectra were collected on a Varian Bio 50 at 298 K. All spectra were collected using a

quartz cell fitted with a Teflon stopper, with a path length of either 2.0 mm, 10.0 mm or 50 mm (as

specified). For each spectrum acquired, the range of 250-550 nm was surveyed at a resolution of 1.0

nm and an integration time of 0.1 s. In all cases, a working concentration range was chosen such that

the peak absorbance value was approximately 0.1-0.5. In every case, the H-bond donor molecules

used did not absorb in the region ≥ 380 nm, so all curve-fitting algorithms used data from this region.

Measurements of volumes > 250 µL were carried out using Hamilton gastight syringes and titrations

were carried out using Hamilton microliter syringes. After each addition, the cell was stoppered and

inverted to ensure complete mixing*.

5.2 UV/Vis Experiments in CH2Cl2 Evaluation of the complex strength of 12·13 was not possible by direct titration measurements

(Figure 4, main paper) but a lower limit for the binding constant was established through a series of

competition experiments. The strength of 7·6 was known from previously fluorescence titration

measurements,(S8) and competition between 7 and 12 should therefore allow the determination of

K12·6. K12·6 was found to be smaller than K7·6, and so to confirm this result, the reverse experiment

was performed, titrating 7 into a solution of 12·6. The data was acquired as follows:

2.00 mL of a solution of 6 containing an accurately known amount of 12 in greater than molar excess

was placed into a 10.0 mm quartz cell with a Teflon stopper, and aliquots of a solution of 7 were

added. The resulting spectrum showed a hypsochromic shift of approximately 2 nm, corresponding

to the difference between 12·6 and 7·6.

* In several cases, individual scans in the middle of a titration were re-run after a wait of several minutes to yield identical spectra, showing that equilibration is fast and that no other decay processes take place on the same timescale as the titrations.

© 2011 Macmillan Publishers Limited. All rights reserved.

nature chemistry | www.nature.com/naturechemistry 29

SUPPLEMENTARY INFORMATIONdoi: 10.1038/nchem.987

SI ‘An AAAA-DDDD Quadruple Hydrogen Bond Array’ Blight et al… S29

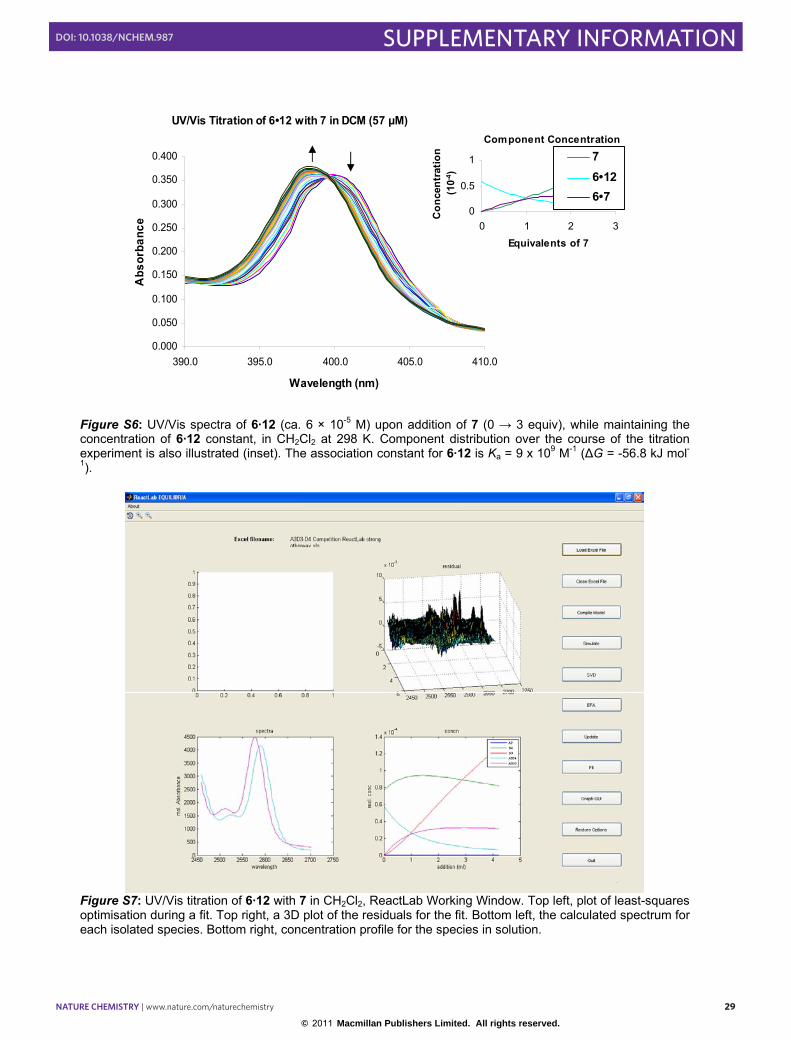
Figure S6: UV/Vis spectra of 6·12 (ca. 6 × 10⁻⁵ M) upon addition of 7 (0 → 3 equiv), while maintaining the concentration of 6·12 constant, in CH2Cl2 at 298 K. Component distribution over the course of the titration experiment is also illustrated (inset). The association constant for 6·12 is Ka = 9 x 10⁹ M-1 (∆G = -56.8 kJ mol-1).

Figure S7: UV/Vis titration of 6·12 with 7 in CH2Cl2, ReactLab Working Window. Top left, plot of least-squares optimisation during a fit. Top right, a 3D plot of the residuals for the fit. Bottom left, the calculated spectrum for each isolated species. Bottom right, concentration profile for the species in solution.

UV/Vis Titration of 6•12 with 7 in DCM (57 µM)

0.000

0.050

0.100

0.150

0.200

0.250

0.300

0.350

0.400

390.0 395.0 400.0 405.0 410.0

Wavelength (nm)

Abs

orba

nce

Component Concentration

0

0.5

1

0 1 2 3Equivalents of 7

Con

cent

ratio

n (1

0-4)

76•126•7

© 2011 Macmillan Publishers Limited. All rights reserved.

30 nature chemistry | www.nature.com/naturechemistry

SUPPLEMENTARY INFORMATION doi: 10.1038/nchem.987

SI ‘An AAAA-DDDD Quadruple Hydrogen Bond Array’ Blight et al… S30

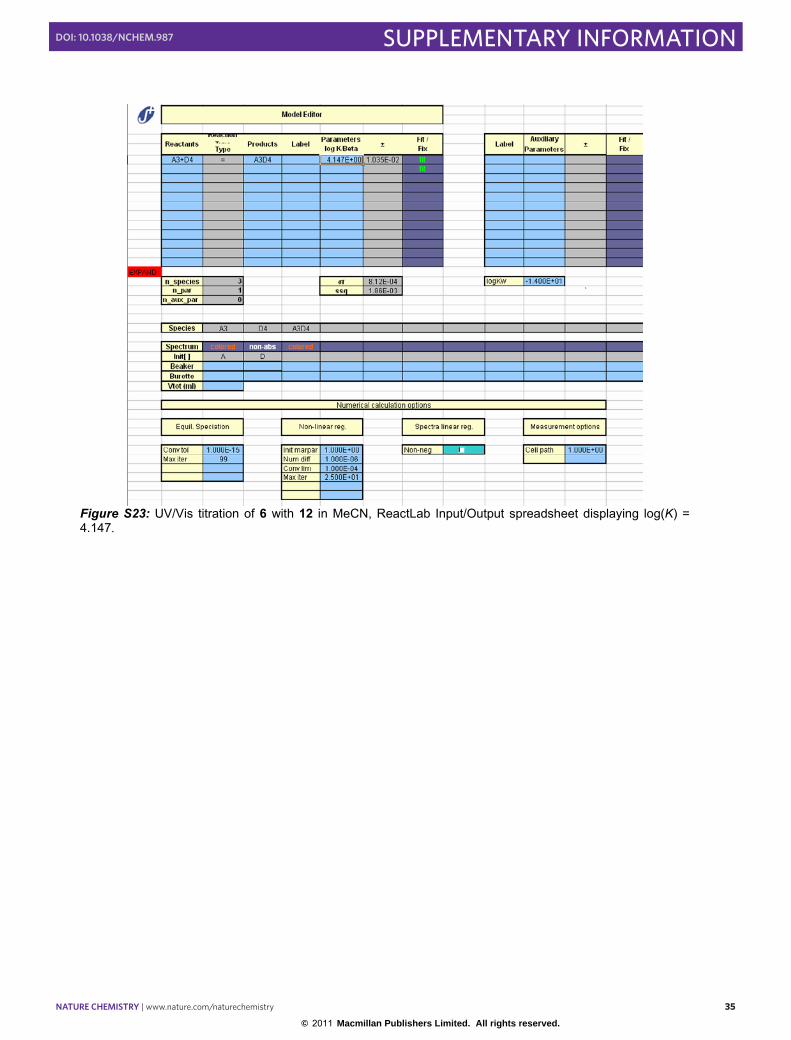
Figure S8: UV/Vis titration of 6·12 with 7 in CH2Cl2, ReactLab Input/Output spreadsheet displaying log(K) = 9.964. The fixed value of log(K) = 10.48 corresponds to the previously known value of K = 3 X 10¹⁰ M-1 for 6·7.

Figure S17: UV/Vis spectra of 6·12 (ca. 6 × 10⁻⁵ M) upon addition of 13 (0 → 4.5 equiv), while maintaining the concentration of 6·12 constant, in CH2Cl2 at 298 K. The determination of complex stability via competition experiments was inconclusive for 12·13 likely caused by multiple equilibrium processes between 6·12, 12·13, and 13·(12·13).

© 2011 Macmillan Publishers Limited. All rights reserved.

nature chemistry | www.nature.com/naturechemistry 31

SUPPLEMENTARY INFORMATIONdoi: 10.1038/nchem.987

SI ‘An AAAA-DDDD Quadruple Hydrogen Bond Array’ Blight et al… S31

5.2 UV/Vis Experiments in MeCN For titrations of 6, an accurately determined mass of the order of 1 mg of 6 was dissolved in 25.00

mL of MeCN to give a stock solution. For titrations of 13, the stock solution was diluted by a factor

of 10, due to a higher molar absorbance. 5.00 mL of the stock was used to dissolve an accurately

known mass of H-bond donor (12 or 7), chosen to yield a solution containing a concentration of

between 10 and 50 times greater than that of the H-bond acceptor. 2.00 mL of H-bond acceptor

solution was placed in a 10.0 mm quartz cell, and 0.1 → 1 molar equivalents of donor were added.

The MeCN used was of Baker-dry grade, containing <10 ppm H2O.

The H-bond donors 12 and 7 do not absorb in the region of the spectrum > 380 nm, and this range

was used to perform curve fitting. The curve fitting was carried out using the ReactLab Equilibria

fitting software, and in each case only the stoichiometries reported were observed. Four different

complexes were investigated: 7·6, 12·6, 7·13 and 12·13. For each complex, experiments were

performed in triplicate. Below, one representative example from each set of data is displayed as a

UV/Vis overlay with an inset showing the output of the modelled component distribution, a picture

of the Reactlab Equilibria working window, and a picture of the Reactlab Equilibria input file.

The stoichiometries were confirmed as follows. For each experiment, identical fitting procedures

were carried out with and without a programmed model of a 2:1 equilibrium. For 7·6, 12·6, and 7·13,

the fits either did not converge or converged to give K21 = 0. For 12·13, the fit for K21 = 0 had a

goodness-of-fit parameter almost 10 times higher (worse) than when it was modelled. Additionally,

the peak residuals were typically 3-5 times larger for any given wavelength, with some over- or

underestimating the absorbance by >5%. Details of the failed 1:1 fit for the formation of only 12·13

are given in Figure S30.

© 2011 Macmillan Publishers Limited. All rights reserved.

32 nature chemistry | www.nature.com/naturechemistry

SUPPLEMENTARY INFORMATION doi: 10.1038/nchem.987

SI ‘An AAAA-DDDD Quadruple Hydrogen Bond Array’ Blight et al… S32

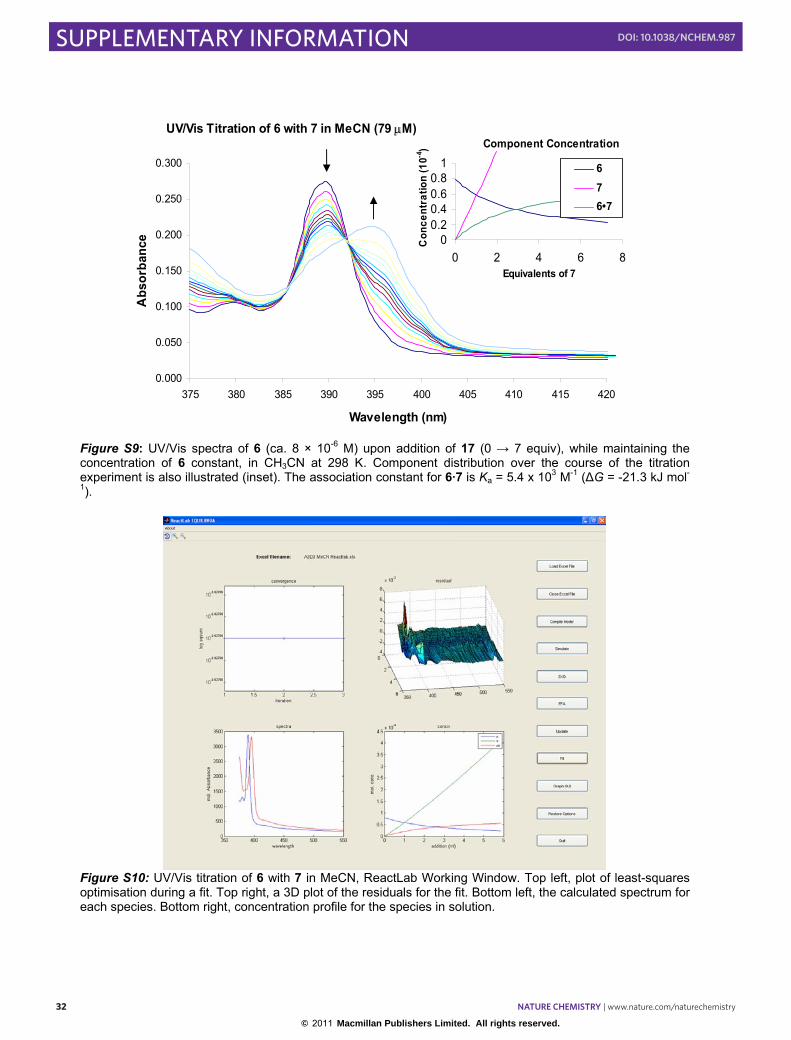
Figure S9: UV/Vis spectra of 6 (ca. 8 × 10⁻⁶ M) upon addition of 17 (0 → 7 equiv), while maintaining the concentration of 6 constant, in CH3CN at 298 K. Component distribution over the course of the titration experiment is also illustrated (inset). The association constant for 6·7 is Ka = 5.4 x 10³ M-1 (∆G = -21.3 kJ mol-1).

Figure S10: UV/Vis titration of 6 with 7 in MeCN, ReactLab Working Window. Top left, plot of least-squares optimisation during a fit. Top right, a 3D plot of the residuals for the fit. Bottom left, the calculated spectrum for each species. Bottom right, concentration profile for the species in solution.

UV/Vis Titration of 6 with 7 in MeCN (79 µM)

0.000

0.050

0.100

0.150

0.200

0.250

0.300

375 380 385 390 395 400 405 410 415 420

Wavelength (nm)

Abs

orba

nce

Component Concentration

00.20.40.60.8

1

0 2 4 6 8Equivalents of 7

Con

cent

ratio

n (1

0-4)

676•7

© 2011 Macmillan Publishers Limited. All rights reserved.

nature chemistry | www.nature.com/naturechemistry 33

SUPPLEMENTARY INFORMATIONdoi: 10.1038/nchem.987

SI ‘An AAAA-DDDD Quadruple Hydrogen Bond Array’ Blight et al… S33

Figure S20: UV/Vis titration of 6 with 7 in MeCN, ReactLab Input/Output spreadsheet displaying log(K) = 3.781.

© 2011 Macmillan Publishers Limited. All rights reserved.

34 nature chemistry | www.nature.com/naturechemistry

SUPPLEMENTARY INFORMATION doi: 10.1038/nchem.987

SI ‘An AAAA-DDDD Quadruple Hydrogen Bond Array’ Blight et al… S34

Figure S21: UV/Vis spectra of 6 (ca. 1 × 10⁻⁴ M) upon addition of 12 (0 → 4 equiv), while maintaining the concentration of 6 constant, in CH3CN at 298 K. Component distribution over the course of the titration experiment is also illustrated (inset). The association constant for 6·12 is Ka = 1.4 x 10⁴ M-1 (∆G = -23.7 kJ mol-1).

Figure S22: UV/Vis titration of 6 with 12 in MeCN, ReactLab Working Window. Top left, plot of least-squares optimisation during a fit. Top right, a 3D plot of the residuals for the fit. Bottom left, the calculated spectrum for each species. Bottom right, concentration profile for the species in solution.

UV/Vis Titration of 6 with 12 in MeCN (104 µM)

0.000

0.050

0.100

0.150

0.200

0.250

0.300

375 380 385 390 395 400 405 410 415 420

Wavelength (nm)

Abs

orba

nce

Component Concentration

00.20.40.60.8

1

0 1 2 3 4Equivalents of 12

Con

cent

ratio

n (1

0-4)

6126•12

© 2011 Macmillan Publishers Limited. All rights reserved.

nature chemistry | www.nature.com/naturechemistry 35

SUPPLEMENTARY INFORMATIONdoi: 10.1038/nchem.987

SI ‘An AAAA-DDDD Quadruple Hydrogen Bond Array’ Blight et al… S35

Figure S23: UV/Vis titration of 6 with 12 in MeCN, ReactLab Input/Output spreadsheet displaying log(K) = 4.147.

© 2011 Macmillan Publishers Limited. All rights reserved.

36 nature chemistry | www.nature.com/naturechemistry

SUPPLEMENTARY INFORMATION doi: 10.1038/nchem.987

SI ‘An AAAA-DDDD Quadruple Hydrogen Bond Array’ Blight et al… S36

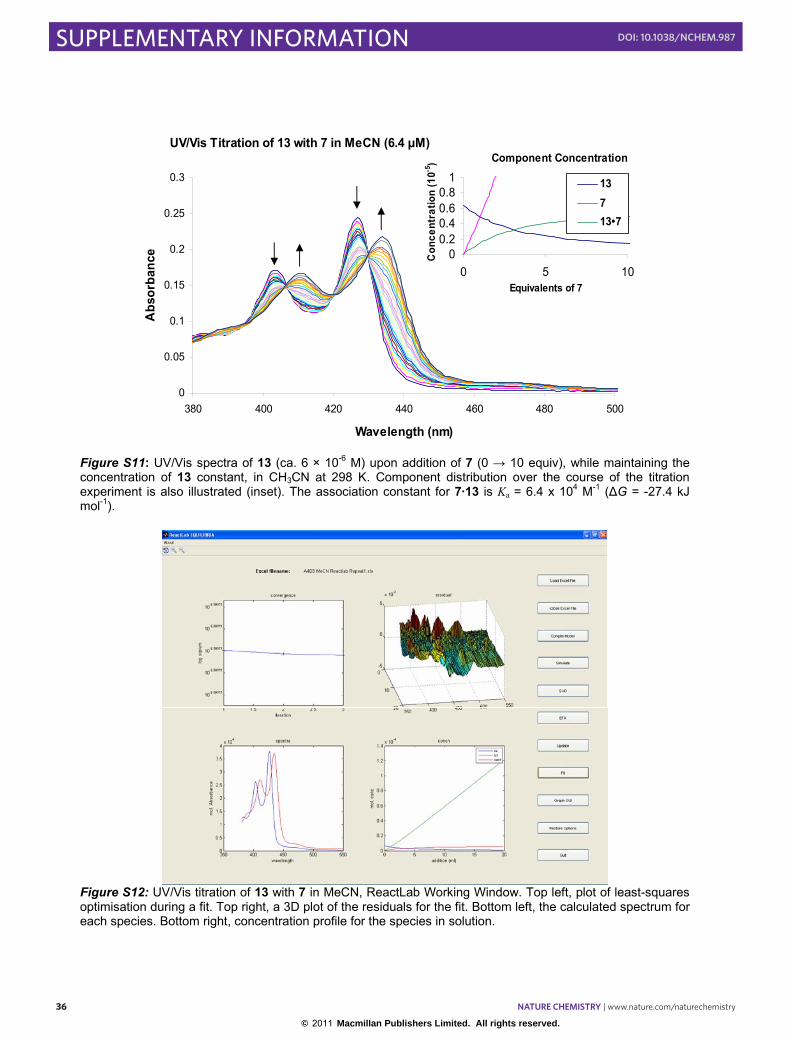
Figure S11: UV/Vis spectra of 13 (ca. 6 × 10⁻⁶ M) upon addition of 7 (0 → 10 equiv), while maintaining the concentration of 13 constant, in CH3CN at 298 K. Component distribution over the course of the titration experiment is also illustrated (inset). The association constant for 7·13 is Ka = 6.4 x 10⁴ M-1 (∆G = -27.4 kJ mol-1).

Figure S12: UV/Vis titration of 13 with 7 in MeCN, ReactLab Working Window. Top left, plot of least-squares optimisation during a fit. Top right, a 3D plot of the residuals for the fit. Bottom left, the calculated spectrum for each species. Bottom right, concentration profile for the species in solution.

UV/Vis Titration of 13 with 7 in MeCN (6.4 µM)

0

0.05

0.1

0.15

0.2

0.25

0.3

380 400 420 440 460 480 500

Wavelength (nm)

Abs

orba

nce

Component Concentration

00.20.40.60.8

1

0 5 10Equivalents of 7

Con

cent

ratio

n (1

0-5)

13713•7

© 2011 Macmillan Publishers Limited. All rights reserved.

nature chemistry | www.nature.com/naturechemistry 37

SUPPLEMENTARY INFORMATIONdoi: 10.1038/nchem.987

SI ‘An AAAA-DDDD Quadruple Hydrogen Bond Array’ Blight et al… S37

Figure S13: Representative example of one UV/Vis titration of 13 with 7 in MeCN, ReactLab Input/Output displaying log(K) = 4.739.

© 2011 Macmillan Publishers Limited. All rights reserved.

38 nature chemistry | www.nature.com/naturechemistry

SUPPLEMENTARY INFORMATION doi: 10.1038/nchem.987

SI ‘An AAAA-DDDD Quadruple Hydrogen Bond Array’ Blight et al… S38

Figure S14: UV/Vis spectra of 13 (ca. 4 × 10⁻⁶ M) upon addition of 12 (0 → 5 equiv), while maintaining the concentration of 13 constant, in CH3CN at 298 K. Component distribution over the course of the titration experiment is also illustrated (inset). Association constants for 12·13, which were modelled with a 2:1 equilibrium, are K12•13 = 1.5 x 10⁶ M-1 (∆G = -35.2 kJ mol-1) for 12·13 and K13(12·13) = 3.4 x 10⁵ M-1 (∆G = -31.6 kJ mol-1) for the binding of a second AAAA unit to this complex to form 13·(12·13).

Figure S15: UV/Vis titration of 13 with 12 in MeCN, ReactLab Working Window. Top left, plot of least-squares optimisation during a fit. Top right, a 3D plot of the residuals for the fit. Bottom left, the calculated spectrum for each species. Bottom right, concentration profile for the species in solution.

UV/Vis Titration of 13 with 12 in MeCN (3.6 µM)

0

0.02

0.04

0.06

0.08

0.1

0.12

0.14

380 400 420 440 460 480 500

Wavelength (nm)

Abs

orba

nce

Component Concentration

00.10.20.30.40.5

0 2 4Equivalents of 12

Con

cent

ratio

n (1

0-5)

131212•1313•(12•13)

© 2011 Macmillan Publishers Limited. All rights reserved.

nature chemistry | www.nature.com/naturechemistry 39

SUPPLEMENTARY INFORMATIONdoi: 10.1038/nchem.987

SI ‘An AAAA-DDDD Quadruple Hydrogen Bond Array’ Blight et al… S39

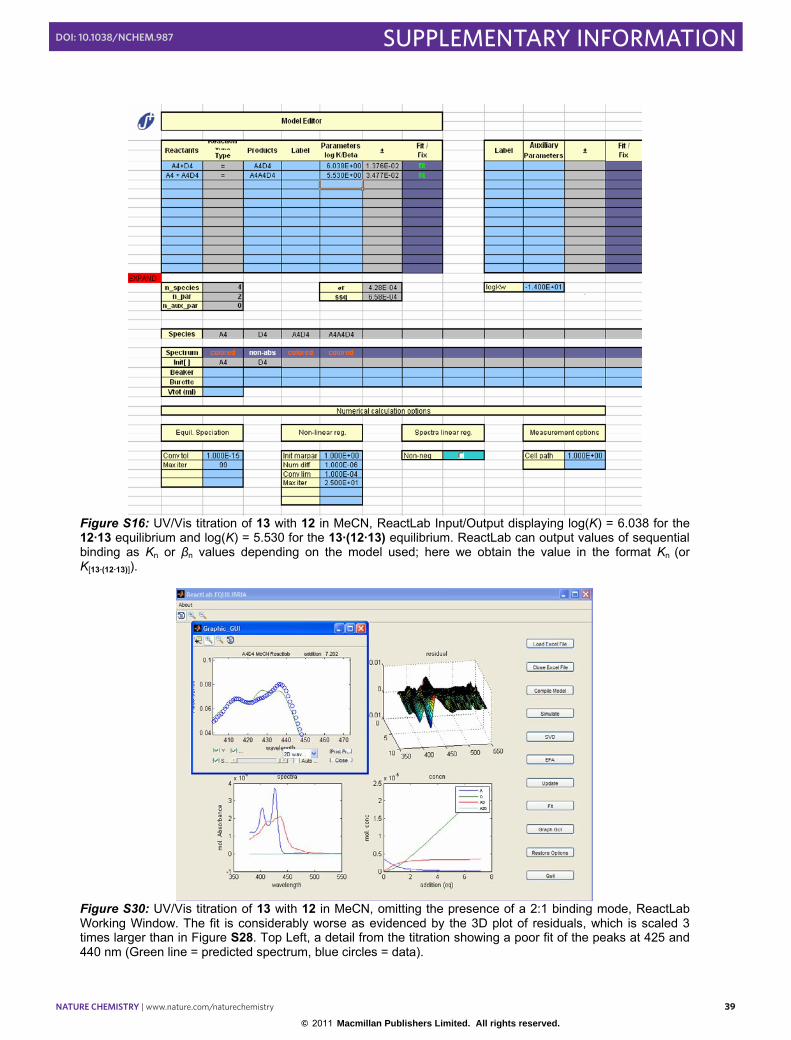
Figure S16: UV/Vis titration of 13 with 12 in MeCN, ReactLab Input/Output displaying log(K) = 6.038 for the 12·13 equilibrium and log(K) = 5.530 for the 13·(12·13) equilibrium. ReactLab can output values of sequential binding as Kn or βn values depending on the model used; here we obtain the value in the format Kn (or K[13·(12·13)]).

Figure S30: UV/Vis titration of 13 with 12 in MeCN, omitting the presence of a 2:1 binding mode, ReactLab Working Window. The fit is considerably worse as evidenced by the 3D plot of residuals, which is scaled 3 times larger than in Figure S28. Top Left, a detail from the titration showing a poor fit of the peaks at 425 and 440 nm (Green line = predicted spectrum, blue circles = data).

© 2011 Macmillan Publishers Limited. All rights reserved.

40 nature chemistry | www.nature.com/naturechemistry

SUPPLEMENTARY INFORMATION doi: 10.1038/nchem.987

SI ‘An AAAA-DDDD Quadruple Hydrogen Bond Array’ Blight et al… S40 5.4 UV/Vis Experiments in 10% DMSO/CHCl3 The binding of 12•13 in 10% DMSO/CHCl3 v/v was carried out using identical experimental

procedures to experiments in MeCN. The DMSO was laboratory reagent grade and the CHCl3 was

HPLC grade, the mixture containing 250 ppm H2O (by Karl-Fischer coulometric titration). As

before, quantities were chosen so as to give the desired concentrations of 12 and 13, and the titration

carried out using Hamilton microliter syringes. The binding was verified by 1H NMR (Figure S34).

Figure S31: UV/Vis spectra of 13 (ca. 1 × 10⁻⁵ M) upon addition of 12 (0 → 4.5 equiv), while maintaining the concentration of 13 constant, in a solution of 10% DMSO in CHCl3 at 298 K. Component distribution over the course of the titration experiment is also illustrated (inset). Association constants for 12·13, which were modelled with a 2:1 equilibrium, are K12•13 = 3.4 x 10⁵ M-1 (∆G = -31.6 kJ mol-1) for 12·13 and K13(12·13) = 1.4 x 10⁵ M-1 (∆G = -29.4 kJ mol-1) for the binding of a second AAAA unit to this complex to form 13·(12·13).

UV/Vis Titration of 13 with 12 in 10% v/v DMSO in CHCl3 (10 µM)

0

0.05

0.1

0.15

0.2

0.25

0.3

0.35

0.4

390 410 430 450 470 490 510 530 550

Wavelength (nm)

Abs

orba

nce

Component Concentration

00.20.40.60.8

1

0 2 4Equivalents of 12

Con

cent

ratio

n (1

0-5)

131212•1312•13•13

© 2011 Macmillan Publishers Limited. All rights reserved.

nature chemistry | www.nature.com/naturechemistry 41

SUPPLEMENTARY INFORMATIONdoi: 10.1038/nchem.987

SI ‘An AAAA-DDDD Quadruple Hydrogen Bond Array’ Blight et al… S41

Figure S32: UV/Vis titration of 13 with 12 in 10% DMSO/ CHCl3 v/v, ReactLab Working Window. Top left, plot of least-squares optimisation during a fit. Top right, a 3D plot of the residuals for the fit. Bottom left, the calculated spectrum for each species. Bottom right, concentration profile for the species in solution.

© 2011 Macmillan Publishers Limited. All rights reserved.

42 nature chemistry | www.nature.com/naturechemistry

SUPPLEMENTARY INFORMATION doi: 10.1038/nchem.987SI ‘An AAAA-DDDD Quadruple Hydrogen Bond Array’ Blight et al… S42

Figure S33: UV/Vis titration of 13 with 12 in 10% v/v DMSO/CHCl3, ReactLab Input/Output displaying log(K) = 5.561 for the 12·13 equilibrium and log(K) = 5.129 for the 13·(12·13) equilibrium. ReactLab can output values of sequential binding as Kn or βn values depending on the model used; here we obtain the value in the format Kn (or K13·(12·13)). The presence of a 2:1 binding mode was verified in the same way as Fig. S30.

Figure S34: NMR titration (500 MHz, 10% v/v DMSO-d6/CDCl3, 298 K, 2 mM) of 13 with 12 in, showing a sharp isotherm indicative of binding Ka > 105 M-1 in addition to multiple equilibria. Proton A of 13 (see Fig. S3) was followed during th course of the titration experiment.

© 2011 Macmillan Publishers Limited. All rights reserved.

nature chemistry | www.nature.com/naturechemistry 43

SUPPLEMENTARY INFORMATIONdoi: 10.1038/nchem.987SI ‘An AAAA-DDDD Quadruple Hydrogen Bond Array’ Blight et al… S43

5.5 Repetitions of binding constant determinations

Log10(K) for 3 runs Entry Equilibrium Solvent

1 2 3

Average log10(K)

1 6 + 7 ↔ 6·7 MeCN 3.78 3.77 3.64 3.73 ± 0.076 2 6 + 12 ↔ 6·12 MeCN 4.15 4.12 4.19 4.15 ± 0.030 3 13 + 7 ↔ 13·7 MeCN 4.79 4.90 4.74 4.81 ± 0.081 4 13 + 12 ↔ 13·12 MeCN 6.21 6.28 6.03 6.17 ± 0.122 5 13·12 + 13 ↔(13·12)·13 MeCN 5.52 5.56 5.53 5.53 ± 0.032 6 13 + 12 ↔ 13·12 10% DMSO/CHCl3 5.51 5.51 5.56 5.53 ± 0.031 7 13·12 + 13 ↔(13·12)·13 10% DMSO/CHCl3 5.13 5.14 5.13 5.13 ± 0.003 8 6 + 12 ↔ 6·12 CH2Cl2 9.97 10.00 10.09 10.02 ± 0.065

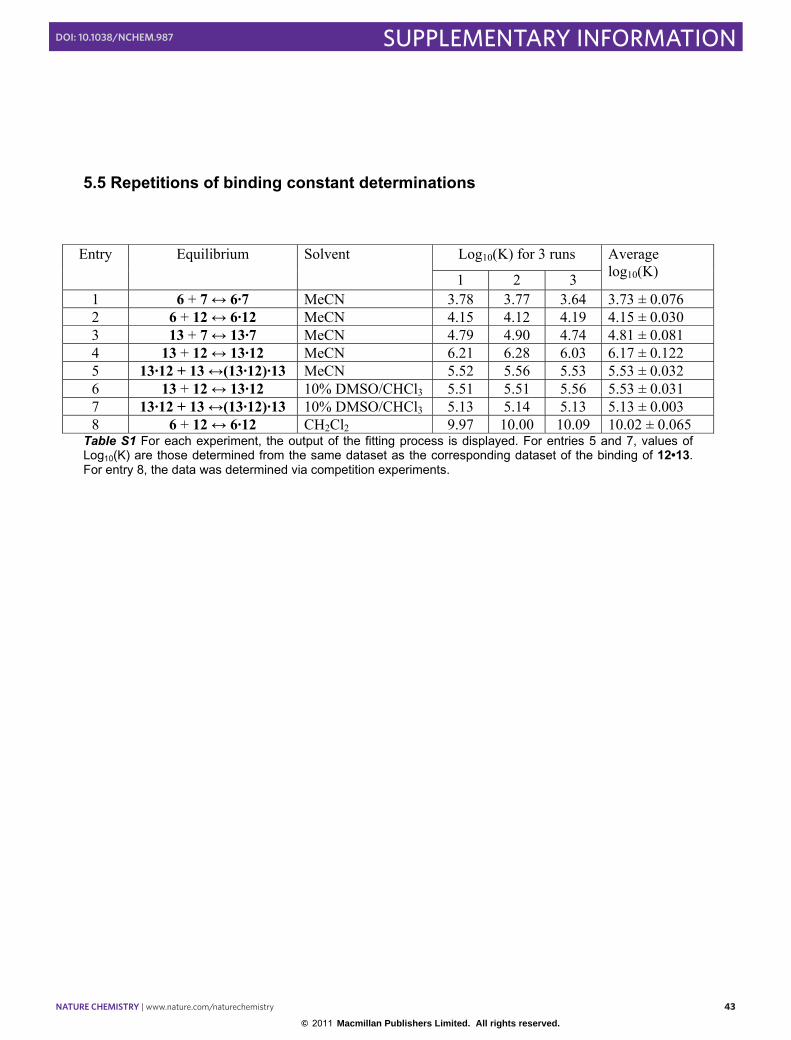
Table S1 For each experiment, the output of the fitting process is displayed. For entries 5 and 7, values of Log10(K) are those determined from the same dataset as the corresponding dataset of the binding of 12•13. For entry 8, the data was determined via competition experiments.

© 2011 Macmillan Publishers Limited. All rights reserved.

44 nature chemistry | www.nature.com/naturechemistry

SUPPLEMENTARY INFORMATION doi: 10.1038/nchem.987

SI ‘An AAAA-DDDD Quadruple Hydrogen Bond Array’ Blight et al… S44

5.6 Job Plots To determine the presence of a 2:1 binding mode, ReactLab’s input model was varied as previously

described. In order to obtain a second independent measure of stoichiometry, MacCarthy’s method

of obtaining Job curves(S12, S13) was used on the unprocessed titration data to confirm the

stoichiometry in each case.

0

0.002

0.004

0.006

0.008

0.01

0 0.5 1Mol Fraction 12

Abs

at 4

55 n

m

Peak = 0.40

Figure S35: Job plot of 12•13 (MeCN, 5 × 10⁻⁵ M, 460 nm) showing a mixed binding mode.

00.005

0.010.015

0.020.025

0.030.035

0 0.5 1Mol Fraction 12

Abs

at 4

55 n

m

Peak = 0.41

Figure S36: Job plot of 12•13 (10% v/v DMSO/CHCl3, 1 × 10⁻⁵ M, 430 nm) showing a mixed binding mode.

0

0.002

0.004

0.006

0.008

0 0.5 1Mol Fraction 12

Abs

at 4

55 n

m

Peak = 0.50

Figure S37: Job plot of 12•6 (MeCN, 7 × 10⁻⁴ M, 370 nm) showing a 1:1 binding mode.

© 2011 Macmillan Publishers Limited. All rights reserved.

nature chemistry | www.nature.com/naturechemistry 45

SUPPLEMENTARY INFORMATIONdoi: 10.1038/nchem.987

SI ‘An AAAA-DDDD Quadruple Hydrogen Bond Array’ Blight et al… S45

00.010.020.030.040.050.060.07

0 0.5 1Mol Fraction 7

Abs

at 4

55 n

m

Peak = 0.49

Figure S38: Job plot of 7•6 (MeCN, 8 × 10⁻⁴ M, 370 nm) showing a 1:1 binding mode.

00.0020.0040.0060.008

0.010.012

0 0.5 1Mol Fraction 7

Abs

at 4

55 n

m

Peak = 0.54

Figure S39: Job plot of 7•13 (MeCN, 5 × 10⁻⁵ M, 450 nm) showing a 1:1 binding mode.

© 2011 Macmillan Publishers Limited. All rights reserved.

46 nature chemistry | www.nature.com/naturechemistry

SUPPLEMENTARY INFORMATION doi: 10.1038/nchem.987SI ‘An AAAA-DDDD Quadruple Hydrogen Bond Array’ Blight et al… S46

6. Other AADA-DDAD and AAAA-DDDD systems

Examples of AADA-DDAD and AAAA-DDDD+ quadruple hydrogen bonded arrays have

previously been claimed.(S9,S10) However, their association constants in CDCl3 are anomalously low

(Ka = 5.9 x 10² M-1 and Ka = 5.3 x 10² M-1, respectively). This seems to be the result of rotamers of

the DDAD (Figure S40a) and DDDD+ (Figure S40b) components caused by intramolecular hydrogen

bonding interactions to favour hydrogen bond motifs that do not correspond to the ones intended.

Figure S40: Reported AADA-DDAD(S9) (a, Ka = 5.9 x 10² M-1) and AAAA-DDDD+ (S10) (b, Ka = 5.3 x 10² M-1) complexes. The DDAD and DDDD+ components may favor rotamers that do not correspond to the intended H-bond motif .

© 2011 Macmillan Publishers Limited. All rights reserved.

nature chemistry | www.nature.com/naturechemistry 47

SUPPLEMENTARY INFORMATIONdoi: 10.1038/nchem.987 SI ‘An AAAA-DDDD Quadruple Hydrogen Bond Array’ Blight et al… S47

7. Estimation of binding strengths in different solvents using hydrogen bond

parameters

If the thermodynamic contributions of individual hydrogen bonds in a multiply hydrogen bonded

complex are assumed to be additive in free energy, the magnitude of the expected solvent effects can

be estimated using Hunter’s hydrogen bond parameters in conjunction with Equation 1.(S11)

∆G0 = − (α i −αS )(β i −βS )i

∑ + 6 kJ mol−1 Eq. 1

where αS and βS are the hydrogen bond parameters of the solvent, αi and βi are the hydrogen bond

parameters for the solute interaction sites, the sum is over all solute-solute interactions and 6 kJ mol-1

is a constant representing the cost of forming a bimolecular complex in solution.

The solvent hydrogen bond parameters used to estimate association constants are αS = 1.9, 1.7, 0.8

for dichloromethane, acetonitrile, dimethylsulfoxide, and βS = 2.0, 5.1, 8.9 for dichloromethane,

acetonitrile, dimethylsulfoxide. The hydrogen-bond donor parameter (α) used for 7 and 12 was

assumed to be the same as the value for ammonium and guanidinium cations, which have been

characterised experimentally (6.0). The hydrogen-bond acceptor parameter (β) used for 6 and 13 was

assumed to be the same as the value for pyridine, which has been characterised experimentally (7.0).

© 2011 Macmillan Publishers Limited. All rights reserved.

48 nature chemistry | www.nature.com/naturechemistry

SUPPLEMENTARY INFORMATION doi: 10.1038/nchem.987

SI ‘An AAAA-DDDD Quadruple Hydrogen Bond Array’ Blight et al… S48

8. References S1: Harwood, L. M. Dry-column flash chromatography. Aldrichimica Acta 18, 25 (1985).

S2: Yakelis, N. A. & Bergman, R. G. Safe preparation and purification of sodium tetrakis (3,5-

trifluoromethyl)phenylborate (NaBArF24): reliable and sensitive analysis of water in

solutions of fluorinated tetraarylborates. Organometallics 24, 3579-3581 (2005).

S3: Park, T., Mayer, M. F., Nakashima, S. & Zimmerman, S. C. Preparation of 2,7-diamino-1,8-

naphthyridine: a useful building block for supramolecular chemistry. Synlett, 1435-1436

(2005).

S4: A more efficient synthesis has since been published: Goswami, S., Mukherjee, R., Jana, S.,

Maity, A. C. & Adak, A. K. Simple and efficient synthesis of 2,7-difunctionalized-1,8-

naphthyridines. Molecules 10, 929-936 (2005).

S5: Ashworth, R. D., Crowther, A. F., Curd, F. H. S. & Rose, F. L. Synthetic antimalarials .24.

some 2-phenylureido-4-dialkylaminoalkylamino-6-methylpyrmidines and 2-

phenylthioureido-4-dialkylaminoalkylamino-6-methylpyrimidines. J. Chem. Soc., 581-586

(1948).

S6: Comins, D. L. & Brown, J. D. Ortho-metalation directed by alpha-amino alkoxides - an

improved synthesis of ortho-substituted aryl ketones. Tetrahedron Lett. 24, 5465-5468

(1983).

S7: Connors, K. A. Binding Constants: The Measurement of Molecular Complex Stability page

203 (Wiley, New York, 1987)

S8: Blight, B. A. et al. AAA-DDD Triple Hydrogen Bond Complexes. J. Am. Chem. Soc. 131,

14116-14122 (2009).

S9: Brammer, S., Luning, U. & Kuhl, C. Multiple hydrogen bonds. Part 2. A new quadruply

bound heterodimer DDAD•AADA and investigations into the association process. Eur. J.

Org. Chem., 4054-4062 (2002).

© 2011 Macmillan Publishers Limited. All rights reserved.

nature chemistry | www.nature.com/naturechemistry 49

SUPPLEMENTARY INFORMATIONdoi: 10.1038/nchem.987

SI ‘An AAAA-DDDD Quadruple Hydrogen Bond Array’ Blight et al… S49 S10: Taubitz, J. & Luning, U. The AAAA•DDDD hydrogen bond dimer. synthesis of a soluble

sulfurane as AAAA domain and generation of a DDDD counterpart. Aus. J. Chem. 62, 1550-

1555 (2009).

S11: Hunter, C. A. Quantifying intermolecular interactions: guidelines for the molecular

recognition toolbox. Angew. Chem. Int. Ed. 43, 5310-5324 (2004).

S12: Hill, Z. D. & MacCarthy, P. Novel approach to Job’s method. J. Chem. Ed. 63, 162-167

(1986).

S13: MacCarthy, P. Simplified experimental route for obtaining Job’s curves. J. Anal. Chem., 50,

2165 (1978)

© 2011 Macmillan Publishers Limited. All rights reserved.


Recommended