Page 1
Supplementary Information
Effects of Perfluorooctanoic Acid on Metabolic Profiles in Brain and Liver of Mouse by a
High-throughput Targeted Metabolomics Approach
Nanyang Yu†, Si Wei†,*, Meiying Li†, Jingping Yang‡, Kan Li†, Ling Jin§, Yuwei Xie†, John P. Giesy†,⊥,
∥, Xiaowei Zhang, Hongxia Yu†,*
†State Key Laboratory of Pollution Control and Resource Reuse, School of the Environment, Nanjing
University, Nanjing, Jiangsu, People’s Republic of China
‡Laboratory of Immunology and Reproductive Biology, School of Medicine, Nanjing University,
Nanjing, Jiangsu, People’s Republic of China
§Department of Civil and Environmental Engineering, The Hong Kong Polytechnic University, Hung
Hom, Kowloon, Hong Kong
⊥Department of Biomedical Veterinary Sciences and Toxicology Centre, University of Saskatchewan,
Saskatoon, SK S7N 5B3, Canada
∥School of Biology Sciences, University of Hong Kong, Hong Kong, SAR, China
Corresponding author:
Name: Dr. Si Wei
Phone: +86 25 8968 0356; fax: +86 25 8968 0356; e-mail: [email protected]
Name: Dr. Hongxia Yu
Phone: +86 25 8968 0356; fax: +86 25 8968 0356; e-mail: [email protected]
Page 2
S2
Supplementary Methods P.S3
Supplementary Table S1 P.S6
Supplementary Figure S1. P.S8
Supplementary Figure S2. P.S9
Supplementary Figure S3. P.S10
Supplementary Figure S4. P.S11
Supplementary Figure S5. P.S12
Supplementary Figure S6. P.S13
Supplementary Figure S7. P.S14
Page 3
S3
Supplementary Methods
Metabolite analysis
AbsoluteIDQTM p180 kit assay. Biocrates’ commercially available KIT plates were used for
quantification of amino acids, acylcarnitines, sphingomyelins, phosphatidylcholines, hexoses, and
biogenic amines. The fully automated assay was based on phenylisothiocyanate (PITC) derivatization in
the presence of internal standards followed by flow injection analysis-tandem mass spectrometry
(FIA-MS/MS) (acylcarnitines, lipids, and hexose) and LC/MS (amino acids, biogenic amines) using an
AB SCIEX 4000 QTrap™ mass spectrometer (AB SCIEX, Darmstadt, Germany) with electrospray
ionization. The experimental metabolomics measurement technique was described in detail by patent US
2007/0004044.
Oxidized polyunsaturated fatty acids. Eicosanoids and other oxidized polyunsaturated fatty acids
were extracted from samples with aqueous acetonitrile that contained deuterated internal standards. The
metabolites were determined by LC-MS/MS with Multiple Reaction Monitoring (MRM) in negative
mode using a SCIEX API 4000 QTrap mass spectrometer with electrospray ionization.
Intermediates of the energy metabolism. For quantification of energy metabolism intermediates
(glycolysis, citrate cycle, pentose phosphate pathway, urea cycle) hydrophilic interaction liquid
chromatography (HILIC)-ESI-MS/MS in highly selective negative MRM detection mode was used. The
MRM detection was performed using a SCIEX 4000 QTrap™ tandem mass spectrometry instrument
(Applied Biosystems/MDS Analytical Technologies). Protein was precipitated and extracted
simultaneously with aqueous methanol in a 96 well plate format. Internal standards (ratio external to
Page 4
S4
internal standard) and external calibration were used for quantitation.
Free fatty acids. Concentrations of individual free fatty acids in liver and urine samples from mice
were quantified as their corresponding methyl ester derivatives (FAME’s) using gas chromatography
coupled with mass spectrometric detection (Agilent 7890 GC / 5975 MSD) after derivatization. Samples
were treated with methanolic HCl for a prolonged time period to completely convert both free fatty acids
into their methyl esters representing the free fatty acid (FFA) content. Chromatograms in Selected Ion
Monitoring (SIM) mode with four characteristic ions were recorded for quantitation of individual
FAME’s. External standard calibration curves were used to calculate the corresponding concentrations.
Unknown FAME’s (external standards not available) were identified using a combination of: spectra
recorded in SCAN mode, respective ratios of characteristic ions and the retention behavior. Their
(semi)-quantification was carried out with response factors extra- and/or interpolated from the nearby
eluting compounds having the same number of double bonds.
Neurotransmitter. Quantification of neurotransmitters was carried out in a 96 well plate format and
based on a PITC (phenylisothiocyanate)-derivatization in the presence of internal standards followed by
LC-ESI-MS/MS in selective multiple reaction monitoring (MRM) mode using an AB Sciex 4000
QTrap™mass spectrometer (AB Sciex, Darmstadt, Germany). 5-HIAA and its corresponding internal
standard cannot be derivatized with PITC because they do not contain an aliphatic amino group like the
other 6 neurotransmitters. Therefore, the chromatographic peak of the un-derivatized 5-HIAA was
slightly broader and the detection in the mass spectrometer was less sensitive (greater LOD) compared
to the other derivatized neurotransmitters. Apart from that, 5-HIAA can be quantified without
Page 5
S5
restrictions.
Instrument analysis on PFOA and QA/QC.
PFOA was analyzed by high performance liquid chromatography (Agilent 1260 Infinity LC, Agilent
Technologies) tandem mass spectrometry (API 4000, AB Sciex, Darmstadt, Germany) with an
ACQUITY BEH C18 column (2.1 mm × 50 mm, 2.5 μm, Waters, Milford, MA, USA). The column
temperature was held at 40 °C. The mobile phases were 2 mM ammonium acetate in water (A) and
methanol (B). The sample injection volume was 5 μL. The HPLC gradient program was optimized as
follows: the flow rate was set at 400 μL/min with starting at 5 % of solvent B held until 0.50 min,
increasing to 20 % of solvent B until 1.5 min, to 50 % of solvent B until 5 min, to 65 % of solvent B
until 13 min, to 85 % of solvent B until 14.5 min, further 100 % of solvent B until 15.5 min, and then
keeping 5 % of solvent B until 18 min for equilibration. The mass spectrometer was operated in negative
electrospray ionization multiple reaction monitoring (MRM) mode (413.1-368.8 and 413.1-168.9 for
PFOA, 417-372 for 13C4-PFOA).
Quantification of PFOA was performed by use of an internal standard calibration curve (r > 0.99).
The limit of quantification (LOQ) for instrument was defined as the minimum point on the calibration
curve that could be accurately measured within ± 20 % of its theoretical value. PFOA in procedural
blanks were below its method LOQ (1 ng/mL). Mean matrix spike recoveries of PFOA (20 ng/g or 20
ng/mL) in blood (n = 3), brain (n = 3), and liver (n = 3) were 79.8±1.6%, 81.2±2.5% and 78.1±1.4%,
respectively.
Page 6
S6
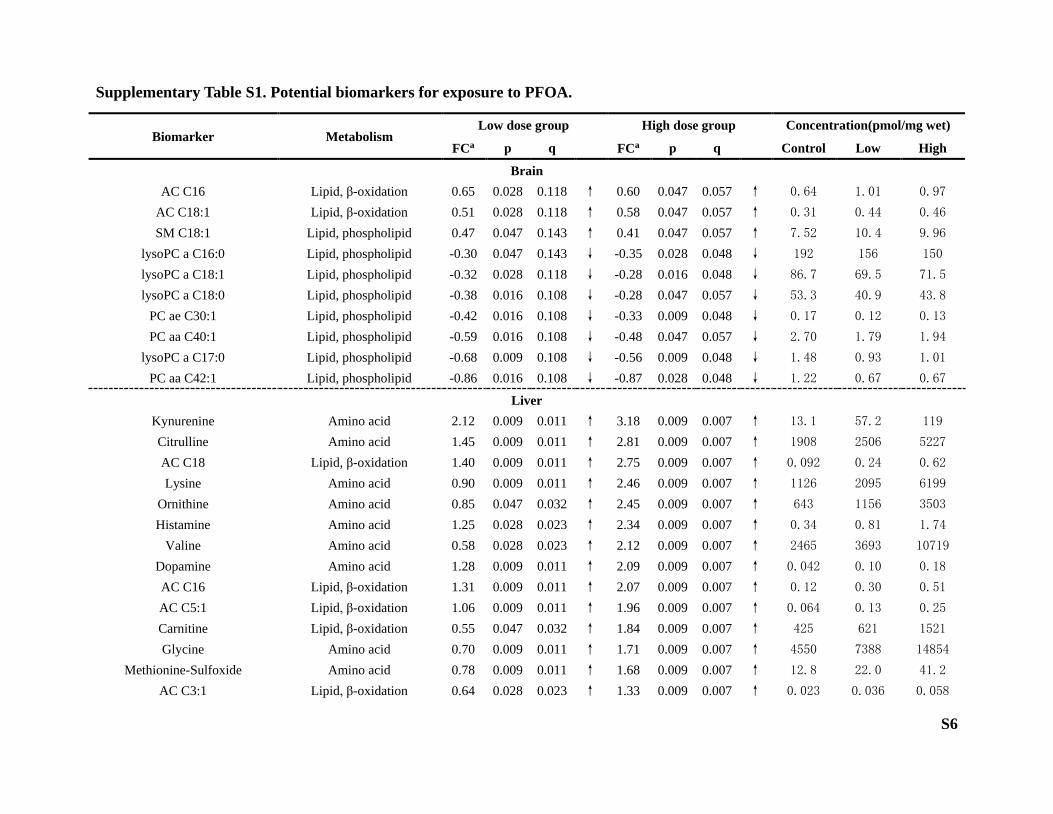
Supplementary Table S1. Potential biomarkers for exposure to PFOA.
Biomarker Metabolism Low dose group High dose group Concentration(pmol/mg wet)
FCa p q FCa p q Control Low High
Brain
AC C16 Lipid, β-oxidation 0.65 0.028 0.118 ↑ 0.60 0.047 0.057 ↑ 0.64 1.01 0.97
AC C18:1 Lipid, β-oxidation 0.51 0.028 0.118 ↑ 0.58 0.047 0.057 ↑ 0.31 0.44 0.46
SM C18:1 Lipid, phospholipid 0.47 0.047 0.143 ↑ 0.41 0.047 0.057 ↑ 7.52 10.4 9.96
lysoPC a C16:0 Lipid, phospholipid -0.30 0.047 0.143 ↓ -0.35 0.028 0.048 ↓ 192 156 150
lysoPC a C18:1 Lipid, phospholipid -0.32 0.028 0.118 ↓ -0.28 0.016 0.048 ↓ 86.7 69.5 71.5
lysoPC a C18:0 Lipid, phospholipid -0.38 0.016 0.108 ↓ -0.28 0.047 0.057 ↓ 53.3 40.9 43.8
PC ae C30:1 Lipid, phospholipid -0.42 0.016 0.108 ↓ -0.33 0.009 0.048 ↓ 0.17 0.12 0.13
PC aa C40:1 Lipid, phospholipid -0.59 0.016 0.108 ↓ -0.48 0.047 0.057 ↓ 2.70 1.79 1.94
lysoPC a C17:0 Lipid, phospholipid -0.68 0.009 0.108 ↓ -0.56 0.009 0.048 ↓ 1.48 0.93 1.01
PC aa C42:1 Lipid, phospholipid -0.86 0.016 0.108 ↓ -0.87 0.028 0.048 ↓ 1.22 0.67 0.67
Liver
Kynurenine Amino acid 2.12 0.009 0.011 ↑ 3.18 0.009 0.007 ↑ 13.1 57.2 119
Citrulline Amino acid 1.45 0.009 0.011 ↑ 2.81 0.009 0.007 ↑ 1908 2506 5227
AC C18 Lipid, β-oxidation 1.40 0.009 0.011 ↑ 2.75 0.009 0.007 ↑ 0.092 0.24 0.62
Lysine Amino acid 0.90 0.009 0.011 ↑ 2.46 0.009 0.007 ↑ 1126 2095 6199
Ornithine Amino acid 0.85 0.047 0.032 ↑ 2.45 0.009 0.007 ↑ 643 1156 3503
Histamine Amino acid 1.25 0.028 0.023 ↑ 2.34 0.009 0.007 ↑ 0.34 0.81 1.74
Valine Amino acid 0.58 0.028 0.023 ↑ 2.12 0.009 0.007 ↑ 2465 3693 10719
Dopamine Amino acid 1.28 0.009 0.011 ↑ 2.09 0.009 0.007 ↑ 0.042 0.10 0.18
AC C16 Lipid, β-oxidation 1.31 0.009 0.011 ↑ 2.07 0.009 0.007 ↑ 0.12 0.30 0.51
AC C5:1 Lipid, β-oxidation 1.06 0.009 0.011 ↑ 1.96 0.009 0.007 ↑ 0.064 0.13 0.25
Carnitine Lipid, β-oxidation 0.55 0.047 0.032 ↑ 1.84 0.009 0.007 ↑ 425 621 1521
Glycine Amino acid 0.70 0.009 0.011 ↑ 1.71 0.009 0.007 ↑ 4550 7388 14854
Methionine-Sulfoxide Amino acid 0.78 0.009 0.011 ↑ 1.68 0.009 0.007 ↑ 12.8 22.0 41.2
AC C3:1 Lipid, β-oxidation 0.64 0.028 0.023 ↑ 1.33 0.009 0.007 ↑ 0.023 0.036 0.058
Page 7
S7
Biomarker Metabolism Low dose group High dose group Concentration(pmol/mg wet)
FCa p q FCa p q Control Low High
cis-8,11,14-Eicosatrienoic acid Polyunsaturated fatty acids 0.43 0.028 0.023 ↑ 1.15 0.009 0.007 ↑ 234 315 518
AC C8:1 Lipid, β-oxidation 0.54 0.009 0.011 ↑ 1.07 0.009 0.007 ↑ 0.13 0.19 0.27
PC ae C40:0 Lipid, phospholipid 0.42 0.009 0.011 ↑ 0.66 0.009 0.007 ↑ 96.7 129 153
linolenic acid Polyunsaturated fatty acids -1.00 0.016 0.015 ↓ -3.50 0.008 0.007 ↓ 30.0 15.0 2.66
a: Fold change
Page 8
S8
Supplementary Figure S1. KEGG metabolic pathways mapping selected metabolites: blue:
metabolites quantified only for brain; red: metabolites quantified only for liver; green:
metabolites quantified for both brain and liver.
Page 9
S9
Supplementary Figure S2. PCA score plots of metabolic profiles in brain (A and B) and liver (C
and D). Panels A and C for the first two components and panels B and D for the first three
components. Red for the high-dose group; Blue for the low-dose group; Green for the control
group.
Page 10
S10
Supplementary Figure S3. Permutations plot for PLS-DA models for brain (A) and liver (B).
Page 11
S11
Supplementary Figure S4. Metabolic pathway analysis. KEGG metabolic pathways mapping the
detected metabolites in brain (A) and liver (B), red: differential metabolites only for high-dose
group; blue: differential metabolites only for low-dose group; green: differential metabolites for
both two-exposure groups.
Page 12
S12
Supplementary Figure S5. Mean concentrations of dopamine, serotonin, norepinephrine and
glutamate in brain among three groups. *: p < 0.05; the confidence intervals are SD.
Page 13
S13
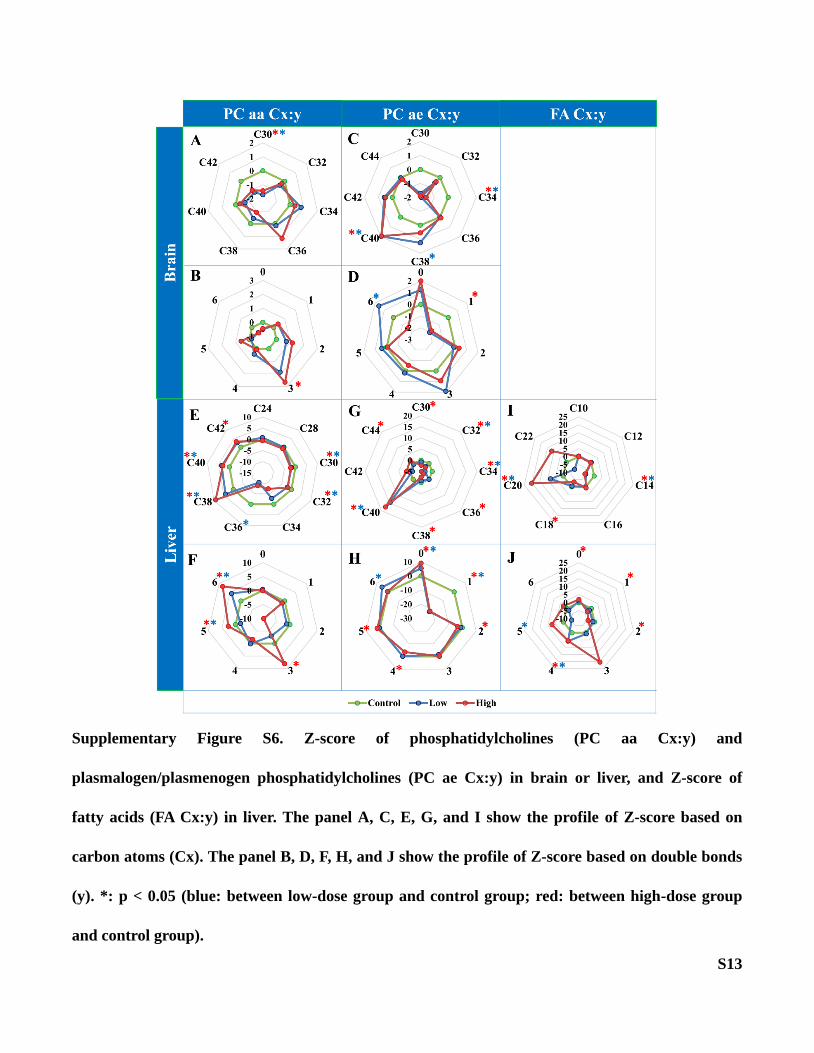
Supplementary Figure S6. Z-score of phosphatidylcholines (PC aa Cx:y) and
plasmalogen/plasmenogen phosphatidylcholines (PC ae Cx:y) in brain or liver, and Z-score of
fatty acids (FA Cx:y) in liver. The panel A, C, E, G, and I show the profile of Z-score based on
carbon atoms (Cx). The panel B, D, F, H, and J show the profile of Z-score based on double bonds
(y). *: p < 0.05 (blue: between low-dose group and control group; red: between high-dose group
and control group).
Page 14
S14
Supplementary Figure S7. Mean concentrations of prostaglandins, thrombaxanes, and
leukotrienes in liver among three groups. *: p < 0.05 ; the confidence intervals are SD.