Supplementary Tables
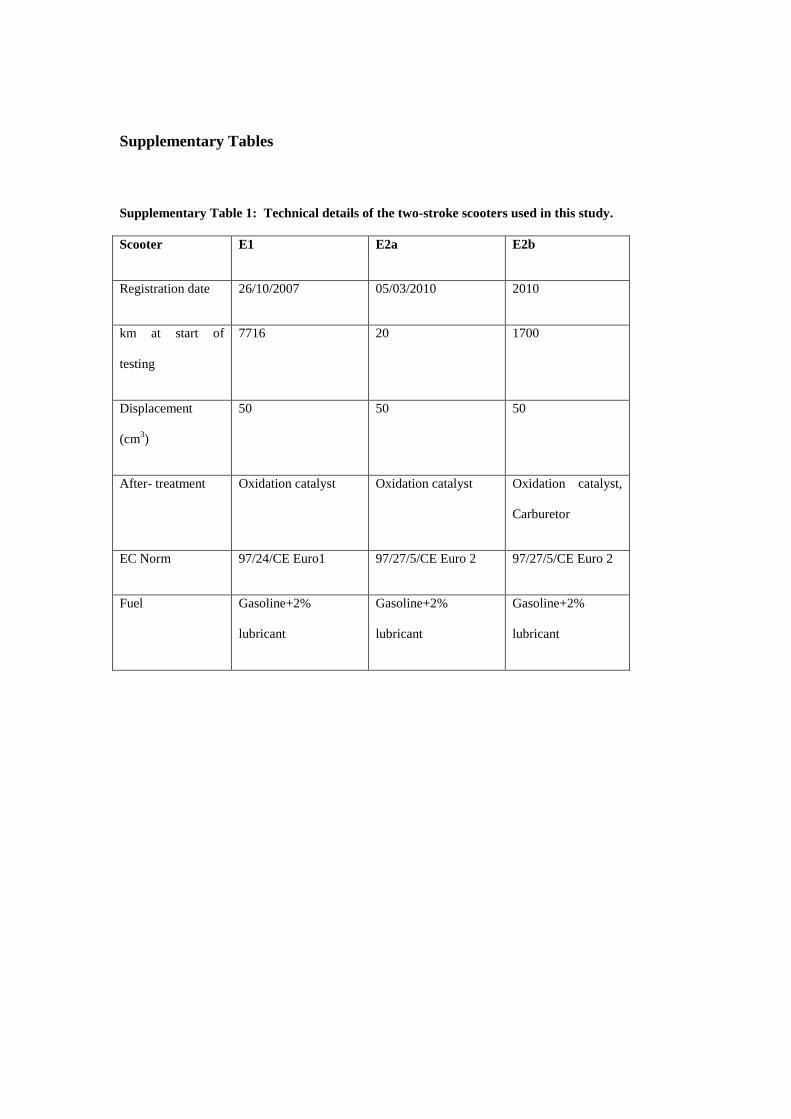
Supplementary Table 1: Technical details of the two-stroke scooters used in this study.
Scooter E1 E2a E2b
Registration date 26/10/2007 05/03/2010 2010
km at start of
testing
7716 20 1700
Displacement
(cm3)
50 50 50
After- treatment Oxidation catalyst Oxidation catalyst Oxidation catalyst,
Carburetor
EC Norm 97/24/CE Euro1 97/27/5/CE Euro 2 97/27/5/CE Euro 2
Fuel Gasoline+2%
lubricant
Gasoline+2%
lubricant
Gasoline+2%
lubricant
Supplementary Table 2: Emission limit values for Euro 1 and Euro 2 powered two wheelers.
Euro 3 legislation is to be introduced by 2016 (ref 53)
.
Norm Directive Effective CO HC+NOx
mg km-1
mg km-1
EURO 1 97/24/EC 17.06.1999 6000 3000
EURO 2 97/24/EC 17.06.2002 1000 1200
Supplementary Table 3: List of smog chamber tests with driving conditions, smog chamber OA
concentrations, initial NO concentrations and calculated primary and secondary organic aerosol
in g carbon (C) kg-1
fuel for idling, simulated low power and ECE47 driving cycle (chassis
dynamometer) 2S scooter experiments.
Vehicle Date Test OA
Aged OA
/POA
NO Emission Factors
POA Aged OA POC SOC(5h)
µg m-3 µg m-3 ppb(v) g C kg-1 Fuel g C kg-1 Fuel
17.11.10 Idle 11 121.8 11.1 41 1.02 6.45
E1 19.11.10 Idle 7.5 196.1 26.1 87 0.72 5.45
22.11.10 Low Power 70.4 116.4 1.7 87 5.17 6.59
15.11.10 Low Power 38.8 114.9 5.0 52 5.17 6.59
E2a 24.11.10 Low Power 8.3 23.3 3.0 64 9.18 15.37
26.11.10 Idle 1.7 157.9 2.8 49 1.48 2.02
E2b 30.09.11 Full cycle 3.04 4.98 1.6 119 0.49 0.78
03.10.11 Phase one only 30.56 71.23 2.3 60 2.08 3.25
Supplementary Table 4: Average primary organic aerosol (POA) emission factors and aged
organic aerosol (POA+SOA, g C kg-1
fuel) from the literature.
Study POA Aged
OA
Notes
European 2S Scooters
Chirico et al., (in prep.) 15.8 - 2 scooters (includes Euro 1 of this study and
one Euro 2), mix of hot and cold idle on line
measurement
Chirico et al., (in Prep.) 15.5 16.2 Same vehicles as above, ECE47 driving
cycle. Aged OA=POA+(0.084×Aromatic)
Adam et al. (2010)7 1.12 2.00 4 Euro 2 scooters. ECE47 driving cycle.
Gravimetric measurement, assumes 100%
POA. Aged OA=POA+(0.084×Aromatic)
Indian 2S Autorickshaws
Apte et al. (2011)8, Reynolds et al.,
(2011)9
10.7 In-use vehicles, Indian Driving Cycle. Mix
of compressed natural gas and gasoline
powered
Euro 5 light duty vehicles
Platt et al. (2013)1 0.02 0.05 One gasoline vehicle, NEDC driving cycle
Platt et al. (in Prep.) 0.01 0.02 Two gasoline and two diesel vehicles,
NEDC. Same methodology as for driving
cycle scooters of this study.
Light duty vehicles not meeting Euro 5
Nordin et al. (2013)10
0.10 Mix of gasoline vehicles, mostly <Euro 3.
SOA only. Non standardised driving cycle
Chirico et al., (2010)11
0.11 0.26 One diesel vehicle with catalyst. Non
standardised driving cycle
Gordon et al. (2013a)12
, Gordon et al.,
(2013b)13
0.05 0.08 Diesel and gasoline vehicles complying with
US LEV1, LEV2, and LEV3. Standardised
US driving cycles
Schauer et al. (2002)14
0.05 Mix of gasoline vehicles. Sampled during
federal cold start test procedure
Chirico et al. (in Prep.) 0.07 NEDC driving cycle
Heavy duty vehicles
Gordon et al. (2013)12
0.02 Standardised driving cycles
Chirico et al. (in Prep.) 0.03 ETC driving cycle
Zardini et al. (in Prep.) 0.007 0.009 Same methodology as for driving cycle
scooters of this study.
Schauer et al. (1999)15
0.11 Medium duty diesel trucks. Federal hot start
test procedure
Ambient roadside/ tunnel mainly light duty (>50%)
Grieshop et al. (2006)16
0.08 US: Pittsburgh highway tunnel, average of
high and low speed
Handler et al. (2008)17
0.09 EU: tunnel in Austria, measurements in
2005
Phuleria et al. (2007)18
0.12 US: California tunnel, measurements in
2005
Fraser et al. (1998)19
0.18 US: LA tunnel
Geller et al. (2005)20
0.03 US: Northern California tunnel,
measurements in 2004
He at al. (2008)21
0.33 Asia: Zhujiang Tunnel, China,
measurements in 2004
Gillies et al. (2001)20
0.27 US: Sepulveda tunnel, LA, measurements in
1998
Lough et al. (2005)21
0.14 US: average Kilburn and Howell tunnels,
Milwaukee, in winter and summer, on
weekends and weekdays
Cheng et al. (2010)22
0.14 Asia: Xueshan Tunnel, Taiwan
Dallmann et al. (2013)23
0.01 US: Caldecott tunnel, LA, measurements in
2010
Kirchstetter et al. (1999)24
0.05 US: California, measurements in summer
1997
Kam et al. (2012)25
0.05 US: California roadside, measurements in
2011
Hung-Lung et al. (2009)26
0.07 Asia: tunnel in Taiwan, measurements in
2005
EPA (2006)29
0.08 US: remote sensing at roadside in Kansas
City. Average of winter/ summer
Ambient roadside/ tunnel mainly heavy duty (>50%)
Geller et al. (2005)30
0.18 US: Northern California tunnel,
measurements in 2004
Cheng et al. (2010)24
0.19 Asia: Xueshan Tunnel, Taiwan
Kirchstetter et al. (1999)26
0.5 US: California, measurements in summer
1997
EPA (2006)29
0.08 US: remote sensing at roadside in Kansas
City. Average of winter/ summer
Supplementary Table 5: Roadside benzene, toluene, ethylbenzene and xylene (BTEX)
concentrations in different cities (μg m-3
).
City Time Benzene Toluene Ethylbenzene Xylene Ref.
Guangzhou,
China
Oct and
Nov
1996
51.5 77.3 17.8 82.1 Wang et al.
(2002)30
Guangzhou,
China
Sep 2000 47.9 75.3 15.2 106.3 Chan et al.
(2006)31
Guangzhou,
China
Feb and
Aug
2000
61.6 103.9 15.4 109.8 Tang et al.
(2008)32
Guangzhou,
China
Feb 2002 34.6 56.2 11.4 48.2 Zhao et al.
(2004)33
Guangzhou,
China
Sep 2005 6.6 15.1 4.0 11.1 Tang et al.
(2007)34
Dongguan,
China
Jan 2006 12.3 76.0 14.6 48.0 Tang et al.
(2007)34
Macau Nov
1995
34.9 85.9 24.1 95.6 Wang et al.
(2002)30
Hong Kong Jan and
Feb 1998
24.9 68.9 2.5 14.5 Chan et al.
(2002)35
Nanjing, China April
2006 –
Jan 2007
15.8 38.2 7.0 16.3 Wang et al.
(2008)36
Nanjing, China Aug
2011
5.6 10.6 4.0 7.8 Lan et al.
(2012)37
Changchun,
China
Sep 1997
– Jul
1998
38.5 80.2 18.8 23.4 Liu et al.
(2000)38
Taipei, Taiwan Spring
1992
371.0 849.0 189.0 606.0 Chan et al.
(1994)39
Taichung,
Taiwan
1998 145.0 442.0 74.0 198.0 Kuo et al.
(2000)40
Kyoto, Japan May
2011
2.3 12.2 2.8 3.7 Lan et al.
(2012)37
Osaka, Japan May
2011
2.1 11.8 2.1 5.9 Lan et al.
(2012)37
Bangkok,
Thailand
Sep 2003 / 246.7 / 106.3 Oanh et al.
(2008)41
Kuala Lumpur,
Malaysia
Aug
2011
48.0 105.6 15.8 82.6 Lan et al.
(2012)37
HoChiMinh,
Vietnam
Oct –
Dec 2009
93.5 208.5 33.8 200.4 Lan et al.
(2013)42
HoChiMinh,
Vietnam
Oct 2011 87.0 200.1 39.2 150.9 Lan et al.
(2012)37
Hanoi, Vietnam Dec 2011 52.0 88.4 23.4 84.0 Lan et al.
(2012)37
Singapore May
2011
6.9 42.8 5.2 14.0 Lan et al.
(2012)37
Delhi, India Oct 2001
– Sep
2002
103.5 185.5 22.5 127.0 Hoque et al.
(2008)45
Delhi, India Jan – Dec
2001
358.5 74.8 31.3 37.6 Srivastava et al.
(2005)44
Mumbai, India May
2001 –
April
2002
237.8 216.0 1.7 0.7 Srivastava et al.
(2006)45
Karachi, Dec 1998 93.9 246.9 / 249.0 Barletta et al.
Pakistan – Jan
1999
(2002)46
Rome, Italy Jan, May,
July, Oct
2000
6.2 44.1 8.2 41.4 Fuselli et al.
(2002)47
Izmir, Turkey Aug –
Sep 1998
46.3 102.8 29.3 177.1 Muezzinoglu et
al. (2001)48
Zurich,
Switzerland
Oct 1993 6.0 / / 7.4 Monn et al.
(1996)49
London, UK July 1991
– June
1992
15.6 25.8 4.2 18.7 Derwent at al.
(1995)50
London, UK Jan – Dec
1996
6.0 13.6 3.2 12.8 Derwent et al.
(2000)51
Birmingham,
UK
2005 –
2006 (13
months)
2.0 9.5 1.7 5.4 Vardoulakis et
al. (2011)52
Supplementary Note 1
Secondary organic aerosol yields
A secondary organic aerosol (SOA) yield y is defined as:
VOC
Cy OA
, (1)
Where ΔCOA is the organic aerosol production for a given change in volatile organic
compound concentration ΔVOC. The SOA yields for an individual aromatic i as a
function of aerosol loading may be estimated using two-product fits 4:
OAom
om
OAom
om
OAiCk
k
Ck
kCy
2,
2,2
1,
1,1
11
, (2)
Where COA is the organic aerosol loading, measured using a high resolution time of
flight mass spectrometer, and αj and Kom,j are the mass fraction and partitioning
coefficients of gas phase species i, respectively. Using literature values of αi and kom,i
for aromatic hydrocarbons4 a concentration-weighted predicted yield ypredicted is
calculated for the oxidation of aromatics in 2S scooter exhaust using:
i
ii
predictedi
iyy
)( (3)
SOA yields from the literature for high NOX conditions were used to calculate a
predicted yield ypredicted from the decay of aromatic hydrocarbons, measured
with the PTRMS from the smog chamber. ypredicted is then compared with the
apparent yield (Eq. 1, main text), which assumes that all observed SOA is
from the oxidation of aromatics.
Supplementary References
1 Platt, S.M. et al. Secondary organic aerosol formation from gasoline vehicle
emissions in a new mobile environmental reaction chamber. Atmospheric
Chemistry and Physics 13, 9141-9158 (2013).
2 Paulsen, D. et al. Secondary Organic Aerosol Formation by Irradiation of 1, 3,
5-Trimethylbenzene-NO x-H2O in a New Reaction Chamber for Atmospheric
Chemistry and Physics. Environmental science and technology 39, 2668-2678
(2005).
3 United Kingdom Transport Research Laboratory (TRL) A Reference Book of
Driving Cycles for Use in the Measurement of Road Vehicle Emissions (2009)
available at
http://www.trl.co.uk/online_store/reports_publications/trl_reports/cat_traffic_a
nd_the_environment/report_a_reference_book_of_driving_cycles_for_use_in_
the_measurement_of_road_vehicle_emissions.htm , last accessed January 12th
,
2014.
4 Barmet, P. et al. OH clock determination by proton transfer reaction mass
spectrometry at an environmental chamber. Atmospheric Measurement
Techniques 5, 647-656 (2012).
5 Ng, N.L. et al. Secondary organic aerosol formation from m-xylene, toluene,
and benzene. Atmospheric Chemistry and Physics 7, 3909-3922 (2007).
6 Aiken, A.C. et al. O/C and OM/OC ratios of primary, secondary, and ambient
organic aerosols with high-resolution time-of-flight aerosol mass
spectrometry. Environmental Science and Technology 42, 4478-4485 (2008).
7 Adam, T. et al. Chemical Characterization of Emissions from Modern Two-
Stroke Mopeds Complying with Legislative Regulation in Europe (EURO-2).
Environmental science and technology 44, 505-512 (2010).
8 Apte, J.S. et al. Concentrations of fine, ultrafine, and black carbon particles in
auto-rickshaws in New Delhi, India. Atmospheric Environment 45, 4470-4480
(2011).
9 Reynolds, C.C.O., Grieshop, A.P. & Kandlikar, M. Climate and health
relevant emissions from in-use Indian three-wheelers fueled by natural gas and
gasoline. Environmental science and technology 45, 2406-2412 (2011).
10 Nordin, E.Z. et al. Secondary organic aerosol formation from idling gasoline
passenger vehicle emissions investigated in a smog chamber. Atmospheric
Chemistry and Physics 13, 6101-6116 (2013).
11 Chirico, R. et al. Impact of aftertreatment devices on primary emissions and
secondary organic aerosol formation potential from in-use diesel vehicles:
results from smog chamber experiments. Atmospheric Chemistry and Physics
10, 11545-11563 (2010).
12 Gordon, T.D. et al. Secondary organic aerosol formation exceeds primary
particulate matter emissions for light-duty gasoline vehicles. Atmospheric
Chemistry and Physics Discussions 13, 23173-23216 (2013).
13 Gordon, T.D. et al. Secondary organic aerosol production from diesel vehicle
exhaust: impact of aftertreatment, fuel chemistry and driving cycle.
Atmospheric Chemistry and Physics Discussions 13, 24223-24262 (2013).
14 Schauer, J.J., Kleeman, M.J., Cass, G.R. & Simoneit, B.R.T. Measurement of
emissions from air pollution sources. 5. C1-C32 organic compounds from
gasoline-powered motor vehicles. Environmental science and technology 36,
1169-1180 (2002).
15 Schauer, J.J., Kleeman, M.J., Cass, G.R. & Simoneit, B.R.T. Measurement of
emissions from air pollution sources. 2. C1 through C30 organic compounds
from medium duty diesel trucks. Environmental science and technology 33,
1578-1587 (1999).
16 Grieshop, A.P., Lipsky, E.M., Pekney, N.J., Takahama, S. & Robinson, A.L.
Fine particle emission factors from vehicles in a highway tunnel: Effects of
fleet composition and season. Atmospheric environment 40, 287-298 (2006).
17 Handler, M. et al. Size and composition of particulate emissions from motor
vehicles in the Kaisermuhlen-Tunnel, Vienna. Atmospheric environment 42,
2173-2186 (2008).
18 Phuleria, H.C., Sheesley, R.J., Schauer, J.J., Fine, P.M. & Sioutas, C.
Roadside measurements of size-segregated particulate organic compounds
near gasoline and diesel-dominated freeways in Los Angeles, CA.
Atmospheric environment 41, 4653-4671 (2007).
19 Fraser, M.P., Cass, G.R. & Simoneit, B.R.T. Gas-phase and particle-phase
organic compounds emitted from motor vehicle traffic in a Los Angeles
roadway tunnel. Environmental science and technology 32, 2051-2060 (1998).
20 Geller, M.D., Sardar, S.B., Phuleria, H., Philip, M. & Sioutas, C.
Measurements of particle number and mass concentrations and size
distributions in a tunnel environment. Environmental science and technology
39, 8653-8663 (2005).
21 He, L.-Y., Hu, M., Zhang, Y.-H., Huang, X.-F. & Yao, T.-T. Fine particle
emissions from on-road vehicles in the Zhujiang Tunnel, China.
Environmental science and technology 42, 4461-4466 (2008).
22 Gillies, J.A., Gertler, A.W., Sagebiel, J.C. & Dippel, n.W.A. On-road
particulate matter (PM2. 5 and PM10) emissions in the Sepulveda Tunnel, Los
Angeles, California. Environmental science and technology 35, 1054-1063
(2001).
23 Lough, G.C. et al. Emissions of metals associated with motor vehicle
roadways. Environmental science and technology 39, 826-836 (2005)
24 Cheng, Y.-H., Liu, Z.-S. & Chen, C.-C. On-road measurements of ultrafine
particle concentration profiles and their size distributions inside the longest
highway tunnel in Southeast Asia. Atmospheric environment 44, 763-772
(2010).
25 Dallmann, T.R., Kirchstetter, T., DeMartini, S.J. & Harley, R.A. Quantifying
on-road emissions from gasoline-powered motor vehicles: Accounting for the
presence of medium and heavy-duty diesel trucks. Environmental science and
technology (2013).
26 Kirchstetter, T.W., Harley, R.A., Kreisberg, N.M., Stolzenburg, M.R. &
Hering, S.V. On-road measurement of fine particle and nitrogen oxide
emissions from light-and heavy-duty motor vehicles. Atmospheric
Environment 33, 2955-2968 (1999).
27 Kam, W., Liacos, J.W., Schauer, J.J., Delfino, R.J. & Sioutas, C. On-road
emission factors of PM pollutants for light-duty vehicles (LDVs) based on
urban street driving conditions. Atmospheric environment (2012).
28 Hung-Lung, C. & Yao-Sheng, H. Particulate matter emissions from on-road
vehicles in a freeway tunnel study. Atmospheric Environment 43, 4014-4022
(2009).
29 EPA, (United States Environmental Protection Agency) Kansas city PM
characterization study (2006). Available at
http://www.epa.gov/OTAQ/emission-factors-research/420r08009.pdf, last
accessed January 5th 2014.
30 Wang, P. & Zhao, W. Assessment of ambient volatile organic compounds
(VOCs) near major roads in urban Nanjing, China. Atmospheric Research 89,
289-297 (2008).
31 Chan, L.-Y. et al. Characteristics of nonmethane hydrocarbons (NMHCs) in
industrial, industrial-urban, and industrial-suburban atmospheres of the Pearl
River Delta (PRD) region of south China. Journal of geophysical research
111, D11304 (2006).
32 Tang, J.H. et al. Implications of changing urban and rural emissions on non-
methane hydrocarbons in the Pearl River Delta region of China. Atmospheric
Environment 42, 3780-3794 (2008).
33 Zhao, L. et al. Exposure to hazardous volatile organic compounds, PM< sub>
10</sub> and CO while walking along streets in urban Guangzhou, China.
Atmospheric Environment 38, 6177-6184 (2004).
34 Tang, J.H. et al. Characteristics and diurnal variations of NMHCs at urban,
suburban, and rural sites in the Pearl River Delta and a remote site in South
China. Atmospheric Environment 41, 8620-8632 (2007).
35 Chan, C.Y. et al. Volatile organic compounds in roadside microenvironments
of metropolitan Hong Kong. Atmospheric Environment 36, 2039-2047 (2002).
36 Wang, P. & Zhao, W. Assessment of ambient volatile organic compounds
(VOCs) near major roads in urban Nanjing, China. Atmospheric Research 89,
289-297 (2008).
37 Lan, T.T.N. & Binh, N.T.T. Daily roadside BTEX concentrations in East Asia
measured by the Lanwatsu, Radiello and Ultra I SKS passive samplers.
Science of the Total Environment 441, 248-257 (2012).
38 Liu, C., Xu, Z., Du, Y. & Guo, H. Analyses of volatile organic compounds
concentrations and variation trends in the air of Changchun, the northeast of
China. Atmospheric Environment 34, 4459-4466 (2000).
39 Chan, L.-Y. et al. Characteristics of nonmethane hydrocarbons (NMHCs) in
industrial, industrial-urban, and industrial-suburban atmospheres of the Pearl
River Delta (PRD) region of south China. Journal of geophysical research
111, D11304 (2006).
40 Kuo, H.-W. et al. Exposure to volatile organic compounds while commuting in
Taichung, Taiwan. Atmospheric Environment 34, 3331-3336 (2000).
41 Kim Oanh, N.T., Martel, M., Pongkiatkul, P. & Berkowicz, R. Determination
of fleet hourly emission and on-road vehicle emission factor using integrated
monitoring and modeling approach. Atmospheric Research 89, 223-232
(2008).
42 Lan, T.T.N. & Minh, P.A. BTEX pollution caused by motorcycles in the
megacity of HoChiMinh. Journal of Environmental Sciences 25, 348-356
(2013).
43 Hoque, R.R., Khillare, P.S., Agarwal, T., Shridhar, V. & Balachandran, S.
Spatial and temporal variation of BTEX in the urban atmosphere of Delhi,
India. Science of the total environment 392, 30-40 (2008).
44 Srivastava, A. Variability in VOC concentrations in an urban area of Delhi.
Environmental monitoring and assessment 107, 363-373 (2005).
45 Srivastava, A., Joseph, A.E. & Devotta, S. Volatile organic compounds in
ambient air of Mumbai—India. Atmospheric Environment 40, 892-903 (2006).
46 Barletta, B. et al. Mixing ratios of volatile organic compounds (VOCs) in the
atmosphere of Karachi, Pakistan. Atmospheric Environment 36, 3429-3443
(2002).
47 Fuselli, S., Paduano, S. & Soriero, A. Seasonal trends of some volatile organic
compounds inside and outside private apartments located in areas
characterized by different vehicular traffic intensity of Rome. Annali
dell'Istituto superiore di sanita 38, 175-185 (2001).
48 Muezzinoglu, A., Odabasi, M. & Onat, L. Volatile organic compounds in the
air of Izmir, Turkey. Atmospheric Environment 35, 753-760 (2001).
49 Monn, C. & Hangartner, M. Passive sampling of aromatic volatile organic
compounds (VOC) in ambient air in Switzerland. Environmental technology
17, 301-307 (1996).
50 Derwent, R.G. Sources, distributions, and fates of VOCs in the atmosphere.
Issues in Environmental Science & Technology 4, 1-16 (1995)51
Derwent,
R.G. et al. Analysis and interpretation of the continuous hourly monitoring
data for 26 C< sub> 2</sub>--C< sub> 8</sub> hydrocarbons at 12 United
Kingdom sites during 1996. Atmospheric Environment 34, 297-312 (2000).
52 Vardoulakis, S., Solazzo, E. & Lumbreras, J. Intra-urban and street scale
variability of BTEX, NO2and O3 in Birmingham, UK: Implications for
exposure assessment. Atmospheric Environment 45, 5069-5078 (2011).
53 European Commission (EC), Official Journal of the European Communities
Regulation (EU) No 168 (2013).