Page 1
Supplementary Information:
Lithium manganese oxyfluoride as a new cathode material exhibiting oxygen redox
Robert Housea, Liyu Jina, Urmimala Maitraa, Kazuki Tsurutab, James Somervillea, Dominic Forstermanna, Felix Masselc, Laurent Dudac, Matthew R. Robertsa, Peter G. Brucea
a. Departments of Materials and Chemistry, University of Oxford, Parks Road, Oxford OX1 3PH, UK.b. Japan Synchrotron Radiation Research Institute (JASRI), 1-1-1 Kouto, Sayo, Hyogo 679-5198, Japanc. Department of Physics and Astronomy, Division of Molecular and Condensed Matter Physics, Uppsala University, Box 516, S-751 20 Uppsala, Sweden
Experimental
LMOF was synthesised using a mechanochemical ball-milling method. LiF (Sigma Aldrich, 99.995%), Li-
2O (Alfa Aesar, 99.5%) and Mn2O3 (Sigma Aldrich, 99.9%) were mixed by mortar and pestle in a 2:1:1
molar ratio and then sealed in air-tight zirconia jars in an argon-filled MBraun glovebox with H2O and
O2 less than 1 ppm. The mixture was then ball-milled for 18 hours at 750rpm in a Fritsch Pulverisette
7 planetary ball-mill. Milling was carried out in 5 minute intervals separated by 10 minute rests to
avoid excessive heat generation.
Free-standing electrodes were prepared by mixing 80 wt% active material, 10 wt% Carbon Super P
conductive additive and 10 wt % polytetrafluoroethylene (PTFE) binder in a mortar and pestle and
then calendared between rollers to a thickness of ~0.25mm and cut into squares approximately 25-50
mm2 in area. Sample loadings were typically 5-10 mg cm-2. Electrochemical testing was performed in
2032 coin cells using a Li-metal disk as a negative electrode and glass microfibre separators (Whatman)
soaked in LP30 electrolyte (BASF Selectilyte, 1M LiPF6 in 1:1 of EC:DMC). All electrode processing was
carried out under inert Ar atmosphere.
Powder X-ray Diffraction (PXRD) was performed using a Rigaku Smartlab diffractometer using Cu Kα1
radiation (λ = 1.54051 Å). The PXRD data were analysed using the Rietveld method of refinement and
FullProf Suite software.
Electronic Supplementary Material (ESI) for Energy & Environmental Science.This journal is © The Royal Society of Chemistry 2018
Page 2
Solid-state nuclear magnetic resonance (NMR) experiments were performed in a 3.2 mm probe-head
on a 400 MHz Bruker Avance III spectrometer at the 19F Larmor frequency of 376.6 MHz and 7Li of
155.5 MHz. Magic angle spinning (MAS) of 20 kHz was applied. The spectra were recorded with rotor-
synchronised Hahn-echo pulse sequence; the applied π/2 pulse length and the delay between π/2 and
π pulses were 2.5 μs and 46.3 μs, respectively for both 7Li and 19F. All samples were ground and packed
in an Ar-filled glovebox; The 19F and 7Li spectra were externally referenced with CFCl3 and 1 M LiCl
aqueous solution at 0.0 ppm.
For Inductively Coupled Plasma – Optical Emission Spectroscopy (ICP-OES) of the precursor mixture
and ball-milled material, 5mg of each powder were dissolved in concentrated aqua-regia and diluted
to 1:100 and 1:200 each. For ICP-OES on cathodes (see Table S1.) free-standing electrodes prepared
as discussed above were dissolved in concentrate aqua-regia, filtered using glass fiber membrane
syringe filters followed by dilution to 1:100 and 1:200. For ICP-OES on the residue collected after
cycling, the coin cells were disassembled in an Ar-filled glovebox, the cathode extracted and all the
remaining parts were washed with 1mL concentrated aqua-regia and 14mL 2% nitric acid. The Li anode
and black precipitate were completely dissolved. The entire liquid solution was mixed thoroughly and
a filtered sample diluted 1:30 with 2% nitric acid. This diluted sample was subjected to ICP-OES
analysis.
Operando electrochemical mass spectrometry (OEMS) analysis was carried out to study the different
gases generated during cell cycling. The set up consisted of a quadrupole mass spectrometer (Thermo
Fischer) equipped with turbomolecular pump (Pfeiffer Vacuum) and mass-flow controllers
(Bronkhorst). Two electrode type cells (ECC-Std from EL-CELL) with gas inlet and outlet ports were
used for the operando measurements. The cell consisted of Li anode, 1M LiPF6 in PC electrolyte and
the same cathode as described above.
Scanning Electron Microscopy (SEM) image was taken using a Zeiss Gemini SEM-500 at an operating
voltage of 3 keV. Pristine LMOF powder was loaded onto a stub topped with Copper tape.
Page 3
Soft X-ray Absorption Spectra (SXAS) and Resonant Inelastic X-Ray Scattering (RIXS) spectra were
recorded at beamline BL27SU of the RIKEN/JASRI Spring8 synchrotron in Japan. Ex situ cathode
samples were loaded onto adhesive copper tape and measured under 10-6 Pa high-vacuum conditions.
Iodometric Titration was carried out to determine Mn valence. A known mass of LMOF (approximately
5 mg) was completely dissolved in 25 mL of 1 M hydrochloric acid in deionised water that had been
degassed with Argon. A few drops of starch indicator and an excess of potassium iodide was added.
The mixture was constantly purged with Ar and stirred vigorously whilst titrating with 0.03 M sodium
thiosulphate in deionised water until the mixture was colourless. The concentration of the sodium
thiosulphate solution was standardised using potassium iodide.
Page 4
Supplementary Figures and Tables
Table S1 Crystal structure data for the pristine LMOF sample. Site occupancies were fixed to the
targeted composition, Li2MnO2F, and the cell parameter and peak width allowed to vary. The resulting
refinement gave cell parameter, a = 4.1176(5) with χ2 = 1.535.
Atom Wyckoff position x y z Occupancy
Li1 4a 0 0 0 0.667
Mn1 4a 0 0 0 0.333
O1 4b 0.5 0.5 0.5 0.667
F1 4b 0.5 0.5 0.5 0.333
Space group: Fm m a = b = c = 4.1176(5) Å α = β = γ = 90°3̅
Page 5
Figure S1 7Li MAS NMR spectra for a precursor mixture of LiF, Li2O and Mn2O3 ground together in a
mortar and pestle in a 2:1:1 ratio compared with that for the pristine LMOF. The left inset gives a
zoomed-in view of the spectrum of the ball-milled sample and the right inset gives a zoomed in view
of the isotropic shifts for the sharp peaks of both spectra. Spectra are normalised to account for
sample mass. The MAS rate was 20 kHz. The two intense chemical shifts from Li2O and LiF appear to
almost completely diminish to give a single shift near 0 ppm in the ball-milled material which we
attribute to Li in locally diamagnetic regions of the Rocksalt material which experience virtually no net
paramagnetic interactions from Mn. The much broader Gaussian peak of the ball-milled sample is
attributed to multiple overlapped Li sites, which are coupled with paramagnetic Mn.
Page 6
Figure S2 (a) 7Li and (b) 19F NMR spectra for solutions of the precursor mixture of LiF, Li2O and Mn2O3
ground together in a mortar and pestle in a 2:1:1 ratio compared with that for the pristine LMOF. Both
samples were completely dissolved in 12 M hydrochloric acid at concentrations of 0.644 and 0.636 mg
ml-1 respectively (= 0.988). From NMR peak intensities, scale factor of Precursors : Ball-milled = 0.952
in both Li and F.
(a)
(b)
Page 7
Table S2 Oxidation states for Mn measured using Iodometric Titration
Precursor Mixture Ball-milled3.001 3.2573.015 3.2863.003 3.2683.006 3.2662.990 3.282
3.003(8) 3.272(11)LiF + Li2O + Mn2O3 Li2MnO2.14F
Page 8
1 μm
Figure S3 Scanning Electron Microscopy (SEM) images of pristine LMOF. Image was taken at an
operating voltage of 3 keV using a Zeiss Gemini SEM-500.
Page 9
0 50 100 150 200 250 300
2.0
2.5
3.0
3.5
4.0
4.5
5.0
Volta
ge v
s Li
/Li+ (V
)
Capacity (mAh g-1)
1st5th
1st5th
2.0 2.5 3.0 3.5 4.0 4.5 5.0-400
-200
0
200
400 1 2 3 4 5
dQ/d
V (m
Ah
g-1 V
-1)
Voltage vs. Li/Li+ (V)
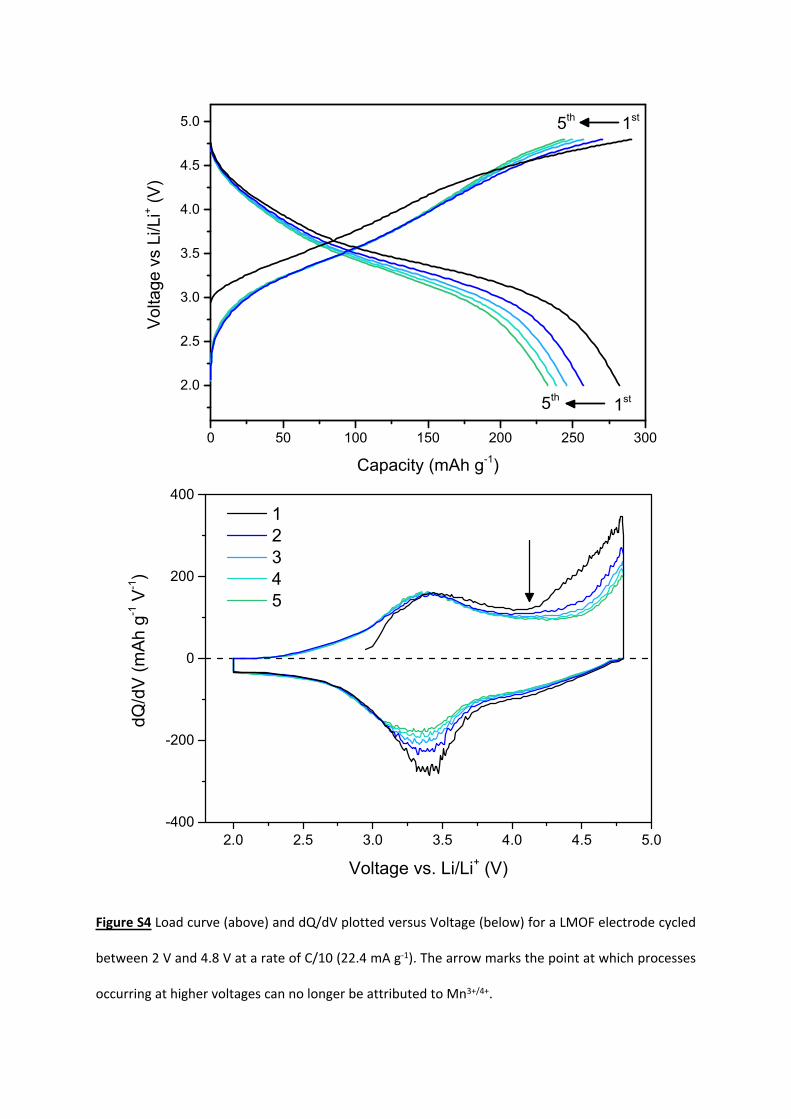
Figure S4 Load curve (above) and dQ/dV plotted versus Voltage (below) for a LMOF electrode cycled
between 2 V and 4.8 V at a rate of C/10 (22.4 mA g-1). The arrow marks the point at which processes
occurring at higher voltages can no longer be attributed to Mn3+/4+.
Page 10
Table S3 ICP-OES measurements yielding Li:Mn ratio for cathodes at different states of charge and
capacities calculated using Li:Mn ratio as obtained from ICP-OES. Electrode materials were charged at
a current rate of C/10 (22.4 mA g-1)
Before cycling Charged to 4.8V
Discharged to 2V
Li : Mn ratio from ICP-OES(error) 1.95(5) 0.67(5) 1.99(5)
Li content, x, in LixMn0.95O2.05F0.95 from ICP-OES (error) 1.85(5) 0.64(5) 1.89(5)
Li content, x, in LixMn0.95O2.05F0.95 from electrochemistry 1.90 0.65 1.85
Page 11
2.0
2.5
3.0
3.5
4.0
4.5
5.0
0 200 400 600 800 1000 12000.0
1.0
2.0
3.0
4.0
5.0
O2 (m/z = 32)
Time (Mins)
O2 F
lux
(x10
-8 m
ol m
in-1)
0.0
0.5
1.0
1.5
2.0 CO2 (m/z = 44)
CO
2 Flu
x (x
10-8 m
ol m
in-1)
Volta
ge v
s Li
/Li+
(V)
Figure S5 Operando Electrochemical Mass Spectrometry (OEMS) for the first charge and discharge
cycle between 2 V and 4.8 V at a current rate of C/10. At high potentials, some carbon dioxide gas
evolution was evolved, corresponding to 0.03 moles per mole of LMOF active material. Virtually no
oxygen loss was observed.
Page 12
Figure S6 Average discharge voltage as a function of cycle number at progressively faster C-rates C/10,
C/2 and 1C (224 mA g-1). Cells were cycled between 2 V and 4.8 V.
Page 13
Table S4 ICP-OES measurements on residue collected from coin cell components after disassembly
yielding the absolute loss of Mn from the cathode material into the electrolyte and deposited on the
anode. Cathode materials were cycled vs a Li metal anode between 2 – 4.8V at a current rate of C/2
(112 mA g-1) and extracted before washing the cell parts.
50 cycles 100 cycles
Mass of LMOF in Cathode (mg) 10.88 7.04
Mass of Mn in Cathode (mg) 4.989 3.228
Mn ICP Concentration (mg L-1) 0.441 0.552
Mass of Mn lost from Cathode (mg) 0.198 0.248
% loss of Mn from Cathode 3.97 7.68
% capacity loss 40.4 53.2
Page 14
0 50 100-60
-50
-40
-30
-20
-10
0
Per
cent
age
Cha
nge
Cycle Number
Mn loss from Cathode Capacity loss
Figure S7 Comparison of Mn lost from Cathode as measured by ICP-OES with capacity loss as a function
of cycle number.