Page 1
1
Supplementary Information
Facile Synthesis and Characterization of Symmetric N-[(Phenylcarbonyl)
carbamothioyl]benzamide Thiourea: Experimental and Theoretical Investigations
Rafael G. Silveira,a,b
Anderson J. L. Catão,a Beatriz N. Cunha,
a,b Fernando Almeida,
c
Rodrigo S. Correa,d Luan F. Diniz,
e Juan C. Tenório,
e Javier Ellena,
e Aleksey E. Kuznetsov,
f
Alzir A. Batista*,a and Edésio Alcântara
g
aDepartamento de Química, Universidade Federal de São Carlos, 13565-905 São Carlos-SP, Brazil
bInstituto Federal Goiano, Campus Ceres, 76300-000 Ceres-GO, Brazil
cInstituto de Ciências Biomédicas, Universidade de São Paulo, 05508-900 São Paulo-SP, Brazil
dDepartamento de Química, Instituto de Ciências Exatas e Biológicas,
Universidade Federal de Ouro Preto, 35400-000 Ouro Preto-MG, Brazil
eInstituto de Física de São Carlos, Universidade de São Paulo, 13560-970 São Carlos-SP, Brazil
fInstituto de Química, Universidade de São Paulo, 05508-000 São Paulo-SP, Brazil
gInstituto de Química, Universidade Federal de Goiás, 74001-970 Goiânia-GO, Brazil
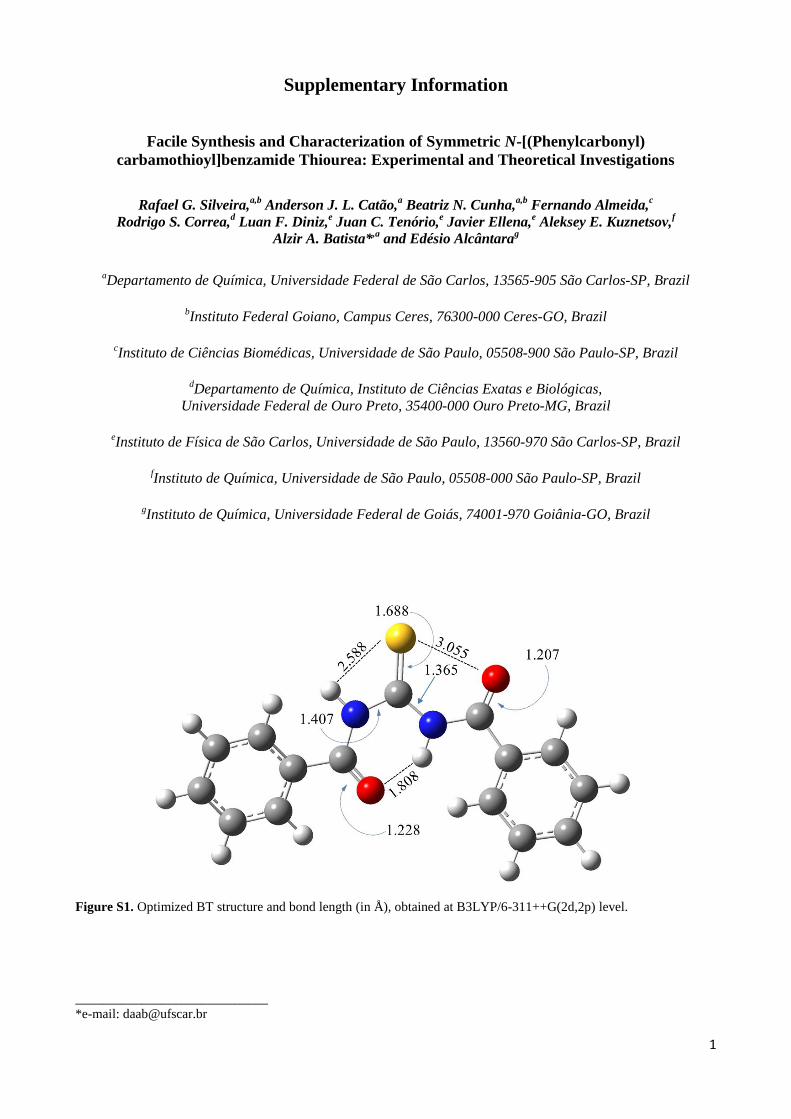
Figure S1. Optimized BT structure and bond length (in Å), obtained at B3LYP/6-311++G(2d,2p) level.
_____________________________
*e-mail: [email protected]
Page 2
2
Figure S2. 1H-
1H COSY experiments (400.21 MHz, CD2Cl2) of BT.
Page 3
3
Figure S3. 1H-
13C HSQC experiments (400.21 MHz, CD2Cl2) of BT.
Page 4
4
Figure S4. Spectrum of mass (full scan MS) of BT.
Figure S5. Spectrum of mass (MS/MS) of BT.
Page 5
5
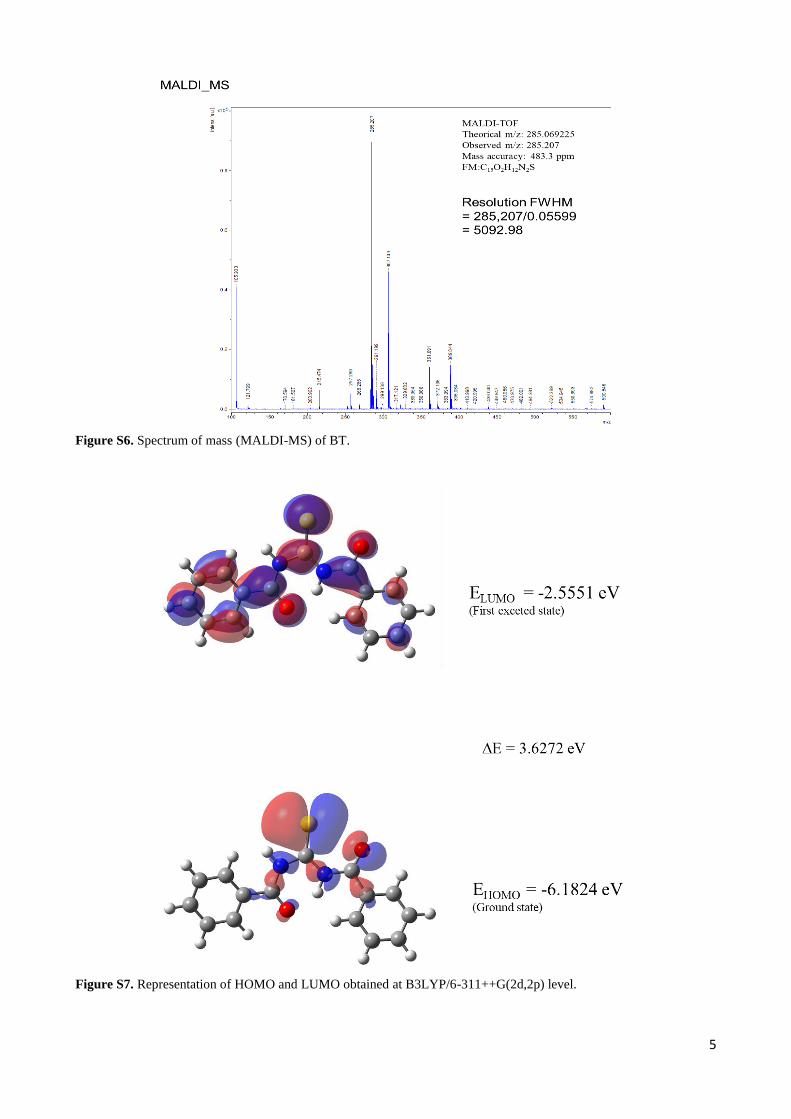
Figure S6. Spectrum of mass (MALDI-MS) of BT.
Figure S7. Representation of HOMO and LUMO obtained at B3LYP/6-311++G(2d,2p) level.
Page 6
6
NBO analysis
The data of NBO analysis showed that in cis conformation there are two equivalent resonant systems, while in
trans, there is only one and the electronic density more localized resulting in a more negative charge. Furthermore, the
charge on oxygen atom that forms the intramolecular hydrogen bond is more negative in trans structure when compared
to the cis form. However, an opposite relation is found for hydrogen atom of the intramolecular hydrogen bond, i.e., it is
more positive in trans configuration, which means that the hydrogen becomes more acid, as expected by the weakening
of NH bond due to the formation of NH---O bond.
Figure S8. Graphs of (a) trans-BT and (b) cis-BT with critical points represented by purple (nucleic critical point,
NCP), by orange (bond critical point, BCP) and yellow (ring critical point, RCP). Paths are represented by solid lines.
The stabilization energy associated with delocalization ("2e-stabilization") is shown in Tables S5 and S6 for
the most important NBO donor and acceptor.
Under topological analysis, trans-BT and cis-BT wave functions reveals the same number and same types of
critical points, 32 nucleic critical point (NCP), 35 bond critical point (BCP) and 4 ring critical point (RCP).
Nonetheless, cis-BT form presents two equivalent BCP between sulfur atom and the two oxygen atoms, while trans-BT
has only one. This additional BCP, which in trans system appears in other spatial region, confers two equivalent RCP
that involve S–C–N–C–O fragment, indicating a delocalization of electronic density around this whole region. As in
trans form there is only one of this S–C–N–C–O fragment, it is expected that charge delocalization would be smaller
than in cis configuration. Figure S8 shows the graphs of cis-BT and trans-BR with all critical points and paths
connecting them. In cis-BT, the path between the critical point in oxygen atom and sulfur atom has length of 3.05 and
3.11 Å, respectively. In trans-BT, the path between the CP in oxygen atom and the BCP on the line of hydrogen atom
has a length of 1.14 Å and the complement (from BCP until hydrogen NCP) is 0.64 Å, meaning that the distance
between the two attractor, bond distance, is 2.04 Å, which is an usual length of a hydrogen bond.
The electronic density (ρ) and the electron localization function (ELF) of those critical points are present in
Figures S9 and S10 and Table S7, which show a contour map of the Laplacian of electronic density for both forms, cis
and trans, that indicates the presence of a intramolecular hydrogen bond, in trans form, and the presence of a resonance
structure formed by the S–C–N–C–O fragment, in cis. The higher ρ and ELF values obtained at BCP of O–H–N region
display a concentration of charge in the interatomic O–H region and indicates that there is a stronger interaction
Page 7
7
between the oxygen atom and the proton. The other bonding regions, which exhibit ρ(rc) around 0.01 and ELF ranging
from 0.02 to 0.04, indicate a moderate interaction and partially covalent nature (van der Waals interaction).
Figure S9. Contour map of the Laplacian of electronic density (ρ(r)) for the trans-BT with the bond paths linking the
N1, H1 and O2 nuclei and the bond critical point superimposed.
Figure S10. Contour map of the Laplacian of electronic density (ρ(r)) for the cis-BT with the bond paths closing the
two (a, b) S–C–N–C–O systems and forming a RCP.
Page 8
8
Table S1. 1H and
13C NMR data summary
Carbon Chemical shift Proton Chemical shift Multiplicity
2 128.15 4H 8.03 m
3 129.60 4H 7.61 m
4 132.60 2H 7.72 m
1 134.17 –
5 166.09 –
6 177.80 –
Nitrogen
2H 11.75
Table S2. Vibrational assignments and calculated wave numbers of BT at B3LYP/6-311++G(2d,2p)
Mode No. Unscaled IR
freq. / cm-1
Scaled IR
freq. / cm-1
Iinfrared
/
(kM mol-1
)
Scaled Raman
freq. / cm-1
Raman
intensity IR and Raman assignments
1 10.13 10.01 0.01 10.33 3.06 CCNC
2 25.70 25.38 0.65 26.19 2.77 CCNC
3 38.30 37.83 0.24 39.03 1.57 CCNC
4 39.26 38.79 0.72 40.02 2.89 CCCN
5 51.23 50.60 1.3 52.21 1.07 s CNC + CNCN CCCN
6 98.31 97.12 4.53 100.20 1.70 CNCN
7 114.25 112.85 0.25 116.44 1.27 CNCN
8 119.91 118.45 2.17 122.21 0.64 CNCN
9 171.62 169.53 1.11 174.92 3.04 CCCC
10 187.05 184.77 6.08 190.65 1.31 CCNC + CCCC
11 207.62 205.09 0.61 211.61 1.60 s NCS
12 215.47 212.84 1.13 219.61 2.50 CCNC + CCCC
13 278.56 275.16 11.05 283.91 1.65 νs NC + νs CC + νs NC + s NCO + s CCC
14 328.78 324.77 3.15 335.10 0.58 NCO + s CCC + NCN + CNC
15 384.23 379.54 8.51 391.62 5.16 s NCN + NCO
16 410.82 405.81 0.17 418.72 0.49 CCCC
17 411.24 406.22 0.08 419.14 0.93 CCCC + HCCC
18 423.25 418.09 0.76 431.39 1.60 CCCC (ring puckering)
19 440.82 435.44 0.85 449.29 0.18 CCCC (ring puckering)
20 456.11 450.54 13.64 464.87 0.61 CCCC + CCC + NCO + NCS + CNC +CCN
21 480.40 474.54 1.32 489.63 0.95 CCCC + CCC
22 541.04 534.44 31.48 551.44 2.05 s CCN
23 628.48 620.81 19.15 640.56 0.42 HNCC + CCC
24 633.82 626.09 1.29 646.00 8.71 s CCC
25 634.73 626.99 2.45 646.93 2.91 SNNC + s CCC
Page 9
9
Mode No. Unscaled IR
freq. / cm-1
Scaled IR
freq. / cm-1
Iinfrared
/
(kM mol-1
)
Scaled Raman
freq. / cm-1
Raman
intensity IR and Raman assignments
26 673.41 665.19 13.48 686.35 6.30 HNCN +s CCC
27 681.08 672.77 26.91 694.17 7.59 HNCN + s CCC
28 698.61 690.09 3.17 712.04 0.12 HCCC + CCCC
29 703.18 694.61 28.22 716.70 0.20 HCCC + CCCC
30 705.24 696.63 20.34 718.79 0.85 CCC
31 714.87 706.15 102.27 728.61 0.15 HCCC
32 717.47 708.72 17.28 731.26 0.38 HCCC
33 797.90 788.17 27.94 813.24 9.11 HNCC
34 802.32 792.53 32.1 817.74 15.47 HCCC + νs SC + νas CC + νs N-C
35 816.05 806.09 18.57 831.73 17.10 νs SC + νas CC + νs NC + HCCC + ONCC
36 823.89 813.83 14.09 839.72 5.00 HNCC + HCCC
37 858.36 847.89 1.1 874.86 1.62 HCCC
38 860.27 849.77 0.87 876.80 0.68 HCCC
39 880.86 870.11 1.41 897.79 49.05 CNC + νs NC
40 928.26 916.93 60.19 946.10 0.83 s NCO + s NCN + νas NC + νs CC
41 953.09 941.46 1.51 971.41 0.28 HCCC
42 954.10 942.46 2.87 972.44 0.91 HCCC
43 999.56 987.36 1.69 1018.77 0.18 HCCC + HCCC
44 1000.90 988.69 0.63 1020.14 0.14 HCCC + HCCC
45 1018.49 1006.06 0.45 1038.06 0.11 HCCC
46 1019.47 1007.04 3.59 1039.07 11.43 s CCC + νs CC
47 1019.69 1007.25 1.54 1039.28 80.74 s CCC + νs CC
48 1020.42 1007.98 1.9 1040.04 42.70 s CCC + HCCC + νs CC
49 1047.05 1034.27 20.35 1067.17 5.30 νs C-C + CCC
50 1050.35 1037.54 7.14 1070.54 48.14 νs C-C + CCC
51 1086.29 1073.04 47.64 1107.17 6.77 νas NC + νs CC + s HCC
52 1094.54 1081.19 58.87 1115.58 19.08 νs NC + νas SC + νas CC
53 1111.56 1098.00 29.94 1132.92 4.84 HCC
54 1119.17 1105.52 3.55 1140.68 27.20 HCC + νas CC + νs NC
55 1167.54 1153.29 164.91 1189.98 44.85 νs NC
56 1186.27 1171.79 9.21 1209.07 6.86 νas CC
57 1188.13 1173.63 1.13 1210.96 7.34 s HCC
58 1210.75 1195.98 43.96 1234.02 10.72 s HCC + νas CC
59 1216.44 1201.60 19.5 1239.82 0.67 s HCC
60 1250.18 1234.93 133.22 1274.21 219.07 νs CC + νas NC + HNC
61 1254.31 1239.01 520.22 1278.42 111.81 νas CC + νas NC
62 1322.10 1305.97 268.25 1347.51 53.63 νas NC + νs CC
Page 10
10
Mode No. Unscaled IR
freq. / cm-1
Scaled IR
freq. / cm-1
Iinfrared
/
(kM mol-1
)
Scaled Raman
freq. / cm-1
Raman
intensity IR and Raman assignments
63 1331.89 1315.64 10.63 1357.48 3.95 ν asym CC
64 1341.58 1325.21 316.01 1367.36 51.14 νas NC + νas CC
65 1362.32 1345.70 7.55 1388.50 2.53 νas CC
66 1369.77 1353.06 28.42 1396.10 8.65 s HCC
67 1482.07 1463.99 17.2 1510.55 8.84 s CCC + HCC
68 1483.85 1465.74 0.7 1512.37 10.06 νas CC + νs N-C + s CCC + HCC
69 1517.58 1499.07 306.7 1546.75 4.85 s HNC s + s HCC
70 1531.41 1512.73 56.74 1560.85 14.85 s HNC + s HCC
71 1537.37 1518.62 147.41 1566.92 25.48 s HNC + s HCC
72 1588.60 1569.22 1039.43 1619.14 184.87 s HNC
73 1617.82 1598.08 10.38 1648.91 7.03 νs CC
74 1620.20 1600.44 11.82 1651.34 12.05 νas CC
75 1639.13 1619.14 18.63 1670.64 238.46 νas CC
76 1640.20 1620.19 27.38 1671.72 175.34 νas CC + s HCC
77 1699.07 1678.34 189.35 1731.72 126.67 νs OC
78 1769.28 1747.69 139.67 1803.29 209.58 νs OC
79 3172.66 3133.96 2.64 3233.64 39.80 νas CH
80 3172.73 3134.02 0.02 3233.71 35.62 νas CH
81 3179.56 3140.77 2.05 3240.67 82.99 νas CH
82 3182.27 3143.44 5.35 3243.43 139.41 νas CH
83 3189.97 3151.05 11.64 3251.28 45.05 νas CH
84 3190.21 3151.29 10.6 3251.52 89.30 νas CH
85 3198.70 3159.68 10.61 3260.18 244.32 νs CH
86 3199.79 3160.75 9.08 3261.29 248.42 νs CH
87 3211.08 3171.90 6.09 3272.80 114.06 νs CH
88 3211.23 3172.06 4.44 3272.95 149.11 νs CH
89 3396.14 3354.71 277.99 3461.41 218.89 νs NH
90 3611.76 3567.70 33.1 3681.18 92.14 νs NH
Table S3. Natural atomic charges of BT molecule in implicit solvent (acetone)
Atom cis-BT trans-BT Difference
S1 0.03229 –0.16197 0.19426
O2 –0.55255 –0.64534 0.09279
C1 0.22701 0.29557 –0.06856
H1 0.38711 0.44475 –0.05764
H2 0.38711 0.43123 –0.04412
O1 –0.55254 –0.59597 0.04343
N2 –0.64875 –0.62199 –0.02676
C2 0.68597 0.70678 –0.02081
C9 0.68597 0.70541 –0.01944
N1 –0.64874 –0.64795 –0.00079
Page 11
11
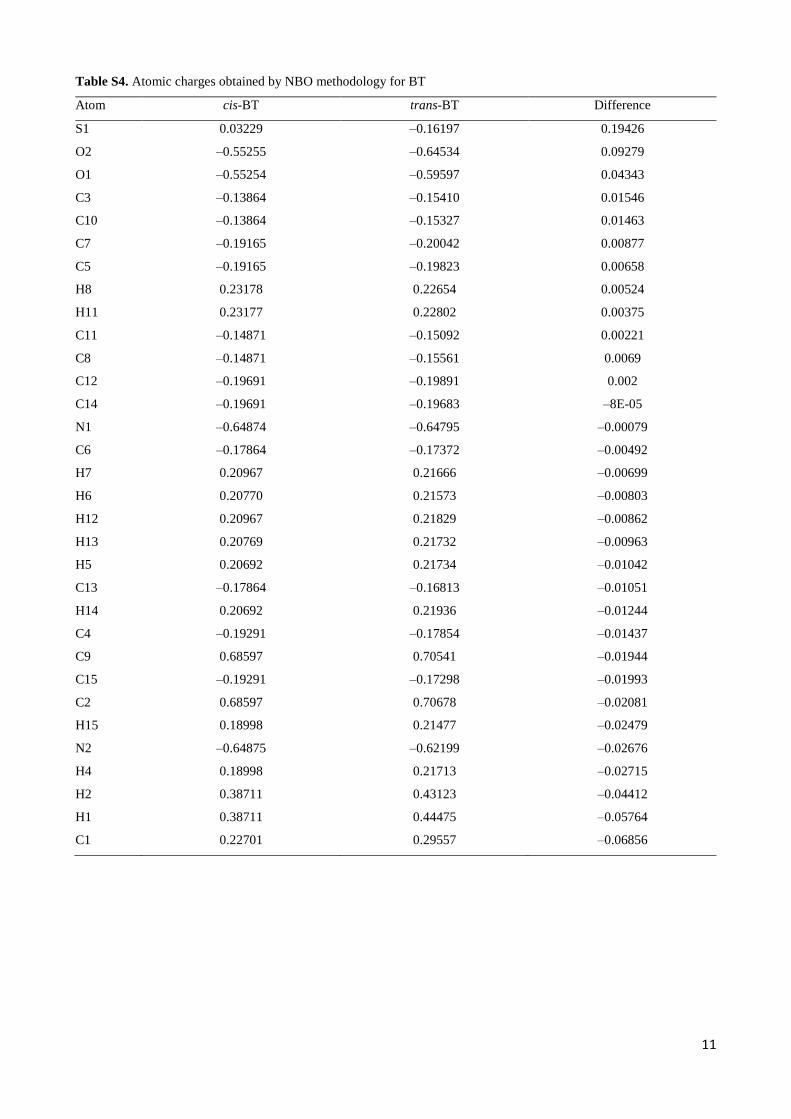
Table S4. Atomic charges obtained by NBO methodology for BT
Atom cis-BT trans-BT Difference
S1 0.03229 –0.16197 0.19426
O2 –0.55255 –0.64534 0.09279
O1 –0.55254 –0.59597 0.04343
C3 –0.13864 –0.15410 0.01546
C10 –0.13864 –0.15327 0.01463
C7 –0.19165 –0.20042 0.00877
C5 –0.19165 –0.19823 0.00658
H8 0.23178 0.22654 0.00524
H11 0.23177 0.22802 0.00375
C11 –0.14871 –0.15092 0.00221
C8 –0.14871 –0.15561 0.0069
C12 –0.19691 –0.19891 0.002
C14 –0.19691 –0.19683 –8E-05
N1 –0.64874 –0.64795 –0.00079
C6 –0.17864 –0.17372 –0.00492
H7 0.20967 0.21666 –0.00699
H6 0.20770 0.21573 –0.00803
H12 0.20967 0.21829 –0.00862
H13 0.20769 0.21732 –0.00963
H5 0.20692 0.21734 –0.01042
C13 –0.17864 –0.16813 –0.01051
H14 0.20692 0.21936 –0.01244
C4 –0.19291 –0.17854 –0.01437
C9 0.68597 0.70541 –0.01944
C15 –0.19291 –0.17298 –0.01993
C2 0.68597 0.70678 –0.02081
H15 0.18998 0.21477 –0.02479
N2 –0.64875 –0.62199 –0.02676
H4 0.18998 0.21713 –0.02715
H2 0.38711 0.43123 –0.04412
H1 0.38711 0.44475 –0.05764
C1 0.22701 0.29557 –0.06856
Page 12
12
Table S5. NBO analysis of BT in configuration trans
Donor NBO Occupancy Acceptor NBO Occupation Stabilization energy / (kcal mol-1
)
nN2 1.62255
π*(C12–O30) 0.29969 57.05
nN2 π*(C13–S32) 0.41252
62.62
nN1 1.60188
π*(C13–S32) 79.80
nN1 π*(C14–O31) 0.24623 46.18
nO2
1.86290
π*(C1–C12) 0.05848 17.74
nO2 π*(C12–N26) 0.07853 22.69
nO2 σ*(N28–H29) 0.05473 12.88
Table S6. NBO analysis of BT in configuration cis
Donor NBO Occupation Acceptor NBO Occupation Stabilization energy / (kcal mol-1
)
nN2 1.66746
π*(C12–O30) 0.24176 47.49
nN2 π*(C13–S32) 0.31106
45.01
nN1 1.66745
π*(C13–S32) 45.02
nN2 π*(C14–O31) 0.24176 47.49
nO2 1.85867 π*(C12–N26) 0.08879 30.24
nO1 1.85867
π*(C14–C15) 0.06713 19.25
nO1 π*(C14–N28) 0.08879 30.24
Table S7. Electronic density and electron localization function at the BCP and RCP (all quantities are in atomic units)
Molecule CP Region ρ(rc) / a.u. ELF / a.u.
trans-BT
BCP O–H–N 0.0401 0.1374
BCP S---O 0.0130 0.0432
RCP O–C–N–C–N–H 0.0180 0.0215
RCP S–C–N–C–O 0.0124 0.0254
cis-BT
BCP S–O (1) 0.0133 0.0448
BCP S–O (2) 0.0122 0.0363
RCP S–C–N–C–O (1) 0.0121 0.0274
RCP S–C–N–C–O (2) 0.0124 0.0240
CP: critical point; BCP: bond critical point; RCP: ring critical point; ρ(r): electron density distribution function (a.u.:
atomic units); ELF: electron localization function.
Page 13
13
Table S8. Natural atomic charges of BT molecule in implicit solvent (acetone)
Atom cis-BT trans-BT Difference
S1 0.03229 –0.16197 0.19426
O2 –0.55255 –0.64534 0.09279
C1 0.22701 0.29557 –0.06856
H1 0.38711 0.44475 –0.05764
H2 0.38711 0.43123 –0.04412
O1 –0.55254 –0.59597 0.04343
N2 –0.64875 –0.62199 –0.02676
C2 0.68597 0.70678 –0.02081
C9 0.68597 0.70541 –0.01944
N1 –0.64874 –0.64795 –0.00079