www.sciencemag.org/cgi/content/full/336/6086/1275/DC1 Supplementary Materials for The Stomatopod Dactyl Club: A Formidable Damage-Tolerant Biological Hammer James C. Weaver, Garrett W. Milliron, Ali Miserez, Kenneth Evans-Lutterodt, Steven Herrera, Isaias Gallana, William J. Mershon, Brook Swanson, Pablo Zavattieri, Elaine DiMasi, David Kisailus * *To whom correspondence should be addressed. E-mail: [email protected]Published 8 June 2012, Science 336, 1275 (2012) DOI: 10.1126/science.1218764 This PDF file includes: Materials and Methods Figs. S1 to S6 References (38–40)
The Stomatopod Dactyl Club: A Formidable Damage-Tolerant Biological Hammer
James C. Weaver, Garrett W. Milliron, Ali Miserez, Kenneth Evans-Lutterodt, Steven Herrera, Isaias Gallana, William J. Mershon, Brook Swanson, Pablo Zavattieri, Elaine
DiMasi, David Kisailus*
*To whom correspondence should be addressed. E-mail: [email protected]
Published 8 June 2012, Science 336, 1275 (2012)
DOI: 10.1126/science.1218764
This PDF file includes:
Materials and Methods Figs. S1 to S6 References (38–40)
The Stomatopod Dactyl Club: A Formidable Damage-Tolerant Biological Hammer
James C. Weaver*1, Garrett W. Milliron*2, Ali Miserez*3, Kenneth Evans-Lutterodt4, Steven Herrera2, Isaias Gallana5, William J. Mershon6, Brook Swanson7, Pablo Zavattieri5, Elaine
DiMasi4, and David Kisailus #,2
Affiliations: 1 Wyss Institute for Biologically Inspired Engineering, Harvard University, Cambridge, MA 01238 2Department of Chemical and Environmental Engineering, University of California, Riverside, Riverside, CA 92521 3School of Materials Science and Engineering and School of Biological Sciences, Nanyang Technological University, Singapore 639798 4National Synchrotron Light Source, Brookhaven National Laboratory, Upton, NY 11973 5College of Engineering, Purdue University, West Lafayette, IN 47907 6Tescan-USA, Cranberry Township, PA 16066 7Biology Department, Gonzaga University, Spokane, WA 99258 * These authors contributed equally to this study # Corresponding author Supplemental Online Material (SOM) Materials and Methods:
(A) Specimen Handling and Sample Preparation Live specimens of Odontodactylus scyllarus from the tropical Indo-Pacific were obtained through commercial
sources and maintained live in a recirculating seawater system until ready for use. The dactyl clubs were dissected from these specimens and rinsed in fresh seawater to remove any loose organic debris. The samples were then rinsed briefly in deionized water to remove any residual salt and then air dried at 30 ºC. The resulting samples were either imaged in their entirety for whole-club scanning electron microscopy (SEM) or imbedded in Epofix resin for the preparation of cross-sections. The obtained resin blocks were manually trimmed down to the desired imaging plane with a diamond saw and polished to P1200 with progressively finer grades of silicon carbide paper and then with polycrystalline diamond suspensions down to 100 nm to obtain a smooth finish. The resulting samples were imaged either by optical microscopy, backscattered scanning electron microscopy, Energy Dispersive Spectroscopy (EDS), or subjected to nanomechanical testing. In total, the dactyl clubs from more than 15 different individuals were investigated and the results reported here are representative of the trends observed. (B) Scanning Electron Microscopy (SEM) and Energy Dispersive Spectroscopy (EDS)
Whole or polished dactyl club samples were gold or carbon coated and examined with an FEI XL-40, a Tescan VEGA TS-5130MM, or a Tescan VEGA XMU scanning electron microscope equipped with an Oxford Instruments (X-Act) energy dispersive spectrometer. EDS line scans and compositional maps were acquired at a 20 kV accelerator voltage. (C) Nano-Mechanical Testing
Nanoindentation studies were performed on transverse cross-sections through the center of the dactyl club in ambient air using a Triboindenter nanomechanical testing system (Hysitron, Minneapolis, MN, USA) equipped with a Berkovich tip at a peak force of 5 mN. The load function consisted of a 5-second loading to 5 mN, followed by a 5-second hold at that force, and then a 5-second unloading. The hardness and reduced modulus were calculated from the unloading curve of each, using the Oliver-Pharr method (38).
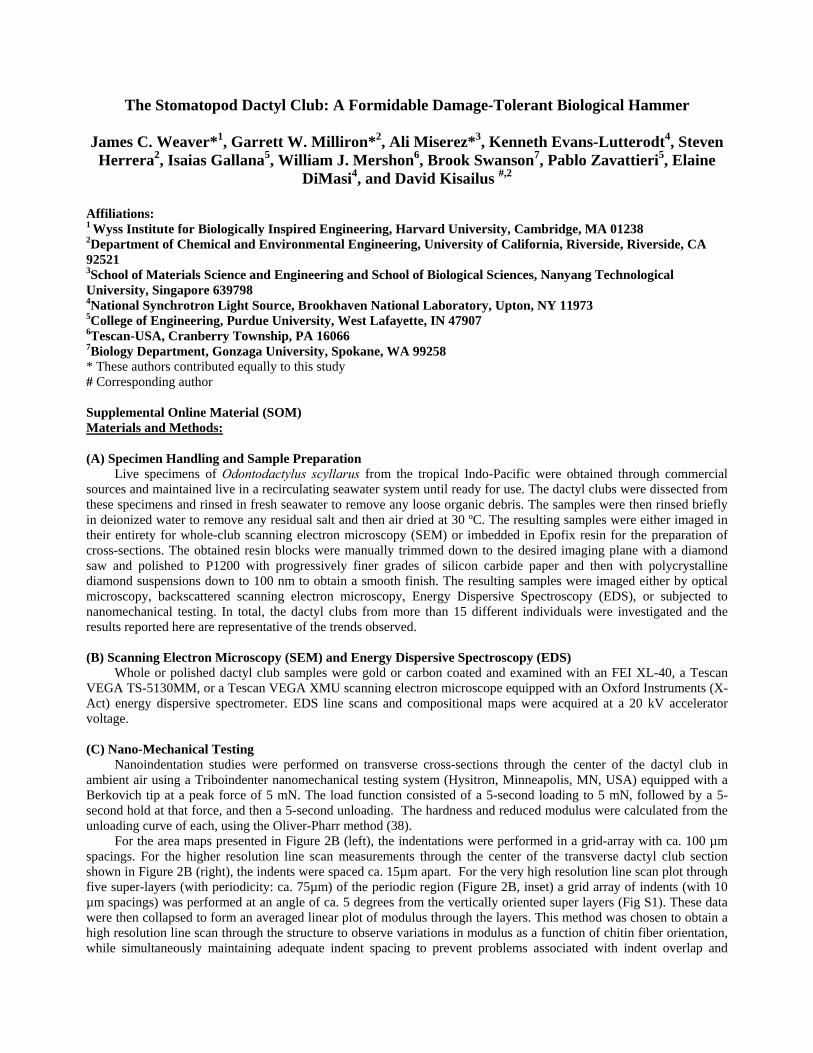
For the area maps presented in Figure 2B (left), the indentations were performed in a grid-array with ca. 100 µm spacings. For the higher resolution line scan measurements through the center of the transverse dactyl club section shown in Figure 2B (right), the indents were spaced ca. 15µm apart. For the very high resolution line scan plot through five super-layers (with periodicity: ca. 75µm) of the periodic region (Figure 2B, inset) a grid array of indents (with 10 µm spacings) was performed at an angle of ca. 5 degrees from the vertically oriented super layers (Fig S1). These data were then collapsed to form an averaged linear plot of modulus through the layers. This method was chosen to obtain a high resolution line scan through the structure to observe variations in modulus as a function of chitin fiber orientation, while simultaneously maintaining adequate indent spacing to prevent problems associated with indent overlap and
subsequent damage-induced changes in the local mechanical properties of the sample. Similar indentation measurements were also performed on samples that had remained hydrated using rows of
intents that crossed from the outer impact surface into the periodic region. These measurements were performed to investigate the possible influence that sample dehydration might have on the measured mechanical properties. Elongated fluid-cell tips were employed for these measurements, and the sample was maintained inside a custom-made glass container that kept the sample surface hydrated at all times during indentation. Because the periodic region was significantly softer in hydrated conditions, a lower maximum peak load of 3mN was applied so that indentation curves remained within the limit of the displacement transducer. These results revealed a direct correlation between the extent of mineralization and the effects of hydration on the observed mechanical properties of the dactyl club. While there was no detectable difference in the modulus of the outer impact surface between the dry and hydrated conditions, there was approximately a one fifth modulus reduction within the bulk of the impact region and a two thirds modulus reduction within the periodic region in the dry vs. hydrated states. The obtained hydrated sample values were subsequently used for the finite element simulation studies discussed in section (F). (D) Synchrotron X-Ray Diffraction Studies
Synchrotron X-ray data was collected at Beamline X13B at the National Synchrotron Light Source, Brookhaven National Laboratory, using 19 keV X-rays (λ = 0.65 Å) and a beam spot focused to ca. 5 μm × 5 μm. Specimens consisting of dactyl clubs embedded in Epofix resin were sliced with a diamond saw to create 0.5 mm thick slices which were then mounted onto the beamline sample holder in transmission geometry. Transmitted X-ray intensity was recorded using a photodiode detector fixed beyond the sample at the beam stop and normalized by incident intensity measured with an upstream ion chamber. Diffraction data were acquired with a Princeton Instruments CCD detector approximately 15 cm beyond the sample. Frames were not corrected for spatial distortions within the detector optical taper. Using a sintered corundum standard, the software package Datasqueeze, and a JCPDS data card for corundum, we calibrated detector pixel positions to Q-values and subsequently re-refined the data using the hydroxyapatite (002) peak as an internal standard. A representative diffraction pattern from the impact region illustrating the (002) oriented hydroxyapatite crystallites is shown in Figure 3A. The plots in Figure 3B were generated by integrating around the azimuthal coordinate (0-360 degrees χ) to produce intensity vs. Q plots with Q ranging from 0 to 3 (Å-1). Diffraction patterns were acquired from the dactyl club impact and periodic regions as well as a hydroxyapatite mineral standard, a dried bovine bone sample, and a commercially available crustacean chitin standard from MP biomedical (Catalog Number 101334).
For the X-ray composition maps shown in figure 3C, a 31x25 mesh of diffractograms was acquired from a dactyl club, with each spot separated by 100 μm in both directions for a total of 775 diffraction patterns. For mapping the hydroxyapatite and amorphous phase distributions shown in Figure 3C, we integrated the areas under the highlighted zones of the impact and periodic region diffraction patterns in Figure 3B, which predominately corresponded to the (211), (112), and (300) reflections of hydroxyapatite and a broad amorphous hump in the periodic region. These data were collected for each diffractogram and their relative concentrations were normalized to 100% intensity. The orientation of the hydroxyapatite crystallites was determined by approximating the preferred orientation in χ of the (002) reflection for each diffractogram (Figure 3A) and its relative angle was denoted as a sloping black line through each pixel of the hydroxyapatite distribution map. The resulting data sets were plotted independently and then combined in the lower left of Figure 3C so that a direct comparison could be made to the obtained X-ray transmission data.
The orientation of chitin fibers was measured using the techniques detailed in (24) and more generally (25), by assuming that crystalline chitin grains exhibit fiber symmetry (a preferred c-axis but no preferred orientation within the plane normal to that axis), while the arrangement of the grains breaks this symmetry, with an angle μ between the fiber axis and a reference axis (the transmitted X-ray beam direction) that can vary from place to place within the sample. First, the (110) reflection of chitin was identified, and intensity vs. Q plots as a function of detector azimuth χ were generated, integrated over a range of Q which bounded this reflection (Q = 1.3-1.4 Å-1). As the fibers deviate from orthogonality with the beam, the location of their reflections on the detector do not remain separated by 180° in χ but have centroids displaced by an angle η. Diffracted peaks will obey:
cos(η) = tan(θ)/tan(μ),
where θ is one-half the Bragg scattering angle. Representative data are shown in the 3 plots of figure 4E, with the blue plot displaying peaks separated by 180 degrees χ, and the green and red plots displaying a varying distance between peaks due to the nonzero η values. Using the python programming language to automatically analyze a batch of plots, each plot was reduced to only consider points within the top 50 percent of intensity values. Using known approximate
locations for peaks, the script found average peak positions weighted by intensity within the known regions. This produced two peak locations in χ for each diffractogram. The resulting measured η values were used to determine the fiber orientation angle μ for each diffraction pattern. Solving for μ provides one of the two angular coordinates needed to represent the average direction of the chitin fibers within the diffraction volume. The orthogonal coordinate, which represents the angle around the beam, is given by the midpoint between the two acquired peaks' positions.
Figure 4D depicts both angular coordinates calculated from each diffractogram as colored bars using the vpython graphics library. The result is a constant helical pitch (curved white lines), except where chitin fibers become parallel with the beam, where invalid assumptions in the rendering produce errors creating deviations in orientation. (E) 3D Modeling of the Helicoidal Architecture
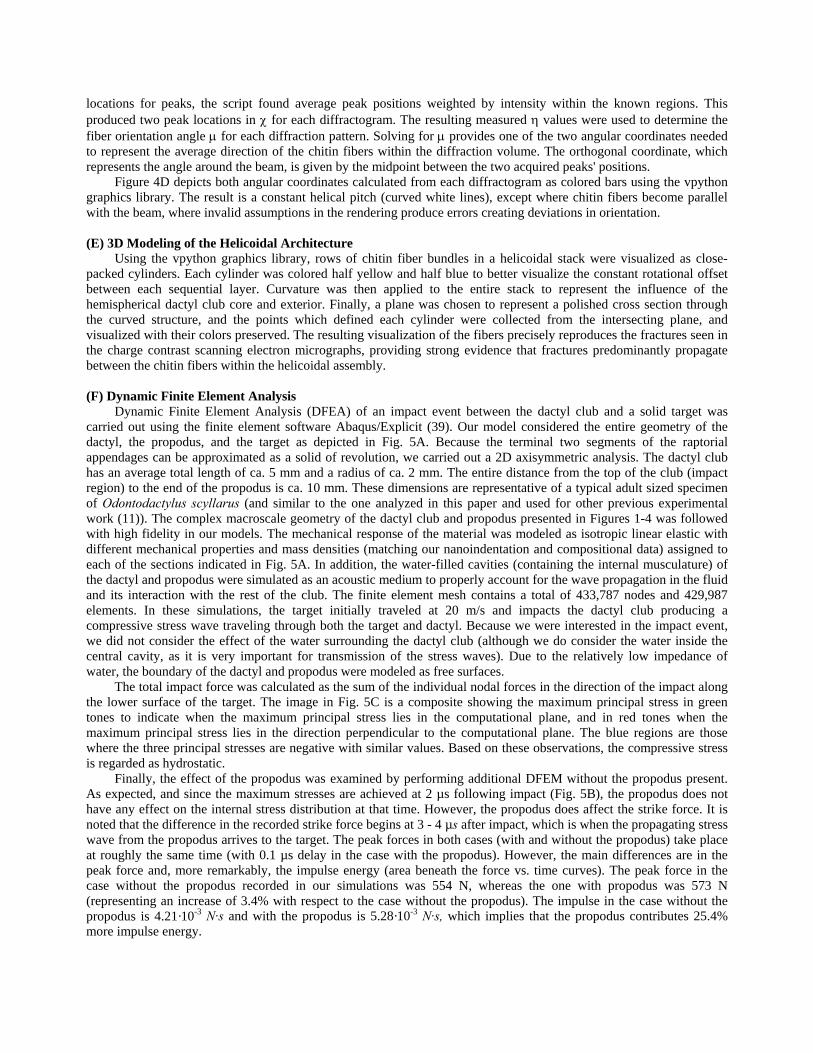
Using the vpython graphics library, rows of chitin fiber bundles in a helicoidal stack were visualized as close-packed cylinders. Each cylinder was colored half yellow and half blue to better visualize the constant rotational offset between each sequential layer. Curvature was then applied to the entire stack to represent the influence of the hemispherical dactyl club core and exterior. Finally, a plane was chosen to represent a polished cross section through the curved structure, and the points which defined each cylinder were collected from the intersecting plane, and visualized with their colors preserved. The resulting visualization of the fibers precisely reproduces the fractures seen in the charge contrast scanning electron micrographs, providing strong evidence that fractures predominantly propagate between the chitin fibers within the helicoidal assembly. (F) Dynamic Finite Element Analysis
Dynamic Finite Element Analysis (DFEA) of an impact event between the dactyl club and a solid target was carried out using the finite element software Abaqus/Explicit (39). Our model considered the entire geometry of the dactyl, the propodus, and the target as depicted in Fig. 5A. Because the terminal two segments of the raptorial appendages can be approximated as a solid of revolution, we carried out a 2D axisymmetric analysis. The dactyl club has an average total length of ca. 5 mm and a radius of ca. 2 mm. The entire distance from the top of the club (impact region) to the end of the propodus is ca. 10 mm. These dimensions are representative of a typical adult sized specimen of Odontodactylus scyllarus (and similar to the one analyzed in this paper and used for other previous experimental work (11)). The complex macroscale geometry of the dactyl club and propodus presented in Figures 1-4 was followed with high fidelity in our models. The mechanical response of the material was modeled as isotropic linear elastic with different mechanical properties and mass densities (matching our nanoindentation and compositional data) assigned to each of the sections indicated in Fig. 5A. In addition, the water-filled cavities (containing the internal musculature) of the dactyl and propodus were simulated as an acoustic medium to properly account for the wave propagation in the fluid and its interaction with the rest of the club. The finite element mesh contains a total of 433,787 nodes and 429,987 elements. In these simulations, the target initially traveled at 20 m/s and impacts the dactyl club producing a compressive stress wave traveling through both the target and dactyl. Because we were interested in the impact event, we did not consider the effect of the water surrounding the dactyl club (although we do consider the water inside the central cavity, as it is very important for transmission of the stress waves). Due to the relatively low impedance of water, the boundary of the dactyl and propodus were modeled as free surfaces.
The total impact force was calculated as the sum of the individual nodal forces in the direction of the impact along the lower surface of the target. The image in Fig. 5C is a composite showing the maximum principal stress in green tones to indicate when the maximum principal stress lies in the computational plane, and in red tones when the maximum principal stress lies in the direction perpendicular to the computational plane. The blue regions are those where the three principal stresses are negative with similar values. Based on these observations, the compressive stress is regarded as hydrostatic.
Finally, the effect of the propodus was examined by performing additional DFEM without the propodus present. As expected, and since the maximum stresses are achieved at 2 µs following impact (Fig. 5B), the propodus does not have any effect on the internal stress distribution at that time. However, the propodus does affect the strike force. It is noted that the difference in the recorded strike force begins at 3 - 4 µs after impact, which is when the propagating stress wave from the propodus arrives to the target. The peak forces in both cases (with and without the propodus) take place at roughly the same time (with 0.1 µs delay in the case with the propodus). However, the main differences are in the peak force and, more remarkably, the impulse energy (area beneath the force vs. time curves). The peak force in the case without the propodus recorded in our simulations was 554 N, whereas the one with propodus was 573 N (representing an increase of 3.4% with respect to the case without the propodus). The impulse in the case without the propodus is 4.21·10-3 N·s and with the propodus is 5.28·10-3 N·s, which implies that the propodus contributes 25.4% more impulse energy.
(G) Influence of modulus oscillation on the crack-driving force
When an impinging crack deviates from its helicoidal pattern and crosses helicoidal super layers in the periodic region, it encounters a modulus oscillation. Depending on the direction of crack propagation relative to chitin fiber’s orientation within the layers, the relative thickness of soft and hard layers vary, and three limiting cases can be considered. In the first case, the thickness of soft and hard layers is equivalent, and the modulus features a sinusoidal profile of period T ~ 75 µm (Fig. 4B), with maxima and minima values of 8 and 3 GPa (obtained from nanoindentation measurements on hydrated samples). In the second case, the modulus profile will feature hard, thicker layers separated by thin, softer layers. The third case is the opposite, with soft thicker layers separated by thin harder ones. We analyzed the effect of this modulus oscillation on the crack propagation using the formalism developed by Fratzl et al. (33), which show that the crack tip propagation driving force, Jtip, in a non-linear elastic material with periodic modulus can be expressed as:
Jtip = J far ⋅ (1+ finh ) (Eq. S1)
where Jfar is the far-field J-integral surrounding the crack tip as defined by standard fracture mechanics (40), and finh is a factor related to shielding or anti-shielding due to modulus oscillation. With a far field modulus taken as the average modulus E0, and the condition that the layer wavelength T be much smaller than the singularity-dominated zone R, which is obeyed here (R is on the order of a few mm whereas T is in the µm range), they derived the following expression for finh:
finh = p0E0
E a+ξ( )− E0
E a−ξ( )⎛
⎝⎜⎜
⎞
⎠⎟⎟
dξπξ0
T
∫ − p0
' E0
E(a)− 1
TE0
E x( )dx
0
T
∫⎛
⎝⎜⎜
⎞
⎠⎟⎟ (Eq. S2)
where a is the crack length, x is the coordinate perpendicular to the crack front propagation, ξ is the relative coordinate ahead of the crack tip in the periodic region (ξ = x-a), E(x) is the elastic modulus oscillation, and p0 and p0’ are defined as:
p0 =3−υ
4 for plane stress; p0 =
3− 4υ4(1−υ)
for plane strain
p0
' = 1−υ2
for plane stress; p0
' = 1− 2υ2(1−υ)
for plane strain
where ν is the Poisson’s ratio assumed to be 0.3. We used the periodic function suggested in (33) to describe E(x), which was fitted to our nanoindentation data to obtain values of the oscillation wavelength, thin layer thickness, and modulus ratio ρ = Emax/Emin. The three cases mentioned above are depicted in Fig. S4 (upper), and the effect of modulus oscillation on the crack tip driving force is shown in Fig. S4 (lower), here expressed in terms of the normalized crack-driving force (Jtip/Jfar) as a function of the coordinate ahead of the crack tip ξ. As discussed in (33), shielding regions exist whereby the crack driving force is significantly reduced, with the actual amount of shielding depending on the relative thickness of soft and hard layers. A value ρ = 2.5 was measured in the stomatopod club, which is most likely a lower bound value: indeed in our measurements, the variation in modulus at the length scale of indents is related to anisotropy changes of mineralized chitin fibers. At a finer scale, which is not captured by the nanoindentation measurements, much more dramatic modulus differences are expected between chitin bundles and the mineral phase. Nevertheless, in order to obtain conservative values of toughening by the observed modulus oscillation, we used ρ = 2.5 in the calculations, and we see that case 2 (thin soft layers between thick hard layers) is the most efficient in reducing the crack tip driving force, with minima Jtip/Jfar ratio of 0.4. A regular sinusoidal oscillation (case 1) yields to minima of Jtip/Jfar of 0.6. Although case 3 (thin hard layers between thick soft layers) provides some shielding, it remains limited in comparison to the other cases. With larger differences in modulus oscillation (as discussed above), more dramatic crack shielding is predicted. Hence in the periodic region, had a crack deviated from its helicoidal trajectory, the analysis suggests that subsequent propagation is hampered by the modulus oscillation, with an efficiency that depends on the direction of crack propagation relative to the fiber orientation in the helicoid.
(H) Additional Observations Designation of the impact and periodic regions in this study relied on the regiospecific deposition of the different
mineral phases rather than that of the organic matrix. This distinction was based on the fact that as the helicoidal structural motif curves around the periphery of the dactyl club, it undergoes a characteristic buckling pattern as it transitions from the amorphous mineral phase of the periodic region to the highly crystalline hydroxyapatite of the impact region (Fig. S5). In addition, charge contrast scanning electron microscopy proved to be particularly useful in investigating crack deflection and blunting within these different regions through the ability to simultaneously visualize the propagation trajectory of cracks within the entire sample (Fig. S6).
SOM References 38. W. C. Oliver, G. M. Pharr, J. Mater. Res. 7, 1564–1568 (1992). 39. ABAQUS, Version 6.10 (Inc. Providence, RI) 40. T. L. Anderson, Fracture Mechanics (CRC Press, ed. 2, 1995)
SOM Figures
Figure S1: Indentation grid array used to generate the high-resolution line scan data depicted in Figure 2B, inset. The indents (each denoted by a colored square) have been overlaid on an optical micrograph of the club’s periodic region to show the relative X-location of each indent. In this figure, the Y-distance between the indents has been exaggerated to reveal the underlying banding pattern.
Figure S2: A helicoidal stack of cylinders representing chitin fiber bundles within the dactyl club (left). The same helicoidal stack with an applied curvature was achieved by wrapping the structure around a sphere and an intersecting plane (shown in gray) denotes the location of sectioning (middle). A collection of points representing the chitin fiber bundle locations accurately reproduces both the locations and curvature of the fractures seen in charge contrast scanning electron micrographs in Figure 4 (right).
Figure S3: Graph illustrating evolution of the force recorded at the impacted target (or sensor) with and without the propodus present for a representative simulation.
Figure S4: Elastic modulus ratio (upper) oscillation and crack-shielding Jtip/Jfar (lower) vs. the normalized coordinate ahead of the crack-tip, ξ/T (where T is the oscillation wavelength), in the periodic region of the dactyl club for three limiting cases of crack propagation/fiber orientation relative direction. The crack-driving force ahead of the crack tip for the three cases was computed according to Eq. S2. Jfar corresponds to the far-field crack-driving force for a homogenous material with modulus E0 and Jtip is the crack-driving force at the crack tip for materials with periodic moduli (33).
Figure S5: As shown in both the topographical backscattered electron micrographs and schematic to the left and the dark field (DF) and differential interference contrast (DIC) optical micrographs to the right, mineral deposition within the impact (IR) and periodic regions (PR) of the dactyl club do not follow the contours of the underlying organic matrix. These images also clearly illustrate the gradual parallel to buckled motifs of the helicoidal architecture as they transition between the periodic and impact regions. These observations suggest that the mechanisms regulating the synthesis of the chitinous organic matrix and those controlling mineral infiltration are not directly coupled.
Figure S6: Backscattered (BEI, left) and charge-contrast secondary (SEI, right) scanning electron micrographs of a transverse cross-section through the dactyl club, indicating crack-arrest near the impact surface (IR: Impact Region) and at interfaces within the periodic region (PR).
References and Notes
1. F. R. Schram, Paleozoic proto-mantis shrimp revisited. J. Paleontol. 81, 895 (2007).
doi:10.1666/pleo05-075.1
2. T. W. Cronin, N. J. Marshall, A retina with at least ten spectral types of photoreceptors in a